Embed Size (px)
Citation preview

Prepared for the IIPF 2012 Congress
ByAssaf Razin
MIGRATION AND THE MIGRATION AND THE WELFARE STATE: POLITICAL- WELFARE STATE: POLITICAL-
ECONOMY PERSPECTIVESECONOMY PERSPECTIVES

The Road MapIntroduction
Background LiteratureEvidence on the Fiscal Burden EffectTax Competition vs. Tax CoordinationConcluding Remarks and Extensions
2

I. Introduction
3

Free Migration and the Welfare State
The Nobel laureate economist, Milton Friedman, had it right, that one can't have free immigration and a welfare
state, both at the same time :..."It is one thing to have free
immigration for jobs, it is another thing to have free immigration to welfare. And you cannot have both".
4

New studyIn recent research, Razin Sadka and
Suwankiri (MIT Press, 2011)we explore the root causes of restrictions on migration, particularly how age- and skill-dependent restrictions on migration are shaped by the political process. A welfare state, with a heterogeneous (by age, skill, etc.) population, typically does not have a commonly accepted attitude towards migration.
5

Labor mobilityPrice wedges in international markets
for commodities and financial assets rarely exceed the ratio 2:1. Wages on labor services of similarly qualified individuals in advanced and low-income countries differ by a factor of
10 .Clearly, the greatest impediments to
international economic exchange are those associated with labor mobility .
6

Political economyA generous welfare state would be under constant attack by the many would-be immigrants who yearn for its many benefits
Under such a growing burden, sooner or later a political coalition would be formed which will either curtail the generosity of the state or restrict in-migration, or both.
But, an ageing welfare state benefits from the labor force enlargements
7

The US vs. EuropeOver the last three decades, Europe's generous social benefits encourage a massive suyge of "welfare migration", especially low skilled labors.
In the same period US has attracted a major portion of highly skilled migrants, boosting its innovative edge.
8

9
While Europe ended up in the last two decades with 85 percent of all unskilled migrants to developed countries, US retain its innovative edge by attracting 55 percent of the world educated migrants.

Opinion survey dataHanmeueller and Hiscox (2010), using survey data in
the US, find two critical economic concerns that appear to generate anti-immigrant sentiments among voters: 1. Concerns about labor-market competition2. Concerns about the fiscal burden on public
services. Employing opinion surveys, Hanson et al (2007) bring
evidence that in the United States native residents of states which provide generous benefits to migrants also prefer to reduce the number of migrants.
Furthermore, the opposition is stronger among higher income groups.
10

More opinion survey dataSimilarly, Hanson et al (2009), again
employing opinion surveys, find for the United States that native-born residents of states with a high share of unskilled migrants, among the migrants population, prefer to restrict in migration
Native-born residents of states with a high share of skilled migrants among the migrant population are less likely to favor restricting migration
11

sorting out immigrants by skillsDeveloped economies do attempt to sort out immigrants by skills (see, for instance, Bhagwati and Gordon (2009)). Australia and Canada employ a point system based on selected immigrants' characteristics. The U.S. employs explicit preference for professional, technical and kindred immigrants under the so-called third-preference quota. Jasso and Rosenzweig (2009) find that both the Australian and American selection mechanisms are effective in sorting out the skilled migrants, and produce essentially similar outcomes despite of their different legal
characteristics .
12

Fiscal Burden of Migration by SkillsEdmonston and Smith (1997) look comprehensibly at all
layers of government (federal, state, and local), all programs (benefits), and all types of taxes.
For each cohort, defined by age of arrival to the U.S., the benefits (cash or in kind) received by migrants over their own lifetimes and the lifetimes of their first-generation descendents were projected.
These benefits include Medicare, Medicaid, Supplementary Security Income (SSI), Aid for Families with Dependent Children (AFDC), food stamps, Old Age, Survivors, and Disability Insurance (OASDI), etc.
Similarly, taxes paid directly by migrants and the incidence on migrants of other taxes (such as corporate taxes) were also projected for the lifetimes of the migrants and their first-generation descendents.
13

Fiscal Burden of Migration by SkillsAccordingly, the net fiscal burden was projected and
discounted to the present. In this way, the net fiscal burden for each age cohort of migrants was calculated in present value terms.
Within each age cohort, these calculations were disaggregated according to three educational levels: Less than high school education, high school education, and more than high school education.
Migrants with less than high school education are typically a net fiscal burden that can reach as high as approximately US-$100,000 in present value, when the migrants' age on arrival is between 20--30 years.
14

Empirical Evidence on Welfare MigrationKhoudouz-Castezas (2004), who studies emigration from the 19th century Europe, finds that the social insurance legislation, adopted by Bismarck in the 1880s, reduced the incentives of risk averse Germans to emigrate. He estimates that in the absence of social insurance, German emigration rate from 1886 to 1913 would have been more then doubled their actual level
15

US dataSouthwick (1981) shows with U.S. data that high
welfare-state benefit gap, between the origin and destination regions in the U.S., increases the share the welfare-state benefit recipients among the migrants. Gramlich and Laren (1984) analyze a sample from the 1980 U.S. Census data and find that the high-benefit regions will have more welfare-recipient migrants than the low-benefit regions. Using the same data, Blank (1988) employs a multinomial logit model to show that welfare benefits have a significant positive effect over the location choice of female-headed households. Similarly, Enchautegui (1997) finds a positive effect of welfare benefits over the migration decision of women
with young children .
16

Regional migrationMeyer (2000) employs a conditional logit
model, as well as a comparison-group method, to analyze the 1980 and 1990 U.S. Census data and finds significant welfare induced migration, particularly for high school dropouts. Borjas (1999), who uses the same data set, finds that low skilled migrants are much more heavily clustered in high-benefit states, in comparison to other migrants or natives. Gelbach (2000) finds strong evidence of welfare migration in
1980, but less in 1990 .
17

More LiteratureMcKinnish (2005, 2007) also finds evidence for
welfare migration, especially for those who are located close to state borders (where migration costs are lower). Walker (1994) uses the 1990 U.S. Census data and finds strong evidence in support of welfare-induced migration. Levine and Zimmerman (1999) estimate a probit model using a dataset for the period 1979-1992 and find, on the contrary, that welfare benefits have little effect on the probability of female-headed households (the recipients of the benefits) to relocate.
18

EU Enlagements Dustmann at al (2009) bring evidence of no welfare migration. The average
age of the A8 migrants during the period 2004. More accurately, the said period extends from the second quarter of 2004 through the first quarter of 2009 is 25.8 years, considerably lower than the native U.K. average age (38.7 years). The A8 migrants are also better educated than the native-born. For instance, the percentage of those that left full-time education at the age of 21 years or later is 35.5 among the A8 migrants, compared to only 17.1 among the U.K. natives. Another indication that the migration is not predominantly driven by welfare motives is the higher employment rate of the A8 migrants (83.1%) relative to the U.K. natives (78.9%). Furthermore, for the same period, the contribution of the A8 migrants to government revenues far exceeded the government expenditures attributed to them.
A recent study by Barbone et al (2009), based on the 2006 European Union Survey of Income and Living conditions, finds that migrants from the accession countries constitute only 1-2 percent of the total population in the pre-enlargement EU countries (excluding Germany and Luxemburg); by comparison, about 6 percent of the population in the latter EU countries were born outside the enlarged EU. The small share of migrants from the accession countries is, of course, not surprising in view of the restrictions imposed on migration from the accession countries to the EU-15 before the enlargement and during the transition period after the enlargement. The study shows also that there is, as expected, a positive correlation between the net current taxes (that is, taxes paid less benefits received) of migrants from all source countries and their education level
19

IV. Evidence on the Fiscal Burden Effect
20
Previous Empirical Literature on international migration lumps together welfare and wage migration

Isolating welfare migration from wage migration forcesIn Razin and Wahba (2012) we considered a bi-lateral migration flow OECD sample: among the countries in the sample are 16 European countries, 14 of them are a part of the EU (Austria, Belgium, Denmark, Finland, France, Germany, Greece, Ireland, Italy, Netherlands, Portugal, Spain, and U.K.), and Norway and Switzerland. For notational brevity, we will nonetheless refer to this group as the EU group. The data for this group, therefore, consist of bilateral migration stock for any pair of these countries. The second group includes source-host pairs of countries, within which the source country residents cannot necessarily move freely into any of the host countries. That is, the host countries control migration from the source countries. The host countries are the same 16 countries from the first group, and the source countries comprise of 10 developed non-European countries (U.S., Canada, Japan, Australia, New Zealand, Israel, Taiwan, Hong Kong, Korea and Singapore) and 16 LDCs.
21

Free vs. Policy-Controlled migrationThis decomposition enables to plausibly assume that migration is free among the 16 countries of the first group, and is effectively policy-controlled with respect to migrants from 10 source countries belonging to the second group. It is plausible to assume that the categorizing of both groups is exogenous to our dependent variable, the skill composition of immigrants. Thus, we can identify the differential effect of the generosity of the welfare state on the skill composition of immigrants across the two groups (the "free-migration" group and the "policy-restricted migration" group) in an unbiased way.
22

Quality of Education To enlarge the sample and include developing
countries, controlling for the heterogeneity in the skill (education) measurement is essential.
To address this potential problem, Razin and Wahba (2012) adjust all the migration stocks and rates for quality of education, using Hanushek and Woessmann (2009) new measures of international differences of cognitive skills – average international assessments of student achievement in 12 international student achievement tests (ISATs)
23

The econometric Methodology
mis,h,t - the stock of migrants of skill level i
who originated from source country s and reside in host country h, as a ratio of the stock of all native workers of skill level i in the source country s in t, the year 2000 (pi
s,t) Since our key hypothesis is that the effect of
welfare benefits on the skill selectivity of immigrants vary according to the immigration regime, we use the skill difference in the migration rates as follows:
24

The econometric model The skill difference selection equation is
where the dependent variable is DMs,h
measuring the skill difference in selectivity of migrants, t=the year 2000 and t-1= the year 1990:
25

Some Regressions
26

Discussion of regressions The table shows that for both DCs and
LDCs, the social magnet hypothesis holds, and that the findings support the fiscal burden hypothesis.
When adjusting for the flows by Relative Education Quality, again the estimates for LDCs are affected more than those for DCs, and our previous results are all upheld.
27

V. Tax Competition vs. Tax Coordination
28
The issue: whether tax competition necessarily lead to an inefficient race to the bottom.
Some BackgroundOates (1972, p. 143) argues that competition may lead to inefficiently low tax rates (and benefits):
"The result of tax competition may well be a tendency toward less than efficient levels of output of local services. In an attempt to keep taxes low to attract business investment, local officials may hold spending below those levels for which marginal benefits equal marginal costs, particularly for those programs that do not offer direct benefits to local business."
29

Revisiting Tiebout
Such reinforcing factors reduce tax revenues and, consequently, the generosity of the welfare state.Our model is somewhat similar to Tiebout's (1956) framework of competition among localities. Tiebout's model features many "utility-taking" localities, analogous to the perfect competition setup of many "price-taking" agents. Naturally, Tiebout competition yields an efficient outcome.
30

Efficiency?
The Tiebout paradigm considers the allocation of a given population among competing localities. Our model of international tax-transfer and migration competition among host countries deviates from the Tiebout paradigm in that the total population in the host countries and its skill distribution are endogenously determined through migration of various skills. As a result, competition needs not be efficient.
31

Analytical FrameworkConsider n identical host countries engaged in competition over migrants, skilled and unskilled , from the rest of the world. he model incorporates two channels through which native households are effected by migration: the wage channel and the fiscal channel. The former relates to the fact that skilled (unskilled) individuals favor unskilled (skilled) migration since it boosts their wage. The latter relates to the fact that all migrants contribute to the financing of the public good through a proportional income tax (on both labor and capital).
32

Tax Competition and World Labor Supply
To re-examine the race-to-the-bottom hypothesis when several host countries compete for an upward slopping supply of immigrants from the rest of the world
I assume that there is a large enough number of competing host countries, to allow us to treat each host country as a
"perfect competitor ."
33

A Representative Host CountryA representative host country produces a single good by employing two labor inputs, skilled and unskilled, and capital according to a Cobb-Douglas production function,
where, Y is GDP, A denotes a Hicks-neutral productivity parameter, and Li denotes the input of labor of skill level i, where i=s,u for skilled and unskilled, respectively, K denotes the input of capital, β denotes the share of capital, and α denotes the share of skilled labor in the total share, 1-β, of labor.
34

Representative Host Country
The competitive wages of skilled and unskilled labor are, respectively,
Note that the abundance of skilled labor raises the wage of the unskilled, whereas abundance of unskilled labor raises the wage of the skilled.
35

Representative Host CountryAggregate labor supply, for skilled and unskilled workers, respectively, is given by:
There is a continuum of workers, where the number of native-born is normalized to 1; S denotes the share of native born skilled in the total native-born labor supply; ms denotes the number of skilled migrants; mu denotes the total number of unskilled migrants; and li is the labor supply of an individual with skill level i є{s,u}
36
Host Country labor and Interest Rate
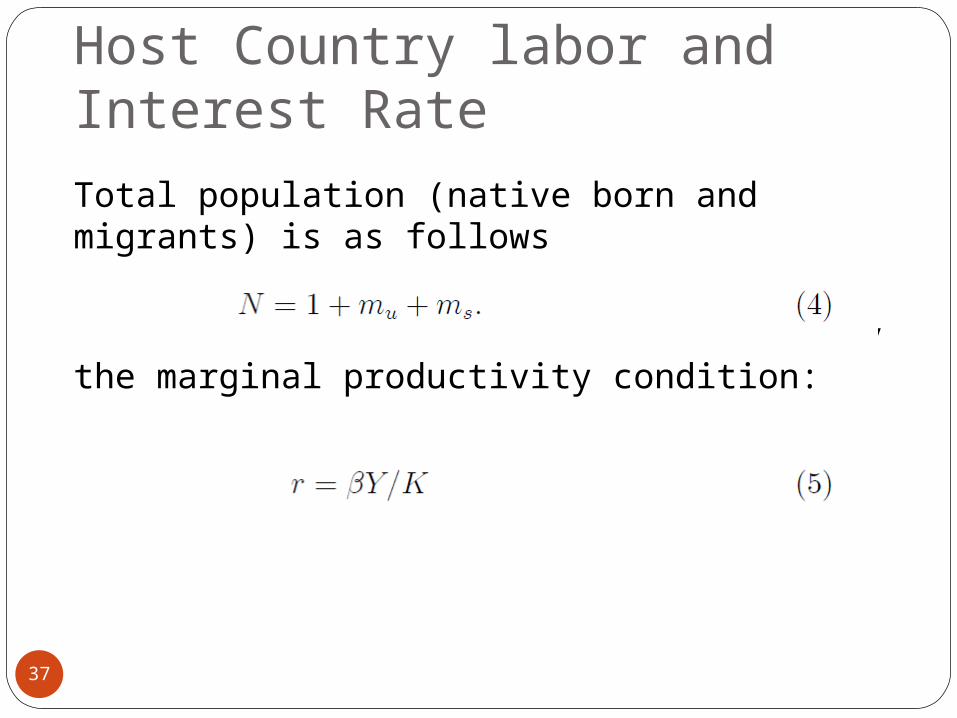
Total population (native born and migrants) is as follows
The rental price of capital is given by the marginal productivity condition:
37

Host Country Capital
A skilled individual holds a stock of capital, K_
s, which
is larger than the stock of capital, K_
u, which is held
by an unskilled individual; that is K_
s > K_
u, so that the skilled is unambiguously richer than the unskilled. An individual can rent her capital either at home or at the other host countries. Thus, the total stock of
capital owned by residents, S K_
s +(1-S) K_
u (assuming that migrants own no capital), does not have to equal K, the total inputs of capital.
38

Source Principle of Taxation
Capital taxation, if any, is levied according to the source principle, according to which each country taxes only the capital employed in that country.
39

Representative Host Country
Denote the net-of-tax rental price of capital in
all other host countries by r_
.Then, the residents of the representative host country must enjoy the same net-of-tax rental price at home, that is:
where τK is the tax rate on capital employed by our representative host country.
40

Dual Tax System
I specify a simple welfare-state system in which there is a dual tax system: a tax at the rate τL on labor income and a tax at the rate τK on capital income. We allow for different rates of taxation of labor and capital in order to examine the effects of migration and capital mobility separately on capital and labor taxation.
41

Fiscal System
The revenues from all taxes are redistributed equally to all residents (native born and migrants alike) as a demogrant, b, per capita. The demogrant may capture not only a cash transfer but also outlays on public services such as education, health, and other provisions, that benefit all workers, regardless of their contribution to the finances of the system. Thus, b is not necessarily a perfect substitute to private consumption.
42

Government Transfers
The government budget constraint is given by:
Note that we assume that migrants are fully entitled to the welfare state system. That is, they pay the tax rate τL on their labor income (they own no capital) and receive the benefit b.
43

Household Utility Function
The two types of individuals share the same utility function,
where c denotes consumption and ε>0, in the labor supply elasticity.
44
Household budget constraint
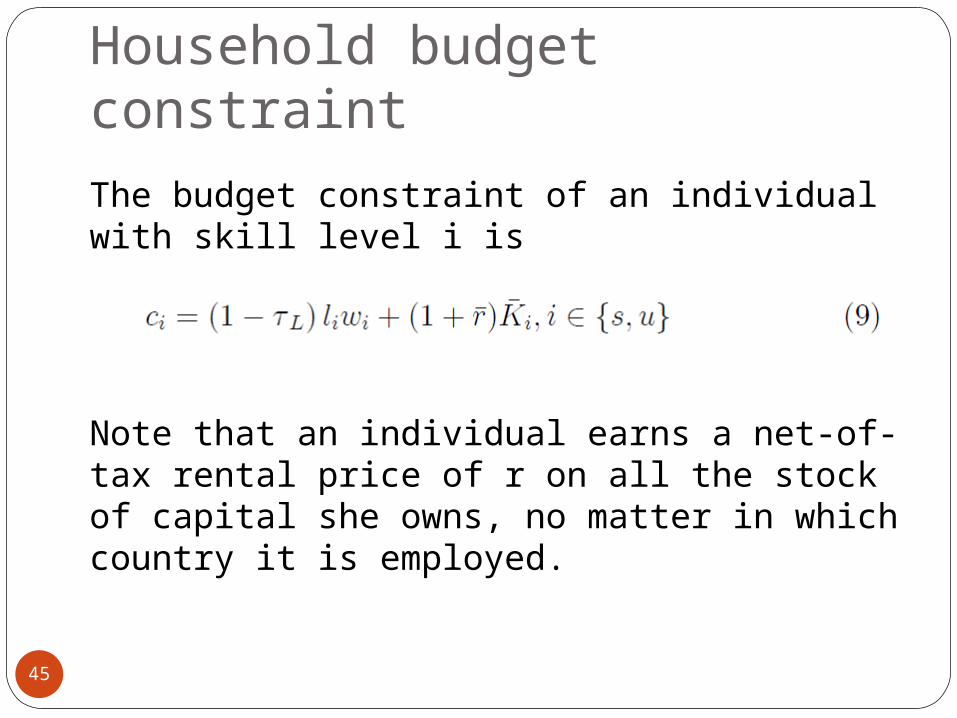
The budget constraint of an individual with skill level i is
Note that an individual earns a net-of-tax rental price of r on all the stock of capital she owns, no matter in which country it is employed.
45

Labor supply and indirect utility function
Individual utility-maximization yields the following labor supply equation
The indirect utility function of an individual of skill level i є{s,u} is given by
46

Wage differentials
We also assume that
which ensures that the wage of the skilled always exceeds the wage of the unskilled (ws>wu).
47

World Supply of Migrants
We assume that there is free migration according to an exogenously given upward supply of migrants of each skill type from the rest of the world to all host countries.Specifically, the number of migrants of each skill type that wish to emigrate to the host countries rises with the level of utility (well-being) that they will enjoy in the host countries.
48

Supply of Migrants
A possible interpretation for this upward supply is as follows. For each skill type there is a heterogeneity of some migration cost (due to some individual characteristics such as age, family size, portability of pensions, etc.). This cost generates a heterogeneity of reservation utilities, giving rise to an upward sloping supply of migrants.
49

Supply function of the would be Migrants
We denote the supply function of skill i є{s,u} by:
where Ni is the number of migrants of skill type i and Vi is the level of utility enjoyed in the host counties, i є{s,u}.
50

Supply of Migrants
We assume that would-be migrants are indifferent with respect to the identity of the would-be host country. All they care about is the level of utility they will enjoy.Therefore, in equilibrium, the utility enjoyed by migrants of each skill type is the same in all host countries. Denote this equilibrium cutoff utility level by Vi,i є{s,u}.
51

Supply of Migrants
Being small enough, each host country takes these cutoff utility levels as given for her. That is, each host country behaves as a "utility - taker", in analogy to the "price taking" behavior of each agent in perfectly competitive market.
52

The Fiscal Policy Choice
A representative host country determines its fiscal policy by majority voting among the native born. For concreteness, we describe in details the case where the native-born skilled form the majority, that is S>0.5 (the other case is specified similarly).
53

Fiscal Policy Choice
Thus, the fiscal policy variables, τL, τK and b, are chosen so as to maximize the indirect utility of the skilled (given in equation (11)), subject to the government budget constraint (given in equation (7)), and to the free migration constraints:
54

Endogenous variables in the Fiscal Policy Choice
assuming that the migrants have the same preferences as the native-born, and recalling that migrants own no capital. In determining their policy, the government takes also into account that wi,li ,Li,r,K,N,Y,ms and mu are determined in equilibrium by equations (1)-(6), and (10).
55
Fiscal Policy Choice
Note that in setting the optimal fiscal policy, a representative host country takes the migrants cutoff utility levels, Vs and Vu, as given, and also takes the net of tax return to capital, r, as given. Denote by an asterisk (*) the levels of the economic variables that ensue with optimal fiscal policy.
56

Symmetric Tax - Competition Equilibrium
Each one of the n identical host countries admits ms
∗ skilled migrants and mu∗ unskilled
migrants. Thus, the aggregate demand for skilled and unskilled migrants is nms
∗ and nmu∗.
57

Symmetric Tax - Competition Equilibrium
Therefore, the cutoff utilities enjoyed by migrants, Vs and Vu, are determined in a symmetric Nash-equilibrium, so as to equate supply and demand:
58

Symmetric Tax - Competition Nash Equilibrium
Also, the world wide net-of-tax rental price of capital, r, is determined so as to equate world
demand for capital, nK∗, to world supply, n(S K_
s
+(1-S) K_
u), that is:
59

Fiscal Coordination
So far we assumed that the host countries compete with each other with respect to the volume and the skill-composition of migrants, and for capital.Presumably, an unskilled median voter opts to admit skilled migrants, for two reasons: First, such migrants are net contributors to the finances of the welfare state, that is the tax that each one pays (namely, τL ws ls) exceeds the benefit she receives (namely, b).
60

Fiscal Coordination
Second, skilled migrants raise the wage of the unskilled.On the other hand, a skilled median voter may opt for both types of migrants. Unskilled migration raises the wage of the skilled but imposes a fiscal burden on the welfare state. Skilled migration lowers the wage of the skilled but contributes positively to the finances of the welfare state.
61

Fiscal Coordination
Thus, the volume and skill-composition of migration to each one of the n identical host countries are determined in a general, uncoordinated competitive equilibrium.An alternative, albeit difficult to sustain, is for the host countries to coordinate their fiscal policy so as to maximize the utility of their decisive median voter
62

Fiscal Coordination
Naturally, this coordination comes at the expense of the migrants. In a coordinated-policy regime the cutoff utilities, Vs and Vu, are also controlled by the host countries, taking into account that migration takes place according to the migration equations (14) and (15).
63

Fiscal Coordination
They set also the common (by symmetry) tax rate on capital, and consequently r, taking into account the capital resource constraint (18).
64

Competition vs. Coordination: Is there a Race to the Bottom?
Evidently, coordination can only improve the well-being of the skilled which is in power (recall that we consider for concreteness the case S > 0.5) compared to its well-being under competition.In this section we compare also the tax policies that arise under competition and under coordination. Specifically, we ask whether competition can lead to "a race to the bottom" in the sense that it yields lower tax rates and welfare-state benefits, relative to the coordination regime.
65

4 .Competition vs. Coordination: Is there a Race to the Bottom?
We carry this comparison via numerical simulations:
66

4 .Competition vs. Coordination: Is there a Race to the Bottom?
Parameters: α = 0.7; β = 0.33; ε = 0.1; S =
0.6; A = 6.2 to 7.2; K_
s = 1; K_
u = 0.5; n = 1; B = 1.5; fs(Vs)=fu(Vu)=(V/B)^{B} Figure 1(a) clearly refutes the race-to-the-bottom hypothesis for both the labor and the capital income taxes: the taxes are lower in the coordinated regime than in the competitive regime.
67
Why is there a race to the top rather than a race to the Bottom?—fiscal externality
The rationale for this somewhat suprising results seems to be quite basic: a fiscal externalitiy associated with the volume of migration. There are gains and losses brought about by migration. A host country has an infra-marginal gain from migration because of the diminishing productivity of labor for a given stock of capital.
68

The Rationale
On the other hand, the native-born population shares with migrants the tax collected from capital income (recall that migrants have no capital): the transfer b that the migrants receive in not financed fully by their labor income tax.
69
InterpretationThat is, the capital tax revenues paid by the native-born population "leak" also to the migrants.Each host country in a competitive regime evidently balances on the margin the gains and losses from migration. In doing so, each country takes the well-being of the migrants as given (see equation (14) - (15)). It ignores the fact that a tax-migration policy that admits an extra migrant raises the well-being that must be accorded to migrants by all host countries, in order to elicit the migrant to come in.
70

Interpretation
As a results, it offers migrants too high level of b, levies too high taxes, and admits too many migrants.Indeed, figure 1(b) shows that the number of both types of migrants is higher in the competitive than in the coordinated regime. Note also that tax rates on capital income are lower than tax rates on labor income. This is a way that native born who is endowed with capital take advantage of the migrants, who have no capital.
71

Conclusion and Policy implications
The literature on tax competition with free capital mobility cites several reasons for the race-to-the-bottom hypothesis in the sense that tax competition may yield significantly lower tax rates than tax coordination. With a fixed (exogenously given) population that can move from one fiscal jurisdiction to another, the Tiebout paradigm suggests that tax competition among these jurisdictions yields an efficient outcome, so that there are no gains from tax coordination.
72

ConclusionA fuller treatise of these issues is in Assaf Razin, Efraim Sadka,
and Ben Suwankiri, Migration and the Welfare State: Political-Economy Policy Formation, MIT Press November 2011.
In the present talk I provided some support to a nuanced version of the Tiebout hypothesis. It demonstrated that not only there is no “race to the Bottom” tax competition, indeed, when a group of host countries faces an upward supply of immigrants, tax competition does not indeed lead to a race to the bottom; competition may lead to higher taxes than coordination.
I identify a fiscal externality (fiscal leakage) that causes tax rates (on both labor and capital), and the volume of migration (of both skill types), to be higher in the competitive regime than in the coordinated regime. This fiscal externality is missing from the Tiebout framework.
73

Two ExtensionsA model of social security with no intra-
generational redistributions and capital accumulation.
Political-economy resolution of intra and inter-generetional conflicts.
Both extensions are found in the aforementioned Razin-Sadka-Suwankiri 2011 MIT Press Treatise.
74

Tax- increase trade-offIf the population growth rate is positive the
young are always in the majority. When raising period t payroll taxes the
young voter has a tradeoff between the negative effect ( an income transfer to the old) and a general equilibrium income boosting effect on her private pension in period t+1 and the social security benefit in period t+1.
75

Tax and Migration PoliciesTax rate is positive if the (state variable)
the capital stock is within a certain range, or zero, other-wise.
Migration share of native born population is at the max if the state variable, the capital stock, is in the above mentioned range, or intermediate level, otherwise.
76

Migration policy under social security-cum-private savings compared to migration policy under private savings
In the case of private saving only regime, the migration share is intermediate level.
Thus, migration shares in the social security-cum-private-savings regime are either the same, or is more liberal than in the private savings-only regime.
A social security system effectively create an incentive, through the political-economy mechanism,for a country to bring in migrants!
77