Embed Size (px)
Citation preview

R/001080
REVIEW OF HS1 DEMAND FORECASTS
Prepared for:
HS2 Limited
London
February 2012
.

CONTENTS
0. INTRODUCTION AND EXECUTIVE SUMMARY
0.1 Purpose of Report and Contents
0.2 HS1 Forecast Phases
0.3 Evolution of HS1 Traffic
0.4 Results of Forecasts
` 0.5 Conclusions from Review of Forecasts
0.6 Implications for HS2
1. PHASE 1 FORECASTS (PRE-OPENING / BID FORECASTS)
1.1 Overview
1.2 Eurotunnel Forecasts - Mid 1980s - 1993
1.3 Initial Government and Railway Forecasts – Mid to late 1980s
1.4 Government and Railway Forecasts 1990-1995
1.5 Eurorail Forecasts 1988-1990
1.6 LCR Forecasts 1994-1995
1.7 Hague Consult Forecasts 1994 for Union Railways Rights Issue
1.8 Summary of Forecasts
2. CORRIDOR CHARACTERISTICS, MARKET AND FARES GROWTH
2.1 Market Growth
2.2 Air Fares Growth
2.3 Eurostar Fares Growth
3. THE BOOZ & CO 1997/98 MODELS
3.1 Context
3.2 1997/98 Booz Model
3.2.1 Market Growth Projections
3.2.2 Additional Adjustments
3.2.2.1 Remaining Ramp Up
3.2.2.2 Brussels High Speed Line
3.2.2.3 Other Network Improvements
3.2.2.4 CTRL 1 (HS1 Stage 1)
3.2.2.5 CTRL 2 (HS2 Stage 2)
3.2.2.6 Fares Restructuring
3.2.2.7 Fares Increases
3.3 Ex Post Assessments
3.3.1 Summary of Base Results
3.3.2 Correcting for Growth and Actual Change
3.3.3 What We Believe Actually Happened
3.4 Summary

4. THE BOOZ 2000/01 MODEL
4.1 Context
4.2 Model Structure and Market Growth
4.3 Additional Adjustments
4.3.1 Commercial Initiatives
4.3.2 Low Fare Airlines
4.3.3 CTRL 1
4.3.4 CTRL 2
4.3.5 Real Changes in Air and Eurostar Fares
4.3.6 Capacity Constraints
4.4 Ex Post Assessments
4.5 Summary
5. THE BOOZ 2004/2005 MODEL
5.1 Context
5.2 Model Structure and Market Growth
5.3 Additional Adjustments
5.3.1 CTRL 1
5.3.2 CTRL 2
5.3.3 Eurostar Performance
5.3.4 Real Changes in Air and Eurostar Fares
5.3.5 Capacity Constraints
5.4 Ex Post Assessment
5.5 Summary
6. DISCLAIMER

LIST OF FIGURES
Figure 0.1 Eurostar Traffic 1995-2010
Figure 0.2 Phase 1 Forecasts V Actual 1997-2010
Figure 0.3 Phase 2 Traffic Forecasts V Actual 1997-2010
Figure 0.4 Phase 3 Booz Forecasts & Actual 1997-2010
Figure 1.1 Phase 1Forecasts Against Actual
Figure 2.1 Evolution of UK Travel Market
Figure 3.1 Management and Booz 1997/98 forecasts for 2010 against Actual
Figure 3.2 Booz Model Structure
Figure 3.3 1997 Model Forecasts by Growth Component and Comparison with Actual
Figure 4.1 2000 Model Forecasts by Growth Component against Actual
Figure 5.1 2004/5 Model Forecasts by Growth Component and Comparison with Actual
LIST OF TABLES
Table 1.1 Eurostar Passenger Forecasts and Actual 1985 – 2004/5 (passenger millions)
Table 1.2 Comparison of Rail Forecasts (millions passengers p.a.)
Table 2.1 UK Overseas Travel Market Growth (% p.a)
Table 2.2 Visits to and from near Europe 1997-2010 (two way - 000’s)
Table 2.3 Air and Eurostar Fare Indices 1997-2010 (Index: 2010 = 100)
Table 3.1 Structure of 1997 model
Table 3.2 Components of 2010 demand in 1997 model
Table 3.3 Components of 2010 demand in 1997 model actual independent variables
Table 3.4 Components of 2010 demand in 1997 model assessment of what occurred in practice
Table 4.1 Revised model structure and growth rates (with forecast and actual GDP)
Table 4.2 Components of 2010 demand in 2000 model
Table 4.3 Components of 2010 demand with revised inputs in 2000 model
Table 4.4 Components of 2010 demand in 2000 model, assessment of what occurred in practice
Table 5.1 Comparison of 2004 model forecast and actual demand
Table 5.2 Assumed and actual GDP growth and exchange rates
Table 5.3 2004 model market growth forecasts
Table 5.4 2004 model near-Europe market growth forecasts
Table 5.5 Components of 2010 demand 2004 model forecast independent variables
Table 5.6 Components of 2010 demand 2004 model actual independent variables
Table 5.7 Components of 2010 demand 2004 model, assessment of what occurred in practice

Eurostar Traffic 1995 - 2010
0
1
2
3
4
5
6
7
8
9
10
Pax (Mn)
06050403020109998979695 10090807
Passengers (Mn)
Reliability & 9/11security
issues
Section 2
Late 2007
Section 1 Late 2003
Major fire late 1996
Belgian
High Speed Line
1997/98
0. INTRODUCTION AND EXECUTIVE SUMMARY
0.1 PURPOSE OF REPORT AND CONTENTS
High Speed 2 Ltd (HS2) wish to understand the reasons behind the over-forecasting of cross Channel
rail passenger demand carried by Eurostar on High Speed 1 (HS1) and the implications of these over-
forecasts for HS2.
This summary section of the report provides a précis of a range of demand forecasts undertaken since
the mid-1980s, compares them with actual traffic carried by Eurostar and then draws out conclusions
and implications for HS2.
The remainder of this report examines these issues in more detail. Chapter 1 focuses on the forecasts
prepared before the opening of the Channel Tunnel, and those used to bid for the concession to build
the Channel Tunnel Rail Link to operator Eurostar (UK) Ltd. Chapter 2 looks at more recent forecasts
(post 1997), outlining market trends over the period to 2010. Chapters 3 to 5 analyze in detail three
sets of forecasts prepared by Booz & Company for Government from 1997 to 2004/5.
0.2 HS1 FORECAST PHASES
The forecasts fall into three main phases:
• Phase 1, covering HS1 pre-opening/bid phase, initially as part of feasibility studies into the tunnel
and subsequently by consortia bidding for the rights to the HS1 concession;
• Phase 2, following the opening of the tunnel but before the opening of the first stage of HS1; and,
• Phase 3 following the opening of the first stage of HS1 but before the opening of the link from
Ebbsfleet to St. Pancras (HS1 Stage 2).
The Phase 2 forecasts, made at various times between 1996 and 2003, were prepared for Eurostar or
for the Department for Transport and predecessor departments. These were required to support re-
financing initiatives and to prepare for Stage 1 of HS1.
The final forecasts were made post-2003 and centred on estimating the impact of Stage 2 of HS1,
examining terminal options and building on the experiences of the earlier forecasts.
0.3 EVOLUTION OF HS1 TRAFFIC
Figure 0.1
Since 1997 a wide number of external issues
have impacted on HS1/Eurostar relating to:
competition from airlines; the impacts of
global events (such as the terrorist attacks of
September, 2001); the Hatfield railway
incident (and consequent impacts on rail
reliability); and, of course management and
infrastructure initiatives, such as pricing
policies, construction of HS1 (in two stages)
and the move to a new terminal at St.
Pancras.

0.4 RESULTS OF FORECASTS
Figure 0.2 The Pre-Opening / Pre bid (Phase 1)
forecasts (in black) were summarized and
compared with actual demand (in red)
over the period 1997 – 2010. The pre-bid
forecasts ranged from 20-28m passengers
by 2010. Although actual loadings were
well below forecasts, the two final
bidders conformed to earlier projections
and produced similar forecasts (at around
28 million passengers by 2010). All
forecasts relied heavily on estimates of
diversion from other modes, typically
undertaken with modal split models of
some type, supported by generation and
general market growth.
Figure 0.3
Phase 2 forecasts (post opening but
pre-HS1 Stage1) made for Eurostar
management and for Government
(the Booz & Co forecasts) ranged
between 11 and 20 million
passengers (in 2010). These
forecasts pivoted projections on the
number of passengers already
carried, but continued to overlay
aggressive market growth
assumptions. All forecasts were
high, with the management numbers
being the most aggressive.
Figure 0.4
Finally, the Booz Phase 3 forecast
undertaken in 2004/5, mirrored actual
demand very well. However, even here the
market growth was over estimated, with the
error being offset by more conservative
assumptions elsewhere such as impact of
service improvements and declines in
airlines quality of service (caused by
increased security delays at major airports).
Phase 1 Forecasts v Actual 1997 - 2010
0.0
2.5
5.0
7.5
10.0
12.5
15.0
17.5
20.0
22.5
25.0
27.5
30.0
9897
Pax (Mn)
10090807060504030201099
Actual
Forecasts
Phase 2 Traffic Forecasts & Actual 1997 - 2010
0
2
4
6
8
10
12
14
16
18
20
Pax (Mn)
100908070605040302010999897
1997/98 Eurostar Management (interpolated)
2000 Booz Forecasts
1997/98 Booz Forecasts
Actual
Phase 3 Booz Forecast & Actual
Pax (Mn)
10.0
9.5
9.0
8.5
8.0
7.5
7.0
6.5
0.01009080706050403
2004 Booz Forecasts
Actual

0.5 CONCLUSIONS FROM REVIEW OF FORECASTS
We concluded that not too much time should be spent on the pre opening / pre bid forecasts, as the
models, reports and data were difficult to access. However, what information was available was
scrutinized. It is likely that these ‘pre-tunnel’ over forecasts related to:
- over estimation of market share (particularly from sea traffic);
- underestimation of competitor strategies and reactions;
- over estimation of demand from areas beyond London, Paris, Brussels;
- over estimation in market growth.
We then focused on a review of:
- Booz models for 1997/98 (which gave a 30% over forecast);
- Booz models for 2000/2001 Pre HS1 Stage 1 improvements (13% over forecast); and
- Booz models for 2004/5 Pre HS1 Stage 2 improvements (a 2% under forecast).
We found that the key reason underlying the ‘over forecasts’ of demand related to that fact that total
‘market growth’ in the corridor was near zero. This was set against model projections of rapidly
rising demand to near European destinations (France, Belgium, Holland and Germany).
The fact that the last (2004/5) Booz set of forecasts were very close (within 2%) to actual demand was
not so much a result of improving market growth modeling, but because over forecasts in this area
were offset by overly conservative aspects elsewhere.
0.6 IMPLICATIONS FOR HS2
There seem to be limited methodological lessons to be learnt for HS2. The adjustments made for
changes in the level of service of both Eurostar and competing modes seem to have performed
reasonably well (or under forecast) once allowance has been made for the difference in forecast and
actual causal variables (time savings, fare changes and so on).
This suggests that the elasticity and attribute valuation components of the Booz & Co models were
not responsible for the HS1 over forecasts, and so we concluded that HS1 experience, does not show
that PDFH based service quality (elasticity and attribute) methodologies are inappropriate for HS2.
By far the largest problem has been the stagnation of the travel market between UK and ‘near
Europe’. It is difficult to see how this could have been foreseen; this market had grown strongly and
consistently for many years and most independent forecasts were united at that time in projecting it
forward almost ad infinitum. But whether this risk also applies to HS2 to the same degree is a moot
point, unless there is a belief that the market for long distance domestic travel is subject to the same
uncertainties and fluctuations as the international leisure market. In this context it is worth noting that
in the same period as the base Eurostar market has stagnated, passenger trips on long distance rail
franchises in Great Britain increased on average by nearly 5% per annum suggesting that the nature of
the HS1 and HS2 markets would be very different.
Eurostar forecasts did not predict the impact of the deregulation of European passenger aviation. This
has had a particular impact in terms of the relative loss of the overall travel market share to ‘near
Europe’ countries such as France and Belgium (which Eurostar directly serves), as people switched to
other destinations in Europe (such as Spain, Portugal, Greece, Central Europe etc), as well as the
losses to destinations well beyond Europe. However, the analogy with High Speed 2 would be a

decline in the core London travel markets and it is unlikely that domestic travelers are going to switch
destinations (e.g. substituting Manchester-London trips with Manchester to Yeovil) with the same
alacrity that air passengers have switched from London to Paris to say London to Prague or indeed the
West Indies (as costs have declined to more exotic destinations).
Understanding competitive response will continue to be a key issue for HS2 demand forecasts.
However, HS2's main competitor will be other rail services, not aviation, and government policies on
franchising and rail fare regulation would greatly influence the competitive environment in which
HS2 would operate. This contrasts with Eurostar, where government has less influence over market
competition.
Eurostar’s early pre-opening forecasts faced severe difficulties as the ‘base’ rail market had declined
significantly by the time the project opened. HS2 has the advantage of a long time series of data and
much research into the causes of demand growth and the impacts of rail improvements.
Since 1997 a number of different one-off events (e.g. Channel tunnel fires, Hatfield, BSE and
international issues such as; terrorist incidents, and SARS) have further distorted Eurostar demand.
At the time, with a limited real experience of Eurostar demand, it was difficult to determine the long-
term impacts of these events. HS2 is possibly in a better position given that it can draw on a wide
breadth of data and research into domestic rail demand which has been subject to many different one-
off events over the years.
The HS1 experience illustrates that demand forecasting is subject to uncertainty, but these
uncertainties were magnified for HS1 by the need to understand international travel choices,
uncertainties in exchange rates, overseas economic growth and the competitive environment. Major
uncertainties for HS2 remain but they should be significantly less than those faced by HS1.
Probably the biggest single lesson is to focus on the key variables that influence demand and not be
diverted into the numerous possible sophistications and complexities, many of which, over a decade
or so, simply either disappear or else cancel out.
1 PHASE 1 FORECASTS (PRE-OPENING / BID FORECASTS)
1.1 OVERVIEW
At least a dozen forecasts were made in the ten years prior to the construction of the Tunnel. They
were undertaken for a range of interested parties. These included Eurotunnel, the French and British
Governments and their national railways as well as the bidders for the concession to build the Channel
Tunnel Rail Link (known now as High Speed 1) and operate Eurostar (UK) Ltd. Table 1.1 (overleaf),
shows that Eurostar was predicted to carry between 11 and 17 million passengers in its first year of
operation (generally assumed to be 1993; services actually commenced in late 1994).
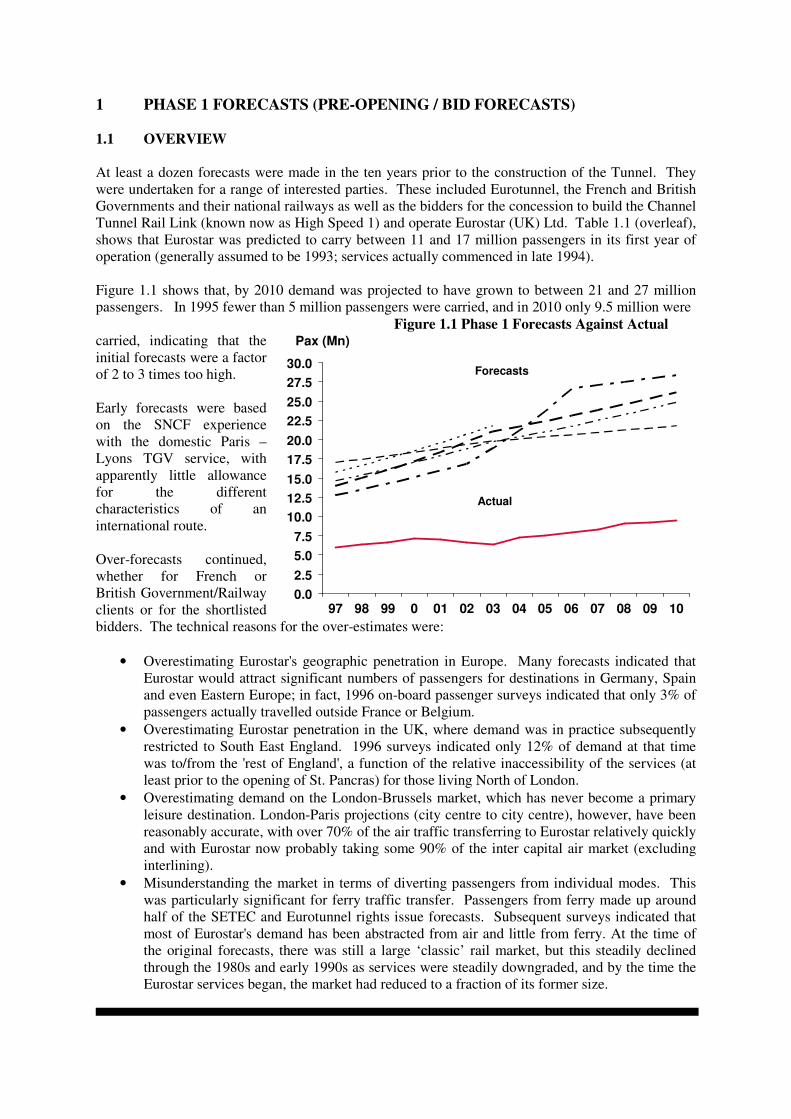
Figure 1.1 shows that, by 2010 demand was projected to have grown to between 21 and 27 million
passengers. In 1995 fewer than 5 million passengers were carried, and in 2010 only 9.5 million were
Figure 1.1 Phase 1 Forecasts Against Actual carried, indicating that the
initial forecasts were a factor
of 2 to 3 times too high.
Early forecasts were based
on the SNCF experience
with the domestic Paris –
Lyons TGV service, with
apparently little allowance
for the different
characteristics of an
international route.
Over-forecasts continued,
whether for French or
British Government/Railway
clients or for the shortlisted
bidders. The technical reasons for the over-estimates were:
• Overestimating Eurostar's geographic penetration in Europe. Many forecasts indicated that
Eurostar would attract significant numbers of passengers for destinations in Germany, Spain
and even Eastern Europe; in fact, 1996 on-board passenger surveys indicated that only 3% of
passengers actually travelled outside France or Belgium.
• Overestimating Eurostar penetration in the UK, where demand was in practice subsequently
restricted to South East England. 1996 surveys indicated only 12% of demand at that time
was to/from the 'rest of England', a function of the relative inaccessibility of the services (at
least prior to the opening of St. Pancras) for those living North of London.
• Overestimating demand on the London-Brussels market, which has never become a primary
leisure destination. London-Paris projections (city centre to city centre), however, have been
reasonably accurate, with over 70% of the air traffic transferring to Eurostar relatively quickly
and with Eurostar now probably taking some 90% of the inter capital air market (excluding
interlining).
• Misunderstanding the market in terms of diverting passengers from individual modes. This
was particularly significant for ferry traffic transfer. Passengers from ferry made up around
half of the SETEC and Eurotunnel rights issue forecasts. Subsequent surveys indicated that
most of Eurostar's demand has been abstracted from air and little from ferry. At the time of
the original forecasts, there was still a large ‘classic’ rail market, but this steadily declined
through the 1980s and early 1990s as services were steadily downgraded, and by the time the
Eurostar services began, the market had reduced to a fraction of its former size.
0.0
2.5
5.0
7.5
10.0
12.5
15.0
17.5
20.0
22.5
25.0
27.5
30.0
9897
Pax (Mn)
10090807060504030201099
Actual
Forecasts

Table 1.1 Eurostar Passenger Forecasts 1985 – 2004/5 and Actual (passenger millions)
1993 1994 1995 1996 1997 1998 1999 2000 2001 2002 2003 2004 2005 2006 2007 2008 2009 2010 2011 2012 2013
Planned Introduction Eurostar CTRL1 CTRL2
Actual Introduction Eurostar CTRL1 CTRL2
Pre Opening studies
SNCF 85 15.9
SETEC 85 17.4
MVA 87 12.6
SETEC 88 15.4 19.8 21.6 22.4
C&L88 12.7 21.8
C&L 90 13.8
TME 90 12.0 19.7 24.2 26.5
BRBB/SNCF 1993 17.6
Rights issue 94 10.6 21.0 25.5 27.7
Bids
LCR bid March 95 12.7 16.8 26.6 28.0 28.8
Eurorail bid M arch 95 8.3 10.7 13.7 16.0 17.2 18.1 19.2 20.6 22.3 23.7 24.8 25.6 26.3 27.6 29.7
Pre HS1 Stage 1
LEK / M anagement Feb 1997 14.9 22.6 26.0 27.9
LEK / M anagement Sept 1997 10.5 15.1 17.9 19.4
BAH 1997/98 8.0 8.4 8.7 9.1 9.7 10.2 10.7 11.9 12.6 13.3 13.8
EUKL Management 98 7.5 8.2 8.9 9.4 12.5
BAH June 2000 7.0 7.3 7.6 8.2 8.8 9.1 9.7 10.2 10.6 11.0
Pre HS1 Stage 2
BAH 2004/2005 7.2 7.5 7.7 8.1 8.8 9.1 9.3
Actual 2.9 4.9 6.0 6.3 6.6 7.1 7.0 6.6 6.3 7.3 7.5 7.8 8.3 9.1 9.2 9.5
3rd
party data from secondary sources, Booz & Co are not aware of major inaccuracies but they may exist & Booz & Co have not been able to verify (also see disclaimer)
2010 figures for early studies SETEC 88, TME 1990 and Rights Issue 1994 interpolated from 2013 figures (no 2010 figures readily available to us).
2010 figures for LCR Bid, and the February and September 1997 Management forecasts interpolated from 2012 figures (no 2010 figures readily available to us).
Notes: Transport consultants: BAH, C&L, TME, LEK, MVA, SETEC, Hague Consult (1994 Rights issue)
Bid consortia: LCR, Eurorail,
Railway companies: BRB, British Railways Board, SNCF, French Railways, EUKL/Management, Eurostar UK Limited.
Note LEK work undertaken for Eurostar/LCR management in 1997/98 and quoted in earlier salvaged documentation, source material not available.
Note BAH figures salvaged from surviving Booz & Co records, note BAH 1997/98 salvaged model gives forecast for 2010 of 13.8m but supporting report not found.
• Misunderstanding of competitive responses (ferries reduced fares and marketed new duty-
free services aggressively). The introduction of low-cost airlines, and general de-regulation
in the aviation sector may not have had an impact at the early stages of the process, but has
been a significant competitor on and off-route since 1996/7.
The forecasts produced by SNCF had major methodological differences to those produced by other
parties, which used more conventional multi-modal techniques. However, even these conventional
models all had large variations in assumptions on diversion rates and generation, many of which arise
from differing assumptions on service variables such as fare levels. In addition, much of the earlier
work was based on incomplete and differing base data. Many of the forecasts were produced by a
process of incremental adjustment from earlier work and weaknesses thus persisted for several years.
1.2 EUROTUNNEL FORECASTS - MID 1980S – 1993
These forecasts were prepared jointly by Wilbur Smith Associates and SETEC on a regular basis from
the mid-1980s. As such they used a consistent methodology, with changes in forecasts due to steadily
improving base data and revisions to diversion rates as more research and analysis of passenger
behaviour was undertaken. The major revision in December 1993 formed the basis of the forecasts
included in the May 1994 Eurotunnel Rights Issue prospectus.
1.3 INITIAL GOVERNMENT AND RAILWAY FORECASTS - MID TO LATE 1980S
Forecasts have been undertaken at varying intervals by the British and French railways (BRB and
SNCF), both individually and in conjunction with their governments. In 1985, forecasts were prepared
by Martin and Voorhees Associates (MVA) for BRB (which were substantially revised in 1986-87)
and internally by SNCF, so as to enable initial planning and scheme selection to be undertaken. These
forecasts differed (MVA forecast over 12 million passengers in 1993 and SNCF forecast over 16
million) and in 1988 a joint study was undertaken in which Coopers and Lybrand (C&L) examined
the forecasts and came to an independent view.
The methodologies adopted by the two railways differed significantly:-
• The BRB approach was a conventional model in which each pair of origin and destinations
was examined and diversions to a tunnel rail service estimated on the basis of service
characteristics.
• The SNCF approach was based on their experience of the TGV Sud-Est, where there was
significant ‘new’ traffic which had not previously travelled by either conventional rail or by
air. Much of this traffic had previously travelled by car and a major point of debate was as to
whether this transfer would be repeated for cross-Channel traffic.
C&L recommended that the MVA approach be adopted, with some technical modifications, revised
the base parameters (which had also been different between BRB and SNCF) and estimated a demand
intermediate between the two previous railway estimates.

1.4 GOVERNMENT AND RAILWAY FORECASTS 1990 - 1995
After 1990, a series of studies were undertaken in the UK, either internally or by external consultants.
The most comprehensive of these was undoubtedly the model developed for Union Railways by
Hague Consultants. This had a similar structure to that previously used by MVA/C&L, except that it
was applied to disaggregate data, with diversion rates based on the results of Stated Preference
surveys (which ask passengers what they would do under a series of hypothetical travel scenarios).
Under the terms of the Usage Contract, the railways were required to submit annual forecasts to
Eurotunnel for use in their forward planning. The December 1993 forecasts were clearly based on the
SNCF approach but were rejected by Eurotunnel as being insufficiently documented and supported.
1.5 EURORAIL FORECASTS – 1988-1990
A series of forecasts were produced between 1988 and 1990 by Travers Morgan Economics (TME)
for Eurorail as part of their assessment of the Southern Route into London. The approach adopted was
to use a base forecast, prepared by C&L in updating their 1988 forecast. The C&L approach did not
easily lend itself to the analysis of the impact of different fare levels and service options, which were
of prime importance to Eurorail, and TME estimated these impacts by using a series of elasticities to
adjust the C&L base forecast.
1.6 LCR FORECASTS – 1994-1995
London and Continental Railways (LCR) adopted a different approach to forecasting than the others.
Their consultants split the market into a wide number of market segments (30 or more), based on data
from IPS and CAA surveys. This was argued to make the model more responsive to a wider range of
policy variables and allow the impact of 'airline' style yield management techniques to be brought to
bear. The model lacked a formal/conventional mathematical or 'statistical' basis and was largely
assumption-driven. The model was later used as the basis for Eurostar/LCR management work in
negotiations with Government.
1.7 HAGUE CONSULT FORECASTS 1994 FOR UNION RAILWAYS RIGHTS ISSUE
A complex and detailed set of forecasts were made, based on:
• a series of disaggregate revealed/stated preference based hierarchical logit models (for mode
choice modelling);
• market research survey based estimates of new/generated traffic; and,
• market growth models based on research undertaken by the Henley Centre.
The model had a number of surprising results. These included very low fare sensitivities (implying
very high values of time and that high prices could be charged for the services). Some other outputs
also appeared counter-intuitive. For example on the key UK-France business market, Eurostar
achieved a share of 54% for non UK residents, but only 28% for those from the UK, while non-UK
leisure had a higher share from the Netherlands than Paris.

1.8 SUMMARY OF FORECASTS
Table 1.2 summarizes 'early' forecasts produced prior to Eurostar operation. They were produced on a
variety of fares policies; as fare is a key determining variable, comparisons of the figures need care.
The forecasts could be said to be trending downwards as more detailed information became available,
with early (1985) forecasts coming in at 18 million and later (1994) for the rights issue coming in at
just under 11 million (however, if 'build-up rates' were ignored the rights issue forecast was for 11.8
million). It should also be noted that LCR bid projections were for some 13 million passengers
(however, these were given for a later forecast year 1997). Hague Consult work undertaken for Union
Railways at the same time as the bids (and provided to the bidders) projected over 20 million
passengers in 2001 (though these forecasts also included opening of the Channel Tunnel Rail Link).
The major change over the years was the large reduction in the assumed diversion from ‘foot’
passengers, i.e. those travelling by ferry without a vehicle. Indeed later surveys showed over 25% of
these were ‘excursionists’ on day-trips (probably to take advantage of duty free shopping). Initial
forecasts, in the absence of this information, assumed they would all transfer to through rail services.
It is clear, however, that all projections were considerably at variance with the actual demand carried,
with the closest projections more than double the 4.9 million passengers actually carried in 1995.
Most forecasts were out by a factor of three.
Analysis of observed travel patterns indicates that air has supplied the majority of Eurostar
passengers, with Ferry only being the source of between 17% and 30% of Eurostar trips.

Table 1.2 Comparison of Sources of Actual Traffic and Rail Forecasts (millions passengers p.a.)
Current
mode
Actual Traffic
Carried in
1996(1) (2) & (5)
Eurotunnel Forecasts Government / National Railway
Forecasts
Bidders’ Forecasts: Initial
Eurorail/TME and 'Final' LCR
EUKL - ITS SETEC
1985
SETEC
1988
Rights
Issue
SNCF
1985
MVA
1987
C&L-Hague (4)
1988 & 1995
C&L
1990
TME - LCR
1990 1995
Forecast year 1993 1993 1994 1993 1993 1993 2001 1993 1993 1997
Build-up % 100 100 90 100 100 100 100 100
Source Air
Ferry
• Coach
• Car
• Foot
Subtotal
Generated
2.34 2.96
0.16
0.29
1.00
1.45 0.83
1.07 (3)
13.3
3.6
0.5
5.7
1.4
0.6
6.3
8.3
1.4
4.0
0.1
1.2
3.4
4.7
1.9
TOTAL 4.86 17.5 15.4 10.6 11.8 (6)
15.9 12.6 12.7 20.3 13.8 12.0 12.7
Notes (Data taken from secondary sources and not verified)
(1) EUKL sales database, breakdown by air, ferry etc. based on surveys of Eurostar passengers, asking if Eurostar, not available. Later data might indicate higher share from
air due to presence of low cost airlines.
(2) Generated assumed to be 22% of market based on EUKL analysis of 1997 origin destination surveys.
(3) Broken down on basis of responses to 1996 Terminal survey, asking Eurostar passengers choice of mode.
(4) Hague Results 2001 include Rail Link.
(5) ITS 98 surveys, indicate higher proportion switching from air, 63-78%, depends on interpretation, but most likely the higher proportion.
(6) Total if 100% build up.

2. CORRIDOR CHARACTERISTICS, MARKET AND FARES GROWTH
2.1 MARKET GROWTH
Figure 2.1 shows that since 1995, although the total UK travel market has averaged 2% per annum.
growth, travel between UK and near Europe (the main countries served by Eurostar) stagnated.
Effectively near Europe lost share as low cost airlines expanded choices into other parts of Europe,
while rising incomes and competitive prices have increased the share of travel to the rest of the world.
Figure 2.1 Evolution of UK Travel Market
Source: IPS Travel Data all Traffic UK Rest of World
A key reason for this stagnation has been the loss of market share of near Europe in the UK travel
market (Figure 2.1, Tables 2.1 and 2.2.) and, presumably, UK in the travel markets of near Europe.
Table 2.1 shows that between 1997 and 2008, total visits overseas by UK residents increased at 4.3%
p.a., although the drop in overseas trips since then has reduced this growth to 1.9% p.a. for the 1997-
2010 period.
Focusing on the 1997-2010 period, we see visits by UK residents to the near four grew by only 0.1%
per annum., the remainder of the EU15 grew by 1.2% p.a. and visits to other countries grew by 4.3%
p.a.
The share of trips to the ‘near four’ (excluding one day) reduced from 30% of total overseas visits in
1997 to 23% in 2008 before recovering slightly to 24% in 2010. In retrospect, the loss of share began
in the 1980s but appears to have reversed in the early 1990s, at least according to the data available at
the time.
Table 2.1 UK Overseas Travel Market Growth (% p.a.)
1997- 2008 2008 – 2010 1997-2010
Near four1 1.9 -9.3 0.1
Rest of EU 15 4.2 -13.9 1.2
Other 6.5 -7.0 4.3
Total1 4.3 -10.3 1.9
1997 2008 2010
Near four share of total (%) 30 23 24
+7%+6%
Visits (T)
110,000
100,000
90,000
80,000
70,000
60,000
50,000
40,000
30,000
20,000
10,000
0
-5%
-12%
+3%
-1%0%+6%
+5%+7%
+3%+3%-1%+3%
+4%
+2%
Near
RestEurope
Rest
World
2010200920082007200620052004200320022001200019991998199719961995

Source: IPS Note: (1) Excludes same-day trips. We exclude these not because all are irrelevant (many
such travelers use Eurostar) but that the decline in their market is, we believe, led by a fall in duty-
free, day cruses etc. which are not a relevant market as Eurostar does not offer the service.
2.2 AIR FARES GROWTH
Air fare indices were constructed for the various routes considered in the model based on raw data
from the Sabre airline database. Although this database gives the average fare by route and carrier at
monthly intervals, the fare quoted excludes airport charges and taxes such as the Air Passenger Duty
and these have been estimated to derive air fare as paid by the passenger. The Sabre database only
includes data from 2002 onwards. The only readily available source of data for the period from 1997
is the International Passenger Survey. Unfortunately, the sample sizes for many of the years are small
and the fare estimates clearly have a large sample error. Nevertheless, it has been used to construct an
index prior to 2002 which has been spliced with the Sabre series. The various fare indices are given in
Table 2.3. It is clear that the monetary cost of air travel has fallen in line with low cost carriers and
accelerated efficiency measures. However, what the fares do not demonstrate is a reduction in air
travel’s quality of service, brought about by enhanced security measures, which has significantly
increased time spent at airports waiting to board.
2.3 EUROSTAR FARES GROWTH
Unfortunately, Eurostar were unable to provide us with any information for our analysis, either on
fares, market growth, or demand segments. Eurostar, were concerned about commercial information
entering into the public domain. The only information available to us is the average yield and
aggregate demand available from press releases. This yield is presented over all routes and ticket
types. This is also given in Table 2.3 and demonstrates growth in real terms, reflecting both its market
dominance (over aviation) in the corridor and the improvement in quality of service brought about by
the various infrastructure investments.
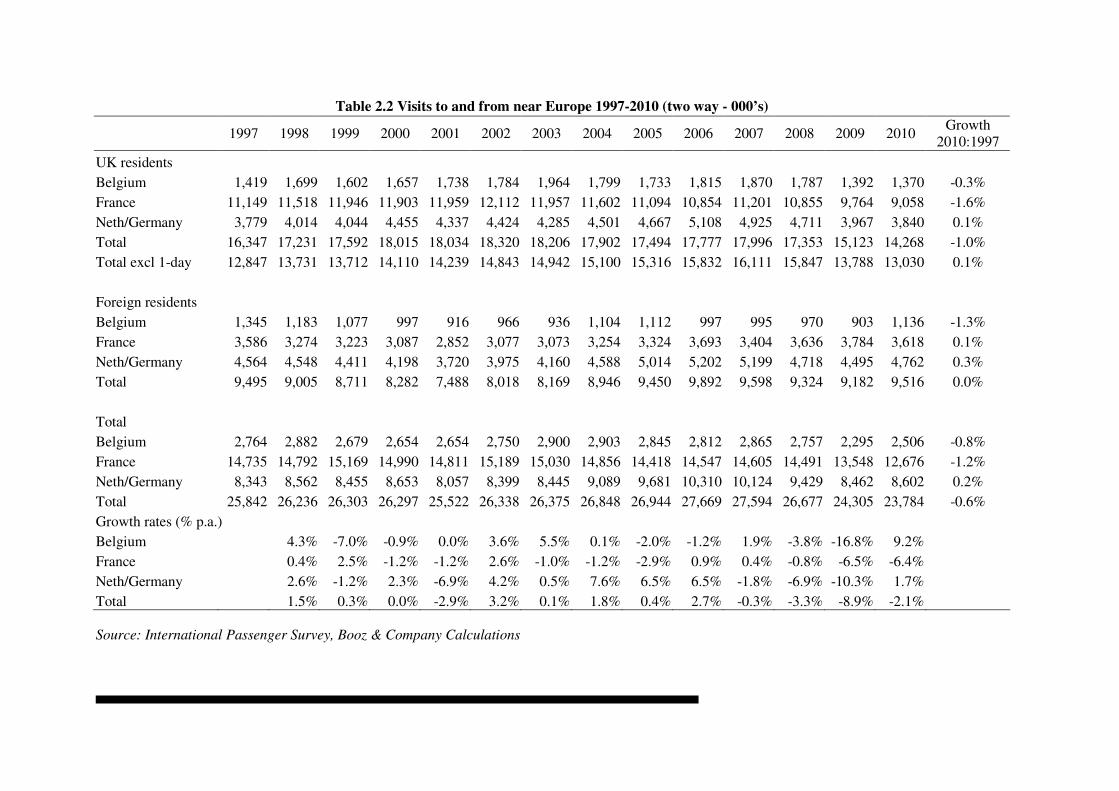
Table 2.2 Visits to and from near Europe 1997-2010 (two way - 000’s)
1997 1998 1999 2000 2001 2002 2003 2004 2005 2006 2007 2008 2009 2010
Growth
2010:1997
UK residents
Belgium 1,419 1,699 1,602 1,657 1,738 1,784 1,964 1,799 1,733 1,815 1,870 1,787 1,392 1,370 -0.3%
France 11,149 11,518 11,946 11,903 11,959 12,112 11,957 11,602 11,094 10,854 11,201 10,855 9,764 9,058 -1.6%
Neth/Germany 3,779 4,014 4,044 4,455 4,337 4,424 4,285 4,501 4,667 5,108 4,925 4,711 3,967 3,840 0.1%
Total 16,347 17,231 17,592 18,015 18,034 18,320 18,206 17,902 17,494 17,777 17,996 17,353 15,123 14,268 -1.0%
Total excl 1-day 12,847 13,731 13,712 14,110 14,239 14,843 14,942 15,100 15,316 15,832 16,111 15,847 13,788 13,030 0.1%
Foreign residents
Belgium 1,345 1,183 1,077 997 916 966 936 1,104 1,112 997 995 970 903 1,136 -1.3%
France 3,586 3,274 3,223 3,087 2,852 3,077 3,073 3,254 3,324 3,693 3,404 3,636 3,784 3,618 0.1%
Neth/Germany 4,564 4,548 4,411 4,198 3,720 3,975 4,160 4,588 5,014 5,202 5,199 4,718 4,495 4,762 0.3%
Total 9,495 9,005 8,711 8,282 7,488 8,018 8,169 8,946 9,450 9,892 9,598 9,324 9,182 9,516 0.0%
Total
Belgium 2,764 2,882 2,679 2,654 2,654 2,750 2,900 2,903 2,845 2,812 2,865 2,757 2,295 2,506 -0.8%
France 14,735 14,792 15,169 14,990 14,811 15,189 15,030 14,856 14,418 14,547 14,605 14,491 13,548 12,676 -1.2%
Neth/Germany 8,343 8,562 8,455 8,653 8,057 8,399 8,445 9,089 9,681 10,310 10,124 9,429 8,462 8,602 0.2%
Total 25,842 26,236 26,303 26,297 25,522 26,338 26,375 26,848 26,944 27,669 27,594 26,677 24,305 23,784 -0.6%
Growth rates (% p.a.)
Belgium 4.3% -7.0% -0.9% 0.0% 3.6% 5.5% 0.1% -2.0% -1.2% 1.9% -3.8% -16.8% 9.2%
France 0.4% 2.5% -1.2% -1.2% 2.6% -1.0% -1.2% -2.9% 0.9% 0.4% -0.8% -6.5% -6.4%
Neth/Germany 2.6% -1.2% 2.3% -6.9% 4.2% 0.5% 7.6% 6.5% 6.5% -1.8% -6.9% -10.3% 1.7%
Total 1.5% 0.3% 0.0% -2.9% 3.2% 0.1% 1.8% 0.4% 2.7% -0.3% -3.3% -8.9% -2.1%
Source: International Passenger Survey, Booz & Company Calculations

Table 2.3 Air and Eurostar Fare Indices 1997-2010 (Index: 2010 = 100)
1997 1998 1999 2000 2001 2002 2003 2004 2005 2006 2007 2008 2009 2010
Growth
2010:1997
Paris total 136 128 122 115 109 118 107 95 96 95 97 104 102 100 -2.3%
Paris economy 116 110 104 98 93 101 97 88 92 89 86 88 99 100 -1.1%
Paris business 138 130 124 117 111 120 121 102 103 106 104 110 110 100 -2.4%
Brussels total 108 81 80 84 92 95 97 102 111 109 90 102 106 100 -0.6%
Brussels economy 85 64 63 66 72 75 77 85 95 91 70 88 99 100 1.3%
Brussels business 125 94 93 97 106 110 119 113 112 113 107 105 95 100 -1.7%
London-Europe 87 87 85 87 94 97 100
France - Europe 115 113 114 111 107 98 100
Eurostar 77 87 86 87 89 92 99 96 95 100 2.0%
Source Sabre data sets, Eurostar press releases and consultant’s estimates
LogitFunction
Competition
Characteristics
Market
Growth
Build
UpService and
Characteristics
Market
Shares
Business/
Leisure Yields
Trips and
Revenues
Market
Segments
Trips
3. THE 1997/98 MODELS
3.1 CONTEXT
After the formal opening of the Channel tunnel in May 1994 and the award of the operation and
construction concessions to London and Continental Railways (LCR) in February 1996, preparations
were made to offer the business to equity participants. New forecasts were provided by LCR and
Eurostar UK Limited (EUKL) management supported by LEK consultants. Analysis was based on the
ULTRA model, a development of LCR's bid model.
Following the introduction of Eurostar services in November 1994, a tunnel fire occurred in
November 1996, causing a two-month suspension and then continuing disruption to Eurostar services
until May 1997. By the end of 1997 the poor performance of the Eurostar business revealed the LCR
forecasts were optimistic and weakened LCR's ability to raise private capital to fund HS1. In January
1998 LCR approached Government with a view to re-financing the scheme to construct the high speed
line. Booz & Co were commissioned by Government to provide forecasts for Eurostar services to
support the negotiations with LCR.
The Booz & Co and EUKL/LCR management forecasts are shown below; although lower than the
management projections, Booz projections were still significantly higher than out turn. We examine
the Booz model in more detail below.
Figure 3.1 Management and Booz 1997/98 forecasts for 2010 against Actual
(Pass. Millions)
Note: Management figures based on Booz & Co interpolation of LEK February & September 1997
outputs from Table 1.1. Note an additional set of management forecasts were closer to Booz, but fares
were much higher (rising 40% to 2006) & as we only have data to 2006, these are not shown.
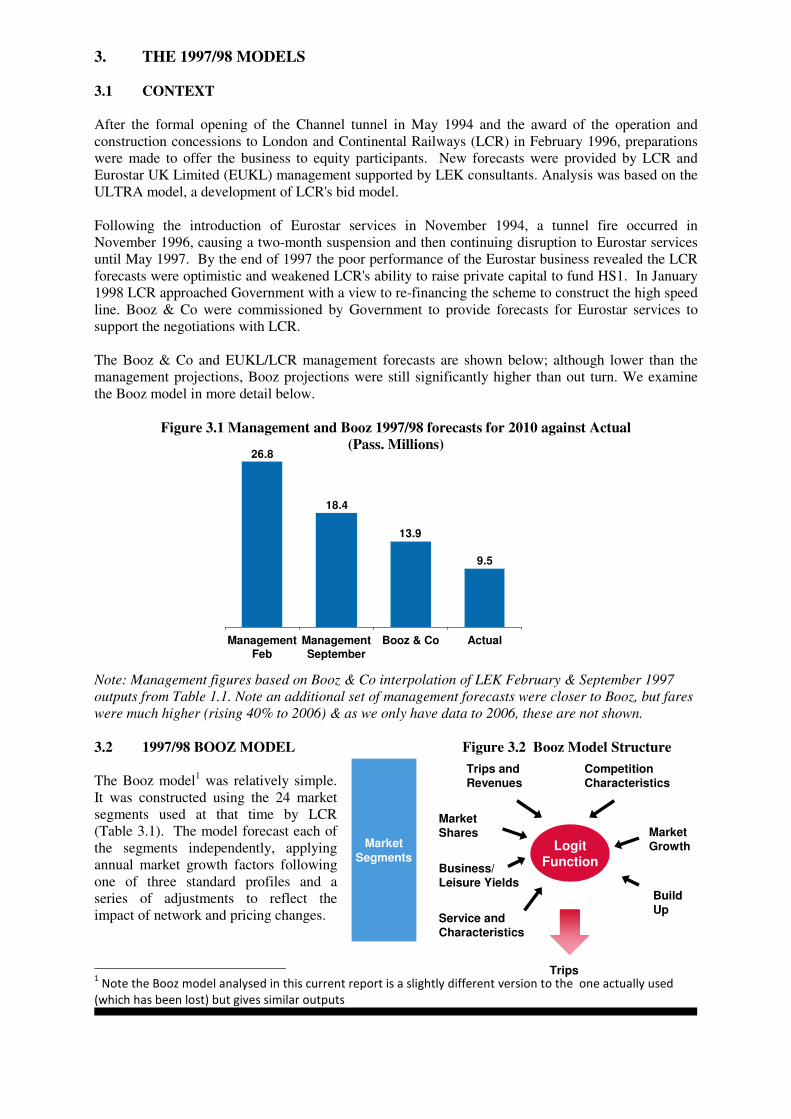
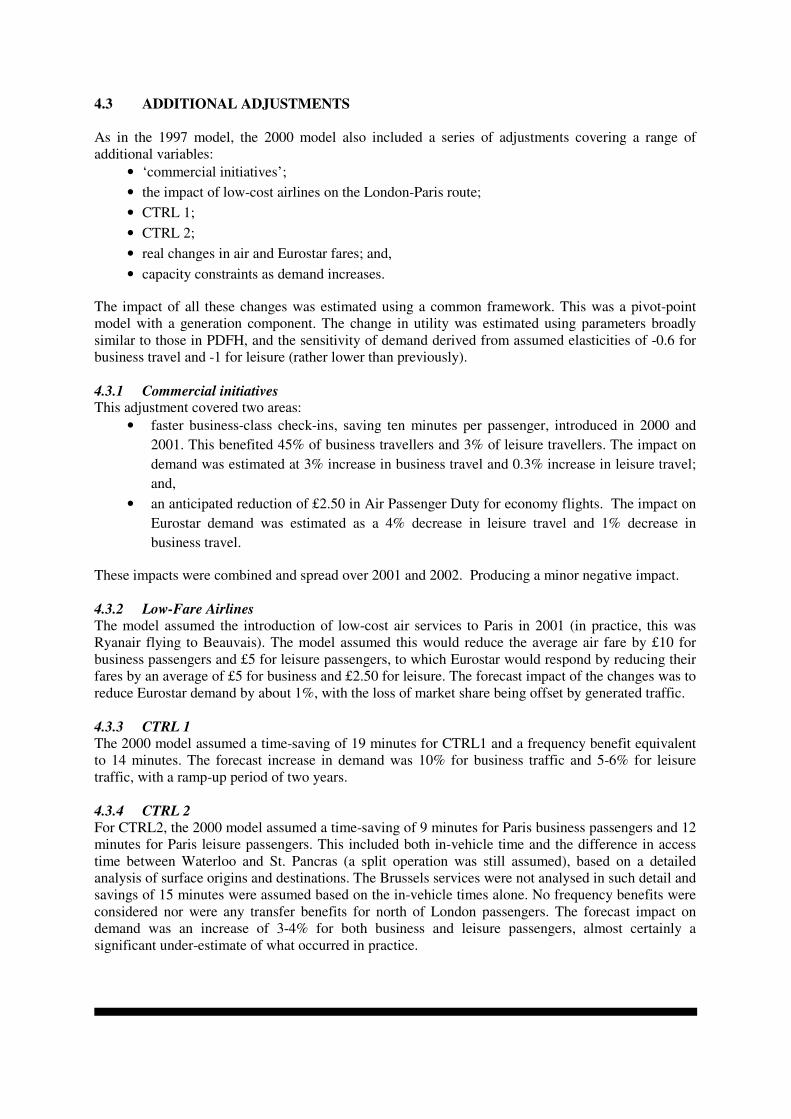
3.2 1997/98 BOOZ MODEL Figure 3.2 Booz Model Structure
The Booz model1 was relatively simple.
It was constructed using the 24 market
segments used at that time by LCR
(Table 3.1). The model forecast each of
the segments independently, applying
annual market growth factors following
one of three standard profiles and a
series of adjustments to reflect the
impact of network and pricing changes.
1 Note the Booz model analysed in this current report is a slightly different version to the one actually used
(which has been lost) but gives similar outputs
9.5
13.9
18.4
26.8
ActualBooz & CoManagement
September
Management
Feb

Table 3.1 Structure of 1997 model
Market growth
Segment Profile
Growth index
1997 - 2010
1 Business LSE-Paris-Day 1 1.78
2 Business LSE-Paris-Non Day 1 1.78
3 Business LSE-Belgium-Day 1 1.78
4 Business LSE-Belgium-Non Day 1 1.78
5 Leisure LSE-Paris-Day 2 1.81
6 Leisure LSE-Paris-Day 3 1.81
7 Leisure LSE-Paris-Non Day-Hols 2 1.81
8 Leisure LSE-Paris-Non Day-Hols 2 1.81
9 Leisure LSE-Paris-Non Day-Hols 3 1.81
10 Leisure LSE-Paris-Non Day-VFR 2 1.81
11 Leisure LSE-Belgium-Day 2 1.81
12 Leisure LSE-Belgium-Non Day 2 1.81
13 Business LSE-NE France 1 1.78
14 Leisure LSE-NE France 2 1.81
15 Leisure LSE-NL/Lux 2 1.81
16 Leisure LSE-Inner Germany 2 1.81
17 Leisure LSE-Rof/Swiss 2 1.81
18 Leisure RoUK-Paris/NE France 2 1.81
19 Leisure RoUK-Belgium 2 1.81
20 Business RoUK-Paris/NE France 1 1.78
21 Business RoUK-RoF/Swiss 1 1.78
22 Business RoUK-Belgium & LSE-NL/Lux/D 1 1.78
23 Business Leisure to Near 6 2 1.81
24 Business Leisure beyond Near 6 2 1.81
Source: Booz and Co analysis
3.2.1 MARKET GROWTH PROJECTIONS
Market growth rates for each segment were input directly. These were sourced from a range of third-
party projections (CAA, BAA, Economist Intelligence Unit, etc) with no relationship to any
independent variables such as GDP/head2. Three growth profiles were used: one for business
segments, one for leisure and a third for two of the London – Paris leisure segments. However,
although there were small fluctuations from year to year, total forecast growth over the period to 2010
was almost the same for all segments, at around an 80% increase or 4.6% p.a. However, as discussed
in Chapter 2, travel between UK and near Europe (France, Belgium, Netherlands and Germany, the
primary countries served by Eurostar) has stagnated over the period.
3.2.2 ADDITIONAL ADJUSTMENTS
The model also included other adjustments, covering:
• the remaining ramp-up of initial demand;
• the impact of the Brussels high-speed line;
• other network changes (principally for traffic to/from Germany and Netherlands);
• HS1 Stage 1 a fast link through Kent, (also called CTRL 1);
• HS1 Stage 2 (CTRL 2) the link to St. Pancras;
• fare restructuring; and,
• real changes in fares.
2 Efforts at constructing elasticity based models were made at the time but were not successful.

3.2.2.1 Remaining ramp-up This was a hotly debated issue at the time, with many claiming that the faltering start to the services
was caused by issues surrounding the Channel Tunnel fire in 1996. The forecast assumed residual
ramp-ups by segment, typically 10% for the business segments and 20% for the leisure segments,
spread over the following 2-3 years. The reasoning for the higher leisure ramp-up included the slow
development of associated travel packages (such as weekend breaks) and, for the beyond Brussels-
traffic, the poor arrangements at the time for through ticketing and the like. The overall impact was to
add 12% of traffic in 1998, 4% in 1999, with a cumulative increase of 18% by 2001, equivalent to
about 1.1 million passengers in 2010. Whether this actually occurred is difficult to judge; certainly
some of the pre-conditions, especially those associated with beyond-Brussels traffic, seem to have
taken far longer to come about in practice. It is likely that the impact was only about half of that
assumed.
3.2.2.2 Brussels high-speed line
The model assumed time-savings when the line opened in 1998 and a further gain because of the
improved frequencies. The overall effect was an increase in patronage of about 0.4 million trips in
2010.
3.2.2.3 Other network improvements
The model assumed time-savings of 20-30 minutes for leisure traffic to Germany and the Netherlands,
presumably based on the HSL2 and HSL3 in Belgium. These lines actually opened quite late, in 2002
to Liege and 2009 to the Dutch/German borders. The model also assumed other improvements in
access times, i.e. from construction of the Jubilee line extension etc. The forecast impact on demand
was an increase of some 0.3 million in 2010.
3.2.2.4 CTRL 1 (HS1 stage 1)
The model assumed a time-saving of 15 minutes. The forecast increase in demand was 10% for
business traffic and 4-6% for leisure traffic, with a ramp-up period of three years, increasing patronage
by 0.7 million in 2010.
3.2.2.5 CTRL 2 (HS1 stage 2)
The model assumed further time-savings for CTRL1 and frequency improvements. It also assumed a
set of access and transfer benefits as the result of the move to St. Pancras. At the time not all services
were assumed to transfer to St. Pancras and it was assumed that a split operation using Waterloo and
St. Pancras would be run. The overall forecast increase was about 13%, increasing overall patronage
by nearly 2 million in 2010.
3.2.2.6 Fares restructuring The model assumed a set of segment-specific fare increases in 1998 and 1999, of between 15-30%.
The model assumed a set of elasticities, varying by segment and ticket type, which ranged from -0.4
for full-fare business trips to -1.6 for leisure passengers travelling in groups. The forecast impact of the
combined changes was to reduce demand by 10%, with individual segments decreasing by 5-18%, or
by just over 1.7 million in 2010.
3.2.2.7 Fare increases The model assumed progressive increases in fares relative to air. Air fares were assumed to be
constant for business passengers but to decrease for leisure trips by 0.5% p.a. until 2005. Eurostar
fares were assumed to increase by 1% p.a. relative to air fares until 2007, with additional increases of
3% in 2004 (CTRL 1) and 8% in 2007 (CTRL 2). The combined impact was an increase between 1997
and 2010 of 18% in business and 8% in leisure fares. As for fare restructuring, elasticities were
assumed for each segment to derive the impact on demand. The forecast impact by 2010 was a
reduction in demand of 1.1 million (7%) with a small change in revenue, reflecting an average
elasticity over all segments of -1.

3.3 EX POST ASSESSMENT (S)
In this section we re-run the models with observed fare and network changes (as far as we can, given
model and data limitations3). We identify what we think actually happened under each of the variables
and speculate what may be the major reason behind any residual gap.
3.3.1 Summary of Base Results
Firstly, the Booz & Co 1997/98 model results are summarized in Table 3.2 below. Actual traffic in
2010 was 9.5m (some 30% below the projection of nearly 14m).
The key drivers of the forecasts related to market growth and build up. Analysis shows these were
significant over-estimates. The network impacts of Stage 1 & Stage 2 of CTRL appear reasonable,
while impact of fares should be larger as they did not take account of the fall in air fares that has
happened over the period).
Table 3.2 Components of 2010 demand in 1997 model
Passengers
(000) % Comment
1 Base 6265
2 Residual build-up 1130 18 Probably too large by 50%
3 Market growth 5939 80 No market growth in practice
4 Brussels HSL 421 3 Probably reasonable
5 Other network changes 266 2 Reasonable but other network
changes have also occurred
6 CTRL 1 699 5 Reasonable
7 CTRL 2 1858 13 Reasonable
8 1998/9 fare restructure -1704 -10
Forecast Eurostar yield close
to actual but most air fares
have declined rather than
increased. So impact
potentially much greater in
practice.
9 General fare changes -1094 -7
Total 13780
Source Booz and Co Analysis
3 Eurostar have been unable to provide us with a breakdown of fare information by market segment, or indeed
any other information, so we had to rely only on aggregated data contained in various press releases.

3.3.2 Correcting for Growth and Actual Change
Correcting for lack of growth and then entering into the model4 actual fare and service changes,
demonstrates that the model would then significantly under-estimate. This is significantly influenced
by the decrease in real terms of most air fares. At this stage we retained the assumption that residual
build up was achieved.
Table 3.3 Components of 2010 demand in 1997 model actual independent variables
Passengers
(000)
% Comment
1 Base 6265
2 Residual build-up 1130 18
Assumed same as model with 82% build
up achieved end 1997, leaving another
18% to go.
3 Market growth 0 0 No market growth in practice.
4 Brussels HSL 343 5
As modeled with revised inputs,
absolute number lower in the base as
base demand lower without market
growth..
5 Other network changes 156 2 As modeled but with some other
network changes which also occurred.
6 CTRL 1 363 5 As modeled with revised inputs similar
% impact.
7 CTRL 2 830 10
As modeled but revised inputs, impact
falls as the base ran to St Pancras &
Waterloo, now only St. Pancras is
served, so accessibility lost.
8 1998/9 fare restructure 0 Now included in the general fare
changes below.
9 General fare changes -2600 -29
Modelled with actual inputs including
large reduction in air fares, so big
negative % impact.
Total 6487
Source Booz & Co. analysis
3.3.3 What We Believe Actually Happened
We finally discuss what we believe actually happened for each segment. Firstly, we reduced the build
up assumption by half. Looking back over the data it is clear that build up was mostly exhausted by
1997, so we revised the impact down to 9%.
Major changes then included entering a figure for CTRL2 which again reflects our view of what
occurred in practice, based on the high level data that is available. Between 2007 and 2009 Eurostar
demand increased by about 11% at a time when overall travel between UK and France/Belgium fell
by nearly 10%. At the same time, the real yield on Eurostar tickets reduced by some 4%. Assuming a
fare elasticity of -1, and also that Eurostar demand broadly follows general trends in travel between
4 Eurostar have not provided breakdown of fare changes by sector. Impact of switching all services to St.
Pancras broadly estimated.
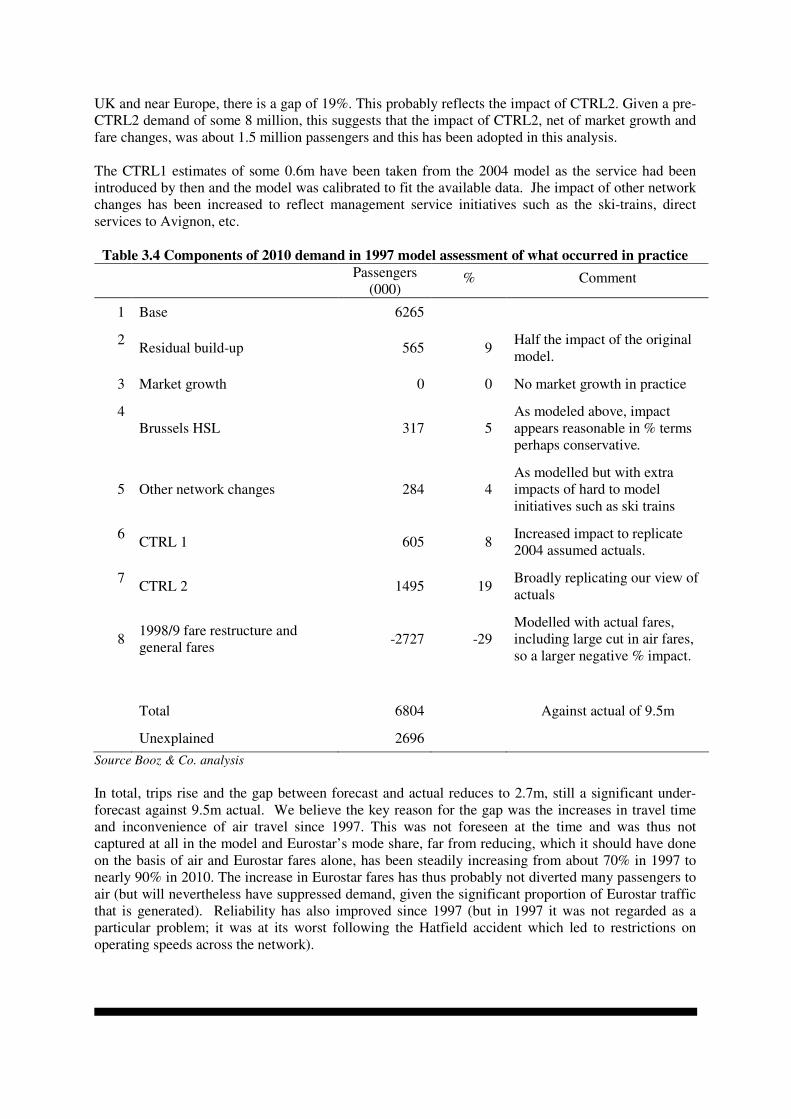
UK and near Europe, there is a gap of 19%. This probably reflects the impact of CTRL2. Given a pre-
CTRL2 demand of some 8 million, this suggests that the impact of CTRL2, net of market growth and
fare changes, was about 1.5 million passengers and this has been adopted in this analysis.
The CTRL1 estimates of some 0.6m have been taken from the 2004 model as the service had been
introduced by then and the model was calibrated to fit the available data. Jhe impact of other network
changes has been increased to reflect management service initiatives such as the ski-trains, direct
services to Avignon, etc.
Table 3.4 Components of 2010 demand in 1997 model assessment of what occurred in practice
Passengers
(000) % Comment
1 Base 6265
2 Residual build-up 565 9
Half the impact of the original
model.
3 Market growth 0 0 No market growth in practice
4
Brussels HSL 317 5
As modeled above, impact
appears reasonable in % terms
perhaps conservative.
5 Other network changes 284 4
As modelled but with extra
impacts of hard to model
initiatives such as ski trains
6 CTRL 1 605 8
Increased impact to replicate
2004 assumed actuals.
7 CTRL 2 1495 19
Broadly replicating our view of
actuals
8 1998/9 fare restructure and
general fares -2727 -29
Modelled with actual fares,
including large cut in air fares,
so a larger negative % impact.
Total 6804 Against actual of 9.5m
Unexplained 2696
Source Booz & Co. analysis
In total, trips rise and the gap between forecast and actual reduces to 2.7m, still a significant under-
forecast against 9.5m actual. We believe the key reason for the gap was the increases in travel time
and inconvenience of air travel since 1997. This was not foreseen at the time and was thus not
captured at all in the model and Eurostar’s mode share, far from reducing, which it should have done
on the basis of air and Eurostar fares alone, has been steadily increasing from about 70% in 1997 to
nearly 90% in 2010. The increase in Eurostar fares has thus probably not diverted many passengers to
air (but will nevertheless have suppressed demand, given the significant proportion of Eurostar traffic
that is generated). Reliability has also improved since 1997 (but in 1997 it was not regarded as a
particular problem; it was at its worst following the Hatfield accident which led to restrictions on
operating speeds across the network).

3.4 SUMMARY
Actual demand out turn was around a third below forecast, primarily because the key component of
the forecasts (market growth) failed to materialize. Traffic build up was also lower than anticipated,
while the model failed to predict the significant reduction in airline fares.
Once, these issues are taken into account, along side the actual changes in fares, impacts of CTRL 1
and 2 etc, the model actually under forecasts. This is because the significant relative decline in air’s
level of service (reliability, security issues etc) was not predicted.
Figure 3.3
Booz & Company Analysis 0
Actual
8.1
1999
7.4
1998
6.9
1997
6.3
9.7
2003
9.1
2002
8.7
2001
8.4
2000
13.3
2008
12.6
2007
11.9
2006
10.7
2005
10.2
2004
9.5
2010
13.8
2009
CTRL 2
CTRL 1
1997 network changes
BHSL
Market growth
BUP
Base Fare level
Fare structure Unexplained
1997 Model for Forecasts by Growth Component & Comparison With Actual
4. THE BOOZ 2000/2001 MODEL
4.1 CONTEXT
A further set of Eurostar forecasts was prepared in 2000 when actual demand was seen to be falling
behind the 1997 model projections.
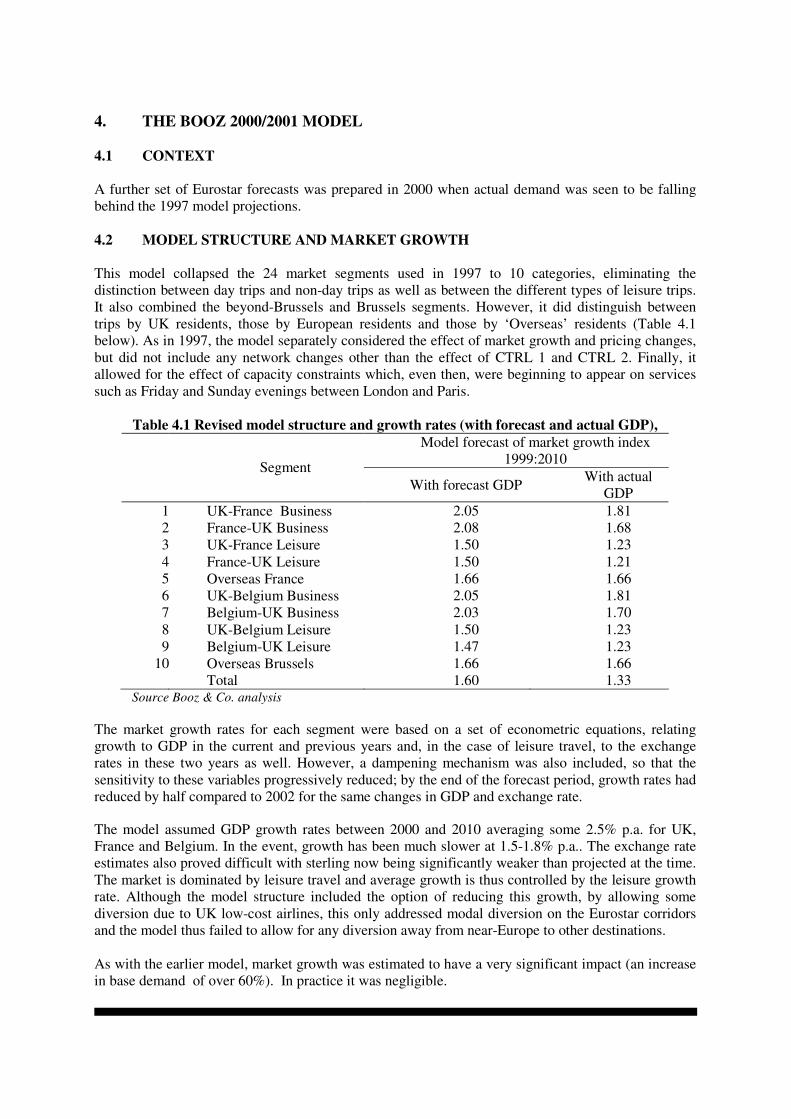
4.2 MODEL STRUCTURE AND MARKET GROWTH
This model collapsed the 24 market segments used in 1997 to 10 categories, eliminating the
distinction between day trips and non-day trips as well as between the different types of leisure trips.
It also combined the beyond-Brussels and Brussels segments. However, it did distinguish between
trips by UK residents, those by European residents and those by ‘Overseas’ residents (Table 4.1
below). As in 1997, the model separately considered the effect of market growth and pricing changes,
but did not include any network changes other than the effect of CTRL 1 and CTRL 2. Finally, it
allowed for the effect of capacity constraints which, even then, were beginning to appear on services
such as Friday and Sunday evenings between London and Paris.
Table 4.1 Revised model structure and growth rates (with forecast and actual GDP),
Model forecast of market growth index
1999:2010 Segment
With forecast GDP With actual
GDP
1 UK-France Business 2.05 1.81
2 France-UK Business 2.08 1.68
3 UK-France Leisure 1.50 1.23
4 France-UK Leisure 1.50 1.21
5 Overseas France 1.66 1.66
6 UK-Belgium Business 2.05 1.81
7 Belgium-UK Business 2.03 1.70
8 UK-Belgium Leisure 1.50 1.23
9 Belgium-UK Leisure 1.47 1.23
10 Overseas Brussels 1.66 1.66
Total 1.60 1.33 Source Booz & Co. analysis
The market growth rates for each segment were based on a set of econometric equations, relating
growth to GDP in the current and previous years and, in the case of leisure travel, to the exchange
rates in these two years as well. However, a dampening mechanism was also included, so that the
sensitivity to these variables progressively reduced; by the end of the forecast period, growth rates had
reduced by half compared to 2002 for the same changes in GDP and exchange rate.
The model assumed GDP growth rates between 2000 and 2010 averaging some 2.5% p.a. for UK,
France and Belgium. In the event, growth has been much slower at 1.5-1.8% p.a.. The exchange rate
estimates also proved difficult with sterling now being significantly weaker than projected at the time.
The market is dominated by leisure travel and average growth is thus controlled by the leisure growth
rate. Although the model structure included the option of reducing this growth, by allowing some
diversion due to UK low-cost airlines, this only addressed modal diversion on the Eurostar corridors
and the model thus failed to allow for any diversion away from near-Europe to other destinations.
As with the earlier model, market growth was estimated to have a very significant impact (an increase
in base demand of over 60%). In practice it was negligible.
4.3 ADDITIONAL ADJUSTMENTS
As in the 1997 model, the 2000 model also included a series of adjustments covering a range of
additional variables:
• ‘commercial initiatives’;
• the impact of low-cost airlines on the London-Paris route;
• CTRL 1;
• CTRL 2;
• real changes in air and Eurostar fares; and,
• capacity constraints as demand increases.
The impact of all these changes was estimated using a common framework. This was a pivot-point
model with a generation component. The change in utility was estimated using parameters broadly
similar to those in PDFH, and the sensitivity of demand derived from assumed elasticities of -0.6 for
business travel and -1 for leisure (rather lower than previously).
4.3.1 Commercial initiatives This adjustment covered two areas:
• faster business-class check-ins, saving ten minutes per passenger, introduced in 2000 and
2001. This benefited 45% of business travellers and 3% of leisure travellers. The impact on
demand was estimated at 3% increase in business travel and 0.3% increase in leisure travel;
and,
• an anticipated reduction of £2.50 in Air Passenger Duty for economy flights. The impact on
Eurostar demand was estimated as a 4% decrease in leisure travel and 1% decrease in
business travel.
These impacts were combined and spread over 2001 and 2002. Producing a minor negative impact.
4.3.2 Low-Fare Airlines
The model assumed the introduction of low-cost air services to Paris in 2001 (in practice, this was
Ryanair flying to Beauvais). The model assumed this would reduce the average air fare by £10 for
business passengers and £5 for leisure passengers, to which Eurostar would respond by reducing their
fares by an average of £5 for business and £2.50 for leisure. The forecast impact of the changes was to
reduce Eurostar demand by about 1%, with the loss of market share being offset by generated traffic.
4.3.3 CTRL 1
The 2000 model assumed a time-saving of 19 minutes for CTRL1 and a frequency benefit equivalent
to 14 minutes. The forecast increase in demand was 10% for business traffic and 5-6% for leisure
traffic, with a ramp-up period of two years.
4.3.4 CTRL 2
For CTRL2, the 2000 model assumed a time-saving of 9 minutes for Paris business passengers and 12
minutes for Paris leisure passengers. This included both in-vehicle time and the difference in access
time between Waterloo and St. Pancras (a split operation was still assumed), based on a detailed
analysis of surface origins and destinations. The Brussels services were not analysed in such detail and
savings of 15 minutes were assumed based on the in-vehicle times alone. No frequency benefits were
considered nor were any transfer benefits for north of London passengers. The forecast impact on
demand was an increase of 3-4% for both business and leisure passengers, almost certainly a
significant under-estimate of what occurred in practice.

4.3.5 Real Changes in Air and Eurostar fares Air fares were assumed to be constant in real terms for both business and leisure passengers. Eurostar
fares were also assumed to be constant except for a 4% increase in Paris business fares spread over
2000 and 2001, with a very small impact on demand. In practice air fares reduced significantly, while
Eurostar rose more than anticipated.
4.3.6 Capacity constraints
The 2000 model included an adjustment to allow for capacity constraints suppressing demand, which
were already having an impact on Friday and Sunday afternoon services.
4.4 EX POST ASSESSMENTS
Table 4.2 summarizes the contribution of the various components to the overall forecast.
Table 4.2 Components of 2010 demand in 2000 model5
Passengers
(000)
% impact Comment
1 Base 6594
2 Market growth 4093 62 Negligible in practice
3 Commercial initiatives -216 -2 Wrapped in overall fare
changes
4 Low-cost airlines -109 -1 Ceased operation by 2010
5 CTRL 1 641 6 Reasonable
6 CTRL 2 360 3 Significantly under-forecast
7 Fare changes -54 -
Much greater impact in practice
but countered by decline in
airline level of service.
8 Constrained demand -335 -3 Probably occurs in practice
Total 10974 Source Booz & Co. analysis
The 2000 model over-forecasts (1.5m above the actual 9.5m passengers carried), and again market
growth is heavily over-estimated. However, the impact of CTRL2 is now under-estimated. The
impact of fare changes on both the airlines and Eurostar is also heavily underestimated but again the
model did not take account of the counterbalancing deterioration of the airline level-of-service.
The following estimated variables were replaced by actual values:
• GDP;
• exchange rates;
• commercial initiatives - has been used as a line to reflect the deterioration in the air level of
service6, assessed as penalties of 20 minutes air in-vehicle time and 30 minutes additional
airport wait time;
• low-cost airlines omitted as services began and then ceased;
• CTRL 1 inputs unchanged; and,
5 One of a number of models compiled over the period, giving broadly similar results
6 Difficult to measure precisely but order-of-magnitude estimate derived using 2000 model framework & taking
the change in airline level-of-service as an increase in in-vehicle time of 20 minutes (to reflect congestion
delays) and an increased wait time of 30 minutes (to reflect security and boarding procedures).

• CTRL 2 inputs originally assumed split services. In practice, services were consolidated at
St. Pancras, providing frequency benefits compared with previous assumption, operating 4
minutes faster then assumed, but receiving some accessibility losses.
Actual fare changes have seen Eurostar fares increase in real terms over forecast period while air fares
have reduced in real terms by 1-2% p.a. Such an adjustment has been included for comparison
purposes and the combined impact of the changes in the Eurostar and air fares is a reduction in
demand of 12%, or 1.3 million passengers in 2010.
Table 4.3 summarizes the possible components of actual 2010 demand on this basis using the 2000
model framework.
Table 4.3 Components of 2010 demand with revised inputs in 2000 model
Passengers
(000)
Impact
% Source of estimate
1 Base 6,594 1999 actual
2 Market growth 2,383 36 Revised inputs
3 Commercial initiatives 1,206 13
Revised inputs for aviation
whose quality of service
suffered
4 Low-cost airlines - 0
Excluded, it ceased to
operate.
5 CTRL 1 639 6 As modeled
6 CTRL 2 523 5
Revised inputs and rerun in
model
7 Fare changes -1,310 -12
Revised inputs and re run
in model
8 Constrained demand -227 - 2 As modeled
Total 9,808 Source Booz & Co. analysis
Although the recalculated model gives a reasonable result in aggregate (an over-forecast of only
0.3m), individual components are clearly in error. Market growth is too high and the impact of
CTRL2 too low (against our estimate of what occurred in practice). The impact of fares is, correctly,
much lower in this model than the 1997 model, as about half of the change in relative fares occurs
between 1997 and 1999.
Table 4.4 presents possible components of actual demand based on adjusted estimates for the main
components.
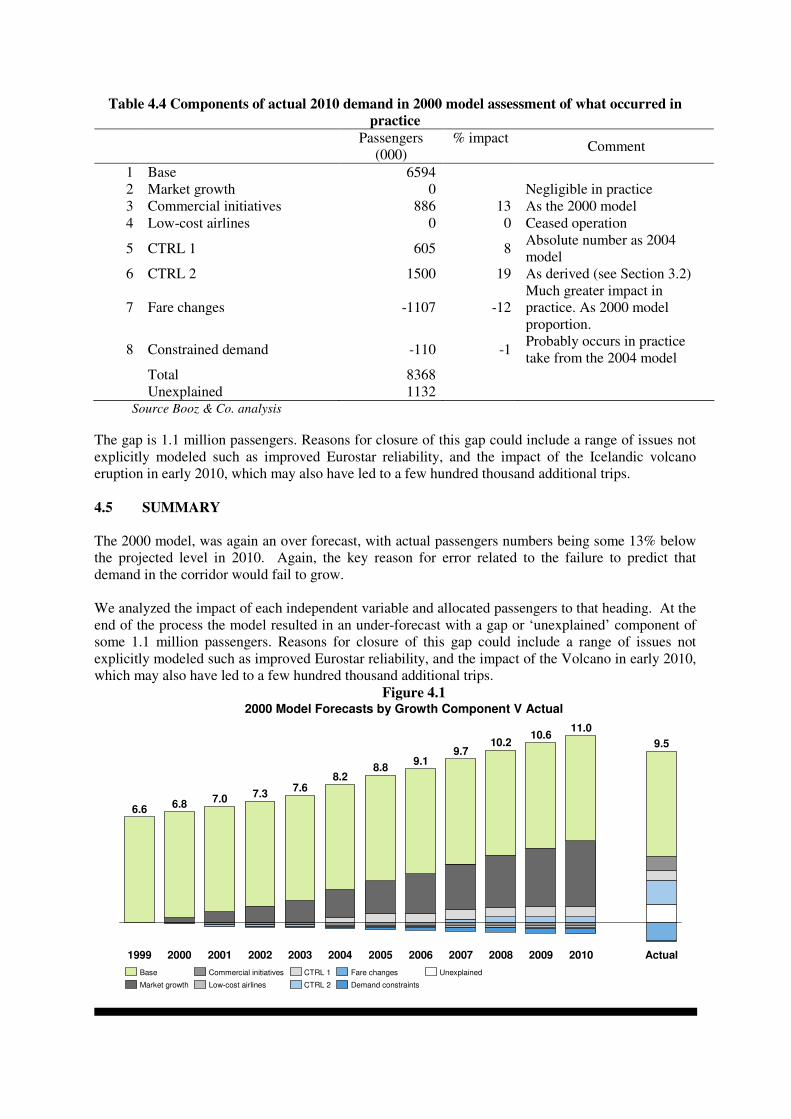
Table 4.4 Components of actual 2010 demand in 2000 model assessment of what occurred in
practice
Passengers
(000)
% impact Comment
1 Base 6594
2 Market growth 0 Negligible in practice
3 Commercial initiatives 886 13 As the 2000 model
4 Low-cost airlines 0 0 Ceased operation
5 CTRL 1 605 8 Absolute number as 2004
model
6 CTRL 2 1500 19 As derived (see Section 3.2)
7 Fare changes -1107 -12
Much greater impact in
practice. As 2000 model
proportion.
8 Constrained demand -110 -1 Probably occurs in practice
take from the 2004 model
Total 8368
Unexplained 1132 Source Booz & Co. analysis
The gap is 1.1 million passengers. Reasons for closure of this gap could include a range of issues not
explicitly modeled such as improved Eurostar reliability, and the impact of the Icelandic volcano
eruption in early 2010, which may also have led to a few hundred thousand additional trips.
4.5 SUMMARY
The 2000 model, was again an over forecast, with actual passengers numbers being some 13% below
the projected level in 2010. Again, the key reason for error related to the failure to predict that
demand in the corridor would fail to grow.
We analyzed the impact of each independent variable and allocated passengers to that heading. At the
end of the process the model resulted in an under-forecast with a gap or ‘unexplained’ component of
some 1.1 million passengers. Reasons for closure of this gap could include a range of issues not
explicitly modeled such as improved Eurostar reliability, and the impact of the Volcano in early 2010,
which may also have led to a few hundred thousand additional trips.
Figure 4.1
10.611.0
6.8
2004
6.6
1999 2009200820072006 Actual2010
9.510.2
2002 2005
8.8
7.0 7.3
2001 2003
7.6
2000
8.2
9.19.7
2000 Model Forecasts by Growth Component V Actual
Unexplained
Demand constraints
Base Fare changes
CTRL 2
CTRL 1
Low-cost airlines
Commercial initiatives
Market growth

5. THE BOOZ 2004/2005 MODEL
5.1 CONTEXT
A further set of Eurostar forecasts was prepared in 2004/5. This followed reductions in demand after
the slowing of train speeds in the wake of the Hatfield incident and the associated problems with
reliability, which impacted the entire GB rail network including Eurostar routes. This model was a
combination of the two previous models in that it adopted the 10 categories used in 2000 to establish
market growth rates but then applied these to 37 market segments which were then subject to
adjustment for the impact of changes in service levels and fares. The model made an attempt to allow
for ‘off-corridor’ growth, but this only considered diversion from near-Europe to other European
destinations and thus failed to allow adequately for diversion to non-traditional destinations such as
Asia, North Africa and the Caribbean. On the face of it, this model was remarkably accurate, being
able to replicate patronage between 2000 and 2004, but also forecasting demand between 2004 and
2010 to within 2% (Table 5.1). However, this was achieved by combining an over-forecast of growth
with an under-forecast of mode switching.
Table 5.1 Comparison of 2004 model forecast and actual demand7
Eurostar patronage (million) Year
Actual Forecast
2000 7.1 7.1
2001 7.0 6.9
2002 6.6 6.5
2003 6.3 6.3
2004 7.3 7.3
2005 7.5 7.5
2006 7.8 7.7
2007 8.3 8.1
2008 9.1 8.8
2009 9.2 9.1
2010 9.5 9.3 Source Booz & Co. analysis
5.2 MODEL STRUCTURE & MARKET GROWTH
The model assumed GDP growth rates between 2004 and 2010 averaging 2.1- 2.7% p.a. for each of
UK, France and Belgium. In the event, growth has been much slower at 1.0-1.5%. The exchange rate
estimates proved reasonably accurate until the sterling devaluations of 2008 (Table 5.2).
7 One of series of models giving broadly similar outputs
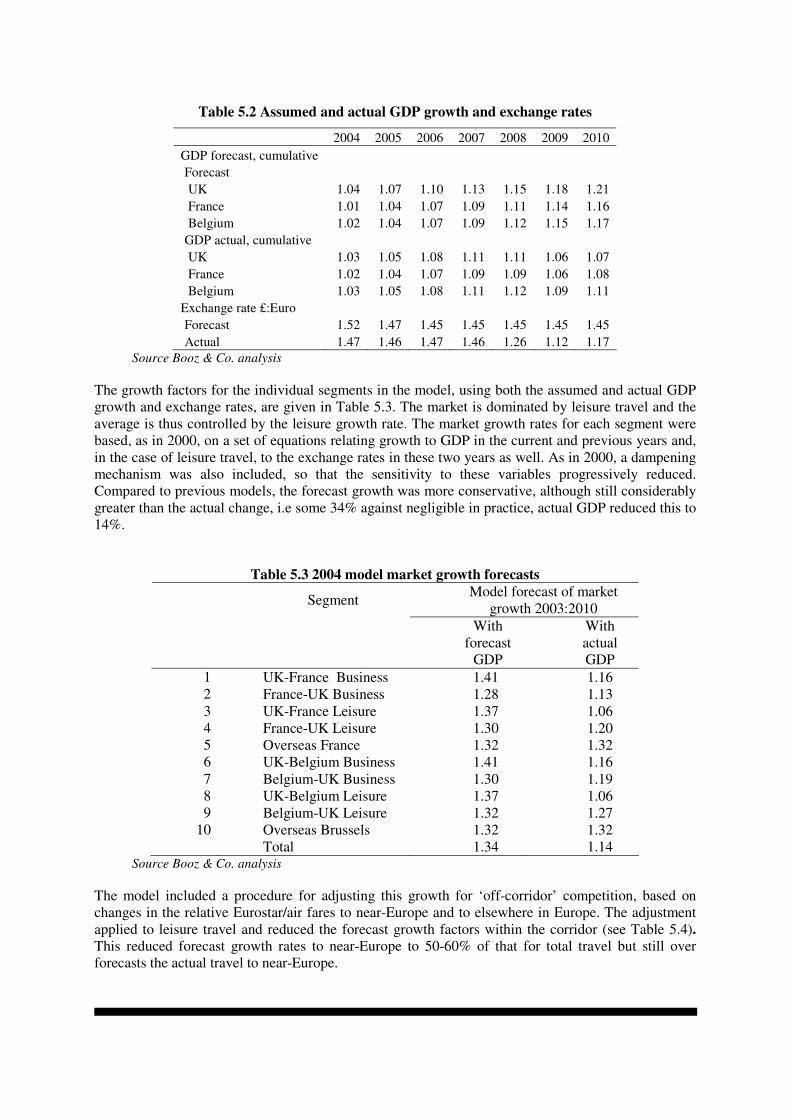
Table 5.2 Assumed and actual GDP growth and exchange rates
2004 2005 2006 2007 2008 2009 2010
GDP forecast, cumulative
Forecast
UK 1.04 1.07 1.10 1.13 1.15 1.18 1.21
France 1.01 1.04 1.07 1.09 1.11 1.14 1.16
Belgium 1.02 1.04 1.07 1.09 1.12 1.15 1.17
GDP actual, cumulative
UK 1.03 1.05 1.08 1.11 1.11 1.06 1.07
France 1.02 1.04 1.07 1.09 1.09 1.06 1.08
Belgium 1.03 1.05 1.08 1.11 1.12 1.09 1.11
Exchange rate £:Euro
Forecast 1.52 1.47 1.45 1.45 1.45 1.45 1.45
Actual 1.47 1.46 1.47 1.46 1.26 1.12 1.17
Source Booz & Co. analysis
The growth factors for the individual segments in the model, using both the assumed and actual GDP
growth and exchange rates, are given in Table 5.3. The market is dominated by leisure travel and the
average is thus controlled by the leisure growth rate. The market growth rates for each segment were
based, as in 2000, on a set of equations relating growth to GDP in the current and previous years and,
in the case of leisure travel, to the exchange rates in these two years as well. As in 2000, a dampening
mechanism was also included, so that the sensitivity to these variables progressively reduced.
Compared to previous models, the forecast growth was more conservative, although still considerably
greater than the actual change, i.e some 34% against negligible in practice, actual GDP reduced this to
14%.
Table 5.3 2004 model market growth forecasts
Segment Model forecast of market
growth 2003:2010
With
forecast
GDP
With
actual
GDP
1 UK-France Business 1.41 1.16
2 France-UK Business 1.28 1.13
3 UK-France Leisure 1.37 1.06
4 France-UK Leisure 1.30 1.20
5 Overseas France 1.32 1.32
6 UK-Belgium Business 1.41 1.16
7 Belgium-UK Business 1.30 1.19
8 UK-Belgium Leisure 1.37 1.06
9 Belgium-UK Leisure 1.32 1.27
10 Overseas Brussels 1.32 1.32
Total 1.34 1.14 Source Booz & Co. analysis
The model included a procedure for adjusting this growth for ‘off-corridor’ competition, based on
changes in the relative Eurostar/air fares to near-Europe and to elsewhere in Europe. The adjustment
applied to leisure travel and reduced the forecast growth factors within the corridor (see Table 5.4).
This reduced forecast growth rates to near-Europe to 50-60% of that for total travel but still over
forecasts the actual travel to near-Europe.

Table 5.4 2004 model near-Europe market growth forecasts
Model forecast of market growth
2003:2010 Segment
With forecast GDP With actual GDP
1 UK-France Business 1.41 1.16
2 France-UK Business 1.28 1.13
3 UK-France Leisure 1.15 0.95
4 France-UK Leisure 1.09 1.09
5 Overseas France 1.32 1.32
6 UK-Belgium Business 1.41 1.16
7 Belgium-UK Business 1.30 1.19
8 UK-Belgium Leisure 1.15 0.95
9 Belgium-UK Leisure 1.11 1.15
10 Overseas Brussels 1.32 1.32
Total 1.20 1.07 Source Booz & Co. analysis
5.3 ADDITIONAL ADJUSTMENTS
As in the two previous models, the 2004 model also included a series of adjustments for changes in
service level and prices and other network changes. These covered:
• CTRL 1 and CTRL 2;
• Eurostar performance;
• real changes in air and Eurostar fares; and,
• capacity constraints as demand increases.
The impact of all these changes was estimated using a common framework. This was a pivot-point
model with a generation component. The change in utility was estimated using parameters broadly in
line with PDFH (the UK Passenger Demand Forecasting Handbook) and the sensitivity of demand
derived from assumed fare elasticities of -0.6 for business travel and -1.2 for leisure.
5.3.1 CTRL 1 The 2004 model assumed a time-saving of between 16 and 20 minutes depending on market segment
(reflecting different proportions using Ashford and Waterloo) but with no frequency benefit, unlike
the 2000 models. The forecast increase in demand was 8% for both business and leisure traffic, with a
ramp-up period of three years.
5.3.2 CTRL 2
For CTRL2 the 2004 model assumed a further time-saving of 15-20 minutes, depending on market
segment, together with some small access time savings and reduced waiting times of 6 minutes for
Brussels passengers and 2 minutes for Paris passengers. As in the 2000 model, these savings were
based on a detailed model of access to Waterloo and St. Pancras. Little in the way of frequency
benefits or transfer benefits for north of London passengers were considered. The forecast impact on
demand was an increase of about 10%, an under-estimate of what occurred in practice.
5.3.3 Eurostar performance
Eurostar’s punctuality had been patchy during its early years when it was using the conventional rail
network but it deteriorated badly in the period following the Hatfield accident, so that by 2002, the
average delay for Paris services was over 15 minutes – this meant many trains were up to half-an-hour
late. This was clearly having a significant effect on demand and the model included a component to
reflect a reduction in average delay for the Paris trains to 8 minutes following the CTRL 1 opening
and 7 minutes following CTRL2, with corresponding reductions for the Brussels services. This was
forecast to increase demand by 10%. In the event, the actual average delay since 2004 has been close
to that assumed in the model.
5.3.4 Real changes in air and Eurostar fares
Small increases in business air fares were assumed for the Paris route for 2004-8, with larger ones for
Brussels for the first year. Leisure air fares had small reductions in the first two years. Eurostar fares
were assumed to increase steadily by 1-2% p.a. The overall impact was a forecast reduction in demand
of 2%, with business travel increasing slightly and leisure travel reducing. In practice, Eurostar fares
have increased by about 15% over the period to 2010. Air fares have fluctuated, with business fares
reducing whilst leisure fares have increased with the demise of the low-cost carriers on the route.
5.3.5 Capacity constraints
Similar to the 2000 model, the 2004 model included a small adjustment to allow for capacity
constraints suppressing demand. In the period to 2010 this adjustment had comparatively little impact.
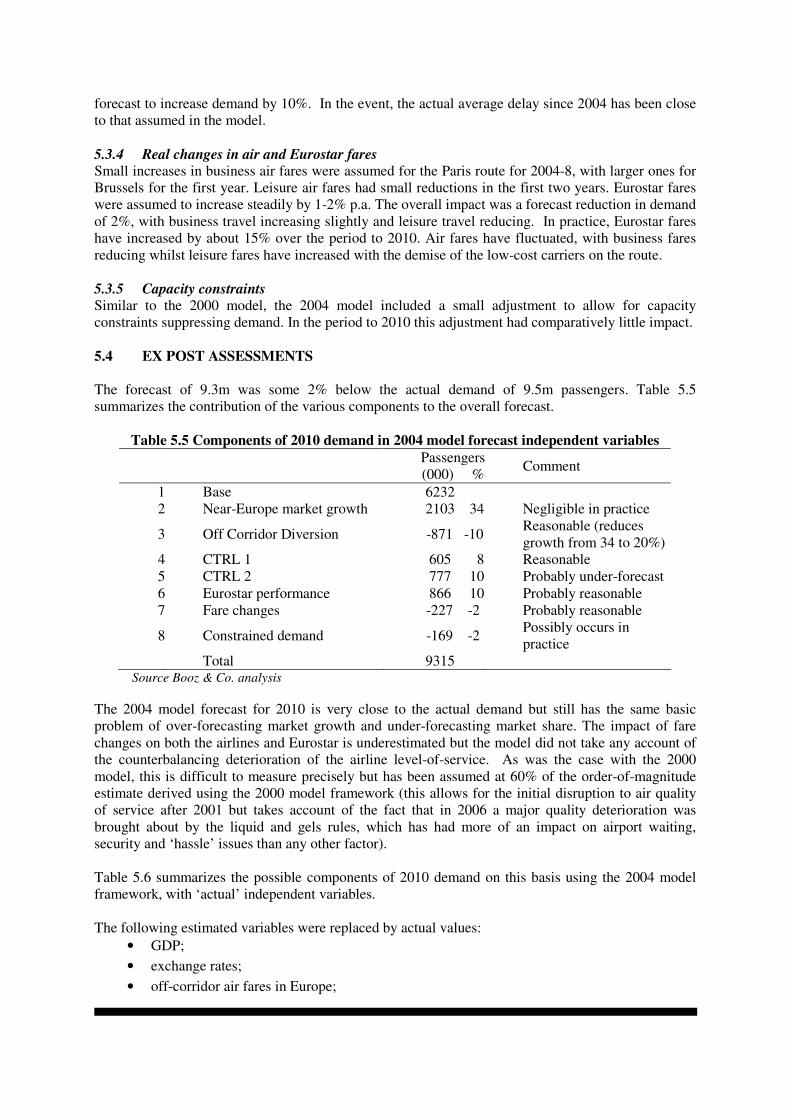
5.4 EX POST ASSESSMENTS
The forecast of 9.3m was some 2% below the actual demand of 9.5m passengers. Table 5.5
summarizes the contribution of the various components to the overall forecast.
Table 5.5 Components of 2010 demand in 2004 model forecast independent variables
Passengers
(000) % Comment
1 Base 6232……
2 Near-Europe market growth 2103 34 Negligible in practice
3 Off Corridor Diversion -871 -10 Reasonable (reduces
growth from 34 to 20%)
4 CTRL 1 605 8 Reasonable
5 CTRL 2 777 10 Probably under-forecast
6 Eurostar performance 866 10 Probably reasonable
7 Fare changes -227 -2 Probably reasonable
8 Constrained demand -169 -2 Possibly occurs in
practice
Total 9315 . Source Booz & Co. analysis
The 2004 model forecast for 2010 is very close to the actual demand but still has the same basic
problem of over-forecasting market growth and under-forecasting market share. The impact of fare
changes on both the airlines and Eurostar is underestimated but the model did not take any account of
the counterbalancing deterioration of the airline level-of-service. As was the case with the 2000
model, this is difficult to measure precisely but has been assumed at 60% of the order-of-magnitude
estimate derived using the 2000 model framework (this allows for the initial disruption to air quality
of service after 2001 but takes account of the fact that in 2006 a major quality deterioration was
brought about by the liquid and gels rules, which has had more of an impact on airport waiting,
security and ‘hassle’ issues than any other factor).
Table 5.6 summarizes the possible components of 2010 demand on this basis using the 2004 model
framework, with ‘actual’ independent variables.
The following estimated variables were replaced by actual values:
• GDP;
• exchange rates;
• off-corridor air fares in Europe;

• Eurostar performance;
• CTRL 1 inputs unchanged;
• CTRL 2 travel times 8 minutes faster then assumed; and
• actual fare changes have seen Eurostar fares increase in real terms over forecast period by
about 2% p.a. while business air fares have reduced in real terms by 2-3% p.a. and leisure
airfares have remained constant (France) or increased by 3%p.a. (Belgium).
This results in a rather larger under-forecast mainly caused by an underestimate of CTRL 1 and
CTRL2 and a failure to pick up airline level of service deterioration.
Table 5.6 Components of 2010 demand in 2004 model actual independent variables
Passengers
(000)
%
ImpactComment
1 Base 6232
2 Near-Europe market growth 885 14 Negligible in practice
3 Off Corridor Diversion -470 -7 Reasonable
4 CTRL 1 524 8 Probably under forecast
5 CTRL 2 889 12 Probably under forecast
5 Eurostar performance 765 9 Reasonable
6 Fare changes -585 -7 Probably reasonable
7 Constrained demand -107 -1Possibly occurs in
practice
Total 8133 Source Booz & Co. analysis
Table 5.7 substitutes what we believe were the actual impacts of the variables, CTRL1 and 2 are
much higher but market growth is lower. However we are still some 1 million trips below the actual
2010 out turn.
Table 5.7 Components of 2010 demand in 2004 model assessment of what occurred in practice
Passengers
(000)
%
ImpactComment
1 Base 6232
2 Near-Europe market growth - 02 & 3 together observed
to be negligible
3 Off Corridor Diversion - 0
4 CTRL 1 605 10 Observed
5 CTRL 2 1500 22 Observed
5 Eurostar performance 791 9 2004 model
6 Fare changes -605 -7 From 2004 model
7 Airline Level of service -Probably some 2/3rds of
2000 model
8 Constrained demand -111 -1Possibly occurs in
practice 2004 model
Total 8412
Unexplained 1088 Source Booz & Co. analysis
If airline quality of service impacts were taken into account (i.e., the impact of liquid and gels security
impacts in 2005/6), say 0.7 to 0.8 million, we would only be a little off the 2010 actuals, a difference
that can probably be accounted for by the impact of the 2010 volcano eruption on air traffic in Europe,
which temporarily boosted Eurostar demand in the first half of the year.

5.5 SUMMARY
The 2004 forecasts were remarkably accurate, predicting actual traffic to within approximately 2%.
However, this was more a matter of compensating errors and when actual levels of independent
variables etc were entered the under-forecast error increased to over 10%. The 2004 model did not
have a variable to account for airline level of service impacts. It is likely that this would account for
much of the variation. That is, the impact of the restrictions on carrying liquid and gels and other
security issues in 2005/6 on airline demand would raise Eurostar trips by some 0.7 to 0.8 million. At
this stage, we would only be a little off the 2010 actuals, a difference that can probably be accounted
for by the impact of the 2010 volcano eruption on air traffic in Europe, which will have temporarily
boosted Eurostar demand in the first half of the year.
Figure 5.1
7.7
2008
8.8
2005
7.5
2004
7.2
2006
6.2
2003
9.5
2007 2009 2010
9.3
Actual
8.1
9.1
2004/5 Model Forecasts by Growth Component & Comparison with Actual
CTRL2
CTRL1
Market growth
Base Unexplained
Air LOS
Constrained
Fares
Eurostar performance
Source: International Visitor Survey – Travel trends, Booz Estimates, Booz models

6. DISCLAIMER
This report prepared by Booz & Company (UK) Ltd and any information, findings, conclusions or
recommendations provided by Booz & Company (UK) Ltd or any of its representatives to High Speed
2 Limited and the Department for Transport (being the “Client”) in connection with its work
(collectively referred to herein as "our Report") are for the exclusive use of the Client.
No third party may rely on this report. Booz & Company accepts no responsibility to any third party
who is given a copy of this report. Each such third party will conduct its own independent analysis.
All estimates and analyses contained in this report are based on data or data reported to be obtained
from the sources cited and involve elements of subjective judgment and analysis, which may or may
not be correct.
The report is based upon publicly available information and information obtained from third party
sources and previous reports, and report drafts undertaken by Booz & Company and others, for which
source documentation has not been available. Booz & Company have thus, not been able to verify the
data quoted, so analyses represent Booz & Company's judgment, based upon reports of these data
sources, and are subject to the validity of assumptions not necessarily noted.
For purposes of the analyses and data presented in this report, Booz & Company has relied upon, and
considered accurate and complete, data obtained from such sources, but has not independently verified
the completeness or accuracy of that data, either with the sources or other 3rd
parties.