Embed Size (px)
Citation preview

© 2013 Navigant Consulting, Inc.
Evolution of the Electric Industry
Structure in the U.S. and
Resulting Issues
Prepared for:
Electric Markets Research Foundation
Navigant Consulting, Inc.
1200 19th Street NW
Suite 700
Washington, DC 20036
202.973.2400
www.navigant.com
October 8, 2013
© 2013 Navigant Consulting, Inc.
Copyright This report is protected by copyright. Any copying, reproduction, performance or publication in
any form without the express written consent of Navigant Consulting, Inc. is prohibited.
No Warranties or Representations, Limitation of Liability This report (The “Report”) was prepared for Electric Markets Research Foundation on terms
specifically limiting the liability of Navigant Consulting, Inc. (“Navigant”). Navigant’s conclusions
are the results of the exercise of its reasonable professional judgment based upon information
believed to be reliable. This Report is provided for informational purposes only. Navigant accepts
no duty of care or liability of any kind whatsoever to the reader or any other third party, and all
parties waive and release Navigant for all claims, liabilities and damages, if any, suffered as a result
of decisions made, or not made, or actions taken, or not taken, based on this report. Use of this
Report by reader for whatever purpose should not, and does not, absolve reader from using due
diligence in verifying the Report’s contents.
Electric Markets Research Foundation
Navigant conducted this study for the Electric Markets Research Foundation (EMRF). EMRF was
established in 2012 as a mechanism to fund credible expert research on the experience in the United
States with alternative electric utility market structures – those broadly characterized as the
traditional regulated model where utilities have an obligation to serve all customers in a defined
service area and in return receive the opportunity to earn a fair return on investments, and the
centralized market model where generation is bid in to a central market to set prices and customers
generally have a choice of electric supplier.
During the first few years of restructured markets, numerous studies were done looking at how
these two types of electric markets were operating and the results were mixed. But since those early
studies, limited research has been done regarding how centralized markets and traditionally
regulated utilities have fared. The Electric Markets Research Foundation has been formed to fund
studies by academics and other experts on electric market issues of critical importance.

© 2013 Navigant Consulting, Inc. Page i October 8, 2013
Table of Contents
1. Executive Summary ................................................................................................................ i
History and Development of Traditional Regulation and Competitive Markets .................................. i Today’s Two Broad Models ......................................................................................................................... iii System Reliability ......................................................................................................................................... iv Environmental Issues .................................................................................................................................... v Relative Allocation of Risks over Time ...................................................................................................... vi Responsibilities for Planning and the Types of Planning Performed .................................................... vi Innovation and the Levels of Research and Development Pursued ..................................................... vii State and Federal Government ................................................................................................................. viii
2. Introduction ............................................................................................................................ 1
3. History and Development of Traditional Regulation and Competitive Markets ..... 2
3.1 Development of Traditionally Regulated Markets .............................................................................. 3 3.2 Period of Growth and Declining Costs, 1945‐1970 .............................................................................. 6 3.3 Slowed Growth and Inflation, Seeds of Competition, 1970‐1990 ...................................................... 7 3.4 The Advent of Centralized Markets, 1990‐1999 ................................................................................... 9 3.5 Traditional Regulation and Centralized Markets Today .................................................................. 13
4. Today’s Two Broad Models ............................................................................................... 20
4.1 Current Status of Centralized Wholesale Generating Markets ....................................................... 20 4.1.1 Todays’ Centralized Wholesale Generating Markets .......................................................... 20 4.1.2 Energy Markets ........................................................................................................................ 21
4.2 Bilateral Wholesale Generation ............................................................................................................. 23 4.3 Today’s Retail Choice Status ................................................................................................................ 23 4.4 Cost‐Based Rates and Traditional Utility Regulation ....................................................................... 24 4.5 The Retail Choice Model ....................................................................................................................... 24 4.6 Differences Between the Traditional and Retail Choice Models ..................................................... 26
4.6.1 Retail Choice Markets .............................................................................................................. 26 4.6.2 Pricing for Generation Services .............................................................................................. 27
5. System Reliability ................................................................................................................ 28
5.1 Development of the Mandatory Reliability Standards ..................................................................... 28 5.2 Transmission Reliability ....................................................................................................................... 31
5.2.1 The NERC Standards and Who Must Comply .................................................................... 31 5.2.2 Role of the Registered Entities and States ............................................................................. 33 5.2.3 Compliance Monitoring and Enforcement ........................................................................... 34
5.3 Resource Adequacy ............................................................................................................................... 34

© 2013 Navigant Consulting, Inc. Page ii October 8, 2013
6. Environmental Issues .......................................................................................................... 39
6.1 Impacts of Environmental Regulation ................................................................................................ 39 6.2 Differing Impacts for Different Structures ......................................................................................... 39
6.2.1 Greenhouse Gas Initiatives ..................................................................................................... 40 6.2.2 Renewable Portfolio and Energy Efficiency Resource Standards ..................................... 42 6.2.3 Mercury and Air Toxics Standards ........................................................................................ 44 6.2.4 National Ambient Air Quality Standards ............................................................................. 44 6.2.5 Clean Air Interstate Rule/Cross‐State Air Pollution Rule ................................................... 44 6.2.6 Regional Haze ........................................................................................................................... 44 6.2.7 Cooling Water Intake Structures ............................................................................................ 45 6.2.8 Coal Combustion Residuals .................................................................................................... 45
7. Relative Allocation of Risks over Time ........................................................................... 46
7.1 Traditionally Regulated Model ............................................................................................................ 46 7.2 Centralized Market Model .................................................................................................................... 47
8. Responsibilities for Planning and the Types of Planning Performed ...................... 51
8.1 The Transmission Planning Framework ............................................................................................. 51 8.1.1 Regional Planning and the Inclusion of Non‐Incumbent Transmission Developers ..... 51 8.1.2 Interregional Planning Coordination .................................................................................... 53 8.1.3 Cost Allocation ......................................................................................................................... 54 8.1.4 Planning for Public Policy Requirements ............................................................................. 56
8.2 Transmission Siting and Transmission Grid Expansion .................................................................. 59 8.3 Adequacy Planning and Integrated Resource Planning ................................................................... 60
8.3.1 Integrated Resource Planning and Procurement Plans ...................................................... 60
9. Innovation and the Levels of Research and Development Pursued .......................... 63
9.1 Declining Costs and Increasing Flexibility of Generation Technologies ........................................ 63 9.2 Emergence of Demand Side Alternatives ........................................................................................... 65 9.3 Smart Grid ............................................................................................................................................... 66 9.4 Research and Development Investment ............................................................................................. 67
10. State and Federal Government ........................................................................................ 70

© 2013 Navigant Consulting, Inc. Page iii October 8, 2013
List of Figures and Tables
Figures:
Figure 1. Historical Timeline 1920‐1945 ................................................................................................................ 3 Figure 2. Historical Timeline 1945‐1970 ................................................................................................................ 6 Figure 3. Historical Timeline 1970‐1990 ................................................................................................................ 7 Figure 4. Historical Timeline 1990‐1999 ................................................................................................................ 9 Figure 5. Historical Timeline 1999‐Present ......................................................................................................... 13 Figure 6. Regional Transmission Organizations ................................................................................................ 18 Figure 7. Status of Electricity Restructuring (Retail Choice) by State .............................................................. 19 Figure 8. NERC Regions ........................................................................................................................................ 31 Figure 9. State RPS Policies ................................................................................................................................... 42 Figure 10. State EERS Policies ............................................................................................................................... 43 Figure 11. Forecasted Energy Sales from Alternative Suppliers ...................................................................... 49 Figure 12. States with Integrated Resource Planning (or similar planning process) ..................................... 62
Tables:
Table 1. Wholesale and Retail Market Structure by State ................................................................................. 20 Table 2. Centralized Markets and their Attributes ............................................................................................. 22 Table 3. Examples of Market‐Based Resource Adequacy Mechanisms .......................................................... 37 Table 4. Examples of Cost Allocation Approaches Used by Planning Region ............................................... 55 Table 5. Estimated National Average Levelized Cost of New Generation Resources in 2018 ..................... 64 Table 6. EPRI Planned R&D Funding for 2013 and 2014 .................................................................................. 69

© 2013 Navigant Consulting, Inc. Page i October 8, 2013
1. Executive Summary
This paper explores the key policy questions surrounding two broad regulatory/market structures that
currently exist in the United States (U.S.) in varying degrees: traditional utility regulation without
centralized markets on the one hand, and centralized electricity markets, often involving restructured
regulation, on the other.1 The paper is intended as an educational piece for non‐industry experts on how
and why electric utility regulation has evolved and one model has developed in some areas of the
country while not in others. This paper does not provide a critique of the market structures nor a
quantitative comparison between the two models. This paper may also serve as a foundation for
identifying the issues that characterize the key differences between the approaches and help guide
decisions on future research projects for the Electric Markets Research Foundation.
History and Development of Traditional Regulation and Competitive Markets
The evolution of the U.S. electric industry is a history of adaptation to changes in the operating and
regulatory environment. The first chapter traces the history of the two regulatory/market structures. It
begins from the early structure of the electric utility industry as it developed around the concept of a
central source of power with vertically integrated utilities and regulation of these entities by municipal
and state governmental entities.
During the early twentieth century, electric systems grew rapidly. Under the Rural Electrification Act
service was extended to unserved, or underserved, rural areas, which also gave rise to rural electric
cooperatives in many areas of the U.S. Disenchantment with privately owned power spurred the
development of government‐owned utilities, particularly hydroelectric power facilities. During the
presidency of Franklin D. Roosevelt (1933 to 1945), a number of these facilities were built, ushering in the
beginning of publicly owned power.
In 1920, the Federal Water Power Act was passed to coordinate the development of these hydroelectric
projects. This act created the Federal Power Commission (FPC), now the Federal Energy Regulatory
Commission (FERC). In 1935 the law was renamed the Federal Power Act and the FPC’s regulatory
jurisdiction was expanded to include all interstate electricity transmission and sales of power for resale
1 Within the two different general models there are further distinctions. The traditionally regulated model is often
characterized at the wholesale level by bilateral resource transactions while at the retail level the traditional
vertically integrated utility provides / purchases all functions required to provide service to the end users. The
centralized market model generally involves the existence of a Regional Transmission Organization (RTO) or
Independent System Operator (ISO) that administer centralized, bid‐based markets at the wholesale level with some
degree of retail competition where the customer has the right to procure power competitively with transmission and
distribution service provided by a regulated utility. Transmission and distribution under both models remains
governed by a cost of service regulatory approach. Further, the reader should be aware that there may be instances
where regions or entities generally characterized as functioning under a certain broad model may not exhibit all
features of that model. For example, there are regions that have centralized wholesale energy markets that may not
have implemented retail choice in all states within that region. Similarly, there are regions that remain traditionally
regulated but have elements of centralized markets and retail choice.

© 2013 Navigant Consulting, Inc. Page ii October 8, 2013
and formed the basis for federal jurisdiction over the electric and natural gas industries, and the
responsibilities of the FERC. In that same year, after several large holding company systems collapsed,
the Public Utility Holding Company Act of 1935 (PUHCA) was passed, giving the Securities and
Exchange Commission responsibility for regulating utility holding companies. Under Title II, PUHCA
charged the FPC with regulating utilities involved in interstate wholesale marketing or transmission of
electric power. Regulatory administration of the rate case established base rates based on the actual
normal costs of providing service determined by the utility’s revenue requirement.
A number of damaging events occurred in the 1960s and 1970s that interrupted the growth that had
occurred in the prior several decades. First, the Northeast Blackout of 1965 raised concerns about
reliability; then, the passage of the Clean Air Act of 1970 and its amendments in 1977 increased utility
costs to reduce polluting emissions. And, most significantly, the Oil Embargo of 1973‐1974 resulted in
increases in fossil‐fuel prices. In 1978, Congress pursued legislation to address these pressures by
reducing U.S. dependence on foreign oil and developing renewable and alternative energy sources. The
Public Utility Regulatory Policies Act of 1978 ushered in a greater reliance on market forces to set
wholesale energy prices, while requiring utilities to buy power at their “avoided cost” from unaffiliated
alternative energy resources meeting a number of qualifications. Throughout the late 1980s, utility
interest in wholesale transactions grew, prompted by a number of factors. Some utilities found
themselves with excess generation because expected demand growth did not meet projected levels. In
addition, in the wake of aggressive utility construction programs, regulators determined that some costs
were imprudent and refused to allow the utilities to recover them in rates. Utilities sought to sell
electricity in wholesale transactions at market‐based rates, and FERC would grant these requests upon a
showing that the utility could not exercise market power to set prices.
Two significant policy decisions occurred in the 1990s that provided a foundation for energy market
development. The first was the passage of the federal Energy Policy Act of 1992 (EPACT), which created
a number of incentives for market development. The second was the cornerstone in the creation of
competitive wholesale power markets, FERC’s Order No. 888. Order No. 888 strove to eliminate anti‐
competitive practices and undue discrimination in transmission services through a universally applied
open‐access transmission tariff. At the same time these changes were occurring in the wholesale
electricity markets, a growing number of states were also pursuing a reliance on competitive markets for
the retail supply of electric power. This typically required the incumbent utility to divest some or all of
its generation and become a wires‐only distribution utility.
By 2000, FERC was calling for the voluntary formation of regional transmission organizations (RTOs)
through its Order No. 2000. The basis of Order No. 2000 was FERC’s belief that RTOs would facilitate
the continued development of competitive wholesale power markets and would lead to improvements
in reliability and management of the transmission system, eliminating any remaining discriminatory
practices. However, concurrent with FERC’s efforts under Order No. 2000, challenges were arising in
the California markets. In 2001, California suffered from flaws in its power market structure leading to
the insolvency of one of the largest utilities in the state. Following the California energy market crisis
and a blackout that affected a large portion of the northeastern U.S. and Canada in 2003, Congress
enacted the Energy Policy Act of 2005 (EPAct 2005) on August 8, 2005. This legislation provided FERC
greater authority to oversee wholesale electricity markets. FERC subsequently issued Order No. 890 in

© 2013 Navigant Consulting, Inc. Page iii October 8, 2013
early 2007 to correct flaws in its pro forma Open Access Transmission Tariff (OATT) that had been
uncovered during the ten years since Order No. 888 was issued.
During the autumn of 2008, large disruptions in the financial markets also uncovered vulnerabilities in
the electricity markets. In response, FERC issued Order No. 741 proposing extensive revisions to its
policy on RTO/Independent System Operator (ISO) credit practices. Congress took additional actions in
response to the 2008 financial crisis, including enacting the Dodd‐Frank Act, which had the potential to
affect energy trading companies and wholesale energy markets.
Today’s Two Broad Models
At the wholesale level, bilateral transactions prevail in the Southeast, most of the Southwest, parts of the
Midwest and the West, excluding California. Under this regime, utilities engage in wholesale physical
power transactions through bilateral arrangements ranging from standardized contract packages, to
customized, complex contracts known as structured transactions. This is characterized as a component
of the traditionally regulated model. A centralized market model is the norm in the Northeast, Mid‐
Atlantic, much of the Midwest, the Electric Reliability Council of Texas (ERCOT), and California. In
these markets participants bid/offer resources into a centralized market and are paid a uniform clearing
price.
Similarly, two models are currently employed in the United States to deliver electric power to retail
consumers. The traditional model is the Vertically Integrated Utility, where various services are
“bundled,” meaning that all energy and energy delivery (transmission and distribution) services, as well
as ancillary and retail services, are provided by one entity.2 Customers do not have the option of
selecting another provider for any of these services, and the utility’s charges are set entirely by the
regulatory authority or governing body in the case of public power. In contrast, under the retail choice
model, customer choice has been partially or fully implemented. In this model, customers may often
select their energy provider, and the utility will deliver the power. Non‐utility energy providers can set
their own pricing for power, but the utility’s charges for delivery and related services are set by the
regulatory authority. Traditional “bundled” pricing may also be available from the utility, for some or
all types of customers.3
In the United States, traditional utility pricing (or ratemaking) is cost‐based, meaning that the utility is
allowed to charge prices that will recover prudent operating costs and provide an opportunity to earn a
reasonable rate of return on the property devoted to the business. Among the historical criticisms of
cost‐based ratemaking are that it creates an incentive to over‐invest in capital‐intensive projects and fails
to provide utilities proper incentives to operate efficiently.
2 Although in the case of Public Power, generation and transmission may be provided by joint authorities and
bundled by the local distribution utility. 3 It is worth noting that the “Retail Choice” model encompasses a spectrum of features that may vary from state to
state. The key features, such as the existence of retail choice for at least some customers and the availability of
organized wholesale energy markets are the same, although there may be differences in the manner and degree to
which these features are implemented.

© 2013 Navigant Consulting, Inc. Page iv October 8, 2013
The customer choice aspect of the Retail Choice model was introduced in the United States in the 1990s
in response to high regulated prices in some regions relative to the cost of wholesale markets. Many
consumer groups found retail competition attractive because the prices in emerging wholesale markets
were significantly below the regulated retail prices charged by utilities.
In contrast to the traditional regulated model, the customer choice feature of the retail choice model
limits the operation of the regulated utility to the transmission and distribution functions, where
traditional cost‐based pricing is implemented and approved by regulators. Generation services are
provided either by competitive service providers or through a default “provider of last resort.” Retail
choice also has its criticisms; among them are that residential participation in some retail markets has
been slow to materialize, in part because retail suppliers have not pursued residential customers as
aggressively as commercial customers due to their relatively small size. Other factors may include a lack
of incentives (i.e., lower prices) or information.
System Reliability
Reliability standards or criteria used for planning and operations are an integral part of the electric
power industry and have been since the very first systems were developed in the late nineteenth
century. There are two principal components to bulk power system (BPS) reliability—resource adequacy
and transmission security.4 The area of transmission security is governed by FERC, the North American
Electric Reliability Corporation (NERC), and the Regional Entities (REs). The states still retain a role in
resource adequacy and in regulating the reliability of local distribution systems.
Over the years, a series of blackouts (the 1965 Northeast Blackout, the blackout on the East Coast in July
1977, the West Coast blackouts in July and August of 1996, and the blackout on August 14, 2003 affecting
the northeastern U.S. and Canada) led to the creation of NERC and its REs. Prior to 2005, compliance
with reliability standards was voluntary. The enactment of EPAct 2005 eliminated the voluntary nature
of the NERC reliability standards. FERC was charged with the ultimate oversight of electric reliability of
the Bulk Power System (BPS). NERC, as the independent Electric Reliability Organization (ERO), along
with its REs develop mandatory reliability standards subject to FERC approval, monitor industry
participants’ compliance with these standards, and can levy penalties for noncompliance up to one
million dollars per day per violation for the most serious violations.
Currently, there are 102 standards with more than 1,300 requirements applicable and mandatory in the
U.S. Within the United States, other than Alaska and Hawaii, all users, owners, and operators of the BPS
must comply with the reliability standards developed by the ERO and regional reliability standards
developed by the REs. This responsibility extends FERC jurisdiction not only to the government‐owned
and other so‐called non‐jurisdictional utilities, but also to utilities in Texas as well as to a wide range of
non‐utility entities that use the transmission grid.
The ERO’s compliance registry process is used to identify the set of entities that are responsible for
compliance with a particular reliability standard and the applicability section of a particular reliability
standard determines the applicability of each reliability standard. The NERC Functional Model provides
4 Reliability is also dependent at the local level on the reliability of the local distribution system.

© 2013 Navigant Consulting, Inc. Page v October 8, 2013
guidance concerning the type of function for which an entity is registered and, therefore, their role in
maintaining reliability.
Regardless of whether entities are located in regions that have centralized markets and RTOs/ISOs or a
traditional regulation structure, the REs and NERC will identify who must be registered and as what
type of functional entity. The primary difference between functional responsibilities of entities that exist
in RTOs/ISOs and those that do not is that RTOs/ISOs often perform the functional roles of balancing
authority, reliability coordinator, transmission operator, and transmission planner. In regions that do
not have RTOs/ISOs, the electric utility often performs all the functions and is registered as multiple
functional entity types. The states and other governmental entities that have regulatory oversight
functions may participate as non‐voting members in NERC and RE activities, under the government
sector, and may also provide comments in FERC proceedings.
Two approaches have been applied to achieving the resource adequacy goals—market‐based and an
administrative approach. With a capacity market, suppliers receive periodic (i.e., annual or monthly)
payments for providing “reliable” capacity to a system and Load‐Serving Entities (LSEs) are required by
the regulatory standard to purchase the capacity. Examples of capacity markets are PJM, NYISO, and
ISO‐NE. There are also other variations to the market‐based approach; these are energy‐only markets (in
ERCOT) and markets with administrative resource adequacy requirements for LSEs (CAISO and MISO).
One key concern for consumers is price volatility and uncertainty. Questions also remain as to how
current market design will work to ensure capacity adequacy in the long term at economically efficient
levels. Under the administrative approach, resource adequacy is achieved through traditional Integrated
Resource Planning (IRP) and competitive resource solicitation. One key concern with the administrative
approach is increased consumer cost due to uneconomic long‐term investment decisions. Examples of
administrative approaches are the Southwest Power Pool, most of the Western Electricity Coordinating
Council outside the CAISO, and the southeast U.S.
Environmental Issues
Market/regulatory structure plays an important role in whether and how environmental requirements
and policies affect electric entities. Where the traditionally regulated model prevails, the impacts—
whatever they are—fall on the utility and the associated costs flow to its customers through cost‐based
rates. In contrast, where there has been a restructuring of utility regulation and the development of
centralized electricity markets, impacts vary widely. A utility that owns no generation would not incur
the direct expense of complying with environmental rules relating to emissions, although generators
would try to raise prices to recover costs. Similarly, generation‐only entities would not normally be
subject to renewable portfolio standards (RPS) or policies favoring the use of renewable energy
resources.
Independent generators in centralized markets are particularly sensitive to the costs of environmental
regulation, since these generators rely on market pricing rather than cost of service rates. Uneconomic
generation in competitive markets may be retired rather than operated at a loss for any extended period
of time. Under the traditional regulated model, vertically integrated utilities are also sensitive to
environmental regulation, including policies or regulations favoring renewables, since compliance
would increase or decrease its costs.

© 2013 Navigant Consulting, Inc. Page vi October 8, 2013
The costs and risks from proposed environmental regulations will differ by region, largely affecting
those regions of the country with significant amounts of existing coal‐fired generation. Whether
environmental costs end up being passed through in cost‐based rates or result in higher market‐based
rates, the impact on electricity consumers in those regions will be considerable.
Relative Allocation of Risks over Time
Under the traditional regulated model, the allocation of risks is well established. The utility has a
monopoly right to provide electric service to retail customers, who in turn are entitled to electricity at a
“reasonable” cost. The utility’s risk in the traditional model is that its rates will not recover its actual
investment and operating costs or meet the rate of return required for its investors to risk their money.
The utility also risks that its costs will be determined to have been prudently incurred and that it will
receive timely recovery through the regulatory process. The customers face much of the risk of utility
over‐investment or under‐investment (either through bad decision making or out of concern that it will
not recover its costs), and unreliable service and high costs as a result of ineffective operations or bad
decision making; to the extent the regulators allow utilities to recover their costs.
In a centralized market model, the risks for customers and the mechanisms for addressing them are the
same with respect to the transmission and distribution system. Rate cases and regulation are the
principal tools to protect customers from monopoly abuses and to set the utility’s pricing for the delivery
of electricity. However, with respect to generation, the market sets wholesale energy prices. In these
markets, many generators in a region compete with one another to supply electricity. These regions also
rely on market forces to cause needed generation to be added when and where it is needed but some
markets have found that these forces may not be enough incentive. A further complexity in some
centralized markets is customer choice where a utility must be prepared to procure power for a changing
customer base.
Responsibilities for Planning and the Types of Planning Performed
Planning functions encompass adequacy and transmission security planning. State and federal
governments have overlapping responsibilities for these two aspects of planning. The oversight of
resource adequacy planning has traditionally been a state function while transmission security planning,
with the important exception of transmission siting, has now become governed by federal law and
regulation overseen by FERC.
In recent years, two key FERC Orders have encompassed the field of transmission planning. They are
Order No. 890 and Order No. 1000, which apply to entities whether in RTO/ISO regions with centralized
markets or not. Order No. 890 promoted increased open, transparent and coordinated transmission
planning on sub‐regional (local) and regional levels. Order No. 1000 built upon and extended many of
the ideas initially introduced under Order No. 890. Among the changes introduced in Order No. 1000
are requirements for regional and interregional planning, cost allocation, consideration of public policy
requirements, and elimination of the Right of First Refusal in wholesale tariffs to construct new facilities.
In areas where RTO/ISOs have formed, transmission planning often encompasses a larger region than
previously existed and is coordinated around a centralized processes administered by the RTO/ISO. In
areas where traditional regulation remains, planning is coordinated by the vertically integrated utilities

© 2013 Navigant Consulting, Inc. Page vii October 8, 2013
or public power entities within their territory. These territories may also encompass large areas due to
mergers and holding company consolidation. Both traditionally regulated and competitive market
(RTO/ISO) regions have in place processes to coordinate planning with their neighboring entities.
The authority over transmission siting is a patchwork quilt of overlapping and sometimes unclear
divisions of authority. While the majority of siting authority currently lies with the states, there are
instances where federal approvals are required. The Energy Policy Act of 2005 established a limited role
for the U.S. Department of Energy (DOE) and the FERC in transmission siting. The act directed DOE to
create “transmission corridors” in locations with adequate transmission capacity that had “national
interest” implications. The act also granted FERC secondary authority over transmission siting in these
corridors, which may not be exercised by FERC unless the state where the facility would be sited lacks
the authority to issue the permit, the applicant does not qualify for the permit in the state, or the state
has “withheld approval” of the permit for more than one year.
While some regions have moved to develop capacity markets, discussed earlier, to ensure generation
adequacy, many states, particularly in areas where the traditionally regulated model remains, have
retained the IRP approach, which began in the late 1980s. Steps taken in an IRP include forecasting
future loads, identifying potential supply‐side and demand‐side resource options to meet those future
loads and their associated costs, determining the optimal mix of resources taking into account
transmission and other costs, receiving and responding to public participation (where applicable), and
creating and implementing a resource plan.
Innovation and the Levels of Research and Development Pursued
Innovations in the electric industry, technical and economic, have come about through the application of
research and development (R&D) of projects by the electric sector, governments, and other industrial,
communications, and technology sectors.
The expansion of combined heat and power and natural gas‐fired combined cycle plants in the late 1970s
into the 1990s was a strong contributing factor to growth in the class of non‐utility generation. The cost‐
effectiveness of smaller increments of generation has reduced the need for utilities to periodically have
large, “lumpy”, capital‐intensive investments and corresponding large additions to their rate base.
Moreover, since generation can be added in smaller increments and with lead times closer to the time of
anticipated need, the investment cycle has become smoother. This benefits both traditional and
competitive market entities.
Demand‐side management (DSM)‐induced reductions in load growth reduce or defer the need for new
generation plant investment and the costs of the DSM alternatives may be less than the cost of new
generation. Centralized market regions are gradually implementing market rules that seek to place
supply‐ and demand‐side options on equal footing with respect to bidding into capacity and energy
markets. Traditionally regulated regions seek to maintain equal footing for these two types of options
through integrated resource plans vetted by state regulators.
In the last decade, or less, the Smart Grid has become a hot topic in political and academic circles as well
as other groups not traditionally involved in the regular processes of the electric sector. The expectation
© 2013 Navigant Consulting, Inc. Page viii October 8, 2013
is that Smart Grid implementation will generate potential savings to customers by providing them the
tools to manage their energy consumption habits and costs, as well as providing potential savings to
utilities and their customers through operating efficiencies. Utilities in both models would benefit from
savings. Similarly, customers can benefit from smart meters and usage information under both models.
R&D investment by electric utilities (including their contributions to the Electric Power Research
Institute) is small when compared to other industrial sectors and when observed in the context of the
role electricity plays in our national economy and society. However, historically, electric equipment
manufacturers have provided the majority of the R&D in the sector; this is primarily because utilities
cannot necessarily internalize the benefits of the innovations developed through R&D. No study has
definitively assessed the impact of restructuring efforts on R&D investment in the electricity industry.
However, several studies have noted a decline in R&D investment in some areas and concluded that
utility restructuring is the likely cause. However, there are also studies that have concluded that the
centralized market model encourages more innovation than the traditionally regulated model.5
State and Federal Government
The electric utility industry in the United States is regulated at the state and federal levels. State
regulation extends to most areas of utility operations, rates, and end‐user issues. Federal regulation,
founded on interstate commerce impacts, generally relates to the wholesale side of the utility business,
including interstate transmission and sales of electricity for resale. State and Federal jurisdiction over
transmission siting, resource adequacy and transmission security planning, and electric reliability have
been discussed above.
Investor‐owned utilities are subject to state regulation as to their duties to customers, system
requirements, financing arrangements, and retail rates. Government‐owned utilities and rural electric
cooperatives are not generally subject to regulation under state utility laws, but must follow the
requirements of the ordinance or law establishing them and have governing boards that provide
oversight.
Under both the traditionally regulated model and the centralized market model, interstate transmission
rates are approved by FERC and FERC regulates the interstate transmission and generation activities of
“public utilities.” FERC does not regulate government‐owned utilities or most cooperatives, which are
often referred to as “non‐jurisdictional” entities. In addition, because most of the Texas transmission
grid is not interconnected with the rest of the interstate transmission grid, Texas is not subject to FERC
rate regulation. In Texas, the state regulator is responsible for approving transmission rates (because
Texas transmission is intrastate) as well as regulating all other aspects of the electric utility business in
Texas.
While FERC’s regulatory reach is not absolute, FERC has effectively extended many of its regulations to
non‐jurisdictional utilities through reciprocity. For example, if a non‐jurisdictional utility wants to take
advantage of the terms of a public utility’s Open Access Transmission Tariff (OATT), then it must itself
have an OATT where the terms of service other than rates must comply with FERC requirements.
5 These studies are discussed in greater detail in section 9.4.

© 2013 Navigant Consulting, Inc. Page ix October 8, 2013
Similarly, in order to be part of the regional planning process and to take advantage of proposed cost
allocation mechanisms, FERC has said that non‐jurisdictional entities have to agree to participate in the
FERC‐regulated planning processes and be subject to the outcome of these processes.

© 2013 Navigant Consulting, Inc. Page 1 October 8, 2013
2. Introduction
This paper explores the key policy questions surrounding two broad regulatory/market structures that
currently exist in the United States in varying degrees: traditional utility regulation without centralized
markets on the one hand, and centralized electricity markets, often involving restructured regulation, on
the other. The latter structure also generally involves the existence of a Regional Transmission
Organization (RTO) or Independent System Operator (ISO).
This paper provides a brief history of regulation and competition in the electric industry and identifies
the issues that characterize the key differences between the two major regulatory/market structures,
which for ease of reference are being called a “traditionally regulated” model and a “centralized market”
model.6 The paper is intended as an educational piece for non‐industry experts on how and why electric
utility regulation has evolved and centralized energy markets have developed in some areas of the
country and not in others. It focuses on consumer impacts and discusses how various issues are
addressed under the two broad models as well as identifying ongoing issues and challenges. This paper
does not provide a critique of the models nor a quantitative comparison between the two models.
A secondary purpose of the paper is to serve as a foundation for identifying the issues that characterize
the key differences between the two regulatory/market structures that will help guide decisions on
future research projects for the Electric Market Research Foundation (EMRF) to meet its goal of
informing the public policy debate on the pros and cons of the major market structures.
6 Within the two different general models there are further distinctions. The traditionally regulated model is often
characterized at the wholesale level by bilateral resource transactions while at the retail level the traditional
vertically integrated utility provides / purchases all functions required to provide service to the end users. The
centralized market model generally involves the existence of a Regional Transmission Organization (RTO) or
Independent System Operator (ISO) that administer centralized, bid‐based markets at the wholesale level with some
degree of retail competition where the customer has the right to procure power competitively with transmission and
distribution service provided by a regulated utility. Transmission and distribution under both models remains
governed by a cost of service regulatory approach. Further, the reader should be aware that there may be instances
where regions or entities generally characterized as functioning under a certain broad model may not exhibit all
features of that model. For example, there are regions that have centralized wholesale energy markets that may not
have implemented retail choice in all states within the region. Similarly, there are regions that remain traditionally
regulated but have elements of centralized markets and retail choice.

© 2013 Navigant Consulting, Inc. Page 2 October 8, 2013
3. History and Development of Traditional Regulation and Competitive Markets
The evolution of the U.S. electric industry is a history of adaptation to changes in the operating and
regulatory environment. During times of significant economic and technological change, policymakers
adapted regulatory policy to ensure the public interest continued to be served, economic principles of
efficiency and competition were advanced, and the reliable and efficient delivery of electric service to
consumers was maintained. The decisions made by regulators and policymakers shaped the two
regulatory paths that have emerged—traditional rate making based on cost of service regulation and
centralized market development. Today, both of these approaches co‐exist and continue to evolve to
meet changing economic and technological challenges.
The allocation of regulatory authority between the federal government and the states is distinguished by
what constitutes interstate commerce and what constitutes intrastate commerce.7 Furthermore, there is
the preemptive effect of federal wholesale rate orders on state retail rate authority.8 This dichotomy has
resulted in a number of distinctions among industry participants as to whether they are subject to
federal, state or both federal and state regulation by virtue of how they are organized and whether they
operate within a single state. Further, distinctions as to the applicability of federal vs. state regulation
turn on which specific physical and functional components of the electric system (e.g., generation,
transmission, distribution, and customer service) are in question.
The sections that follow describe, from the early beginning to present day, the key events that
transformed approaches in electric regulation policy and the evolving approaches designed by
regulators and policymakers on both the federal and state levels to meet those challenges.
7 See also, New York v. FERC, 535 U.S. 1 (2002). The court acknowledged that FERC correctly could choose not to
regulate the transmission component of bundled retail sales. Bundled sales are sales that combine energy and
transmission service as a single unit. 8 Under the Narragansett line of cases, Narragansett Elec. Co. v. Burke, 381 A.2d 1358 (1977), cert. denied, 435 U.S. 972
(1978), comprising what is now called the ʺfiled rate doctrine,ʺ state regulators must treat a utilityʹs FERC‐approved
wholesale power costs as reasonable operating expenses in the companyʹs retail cost of service. In other words, the
retail regulator cannot, in its retail rate hearing, question the reasonableness of the wholesale rate that the FERC has
fixed.

© 2013 Navigant Consulting, Inc. Page 3 October 8, 2013
3.1 Development of Traditionally Regulated Markets
Figure 1. Historical Timeline 1920‐19459
The early structure of the electric utility industry developed around the concept of a central source of
power supplied by efficient, low‐cost utility generation, transmission, and distribution. Regulation of
utilities began in the late nineteenth century, with municipalities issuing franchises, often overlapping,
as a method of regulation, promoting competition between utilities. This regulatory oversight derived
from a series of nineteenth century court decisions in the U.S. that held industries such as grain
elevators, warehouses, and canals were “monopoly” providers of service “affected with the public
interest”7 and that their rates and terms of service could therefore be regulated.10 Municipal regulation
gave way to state regulation following the passage of laws in New York and Wisconsin developing
powerful state commissions.11
In the early part of the twentieth century, the electric industry evolved quickly through the creation,
growth, and consolidation of vertically integrated utilities. A rapid increase in electricity generation
encouraged growth and consolidation of the industry to achieve economies of scale, which resulted in an
expansion into more and more cities across wider geographic areas.12 During this period, vertically
integrated electric utilities produced approximately two‐fifths of the nationʹs electricity.13 Over time,
states granted these consolidated utilities monopoly franchises with exclusive service territories in
exchange for an obligation to serve customers within that territory at rates for service based on state‐
regulated, cost‐of‐service ratemaking.14 As utility service territories grew throughout the 1900s, state
9 Source: Navigant Consulting, Inc. 10 See Munn v. Illinois, 94 U.S. 113, 126 (1877). 11 There are alternative views of why the municipal regulation ended. The natural monopoly view is that state
regulation was necessary to distance the regulator from the local level and to enforce uniform regulation throughout
the jurisdiction. This view assumes that one firm can serve the market more cheaply than two or more firms and can
keep out rival firms by expanding output and lowering price when threatened. The alternative view was that the
move from municipal to state regulation was in the public interest. See R. Richard Geddes, A Historical Perspective
on Electric Utility Regulation, CATO REVIEW OF BUSINESS,
http://www.cato.org/sites/cato.org/files/serials/files/regulation/1992/1/v15n1‐8.pdf, at pp. 75‐77. 12 See U.S. Electric Power Industry ‐ Context and Structure, Analysis Group for Advanced Energy Economy
(November 2011) (“AEE Context and Structure”). 13 Energy Information Administration, The Changing Structure of the Electric Power Industry 2000: An Update
(October 2000) Part I, Chapter 2, pg. 5 (“EIA Changing Structure”). 14 See AEE Context and Structure.

© 2013 Navigant Consulting, Inc. Page 4 October 8, 2013
regulation of privately owned electric utilities increased. Among the first states to regulate electric
utilities were Georgia, New York, and Wisconsin, which established state public service commissions in
1907.15 These states were soon followed by more than 20 other states. Part of the justification for
exclusive service territories was that a single distribution system in an area was more efficient due to
economies of scope; competing distribution facilities on thoroughfares and in communities would
require redundant capital investment and expenditures.
Despite the lure of exclusive franchises, some areas were inevitably less attractive than others. This was
particularly true with respect to rural areas, where the progress of electrification was much slower than
in urban areas. The Rural Electrification Act was enacted to provide power to unserved, or underserved,
rural areas and gave rise to the advent of rural electric cooperatives in many areas of the U.S.
During the 1920s and the early years of the Depression, the public became disenchanted with privately
owned power and began to support the idea of government ownership of utilities, particularly
hydroelectric power facilities. This disenchantment resulted primarily from abuses imposed by holding
companies on utilities, and ultimately on their customers, causing the price of electricity to increase. A
fierce debate at the time was whether government‐owned hydroelectric power facilities could produce
power cheaply and sell it to publicly owned utilities for distribution. During the presidency of Franklin
D. Roosevelt (1933 to 1945), a number of these facilities were built, ushering in the beginning of publicly
owned power.16
The development of hydroelectric projects in the United States was coordinated under the Federal Water
Power Act in 1920. The act created the Federal Power Commission (FPC), now the Federal Energy
Regulatory Commission (FERC), as the licensing authority for these plants. The FPC also regulated the
interstate activities of the electric power and natural gas industries. The responsibility of the FPC was to
maintain just, reasonable, and nondiscriminatory rates to the consumer. In 1935 the law was renamed
the Federal Power Act (FPA), and the FPC’s regulatory jurisdiction was expanded to include all
interstate electricity transmission. The FPC was also given authority to regulate nonfederal hydropower
projects. The Federal Power Act is the core legislation providing federal jurisdiction over the electric and
natural gas industries and defining the responsibilities of the FERC.17 However, the FPA exempts
15 Energy Information Administration, Annual Outlook for U.S. Electric Power 1985, DOE/EIA‐0474(85) (August 1985),
pg. 3. 16 EIA Changing Structure, Part I, Chapter 2, pg. 6. As part of the program, President Roosevelt proposed that the
government build four hydropower projects and, within a year after his proposal, his administration began to
implement the projects.
Hoover Dam began generation in 1936, followed by other large projects.
Grand Coulee, the nation’s largest hydroelectric dam, began operation in 1941.
Under the Tennessee Valley Authority Act of 1933, the federal government supplied electric power to
states, counties, municipalities, and nonprofit cooperatives.
The Bonneville Project Act of 1937 pioneered the federal power marketing administrations.
From 1933 to 1941, one‐half of all new capacity was provided by federal and other public power installations. Public
power contributed 12 percent of total utility generation, with federal power alone contributing almost 7 percent. See
Id. It should be noted that the federal power generating entities were not subject to regulation by States. 17 See AEE Context and Structure.
© 2013 Navigant Consulting, Inc. Page 5 October 8, 2013
certain entities from many provisions of the Act, including entities in the state of Texas, which is a
single‐state Interconnection with no interstate transactions, as well as certain non‐public utilities (i.e.,
Municipal Utilities, Cooperatives, Power Marketing Administrations, and state authorities).18
After several large holding company systems collapsed, an investigation by the Federal Trade
Commission was ordered, leading eventually to the passage of the Public Utility Holding Company Act
of 1935 (PUHCA). PUHCA was aimed at breaking up the unconstrained and excessively large trusts
that then controlled the nationʹs electric and gas distribution networks.19
PUHCA gave the Securities and Exchange Commission (SEC) responsibility for regulating utility
holding companies. Under Title II of PUHCA, the FPC also regulated utilities involved in interstate
wholesale marketing or transmission of electric power.20 One of the most important features of the Act
was that the SEC was given the power to break up the large interstate holding companies by requiring
them to divest their holdings until each became a single consolidated system serving a circumscribed
geographic area. Another important feature of the law permitted holding companies to engage only in
business that was essential and appropriate for the operation of a single integrated utility.21
In the Supreme Court case of FPC v. Hope, the Court stated: “[t]he rate‐making process … i.e., the fixing
of ― just and reasonable rates, involves a balancing of the investor and the consumer interest.”22 This
balancing of consumer and investor interests evolved into what has become known as the regulatory
compact.23 In addition, Hope gave rise to an End Results Doctrine relating to rates. Under this doctrine,
only the end result – not the methodology – matters in determining whether rates are just and
reasonable.24
The regulatory compact is premised on the existence of a set of rights, obligations, and benefits that are
shared between utilities and their customers.25 In return for the grant of a franchise and the right to
recover its costs plus a market‐determined profit equal to the cost of debt and equity capital, the
18 Section 201(f) of the FPA generally exempts the United States, a state or any political subdivision of a state, an
electric cooperative that receives financing under the Rural Electrification Act of 1936 (7 U.S.C. 901 et seq.) or that
sells less than 4,000,000 megawatt‐hours of electricity per year from Part II of the FPA. However, it should be noted
that the reliability section of the FPA added under EPACT 2005 extends to entities that were described under 201(f)
of the FPA. See Federal Power Act § 215(b), 16 U.S.C §844o(b). 19 EIA Changing Structure, Part I, Chapter 4, pg. 29. 20 Ibid., Part I, Chapter 2, pg. 5. 21 Ibid., Part I, Chapter 4, pg. 29. 22 Federal Power Commission v. Hope Natural Gas Co., 320 U.S. 591, 603 (1944). 23 The concept of a regulatory compact is not that there is a formal agreement between the utility and government
but rather that the legal obligations of regulators and utilities have evolved through a long series of court decisions,
See RAP Publications, Electricity Regulation in the US: A Guide (March 2011) ,
www.raponline.org/document/download/id/645 , pp. 4-5. 24 Dr. Karl McDermott, Cost of Service Regulation In the Investor‐Owned Electric Utility Industry (June 2012), pg. 3
(“Cost of Service Regulation”). 25 Cost of Service Regulation, pg. vii.
© 2013 Navigant Consulting, Inc. Page 6 October 8, 2013
investor‐owned utility must submit to rate regulation and provide service efficiently.26 “The regulatory
compact has a two‐fold focus: (1) establish prices based on the actual prudent costs (i.e., avoid monopoly
pricing); and (2) provide incentives to maintain a reasonable level of efficiency in serving the
customers.”27
Under traditional utility regulation, this determination of the appropriate cost of service that can be
charged by the utility is determined through what developed as the rate case process, which examines
the prudency of costs after they are incurred.28 This form of regulation serves as an administrative
replacement for market mechanisms in determining what costs were efficient.29
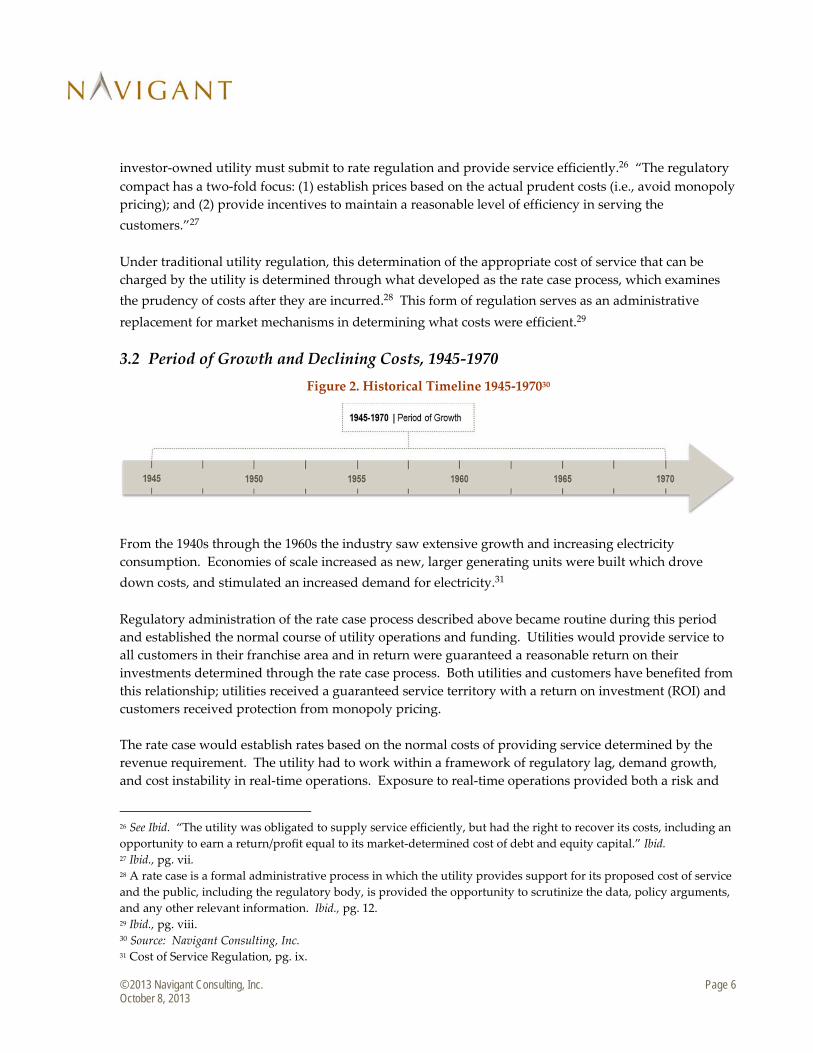
3.2 Period of Growth and Declining Costs, 1945‐1970
Figure 2. Historical Timeline 1945‐197030
From the 1940s through the 1960s the industry saw extensive growth and increasing electricity
consumption. Economies of scale increased as new, larger generating units were built which drove
down costs, and stimulated an increased demand for electricity.31
Regulatory administration of the rate case process described above became routine during this period
and established the normal course of utility operations and funding. Utilities would provide service to
all customers in their franchise area and in return were guaranteed a reasonable return on their
investments determined through the rate case process. Both utilities and customers have benefited from
this relationship; utilities received a guaranteed service territory with a return on investment (ROI) and
customers received protection from monopoly pricing.
The rate case would establish rates based on the normal costs of providing service determined by the
revenue requirement. The utility had to work within a framework of regulatory lag, demand growth,
and cost instability in real‐time operations. Exposure to real‐time operations provided both a risk and
26 See Ibid. “The utility was obligated to supply service efficiently, but had the right to recover its costs, including an
opportunity to earn a return/profit equal to its market‐determined cost of debt and equity capital.” Ibid. 27 Ibid., pg. vii. 28 A rate case is a formal administrative process in which the utility provides support for its proposed cost of service
and the public, including the regulatory body, is provided the opportunity to scrutinize the data, policy arguments,
and any other relevant information. Ibid., pg. 12. 29 Ibid., pg. viii. 30 Source: Navigant Consulting, Inc. 31 Cost of Service Regulation, pg. ix.

© 2013 Navigant Consulting, Inc. Page 7 October 8, 2013
incentive. If the original assumptions remained fairly accurate, utilities would be able to operate fairly
successfully; however, if the assumptions proved to be incorrect, either the utility or the regulator would
seek adjustments.32
This worked well for most of this period, although the Northeast Blackout of 1965 raised pressing
concerns about reliability.
3.3 Slowed Growth and Inflation, Seeds of Competition, 1970‐1990
Figure 3. Historical Timeline 1970‐199033
A number of damaging events occurred in the 1970s that interrupted the growth that occurred in the
prior several decades. After the Northeast Blackout of 1965, state and regional power pools were created
or took on expanded roles. Many of these are the predecessors to today’s Regional Transmission
Organizations. In addition, regional, voluntary reliability councils were formed by the utilities in an
effort to enhance reliability and stave off regulation.
The passage of the Clean Air Act of 1970 and its amendments in 1977 required utilities to reduce their
emission of pollutants, raising their operating costs, particularly for utilities operating coal‐fired
generation. Probably the most significant event was the Oil Embargo of 1973‐1974, which resulted in
burdensome increases in fossil‐fuel prices due to transportation costs. Although the embargo lasted only
until March 1974, its effects increased public awareness of energy issues, resulted in higher energy
prices, and contributed to inflation.
The accident at Three Mile Island in 1979 led to higher costs, regulatory delays, and greater uncertainty
for companies pursuing nuclear generation. In general, inflation caused interest rates to more than
triple. The escalating fuel costs, reduction in demand growth, and accompanying unprecedented
inflation in labor, capital costs, and construction materials meant that utilities were not realizing the
incremental cash flows that had helped finance new construction in the past.34
In 1978, Congress pursued legislation intended to reduce U.S. dependence on foreign oil, develop
renewable and alternative energy sources, sustain economic growth, and encourage the efficient use of
32 Ibid., pg. 16. 33 Source: Navigant Consulting, Inc. 34 Cost of Service Regulation, pg. ix.

© 2013 Navigant Consulting, Inc. Page 8 October 8, 2013
fossil fuels.35 A greater reliance on market forces to set wholesale power costs was introduced through
the Public Utility Regulatory Policies Act of 1978 (PURPA), which adopted avoided cost pricing for
energy purchased by utilities from certain types of third‐party suppliers.36 PURPA became a catalyst for
competition in the electricity supply industry, because it allowed nonutility facilities that met certain
ownership, operating, and energy efficiency criteria established by FERC (referred to as “qualifying
facilities” or “QFs”), to enter the wholesale market.37 Utilities did not initially welcome this forced
competition.38 The QFs themselves are not subject to cost‐of‐service regulation, and the prices paid to
them are not based on their cost of producing the electricity.39 Instead, the prices they are paid reflect
the avoided cost of the purchasing utility (generally determined by the utility’s regulatory authority),
that is, the cost the utility avoided by not producing the electricity received from the QF or purchasing it
from another source.40 In some cases utility regulatory authorities set an avoided cost that was very high
leading to financial problems for utilities that were forced to pay these high prices.
The economic challenges of the 1970s fed directly into the 1980s. Demand growth continued to be slow.
The beginning of the decade saw high inflation in the cost of construction materials and labor along with
double‐digit financing rates. This led to dramatic cost overruns in coal and nuclear plants under
construction. In the wake of the Three Mile Island accident in 1979, the cost to complete nuclear plants
under construction soared as new safety requirements came into play. Some plants (nuclear and non‐
nuclear) were cancelled before completion. These factors led to increased utility costs for plants that
were ultimately cancelled and substantial rate shocks for plants that were completed and entered the
rate base. Regulators responded to the challenge of construction cost overruns by expanding their
oversight of the prudence of project costs. The number of rate cases expanded dramatically from the few
dozen major prudence cases between 1945 and 1975 to over 50 during the 1975 through 1985 period.41
In addition, regulators, public interest groups, and utilities began to recognize in the late 1970s and early
1980s that actions taken to promote conservation and demand‐side management (DSM) could be less
costly under some conditions than construction of new power plants. While the economic conditions
that supported the premise that incremental costs of DSM could be less than the incremental costs of
new generation were reversed during an era of lowered natural gas prices later, new state and federal
35 EIA Changing Structure, Part I, Chapter 2, pg. 8. 36 Cost of Service Regulation, pg. 24. 37 EIA Changing Structure at Part I, Chapter 2, pg. 8. 38 Ibid., Part I, Chapter 2, pg. 8. PURPA defined a new class of energy producers called qualifying facilities. These
producers are either small‐scale producers of commercial energy who normally self‐generate energy for their own
needs but may have surplus energy, or incidental producers who happen to generate usable electric energy as a by‐
product of other activities. When a facility of this type meets the requirements for ownership, size and efficiency,
utility companies are obliged to purchase their energy based on a pricing structure referred to as avoided cost rates.
These rates tend to be highly favorable to the producer, and are intended to encourage more production of this type
of energy as a means of reducing emissions and dependence on other sources of energy. See AEE Context and
Structure. 39 EIA Changing Structure, Part I, Chapter 4, pg. 32. 40 Ibid. at Part I, Chapter 4, pg. 32. 41 Cost of Service Regulation, pg. 25.

© 2013 Navigant Consulting, Inc. Page 9 October 8, 2013
regulations or conservation programs introduced the retail customer class to much greater involvement
in utility planning than had existed before.
An immediate impact on regulators‘ thinking was that there was a need to plan to avoid these situations
and to search for smaller increments of supply or demand reductions. The least cost utility planning and
Integrated Resource Planning (IRP) processes were part of the response to this need.42
These processes were designed to take into account a broad range of information and alternatives,
produce demand forecasts in a public process, and attempt to evaluate supply and demand options on
an equal footing. Much of the late 1980s saw efforts to establish more effective formal planning
frameworks in an attempt to avoid the mistakes that occurred in the 1970s. Regulators embraced this
process to varying degrees, attempting to integrate the planning and rate case sequences together in a
way that reinforced both from an information and implementation perspective.
Another significant development in the late 1980s was an increased utility interest in selling their
generation in wholesale transactions. This was prompted by excess capacity in the early 90s that
occurred because load growth did not meet projected levels. FERC began allowing utilities to sell power
at market based rates (as compared to cost‐based) if the utility could show it had no power to set prices
in the market, would cap the rates at avoided cost, or would provide non‐discriminatory transmission
access to competitive generators.43 This form of regulatory rate treatment was viewed by many in the
industry as superior to the risk of building a new unit under traditional regulation at the state level.44 By
1991, FERC had received 40 of these market‐based pricing requests.45
3.4 The Advent of Centralized Markets, 1990‐1999
Figure 4. Historical Timeline 1990‐199946
42 Ibid., pg. 26. 43 Ibid., pg. 30‐31. 44 Cost of Service Regulation, pg. 31. “The move to greater reliance on markets was accelerated by FERC‘s 1988 pre‐
construction rate approval in Ocean States Power as well as the notice of proposed rulemakings on market based
pricing of electricity. All of these factors were layered on top of the incentive provided for non‐utility generation by
PURPA.” Ibid., pg. 30. 45 Ibid., pg. 31. 46 Source: Navigant Consulting, Inc.
© 2013 Navigant Consulting, Inc. Page 10 October 8, 2013
Passage of the federal Energy Policy Act of 1992 (EPACT) was a significant enabler of market
development. First, it created a new class of electric suppliers, the exempt wholesale generator (EWG),
extending the trend started by FERC with the market‐based rate policy and open access to the
transmission system.47
Like QFs, EWGs were wholesale producers that did not sell electricity in the retail market and did not
own transmission facilities.48 Unlike the non‐utilities that qualified under PURPA, EWGs were not
regulated and could charge market‐based rates.49 The growth of EWGs marked another step toward
increasing the level of competition in the wholesale electricity market.
Marketing of EWG power was facilitated by transmission provisions in EPACT 1992 that gave FERC the
authority to order utilities to provide access to their transmission systems to utilities and non‐utilities.50
In addition, EPACT 1992 required states to conduct an IRP process and evaluate the impact of purchased
power contracts on the local distribution company.51 Some states took this even further, taking steps to
break up the vertical integration of utilities within those states, to introduce retail competition.52
The second cornerstone in the creation of competitive wholesale power markets came in 1996 through
FERC’s Order No. 888.53 At that time, Order No. 888 was considered the most far‐reaching and
ambitious project undertaken by FERC to eliminate impediments to wholesale competition in the electric
power industry.54 Order No. 888 had two basic goals: (1) to eliminate anti‐competitive practices and
undue discrimination in transmission services through a universally applied, open‐access transmission
47 Cost of Service Regulation, pg. 32. 48 EIA Changing Structure, Part I, Chapter 2, pg. 8. The Commission ceased making case‐by‐case determinations of
exempt wholesale generator status following the enactment of EPACT 2005 calling for the repeal of PUHCA. See
Repeal of the Public Utility Holding Company Act of 1935 and Enactment of the Public Utility Holding Company
Act of 2005, Docket No. RM05‐32‐000, (Sept. 2005) at P 21. 49 49 EIA Changing Structure at Part I, Chapter 2, pg. 8. 50 Ibid., Part I, Chapter 4, pg. 33. 51 Cost of Service Regulation, pg. 32. 52 See AEE Context and Structure. 53 The actions taken by the Commission in Order No. 888 paralleled and in many instances were guided by Gas
Restructuring, Order No. 636, open‐access transport in gas. 54 EIA Changing Structure, Part II, Chapter 7, pg. 64.
© 2013 Navigant Consulting, Inc. Page 11 October 8, 2013
tariff, and (2) to ensure the recovery of stranded costs55 a utility might accrue in the transition to
competitive markets.56
Another equally important component of Order No. 888 was the requirement for transmission owners to
functionally unbundle their services. Functional unbundling required the transmission owner to take
transmission service under the same tariff as other transmission users under a comparability standard.
They were required to separate rates for wholesale generation, transmission, and ancillary services and
to rely on the same electronic information network that its transmission customers relied on to obtain
information about prices and available capacity of the transmission system. The concept of unbundling
was to preclude the appearance of possible favoritism and discriminatory practices within a vertically
integrated utility by separating its transmission services functions from other business activities in the
company and by requiring utilities to provide transmission service to others for wholesale transactions
in the same manner as they provide it to themselves.57
Accompanying the requirement for non‐discriminatory access to the transmission system, timely and
accurate day‐to‐day information about transmission was also made available to all transmission users.58
Order No. 889 required all investor‐owned utilities (IOUs) to participate in the Open Access Same‐Time
Information System (OASIS), which facilitated the functioning of competitive power markets.59 At the same time these changes were occurring in the wholesale electricity markets, a growing number
of states were also pursuing a reliance on competitive markets for the retail supply of electric power.
Retail choice was introduced in the United States in the 1990s in response to high regulated prices in
some regions. As noted, excess generation capacity was triggered by the generation construction cycle
that began in the 1960s and continued into the 1970s. Consumer groups in some regions found retail
55 Stranded costs refer to an investment made under regulation whose value will not be recovered under prices
determined in a deregulated environment. Recognizing that FERC only had jurisdiction over a part of the stranded
costs issue, FERC sought to permit public utilities to seek recovery at FERC as the primary forum for a limited set of
existing wholesale requirements contracts, those executed on or before July 11, 1994, termed retail‐turned‐wholesale
transmission customers. Recovery is only permitted where there is a direct nexus between the availability and use
of a Commission‐required transmission tariff and the stranding of the costs. Furthermore, recovery at FERC for
stranded costs caused by unbundled retail wheeling would only be for those stranded costs caused by retail
wheeling where the state regulatory authority did not have authority to address retail stranded costs at the time the
retail wheeling is required. Order No. 888 at pg. 8. As the primary vehicle for recovery, FERC concluded that direct
assignment of stranded costs to the departing wholesale generation customer through either an exit fee or a
surcharge on transmission is the appropriate recovery method. Promoting Wholesale Competition Through Open
Access Non‐discriminatory Transmission Services by Public Utilities; Recovery of Stranded Costs by Public Utilities
and Transmitting Utilities, Order No. 888, FERC Stats. & Regs. ¶ 31,036 (1996), order on rehʹg, Order No. 888‐A,
FERC Stats. & Regs. ¶ 31,048 (1997), order on rehʹg, Order No. 888‐B, 81 FERC ¶ 61,248 (1997), order on rehʹg, Order
No. 888‐C, 82 FERC ¶ 61,046 (1998), affʹd in relevant part sub nom. Transmission Access Policy Study Group v. FERC,
225 F.3d 667 (D.C. Cir. 2000), affʹd sub nom. New York v. FERC, 535 U.S. 1 (2002), pg. 477. (“Order No. 888”) 56 Ibid. 57 EIA Changing Structure, Part II, Chapter 7, pg. 64. 58 Ibid., Part II, Chapter 7, pg. 66. 59 The OASIS is an interactive, Internet‐based database containing information on available transmission capacity,
capacity reservations, ancillary services, and transmission prices.

© 2013 Navigant Consulting, Inc. Page 12 October 8, 2013
competition attractive because the prices in emerging wholesale markets were significantly below the
regulated retail price of utilities, reflecting both excess generation capacity (depressing wholesale energy
prices) and the large number and cost of new generating assets recently placed in service (increasing
regulated retail rates). In addition, these factors also raised concerns that the generation planning as
implemented by utilities and reviewed by regulators in these regions was flawed.
In contrast to the traditionally regulated model, retail choice limits the operation of the regulated utility
to the transmission and distribution functions, where traditional cost‐based pricing is implemented and
approved by state‐level regulators. Generation services are provided either by competitive service
providers or through a default “provider of last resort” (POLR).
Ultimately, 15 states, plus the District of Columbia, implemented retail choice.60 This typically required
the incumbent utility to divest its generation and become a wires‐only transmission and distribution
utility. Some states forced their utilities to divest utility‐owned generation to unaffiliated non‐regulated
entities; other states simply permitted them to create affiliated generation subsidiaries; still other states
required only operational and management separation (i.e., functional separation) from the utilities’
transmission and/or distribution functions. In the restructured states, policymakers were presented with
a host of new issues requiring significant policy responses. Challenges included stranded costs,
development of market rules, the designation of a provider of last resort where retail choice was not
exercised, and level of cost for wires‐only companies.61 Some states that adopted competition faced
market conditions that resulted in the abandonment of restructuring and a return to traditional
regulation.62
60 See http://www.eia.gov/electricity/policies/restructuring/restructure_elect.html. 61 Cost of Service Regulation, pg. 31. 62 Ibid., pg. 34. In December 1998, 23 State public utility commissions sent Congress a letter expressing concerns that
issues affecting them may not be given adequate consideration in the debate about restructuring. Kentucky, whose
electricity prices are the lowest east of the Rocky Mountains, is one of these states. Recently, Kentucky’s Special Task
Force on Electricity Restructuring concluded that there are no compelling reasons to restructure their electric power
industry. EIA Changing Structure, Part II, Chapter 8, pg. 81. Furthermore, not all commissions may be endowed
with the necessary legal authority to manage an evolving competitive market structure. Accordingly, legislation
may be necessary in some states to grant the utility regulatory agency the authority to address the restructuring
issues or to consider alternative rate‐making processes (incentive‐ or performance‐based regulation). In some cases,
legislative actions may become necessary to adopt decisions recommended by the commission(s) for
implementation. Ibid., Part II, Chapter 8, pg. 82.

© 2013 Navigant Consulting, Inc. Page 13 October 8, 2013
3.5 Traditional Regulation and Centralized Markets Today
Figure 5. Historical Timeline 1999‐Present63
In December 1999, FERC released Order No. 200064 calling for the voluntary formation of RTOs. FERC
believed that RTOs would facilitate the continued development of competitive wholesale power markets
and would lead to improvements in reliability and management of the transmission system, eliminating
any remaining discriminatory practices.65 Order No. 2000 asked all transmission‐owning utilities,
including non‐public utilities, to voluntarily place their transmission facilities under the control of an
appropriate regional transmission organization. So that utilities could comply with this request, the
characteristics and minimum functions of an appropriate RTO were defined in the Order.
Order No. 2000 envisioned the creation of independent RTOs that would operate the transmission
systems of its members, engage in regional transmission planning and operate wholesale energy
markets. The RTOs would provide tariffed transmission service and eliminate rate “pancaking” to the
greatest extent possible. Order No. 2000 resulted in the creation of several RTOs, as well as adoption of
various RTO characteristics by the then‐existing ISOs.
Concurrent with FERC’s efforts under Order No. 2000, challenges were arising in the California markets.
In 2001, California, which led the nation toward competitive retail electric markets, suffered from,
among other things, an over‐reliance on spot markets.66 Utilities were required to sell all of their power
into, and buy all of their load‐serving power out of, the California Power Exchange (PX), which operated
a day‐ahead hourly spot market, holding auctions and matching bids for purchase and sale. As a result,
California utilities incurred high costs of which they were only allowed to pass through a portion to
63 Source: Navigant Consulting, Inc. 64 Regional Transmission Organizations, Order No. 2000, 1996‐2000 FERC Stats. & Regs., Regs. Preambles ¶ 31,089
(1999), order on reh’g, Order No. 2000‐A, 1996‐2000 FERC Stats. & Regs., Regs. Preambles ¶ 31,092 (2000), petitions for
review dismissed sub nom. Pub. Util. Dist. No. 1 v. FERC, 272 F.3d 607 (D.C. Cir. 2001). 65 EIA Changing Structure, Part II, Chapter 6, pg. 49. 66 There were additional exacerbating factors identified including increased power production costs combined with
increased demand due to unusually high temperatures and a scarcity of available generation resources throughout
the West and California in particular and flawed market rules, including restrictions on the ability to forward
contract , and retail regulatory policies. See Investigation of Practices of the California Independent System Operator
and the California Power Exchange, 93 FERC ¶61,121 at ¶¶61,354‐355 (2000).

© 2013 Navigant Consulting, Inc. Page 14 October 8, 2013
retail customers,67 leading to a bankruptcy filing by one of largest utilities in the state. The state was
forced to step in and procure the utilities‘ residual power requirements that could not be met by utility‐
retained generation.68
At the wholesale level, the divestiture of rate‐based generating assets made restructured utilities more
dependent on wholesale purchases. Even utilities that remained vertically integrated faced uncertainties
about future state restructuring policy. This led many to rely on wholesale purchases rather than
commit new capital to build rate‐based facilities. At the same time, the development of competitive
wholesale markets69 brought energy price volatility, leading to uncertainties about the optimal timing of
purchases.70
In the aftermath of the California energy market crisis, FERC took steps to investigate the causes and
introduce corrective policies. FERC’s report on the investigation into the California Bulk Power market
concluded that “the electric market structure and market rules for wholesale sales of electric energy in
California are seriously flawed” and that these structures led to unjust and unreasonable rates.71 Among
the remedies ordered by FERC was the elimination of the requirement that Californiaʹs investor‐owned
utilities sell all of their generation into, and buy all of their energy needs from, the PX. FERC concluded
that the buy/sell requirement led to over‐reliance on spot markets and over‐exposure. The Commission
also urged buyers to enter into long‐term contracts and not rely only on spot markets. Furthermore,
FERC staff was directed to develop a market monitoring and mitigation program to be applied to the
California wholesale markets.
Following the California energy market crisis and a blackout that affected a large portion of the
northeastern U.S. and Canada in 2003,72 Congress enacted the Energy Policy Act of 2005 (EPAct 2005) on
August 8, 2005.73 This legislation provided greater authority to the Commission’s oversight of
jurisdictional wholesale electricity markets. EPAct 2005 authorized the Commission to require
transmission‐owning utilities, except for certain small entities, to provide access to their transmission
facilities on a comparable basis. Congress also directed the Commission to facilitate price transparency
in markets and authorized the Commission to prescribe rules to provide for the dissemination of
information about the availability and price of wholesale electric energy and transmission service.74
67 Retail prices charged by the California utilities were capped at a discount per The Electric Utility Industry
Restructuring Act Assembly Bill 1890 (AB1890). 68 Cost of Service Regulation, pg. 36. 69 Including open access transmission, market pricing authority, and the introduction of spot markets. 70 Cost of Service Regulation, pg. 36. 71 93 FERC ¶61,121 at ¶61,349. See also, Staff Report to the Federal Energy Regulatory Commission on Western
Markets and the Causes of the Summer 2000 Price Abnormalities (November 2000). 72 On August 14, 2003, a series of events lead to a blackout affecting much of the system in the northeastern U.S.,
Canada, and portions of the Midwest. A team of industry experts concluded that there had been violations of the
NERC voluntary reliability standards, which resulted in dramatic changes in reliability enforcement. The 2003
blackout and its effect on utility regulation are further explained in Section 5. 73 Energy Policy Act of 2005, Pub. L. No. 109‐58, 119 Stat. 594 (2005). 74 EPAct 2005 also resulted in the development of mandatory reliability standards, which is discussed in Section 5.

© 2013 Navigant Consulting, Inc. Page 15 October 8, 2013
Finally, Congress emphasized compliance with the Commission’s regulations, adopting and increasing
the civil and criminal penalties for violations of Commission‐administered statutes and regulations.
At the same time that the wholesale and retail markets were evolving, states were promulgating new
mandates to improve energy efficiency and demand response. The growing costs of environmental
controls resulting from the Clean Air Act and other regulations placed greater pressure on utilities and
state commissions to adopt alternative cost recovery programs for these targeted expenditures. In
addition, the need to replace aging infrastructure and the potential for modernization of the network
through the use of digital and Smart Grid technology increased.75
To address these challenges, regulators experimented with the use of alternative ratemaking, including
the use of tracker mechanisms, riders, and other mechanisms to provide cost recovery in a manner that
was timelier than traditional rate cases. These mechanisms were useful in cases where the costs of the
specific activity were identified and recovered as incurred. The prudence of the associated costs was
reviewed periodically. These trackers allowed the timely recovery of costs and maintained the utilities’
financial integrity, protecting the level of service provided to customers. In addition, these mechanisms
often involved a true‐up process since the process of granting rate increases ahead of the completion of a
project involves a risk that customers could overpay for the final product. The true‐up mechanism
represented an appropriate retroactive method for providing customers a rebate should cost overruns
occur.76
Similarly, government mandates regarding renewable portfolio standards (RPS) have resulted in new
costs for wind, solar, and biofuels that may be above market. These costs have also sometimes been
treated as a separate cost category for recovery through a rider or adjustment clause mechanism. The
tracker mechanisms developed were an attempt by regulators to match rates with costs. Nevertheless,
reliance on traditional regulatory tools such as prudence reviews and rate cases continues to serve a
fundamental role in providing a substitute for market mechanisms to induce efficient behavior or to
further public policy objectives.77
In February of 2007, FERC issued Order No. 89078 to correct flaws in its pro forma Open Access
Transmission Tariff (OATT) that had been uncovered during the ten years since Order No. 888 was
issued. The Commission recognized that although Order No. 888 had been successful, the need for
additional reform was apparent to realize its goal of remedying undue discrimination in the wholesale
marketplace. The changes introduced in Order No. 890 were intended to: (1) ʺstrengthen the pro forma . .
. OATT to ensure that it achieves its original purpose of remedying undue discrimination; (2) provide
greater specificity to reduce opportunities for undue discrimination and facilitate the Commissionʹs
75 Cost of Service Regulation, pg. 39. 76 Ibid., pg. 39. 77 Ibid., pg. 39. 78 Order No. 890 also introduced reforms in transmission planning that were further refined through
Order No. 1000. Both of these orders are discussed further in Section 8. Preventing Undue Discrimination and Preference in Transmission Serv., Order No. 890, FERC Stats. & Regs. ¶ 31,241 (2007), on reh’g, Order No. 890‐A, FERC
Stats. & Regs. ¶ 31,261 (2007), on reh’g, Order No. 890‐B, 123 FERC ¶ 61,299 (2008), reh’g denied, Order No. 890‐C, 126
FERC ¶ 61,228 (2009).

© 2013 Navigant Consulting, Inc. Page 16 October 8, 2013
enforcement; and (3) increase transparency in the rules applicable to planning and use of the
transmission system.ʺ79 However, FERC retained several core elements of Order No. 888 such as the
existing division of federal and state jurisdiction including FERCʹs seven factor functional unbundling
test, native load protection, firm network service, and firm and non‐firm point‐to‐point transmission
service, and declined to require corporate or structural unbundling, opting instead to retain functional
unbundling.80 The major reforms included: (1) consistency and transparency of methodologies and
calculations for available transfer capability (ʺATCʺ); (2) open, transparent, and coordinated
transmission planning on sub‐regional (local) and regional levels; (3) transmission pricing reforms; (4)
increased efficiency of transmission grid utilization; (5) increased transparency and customer access to
information; (6) enhanced compliance and enforcement efforts; and (7) revisions to non‐rate terms and
conditions of transmission service.81 Complementary to the wholesale market reforms introduced in
Order No. 890, in June of 2007, the Commission issued Order No. 697 to clarify and codify its market‐
based rate policy.82
During the autumn of 2008, large disruptions in the financial markets affected the credit markets and
reduced the availability of credit. The electricity markets were vulnerable to the effects of this broader
financial crisis. Defaults in certain markets within the PJM RTO spurred a need for credit reforms as the
threat of defaults form larger market participants raised concerns. In Order No. 741, the Commission
proposed extensive revisions to its policy on RTO/ISO credit practices.83
79 Ibid., preamble summary. 80 Ibid. 81 Ibid. 82 See Market‐Based Rates for Wholesale Sales of Electric Energy, Capacity and Ancillary Services by Public Utilities, Order
No. 697, FERC Stats. & Regs. ¶ 31,252, clarified, 121 FERC ¶ 61,260 (2007), order on reh’g, Order No. 697‐A, FERC Stats.
& Regs. ¶ 31,268, clarified, 124 FERC ¶ 61,055, order on reh’g, Order No. 697‐B, FERC Stats. & Regs. ¶ 31,285 (2008),
order on reh’g, Order No. 697‐C, FERC Stats. & Regs. ¶ 31,291 (2009).. The Order presented an up‐front analysis to
determine whether market‐based rates should be granted and if a market‐based rate seller or any of its affiliates has
market power in generation or transmission, whether that market power had been mitigated. The order also
established two classes of MBR sellers: Category 1 sellers (anyone below 500 MW in that market) are generally
exempt from submitting triennial market power studies and Category 2 sellers (all others) must continue to file
triennial studies. The Commission also took the opportunity to clarify its interpretation of several decisions by the
United States Court of Appeals that may have created uncertainty for sellers transacting pursuant to its market‐
based rate program. The Commission affirmed its position that an ex ante finding of the absence of market power,
coupled with the EQR filing and effective regulatory oversight, qualifies as sufficient prior review for market‐based
rate contracts to satisfy the notice and filing requirements of FPA section 205. 83 The Commission proposed the following reforms related to the administration of credit in the organized markets:
(1) implementation of a billing period of no more than seven days and a settlement period of no more than seven
days; (2) reduction in the allocation of unsecured credit to no more than $50 million per market participant and a
further aggregate cap per corporate family; (3) elimination of unsecured credit for FTR markets, (4) clarification of
the ISOs’/RTOs’ status as a party to each transaction so as to eliminate any ambiguity or question as to their ability
to net and manage defaults through the offset of market obligations; (5) establishment of minimum criteria for
market participation; (6) clarification of when the ISO or RTO may invoke a “material adverse change” clause in
requiring additional collateral; and (7) establishment of a standard grace period to “cure” collateral calls. See Credit
Reforms in Organized Wholesale Electric Markets, Order No. 741, FERC Stats. & Regs. ¶ 31,317 (2010), order on reh’g,
Order No. 741‐A, FERC Stats. & Regs. ¶ 31,320 (2011), order denying reh’g, Order No. 741‐B, 135 FERC ¶ 61,242 (2011).

© 2013 Navigant Consulting, Inc. Page 17 October 8, 2013
In Congress, additional actions were taking place in response to the 2008 financial crisis. While initially
directed towards financial institutions, the Dodd‐Frank Act had the potential to affect energy trading
companies and wholesale energy markets. Entities categorized as swap dealers or major swap
participants faced new capital, margin, and reporting requirements. While entities that qualified as
“end‐users” of physical energy like utilities and energy producers84 could apply for individual
exemptions, trade by trade, the process could be extremely bulky and burdensome.85 One serious
question left open was whether power purchase agreements for delivery within ISO regions that act as
brokers for all trades, such as NYISO or PJM, would qualify as exempt transactions. In February of 2012,
the Commission‐approved RTO/ISOs86 filed a petition with the Commodity Futures Trading
Commission (CFTC) for an exemption for certain transactions in their organized markets regulated by
FERC or the Public Utility Commission of Texas (PUCT). The CFTC issued its final RTO/ISO Order on
March 28, 2013, which would exempt from CFTC regulation Specific Electric‐Related Product
transactions in the following markets: Financial Transmission Rights (FTRs); Energy Transactions in
Day‐Ahead and Real‐Time Markets; Forward Capacity Transactions; and Reserve or Regulation
Transactions.87 This exemption applies when the purchase or sale of the above‐listed Specific Electric‐
Related Products is executed in an RTO/ISO market pursuant to a FERC or PUCT‐approved tariff.88
84 A company that can prove it uses swaps solely for the purpose of hedging against price fluctuations may qualify
as an end user, exempting it from some of the actʹs requirements. 85 Qualifying will depend, among other things, on the number of swaps traded, who the counterparties are, and the
aggregate amount traded in a given period. 86 California Independent Service Operator Corporation (CAISO), PJM Interconnection (PJM), Midwest Independent
Transmission System Operator (MISO), ISO‐New England (ISO‐NE), New York Independent System Operator
(NYISO) and ERCOT. 87 Final Order in Response to a Petition From Certain Independent System Operators and Regional Transmission
Organizations To Exempt Specified Transactions Authorized by a Tariff or Protocol Approved by the Federal
Energy Regulatory Commission or the Public Utility Commission of Texas From Certain Provisions of the
Commodity Exchange Act Pursuant to the Authority Provided in the Act, 78 Fed. Reg. 19880 (Apr. 2, 2013) (“CFTC
RTO/ISO Final Order”). 88 The CFTC declined to delineate specific transactions that qualify for the RTO/ISO exemption and also declined
requests to expand the exemption to cover transactions that are “outgrowths of,” or “economically comparable to,”
the specific Electric‐related Products. The CFTC clarified that virtual and convergence bids and offers in Day‐Ahead
Markets are exempt “energy transactions,” and that exempt energy transactions may be cash settled. CFTC
RTO/ISO Final Order, 19886.

© 2013 Navigant Consulting, Inc. Page 18 October 8, 2013
Today, the centralized wholesale markets that have been approved by FERC are California ISO, ISO
New England, New York ISO, Pennsylvania, New Jersey, Maryland (PJM) (official name is PJM
Interconnection), Southwest Power Pool, and the Midwest ISO. In addition, the ERCOT (Texas) market
runs under the authority of the Texas PUC. The current state of the centralized wholesale market
development across the U.S. is shown in the diagram below.
Figure 6. Regional Transmission Organizations
Source: http://www.ferc.gov/industries/electric/indus‐act/rto.asp

© 2013 Navigant Consulting, Inc. Page 19 October 8, 2013
The current state of retail choice in the U.S. is shown in the graphic below.
Figure 7. Status of Electricity Restructuring (Retail Choice) by State
Source: http://www.eia.gov/cneaf/electricity/page/restructuring/restructure_elect.html.

© 2013 Navigant Consulting, Inc. Page 20 October 8, 2013
4. Today’s Two Broad Models
At the wholesale level, there are two approaches, centralized generation markets and traditional bi‐
lateral markets. Similarly, there are two approaches at the retail level; the traditional vertically
integrated approach and retail choice. While regions adopting a centralized market model often also
provide some form of retail choice, this is not necessarily a general rule. The variation under the two
general approaches is shown in Table 1.
Table 1. Wholesale and Retail Market Structure by State
Centralized Wholesale Market Bilateral Wholesale Market
Vertically Integrated Utility AR*, CA, IA*, IN, KS, KY*, LA*, MN, MO, MT*, ND*, NE*, NM*, OK, SD*, VA, VT, WI, WV
AK, AL, AZ, CO, FL, GA, HI, ID, MS, NC, NV, SC, TN, UT, WA, WY
Retail Choice CT, DE, IL, MA, MD, ME, MI, NH, NJ, NY, OH, OR, PA, RI, TX
Note: Asterisked states are partially in Centralized and Bilateral Markets
4.1 Current Status of Centralized Wholesale Generating Markets
4.1.1 Todays’ Centralized Wholesale Generating Markets
Consumers’ energy costs include a wholesale cost component consisting of the costs of transmission and
energy.89 As previously noted, traditional vertically integrated utilities can operate within both
centralized wholesale energy markets and traditional bilateral markets; however, restructured utilities
with customer choice are closely linked to organized wholesale energy markets.
Energy markets primarily refer to wholesale markets for generation. While transmission is necessary
and becomes a part of the delivered cost of the energy, utility transmission is a regulated service
provided at cost of service rates.90 A number of regions—including the Northeast, Mid‐Atlantic, much
of the Midwest, the Electric Reliability Council of Texas (ERCOT), and California—organize their energy
89 See Nantahala Power & Light Co. v. Thornburg, 476 U.S. 953 (1986) (State cannot disallow a wholesale rate that the
FERC has set as just and reasonable); see also Mississippi Power v. MISS. Ex Rel. Moore, 487 U.S. 354 (1988). But see,
Pike County Light & Power Co. v. Pennsylvania Public Service Commission, 465 A.2d 735, 738 (1983) ((State can review
prudency of a utility choosing between two choices to purchase power). 90 FERC requires that public utilities that own transmission lines used in interstate commerce offer transmission
service on a nondiscriminatory basis to all eligible customers. The price for the service is cost‐based and published
in the OATT. See Office of Enforcement, Federal Energy Regulatory Commission, Energy Primer: A Handbook of
Energy Market Basics, A staff report of the Division of Energy Market Oversight, (July 2012), pp. 57 and 62 (“Energy
Primer: A Handbook of Energy Market Basics”). Merchant transmission providers may in some cases provide
service at negotiated rates that are not cost‐based.

© 2013 Navigant Consulting, Inc. Page 21 October 8, 2013
markets under an ISO or RTO. Most states in these regions also allow retail competition.91 Other
regions of the United States, including the Southeast and West, excluding California, have chosen to
retain the traditional regulatory model. Under this regime, vertically integrated utilities and certain
public power entities retain functional control over both the transmission systems and generation
dispatch.
4.1.2 Energy Markets
The centralized wholesale energy markets in the U.S. pay a uniform clearing price to all generators
bidding in the market, which is intended to encourage generators to offer their electricity at the
”margin,” their break‐even point for variable costs.92
Most of the centralized wholesale energy markets in the U.S. have implemented what is known as
locational marginal pricing (LMP) or nodal pricing. Examples include the PJM Interconnection, ERCOT,
New York, and New England markets. The table below lists the markets and their key attributes. In an
LMP market, the bids/offers submitted by market participants are used to determine the prices of
electricity at each node on the network.93 The nodal price is the highest priced bid that is dispatched to
meet load in any hour and all successful bidders are paid this nodal or LMP price. Where constraints
exist on a transmission network,94 more expensive generation may be dispatched on the downstream
side of the constraint, resulting in a price separation on either side of the constraint. This results in what
is termed congestion pricing or constraint rents.95 Some systems also account for marginal losses in the
nodal price calculation. Depending on the market, price settlements occur day‐ahead, hourly, or in real‐
time.
Some of the centralized wholesale energy markets have also developed capacity markets to ensure there
is sufficient generation to meet reliability requirements. In addition, the central markets also typically
include ancillary service markets to meet other reliability requirements such as voltage support, and
financial hedging devices called Financial Transmission Rights (FTRs) or Transmission Congestion
Contracts (TCCs), which enable market participants to manage transmission congestion risks and costs.
91 Approximately two‐thirds of the nation’s electricity load is served in RTO regions. See Energy Primer: A
Handbook of Energy Market Basics, pg. 42. 92 The alternative approach (not adopted in any U.S. market) is a pay‐as‐bid market, which encourages generators to
offer their electricity at the expected market price. 93 From the bids/offers, the theoretical price of electricity at each node on the network is calculated as a ʺshadow
price.ʺ The shadow price reflects the hypothetical incremental cost to the system from an optimized dispatch of
available units to meet one additional kilowatt‐hour of demand at the node in question. 94 Transmission systems are operated to allow for continuity of supply even if a contingent event, like the loss of a
line, were to occur. This is known as a security constrained system. 95 If the lowest‐priced electricity can reach all locations, prices are the same across the entire grid.

© 2013 Navigant Consulting, Inc. Page 22 October 8, 2013
Table 2. Centralized Markets and their Attributes
Market Key Elements
California ISO (CAISO) (established 1996)
Energy market: three-settlement (day ahead, hour ahead, and real time). Spot market with locational marginal pricing
Ancillary services, and Financial Transmission Rights market
Midcontinent ISO (MISO) (established 2002 as Midwest ISO)
Administers a two-settlement (day ahead and real-time) energy market known as the Day-2 market. It produces hourly locational marginal prices that are rolled up into 5 regional hub prices.
Also administers a monthly financial transmission rights (FTR) allocation and auction MISO bilateral trading is active on the IntercontinentalExchange (ICE) at the Cinergy
Hub and Northern Illinois Hub. Voluntary annual and monthly capacity auction
ISO New England (ISO-NE) (established 1997)
Energy market: two-settlement (day ahead and real-time) spot market with locational marginal pricing (an internal hub, eight load zones, and more than 500 nodes)
Capacity market Forward reserves market Regulation market, and financial transmission rights market
New York ISO (NYISO) (established 1999)
Energy market: two-settlement (day ahead and real-time) spot market with locational marginal pricing
Regional and locational capacity market with deliverability requirement Financial transmission rights market Market participants trade electricity bilaterally through brokers, the ICE, and the New
York Mercantile Exchange’s (NYMEX) ClearPort, using NYISO zones as pricing points but bilateral deals that go physical must be scheduled with the ISO.
PJM Interconnection (PJM) Energy market: two-settlement (day ahead and real-time) spot market with locational marginal pricing (prices are calculated at each bus every five minutes)
Capacity markets with deliverability requirement Ancillary services markets Financial transmission rights market Energy and capacity in the region are also traded bilaterally through brokers and the
ICE
Southwest Power Pool (SPP) (granted RTO status in 2004)
Market participants trade physical electricity bilaterally, either directly or through brokers, and through the energy imbalance service (EIS) market.
ERCOT Administers the Texas competitive retail market Operates wholesale markets for:
o Balancing energy o Ancillary service markets with zonal congestion management
Source: Information in this table obtained from the Federal Energy Regulatory Commission website available at:
http://www.ferc.gov/market‐oversight/mkt‐electric/overview.asp

© 2013 Navigant Consulting, Inc. Page 23 October 8, 2013
4.2 Bilateral Wholesale Generation
Unlike transactions in the RTO/ISO energy markets, in bilateral transactions, buyers and sellers know
the identity of the party with whom they are doing business.96 Bilateral transactions may occur through
direct contact and negotiation, through a broker or through an electronic brokerage platform, such as the
Intercontinental Exchange (ICE).97 Bilateral transactions range from standardized contract packages, to
customized, complex contracts known as structured transactions.98
Traditional wholesale electric markets exist primarily in the West (other than California) and Southeast.
In these traditional wholesale markets, utilities continue to be responsible for system operations and
management, and, typically, for providing power to retail consumers.99 Nearly all the wholesale
transactions in the Southeast are done bilaterally. Long‐term energy transactions are common, and
transaction durations for a year or more outweigh spot transactions. Furthermore, many long‐term
agreements involve full‐requirements contracts or long‐term purchase power agreements.100 Bilateral
transactions also predominate among entities in the West, other than California. Those entities also sell a
small amount of power into the California ISO’s market.101
4.3 Today’s Retail Choice Status
Two models are currently employed in the United States to deliver electric power to retail consumers.
The traditional model is the Vertically Integrated Utility where various services are “bundled”, which is
defined by the U.S. Energy Information Administration (EIA) as “a means of operation whereby energy,
transmission, and distribution services, as well as ancillary and retail services, are provided by one
entity.”102 Under this model, the energy provided by the utility may be provided by its own generation
or procured from others, generally in bilateral wholesale transactions. Many non‐vertically integrated,
government‐owned and cooperative entities also operate in a “vertically integrated mode” using jointly
owned transmission and generation. In contrast, there are regions where utility restructuring has
occurred and retail choice103 is available for a large number of customers. The second market model
96 See Energy Primer: A Handbook of Energy Market Basics, pg. 64. While bilateral transactions between two parties
do not occur through an RTO, some bilateral activity occurs in areas where there are RTOs/ISOs. 97 Ibid., pg. 60. 98 Ibid., pg. 60. 99 Id., pg. 63. 100 Ibid., , pg. 73. 101 The West includes the Northwest Power Pool (NWPP), the Rocky Mountain Power Area (RMPA) and the
Arizona, New Mexico, Southern Nevada Power Area (AZ/NM/SNV) within the Western Electricity Coordinating
Council (WECC), a regional entity. 102 U.S. Department of Energy – Energy Information Administration,
http://www.eia.gov/tools/glossary/?id=electricity. 103 Retail choice is a regulatory mandate to allow retail customers to use a utilityʹs transmission and distribution
facilities to move bulk power from one point to another on a nondiscriminatory basis for a cost‐based fee.” U.S.
Department of Energy – Energy Information Administration, http://www.eia.gov/tools/glossary/?id=electricity.

© 2013 Navigant Consulting, Inc. Page 24 October 8, 2013
often involves centralized, bid‐based wholesale generation markets. This paper generally refers to the
second model as the “retail choice” model.104
As of the writing of this report, 15 states and the District of Columbia have adopted electric retail choice
programs that allow end‐use customers to buy electricity from competitive retail suppliers.105
Overall, competitive retail suppliers provided 16% of total U.S. retail sales by volume in 2010.106
4.4 Cost‐Based Rates and Traditional Utility Regulation
The traditional mode of regulation in the United States is cost‐based, which permits the utility to
establish prices that will recover prudent operating costs and provide an opportunity to earn a
reasonable rate of return on the property devoted to the business. The goals of cost‐based utility pricing
are as follows:107
1. Attracting investment capital at a reasonable cost
2. Reasonable prices for electric service
3. Efficiency incentive
4. Demand control
5. Revenue generation
Cost‐based ratemaking is not without its criticisms. The most frequent criticism of cost‐based
ratemaking is that an incentive exists to over‐invest in capital‐intensive projects because the utility’s
income is derived by investment (Averch‐Johnson Behavior).108 Cost‐based regulation is also sometimes
criticized because it fails to provide utilities with an incentive to operate efficiently.
4.5 The Retail Choice Model
Inasmuch as the retail choice model is relatively immature (less than 15 years old in most jurisdictions), a
number of criticisms have emerged. First, participation in retail markets in many jurisdictions has been
anemic due to a lack of incentives (i.e., lower prices) or information. Second, in some jurisdictions,
market design issues have led to price spikes which have negatively affected consumers.
104 The descriptions of the “traditional” vs. “retail choice” reflect simplifying assumptions. There are vertically
integrated utilities that operate in areas with bid‐based markets. Similarly, in some areas, limited customer choice
has been made available to large commercial or industrial customers and no bid‐based market may exist. The
“Retail Choice” model generally refers to the utility and market structure that exists as a result of broad retail choice
for the customers of a number of utilities in a given region. 105 http://www.eia.gov/electricity/policies/restructuring/restructure_elect.html 106 U.S. Energy Information Administration (“EIA”), State electric retail choice programs are popular with
commercial and industrial customers (May 14, 2012),
http://www.eia.gov/todayinenergy/detail.cfm?id=6250#tabs_RenewablesMaps‐1. This website has a map of U.S. and
identifies by region Sales for Retail choice vs. default services. 107 James Bonbright, Albert Danielsen and David Kamerschen, “Principles of Public Utility Rates, Public Utilities
Reports, Incorporated” (1988), pg. 11‐2. 108 Harvey Averch and Leland Johnson, “Behavior of the Firm Under Regulatory Constraint”, American Economic
Review (1962).

© 2013 Navigant Consulting, Inc. Page 25 October 8, 2013
At the height of the utility restructuring movement in the 1990s, nearly half of the states were
considering retail choice in one form or another. California and several northeastern states led the way,
in many cases requiring investor‐owned utilities divest some or all of their generation, which was
required for different reasons based upon the jurisdiction. Common reasons for divesture of generation
included: (1) mitigation of perceived market power; and (2) quantification of the value of these assets for
the purposes of determining stranded investment.
After the California energy crisis in 2001, however, some states, including California, abandoned these
efforts. There are currently only 15 states plus the District of Columbia that permit all customers to
choose an energy supplier.109
The restructuring efforts were contentious, with utilities arguing that they (and their shareholders)
would be left with “stranded costs” (i.e., generation and other investments made in anticipation of
needing to serve the load within their footprints that would not be recovered when exposed to market
prices). These issues were resolved in various ways, including by the addition of transition cost adders
to electricity delivery charges with or without securitization arrangements.110 Residential rate freezes or
reductions were also mandated in some cases to provide an immediate benefit to smaller consumers. In
some states, utilities and regulators wrestled over Provider of Last Resort (POLR)111 rates and supply to
ensure that all customers would continue to have access to service, while at the same time fostering
competition.
Utilities that no longer own generation and retain an obligation to serve under a POLR requirement
must procure power in wholesale transactions, either through bilateral arrangements or market
purchases. The cost of power, like other utility costs, is subject to review for reasonableness. FERC rules
require careful scrutiny of sales of power between utilities and their affiliates.112 At least one state,
Illinois, has partially taken over the role of power procurement for the utility’s electric supply customers.
However, more recently, municipal aggregation (where the municipality negotiates a purchase power
agreement on behalf of the residents of the community) is increasingly replacing the state’s role as an
electric power supplier.
109 http://www.eia.gov/electricity/policies/restructuring/restructure_elect.html 110 Securitization arrangements allowed the issuance of binds or other similar financial instruments, which were
secured with a property right to a non‐bypassable revenue. 111 A POLR is a default provider who provides service to customers who do not elect to secure power supply
through a retail electric supplier. 112 Cross‐Subsidization Restrictions on Affiliate Transaction, Order No. 707, 73 FR 11013 (Feb. 29, 2008), FERC Stats.
& Regs. ¶ 31,264 (Feb. 21, 2008) (Affiliate Transactions Final Rule), order on rehearing, Order No. 707‐A, 73 FR 43072
(July 24, 2008), FERC Stats. & Regs. ¶ 31,272 (2008) (Affiliate Transactions Final Rule Rehearing); Order No. 697
(Market‐Based Rate Final Rule).

© 2013 Navigant Consulting, Inc. Page 26 October 8, 2013
4.6 Differences Between the Traditional and Retail Choice Models
In both the Vertically Integrated and Retail Choice regulatory models the distribution and transmission
functions are price regulated, generally using some variant of cost‐based pricing. No jurisdiction in the
United States has seriously entertained the notion of retail competition for distribution facilities.113
The primary difference in the Vertically Integrated and Retail Choice regulatory models lies in is the
treatment of the generation function, as discussed below.
1. Generation Planning and Construction
2. Vertically Integrated Utilities
Traditionally, regulated utilities engage in generation system planning as part of their day‐to‐day
business functions. The objective of regulated generation system planning is to provide customers with
reliable electric service at the lowest long‐run price. Generation system planning generally considers the
following variables in making generation decisions: (1) the cost of new generation technology or
available wholesale market purchases; (2) what costs would be incurred to retain existing generating
units in service; (3) expectations regarding the future costs of generator fuels (e.g., coal, natural gas, and
petroleum products); (4) the impacts of existing and future environmental rules; (5) the delivery costs
associated with generation siting options, and (6) expectations regarding the demand for new load. The
utility management performs analyses that typically rely upon complex simulations to ascertain which
combinations of new and existing generation and transmission system improvements will provide for
the goal of safe and reliable generation service at the lowest reasonable cost. This process is referred to
as integrated resource planning. Once the decisions of the system planning are completed, the costs
associated with those decisions are recovered from customers through regulated prices.
4.6.1 Retail Choice Markets
In contrast to vertically integrated utilities, the retail choice regulatory model relies solely upon
competitive energy markets to provide customers with generation services. Generation is constructed
by independent power producers (IPPs) who rely upon the market to provide revenue streams in
exchange for their investments and are therefore subjected to market risk. Although market design
varies from jurisdiction to jurisdiction, customers are generally served by retail electric suppliers (RESs)
licensed to operate in that jurisdiction or through a POLR mechanism for customers who either do not
elect to choose a retail power marketer or do not have the ability to choose a retail power marketer. The
latter case includes a number of jurisdictions that have abandoned the vertically integrated model but
have not provided all customers with the ability to contract directly with a retail power marketer.
Retail choice markets do not require that any organized planning process be adhered to when
introducing new generation into the electric power system. Developers purchase existing assets or
develop new projects based upon expectation of future market prices.
113 There are a few exceptions, including the competition which exists between First Energy and Cleveland Public
Power in certain areas of Cleveland, Ohio.

© 2013 Navigant Consulting, Inc. Page 27 October 8, 2013
A critical difference in retail choice markets is the existence of retail power marketers. Retail power
marketers procure electric power either through owned assets or transactions on wholesale power
markets to supply customers on a contractual basis.
4.6.2 Pricing for Generation Services
Vertically integrated utilities receive a regulated return for bundled (generation, transmission, and
distribution) services. Although the nuances of regulated ratemaking differ from jurisdiction to
jurisdiction, most states have adopted some variation of rate‐of‐return ratemaking.
Pricing in retail choice states is “market based” for generation or power supply service and not cost‐
based. If the generation service is provided by a retail electric service provider, prices are determined
competitively based upon an arm’s‐length agreement. In most cases the retail electric supplier may not
be accessing physical generation resources directly and instead will reply upon financial instruments
tied to the electric power market to provide price certainty.
A significant proportion of the load in many retail choice jurisdictions is served by default providers,
who provide service to customers who do not elect to secure power supply through a retail electric
supplier. Default providers are generally secured through a competitive solicitation such as a request for
proposals (RFP) or auction. Furthermore, many states listed as retail open access jurisdictions restrict the
competitive shopping option to certain customers (e.g., Michigan).

© 2013 Navigant Consulting, Inc. Page 28 October 8, 2013
5. System Reliability
Reliability standards or criteria used for planning and operations are an integral part of the electric
power industry and have been since the very first systems were developed in the late nineteenth
century. As power systems grew in complexity and evolved into the large synchronous interconnections
of today, these standards have become increasingly important.114
There are two components to Bulk Power System (BPS) reliability—resource adequacy and transmission
security. Resource adequacy ensures adequate generation or demand response to meet expected peak
loads plus a reserve. Transmission security ensures reliable system operation in the face of
contingencies, loss of generation or transmission.115 Planning authorities must construct facilities to
meet both of these identified reliability needs.
FERC regulates wholesale markets in centralized market regions where markets are the source of the
new resources to meet resource adequacy needs. In these regions, the RTOs/ISOs and FERC are facing
challenges of aligning transmission planning with procurement of market‐driven solutions (generation,
demand response) to induce the most efficient outcome. There is also the struggle between the states,
which have historically had regulatory responsibility for assuring generation resource adequacy for
retail electric customers. FERC has provided oversight of resource adequacy under FERC open‐access
tariffs and in competitive markets, and in some cases FERC oversight has conflicted with state resource
planning objectives.
FERC also oversees the North American Electric Reliability Corporation (NERC) as the Electric
Reliability Organization (ERO) under the Federal Power Act. In turn, NERC delegates compliance
monitoring and enforcement oversight to its eight Regional Entities. In states with vertically integrated
companies, states oversee a utility’s resource planning and procurement, and the siting of jurisdictional
power plants. States generally must approve the siting of jurisdictional transmission lines and
equipment.
Under this shared jurisdictional framework, the states and FERC work to ensure the bulk power system
(BPS) is designed and operated in a reliable manner.116
5.1 Development of the Mandatory Reliability Standards
Throughout most of the twentieth century, increased system interrelation took place. By the early 1960s,
power systems in most of the United States and Canada had formed into four large synchronous
114 See Kenneth Lotterhos and Celia David, NERC and Mandatory Electric Reliability Compliance, Lexis (Apr. 2011),
Ch2, pg. 3 (“NERC and Mandatory Electric Reliability Compliance”). 115 See NERC and Mandatory Electric Reliability Compliance, Ch2, pg. 1. 116 See Advanced Energy Economy, U.S. Electric Power Industry ‐ Context and Structure (Nov. 2011), Figure 6.

© 2013 Navigant Consulting, Inc. Page 29 October 8, 2013
interconnections or “grids.”117 During this period, individual power systems each developed and
applied their own criteria for reliability.
With the 1965 Northeast Blackout, it was plain to see that a more coordinated approach was necessary.
Following the 1965 blackout, the North American Electric Reliability Council, which later became
NERC,118 and Regional Reliability Councils, which later became the Regional Entities, formed.119 The
U.S. systems also formed two new power pools: the New England Power Pool and the New York Power
Pool.120 Across the nation systems came together to establish regional reliability councils, until
collectively they encompassed essentially all of the continental U.S. and Canada.121
Subsequent blackouts on the East Coast in July 1977 and the West Coast in July and August of 1996
further underscored the need for greater coordination and adherence to the existing reliability standards.
A common cause of these three major regional blackouts was violation of NERC’s voluntary Operating
Policies and Planning Standards.122 The Northeast Power Coordinating Council (NPCC) adopted
criteria that incorporated the NERC standards, but also established stricter requirements recognizing the
impact on the nation’s economy and finances with the loss of New York City. Compliance with the
NPCC criteria was made mandatory for NPCC members by contract, while the NERC standards were
still voluntary.123
In response to the West Coast July and August 1996 cascading outages, the Secretary of Energy
convened a task force to advise the U.S. Department of Energy (DOE) on maintaining the reliability of
the BPS. The task force recommended, among other things, that federal legislation should grant more
explicit authority for the Commission to approve and oversee an organization having responsibility for
bulk‐power reliability standards and that FERC be given jurisdiction over reliability of the BPS.124 This
117 See NERC and Mandatory Electric Reliability Compliance, Ch2, pg. 3. 118 The systems that had been affected by the blackout formed the Northeast Power Coordinating Council (NPCC),
the Regional Entity for the northeast portion of the U.S and Eastern Canada. See NERC and Mandatory Electric
Reliability Compliance, Ch2, pg. 5. One of NERC’s roles was to establish overall reliability criteria. NERC’s original
planning criteria were general in nature – guidelines as to what topics the regional councils should address in their
own criteria. Another of NERC’s purposes was to provide a forum for the discussion of reliability issues. NERC
adopted NAPSIC’s bulk‐power system protocols, including the now familiar N‐1 system contingency design, and
operating criteria that continue to be used in operating the bulk power system. Ibid., Ch2, pp. 5‐6. 119 The primary role of the regional reliability councils was to establish and maintain uniform reliability criteria to be
applied in the planning and operation of their respective bulk‐power systems. Each also developed procedures for
assessing conformance. Ibid., Ch2, pg. 6. 120 As deregulation proceeded in the Northeast, these evolved into Independent System Operators —New England
(ISO‐NE) and the New York ISO. Both became constituent areas of NPCC. 121 Individual systems and power pools sometimes developed their own more detailed or more stringent criteria, but
they were always responsible for adherence to the regional criteria as a minimum. See NERC and Mandatory Electric
Reliability Compliance, Ch2, pg. 6. 122 Ibid., Ch2, pg. 6. See also, http://blackout.gmu.edu/archive/a_1977.html. 123 See NERC and Mandatory Electric Reliability Compliance, Ch2, pg. 7. 124 Secretary of Energy Advisory Board, U.S. Department of Energy, Maintaining Reliability in a Competitive U.S.
Electricity Industry, Final Report of the Task Force on Electric System Reliability (September 1998), pp. 25‐27, 65‐67.

© 2013 Navigant Consulting, Inc. Page 30 October 8, 2013
laid the groundwork for the eventual adoption of legislation that enacted the mandatory reliability
enforcement structure that exists today.125
On August 14, 2003, a series of events led to a blackout affecting much of the system in the northeastern
U.S., Canada, and portions of the Midwest. A team of industry experts concluded that there had been
violations of the NERC voluntary reliability standards. This conclusion resulted in dramatic changes in
reliability enforcement.126 On August 8, 2005, the Electricity Modernization Act of 2005, which is Title
XII of the Energy Policy Act of 2005, was enacted into law.127 EPACT 2005 eliminated the voluntary
nature of the NERC reliability guidelines, charged FERC with ultimate oversight of electric reliability of
the BPS, and established an independent ERO to develop mandatory reliability standards subject to
FERC approval, monitor industry participants’ compliance to these standards, and levy penalties for
non‐compliance up to one million dollars per day per violation for the most serious violations.128 The
EPACT 2005 language was based on a report by the National Energy Policy Development Group that
recommended enforceable reliability standards by a “self‐regulatory organization subject to FERC
oversight.”129
125 See NERC and Mandatory Electric Reliability Compliance, Ch2, pg. 7. 126 Ibid., Ch2, pg. 8, citing, U.S.‐Canada Power System Outage Joint Task Force’s Final Report on the August 14, 2003
Blackout in the United States and Canada: Causes and Recommendations (April 2004). 127 Similar actions have been taken by the regulatory authorities in the Canadian Provinces and Mexico. 128 See NERC and Mandatory Electric Reliability Compliance, Ch2, pg. 8. 129 National Energy Policy Development Group, National Energy Policy (May 2001), pg. 7‐6.

© 2013 Navigant Consulting, Inc. Page 31 October 8, 2013
Figure 8. NERC Regions130
5.2 Transmission Reliability
5.2.1 The NERC Standards and Who Must Comply
The Reliability Standards are grouped into 14 broad categories relating to bulk‐power system operations
and planning. Each standard describes what measures are to be completed, who by registered entity
function must complete them, and how compliance will be measured.131
Currently, there are 102 Reliability Standards with over 1,300 requirements applicable and mandatory in
the U.S., not including the nine regional standards that have been approved and that are only applicable
130 Source: North American Electric Reliability Corporation website available at
http://www.nerc.com/AboutNERC/keyplayers/Documents/NERC_Regions_BW_072512.jpg. 131 See NERC and Mandatory Electric Reliability Compliance, Ch5, pg. 51.

© 2013 Navigant Consulting, Inc. Page 32 October 8, 2013
in the specific Regions.132 A standard is not mandatory and enforceable in the United States unless it has
received approval by FERC.133
Within the United States, other than Alaska and Hawaii, all users, owners, and operators of the BPS134
must comply with the reliability standards developed by the ERO.135 The ERO’s compliance registry
process is used to identify the set of entities that are responsible for compliance with a particular
Reliability Standard.136 The applicability section of a particular Reliability Standard determines the
applicability of each Reliability Standard.137
A clear definition of the term Bulk Electric System (BES)138 is essential to defining the scope and
applicability of the mandatory reliability standards and is a part of the NERC entity registration process.
The definition establishes which particular facilities will be subject to the reliability standards and,
therefore, has a direct impact on determining which entities must register under the NERC Functional
Model. The definition of the BES does not include facilities used in the local distribution of electric
132 NERC has been working to reduce this number of standards and in February NERC filed a petition to retire 34
requirements within 19 Reliability Standards. FERC has not yet ruled on this filing but NERC issued a guidance
statement instructing Regional Entities to cease actively monitoring compliance to these requirements. See NERC
Guidance for Compliance Monitoring and Enforcement Pending Retirement of Standards and Requirements
Pursuant to Paragraph 81 (Apr. 9, 2013). NERC is also pursuing other efforts to eliminate standards that do not
improve the level of BPS reliability and improve the overall standards development process. 133 16 U.S.C. §824o(d)(1); 18 C.F.R. §39.5; Mandatory Reliability Standards for the Bulk‐Power System, Order No. 693,
FERC Stats. & Regs. ¶ 31,242 at P 26, order on reh’g, Order No. 693‐A, 120 FERC ¶ 61,053 (2007) (explaining “the ERO
must file each of its Reliability Standards and any modification thereto with the Commission”). 134 In Order No. 743, FERC the Commission clarified that the term Bulk Power System (BPS), used in the FPA, was
distinct and more expansive than the NERC‐defined term, BES, which determines the enforcement applicability of
the Reliability Standards. See Revision to Electric Reliability Organization Definition of Bulk Electric System, 133
FERC ¶ 61,150 (Order No. 743) (Nov. 2010) at P 36. 135 See Federal Power Act § 215(b), 16 U.S.C §844o(b); 18 C.F.R § 40.1. Note applicability also extends to entities
described under 201(f) of the FPA. Section 201(f) of the FPA generally exempts the United States, a state or any
political subdivision of a state, an electric cooperative that receives financing under the Rural Electrification Act of
1936 (7 U.S.C. 901 et seq.) or that sells less than 4,000,000 megawatt‐hours of electricity per year from Part II of the
FPA. See also 18 C.F.R §§ 39.2, 40.1(a). 136 Order No. 693 at PP 92‐101. 137 Ibid., P 127. 138 On November 18, 2010, the Commission issued Order No. 743 directing NERC to revise the definition of “bulk
electric system” and also required NERC to provide an exemption process. See Revision to Electric Reliability
Organization Definition of Bulk Electric System, 133 FERC ¶ 61,150 at PP 112‐113 (Order No. 743) (Nov. 2010).
NERC has filed and FERC has approved the definition with minimal changes. See Revision to Electric Reliability
Organization Definition of Bulk Electric System, 141 FERC ¶ 61,236 (Order No. 773 FINAL RULE) (Dec. 2012); order
on reh’g, 143 FERC ¶ 61,053 (Order No. 773‐A) (Apr. 2013). The implementation date is set for July 1, 2014. See
Revision to Electric Reliability Organization Definition of Bulk Electric System, 143 FERC ¶ 61,231 (Order on
Extension) (June 13, 2013).

© 2013 Navigant Consulting, Inc. Page 33 October 8, 2013
energy.139 However, what constitutes local distribution was never defined by Congress and it has since
been left to the Commission, as made clear in Order No. 773.140
5.2.2 Role of the Registered Entities and States
As discussed above, all users, owners, and operators of the BPS must comply with the NERC standards
where the NERC registry process identifies the entities that must be registered. The NERC Functional
Model provides guidance concerning the type of function for which an entity is registered and,
therefore, their role in maintaining reliability. The Functional Model identifies various roles, or
“functions” that an entity may perform with respect to the grid.141 A single utility or organization may
perform several functions and be registered for each of those functions.
Regardless of whether entities are located in regions that have centralized markets and RTOs/ISOs or a
traditionally regulated structure, the Regional Entities and NERC will identify who must be registered
and as what type of functional entity. The primary difference between functional responsibilities of
entities that exist in RTOs/ISOs and those that do not is that RTOs/ISOs often perform the functional
roles of Balancing Authority, Reliability Coordinator, Transmission Operator, and Transmission Planner.
Other entities in the region are then registered to perform the remaining functions. There is sometimes
some overlap in functional roles, such as Transmission Operator (TOP).142
In regions that do not have RTOs/ISOs, the investor owned utility or local public power entities often
perform all the functions and are registered as multiple functional entity types. Even here, however, a
traditional utility may not perform all functions. Where generation has been divested, the generation
owner will be registered as the Generation Owner (GO) and Generation Operator (GOP) (and possibly as
a TO and TOP, depending on the interconnection facilities they own). Furthermore, in several of the
non‐RTO/ISO regions, an operating affiliate of the Regional Entity serves as the RC. These regions are
WECC, Florida Reliability Coordinating Council (FRCC), and SPP.
Transmission reliability is governed by FERC, NERC, and the REs. The states still retain a role in
resource adequacy, as described later in this section. In addition, the states retain oversight for reliability
of distribution facilities and may take action to ensure the safety, adequacy, and reliability within that
state provided it is not inconsistent with any NERC reliability standard.143 The states and other
139 Federal Power Act §215(a). 140 See Order No. 773 at P 69. 141 The Functional Model was developed to address the advent of open access and the restructuring of the electric
utility industry to facilitate the operation of wholesale power markets. This new industry structure reflected
functional disaggregation under open access, that Control Areas no longer provided a single reliability structure,
and the RTOs and ISOs did not all perform the same functions. The functions described in the Functional Model
include Generators, Transmission Service Providers, Transmission Owners, Transmission Operators, Distribution
Providers, Load‐Serving Entities, Purchasing‐Selling Entities, Security Authorities, Balancing Authorities,
Interchange Authorities, and the Compliance Monitor. An advantage of the Functional Models is that it does not
depend on how organizations are, or will be, structured or on how functions are implemented in the future. 142 An exception to this rule is in the WECC region, where the WECC Reliability Coordinator performs the reliability
coordination function for the entire region, including the CAISO area. 143 See FPA 215(h)(3), Savings Clause.

© 2013 Navigant Consulting, Inc. Page 34 October 8, 2013
governmental entities that have regulatory oversight functions may participate as non‐voting members
in NERC and RE activities, under the government sector, and may also provide comments in FERC
proceedings. One important distinction is in the case of the New York State Reliability Council, which
exists as a separate entity within NPCC and may develop rules that result in greater reliability within
New York provided they do not result in lesser reliability outside that state.144
5.2.3 Compliance Monitoring and Enforcement
The NERC Compliance Monitoring and Enforcement Program (CMEP) requires bulk‐power system
owners, operators, and users to register with NERC and comply with all approved Reliability Standards.
They must also report all violations of the Reliability Standards to their Regional Entity. The CMEP uses
various monitoring processes to collect information in order to make assessments of compliance, for
example, audits, self‐certifications, spot checks, and self‐reports.145
NERC, as the international ERO, has delegated authority to monitor and enforce compliance with
reliability standards of owners, operators, and users of the BPS to qualified Regional Entities. The eight
Regional Entities, under NERC’s oversight, are responsible for carrying out the CMEP within their
respective regions based on the regulatory‐authority‐approved uniform CMEP.146
Section 215 of the FPA also gave the ERO the authority to levy penalties for non‐compliance, with fines
of up to one million dollars per day per violation for the most serious violations.147 FERC also has
separate investigation and enforcement authority under section 215 of the FPA.148 While NERC, with
FERC approval, has the authority to assess penalties as large as one million dollars per day per violation,
initial penalties were modest, with maximum penalties in the range of several hundred thousand
dollars. This trend, however, has begun to change and in late 2011 and 2012 penalties up to and
exceeding one million dollars have been assessed to registered entities.149
5.3 Resource Adequacy
“The desire for resource adequacy standards is driven by a belief that electricity supply interruptions
should be very rare, or preferably non‐existent.”150 Historically, state commissions have had regulatory
responsibility for assuring generation resource adequacy for retail electric customers. However, when
changes are implemented through FERC jurisdictional tariffs to achieve resource adequacy objectives,
144 See FPA 215(h)(3), Savings Clause. 145 See NERC and Mandatory Electric Reliability Compliance, pg. Ch8. 146 Ibid., Ch8, pg. 84. 147 The way NERC approaches compliance and enforcement is also under revision through its Compliance
Enforcement Initiative aimed at streamlining its enforcement mechanisms and the Reliability Enforcement Initiative,
where the focus will be to move standards development and compliance monitoring towards the assessment of
internal compliance controls developed by the registered entities. See NERC website links:
http://www.nerc.com/pa/comp/Pages/Reliability‐Assurance‐Initiative.aspx. 148 See FPA 215(e)(3). Investigations are performed under Part 1b of the FERC Rules of Procedure, 18 CFR Part 1b. 149 See http://www.nerc.com/pa/comp/Pages/Enforcement‐and‐Mitigation.aspx. 150 James Bushnell, Electricity Resource Adequacy: Matching Policies and Goals, Center for the Study of Energy
Markets (CSEM) (August 2005), pg. 2.

© 2013 Navigant Consulting, Inc. Page 35 October 8, 2013
for example through capacity markets, FERC has asserted authority over approval of the resource
adequacy determination.151 Likewise, FERC has asserted authority over resource adequacy standards
where they potentially affect the reliable operation of the BPS.152
In the electric power sector, the term resource adequacy refers to the transmission provider’s
probabilistic ability to meet end‐use demand for electric power during system peak hours.153
Underlying most resource adequacy standards in the U.S. are criteria set by the REs for generation
adequacy, typically a “1 in 10 Loss of Load Expectation” or LOLE.154 FERC has accepted this standard
for resource adequacy design,155 although there are opponents asserting that the 1‐in‐10 objective is
overly conservative and may impede transition from resource adequacy based on administrative
capacity mechanisms to market‐driven resource adequacy.156 Regardless, the choice of resource
adequacy objective and the means chosen to achieve it will have an impact on consumer electric rates.
151 FERC stated in PP 29‐32 of its March 23, 2005, order in Devon Power, L.L.C. et al., Docket No. ER03‐563‐030, et al.,
and in P 33 of its May 9, 2005, order in Docket No. ER05‐715‐000 et al. that the ISO New England (ISO‐NE) had the
authority to establish generation resource adequacy standards on the grounds that the ISO‐NE’s installed capacity
market is governed by a tariff that had been filed for approval by the FERC and that the ISO‐NE’s tariff and
Participants Agreement authorize the ISO‐NE to seek FERC approval of the ISO‐NE’s proposed resource adequacy
determinations. 152 In Order No. 747, FERC approved use of the 1‐in‐10 resource adequacy objective by RFC; regional reliability
standard, BAL‐502‐RFC‐02. See Planning Resource Adequacy Assessment Reliability Standard, 134 FERC ¶ 61,212
(2011) (“Order No. 747”). However, PUCO challenged FERC’s jurisdiction that insufficient resource adequacy falls
under its jurisdiction by supposedly impacting ʺjust and reasonableʺ wholesale prices. PUCO asserted that FERC
jurisdiction under FPA 215 adopting reliability standards is limited to those actions which provide for ʺreliable
operationʺ of the bulk‐power system and that a lack of adequate resources to serve firm load does not lead to
unreliable operation (instability, uncontrolled separation or cascading failures) since measures such as controlled
load shedding may be taken. FERC dismissed this argument, stating that the mere potential for instability,
uncontrolled separation or cascading failures justifies its actions, even where such supply‐demand imbalances may
be cured by firm load shedding. 153 See Christine Tezak, Resource Adequacy — Alphabet Soup!, STANFORD WASHINGTON RESEARCH GROUP,
(June 2005), pg. 2 (“Resource Adequacy — Alphabet Soup!”). 154 See Resource Adequacy — Alphabet Soup!, pg. 2. Loss of Load Expectation (LOLE) means the number of firm
load shed events an electric system expects over a period of one or more years. The utility industry, for decades, has
used an LOLE of 1 day of firm load shed in 10 years (referred to as the 1‐in‐10 reliability standard) as the primary if
not sole means for setting target reserve margins and capacity requirements in such resource adequacy analyses.
While this standard is accepted, there is not technical justification supporting this requirement. For example, in
NPCC, “The probability (or risk) of disconnecting firm load due to resource deficiencies shall be, on average, not
more than one day in ten years as determined by studies conducted for each Resource Planning and Planning
Coordinator Area.” ʺ See NPCC Reliability Reference Directory # 1 Design and Operation of the Bulk Power System
(December 2009), section 5.1.1. 155 In Order No. 747, FERC approved use of the 1‐in‐10 resource adequacy objective by RFC; regional reliability
standard, BAL‐502‐RFC‐02. 156 See Energy Choice Matters, FERC Mandates Use of Conservative Resource Adequacy Standard Which Will Raise
Retail Rates, (March 18, 2011).

© 2013 Navigant Consulting, Inc. Page 36 October 8, 2013
In retail choice regions, resource planning has become more complex. Prior to transmission unbundling
and retail access, resource adequacy was part of each utility’s IRP, a process discussed briefly in Section
5 and more thoroughly in Section 8 of this paper. Where utilities have restructured, however, it is not
feasible to plan for resource adequacy in this fashion.157 Under bundled service and IRP ratemaking, the
FERC had little say over resource adequacy decisions, which traditionally were handled by the states in
coordination with the regional reliability council.158 In retail choice regions, planners can no longer rely
on a single entity to meet forecast system needs. An array of merchant suppliers building generation in
response to anticipated future market process replaced a single utility in fulfilling power supply contract
obligations.159 This uncertainty in supply source could mean that a planner could over‐ or
underestimate their optimal supply target.160
Two approaches are used in the Centralized Market model to achieve resource adequacy goals— a
market‐based and an administrative approach. With a capacity market, suppliers receive periodic (i.e.,
annual or monthly) payments for providing “reliable” capacity to a system and Load‐Serving Entities
(LSEs) are required by the regulatory standard to purchase the capacity.161 One key concern for
consumers is price volatility and uncertainty. Examples of capacity markets are found in PJM, NYISO,
and ISO‐NE.
There are also other variations to the market‐based approach; these are energy‐only markets and
markets with administrative resource adequacy requirements for LSEs. An example of an energy‐only
market is ERCOT in Texas; however, declining reserve margins are forcing a reevaluation of this
approach.
Both CAISO and MISO are examples where the market‐based mechanism uses administrative resource
adequacy requirements. Under the administrative approach, resource adequacy is achieved through
traditional IRP and competitive resource solicitation. These processes are discussed in greater detail in
Section 8, Responsibilities for Planning and the Types of Planning Performed. One key concern is
increased consumer cost due to uneconomic investment decisions. Examples of administrative
approaches are SPP, most of WECC outside the CAISO, and the southeast U.S.
Table 3 lists the key features of the market‐based resource adequacy approaches in the U.S.
157 See Resource Adequacy — Alphabet Soup!, pg. 2. 158 Ibid., pg. 4. 159 See James Bushnell, Electricity Resource Adequacy: Matching Policies and Goals, Center for the Study of Energy
Markets (CSEM) (August 2005), pg. 3. 160 Over‐investment of resources can result in higher costs to retail customers while under‐investment can also result
in high costs, e.g., blackouts and in capacity markets price spikes. See Bushnell, pg. 4. For example, in 1998 and
1999, the Midwest experienced significant price spikes where the price of electricity in the wholesale markets went
to $1,000/MWh. 161 See Bushnell, pg. 4.

© 2013 Navigant Consulting, Inc. Page 37 October 8, 2013
Table 3. Examples of Market‐Based Resource Adequacy Mechanisms
Region/ Entity
Market-Based Method Key Features
CAISO LSE Resource Adequacy Requirement
CPUC established resource adequacy obligations applicable to all Load-Serving Entities (LSEs).
Two distinct requirements: Annual and monthly System resource adequacy Filings and annual Local resource adequacy Filings
Each LSE’s system requirement is 100 percent of its total forecast load plus a 15 percent reserve.
PJM Capacity Market “Reliability Pricing Model” that has a locational (subregional) capacity mechanism 3-year capacity obligation Market clearing price paid for all resources committed in the auction with
performance-based penalties Prices determined using an offer-based supply curve and simulated downward-
sloping demand curve (Variable Resource Requirement or VRR) PJM auctions consist of a Base Residual Auctions to meet the 3-year obligation and
Incremental Auctions to meet unfilled commitments. LSEs can self-supply, but their resources must be offered in the base auctions. A Fixed Resource Requirement (FRR) allows LSEs to meet fixed capacity obligations. Minimum Offer Price Rule (MOPR) to discourage efforts to depress market clearing
prices by offering non-competitive bids with a “conduct screen” to identify non-competitive bids
PJM has a capacity deliverability requirement.
NYISO Capacity Market New York State Reliability Council sets an Installed Reserve Margin, currently 118% of peak; NYISO determines the Minimum Unforced Capacity Requirement.
The NYISO runs Capacity Period (seasonal), monthly, and spot market UCAP auctions.
NYISO also has locational capacity requirements for NYC and Long Island (LI). Market clears along an administratively determined “demand curve.” NYISO has a capacity deliverability requirement.
ISO-NE Capacity Market Has a forward reserves market Does not have a deliverability requirement for capacity
MISO LSE Resource Adequacy Requirement
Annual resource adequacy requirements (reserve margin is 11.3% in 2012) and voluntary planning resource auction
Seven local resource zones with local clearing Opt-out provision allowing participants to submit a fixed resource adequacy plan,
allowing utilities to opt out of the yearly auction Deficiency charge for entities that are short on capacity (based on the cost of new
entry) Relies on state processes for resource planning, load forecasting, demand response,
and energy efficiency investment decisions

© 2013 Navigant Consulting, Inc. Page 38 October 8, 2013
Region/ Entity
Market-Based Method Key Features
ERCOT Energy Only Energy-only nodal market with the system-wide offer cap of $3,000 $3,000 offer cap not based on a VOLL (customers’ value of lost load) Target reliability standard of 1-in-10 (13.75% reserve margin) but target is not
enforced through specific requirements or market structures Two out-of-market reliability mechanisms: Emergency Response Service (ERS)
demand curtailment program and reliability-must-run (RMR) contracts for units needed for local reliability
Source: Navigant Consulting, Inc.

© 2013 Navigant Consulting, Inc. Page 39 October 8, 2013
6. Environmental Issues
6.1 Impacts of Environmental Regulation
The electric industry is subject to significant environmental regulation, both directly and through
policies or requirements relating to renewable energy and energy efficiency. For the most part, new and
proposed regulations affect electricity generation, rather than the transmission or distribution sectors.
This section provides an overview of relevant environmental regulations (existing and proposed) facing
electricity generation in the United States. It also discusses how renewable energy policies and
requirements affect entities operating under the two market structures.
6.2 Differing Impacts for Different Structures
Market/regulatory structure play an important role in whether and how environmental requirements
and policies affect electric entities. Where the traditionally regulated model prevails, the impacts –
whatever they are – fall on the utility and the associated costs flow to its customers through cost‐based
rates. In contrast, where there has been a restructuring of utility regulation and the development of
organized electricity markets, impacts vary widely.
For example, a utility that owns no generation would not incur the direct expense of complying with
environmental rules relating to emissions.162 Instead, generator compliance costs would be reflected in
the cost of energy purchases. Similarly, generation‐only entities would not normally be subject to RPS or
policies favoring the use of renewable energy resources. Instead, generators would feel the impact of
these items through increases or decreases in demand for their output and, accordingly, in energy prices.
All of this ultimately affects the prices end‐use customers pay. However, market forces may drive
energy prices higher or lower than would take place under the traditionally regulated model. If a
vertically integrated utility is supplying its energy principally through its own coal‐fired generation,
future environmental costs are potentially high, and may outstrip any potential production cost
differential that would otherwise favor coal. Similarly, if a market is dominated by coal generation,
environmental costs may drive up the overall costs of energy.
Independent generators in centralized markets are particularly sensitive to the costs of environmental
regulation, since these generators rely on market pricing rather than cost of service rates. Uneconomic
generation in centralized markets may be retired rather than operated at a loss for any extended period
of time.163 Environmental regulations facing coal plants as well as changing economics have encouraged
the growth of natural gas generation as well as renewable resources. Renewable resources in these
markets – particularly where there is a high renewables requirement – are usually not competing with
non‐renewables on the basis of cost, but instead are competing with demand response or other
162 This excludes contractual arrangements that would subject a non‐owner to those costs. 163 While an RTO or ISO may be able to keep these units in operation for a limited period through so‐called
“Reliability Must Run” arrangements that cover the owner’s costs, this is not intended to be a permanent or long‐
term solution to a retirement.

© 2013 Navigant Consulting, Inc. Page 40 October 8, 2013
renewables. Similarly, requirements relating to renewables may affect electric service providers
differently, depending on whether they are all subject to the same requirements.
Under the traditionally regulated model, utilities are also sensitive to environmental regulation,
including policies or regulations favoring renewables, since compliance would increase or decrease their
costs. While, in theory, new rate cases can be filed to reflect increased costs, in practice they are often
expensive and may meet resistance as costs to customers increase. “Regulatory lag” – i.e., the period
during which recoverable costs are incurred vs. when they are actually reflected in rates – can also be a
major concern to a vertically integrated utility. Nonetheless, to the extent the utility is able to pass on the
costs to its customers, the impact to the utility (though not its customers) may be muted.
Therefore, the decision to retrofit to comply with environmental regulations or retire and replace with
new generation involves different stakeholders and considerations for regulated utilities and
independent generation owners. For independent generation owners, these decisions are generally
made based on whether or not the revenues from a retrofitted plant outweigh the costs of operating the
retrofitted plant (including capital costs for the retrofit). For regulated utilities, retire or retrofit decisions
must be approved by the state public utility commission (PUC) and weigh the rate impact of the retrofit
compared to the rate impact of replacement generation or demand‐side options. PUCs may also choose
to or be required to take other non‐monetary issues into consideration, such as reliability, fuel diversity,
and public interest.164 While each case is specific, theoretically it is easier for a merchant generation
owner to retire a plant due to the high costs of an environmental regulation than a regulated utility.
Also of importance is the fact that while regulated entities own just over half of all currently operational
generation, they own nearly three‐quarters of all currently operational coal‐fired generation, the type
that is most affected by environmental regulations.165
The costs and risks from proposed environmental regulations will differ by region, largely affecting
those regions of the country with significant amounts of existing coal‐fired generation. Whether
environmental costs end up being passed through in cost‐based rates or result in higher market‐based
rates, the impact on electricity consumers in those regions will be considerable.
6.2.1 Greenhouse Gas Initiatives
The regulation of existing power plants has the potential to significantly affect the nation’s overall
emission of carbon dioxide (CO2); approximately 40 percent of national CO2 emissions are from the
electric sector. Overall, three possible paths for CO2 policy have emerged: legislation of a cap‐and‐trade
or tax approach, regulation by the U.S. Environmental Protection Agency (EPA), and no federal
regulation of CO2.
In the absence of legislation (which is unlikely in the near‐term), the EPA has the obligation under a 2009
settlement agreement to regulate CO2; however, congressional Republicans have threatened to strip the
164 For further discussion of the role of PUCs in utility decision making related to environmental regulations, see
Section II of: Monast and Adair, “A Triple Bottom Line for Electric Utility Regulation: Aligning State‐Level Energy,
Environmental, and Consumer Protection Goals,” Columbia Journal of Environmental Law, 38 (1) (2013). 165 Statistics from Navigant’s analysis of data downloaded from Energy Velocity in July of 2013.

© 2013 Navigant Consulting, Inc. Page 41 October 8, 2013
EPA of the authority.166 On June 25, 2013, President Obama announced that his administration plans to
meet the following deadlines for regulating carbon emissions from power plants:
September 20, 2013 – modified proposed rule for new power plants
June 1, 2014 – proposed rule for existing power plants
June 1, 2015 – final rule for existing power plants
June 30, 2016 – deadline for states to submit implementation plans167
Given the divisiveness of opinion on this topic and the other priorities for the federal government over
the near term, it is uncertain whether a federal greenhouse gas (GHG) program will come into effect in
the very near term.
The EPA re‐proposed New Source Performance Standards (NSPS) rules for CO2 emissions for new fossil‐
fuel power plants on September 20, 2013; the modified proposal limits coal‐fired and small natural‐gas‐
fired power plants to emitting 1,100 pounds of CO2 per MWh, and limits large natural‐gas‐fired plants to
emitting 1,000 pounds of CO2 per MWh. The original proposal set one CO2 emission standard (1,000 lbs.
per MWh) for both new coal and new natural gas power plants. The EPA’s analysis of the impacts of the
regulation show that despite the fact that the rule would essentially bar new coal power plants from
being built without carbon capture and sequestration (CCS), a technology that is not yet commercially
operational, the rule does not disrupt any planned coal power plant construction.
6.2.1.1 California AB 32
California’s Assembly Bill (AB) 32, enacted in September 2006, established a comprehensive program to
achieve quantifiable, cost‐effective reductions of GHGs by 2020. AB 32 requires the reduction of
California GHG emissions by 2020 down to 1990 levels, estimated to be a 16 percent decrease from the
California Air Resources Board’s (CARB’s) projected “business as usual” 2020 levels. CARB plans to
obtain a significant component of GHG reductions in the energy sector, specifically via a cap‐and‐trade
regime. CARB’s cap‐and‐trade program has been the subject of several litigation challenges, including
one in which CARB’s Scoping Plan was upheld in a June 2012 decision.
CARB held their first GHG auction in November of 2012, and held two auctions in the first half of 2013;
prices have remained near the floor of $10/allowance.
6.2.1.2 Regional Greenhouse Gas Initiative
Connecticut, Delaware, Maine, Maryland, Massachusetts, New Hampshire, New York, Rhode Island,
and Vermont have joined the Regional Greenhouse Gas Initiative (RGGI), which is a cap‐and‐trade
program to curb carbon dioxide emissions that began in 2009. The overall CO2 cap was reduced in 2012,
and will continue to be reduced each year. Twenty RGGI auctions have been held to date, with clearing
prices falling between $1.87/ton and $3.51/ton.
166 See Settlement Agreement: http://www.epa.gov/airquality/cps/pdfs/boilerghgsettlement.pdf 167 See Presidential Memorandum: http://www.whitehouse.gov/the‐press‐office/2013/06/25/presidential‐
memorandum‐power‐sector‐carbon‐pollution‐standards

© 2013 Navigant Consulting, Inc. Page 42 October 8, 2013
6.2.2 Renewable Portfolio and Energy Efficiency Resource Standards
Renewable Portfolio Standards (RPS) are state policies that require electricity providers to obtain a
minimum percentage of power from renewable energy resources by specified dates. Currently, there are
29 states plus the District of Columbia that have mandatory RPS policies in place; 8 states have
nonbinding renewable goals. An overview of the RPS objectives in each state has been provided in
Figure 9.
Figure 9. State RPS Policies
Source: Database of State Incentives for Renewables & Efficiency (DSIRE.org)
The target level of renewable penetration, deadlines, definition of renewable or alternative energy
sources, and compliance options all vary from state to state. Some states have provisions within the RPS
that limit compliance costs to regulated entities, utilities, or end‐use customers. Many states’ RPS
policies include special carve‐outs, incentives or other provisions to address local needs; a common
example is a carve‐out that requires a subset of the renewable target be from solar or distributed
generation (DG) sources. So far, most states have met or come close to meeting their RPS and carve‐out
targets. Many of the states that do not have RPS are located in the southeastern U.S., where there is little
potential for low‐cost wind generation. These states tend to have moderate solar potential and high
biomass potential, both of which have higher costs to develop than wind. Conversely, northeastern
states tend to have moderate to aggressive RPS policies and also lack substantial on‐shore wind
potential.
The existing RPS landscape is changing as some states pass revisions through legislation; to date, no
state has repealed its RPS. As they require utilities and regulated entities to obtain power from
renewable sources, which tend to have higher costs than traditional sources, RPS targets tend to increase

© 2013 Navigant Consulting, Inc. Page 43 October 8, 2013
the costs to the entities required to meet them.168 In regulated markets, these costs are passed directly on
to the end user, but, as described above, in deregulated markets the impact on end‐user rates is less
transparent.
Twenty states have mandatory Energy Efficiency Resource Standards (EERS) or similar provisions to
ensure that cost‐effective energy efficiency measures are used to help offset growing electricity demand.
An additional seven states have nonbinding energy efficiency goals. Most EERS policies require a
reduction in annual peak demand by a certain percentage through the implementation of energy
efficiency initiatives. An overview of the EERS objectives in each state has been provided in Figure 10.
Figure 10. State EERS Policies
Source: Database of State Incentives for Renewables & Efficiency (DSIRE.org)
The success of EERS programs is difficult to quantify, as they depend on estimates for demand reduction
compared to a “business as usual forecast.” States with EERS also tend to have lower average power
demand growth than states without EERS that have comparable economic profiles.169 Energy efficiency
improvements can be more cost effective than building new generation to meet demand growth; thus,
energy efficiency measures have the potential to reduce end‐user rates.
168 See U.S. Energy Information Administration, Levelized Cost of New Generation Resources in the Annual Energy
Outlook 2013” (January 2013), http://www.eia.gov/forecasts/aeo/electricity_generation.cfm. 169 U.S. Energy Information Association, Electricity Detailed State Data, 1990‐
2011, http://www.eia.gov/electricity/data/state/.

© 2013 Navigant Consulting, Inc. Page 44 October 8, 2013
6.2.3 Mercury and Air Toxics Standards
On December 21, 2011, the EPA unveiled the final version of the Mercury and Air Toxics Standards
(MATS) rule, which sets emissions limits on mercury and other toxic pollutants from power plants. The
rule will affect existing coal‐ and oil‐fired units that are capable of at least 25 MW of electrical output.
The rule requires emission reductions by April of 2015. The policy allows for an additional year, and
possibly two, for generators to install the necessary emission control equipment; this will likely reduce
the cost of compliance for entities that own many affected units as retrofits can be spread among the
entire compliance time period. Additionally, power plants have the option to use facility‐wide
averaging to meet mercury limits and the emissions are averaged over 90 days. The MATS rule is
expected to add significant retrofit costs to older coal power plants, resulting in the retirement of
some/many.
6.2.4 National Ambient Air Quality Standards
As required under the Clean Air Act (CAA), the EPA has set primary, and in some cases secondary,
National Ambient Air Quality Standards (NAAQS) for six criteria pollutants: carbon monoxide, lead,
nitrogen dioxide, ozone, particulate matter (PM) (diameter 2.5mm and 10mm), and sulfur dioxide, which
are updated by the EPA every five years. Carbon monoxide and lead standards do not apply to the
electric industry, but the other criteria pollutants are emitted or result from the combustion of fossil
fuels. After the EPA finalizes a NAAQS, states submit State Implementation Plans (SIPs) that outline
how that state plans to bring areas that do not meet the NAAQS into compliance. If the EPA does not
approve a state’s SIP, it can implement a Federal Implementation Plan (FIP) in that state. Therefore,
NAAQS SIPs can have very different impacts on generators state to state or even within states,
depending on a generator’s proximity to areas that are above the NAAQS.
6.2.5 Clean Air Interstate Rule/Cross‐State Air Pollution Rule
From the EPA’s NAAQS for PM, NOx, and SO2, the CAA also requires states to limit their emissions of
pollutants that can “contribute significantly” to another state’s NAAQS nonattainment problem when
they drift downwind. The EPA has promulgated two regulations designed to reduce these pollutants
that drift downwind in less than a decade, but both have been successfully challenged in court. Most
recently, in August of 2012, the U.S. Court of Appeals for the District of Columbia vacated the Cross‐
State Air Pollution Rule (CSAPR); the Supreme Court recently agreed to hear the EPA’s appeal of that
decision. Several coal power plants announced their retirement due to the CSAPR, and have since
retracted that announcement. CSAPR, and the Clean Air Interstate Rule (CAIR) before it, used a cap‐
and‐trade mechanism to allow flexibility in meeting emission reductions. In the next few years, either
the CSAPR will be reinstated by the Supreme Court, thought to be an unlikely outcome, or the EPA will
come up with a replacement rule.
6.2.6 Regional Haze
The EPA’s Best Available Retrofit Technology (BART) rule was finalized in 1999. The rule is designed to
improve visibility in national parks and applies to power plants built between 1962 and 1977. However,
the rule only requires NOx and SO2 emission reductions for those plants for which it is deemed
necessary through a unit‐by‐unit study. The regulation requires affected units to conduct analyses to
determine the impact of its emissions on visibility in national parks.
© 2013 Navigant Consulting, Inc. Page 45 October 8, 2013
6.2.7 Cooling Water Intake Structures
The EPA proposed a standard for cooling water intake structures at existing power plants on April 20,
2011, under section 316 (b) of the Clean Water Act (CWA). The EPA planned to issue its final rule for
cooling water intake structures by June 27, 2013; however, they did not meet this deadline and state that
they will finalize the rule by November 4, 2013. The proposed rule offered several compliance options,
including intake screen modification for impingement, and closed‐loop cooling systems or a site‐by‐site
determination of Best Technology Available (BTA) based on closed‐loop cooling systems for
entrainment. This rule has the potential to introduce huge retrofit costs to a number of plants,
potentially raising end‐user rates and causing reliability problems in the process.
6.2.8 Coal Combustion Residuals
Coal combustion residuals (CCRs) are residues from the power plants’ combustion of coal that are
captured by pollution control technologies, like electrostatic precipitators or bag houses. In June 2010,
the EPA issued a proposal to regulate coal ash in an attempt to address the risks from the disposal of the
wastes generated by coal plants in surface impoundments (for liquid waste) and landfills (for solid
waste). The EPA has not set a target date for issuing the final CCR regulation.

© 2013 Navigant Consulting, Inc. Page 46 October 8, 2013
7. Relative Allocation of Risks over Time
7.1 Traditionally Regulated Model
Under the traditionally regulated model, the allocation of risks is well established. The utility has a
monopoly right to provide electric service to retail customers, who in turn are entitled to electricity at a
“reasonable” cost. Utilities are allowed to recover their prudent investments in the system, plus a
reasonable return on investment, plus reasonable operating costs. In return, the utility has a duty to
serve all customers within its footprint and must expand and maintain the electric system as needed to
meet the needs of its customers.
The utility’s risk in the traditional model is that its rates will not recover its actual investment and
operating costs or meet the rate of return required for its investors to risk their money. The utility also
risks that its costs will be determined to have been prudently incurred and that it will receive timely
recovery through the regulatory process. The customer’s risks include:
1. Utility over‐investment or over‐building (since it gets a rate of return on its investment)
2. Utility under‐investment (either through bad decision making or out of concern that it will not
recover its costs)
3. Unreliable service as a result of ineffective operations
4. High costs due to inefficient utility operations or bad decision‐making
The traditional model uses regulation and regulatory proceedings170 to mitigate these risks. Rate cases
are intended to protect the customer from over‐investment (and inefficient operations while allowing the
utility and its investors to recover its prudently incurred costs plus a reasonable investment return. Rate
cases and other regulatory proceedings also address the utility’s reliability, operating costs, and
management. Regulation and mandated system requirements are also used to protect customers and the
public at large from under‐investment, unsafe operations, and environmental impacts. However, the
consumer protections afforded by rate cases may are sometimes criticized because: (1) litigation is
expensive and consumers may to be able to afford the costs of the litigation; and (2) many jurisdictions
do not have consumer advocates.
In the traditional model, utilities are generally vertically integrated, owning both the transmission and
distribution systems within their territory, as well as the generation necessary to serve customers. The
traditional model also includes government‐owned and cooperative utilities that may jointly own
transmission and generation facilities or their own facilities. Because utilities must serve load at all
hours of the year, they must have enough generation to serve peak demand, which may exceed what
would be needed to serve load for most of the year. They must also have access to additional resources
in the event that a generator becomes unable to operate.
Over the years, utilities have developed arrangements to assist one another to meet emergencies such as
the loss of a generator or an unexpected spike in demand, such as capacity reserve sharing agreements.
170 Including proceedings before the governing body of a utility that is not investor owned.

© 2013 Navigant Consulting, Inc. Page 47 October 8, 2013
In addition, utilities may purchase power from other companies on a long‐ or short‐term basis. Where
there is no centralized wholesale market, these are generally bilateral, negotiated transactions. These
purchases and sales allow utilities to manage the costs of providing for peak loads – either by selling
excess power or by purchasing some of the utility’s requirements. Otherwise, each utility would have to
build and own sufficient generation to meet its peak load, plus a required reliability reserve margin.
Independent power producers can be additional sources of power to utilities in areas where the
traditional utility structure prevails. In the absence of an centralized energy market, an independent
wholesale generator in a region subject to traditional utility structure may require a long‐term power
purchase agreement with a utility in order to obtain financing and to support its operations.171 For the
utility, a purchase power arrangement may be a less expensive alternative to constructing and owning a
power plant, and it provides certainty as to pricing over a long term. However, the downside risk is that
the utility may lock in prices that turn out to be too high.
Thus, in a traditional model, one risk to consumers is that prices (rates) will reflect higher generation
costs – either through over‐building or through long‐term power purchase agreements. On the plus
side, however, long‐term pricing agreements may protect consumers from energy price volatility. In
fact, FERC found that the unavailability of long‐term contracts was one of the causes of the California
power supply crisis.172 In addition, in both traditionally regulated and centralized market models, the
risks of long‐term contracts can be hedged through financial investments.
7.2 Centralized Market Model
In a centralized market, the risks for customers and the mechanisms for addressing them are the same
with respect to the transmission and distribution system. Rate cases and regulation are the principal
tools to protect customers from monopoly abuses and to set the utility’s pricing for the delivery of
electricity. However, with respect to generation, the market (often with a price cap as a backstop) sets
wholesale energy prices, which in turn may drive installation of new generation or new transmission.
Utilities may or may not own generation. In many cases, utilities in these areas have been required to
divest their generation. In other cases, utilities have divested some or all of their generation voluntarily.
In these markets, many generators in a region compete with one another to supply electricity. The
centralized markets are associated with RTOs or ISOs that are responsible for regional transmission
planning. In the wake of FERC’s Order No. 888, requiring investor‐owned utilities to file Open‐Access
Transmission Tariffs and requiring non‐jurisdictional entities to do so to gain the benefit of reciprocity,
utilities must make their transmission capacity not needed to serve their own customers available to
others on the same terms.173 They cannot favor their own or their affiliates’ wholesale transactions.
Utilities in these markets are not necessarily planning and building generation. Instead, these regions
rely on market forces to cause needed generation to be added when and where it is needed. Locational
171 IPP development in these areas may also be impacted by transmission constraints, which may limit the
generator’s ability to deliver the power to a buyer other than the local utility. 172 Investigation of Practices of the California Independent System Operator and the California Power Exchange, 93
FERC ¶61,121 at ¶61,354. 173 See Order No. 888, pg. 370.

© 2013 Navigant Consulting, Inc. Page 48 October 8, 2013
Marginal Pricing encompasses the delivered cost of energy into an area. In all of the existing organized
markets, all generation offered in an area is paid the same clearing price for the given hour or service,
with the difference being the cost to deliver the energy to the intended zone. This is intended to drive
overall costs down and to ensure that the lowest cost generation is dispatched first. In theory, new
capacity will be added in areas where prices are high. However, some markets have found that the LMP
differentials themselves may not be enough incentive. PJM and ISO‐NE, for example, have adopted
capacity auction mechanisms to ensure that there is sufficient capacity within the market.
While the markets are “physical” there are many purely financial participants. Financial participants
provide liquidity and depth that would be difficult to achieve if the only players were utilities and
generators. In addition, there are a number of financial hedging mechanisms that the organized markets
offer that help utilities and others reduce (or at least manage) risk. These include items such as the
Financial Transmission Rights (FTRs) offered through PJM (and comparable tools available in other
markets) that enable participants to manage transmission congestion risks and costs. Credit
requirements are stringent and monitored by the market operators. Each market has a market monitor
whose role is to determine whether pricing is competitive. In addition, various rules have been adopted
by FERC to address and prevent potential market abuses and manipulation, particularly after enhanced
civil penalty authority under Part II of the Federal Power Act (FPA)174 and the California energy crisis of
2000 and resulting litigation.
In areas where there is retail choice (which is most common under the centralized markets model), the
presence of lightly (or non‐) regulated alternative retail energy providers presents a range of new risks
for utilities and for customers. These providers may be thinly capitalized or overextended. In addition,
the energy savings may be less than expected (or nonexistent). Customers run the risk of higher rates if
the alternative provider fails to perform, although in many instance retail providers are required to meet
financial responsibility requirements which to some extent may mitigate this risk. In some cases –
particularly where industrial or commercial customers are concerned – the utility may charge a higher
rate to returning customers. In part, this is to discourage these large customers from returning to utility
supply if there are other options. This not only supports the growth of competition, but also protects the
utility from large swings in energy requirements due to customers arbitraging energy costs.
Figure 11 shows Navigant Research’s 2011 forecast that the rate of commercial and industrial customer
purchases from alternative suppliers is likely to continue to outpace overall industry growth for the next
several years.
174 EPACT 2005 expanded FERC’s remedies to address market manipulation, enhancing FERC the power to impose
civil penalties under Part II of the Federal Power Act (16 U.S.C. § 825o‐1 (2000) (as amended by EPAct 2005,
§1284(e)); 16 U.S.C. § 823b (2000)).
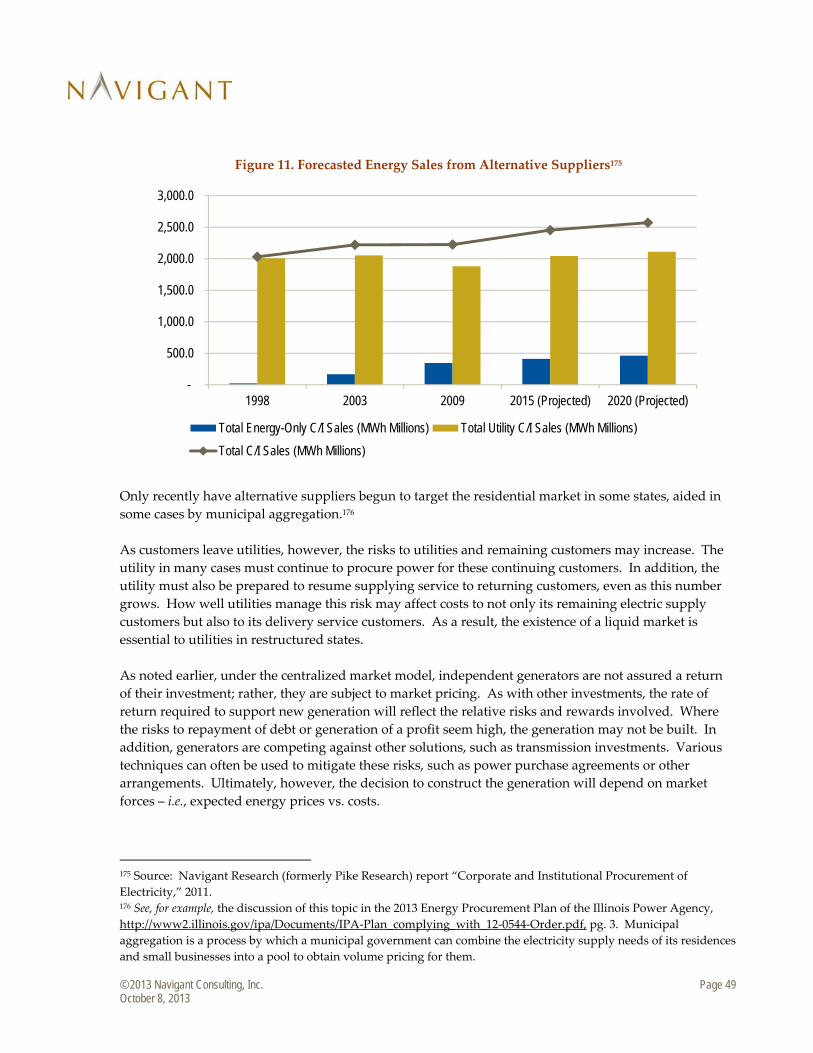
© 2013 Navigant Consulting, Inc. Page 49 October 8, 2013
Figure 11. Forecasted Energy Sales from Alternative Suppliers175
Only recently have alternative suppliers begun to target the residential market in some states, aided in
some cases by municipal aggregation.176
As customers leave utilities, however, the risks to utilities and remaining customers may increase. The
utility in many cases must continue to procure power for these continuing customers. In addition, the
utility must also be prepared to resume supplying service to returning customers, even as this number
grows. How well utilities manage this risk may affect costs to not only its remaining electric supply
customers but also to its delivery service customers. As a result, the existence of a liquid market is
essential to utilities in restructured states.
As noted earlier, under the centralized market model, independent generators are not assured a return
of their investment; rather, they are subject to market pricing. As with other investments, the rate of
return required to support new generation will reflect the relative risks and rewards involved. Where
the risks to repayment of debt or generation of a profit seem high, the generation may not be built. In
addition, generators are competing against other solutions, such as transmission investments. Various
techniques can often be used to mitigate these risks, such as power purchase agreements or other
arrangements. Ultimately, however, the decision to construct the generation will depend on market
forces – i.e., expected energy prices vs. costs.
175 Source: Navigant Research (formerly Pike Research) report “Corporate and Institutional Procurement of
Electricity,” 2011. 176 See, for example, the discussion of this topic in the 2013 Energy Procurement Plan of the Illinois Power Agency,
http://www2.illinois.gov/ipa/Documents/IPA‐Plan_complying_with_12‐0544‐Order.pdf, pg. 3. Municipal
aggregation is a process by which a municipal government can combine the electricity supply needs of its residences
and small businesses into a pool to obtain volume pricing for them.
-
500.0
1,000.0
1,500.0
2,000.0
2,500.0
3,000.0
1998 2003 2009 2015 (Projected) 2020 (Projected)
Total Energy-Only C/I Sales (MWh Millions) Total Utility C/I Sales (MWh Millions)
Total C/I Sales (MWh Millions)

© 2013 Navigant Consulting, Inc. Page 50 October 8, 2013
In contrast, under the traditionally regulated model, the utility determines whether to build generation
(often with its regulator or as part of its IRP) and may choose to build generation based on its value and
costs compared to other options including wholesale purchases. The utility under this model does not
have to consider generation as a standalone investment, but may view it in comparison with
transmission or other investments. And the “franchise” utility has clear responsibility to procure
adequate supply to meet existing and future demand of customers. Regulator oversight, including
prudence reviews, takes the place of market forces under the traditionally regulated model.

© 2013 Navigant Consulting, Inc. Page 51 October 8, 2013
8. Responsibilities for Planning and the Types of Planning Performed
BPS planning functions encompass resource adequacy and transmission security planning. Resource
adequacy planning involves assessing and determining that adequate generation supply will be
available to meet load. Transmission security planning aims to ensure there is adequate transmission
infrastructure to deliver generation to load centers. There is some overlap of federal and state regulation
with respect to these two areas. The oversight of resource adequacy planning has traditionally been a
state function while transmission security planning, with the important exception of transmission siting,
has now become governed by federal law and regulation overseen by the FERC. The planning of the
distribution system is entirely under the oversight of state and local governments. The key planning
challenges to entities in both the traditionally regulated and competitive market regions are discussed
below.
8.1 The Transmission Planning Framework
In recent years, FERC has issued two key Orders governing transmission planning: Order No. 890 and
Order No. 1000. Both apply regardless of an entity’s RTO/ISO affiliation; however, the manner in which
entities address their requirements differs based on whether they operate under an RTO/ISO.
Order No. 890 required that transmission providers participate in open, coordinated, and transparent
transmission planning on both local and regional levels.177 The planning process had to meet FERCʹs
nine planning principles, which include: coordination, openness, transparency, information exchange,
comparability, dispute resolution, regional coordination, economic planning studies, and cost allocation.
Transmission planning processes under Order No. 890 also had to be open to customers, and customers
must be given necessary planning information. Future system plans were required to be coordinated
with customers.178
Order No. 1000 built upon and extended many of the ideas initially introduced under Order 890.
Among the reforms introduced in Order No. 1000 are requirements for a regional transmission planning
process, cost allocation, consideration of public policy requirements, elimination of the Right of First
Refusal (ROFR) in wholesale tariffs to construct new facilities, and improvements to the coordination
between neighboring transmission planning regions for new interregional transmission facilities. Order
No. 1000‐A, issued in May 2012, and Order No. 1000‐B, issued October 2012, made some clarifications.
Each of these changes is discussed in the sections that follow.
8.1.1 Regional Planning and the Inclusion of Non‐Incumbent Transmission Developers
The Commission carried the Order No. 890 planning principles, designed principally to increase
transparency, into Order No. 1000, requiring that all regional planning processes comply with those
177 Order No. 890 at PP 3, 524. 178 Ibid., P 3.

© 2013 Navigant Consulting, Inc. Page 52 October 8, 2013
principles. Order No. 1000 also mandated that stakeholders be provided with an opportunity to
participate in that process in a timely and meaningful manner.179
The planning requirements in FERC Order No. 1000 require that each public utility transmission
provider participate in a regional transmission planning process that produces a regional transmission
plan and that complies with certain transmission planning principles. Through the regional
transmission planning process, public utility transmission providers must evaluate, in consultation with
stakeholders, alternative transmission solutions that might meet the needs of the transmission planning
region more efficiently or cost‐effectively than solutions identified by individual public utility
transmission providers in their local transmission planning process. Public utility transmission
providers have the flexibility to develop, in consultation with stakeholders, procedures by which the
public utility transmission providers in the region identify and evaluate the set of potential solutions that
may meet the region’s needs more efficiently or cost‐effectively.180 The procedures must result in a
regional transmission plan that reflects the determination of the set of transmission facilities that more
efficiently or cost‐effectively meet the region’s needs.
In the centralized markets where RTO/ISOs have formed, transmission planning generally encompasses
large regions and is coordinated around a centralized processes administered by the RTO/ISO. In terms
of identifying viable transmission solutions, several regions, including PJM,181 ISO‐NE, and CAISO,
adopted a competitive solicitation process in their transmission planning procedures as a result of Order
No. 1000.182
In areas where a traditionally regulated model remains, planning is coordinated by the vertically
integrated utilities within their territory. In several non‐RTO areas planning groups were established to
coordinate planning activities and meet Order Nos. 890 and 1000 requirements for regional planning
processes. For example, the Southeastern Regional Transmission Planning (SERTP) includes
predominantly jurisdictional and non‐jurisdictional systems in SERC that have come together to form a
group for preparing a regional planning process proposal for purposes of responding to FERC Order
No. 1000. Also, the California Transmission Planning Group (CTPG) includes jurisdictional and non‐
jurisdictional systems (including LADWP). The CTPG was originally formed in 2009 to comply with
Order No. 890, and was reorganized to address FERC Order No. 1000.
179 Transmission Planning and Cost Allocation by Transmission Owning and Operating Public Utilities, 136 FERC ¶ 61,051
at P 150 (2011) (“Order No. 1000”). 180 Note that the Commission uses the phrase “more efficient and cost‐effective” and “more efficient or cost‐
effective” in Order No. 1000 creating an ambiguity as to whether a project should be both efficient and cost‐effective. 181 See “With no ROFR provisions at issue, FERC mostly reaches consensus on Order 1000 Filings,” SNL Financial,
Apr. 18, 2013. 182 The CAISO competitive solicitation process applies to lines above 200 kV. See “FERC mostly accepts CAISO
Order 1000 filing, but Clark dissents on two issues,” SNL Financial, Apr. 19, 2013. The ISO‐NE process was
introduced conditionally. See “With no ROFR provisions at issue, FERC mostly reaches consensus on Order 1000
Filings,” SNL Financial, Apr. 18, 2013. For example, ISO‐NE uses its Attachment K process, where merchant
transmission solutions can be proposed in response to a need as identified in the Regional System Plan.
Additionally, ISO‐NE may, acting through its Board, solicit transmission solutions as alternative proposals from the
market when no viable solutions have been proposed. Similarly, the NYISO, through its Comprehensive Reliability
Planning Process, may also solicit market solutions to meet reliability needs.

© 2013 Navigant Consulting, Inc. Page 53 October 8, 2013
While Order No. 1000 does not require non‐public utilities to participate in the planning processes, it
does encourage them to do so.183 Some non‐public utilities have chosen to enroll184 in transmission
planning regions depending on whether they have load in the region where they seek to sponsor a
project.185
FERC also does not require Merchant Transmission companies to participate in Order No. 1000
processes, recognizing that the costs of those projects are recovered through negotiated rates and that
Merchant Transmission developers assume the entire risk for development of these projects. However,
if a Merchant Transmission developer wishes to take advantage of the regional cost allocation
mechanisms, it must participate in the regional planning process.186
Several regions, RTO and non‐RTO, initially elected to have their state regulatory bodies decide which
competing transmission developer projects would be selected; the Commission rejected this option.187
While the state may participate in the decisions, it is the planning region that must make the ultimate
decision.
8.1.2 Interregional Planning Coordination
In the Order No. 1000 Final Rule, FERC adopted several measures to broaden the geographic scope of
transmission planning and enable an adequate analysis of the benefits associated with interregional
transmission facilities that address transmission needs in an efficient or cost‐effective manner.188 FERC
required that each public utility transmission provider, through its regional transmission planning
process, (1) develop procedures for sharing information regarding the respective needs of neighboring
transmission planning regions; (2) develop and implement procedures for neighboring public utility
transmission providers to identify and evaluate transmission facilities that are proposed to be located in
both regions; (3) exchange planning data and information between neighboring transmission planning
regions at least annually; and (4) maintain a website or e‐mail list for the communication of information
related to interregional transmission coordination.189 However, the Commission declined to require a
183 See Order No. 1000 at PP 815‐822 and Order No. 1000‐A at P 774. 184 As an enrollee, the entity will have access to regional cost allocation for its accepted projects and will also have
voting rights in the transmission planning process; non‐enrollees do not have these rights. See “With no ROFR
provisions at issue, FERC mostly reaches consensus on Order 1000 Filings,” SNL Financial, Apr. 18, 2013. For
example non‐public utility enrollees include LIPA in the NYISO regional planning process, Tennessee Valley
Authority (TVA), Associated Electric Cooperative Inc. (AECI), and East Kentucky Power Co‐op (EKPC) all joined
the SERTP regional planning process for purposes of the FERC Order 1000. Also, LADWP joined the California
Transmission Planning Group for purposes of FERC Order No. 890 and for FERC Order No. 1000 regional planning
process. 185 See “With no ROFR provisions at issue, FERC mostly reaches consensus on Order 1000 Filings,” SNL Financial,
Apr. 18, 2013. 186 See Order No. 1000‐A at P 275. 187 See SCE&G (ER13‐107‐000), NYISO (ER13‐102‐000), and CAISO (ER13‐103‐000) Orders. 188 See Order No. 1000 at P 368. 189 Ibid. at P 345.

© 2013 Navigant Consulting, Inc. Page 54 October 8, 2013
formal planning agreement between public utility transmission providers of neighboring transmission
planning regions, as it proposed.190
Both traditionally regulated and centralized market (RTO/ISO) regions have implemented processes for
the sharing and exchange of interregional planning data. Furthermore, in response to the interregional
requirements of FERC Order No. 890, and the more specific requirements of the FERC Order No. 1000
Final Rule, there are several coordinated interregional planning initiatives underway in both RTO and
non‐RTO regions to comply with these requirements. One example is the Northeastern ISO/RTO
Planning Coordination Protocol (“the Protocol”), a document, describing a set of processes and
procedures through which coordinated planning activities will be conducted and implemented by the
ISOs and RTOs in the northeastern United States and Canada.191 The Protocol provides a process for
conducting interregional planning studies, and includes: the responsibilities of the stakeholder process,
data and information exchange, the coordination of project evaluation criteria, procedures for
conducting interregional assessments, and procedures for the evaluation of projects that can address
regional needs consistent with FERC Order No. 1000. The Protocol was first developed to support the
Northeastern Coordinated System Plan, one of the first comprehensive interregional planning studies.
Public utility transmission providers that are not affiliated with an RTO/ISO have responded to the
requirements of FERC Order No. 1000 using an approach similar to the above, perhaps relying on an
existing framework that was developed in response to FERC Order No. 890 requirements or earlier.
These systems, whether vertically integrated utility or other transmission service provider, typically
participate in a regional transmission planning process that provides a similar framework for addressing
the requirements of FERC Order No. 1000. For example, Puget Sound Energy, a utility in the Pacific
Northwest, participates in the ColumbiaGrid regional transmission planning process, which is governed
by the provisions of its Planning and Expansion Functional Agreement (“PEFA”). The PEFA addresses
member entities’ data and analyses requirements, and is designed to facilitate multi‐system planning
through a coordinated, open, and transparent process.192 The Southeastern Regional Transmission
Planning (“SERTP”) association is a similar organization, which includes jurisdictional and non‐
jurisdictional utilities in the southeast.
8.1.3 Cost Allocation
Order No. 1000 also mandated that each planning region develop a cost allocation mechanism for
allocating the costs of projects that are selected in the planning process for inclusion in a regional plan.
Transmission cost allocation is a subject of considerable debate among various stakeholders in the
electricity industry. Cost allocation raises a number of questions depending on the stakeholder’s
perspective. From the state regulator and end‐use customer side, issues pertain to electricity rates. For
other stakeholders, it is a question of who is a beneficiary of a new transmission project. For renewable
energy developers, cost allocation can be a significant detriment to the development and delivery of
190 See Ibid. at P 475. 191 The parties to the Protocol are PJM, NYISO, and ISO‐NE. Ontarioʹs Independent Electricity System Operator,
Hydro‐Quebec, and New Brunswick Power are not parties to the Protocol but have agreed to participate in the data
and information exchange process and in regional planning studies for projects that may have interregional impacts. 192 See ColumbiaGrid PEFA, Third Amendment and Restatement.

© 2013 Navigant Consulting, Inc. Page 55 October 8, 2013
renewable resources.193 Some stakeholders advocate “socializing,” or spreading new transmission costs
as widely as possible while others argue that only those who receive direct reliability and/or economic
benefits from new transmission assets should pay. In addition, parties have argued that the socialization
of transmission costs masks the true delivered cost of power from specific resources and therefore
distorts the generation and consumption incentives of different resources or loads. 194
Order No. 1000 adopted six principles for both regional and interregional project cost allocation,
including that allocated costs must be roughly commensurate with benefits and the cost allocation
process must be transparent.195
A PJM paper identified five general cost allocation approaches in use in the U.S., including allocation : 1)
between load and generation, 2) by amount of usage, 3) by peak consumption or generation, 4) by flow‐
basis, and 5) by a monetary impact basis. 196
Table 4. Examples of Cost Allocation Approaches Used by Planning Region197
Methodology Description RTO/ISO or Planning Region
License Plate Each utility recovers the costs of its own transmission investments (usually located within its footprint).
Southeast CAISO (< 200 kV) ISO-NE (< 115 kV)198 WECC (outside CAISO)
Beneficiary Pays Various formulas that allocate costs of transmission investments to those entities that benefit from a project, even if the project is not owned by the beneficiaries. In the case of FRCC, system benefits include avoided transmission costs.
FRCC (>230kV)199 PJM (<500 kV) NYISO (reliability and economic)200 MISO (<345 kV)
193 See “A Survey of Transmission Cost Allocation Issues, Methods and Practices,” PJM, Mar. 10, 2010, pg. 3 (“A
Survey of Transmission Cost Allocation Issues, Methods and Practices”). 194 See A Survey of Transmission Cost Allocation Issues, Methods and Practices, at pg. 3. 195 Order No. 1000 at P 622. 196 See A Survey of Transmission Cost Allocation Issues, Methods and Practices, pg. 1. 197 Source: Navigant Consulting, Inc. 198 Applies to non‐Pool Transmission Facilities (PTF) only. Transmission lines that are determined to contribute to
the reliability of the system (based on tariff criterion) that are less than 115kV are also allocated using a postage
stamp methodology. 199 The Beneficiary Pays cost allocation method applies to FRCC’s Cost Effective and/or Efficient Regional
Transmission Solution (“CEERTS”) Projects. 200 For reliability upgrades specific locational violations occurring in a zone or zones are allocated to the zone or
zones in which those violations occur. Upgrades solving reliability violations in only part of the NYISO due to
constrained interfaces are allocated to the zones causing the violation based on each affected zone’s share of the
coincident peak load of the affected zone. Upgrades solving NYISO‐wide violations are allocated to all zones in the
NYISO based on their share of the coincident peak load in the NYISO. Costs for economic upgrades are allocated
based upon the zonal share of total energy expenditure savings across zones that have energy savings. Load serving
entities identified as beneficiaries are eligible to vote on whether to continue with the project.

© 2013 Navigant Consulting, Inc. Page 56 October 8, 2013
Methodology Description RTO/ISO or Planning Region
Postage Stamp Transmission costs are recovered uniformly from all loads in a defined market area (e.g., RTO-wide in ERCOT and CAISO). Regions using load ratio share either allocate based on coincident peak demand or energy (MWh) of the member systems, as described in its tariff. Some regions use a combination of methods for allocating costs. For example, SPP uses a ratio of 33% postage stamp and 67% Beneficiary Pays for allocating costs for reliability projects. Similarly, for >=345kV projects, MISO uses 20% Postage Stamp and 80% Beneficiary Pays for reliability projects.
ERCOT PJM (>= 500 kV) MISO (>=345kV) CAISO (>= 200kV reliability and economic) SPP(reliability201; economic >345 kV) ISO-NE (>= 115 kV)
Merchant Cost Recovery
Project sponsors recover the cost of the investment (e.g., via negotiated rates with specific customers); largely applies to DC lines where transmission use can be controlled.
CAISO ERCOT PJM NYISO ISO-NE
Multi-Value Project (MVP)
100% of the annual revenue requirements for MVP are allocated on a system-wide basis to Transmission Customers that withdraw energy from the system, including export and wheel-through transactions sinking outside the region, and recovered through an MVP Usage Charge.
MISO
Tehachapi Location Constrained Resource Interconnection (LCRI) Approach
Upfront postage stamp funding of project, later charged back to interconnecting generators.
CAISO
8.1.4 Planning for Public Policy Requirements
Prior to Order No. 1000, some regions already took into account public policy requirements to the extent
that they drove specific actions such as plant retirements to meet federal and state environmental
mandates. Some single state regions also took into account state renewable resource integration targets.
However, Order No. 1000 made it a requirement to consider these public policy requirements as part of
a region’s planning process.
8.1.4.1 Planning for Public Policy Requirements in Order No. 1000
Order No. 1000 requires that regional planners consider “public policy requirements” when conducting
their studies. In the final rule, FERC narrowed the definition to include only “enacted statutes (i.e.,
passed by the legislature and signed by the executive) and regulations promulgated by a relevant
201 For all upgrades at all voltage levels and with upgrade cost greater than $100,000.

© 2013 Navigant Consulting, Inc. Page 57 October 8, 2013
jurisdiction, whether within a state or at the federal level.”202 FERC did not dictate how this would be
accomplished, permitting stakeholders to propose different approaches that it would evaluate.203
While the provisions are still largely untested, several issues have arisen relating to the “public policy”
planning requirements. The Commission rejected the NYISOʹs intention to ask only incumbent
transmission owners to propose solutions to meet public policy requirements, finding this to be
discriminatory. It also ordered that the NYISO must detail how non‐transmission alternatives can be
submitted for consideration.204 Finally, FERC rejected the NYISO’s plan to have the New York PUC
decide which public policy projects should be advanced, noting that this was a decision the NYISO itself
must make. In California, the Commission required that the CAISO have authority to order incumbent
utilities to build economic or policy‐driven lines that no other qualified transmission owner was willing
to build.205
8.1.4.2 Integration of Renewable Resources
The location of renewable resources such as wind, large‐scale solar, and geothermal generation is largely
dictated by nature, due to the location of and the inability to transport the fuel source of renewables.
Connecting these location‐constrained resources to the transmission network in the most cost‐effective
manner can present special challenges.
In the Northeast, state regulators and regional planning authorities acknowledge the hurdles of
transmission development to integrate renewable resources. The six New England states206 and New
York have adopted some form of RPS, which require utilities and other suppliers of retail service to
obtain specified percentages of their electricity from power plants that run on renewable fuels. An
overview of the RPS objectives in each state has been provided in Figure 9, in Section 6.2.2 of this paper.
Transmission infrastructure development in the Mid‐Atlantic region is almost exclusively driven by
PJM’s Regional Transmission Expansion Planning Process (RTEP). As part of that process, PJM
evaluates alternatives that integrate emerging aggregated power resource areas including projects that
address reliability issues posed by clusters of development based on renewable energy sources.
Texas leads the nation in wind power, most of which comes from its remote western plains, and it has
made development of supporting transmission infrastructure a priority. Transmission upgrades to
support additional wind generation are planned by ERCOT with all transmission system construction
costs being borne by the ERCOT grid and ultimately by load within ERCOT. All costs for wind
generation interconnections are rolled into the ERCOT system‐wide transmission costs and assigned to
load in the same manner as system upgrades.
202 Order No. 1000 at P 2. 203 See “With no ROFR provisions at issue, FERC mostly reaches consensus on Order 1000 Filings,” SNL Financial,
Apr. 18, 2013. 204 See “FERC orders changes to NYISO Order 1000 filing, including public policy provisions,” SNL Financial, Apr.
22, 2013. 205 See FERC mostly accepts CAISO Order 1000 filing, but Clark dissents on two issues, SNL Financial, Apr. 19, 2013. 206 The RPS in Vermont are goals, not mandatory requirements at this time.

© 2013 Navigant Consulting, Inc. Page 58 October 8, 2013
In the South Central region, while there are several transmission projects being developed by
Transmission Owners, like the Mid‐Atlantic region, transmission system development is led primarily
by the region’s RTO, the Southwest Power Pool (SPP).
Renewable resource development in the Southeast has been limited. Renewables, like solar power and
wind turbines, are faced with several challenges to their consistent and widespread use in the Southeast.
Solar energy requires large tracts of open land to install, which are not readily available, and cloud cover
limits its reliability. In addition, on‐shore locations with good wind profiles are generally not available
in this region. Unlike the states in other geographic regions of the United States, those in the Southeast
generally lack RPS requirements that would further encourage the development of renewable resources.
The Midwest has several large‐scale studies underway. The Regional Generation Outlet Study
(RGOS)207 identifies major areas of renewable energy development zones, where transmission can be
built in a “build it and they will come approach.” Finally, the Joint Coordinated System Plan (JCSP) was
a multi‐RTO/ISO initiative208 led by the Midwest Independent System Operator (MISO) to determine
transmission infrastructure that could be constructed to support the delivery energy and capacity from
renewable resources in the Midwest to load centers in the east.
Transmission construction in the West to integrate renewable resources is best typified by the
development of numerous, large transmission line projects intended to tap vast renewable resource
reserves. California has initiated the Renewable Energy Transmission Initiative (RETI) to help identify
the transmission projects needed to accommodate the State’s renewable energy goals, support future
energy policy, and facilitate transmission corridor designation and transmission and generation siting
and permitting.
The processes used to identify transmission solutions are strikingly different between some RTO and
non‐RTO interregional planning regions. Some interregional transmission planning approaches for RTO
regions have proposed a systematical approach for identifying transmission solutions to meet a public
policy or reliability need. For example, as mentioned earlier a few RTOs will solicit transmission
solutions using a RFP approach. In contrast, some non‐RTO planning regions will receive input from
stakeholders on a public policy requirement, and evaluate the currently proposed transmission projects
to determine which solution may best meet the requirement.
207 Background information on the RGOS is located at
https://www.midwestiso.org/Planning/Pages/RegionalGenerationOutletStudy.aspx. 208 Members are MISO, PJM, SPP, and TVA. This effort performed a long‐term planning study incorporating both
economic and reliability analysis of system performance for the combined four JCSP areas in collaboration with the
parallel Department of Energy Eastern Wind Integration & Transmission Study, which will provide underlying
input assumptions for generation scenarios. There was a subsequent Eastern Interconnection wide study performed
under the Eastern Interconnection Planning Collaborative. The final reports for this study are available at:
http://www.eipconline.com/.

© 2013 Navigant Consulting, Inc. Page 59 October 8, 2013
8.1.4.3 ROFR and Non‐Incumbent Transmission Owners
Order No. 1000 envisions a level playing field where new transmission developers can compete with
established transmitting utilities for the right to build new transmission lines. The Commission
determined that incumbent utilities must remove provisions from their Commission‐jurisdictional tariffs
and agreements that grant them a right of first refusal (ROFR) to construct transmission facilities.209
These provisions, FERC stated, have the potential to undermine the evaluation of more efficient or cost‐
effective solutions to regional transmission needs.210
In a May 17, 2013 ISO‐NE Compliance Order, the FERC stated it would eliminate the ROFR requirement
in many instances. The Commission, however, did agree that to avoid delays in the development of
transmission facilities needed to resolve a time‐sensitive reliability criteria violation, certain reliability‐
related transmission projects should be exempt from the competitive solicitation ʺin certain limited
circumstances.ʺ211 One such circumstance would be when a project is needed in three years or less to
solve a reliability issue.212 Also, while the ROFR for incumbent TOs to build and own new transmission
facilities with costs allocated regionally has been eliminated, the TOs retain ROFR to build and own local
transmission facilities (under 200 kV) located within the existing service territory of the TO.213
8.2 Transmission Siting and Transmission Grid Expansion
The authority over transmission siting is a patchwork quilt of overlapping and sometimes unclear
divisions of authority between numerous governmental bodies deriving authority under several bodies
of law. While the majority of siting authority currently lies with the states, there are a number of
instances where federal approvals are required.
Under current law, the state PUCs often have the primary authority to issue certificates of public
convenience and necessity, which permit electric utilities to construct transmission lines. Although prior
certification from FERC is required for pipeline facilities under Section 7 of the NGA,214 there is no
analogous certification requirement under the FPA. Furthermore, at the federal level, there is currently
no comprehensive program for regulating the construction of electric utility facilities except in the
instance of nuclear and hydroelectric projects.215
209 See Order No. 1000 at P 226. 210 Ibid. at P 253. 211 See UPDATE: FERC explains reasons for finding public interest standard overcome in ISO‐NE ROFR decision,
SNL Financial. May 21, 2013. See also, ISO New England Inc., 143 FERC ¶ 61,150 at P236 (May 17, 2013). 212 See UPDATE: FERC explains reasons for finding public interest standard overcome in ISO‐NE ROFR decision,
SNL Financial. May 21, 2013. This decision appears to support part of PJM’s approach to ROFR, which provides that
its ROFR would still apply to projects that did not have enough time to go through the competitive solicitation
process. 213 Both MISO and CAISO both proposed this exception to the elimination to ROFR. See “With no ROFR provisions
at issue, FERC mostly reaches consensus on Order 1000 Filings,” SNL Financial, Apr. 18, 2013. 214 Natural Gas Act § 7, 15 U.S.C. § 717f (2001). 215 In fact, for non‐hydroelectric and nuclear projects the FPA expressly excludes the regulation of generating
facilities. Federal Power Act § 201(b), 16 U.S.C. § 824(b) (2001).
© 2013 Navigant Consulting, Inc. Page 60 October 8, 2013
At the state level, a certificate of public convenience and necessity for the construction of high‐voltage
transmission facilities is required by many states. The majority of states have at least one agency/board
that has authority to issue or deny construction permits.216 About two‐thirds of the states that issue
certifications focus primarily on lines greater than 60 kV in size.217
EPACT 2005 established a limited role for DOE and FERC in transmission siting. The act directed DOE
to create “transmission corridors” in locations with adequate transmission capacity that had “national
interest” implications.218 The act also granted FERC secondary authority over transmission siting in
these corridors.219 This authority may not be exercised by FERC unless the state where the facility would
be sited lacks the authority to issue the permit, the applicant does not qualify for the permit in the state,
or the state has “withheld approval” of the permit for more than one year.220 Since the passage of this
law there have been proposals to both expand FERC’s authority as well as contract it. There have also
been several court cases which have further limited FERC’s backstop authority.221
8.3 Adequacy Planning and Integrated Resource Planning
The oversight of adequacy (resource) planning remains primarily a state function; however, FERC has
introduced some regulation governing the interconnection of generation resources to establish an open
and transparent process.
8.3.1 Integrated Resource Planning and Procurement Plans
Many states developed and retained approaches to address increases and decreases in demand and
changes in their generation fleets, while doing so in a cost‐effective manner that maintains required
levels of reliability. Integrated resource planning222 began in the late 1980s as states began to respond to
the oil embargos of the 1970s and nuclear cost overruns that occurred during the same time period and
into the 1980s.
216 Those states that do not have oversight of transmission siting except where it pertains to specific locational
attributes (i.e., river crossings) are Georgia, Indiana, Louisiana, and Oklahoma. Several states have multiple agency
processes. See Edison Electric Institute
State Generation & Transmission Siting D I R E C T O R Y (2012) available at
http://www.eei.org/issuesandpolicy/transmission/Documents/State_Generation_Transmission_Siting_Directory.pdf. 217 Ibid. 218 Energy Policy Act 2005, § 1221. 219 Ibid. 220 Ibid. 221 See, e.g., Piedmont Envtl. Council v. FERC, 558 F.3d 304 (4th Cir. 2009), cert. denied sub nom, Edison Electric Institute v. Piedmont Envtl Council, 130 S. Ct. 1138 (2010); California Wilderness Coalition, et al. v Dept. of Energy, 631 F.3d 1072
(9th Cir. 2011). 222 The integrated resource plan (IRP) is a comprehensive planning process designed to provide insight into how a
utility may best meet its resource needs over a long‐term (10‐20 year) planning horizon while considering all
resource options and a range of risks and uncertainties that are inherent in the utility industry. An IRP is typically
developed with considerable public and other stakeholder involvement, and results in a preferred implementation
plan.
© 2013 Navigant Consulting, Inc. Page 61 October 8, 2013
IRPs are typically long‐term, with a 20‐year period being the most common planning horizon and
periodic updates to reflect changing conditions every 2‐5 years.223 Steps taken in an IRP include
forecasting future loads, identifying potential supply side and demand‐side resource options to meet
those future loads and their associated costs, determining the optimal mix of resources taking into
account transmission and other costs, receiving and responding to public participation (where
applicable), and creating and implementing a resource plan.224 IRPs consider system operation, such as
diversity, reliability, dispatchability, and other factors of risk.225 Commissions do not actively monitor
utility actions that are taken based on the IRP, but rather review the results of the IRP during rate cases,
prudence reviews, fuel cost adjustments, certificates of public convenience and necessity, review of
utility power purchases, and resource acquisition cases.226
Many states began to reconsider the IRP approach in the mid‐1990s as the electric industry began to
restructure.227 Several states either repealed them with restructuring laws, or began to ignore them.228
Recently, however, there has been interest in returning to integrated resource planning in some of the
states that have restructured.229
The presence and status of IRP procedures vary with some state IRP rules remaining unchanged, other
states have amended or repealed their rules, and some have reinstated their IRP rules. Figure 12 shows
those states that currently have IRP rules, states that are developing or revising IRP rules, and states that
do not have an IRP rule.
223 See Rachel Wilson and Paul Peterson, “A Brief Survey of State Integrated Resource Planning Rules and
Requirements Prepared for the American Clean Skies Foundation”, Synapse Energy Economics, Inc. (April 28, 2011),
pp. 7‐8 (“A Brief Survey of State Integrated Resource Planning Rules and Requirements”). 224 See A Brief Survey of State Integrated Resource Planning Rules and Requirements, pg. 3. 225 Energy Policy Act of 1992, §111(d)(19). Text available at: http://www.ferc.gov/legal/maj‐ord‐reg/epa.pdf. 226 See A Brief Survey of State Integrated Resource Planning Rules and Requirements, pg. 4. 227 Ibid. at p. 13. 228 Ibid. at p. 13. 229 Ibid. at p. 16.

© 2013 Navigant Consulting, Inc. Page 62 October 8, 2013
Figure 12. States with Integrated Resource Planning (or similar planning process)

© 2013 Navigant Consulting, Inc. Page 63 October 8, 2013
9. Innovation and the Levels of Research and Development Pursued
Innovations in the electric industry, technical and economic, have come about through the application of
research and development of projects by the electric sector, governments, and other industrial,
communications, and technology sectors. These have affected the electric sector’s regulatory model in a
number of ways. This section reviews several key major innovations and their relative impacts on the
traditionally regulated and centralized market models. In addition, this section reviews the ongoing
impact of these market models on innovation, including research and development.
9.1 Declining Costs and Increasing Flexibility of Generation Technologies
Expansion of combined heat and power (CHP) and natural gas‐fired combined cycle (CC) plants in the
late 1970s into the 1990s was a strong contributing factor to growth in the class of non‐utility generation.
Much of the early impetus for CHP and CC might be attributed to the PURPA (1978) provisions that
required utilities to purchase power at “avoided cost” from cogenerators, and to federal legislative and
regulatory actions that led to open access to gas supplies.230
But just as significant have been the technical and economic strides of these technologies relative to other
thermal and nuclear generation. In its 2013 Annual Energy Outlook, the U.S. Energy Information
Administration (EIA) estimated that a new, advanced CC power plant would cost approximately
$1,006/kW (2011$) to build and would generally be around 400 MW in size, whereas a new scrubbed coal
power plant would cost approximately $2,883/kW (2011$) to build and would generally be around 1,300
MW in size.231 In addition to reduced overnight costs, the levelized cost of many of these sources has
dropped near or below that of a new coal plant, as seen in Table 5. The levelized cost is the cost per unit
of electricity generated, including capital costs, fixed and variable operations and maintenance (O&M)
costs, fuel costs, and transmission investment costs. Note that the values provided in Table 5 do not
include tax credits, nor do they assume any potential CO2 emission‐related costs.
230 Natural Gas Policy Act of 1978, Pub. L. No. 95‐621, 92 Stat. 3351 (codified at 15 U.S.C.§§ 3301‐3432 (1982)).
Regulation of Natural Gas Pipelines After Partial Wellhead Decontrol, Order No. 436, 50 FR 42408 (Oct. 18, 1985), FERC
Stats. & Regs. [Regulations Preambles 1982‐1985] 30,665 (1985), vacated and remanded, Associated Gas Distributors v.
FERC, 824 F.2d 981 (D.C. Cir. 1987), cert. denied, 485 U.S. 1006 (1988), readopted on an interim basis, Order No. 500, 52
FR 30334 (Aug. 14, 1987), FERC Stats. & Regs. [Regulations Preambles, 1986‐1990] 30,761 (1987), remanded,
American Gas Association v. FERC, 888 F.2d 136 (D.C. Cir. 1989), readopted, Order No. 500‐H, 54 FR 52344 (Dec. 21,
1989), FERC Stats. & Regs. [Regulations Preambles 1986‐1990] 30,867 (1989), rehʹg granted in part and denied in part,
Order No. 500‐I, 55 FR 6605 (Feb. 26, 1990), FERC Stats. & Regs. [Regulations Preambles 1986‐1990] 30,880 (1990),
affʹd in part and remanded in part, American Gas Association v. FERC, 912 F.2d 1496 (D.C. Cir. 1990), cert. denied, 111 S.
Ct. 957 (1991); Pipeline Service Obligations and Revisions to Regulations Governing Self‐Implementing Transportation and Regulation of Natural Gas Pipelines After Partial Wellhead Decontrol, Order No. 636, F.E.R.C. STATS. & REGS. ¶ 30,939
(1992), order on reh’g, Order No. 636‐A, F.E.R.C. STATS. & REGS. ¶ 30,950 (1992), order on reh’g, Order No. 636‐B, 61
F.E.R.C. ¶ 61,272 (1992), notice of denial of reh’g, 62 F.E.R.C. ¶ 61,007 (1993), aff’d in part and vacated and remanded in
part, United Dist. Cos. v. FERC, 88 F.3d 1105 (D.C. Cir. 1996), order on remand, Order No. 636‐C, 78 F.E.R.C. ¶ 61,186
(1997).. 231 U.S. Energy Information Administration, Assumptions to the Annual Energy Outlook 2013: Electricity Market Module.

© 2013 Navigant Consulting, Inc. Page 64 October 8, 2013
Table 5. Estimated National Average Levelized Cost of New Generation Resources in 2018
Technology Total System Levelized Cost (2011 $/MWh)
Conventional Coal $100.10
Advanced Coal $123.00
Advanced Nuclear $108.40
Natural Gas Conventional CC $67.10
Natural Gas Advanced CC $65.60
Geothermal $89.60
Biomass $111.00
Wind $86.60
Solar PV $144.30
Source: U.S. Energy Information Administration, Annual Energy Outlook 2013, December 2012
The cost‐effectiveness of smaller increments of generation has reduced the need for utilities to
periodically have large “lumpy” capital‐intensive investments and corresponding large additions to
their rate base leading to large one‐time rate increases. Since generation can be added in smaller
increments and with lead times closer to the time of anticipated need, the investment cycle has become
smoother. As compared with large generation installations, combined cycle technology is more
modular, has relatively lower capital costs than base‐load coal and nuclear plants, has been widely
adopted across the spectrum of regional markets, and has a decades‐long track record of performance.
These factors reduce the risks relating to capital and construction, making it easier for merchant
generation developers to get funding and for regulated utilities to go through the rate case process.
However, the same widespread adoption of this technology, coupled with high levels of retirement in
the coal fleet, may diminish supply diversity over time and increase volatility of electric energy prices.
An indicator of this development may be seen in the high electricity market prices that were experienced
in conjunction with high natural gas prices during 2003‐2008, followed by low power prices during the
past four years as gas prices dropped back to pre‐2000 levels.
Overall, competitive entry in wholesale markets, whether centralized or bi‐lateral, has likely bolstered
investment in combined cycle plants.232 The converse argument, that continued improvement of
combined cycle technology has augmented the movement away from the vertically integrated utility
model in deregulated states, might be deduced from the coincidence of the technology’s expansion with
the opening of markets, but the causal argument is not firm.
232 Peter Kind, Disruptive Challenges: Financial Implications and Strategic Responses to a Changing Retail Electric
Business, Edison Electric Institute (January 2013); Paul L. Joskow, “Regulation and Deregulation After 25 Years:
Lessons Learned for Research in Industrial Organization,” Review of Industrial Organization, 26 (2) (March 2005), P.
169‐193. Joskow observes that “the adoption and rapid diffusion of efficient CCGT [Combined Cycle Gas Turbine]
generating technology was stimulated by allowing competitive entry into electricity generation.”

© 2013 Navigant Consulting, Inc. Page 65 October 8, 2013
9.2 Emergence of Demand Side Alternatives
Active load control and application of energy management technologies gained prominence as utility
tools in the 1980s, and continue to see technological and economic improvements today. There has also
been near‐continual improvement in the energy efficiency of most classes of energy‐using equipment,
including but not limited to residential and commercial lighting, residential and commercial appliances,
heating, ventilation, and air conditioning (HVAC), electric motors, electronics, and external power
supplies.233 These active energy management efforts as well as efforts by utilities, regulators, and
government energy agencies to incent or mandate adoption by electricity end users of higher efficiency
equipment are collectively referred to as DSM.234 The active programs allow for the balancing of electric
supply and demand on the system by adjusting the load, rather than the traditional balancing method of
only adjusting the supply, and adoption of efficient products helps to reduce the growth rate of
electricity demand.
These technologies have affected utility operations, the electric sector’s regulatory model, and customers
in distinct ways – on the scale of scope of utility investment, on the structure of retail rate tariffs, and on
the nature of utility planning and utilities’ interaction with customers and other interest groups.
DSM‐induced reductions in load growth reduce or defer the need for new generation plant investment
and the costs of the DSM alternatives may be less than the cost of new generation. By extension, these
also reduce additions to utility rate base and the rate‐based earnings, all other things being equal.
Traditional tariff structures for electric service include monthly fixed charges, per‐kW demand charges,
and per‐kWh energy charges, and the rates under these tariffs are typically set to be sufficient to allow
the utility to recover their ongoing operating costs as well as earn an allowed rate of return on their fixed
investment. However, it is also rare that the fixed (monthly and per‐kW) and volumetric (per‐kWh)
charges are fully in alignment with actual fixed and variable costs since most rate structures recovered a
sizable portion of fixed costs and return on rate base from volumetric charges. Recognition of this raised
parallel concerns among utilities and DSM advocates – reductions in kWh sales could result in under‐
recovery of allowed earnings and/or fixed costs, and the risk of this under‐recovery could create
disincentives for utilities to participate in or embrace DSM initiatives. In some states, an early solution
for this included implementation of DSM rate adjustment mechanisms to levy surcharges on remaining
kWh sales in order to correct for the “lost” fixed cost recovery. While this approach is attractive to some
utilities and to DSM advocates and fairly easy to implement, it also led to complaints from various
parties that the customers employing DSM and receiving rate savings were being subsidized by
customers that were not employing DSM and had been generally abandoned.
233 U.S. Energy Information Administration, Annual Energy Outlook 2013 (May 2013). 234 Traditional demand side management has been practiced by utilities for many years, with and without load
control technology. Utilities have long used “interruptible” rates that provide large customers price breaks in
exchange for allowing the utility to interrupt service – or request load reductions – on a limited basis. These rates
often require the utility to contact the customer in advance and seek the customer’s permission to curtail load.
Technological advances have made DSM a much more reliable and responsive resource for utilities and grid
operators. Large blocks of DSM, often assembled by a “curtailment service provider,” are now being offered on a
larger scale in several energy markets as an alternative to capacity and/or energy.

© 2013 Navigant Consulting, Inc. Page 66 October 8, 2013
Centralized market model regions are gradually implementing market rules that seek to place supply‐
and demand‐side options on equal footing with respect to bidding into capacity and energy markets.
For instance, PJM allows energy efficiency and demand response (a type of DSM) to bid into its capacity
market, thus competing with generation to ensure capacity is available to meet future demand needs.
Traditionally regulated model regions seek to maintain equal footing for these two types of options
through integrated resource plans vetted by state regulators. In states with traditional regulation,
agreements to provide demand response other than in arrangements directly with the utility may be
viewed as the impermissible equivalent of exercising retail electric supplier choice.
Similarly, trends in energy efficiency have contributed to predictions of much lower electricity demand
growth in the future than were historically observed.235 The federal government has mandated or
incentivized energy efficiency improvements in lighting, residential boilers, clothes washers,
dishwashers, dehumidifiers, electric motors, walk‐in refrigerators and freezers, and external power
supplies among others, with the result that these items use far less energy as compared to earlier models.
In addition, 20 states have set utility Energy Efficiency Resource Standards (EERS) for electric (and
sometimes natural gas) consumption, mandating specific reductions in future demand or demand
growth, while an additional 7 states have nonbinding goals for such reductions.236 Additionally, federal,
state, and local governments are encouraging energy efficiency through appliance standards, building
codes, and energy efficiency standards for public buildings. Again, the traditional paradigm in which
vertically integrated utilities obtain earnings through the capital invested to install the infrastructure to
supply electricity is challenged by these trends. But some also argue that current trends toward lower
growth are more a result of current economic conditions rather than a long‐term trend.
9.3 Smart Grid
In the last decade, or less, ”Smart Grid” has become a hot topic in political and academic circles as well
as other groups not traditionally involved in the regular processes of the electric sector. The term
generally refers to a more integrated, information‐based, and adaptive electric system, usually involving
communication flows among users, operators, devices, and systems. Integration of the Smart Grid is
growing, as Smart Grid technologies continue to be developed, promising better grid management and
improvements to DSM. The expectation is that Smart Grid implementation will generate potential
savings to customers by providing them the tools to manage their energy consumption habits and costs,
as well as providing potential savings to utilities and their customers through operating efficiencies.
The utility savings would inure to the benefit of utilities in both types of markets. Similarly, customers
can benefit from smart meters and usage information under both models. Time of Use pricing, including
peak and off‐peak pricing, would enhance the potential for savings. To the extent that unbundled
pricing is generally only available in the retail choice structure, customers may have greater
opportunities to generate savings based on energy pricing options.
235 U.S. Energy Information Administration, Annual Energy Outlook 2013 (May 2013). 236 EERS states: Arkansas, Connecticut, Delaware, Florida, Hawaii, Illinois, Indiana, Iowa, Maine, Maryland,
Massachusetts, Michigan, Missouri, New York, Ohio, Pennsylvania, Rhode Island, Texas, Vermont, Virginia,
Wisconsin.

© 2013 Navigant Consulting, Inc. Page 67 October 8, 2013
The implementation of Smart Grid, and particularly advanced metering infrastructure (AMI), also
creates the possible need for these companies to outsource at least a portion of the associated data
management with no addition to rate base for expanded system costs. These risks are the same in both
market models. Since Smart Grid technologies are still relatively new, there is a risk to companies that
implement Smart Grid that pressure to incorporate full expectations of promised benefits will expose
utilities to unrecoverable costs if benefits do not materialize. Finally, but perhaps most substantially,
Smart Grid technologies have the potential to open up the electric system to greater risk of cyber‐attacks.
Again, these risks are the same under both market models, with the difference being that a “wires only”
company, as compared to a vertically integrated utility, may have a smaller cushion with which to
absorb these risks without seeking rate relief.
From a traditional regulated versus centralized markets model perspective, the most important impact
of a smarter grid is the potential ability for market prices for generation to be reflected at the smart
meter. The increased price transparency and the potential response by customers must be managed
directly by the traditionally regulated utility, or through market interactions in the centralized markets.
9.4 Research and Development Investment
A forecast by Battelle estimates that industrial R&D in the energy sector as a whole (not just the electric
sector) was $6.7 billion in 2012.237 The Battelle document also states that R&D investment by electric
utilities (including their contributions to the Electric Power Research Institute [EPRI]) is small when
compared to other industrial sectors and when observed in the context of the role electricity plays in our
national economy and society. These findings are based on estimates, as many electric utilities may not
be required to disclose the detail of their R&D activities. Since its formation in 1965, EPRI has provided a
vehicle that allows electric utilities to pool their resources on R&D. According to its website, EPRI’s
membership represents approximately 90 percent of all electricity generated in the United States.
However, historically, electric equipment manufacturers have provided the majority of the R&D in the
sector; this is primarily because utilities cannot necessarily internalize the benefits of the innovations
developed through R&D.238
Several studies have noted a decline in R&D investment in some areas and concluded that utility
restructuring is the likely cause.239 For the period between 1993 and 2000, R&D investment dropped
among the four entities involved in the electric sector: R&D spending from utilities dropped by nearly 74
percent, R&D spending by EPRI dropped by approximately 71 percent, government spending dropped
by 30 percent (state) and 3 percent (federal), and spending by electric equipment manufacturers declined
237 Battelle, 2012 Global R&D Funding Forecast (December 2011). 238 Sanyal and Cohen, “Powering Progress: Restructuring, Competition and R&D in the U.S. Electric Utility
Industry,” The Energy Journal, 30 (2) (2009). 239 See Burtraw et al. Electricity Restructuring: Consequences and Opportunities for the Environment. Resources for the Future, Discussion Paper 00‐39 (September 2000); Jamasb and Pollitt, “Liberalisation and R&D in network
industries: The case of the electricity industry,” Research Policy, 37 (6‐7) (July 2008); Sanyal and Cohen, “Powering
Progress: Restructuring, Competition and R&D in the U.S. Electric Utility Industry,” The Energy Journal, 30 (2) (2009);
Kim et al., “R&D investment of electricity‐generating firms following industry restructuring,” Energy Policy, 48
(September 2012); Sanyal and Ghosh, “Product Market Competition and Upstream Innovation: Evidence from the
U.S. Electricity Market Deregulation,” The Review of Economics and Statistics, MIT Press, 95 (1) (March 2013).

© 2013 Navigant Consulting, Inc. Page 68 October 8, 2013
(though by how much is unknown).240 Of particular interest is that overall energy R&D spending (public
and private, and not exclusive to the electricity sector) decreased from $5.8 billion in 1994 to $4.5 billion
in 2003.241 However, there are also studies that have come to the conclusion that the centralized market
model encourages more innovation than the traditionally regulated model.242
240 Sanyal and Cohen, 2009. 241 See Jan Martin Witte, State and Trends of Public Energy and Electricity R&D: A Transatlantic Perspective, Global
Public Policy Institute (2009). Additionally, Sanyal and Cohen found that among the aspects of restructuring, the
introduction of competition to the electric sector had the greatest negative effect on R&D investment. See Sanyal and
Cohen, 2009. Additionally, Burtraw et al. (2000) found that many analysts attribute an increase in the “availability
factor,” of generators to competition and that funding levels at major research institutions, particularly the EPRI, are
down. See Burtraw et al., 2000. Jamasb and Pollitt (2008) agreed that reforms in the electricity sector coincided with
a significant decline in R&D investment, but also notes that the productivity and innovation output of R&D in the
sector appear to have improved at the same time. See Jamasb and Pollitt, 2008. Kim et al. (2012) looked at the
impact of deregulation at 70 electric companies in 15 Organization for Economic Co‐operation and Development
(OECD) countries and found that deregulation was associated with a decline in R&D and that the existence of
wholesale markets appears to be the biggest driver of that decline. See Kim et al., 2012. The OECD member
countries are: Australia, Austria, Belgium, Canada, Chile, Czech Republic, Denmark, Estonia, Finland, France,
Germany, Greece, Hungary, Iceland, Ireland, Israel, Italy, Japan, Korea, Luxembourg, Mexico, Netherlands, New
Zealand, Norway, Poland, Portugal, Slovak Republic, Slovenia, Spain, Sweden, Switzerland, Turkey, United
Kingdom, United States. Sanyal and Ghosh (2013) looked closely at the impacts deregulation have on upstream
suppliers, and found that deregulation in the electricity sector led to a decline in innovation in upstream electric
equipment manufacturers. See Sanyal and Ghosh, 2013. 242 Joskow and Kahn, among other economists, wrote an open letter to policymakers in 2006 in which they stated
that “among economists, it is almost universally accepted that well‐functioning competitive electricity markets yield
the greatest benefits to consumers in terms of price, investment and innovation especially when regulated alternatives
are no longer warranted.” See Joskow and Kahn, Open Letter to Policymakers, June 26, 2006 (emphasis added).
Schmitt and Kucsera observed that deregulation of European utilities lead to a decline in R&D, but that once the
competitive structures were established, increased competition had a positive impact on R&D. See Schmitt and
Kucsera, “The Impact of the Regulatory Reform Process on R&D Investment of European Electricity Utilities,ʺ
Vienna University of Economics and Business: Research Institute for Regulatory Economics Working Paper: October
2012. One report found evidence of the opposite in Texas. Regulation of rate of return did not go into effect in
Texas until 1975, and Frank (2003) found that technological progress to decrease costs was more prevalent prior to
regulation and declined significantly afterwards. See Frank, Mark W., “An Empirical Analysis of Electricity
Regulation on Technical Change in Texas,” Review of Industrial Organization, 22 (4): June 2003.

© 2013 Navigant Consulting, Inc. Page 69 October 8, 2013
Public funding of energy R&D increased significantly for the first time in decades between 2006 and
2007, and again saw boosts in 2009 and 2010 due to the American Recovery and Reinvestment Act and
other policies pushed by the Obama administration.243 EPRI’s 2014 R&D plan shows a slightly higher
level of investment ($297.7 million) over that of 2013 ($288.12 million); a general breakdown of that
spending by topic is given in Table 6.
Table 6. EPRI Planned R&D Funding for 2013 and 2014
2013 R&D Funding ($million) 2014 R&D Funding ($million)
Environment $40.87 $45.00
Generation $49.75 $54.30
Nuclear $136.00 $135.80
Power Delivery & Utilization $61.50 $62.60
Source: EPRI 2014 R&D Portfolio
243 Witte, Jan Martin, State and Trends of Public Energy and Electricity R&D: A Transatlantic Perspective, Global Public
Policy Institute: 2009.

© 2013 Navigant Consulting, Inc. Page 70 October 8, 2013
10. State and Federal Government
The topic of Federal and State government jurisdiction is discussed other times in this paper, for
instance, Sections 3 and 4 address rate setting and markets jurisdiction, Section 5 discusses jurisdiction
over electric reliability and Section 8 addresses jurisdiction over resource adequacy and transmission
security planning as well as transmission siting. This section covers those aspects of jurisdiction not
discussed elsewhere in this paper. Furthermore, there are numerous articles and other texts that provide
detailed histories of the development of the current bifurcated regulatory structure.244 The focus of this
section is not on how the industry got to this point, but rather what it means for the traditionally
regulated and centralized market model participants.
The electric utility industry in the United States is regulated at the state and federal level. State
regulation extends to most areas of utility operations, rates, and end‐user issues. Federal regulation,
founded on interstate commerce impacts, generally relates to the wholesale side of the utility business,
including interstate transmission and sales of electricity for resale.
Investor‐owned utilities are subject to state regulation as to their duties to customers, system
requirements, financing arrangements, and retail rates. State law or regulation determines whether
retail access is permitted (or required). Government‐owned utilities are not generally subject to
regulation under state utility laws, but must follow the requirements of the ordinance or law establishing
them. The state regulator (for investor‐owned utilities) or the governing authority for a public power
entity is responsible for approving the ultimate rates charged to retail customers.
Under both the traditionally regulated model and the centralized market model, unbundled
transmission service rates are approved by FERC. FERC regulates the interstate transmission and
generation activities of “public utilities.” The terminology can be confusing, since utilities can be
“publicly held” in the sense of having a class of securities owned by a large group of investors, or
“public” in the sense that they are government‐owned or owned by customers. For FERC purposes,
“public utility” includes “any person who owns or operates facilities subject to the jurisdiction of the
Commission,” i.e., facilities for “the transmission of electric energy in interstate commerce” or “the sale
of electric energy at wholesale in interstate commerce.”245
Despite this broad language, however, there are numerous exclusions, with the effect that FERC does not
regulate government‐owned utilities or most cooperatives, which are often referred to as “non‐
jurisdictional” entities. To the extent government‐owned utilities participate in market transactions that
are regulated by FERC, they are subject to the same rules as other utilities, but they do not become
subject to general FERC jurisdiction.246 As a result, the “public utilities” FERC regulates for transmission
244 See, e.g., Appendix A, “History of the U.S. Electric Power Industry, 1882‐1991” and Appendix B, “Historical
Chronology of Energy‐Related Milestones, 1800‐1994,” The Changing Structure of the Electric Power Industry: An
Update, U. S. Energy Information Administration (December 1996). 245 16 USC 824(e). 246 FPA 201(f), United States, State, political subdivision of a State, or agency or instrumentality thereof exempt, but
see, FPA 215(b), Jurisdiction and Applicability.

© 2013 Navigant Consulting, Inc. Page 71 October 8, 2013
purposes consist primarily of investor‐owned utilities and entities such as RTOs and ISOs. In addition,
because most of the Texas transmission grid is not interconnected with the rest of the interstate
transmission grid except by limited DC interties, transmission in most areas of Texas is not subject to
FERC regulation.
In Texas, the state regulator is responsible for approving transmission rates (because most of Texas
transmission is intrastate) as well as regulating all other aspects of the electric utility business in Texas.
Texas has adopted full retail choice for most of the state247 and has separated ownership of wires from
generation, with the wires companies continuing to be subject to full state regulation. Transmission for
most of the state is operated by a state‐created transmission organization, ERCOT, and costs of new
transmission facilities are socialized across the entire ERCOT footprint. This is a different approach from
that used in other areas of the country, where each utility’s share of costs is determined according to
various factors, which may include a determination of the specific benefits to the utility’s customers or a
combination of socializing some costs while allocating others specifically.
Thus, FERC’s authority over the transmission grid is far from complete. The EIA calculated in 2000 that
investor‐owned utilities own approximately 73% of the transmission in the United States, with the
remainder divided between federal utilities (13%) and other public power entities, including
government‐owned utilities and cooperative utilities (14%).248
However, FERC has effectively extended many of its regulations to non‐jurisdictional utilities through
reciprocity carrots and sticks. Thus, for example, if a non‐jurisdictional utility wants to take advantage
of the terms of a public utility’s OATT, then it must itself have an OATT – the difference being that the
transmission rates will not be set by FERC. However, the other terms of service, including use of an
OASIS, must comply with FERC requirements. Similarly, under Order No. 1000, FERC did not attempt
to compel non‐jurisdictional utilities to participate in regional planning or cost allocation. However, in
order to be part of the planning process and to take advantage of proposed cost allocation mechanisms,
these non‐jurisdictional entities had to agree to participate.
247 Retail competition has been implemented for IOUs within the ERCOT zone of Texas. Municipally owned utilities
and electric cooperatives in ERCOT were given the choice to opt‐in to retail competition but in the past 11 years only
one cooperative has elected to do so. These entities are known as “non opt in entities” or NOIEs. Most of the
NOIES that owned generation did not divest their generation assets and some have built additional generation
during this time frame. Most of these entities still operate under the vertically integrated utilities business model.
IOUs in ERCOT unbundled their businesses into generating companies (either structurally or through divesting of
assets), Transmission and Distribution Service Providers (TDSPs), and Retail Electric Providers (REPs). Energy
Future Holdings and CenterPoint are good examples of this, with subsidiaries participating in each of those
segments. Retail choice has not been instituted in the Texas areas outside of ERCOT. 248 The Changing Structure of the Electric Power Industry 2000: An Update, Energy Information Agency (October
2000), http://www.eia.gov/FTPROOT/electricity/056200.pdf. There have been many changes in the structure of
the electric industry in intervening years, and these numbers may have changed slightly as new transmission has
been added; however, the fundamental proposition – that FERC does not regulate all of the owners of the
interconnected transmission grid – is the same.