Embed Size (px)
Citation preview

Charles River Associates
Page 62
A Case Study in
Capacity Market Design and
Considerations for Alberta
Appendices: Jurisdictional Reviews
Prepared for:
Alberta Electric System Operator
2500, 330 - 5th Avenue SW
Calgary, AB T2P 0L4
Prepared by:
Charles River Associates
80 Bloor St West
Toronto, Ontario, M5S 2V1
www.crai.com/energy
Date: March 30, 2017

Charles River Associates
Page 63
Appendix A: PJM Interconnection
Market at a Glance
PJM is an RTO that spans 14 states in the mid-Atlantic US. PJM’s territory includes more than 61 million
customers and total installed capacity of more than 182,000 MW. Supply in PJM is provided primarily
by similar quantities of coal, gas, and nuclear generation, complemented by smaller amounts of oil,
hydro, pumped hydro, biomass, wind, and solar resources. PJM is bordered by the Midcontinent
Independent System Operator (MISO) to the west, the New York Independent System Operator (NY-
ISO) to the north, and Duke-Progress to the south. There are significant transmission ties and
meaningful trade with each. PJM operates a day-ahead market, a real-time market, and a capacity
market, with competition by a large number of suppliers in each. Market participants include both
vertically integrated utilities and merchant generators. Retail competition in PJM’s footprint is dictated
by state policy, and provision of service by competitive suppliers is allowed in some member states and
banned in others. Likewise, member states have implemented diverse renewable and environmental
policies, as well as other economic policies that affect relative economic outcomes in the PJM markets.
PJM’s capacity market is called the Reliability Pricing Model (RPM). RPM is mandatory for LSEs in the
PJM footprint, though it provides the option for an LSE to fulfill its own requirement needs through a
carve out. RPM provides locational price signals for annual commitments to provide capacity to serve
load in PJM. Prices are set through the primary structure, the Base Residual Auction (BRA), a uniform
clearing price, sealed-bid auction that takes place three years prior to the delivery year. The auction
has a downward-sloping, administratively defined demand curve. Between the BRA and the delivery
year, there are several opportunities for the RTO to rebalance its capacity procurement needs and for
market participants to buy and sell positions. In addition to generation resources, capacity may be
supplied into RPM by demand response, energy efficiency, imports, and transmission upgrades. The
first period for which capacity was procured through RPM was 2007/2008. Prices in the unconstrained
areas of the market have averaged approximately $100/MW-day during RPM’s existence, though prices
have been as low as $16/MW-day and as high as $174/MW-day. Rule changes are common in RPM.
Currently, RPM is in the process of transitioning to a set of rules called “Capacity Performance,”
designed to provide better incentives for capacity availability during periods of system stress.
Evolution of Capacity Market Design
Beginning in 2005, PJM filed with the Federal Energy Regulatory Commission (FERC) to propose
changes to its market rules to establish RPM. In its filing, PJM stated that its markets could no longer
ensure that PJM would meet its reliability obligations in the future. PJM had been experiencing steady
load growth while facing retirement by generators citing their inability to recover sufficient revenues to
cover their costs. Some reliability criteria violations had been observed and others were likely to
manifest. PJM acknowledged problems with its prior reliability construct, which was based on short-

Charles River Associates
Page 64
term commitments and was unable to provide long-term price signals and predictable revenue streams.
Furthermore, the prior construct was also flawed in allowing capacity transactions regardless of
resource location, thus failing to ensure that capacity could be deliverable while also failing to send
appropriate price signals with respect to where new capacity would be most valuable. PJM’s proposal
to establish RPM, with its long-term, location-based price signals, sought to remedy these issues.
Moreover, PJM’s proposal to integrate RPM with the regional transmission planning process, and with
demand-side resources, would ensure that reliability could also be furthered by consideration of
transmission upgrades and development of demand response in addition to generation capacity.
RPM was eventually approved by FERC and first went into effect in the spring of 2007. Because the
first delivery year was 2007/2008, the first four auctions for delivery years 2008/2009 – 2010/2011 were
all held between April 2007 and January 2008. Since then, BRAs have moved to being conducted on
an annual basis and there have been 13 total BRAs to date. Fundamentally, the overall structure of
RPM has remained consistent. However, there have been regular revisions to the RPM rules, initiated
by both PJM and other stakeholders, to address issues that have arisen over time.
Performance of resources during peak periods. RPM faced criticism that resources that were
compensated for providing capacity did not face sufficient penalties when they failed to provide
reliability benefits during peak periods, when reliability was most at risk. In December 2014, PJM
proposed improved rules for capacity performance to address these issues. Capacity performance
rules, described in more detail in the following section, were accepted in June 2015 and
implemented for resources participating in the 2018/2019 BRA.
Market power mitigation. To which resources a minimum offer pricing rule (MOPR) should apply
has been an ongoing contentious issue throughout the history of the PJM capacity market. The
MOPR was implemented in the PJM auction rules in 2006 in response to concerns over exercise
of buyer-side market power. In 2013, PJM proposed narrowing the list of resource types that would
face a MOPR and establishing categorical exemptions for competitive entry and self-supply
resources. FERC accepted PJM’s filing, but required PJM to retain its unit-specific review
procedures. This topic remains controversial, particularly as states take different approaches to
mandating resource development in line with their economic and environmental priorities.
Demand curve. In 2014, PJM undertook its triennial review of the Variable Resource Requirement
(VRR) demand curve. An independent analysis found that the earlier concave, downward-sloping
curve failed to meet the 1-in-10 reliability objective an unacceptably high fraction of the time and
sent price signals that did not convey the incremental reliability value of capacity. PJM proceeded
to amend its VRR parameters accordingly, shifting several points on the supply curve to make it
convex and increase the likelihood of achieving the desired level of reliability. These changes were
accepted by FERC in September 2014 and implemented for the 2018/2019 BRA.

Charles River Associates
Page 65
Definition and physical nature of capacity resources. FERC and PJM have faced complaints
that some resources, particularly demand response, may be offering into the BRA on a speculative
basis. Allegedly, if prices wind up clearing below a level that would support the resource, the market
participants are then selling out of their position in the incremental auctions, which nearly always
have lower clearing prices. This raises concerns about whether reliability will be maintained in the
case that there are insufficient resources available to provide replacement capacity. Stakeholders
have argued that establishing and adhering to a stricter definition for capacity as a physical product
will solve this problem. However, no solutions have been implemented. (There are also suggestions
for improving the market rules such that incremental auctions do not have systematically lower
prices.)
Rules for committed demand response resources. Associated with capacity performance and
resource physicality, there has been nearly constant debate as to what should be expected of
demand response resources such that they should be compensated similarly to generation
resources with capacity obligations. Over time, there have been numerous rule changes that have
shifted the obligations of demand response resources and penalties for not meeting those
obligations. Such obligations include when they may be called, for how long, and with what
frequency. As with many parts of RPM, capacity performance included sweeping changes to
demand response obligations and demand resources that participate in future BRAs must be
available all year and for an unlimited number of reductions during daily peak hours. Additionally,
to address some concerns about speculative bidding by demand response, PJM has required
significant additional information in the form of a Sell Offer Plan, to be provided by curtailment
service providers (CSPs) before they may offer resources into the RPM.
Current Capacity Market Design
The stated goal of PJM’s capacity market is:
“…to ensure the adequate availability of necessary resources that can be called upon to
ensure the reliability of the grid. In PJM, the capacity market structure provides transparent
information to enable forward capacity market signals to support infrastructure investment.
The capacity market design provides a forward mechanism to evaluate the ongoing reliability
requirements in a transparent way to provide opportunity for generation, demand response,
energy efficiency, price responsive demand and transmission solutions.”
As described further below, towards accomplishing this goal, RPM’s fundamental elements are 1)
locational capacity pricing; 2) a variable resource requirement mechanism to base clearing prices on
procurement levels; 3) forward commitment of resources in a multi-auction structure; and 4) a reliability
backstop mechanism to preserve system reliability. These and other elements are described in more
detail below.

Charles River Associates
Page 66
Resource Adequacy Obligation
PJM is responsible for determining the quantity of capacity to be procured within RPM, as necessary
to serve the forecast peak load and to satisfy the reliability criterion. PJM also holds the obligation to
procure this quantity of capacity. The procurement is based on the forecast peak load plus a component
to account for additional physical capacity needs to ensure that a loss of load event is only likely to
occur once every ten years (commonly known as the “one-in-ten” criterion). This quantity, denominated
in installed capacity (ICAP) is then adjusted to account for the equivalent demand forced outage rate
(EFORd), a measure of the probability that a generator will not be available due to forced outages or
deratings at a time when there is demand for that unit to operate. The resulting procurement target is
denominated in MW of unforced capacity (UCAP), the same units that are offered into RPM by market
participants and procured by the auction.
Participation in, and payment to, the RPM by LSEs in the PJM region is mandatory unless an LSE
elects the fixed resource requirement (FRR) alternative. The FRR alternative allows for an LSE to sub-
mit and execute a plan to meet its capacity requirements outside of the RPM market. It will neither pay
RPM locational reliability charges nor will capacity resources included in the LSE’s FRR capacity plan
receive RPM clearing prices. Election of the FRR alternative for an LSE’s service area has a minimum
term of five consecutive delivery years. Load associated with service areas that have elected the FRR
alternative is deducted from the overall RPM auction procurement target.
Integrated Planning Process
PJM performs transmission planning on an annual basis that considers reliability, economic, and public
policy needs, as required by FERC orders 888, 890, and 1000. The results of this planning process,
called the Regional Transmission Expansion Plan, inform and are informed by the results of the RPM.
However, PJM does not perform integrated planning in the sense that it does not plan the timing,
characteristics, and location of generation investment in the RTO footprint. Rather, those decisions are
made primarily by private entities that participate in the RPM.
Clearing Mechanism
The RPM consists of a centralized sealed-bid auction with an administrative demand curve and a supply
curve made up of resource-specific offers. There are two types of auctions, the base residual auction
(BRA) and the incremental auction (IA). The BRA is the primary forward auction wherein PJM procures
capacity to meet its expected needs less an amount reserved for short term resources and minus any
requirements fulfilled outside the market by LSEs with an FRR obligation. The IAs take place between
the BRA and the delivery year and allow for the RTO and LSEs to procure replacement resources as
necessary. The IAs also allow the RTO and LSEs to account for additional needs dictated by reliability
requirement adjustments and to procure deferred short-term resources. Auctions are cleared by an

Charles River Associates
Page 67
optimization algorithm that seeks to minimize capacity procurement costs and considers demand
requirements, supply offers, and a variety of locational constraints.
Demand Curve Parameters
The RPM market employs a kinked, downward-sloping demand curve that PJM calls the Variable
Resource Requirement (VRR) curve, which effectively sets a price cap and a quantity cap. The VRR
curve is plotted by combining a horizontal line that stretches from the y axis to the first point (point A)
of the downward-sloping part of the curve and two straight lines from there connecting two points (points
B and C) on the downward-sloping portion of the curve, the second of which (point C) lies on the x axis.
The coordinates for the points on the VRR curve are defined administratively based on the reliability
requirement (RelReq), the installed reserve margin (IRM), cost of new entry (CONE) and expected
energy and ancillary service (E&AS) revenue for a new unit, and pool wide forced outage rate (EFORd).
The application of these parameters and the resulting VRR curve is illustrated below.
Figure 8: VRR Curve Definition
Point Price Axis Quantity Axis
A
B
C 0
Demand curves in the incremental auctions (IA) are formulated with a similar structure and based on
buy bids submitted by market participants as well as buy bids, if any, submitted by PJM. If PJM is to
place buy bids, they are based on increased capacity needs resulting from updated reliability

Charles River Associates
Page 68
requirements. In an incremental auction, PJM may also seek to release capacity procured in prior IAs
or in the BRA.
Forward Period
The RPM forward period, the time between the BRA and the delivery year, is three years.65 The IAs
take place annually in the years between the BRA and the delivery year. Each has a successively
shorter effective forward period as the time between the IA and the delivery year shortens.
Commitment Period
The RPM commitment period is one year, the delivery year. A delivery year spans portions of two
calendar years and is defined as the period from June 1 to May 31, which is the same as the PJM
planning period.
Multi-Period Commitment for New Resources
RPM includes provisions for new entry pricing, which is designed to incentivize new generation in
circumstances when the size of new entry is large relative to the size of the load delivery area (LDA).
Through this pricing mechanism, planned resources may recover their cost of entry-based offer for up
to two additional consecutive years following the first year in which the resource clears in RPM. For
new entry pricing to be available, the pricing option must be elected when the offer is submitted, where
the new entry offer would move the auction clearing result for the LDA above a certain point on the
demand curve, and the resource provider commits to offer the resource into the following two auctions
at or below a certain price level. 66
65 The FERC Order approving the settlement agreement in which the RPM was created states, “To increase the
opportunities for competition from new entry, the Settlement provides that companies providing service to customers
must contract with suppliers three years in advance to ensure that reliability goals are met and that current generators
as well as new generators can be assured of sufficient revenues to either retain their current investment in PJM, or
invest in constructing new generating units.”
66 Specifically, the PJM manual states that, to receive New Entry Pricing, a resource must agree to submit “offers into the
two immediately following BRAs (Delivery Year 2 BRA and Delivery Year 3 BRA) to sell the entire capacity of the unit
committed in the Delivery Year 1 BRA at a price equal to the lesser of (a) the price offered in the Delivery Year 1 BRA
where the resource was classified as planned generation; or (b) 90% of the Net CONE applicable in the Delivery Year
1 BRA in UCAP basis.” In the second and third years, if the resource clears at its offer price it receives that price for
each year. If it does not clear, its offer will be resubmitted to the BRA at the highest price at which it will clear. In this
case, “The new entry will receive revenues for the entire committed quantity in such subsequent year BRA based on
the sell offer price initially submitted for such subsequent year BRA. The difference between the initially submitted sell
offer price and the clearing price in such subsequent year BRA and any difference between cleared quantity and
committed quantity in such subsequent year BRA will be paid as Resource Make-Whole payments to the new entry.”

Charles River Associates
Page 69
System-wide or Locational Based
RPM accounts for the possibility that there may be capacity import limitations within the PJM footprint
caused by transmission facility limitations or voltage limitations, and that there is additional value
associated with resources located within constrained areas. PJM determines, ahead of each BRA,
potentially constrained sub-regions, called locational delivery areas (LDA). Constrained LDAs are
determined by comparing import limits by the amount of capacity that needs to be imported to meet the
reliability criterion. If an LDA meets certain criteria prior to a BRA (e.g., import limits are close to binding
levels relative to needs, there was price separation in prior auctions, etc.) it is “modeled” ahead of the
auction and the LDA-specific reliability requirement and a VRR curve will be calculated. During the
auction, if import constraints bind for a modeled LDA (i.e. economic imports exceed import capability),
prices in that LDA will separate from the rest of the market and rise to the level necessary to procure
the reliability target from resources within that LDA.
PJM has currently identified 27 sub-regions as LDAs. These are specified by different scales: regions,
zones, and sub-zones.
Resource Use of Supplementary Auctions
As described briefly above, the RPM includes annual incremental auctions that take place between the
BRA and the delivery year. The auctions allow the RTO and LSEs to procure replacement resources
as necessary and to account for additional needs dictated by reliability requirement adjustments.
Accordingly, IA demand curves are based on location-specific buy bids and PJM buy bids to procure
for increased reliability requirements. Supply curves in the IAs are based on resource-specific offers
submitted by providers and may also include locational non-unit-specific sell offers submitted by PJM
to release commitments. PJM sell offers may be due to decrease in reliability requirements or they may
need to release the commitments of an LDA with a reliability violation. Products that can be offered into
an IA include existing generation, planned generation, demand response, or energy efficiency that was
offered and not cleared in a prior auction for the same delivery year. Transmission upgrades may not
be offered into IAs.
Qualified Capacity
The RPM is designed to procure capacity denominated in unforced capacity, or UCAP. How UCAP is
calculated varies by resource type. For generators, UCAP is equivalent to the summer ICAP rating
multiplied by one minus the resource’s EFORd. For demand response resources, UCAP is equivalent
to the nominated value times the demand response factor (which adjusts for system losses) times the
forecast pool requirement (which adjusts for the fact that demand response is not subject to forced

Charles River Associates
Page 70
outages).67 The same calculation used for energy efficiency resources is also used for demand
response. Transmission upgrades are valued in terms of the increase in import capability into a
constrained LDA and do not face additional adjustments to arrive at a UCAP value.
Resource Eligibility Requirements
Generation resources in RPM may be internal or external, existing or planned. Depending on the
characteristics of a unit, the eligibility requirements vary. The most demanding qualification is
deliverability. To meet the deliverability qualification, internal resources must participate in the PJM
regional transmission planning process and have an executed interconnection service agreement and
an impact study agreement, both going into force on or before the start of the delivery year. For external
resources, it must be shown that firm transmission service has been procured to deliver capacity to
PJM by the delivery year and that the equivalent of an interconnection service agreement and system
impact study will be in place at the appropriate time. Other qualifications include providing performance
data – or using class average data for new resources – posting credit, execution of net capability tests,
and maintaining communication pathways with the RTO.
Load management (LM), a.k.a. demand response, resources in RPM are represented on the supply
side based on their ability to provide capacity through reducing metered load when requested by the
RTO. To be eligible to participate in the RPM, LM resources must submit a sell offer plan, which includes
information on the offering entity, its planned nomination amounts by location, the types of loads that
make up a resource, and details on how load reduction will be achieved. Once the sell offer plan is
approved, the market participant may offer the LM resource into the RPM auction.
Energy efficiency (EE) resources may sell into RPM by merit of their ability to achieve a continuous
reduction in electric demand that is not reflected as reductions in the peak load forecast for the delivery
year. To qualify, an EE resource much be scheduled for completion prior to the delivery year, must not
be reflected as reductions in peak load forecasts, must exceed relevant standards at the time of
installation, and achieve the committed load reductions during defined EE performance hours. EE
resources must also submit a measurement and verification (M&V) plan, establish credit, submit post-
installation M&V reports, and permit post-installation M&V audits. EE resources are eligible to receive
RPM revenue for up to four consecutive delivery years following their installation.
Transmission resources, called “qualifying transmission upgrades,” can be offered into the BRA to
increase import capability into a transmission constrained LDA. To qualify, a transmission upgrade must
67 Again, UCAP for a DR resource is equivalent to the nominated value times the forecast pool requirement. The forecast
pool requirement is determined as follows: FPR = (1+installed reserve margin) x (1 – pool-wide average EFORd).
PJM’s manual provides insight into the meaning of this metric: “While [installed reserve margin] multiplied by peak load
forecasts provides the installed capacity required to meet the reliability criterion, the Forecast Pool Requirement
multiplied by peak load forecasts provides unforced capacity values, required to meet the reliability criterion.”

Charles River Associates
Page 71
have been approved and an incremental capability must have been assigned by the PJM planning
department at least 45 days prior to the auction. Additionally, the transmission upgrade must be in
service on or before the beginning of the delivery year, must have an executed facilities study
agreement, must conform to all RTEPP standards, and must establish credit.
Resource Obligations
All generation resources that clear in the RPM auction or otherwise obtain capacity commitments must-
offer into the PJM day-ahead energy market. Likewise, demand resources that are committed in RPM
must be available any day during the delivery year during certain hours, and without a limit to the
duration of the interruption. Under the less stringent rules prior to PJM’s capacity performance (CP)
program, demand response resources in the full program option (FPO) and the emergency load
response (ELR) program must be available during PJM emergency events.
Non-Performance Penalties
Like ISO-NE, PJM is in the process of implementing revised market rules designed to align goals of the
market and incentives provided to resources; namely, to provide capacity payments to sustain resource
adequacy while also incentivizing investments and behavior to ensure that capacity resources are
available to provide energy during times of system strain. PJM’s CP program will encompass all RPM
participants by the 2020/2021 delivery year. Under CP, during performance periods driven by tight
supply conditions, resources can incur penalties or earn bonus payments by performing worse or better,
respectively, than the rest of the pool. Resources also receive a capacity payment based on the results
of the BRA, IA or bilateral transactions.
Prior to full implementation of CP, there is a transition period during which resources can opt to offer
capacity as either base capacity or as CP capacity. Base capacity has fewer obligations, includes fewer
potential penalties (and bonuses), and may include the possibility of price separation and lower prices
in the BRA. In each year leading up to full CP implementation, the RTO will procure successively less
and less base capacity.
Measurement and Verification
PJM has several assessment types to determine whether a resource is honoring its commitments and
providing expected services during the delivery year. Incentives are in place to penalize deficient
resources, and penalties are generally distributed to LSEs or over-performing resources. RPM
assessments are performed on a resource-specific basis and are not based on a market participant’s
broader portfolio. Resources that do not have RPM commitments are not subject to these assessments.
There are six types of assessments, not all of which apply to all types of resources:
Commitment compliance determines if a resource has sufficient UCAP to fulfill its requirements.
This type of assessment applies to all RPM resources. Capacity compliance is assessed daily

Charles River Associates
Page 72
during the delivery year and any shortfalls may incur a deficiency charge that is a function of the
resource clearing price and penalty factor.
Peak hour period availability measures generation resource availability during peak-hour
periods. This type of assessment applies to only non-variable generators across approximately 500
hours a year. Historical unit availability is compared to resource performance in each delivery year.
If there are shortfalls relative to the expected availability and performance levels, resources are
charged penalties (which may be retroactive). This assessment type will be replaced by CP rules.
Seasonal capability testing determines whether a generation resource can demonstrate its ICAP
commitment amount. This type of assessment applies to non-variable generation, though hydro
resources are only responsible for summer testing. For units to which this assessment applies,
resource owners must perform at least one successful test per season to prove their max
generation capability. If there are shortfalls, resources may be subject to test failure charges.
Peak season maintenance compliance determines if a resource took unapproved outages during
the peak season. This type of assessment applies only to non-hydro, non-variable generators. Units
that are unavailable due to an unapproved, unforced outage may be assessed a PSM compliance
penalty charge. Forced outages are not accounted for here, but through other assessment types.
This assessment type will be replaced by CP rules.
Load management event compliance determines load reduction during load management
events. This type of assessment applies to only demand response resources, and demand
response is differentiated by zone. Compliance is checked after each PJM-initiated load
management event and may be assessed based on a resource’s ability to drop to a pre-set level,
drop by a pre-set amount, or to comply with a load control signal. Penalty rates depend on whether
the period was on- or off-peak, and total penalties are capped at the level of annual revenues. This
assessment type will be replaced by CP rules.
Load management test compliance determines load reduction during a test period initiated by a
demand response provider. This type of assessment applies to demand response resources only
and is necessary if there is a summer season that does not have a PJM-initiated load response
event. Before a test, a CSP informs PJM of its intent to test at least two days in advance. During a
test, a CSP must call upon all of its resources of a given type on a non-holiday weekday for one
hour. Re-tests are allowed, though resources that do not pass a re-test are charged for any shortfall.
Non-performance assessment is a more uniform assessment type to be applied to most resource
classes as part of the CP rules. Non-performance assessments are performed during each hour or
partial hour during which PJM declares certain emergency conditions, called “performance hours.”
While the calculations for non-performance are similar to those above, the administration is simpler
and the penalties are larger. Additionally, any revenues that are collected from underperforming

Charles River Associates
Page 73
resources may be provided as bonus payments to any other kind of resource, including resources
without capacity commitments.
Cost Recovery Mechanism
The cost of capacity resources procured through the RPM auctions is primarily allocated through
locational reliability charges. Locational reliability charges are paid by LSEs. They are calculated as the
product of the LSE’s daily unforced capacity obligation and the final zonal capacity price for the delivery
year. The daily unforced capacity obligation is the product of an LSE’s peak load obligation, which is
based on the LSE’s contribution to the zonal peak demand, and the zonal peak capacity obligation
divided by the zonal weather normalized peak. Effectively, this formulation scales the LSE’s capacity
obligation by expected weather-driven variance in the delivery year. The capacity charges are
calculated daily and settled weekly. LSEs then pass the costs associated with their capacity needs to
consumers through state jurisdictional retail electricity tariffs.
An alternative to cost recovery via locational reliability charges is necessary for resource providers who
have to purchase replacement capacity through an IA. In the instance that a resource provider
purchases replacement capacity, that resource provider is responsible for the cost of the replacement
capacity.
Market Power Mitigation
Efforts to mitigate market power in RPM are multifaceted. RPM contains a minimum offer pricing rule
(MOPR), which is designed to prevent the exercise of buyer side market power, which could be
accomplished should an LSE attempt to suppress market clearing prices via low resource bids, which
it might do in order to reduce its total price for a larger volume of capacity purchased.68 Thus, the MOPR
68 The MOPR screens apply to:
• Generation Capacity Resource 20 MW or greater, based on a combustion turbine, combined cycle, or integrated
gasification combined cycle generating plant;
• Uprates to a Generation Capacity Resource of 20 MW or greater, based on a combustion turbine, combined cycle
or integrated gasification combined cycle generating plant;
• Repowering of an existing plant 20 MW or greater whenever the repowered plant utilizes combustion turbine,
combined cycle or integrated gasification combined cycle technology;
• External resource that entered commercial service on or after January 1, 2013, that meet the aforementioned
criteria and that require sufficient transmission investment for delivery to the PJM Region to indicate a long-term
commitment to providing capacity to the PJM Region;
The MOPR then does not apply to:
• Any Generation Capacity Resource that is not a combustion turbine, combined cycle, or integrated gasification
combined cycle generating plant, such as nuclear, coal, wind, hydro, solar or landfill gas facilities;
• ICAP equivalent (measured at time of clearing), of any of a resource’s UCAP cleared in any auction prior to
February 1, 2013;

Charles River Associates
Page 74
ensures that new resources are offered into RPM auctions on a competitive basis. This is achieved by
applying a screening process to determine whether a new resource offer is competitive. The screen is
applied to any new or uprated resources or imports that are 20 MW of ICAP or larger and consisting of
combustion turbines, combined cycle power plants, or integrated gasification and combined cycle
plants. The screen does not apply to resources that are considered ill-suited to the exercise of market
power, including nuclear, coal, wind, hydro, solar, and landfill gas. Screened resources may not bid below
100% of the net CONE for that asset class unless they receive an exception or clear in an RPM auction.
In addition to the MOPR rules, PJM rules apply additional scrutiny to market conditions in transmission
constrained areas. Following a RPM auction, the RTO performs a market structure test for any LDAs
that have separated in price from the rest of the region. Where the market structure test is failed, the
RTO will apply market seller offer caps to all relevant bids and rerun the auction at the mitigated offer
levels. A resource fails the market structure test, called the “three pivotal suppliers” test, if it has fewer
than four pivotal suppliers offering incremental supply. The incremental supply includes generation
resources that are available to solve the constraint applicable to a constrained LDA offered at less than
150% of the cost-based clearing price (when the PJM algorithm uses only the lower of price- or cost-
based offers).
Market seller offer caps are set at the avoidable cost rate for the resource less any expected energy
and ancillary service market revenues, as determined by the market monitoring unit (MMU). Exceptions
to the market seller offer caps may also be granted by the market monitor. The avoidable cost rates
are set the by the market monitor and represent the fixed annual operating expenses that would not be
incurred if a unit were not a capacity resource for a year. For example, if a unit is mothballed for a year,
the cost of maintaining that unit in working order and acceptable state of repair for return to the next
year’s capacity market would be the avoidable cost rate.
Capacity Market Performance
PJM’s MMU performs an annual assessment of the market structure, participant conduct, and market
performance. The MMU’s 2015 report, which covered the period through the 2019/2020 BRA, found
the overall market performance to be competitive. As in most years, PJM was able to procure capacity
to meet expected peak load plus a reserve margin. However, both the aggregate and local market
structures were found to be “not competitive.” The MMU explains that such results are to be expected
given that, by design, capacity markets are nearly always tight because total supply is only slightly
• Uprates receiving an exception under the unit-specific process for an auction prior to the commencement of the
2016/17 Delivery Year, and clearing in that BRA;
• Cogeneration certified or self-certified as a Qualifying Facility, where the Capacity Market Seller is the owner or
has contracted for the Unforced Capacity of such facility and the Unforced Capacity of the unit is no larger than
approximately all of the Unforced Capacity Obligation of the host load, and all Unforced Capacity of the unit is
used to meet the Unforced Capacity Obligation of the host load.

Charles River Associates
Page 75
larger than total demand, both on a local and regional basis. Thus, there are persistent conditions in
which individual suppliers are pivotal and in which the “three pivotal suppliers” test is failed. To eliminate
such circumstances would require significant dilution of capacity ownership, and such change is not
likely. Nonetheless, competitive outcomes can be preserved through appropriate market power
mitigation, as has been applied by PJM.
In May 2016, the PJM also issued a broader report on the effectiveness of competitive markets in
stimulating resource investment, which includes thoughts on RPM. The report poses the question of
whether PJM’s organized markets are efficiently and reliably managing the entry and exit of supply
resources even as external conditions create uncertainty. First, investment in new capacity has been
significant in the PJM region. Between 2010 and 2015, more than 134,000 MW has entered the PJM
interconnection queue and much of that capacity has been completed or remains under development.
The abundance of merchant development suggests adequate returns are being attracted to secure
capital and PJM’s modeling suggests that actual returns are appropriate given expected levels of risk,
thus diminishing the likelihood of over-procurement. Second, PJM found no evidence that its markets
were failing to provide adequate returns to legacy units, which would cause premature retirement of
economically viable generators. Rather, PJM markets produce efficient price signals that lead to the
timely retirement of uneconomic legacy resources on similar schedules that would be observed in a
regulated environment.
Despite the general success of RPM to date, and with acknowledgement of the merits of CP, the MMU’s
recent reports recommend a number of continued improvements to the capacity market rules. Two of
the most relevant high priority recommendations include:
Definition and physicality of capacity resources. The MMU recommends that there be
enforcement of a single, consistent definition of capacity resources. Specifically, the MMU
recommends that all capacity resources making offers be required to demonstrate that they
represent a physical resource when they first qualify to participate in RPM. This has proven to be
a particularly contentious issue– spanning many years of FERC proceedings – with demand
response resources that have faced allegations of offering into the BRA on a speculative basis prior
to selling out of their commitments in the incremental auctions.
Consistency between energy and capacity markets. The MMU recommends that calculations
that result in the formation of the demand curve better reflect the capabilities of the units in the
market. Specifically, units may be more flexible in the energy markets than the block-loaded manner
in which they are represented in the calculations for net CONE. The result would likely be a
calculation of higher net revenues outside of the capacity market and associated reductions in the
demand curve parameters.

Charles River Associates
Page 76
PJM has also begun to grapple with the complexities of reflecting public policy requirements in the rules
of its wholesale markets, particularly the capacity market. These issues have been brought to the
forefront in several jurisdictions within the US—such as in the PJM footprint taking place in Illinois and
Ohio--where the local utilities have aggressively lobbied the state legislatures and regulators to provide
subsidies to certain legacy resources. Such developments have prompted PJM stakeholder
discussions focused on how to ensure fidelity of the price and quantity procured in RPM while states
pursue a range of policy priorities. One early proposal from the market operator is to run the RPM
auction in two stages, one with and one without subsidized resources. This discussion is ongoing.

Charles River Associates
Page 77
Appendix B: New England ISO (ISO-NE)
Market at a Glance
ISO-NE is an RTO in the US that spans the six New England states. ISO-NE’s territory has a population
of 14.7 million and a peak demand of just more than 28,000 MW. Approximately half of all electricity
generated in ISO-NE is provided by gas-fired generators, and more than half of the balance comes
from nuclear power. Renewables and hydro make up much of the rest of the generation mix, and ISO-
NE has large transmission interconnections to import hydropower from Quebec as well as
interconnections with New Brunswick. Coal and oil play a small and shrinking role. Aside from Canadian
interconnections, ISO-NE borders NYISO to the south. ISO-NE has more than 400 participants in its
day-ahead, real-time, and capacity markets. Generation ownership is entirely unbundled in the ISO-NE
footprint and Vermont is the only state in which retail competition is not allowed. State policies in ISO-
NE are progressive, which has led to robust growth of wind power, solar power, and energy efficiency.
Furthermore, all of the New England states participate in the Regional Greenhouse Gas Initiative
(RGGI), a regional carbon cap-and-trade market.
ISO-NE’s capacity construct is called the forward capacity market (FCM). Participation in FCM is
mandatory for LSEs in the ISO-NE footprint and provides locational price signals for annual
commitments to provide capacity to ensure reliability. FCM was largely born of a settlement agreement
in 2005.69 The primary competitive structure is the forward capacity auction (FCA), a descending clock
auction that allows for active participation. Cleared resources take on a one-year commitment to provide
capacity three years in the future. Between each FCA and the ultimate commitment period, there are
several opportunities for resources to buy and sell capacity position. The first FCA took place in 2007
for the delivery period covering the end of 2010 and beginning of 2011. Since then, in the 10 completed
FCAs the market has most frequently cleared at the floor price, which has fluctuated between $2.93
and $4.50/kW-month. Recently, however, region-wide prices have risen to upwards of $7/ kW-month
and as high as $17.73/ kW-month in constrained areas. Rule changes are frequent in ISO-NE and FCM
is currently transitioning to a revised downward-sloping demand curve and a pay-for-performance
(PFP) regime that seeks to align compensation incentives with the goal of encouraging market
participants to be available during peak periods.
Evolution of Capacity Market Design
Prior to this 2003, ISO-NE had an installed capacity requirement for LSEs based on peak load plus a
reserve margin. If an LSE did not have sufficient capacity, it could buy from the pool or pay a penalty.
69 Devon Power LLC, 107 FERC ¶ 61,240

Charles River Associates
Page 78
In 1998, ISO-NE began operating a bid-based market for capacity. Over time, weaknesses were
identified in this system, including a lack of a locational component and the frequent need for ad hoc
arrangements to keeping critical units online. In 2003, FERC ordered ISO-NE to file changes to its
market rules to create a locational capacity market. Between 2004 and 2007, ISO-NE made several
filings in a contentious proceeding that eventually resulted in a settlement agreement and the
establishment of FCM. In 2007, the final rules were accepted by FERC and the first auction was
scheduled for 2008 for the 2010/2011 delivery period. Between 2006 and 2010, ISO-NE facilitated the
transition from the old construct to FCM, providing fixed capacity payments to all resources during this
period at an administratively set level. Since then, FCM has settled into performing annual forward
auctions as well as interim supplemental auction. Regular changes have been made to improve the
market outcomes and provision of capacity as a service. Particular attention has been paid to mitigating
unnecessarily severe price volatility and improving capacity resource performance.
Demand curve. In its initial form, FCM used a vertical supply curve to clear the FCA. This fixed
demand requirement led to significant price volatility, exacerbated by the “lumpy” nature of capacity
investment. Volatility at such levels was seen as a detriment to both supply and demand, providing
uncertain future revenues and difficult-to-hedge price shocks. A sloped demand curve was
determined to mitigate volatility while resulting in prices that better reflect the incremental value of
capacity. These changes were accepted by FERC in May 2014 and implemented for the FCA 9
and the 2018/2019 delivery year. As described in more detail below, ISO-NE continues to make
changes to its sloped demand curve parameters aimed at improved auction results.
Performance of resources during peak periods. ISO-NE recognized that capacity resources,
while used on a day-to-day basis, are needed most during periods of system stress. Thus, it was
important to implement rules to extend capacity resource incentives beyond just availability;
performance also needed to be valued explicitly. In January 2014, ISO-NE proposed improved
rules for PFP to address these issues. The PFP rules, described in more detail in the following
section, were largely accepted in May 2014 and implemented for resources participating in the FCA
9 for the delivery year 2018/2019.
Market power mitigation. Like other RTOs, ISO-NE has struggled with determining how to apply
MOPR rules to alternative resource types to mitigate possible exercise of buyer-side market power.
The MOPR was implemented in the ISO-NE market rules in 2011 following requirements stipulated
by FERC. The rules that the commission accepted required application of the MOPR to all
resources, including self-supply and state-sponsored public policy resources. However, FERC left
open the possibility for resources to request exemptions from mitigation rules. In 2014, ISO-NE
proposed and had approved a MOPR exemption for renewable capacity resources. This topic
remains controversial, particularly as states take different approaches to mandating resource
development in line with their economic and environmental priorities.

Charles River Associates
Page 79
Rules for committed demand response resources. Associated with concerns over appropriate
compensation for performance of capacity resources, ISO-NE has worked to revise its rules to
create comparable obligations and incentives for demand response resources with capacity
obligations. Related to PFP rule revisions are changes to ISO-NE’s economic demand response
program that will go into effect in June 2018. With these changes, demand resources will now
adhere to ISO-NE’s uniform capacity product definition, resource-neutral obligations, and the PFP
incentives structure. Among other things, demand resources with capacity obligations will have a
must-offer requirement in the day-ahead market and face penalties for failing to be available during
peak periods.
Current Capacity Market Design
ISO-NE’s stated goal of the FCM is:
“[to ensure] that the New England power system will have sufficient resources to meet the
future demand for electricity…[FCA] payments help support the development of new
resources. Capacity payments also help retain existing resources…They also serve as a
stable revenue stream for resources that help meet peak demand but don’t run often the rest
of the year.”70
Resource Adequacy Obligation
ISO-NE is responsible for determining the quantity of capacity to be procured within FCM, as necessary
to serve the forecast peak load and to satisfy the reliability criterion. ISO-NE also holds the obligation
to facilitate procurement of this quantity of capacity. The procurement is based on the forecast peak
load plus a component to account for additional physical capacity needs to ensure that a loss-of-load
event is only likely to occur one day every ten years (commonly known as the “one-in-ten” criterion).
The resulting quantity is called the installed capacity requirement (ICR). To reflect the significant import
capacity provided by transmission interconnection with Hydro-Quebec, the ICR is reduced to account
for what are termed Hydro-Quebec interconnection credits (HQICC), and the difference is the net
Installed capacity requirement (NICR). The FCA demand curve revolves around the NICR. 71
Participation in FCM by LSEs in the ISO-NE region is mandatory. There is no alternative structure
because all load-serving utilities in the New England region have fully divested their generation.
70 ISO New England, “Forward Capacity Market.” Available at https://www.iso-ne.com/markets-opera-
tions/markets/forward-capacity-market
71 ISO-NE customers with HQICC credits are assumed to use those credits to meet the portion of capacity needed
between the NICR and the ICR.
Charles River Associates
Page 80
FCM qualified resources may be variable, non-variable, or associated with an internal elective
transmission upgrade (ETU). Also, the capacity associated with modifications to existing resources may
count as a new resource under certain circumstances. Resources may also take the form of demand
resources, imports, and external ETUs.
Integrated Planning Process
ISO-NE performs transmission planning on a biennial basis that considers reliability, economic, and
public policy needs, as required by FERC Orders 888, 890, and 1000. The results of this planning
process, described in the Regional System Plan, inform and are informed by the results of the FCM.
However, ISO-NE does not perform integrated planning in the sense that it does not plan the timing,
characteristics, and location of generation investment in the New England region. Rather, those
decisions are made primarily by private entities that participate in the FCM.
Clearing Mechanism
ISO-NE’s FCA uses a descending clock auction format, which allows participants to adjust their offers
through successive auction rounds based on real-time information. Descending clock auctions are
thought to be transparent and efficient and are generally used to obtain the lowest price when bidders
in an auction are selling the same product at different costs. At its most basic level, a descending clock
auction starts at a high price, at which it is likely that more than enough product is available to meet
general and locational needs. During the auction, prices drop and information is provided to participants
as to how close the buyer, ISO-NE, is to achieving its procurement goal. In successive rounds, some
participants will determine that the auction price has fallen below the revenue needed to make a
resource profitable and those participants will withdraw their offers from the auction. This process is
repeated and prices drop until the point at which the demand curve intersects what is left of the supply
curve.
There are both basic and more advanced rules regarding resource participation and price setting. At a
basic level, existing resources can choose either to take no action and clear as price takers, or to submit
one of a number of types of delist bids. Above a certain price level, delist bids are static and submitted
as part of the resource qualification process. Below that pre-set price level, participants with existing
resources may submit dynamic delist bids during the auction. However, unlike existing resources, new
resources must offer order to have a chance of clearing, and they will clear if they offer below the
auction clearing price. Thus, the auction clearing price must be set by either delist or new entrant offers;
they cannot be set by an existing resource that is not considering delisting. Following are some exam-
ples of when a resource can place an offer:
If a resource is repowering or increasing its capacity, those respective quantities of capacity may
participate as new resources.

Charles River Associates
Page 81
In the same auction, two resources may compete for the same interconnection capacity. In this
circumstance, the resource that is earlier in the interconnection queue is the only resource
considered until it withdraws its offer, after which the later resource’s offer is considered.
Resources with complementary seasonal characteristics may submit composite offers.
Resources may indicate that they may be rationed, allowing the auction to clear some, but not all,
of a unit’s capacity, though the auction will not produce a result below a resource’s economic
minimum limit.
Resources may indicate that they are providing self-supply capacity.
Demand Curve Parameters
Starting with the 11th FCA, ISO-NE will transition from using a linear sloped demand curve to a convex
sloped demand curve. This change responds to the use of vertical demand curves, which had
contributed to significant price spikes in prior auctions, followed by constant sloped demand curves,
which had been criticized as leading to surplus procurement. When it is completely implemented, which
will take place either by the 14th FCA or when other present conditions are met, the marginal reliability
impact (MRI) curve will be a single, convex, downward sloping segment connecting a horizontal line to
the x-axis. The shape of the curve will be determined through iterations of the GE-MARS model, which
is used to calculate ISO-NE’s installed capacity requirement. The CONE value will determine how
steeply the MRI curve rises at different levels of quantity. Prior to full implementation of the MRI curve,
there will be a transition period that calls for a stepped, downward-sloping curve with convex and
constant sloped portions. For ISO-NE regions that are import constrained, separate demand curves
are calculated prior to the FCA.
Figure 9: Marginal Reliability Impact Curve
Charles River Associates
Page 82
Forward Period
The FCM forward period, the time between the FCA and the delivery year, is three years. That “is
intended to provide for a planning period for new entry and allow potential new capacity to compete in
the auctions.”72 The reconfiguration auctions (Ras) take place annually in the years between the BRA
and the delivery year. Each has a successively shorter effective forward period as the time between
the RA and the delivery year shortens.
Commitment Period
The FCA commitment period is one year, the capacity commitment period (CCP). A CCP spans
portions of two calendar years and is defined as the period from June 1 to May 31, which corresponds
to the ISO-NE “power year.”
Multi-Period Commitment for New Resources
When a new resource submits offers into FCA, it may select a commitment term of up to seven years,
in full CPP blocks. If such a new resource clears, it is committed to provide capacity for the entire
selected number of CCPs and receives the FCA clearing price for its first FCA for the duration, adjusted
for inflation.
System-wide or Locational Based
The FCA descending clock auction begins with a single system-wide price. However, zones that may
be constrained are modeled ahead of the auction and transfer limits are set for those zones. If a limit
binds during the auction, the clock for that capacity zone may stop and set the price for that capacity
zone. In this way, FCA has location-based pricing in instances where capacity is short within a zone
and transmission constraints limit imports to alleviate the shortfalls.
Prices may also differ by location due to import constraints that lead to inadequate supply conditions or
insufficient competition conditions. An inadequate supply condition takes place when the total supply
offered is less than the local sourcing requirement. This condition has been determined to indicate that
the area is not competitive, and leads to the triggering of administrative pricing rules that set one price
for existing resources in the capacity zone and sets the price for new resources at the auction starting
price. An insufficient competition condition takes place when existing capacity is less than the local
sourcing requirement and new offered resource quantities meet several conditions that indicate that
the new resources that should have set the price are not actually competitive. If these conditions are
met, new resources are payed the clearing price set by non-competitive new resources and existing
72 Devon Power Order accepting settlement agreement that established the ISO-NE FCM.

Charles River Associates
Page 83
resources are paid an administrative price (unless the new resource clearing price is lower than the
administrative price).
Resource Use of Supplementary Auctions
There are numerous opportunities after an FCA to transact to gain or release a capacity supply obliga-
tion (CSO). There are six annual events – two in each of the three years prior to the CPP – consisting
of three annual CSO bilateral periods and three annual reconfiguration auctions. There is also one
monthly CSO bilateral period and one monthly reconfiguration period for each month of the delivery
year.
Bilateral CSO transfer periods allow for resources with a CSO to shed a CSO to another resource with
greater qualified capacity than its existing CSO. These transactions can be done on an annual basis,
or can be done monthly, close to, and during, the delivery period. Monthly CSO bilateral transactions
can take into account transmission and generator outage schedules approved for the delivery month.
CSO bilateral transactions are divided into the same zones modeled for the FCA. CSOs can be
transferred between zones as long as they respect LSRs for import constrained zones, maximum
capacity limits for export-constrained zones, and capacity transfer limits at external interfaces. Bilateral
CSO transfers may be associated with a price associated with the MW transferred.
Reconfiguration auctions allow FCM participants to accomplish the same objectives as bilateral
transfers, acquiring and shedding CSOs, though without an arranged counterparty. Additionally, during
the annual reconfiguration options, the ISO itself may also sell excess capacity and procure additional
capacity, as needed. Reconfiguration auctions are static double auctions, where the supply and
demand bids are made up of bids and offers by market participants and, potentially, the ISO. The
auction algorithm seeks to maximize social welfare, accounting for capacity zones and other transfer
constraints. No counterparty is needed to participate in a reconfiguration auction, as the auction
determines prices and quantities to be transacted.
Qualified Capacity
ISO-NE’s FCM establishes procurement requirements in units of installed capacity (ICAP) and procures
in those units as well. Capacity quantities that may be sold into FCM are not adjusted to account for
forced or unforced outages (i.e., to calculate a UCAP), but they may be reduced to account for failure
of a resource to perform at the qualified capacity level in prior years. Separately, qualified capacity for
variable resources is adjusted to account for intermittency of the energy source being relied upon.
Resource Eligibility Requirements
The process for establishing resource eligibility requirements vary for existing and new capacity. For
existing resources, the ISO begins by notifying resources, those that have held CSOs in the past, of
their qualified capacity. Qualified capacity is determined based on historical performance, covering all

Charles River Associates
Page 84
hours for dispatchable resources and a subset of peak hours for variable resources. That is, if an
existing resource has failed to perform at a level that it claimed it could (and sold as ICAP) it may not
be allowed to sell at that level in future auctions. Market participants have an opportunity to challenge
the ISO’s qualified capacity determinations. Following the challenge process and before the auction,
participants can submit bids related to their existing resource. Such bids may include delist bids,
composite offers, of self-supply designations. Existing resources that do not submit a bid will be entered
into the FCA at their qualified capacity level as a price taker.
New resources must go through the ISO-NE capacity qualification process, which requires them first to
submit a show-of-interest (SOI). The SOI form applies to all resource types and contains all necessary
project information, including proposed MW of capacity and the interconnection point. Generation
resources must have a valid interconnection requires prior to submitting an SOI form and must agree
to pay for certain ISO-NE expenses during the qualification process. Following the SOI submission,
ISO-NE performs an interconnection analysis to identify impacts on the ISO-NE transmission system.
To continue in the qualification process, the project sponsor then must submit a new capacity
qualification process, which contains, among other things, detailed information on the development
plan, project costs, and, for variable resources, data on the renewable power source. The ISO then
reviews the qualification package and makes a determination about qualification and whether a project
has been accepted or denied. Once a project is accepted, the sponsor must register as a market
participant and post financial assurance (which is returned upon a project’s commercial operation).
A variable resource’s qualification is based on the average of the median measured energy production
during defined reliability hours and interconnection analysis findings. Non-variable resource qualifica-
tion is based on initial interconnection analysis findings. Demand resource qualification can be based
on three alternative measurement types, which are different from those for energy efficiency, distributed
generation, and load management.
Resource Obligations
For resources with a CSO, obligations vary by resource type.
Planned outage reporting: Required for all generating capacity resources and import capacity
backed by an external resource. Not required for demand resources and import capacity resources
backed by a control area.
Audit and rating obligations: Required for all generating capacity resources. Demand resources
must comply with measurement and verification (M&V) provisions.
Energy market offers: Generating resources must-offer into day-ahead and real-time energy markets
whenever and to the extent that the resource with the CSO is available. However, day-head offers for
variable resources are optional. Import resources must submit external transaction to both energy

Charles River Associates
Page 85
market for every hour. Demand resources do not currently participate in the energy markets, but will
begin to do so again as of June 2018 (planned). When they do, they will have a requirement to offer
into both energy markets.
Non-Performance Penalties
ISO-NE has implemented a PFP mechanism that establishes penalties and bonuses for performance
of CSO resources during shortage events. PFP goes into effect in 2018, starting with the 9th FCA and
the associated CCP, and is designed to substitute for EFOR-type metrics that associate performance
with average unit unavailability. The PFP rules apply to non-variable generator resources, imports, and
demand response.
The PFP provisions stemmed from concerns that, though there is the possibility for additional resource-
related investments that hold the promise to decrease performance risk (e.g. dual-fuel capability, non-
interruptible fuel contracts, etc.), the market rules have provided insufficient incentives to justify such
investments. To remedy this, the new market rules reward output during shortage conditions and allow
suppliers to identify efficient mechanisms for accomplishing that output. Performance measures are
redefined accordingly, shifting away from availability-type metrics, and any associated financial risks
and rewards are placed on suppliers. The design of PFP compensation has a base payment and a
performance payment, where the base payment is based on the auction results and the performance
payments, which may be positive or negative, are based on performance during capacity shortage
conditions. Capacity buyers ultimately pay the base payment and performance payments are structured
to be transferred to over-performing suppliers from under-performing suppliers. Performance is
measured against the pool average during an event, so resources with average performance neither
earn bonus payments nor incur penalties. Penalties rates are administrative and set before the FCA for
the relevant CCP, while bonuses are set based on the pool of penalties.
Until PFP is implemented in 2018, ISO-NE has an interim rule set. Under these rules, resource perfor-
mance is measured during shortage events, which take place when reserves fall below a certain level.
Generation resources that do not meet their obligations –that is, their available MW is below the CSO
MW – during these hours are penalized. Penalties for generation resources are capped across certain
time spans at levels related to their total annual capacity revenues. For example, no resource can lose
more than 2.5 months of capacity revenue in any one month. Demand resources that underperform
relative to their CSO may make up for it by over-performing during a different event in the same month.
There are no caps on penalties for demand resources.
Measurement and Verification
Given the implementation of PFP, measurement and verification (M&V) is primarily a concern for
demand response resources. In this context, M&V provides the procedures for determining demand
resource performance during an event. For dispatchable assets responding to dispatch signals,
Charles River Associates
Page 86
performance is measured based on the difference between actual usage and a historical baseline.
Baselines are calculated using five-minute interval meter data and/or metered output from a distributed
generator that is submitted to the ISO. When resources are called, baselines are adjusted for weather
conditions, recent load levels, and for any recent demand response calls. Performance can then be
calculated based on the difference between the baseline load, the actual load, and the number of MW
that were called on to respond by the ISO.
For non-variable generators, the ISO performs claimed capability audits (CCA) of seasonal claimed
capacity (SCC) values of resources. During an audit, the ISO seeks to establish the generators ability
to respond to ISO dispatch instructions and maintain output at a specified level and duration. A general
audit is performed once when the resources has just entered commercial operation. Then, on a regular
basis, the resource may be audited to test a generators ability to perform under summer and winter
conditions. Durations vary by resource type. During an audit the resource must respond to an ISO
dispatch instruction during the business day at an unannounced time and date.
For variable generators, seasonal capability is based on measured and recorded site-specific summer
and winter data. This information is provided when the resource submits a qualification package to
participate in the FCM.
Cost Recovery Mechanism
FCM payments to resources are based on any credits earned through FCA, bilateral transactions, or
reconfiguration auctions, minus any PER adjustments (described below), performance penalties, and
credits/incentives. FCM charges are applied to each capacity zone, customer, and load asset. FCM
settlement must balance at the zonal level, and settlement is performed on a monthly basis during the
CCP, with final billing completed approximately four months following the delivery month. FCM charges
are billed to all LSEs with a capacity load obligation (CLO) at a level equivalent to the product of the
CLO and the applicable net regional clearing price (NRCP). The CLO is based on a capacity
requirement–calculated based on peak load contributions--adjusted for self-supply, bilateral
transactions, and any Hydro-Quebec interconnection credits. NRCPs are separate from auction
clearing prices and equal to the sum of total payments paid to CSO resources in the capacity zone–net
of PER adjustments, excluding bilateral transactions, and adjusted for performance penalties–divided
by the sum of capacity supply obligations not served through bilateral transactions or self-supply.
Settlement resulting from FCA outcomes may be affected by the peak energy rent (PER) adjustment.
PER adjustment was designed to discourage the exercise of market power in the energy market by
creating a transfer from capacity sellers to capacity buyers during the highest price periods. The PER
adjustment reduces capacity payments for all generation resources when prices in the real-time energy
market go above a certain threshold level (i.e., the strike price), which usually occurs when electricity

Charles River Associates
Page 87
demand is high.73 The PER adjustment does not affect the incremental incentives to produce energy
because a resource’s PER adjustment will be the same regardless of whether it produces energy. In
addition, the PER adjustment was designed as a hedge for load against price spikes in the energy
market. By design, capacity suppliers were intended to make up a roughly equivalent quantity of
revenue by receiving higher prices in the capacity market to account for the PER adjustment.
LSEs in ISO-NE are the entities that pay FCM charges, which are considered wholesale transactions.
The LSEs then pass the capacity charges through to retail customers through the state-jurisdictional
retail tariff.
Market Power Mitigation
Buyer side market power mitigation is applied to new resources until the resource has cleared on FCA.
This mitigation attempts to prevent instances where buyers of capacity may have the ability and
incentive to suppress prices below competitive levels in order to lower their capacity procurement
prices, which could be accomplished by subsidizing new entry or other mechanisms that would lead to
resources entering the market at prices below their costs. The ISO-NE internal market monitor (IMM)
mitigates the exercise of market power through two mechanisms in the FCM. First, by establishing
dynamic-delist bid thresholds and, second, by establishing technology-specific offer review trigger
prices (ORTP). Bids above, or offers below, the established thresholds are reviewed by the IMM.
The ISO-NE MOPR construct depends on ORTPs, which represent the benchmark prices, by technol-
ogy, of a low-end estimate of the net cost of new entry. ORTPs are set for different types of generators,
imports, and demand resources. Resources may request a waiver from the resource-specific ORTP.
Obtaining such a wavier requires a submission that includes supporting documentation to be evaluated
by the IMM. Resources that do not make such a request have their new resource offer floor set at the
ORTP. If an auction falls below the new resource offer floor price, the project is removed from the
auction.
Capacity Market Performance
In its assessment following FCA 10, the external market monitor (EMM) noted progress in facilitating
competitive outcomes in FCM, but also the need to continue to identify factors that may inhibit
participation by new resources or otherwise reduce competition. Leading up to FCA 10, the prior four
auctions had limited participation from new generation, leading to pivotal suppliers and non-competitive
conditions in several capacity zones. However, FCA 10 cleared more than 1,500 MW of new capacity
supply, with participation by an additional 5,000 MW of resources. These new resources serve to
73 The strike price is set at the price of generating by a peaking unit (22,000 BTU/kWh) indexed to certain local fuel prices
(the higher of oil or gas).

Charles River Associates
Page 88
discipline the market while ensuring that there are sufficient resources to meet demand and the reserve
requirement. The ISO and the EMM attributed these improved market conditions, at least to some
extent, to two major rule changes: the application of a sloped demand curve in local capacity zones
and the implementation of the PFP rules.
Though there have been improvements in the RFM rules, there are still some shortcomings that do not
contribute to efficient outcomes. In particular, tight supply conditions can allow a single supplier to affect
market clearing prices. This issue is exacerbated by auction rules that publish information on qualified
capacity that allows suppliers to recognize when they can benefit from raising capacity prices. The
EMM has also expressed concerns that certain ISO-NE market rules, paired with certain PFP
provisions, allow new, uneconomic resources to circumvent the FCA and still earn revenue from
supplemental capacity transactions and from performance payments. Accordingly, the EMM has
recommended several further FCM changes to enhance market efficiency, including:
posting less information about new and existing qualified capacity ahead of the auction.
moving from a descending clock auction format to a sealed-bid format.
modifying queue rules to allow FCA to select the most efficient project among projects that are
interdependent, rather than the project that is first in line.
assessing MOPR rules for alignment with the provisions of PFP.
ISO-NE stakeholders, through the NEPOOL organization, have begun to address the interplay of
markets and public policy through an initiative called Integrating Markets and Public Policy (IMAPP).
The goal of IMAPP is to find solutions that reconcile the traditional role of ISO-NE, and RTOs/ISOs
generally, with the expectation that RTOs/ISOs may be asked to help support state policy objectives.
Incorporating such objectives into the market would be a departure from historical market rules that are
designed primarily to ensure reliable service from the least-cost set of resources. Owing to the
particulars of the ISO-NE region, the focus is as much on achieving state environmental and resource
diversity goals as it is on supporting the continued viability of non-carbon emitting resources. The
ultimate question IMAPP will grapple with is how wholesale markets can reasonably accommodate
various state policy requirements, both in the short term and long term. The IMAPP group began work
in August 2016 and expects to continue working through the first half of 2017. Early leading options for
dealing with the IMAPP problem statement included a carbon adder to the energy market, a forward
clean energy market (FCEM), and/or modifications to the FCM to account for procurement executed
through the FCEM.
Last year, FERC approved a tariff change submitted by ISO-NE that eliminates the PER adjustment on
June 1, 2018, at the start of the ninth capacity commitment period. There are several arguments for the
removal of the PER adjustment:

Charles River Associates
Page 89
Redundancy with PFP. The PFP design is expected to improve resource owner incentives to
perform and may therefore reduce the need for the PER adjustment to curb supplier incentives to
exercise market power in the energy market. The PER adjustment reduces supplier incentives to
exercise market power in the same fundamental way as the PFP design–by taking away the
expected gain from physical or economic withholding. The result of the redundancy is simply a
transfer of dollars from sellers to buyers, with no additional benefits in terms of market power
mitigation.
Uncertainty in FCM payments. In general, the nature of the PER adjustment is to simply increase
the revenue uncertainty associated with FCA payments. Thus, if the PER adjustment is retained
when the PFP model is implemented, FCA payments will not be subject to a single performance
penalty-based adjustment based on real-time deliveries, but will also be subject to the PER
adjustment, adding to the uncertainty associated with capacity revenues. Having such a significant
portion of capacity revenue subject to real-time adjustments undermines one of the key goals of
forward capacity markets, i.e., sending a price signal in advance of the delivery year to support
financing for investments. Significant uncertainty in capacity revenues will hamper investment in
the new or upgraded capacity needed to ensure the system reliability for which the capacity markets
were created in the first place.
Relationship with new, downward-sloping demand curve. PER adjustment will have a greater
impact on future FCM clearing prices/cost than in years past due to the implementation of a
downward-sloping demand curve. These impacts were not considered when PER was initially
envisioned.
Charles River Associates
Page 90
Appendix C: New York ISO (NYISO)
Market at a Glance
The New York Independent System Operator (NYISO), officially formed in 1999, is tasked with the
operation of New York State’s power grid and operating the competitive wholesale electricity market in
the state. Formed out of the New York Power Pool, a group consisting of New York utility companies,
in 1966, the NYISO was largely formed as a response to the growing nationwide trend of electricity
market deregulation and competition in the late 1990s, particularly FERC Orders 888 and 889. NYISO
operates liquid spot markets for electricity and related services. Market participants in NYISO also can
transact bilaterally at established market hubs. Price signals from the NYISO spot markets facilitate
these bilateral forward transactions. NYISO plays a significant role in the operation of the overall
regional grid. It is responsible for the operation, reliability, and planning of the state’s high-voltage
transmission network, and for administering and monitoring the wholesale electricity, capacity, and
ancillary services markets. Most of the high voltage transmission network in the U.S., including in
NYISO, is subject to reliability standards that are established, administered, and enforced, by the North
American Electric Reliability Corporation (NERC).
NYISO’s footprint covers the state of New York, and borders the New England Independent System
Operator (ISO-NE) to the east, PJM ISO to the south, and the Independent Electricity System Operator
(IESO) in Ontario to the north and west. NYISO is divided into 11 main load zones, A through K. Each
zone can be characterized by its distinct generation mix, power price dynamics, and degree of inter-
zonal transmission constraints. Zones A through F are in the less populated northern and western parts
of the state and are not subject to the constraints of those zones located in the southeastern portion of
the state. A map of the NYISO zones can be found in Figure 10.
NYISO runs both day-ahead and real-time spot markets for electricity, as well as oversees the
scheduling of direct transactions between buyers and sellers, known as bilateral transactions. The
owners of power supply assets have two options when selling their generation. They can either bid their
units into the NYISO day-ahead and real-time spot markets, providing offers to sell energy; or self-
schedule their units through bilateral transactions, so that they are dispatched at the owner’s request,
disregarding economic circumstance. Units that are self-scheduled or have their owners’ bids accepted
in the day-ahead markets are financially obligated to provide electric generation in real time. If a
generating asset is unable to provide the previously agreed upon physical energy supply to match their
contracted obligation, they must purchase additional, balancing generation from the real-time market
to make whole the contract.
Generation sold within the NYISO markets is paid the market clearing price, otherwise known as the
locational-based market price (LBMP) for the node at which the generator is connected to the grid.
LBMP is a methodology in which the price of energy at each node location in the New York State

Charles River Associates
Page 91
transmission system is equivalent to the cost to supply the next increment of load at that location at
least cost from available generation sources. Prices at different nodes can vary greatly from location to
location, based on both the time of year and the time of day. NYISO also runs an ancillary services
market, including regulation and operating reserves, energy imbalance, voltage control, and black start
products, for qualifying units in New York.
Figure 10: NYISO Zones
Source: http://www.nyiso.com/public/markets_operations/market_data/maps/index.jsp
The NYISO transmission system is operated to meet demand throughout the system. During periods
of high demand, the system experiences flow constraints across individual transmission lines and
interfaces. Generally, power prices within NYISO increase from West to East, and North to South, due
to these flow restrictions. The most constrained zones tend to be zones G through K, incorporating the
entirety of the Lower Hudson River Valley, New York City, and Long Island. A map of existing
transmission lines in New York is depicted in Figure 12.
Fuel mix in the NYISO is dominated by natural gas, with gas-fired units making up over half of all
installed capacity. NYISO also has over 5000 MW of nuclear capacity, with three large units upstate
and one, Indian Point, located in the Hudson Valley (Zone H). The mix of renewables in the NYISO is
currently dominated by hydro-powered units, with lesser amounts of wind and solar units. NYISO is
currently scheduled to add over 3,500 MW of renewable capacity by 2020, mostly wind and solar units.

Charles River Associates
Page 92
Figure 11: 2015 NYISO Capacity Mix
Source: CRA based on SNL data
Figure 12: New York Transmission Lines
Source: NYISO
While the current level of planned renewable builds in NYISO is substantial, the New York Department
of Public Service’s (DPS) current State Energy Plan may increase that level much further, which could
have substantial impacts on both energy and capacity markets in the NYISO. As part of the plan, the

Charles River Associates
Page 93
Governor’s office has proposed a Clean Energy Standard (CES) that mandates, among other things,
that New York generate 50% of all electricity from renewable sources by 2030 (“50 by 30”).
Beyond the price effects that the 50 by 30 mandate would have on NYISO’s day-ahead and real-time
wholesale energy markets, it could also have a significant impact on the NYISO capacity market.
NYISO has stated that, in order to maintain overall system reliability, the installed reserve margin for
NYCA would have to increase to 40-45% should New York implement the 50 by 30 mandate, though
the Governor’s office disputes NYISO’s assessment. As will be discussed, the reserve margin has a
substantial impact on the design and market outcomes of the New York capacity market auctions, so
the 50 by 30 goal could have lasting effects on the ICAP market. It remains to be seen whether the
current capacity market structure can persist in its current form if the planned renewable generation
targets are realized.
Current Capacity Market Design
Figure 13: NYISO Capacity Market Geography
Source: CRA using data from Ventyx Velocity Suite
The NYISO capacity market is generally referred to as an installed capacity (ICAP) market, and
provides a backstop for LSEs to fulfill capacity obligations that are not adequately filled through self-
supply or bilateral contacts. In the ICAP market, capacity suppliers commit to being available to serve
load when called upon and, in return are paid for each kilowatt of supply, regardless of whether the
resource is actually called upon to supply energy. The costs associated with these capacity payments
Charles River Associates
Page 94
are passed on as costs to the LSEs, which are eventually transferred to rate-payers as a part of their
regulated retail rate, with the amount varying based on the customer’s peak usage.
The NYISO conducts auctions for capacity zones J, K, and G-J Locality, and the rest-of-state (ROS) or
NYCA. These zones are “nested” within each other. The zones were created to reflect the fact that
there can be substantial differences in construction costs between upstate rural regions and the New
York City region, and the fact that there can be significant transmission constraints delivering power
into downstate regions.
Each capacity zone has its own unique downward-sloping demand curve administratively set by
NYISO. NYISO requires load-serving entities (LSEs) to procure capacity on an unforced capacity
(UCAP) basis. All UCAP in New York is included in the NYCA region auction, representing generators
from all parts of the state. UCAP sourced from zones G-J is included in both G-J Locality and NYCA
zones and auctions. Zone J UCAP is included in its own NYC capacity zone and auction, the G-J
Locality auction, and the NYCA auction. Zone K, Long Island, also has its own capacity zone and
auction, and is also nested within the NYCA region and subject to the NYCA auction. Zones A through
F are not included in any sub-zone, and are often referred to as ROS.
The NYISO conducts three separate types of auctions: capability period auction, the monthly auction,
and the spot market auction. The capability period auction is the NYISO default auction, conducted
seasonally twice a year, with a six-month commitment period. Market actors participate in the monthly
auction to buy or sell excess capacity for deliverability during that any month remaining during the
capability period. For example, during a June monthly auction, market participants bid for capacity to
be delivered anytime from June to October (the end of the summer capability period). Finally, the Spot
Market Auction is conducted for excess capacity to be delivered in a single month.
The New York State Reliability Council (NYSRC) sets the installed reserve margin (IRM) for New York.
The IRM for NYCA (New York Control Area) refers to the percentage of capacity above projected peak
demand that the NYCA must have available. NYISO requires that there be capacity sufficiently above
peak load to provide for potential outages and transmission constraints on the system.
The NYSRC Executive Committee includes members from the six utility transmission owners in New
York State, members representing independent power producers, large consumers, and municipal and
cooperative utilities in New York. In accordance with the NYRSC’s IRM recommendation, the NYISO
determines the minimum installed capacity requirement (ICAP) for the state of New York, or NYCA.74
74 IRM established using Northeast Power Coordinating Council’s Standard for Resource Adequacy, which states that
the probability of disconnecting any firm load due to resource deficiency must be once in every ten years, or a loss
of load expectation (LOLE) of 0.1. The NYCA ICAP requirement is a value, expressed in megawatts, equal to the
forecasted NYCA peak load multiplied by one plus the IRM; in other words, the NYCA ICAP requirement is equal to

Charles River Associates
Page 95
NYISO also establishes locational minimum capacity requirements (LCRs) for certain LSEs in
transmission-constrained areas. LCRs are expressed as a percentage of an LSE’s UCAP requirement
that must be procured from capacity suppliers that are electrically located within the constrained area.
NYISO requires these LSEs to procure a certain percentage of UCAP locally as to ensure reliability at
the local level in the face of overall system transmission constraints. The three localities that NYISO
currently establishes LCRs for are New York City (Zone J), Long Island (Zone K), and G-J Locality
(zones G-J). NYISO then assigns LCR UCAP requirements to LSEs that operate within each
constrained locality.
New York City is unique in that it is, by design, not resource adequate, and has a negative reserve
margin. Because of the difficulty of siting capacity in New York City, only about 80% of the capacity
needed to serve the load is sited in the zone and the city relies on imports to serve the remainder of
the load.
The obligation to procure adequate UCAP belongs to the various LSEs. LSEs can procure UCAP from
suppliers either through bilateral contracts or the three NYISO-administered auctions. An individual
LSE’s UCAP requirement can vary based on several factors: its contribution to the transmission
district’s overall peak load, whether or not the LSE is in a LCR Locality, or if it operates in multiple
transmission districts.
Annual changes in the LCR represent a significant uncertainty for investors in the market. Changes in
the LCR result because of transmission topology, generation mix, and changes in other control areas.
Changes in the LCR which result from these factors are not easily predictable by market participants
working with public data, and because of the relatively small size of the NYC market, changes in the
LCR can have significant effects on the capacity price, and thus also revenues.
The NYISO conducts a biennial Comprehensive System Planning Process (CSPP) that encompasses
both transmission and long-term resource planning. Within the CSPP, there is the Local Transmission
Owner Planning Process (LTPP), where each transmission-owning utility’s transmission system plan is
examined within the context of the state’s overall transmission system. In recent years, the NYISO has
also added the Congestion Assessment and Resource Integration Study (CARIS). CARIS, conducted
every two years, is used to evaluate the overall congestion of the system, as well as the economic
peak load plus the % above peak load established by the IRM. The NYISO translates the ICAP requirement value into
a UCAP value using a weighted-average derating factor that represents the historic availability of generating units in
the NYCA. The NYISO recalculates the derating factor before each capability period auction. The derating factor varies
from summer to winter periods. The NYCA UCAP value is equal to the ICAP value multiplied by one minus the derating
factor. NYISO calculates the derating factor using a combination of unit-level information, including maximum capabil-
ity, historical outage rate, and deliverability rates. NYISO uses the NYCA UCAP value to calculate the UCAP for the
various Transmission Districts. In addition to NYCA and the TDs, NYISO also calculates different derating factors for
the three localities that have LCRs, and uses these derating factors to determine LCR UCAP values.
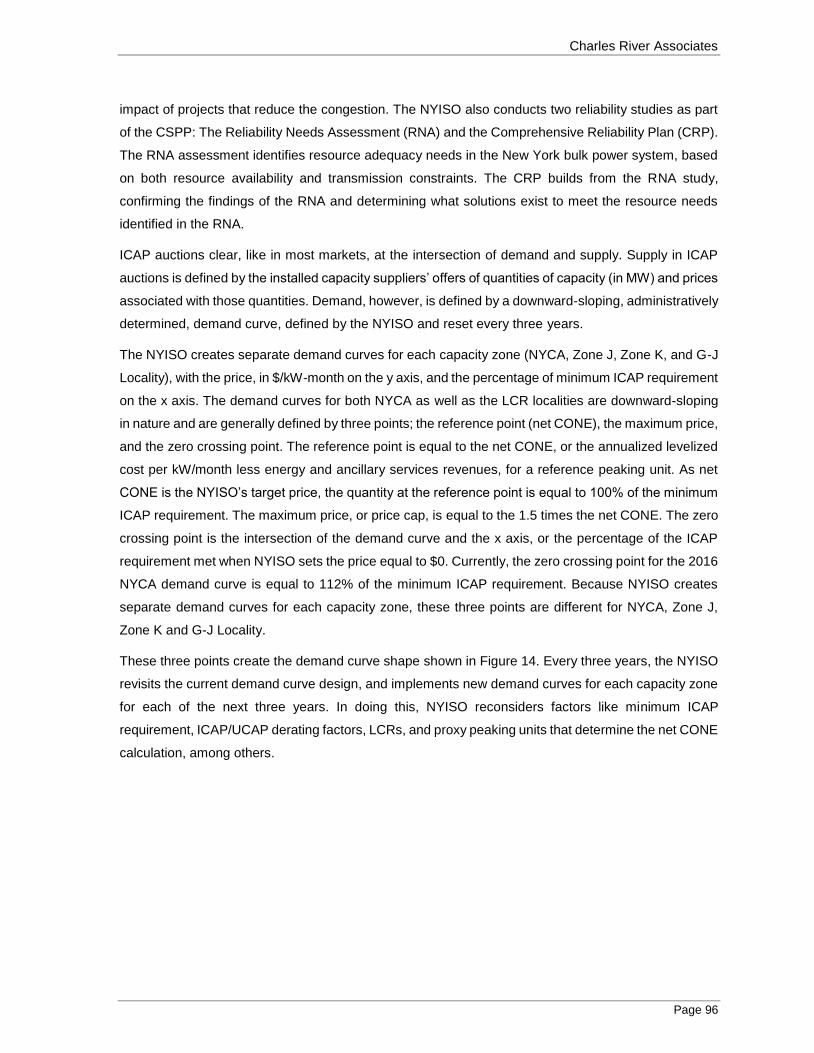
Charles River Associates
Page 96
impact of projects that reduce the congestion. The NYISO also conducts two reliability studies as part
of the CSPP: The Reliability Needs Assessment (RNA) and the Comprehensive Reliability Plan (CRP).
The RNA assessment identifies resource adequacy needs in the New York bulk power system, based
on both resource availability and transmission constraints. The CRP builds from the RNA study,
confirming the findings of the RNA and determining what solutions exist to meet the resource needs
identified in the RNA.
ICAP auctions clear, like in most markets, at the intersection of demand and supply. Supply in ICAP
auctions is defined by the installed capacity suppliers’ offers of quantities of capacity (in MW) and prices
associated with those quantities. Demand, however, is defined by a downward-sloping, administratively
determined, demand curve, defined by the NYISO and reset every three years.
The NYISO creates separate demand curves for each capacity zone (NYCA, Zone J, Zone K, and G-J
Locality), with the price, in $/kW-month on the y axis, and the percentage of minimum ICAP requirement
on the x axis. The demand curves for both NYCA as well as the LCR localities are downward-sloping
in nature and are generally defined by three points; the reference point (net CONE), the maximum price,
and the zero crossing point. The reference point is equal to the net CONE, or the annualized levelized
cost per kW/month less energy and ancillary services revenues, for a reference peaking unit. As net
CONE is the NYISO’s target price, the quantity at the reference point is equal to 100% of the minimum
ICAP requirement. The maximum price, or price cap, is equal to the 1.5 times the net CONE. The zero
crossing point is the intersection of the demand curve and the x axis, or the percentage of the ICAP
requirement met when NYISO sets the price equal to $0. Currently, the zero crossing point for the 2016
NYCA demand curve is equal to 112% of the minimum ICAP requirement. Because NYISO creates
separate demand curves for each capacity zone, these three points are different for NYCA, Zone J,
Zone K and G-J Locality.
These three points create the demand curve shape shown in Figure 14. Every three years, the NYISO
revisits the current demand curve design, and implements new demand curves for each capacity zone
for each of the next three years. In doing this, NYISO reconsiders factors like minimum ICAP
requirement, ICAP/UCAP derating factors, LCRs, and proxy peaking units that determine the net CONE
calculation, among others.
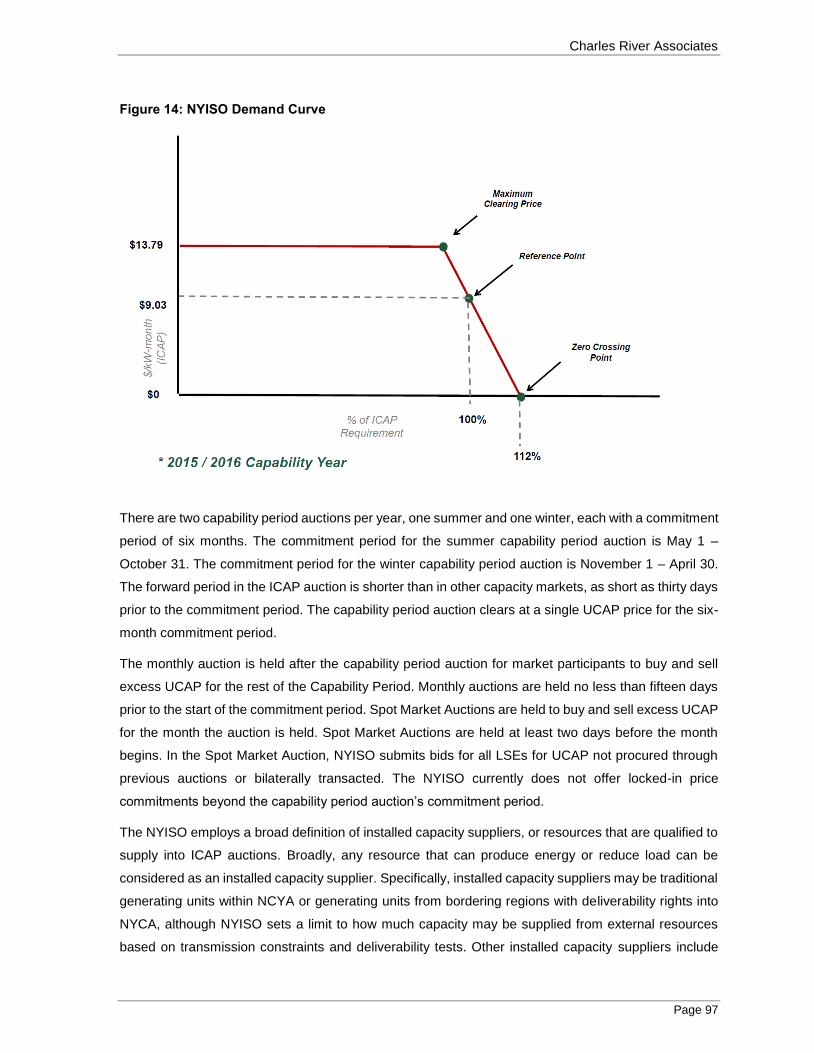
Charles River Associates
Page 97
Figure 14: NYISO Demand Curve
There are two capability period auctions per year, one summer and one winter, each with a commitment
period of six months. The commitment period for the summer capability period auction is May 1 –
October 31. The commitment period for the winter capability period auction is November 1 – April 30.
The forward period in the ICAP auction is shorter than in other capacity markets, as short as thirty days
prior to the commitment period. The capability period auction clears at a single UCAP price for the six-
month commitment period.
The monthly auction is held after the capability period auction for market participants to buy and sell
excess UCAP for the rest of the Capability Period. Monthly auctions are held no less than fifteen days
prior to the start of the commitment period. Spot Market Auctions are held to buy and sell excess UCAP
for the month the auction is held. Spot Market Auctions are held at least two days before the month
begins. In the Spot Market Auction, NYISO submits bids for all LSEs for UCAP not procured through
previous auctions or bilaterally transacted. The NYISO currently does not offer locked-in price
commitments beyond the capability period auction’s commitment period.
The NYISO employs a broad definition of installed capacity suppliers, or resources that are qualified to
supply into ICAP auctions. Broadly, any resource that can produce energy or reduce load can be
considered as an installed capacity supplier. Specifically, installed capacity suppliers may be traditional
generating units within NCYA or generating units from bordering regions with deliverability rights into
NYCA, although NYISO sets a limit to how much capacity may be supplied from external resources
based on transmission constraints and deliverability tests. Other installed capacity suppliers include

Charles River Associates
Page 98
Unforced Capacity Deliverability Right (UDR), which are the controllable MW associated with various
high voltage transmission lines that feed into the NYCA (see Figure 12).
Finally, special case resources (SCRs) within NYCA can qualify as installed capacity supplier. SCRs
are demand response resources, including traditional demand response, local generators, and small
customer aggregations.
Installed capacity suppliers must perform a dependable maximum net capability (DMNC) test during
every capability period. Different DMNC test conditions must be met for different classes of resources,
but generally the DMNC test determines how much ICAP the resource is qualified to offer. NYISO then
determines the specific level of UCAP that resource is qualified to offer, based on the DMNC value and
a specific derating factor. For conventional generating units, the derating factor is based on their
historical outage rate, or EFORd. For variable power resources (solar, wind, hydro, etc.) the derating
factor is based on actual performance of the resource. SCR UCAP is not based upon a DMNC, but the
pledged amount of load reduction, adjusted for a historical performance factor. UCAP associated with
UDRs is awarded based on a case-by-case basis. As of 2016, there is currently 1965 MW of UDRs
awarded from transmission lines from ISO-NE (Cross-Sound Cable) and PJM (HTP, Linden VFT,
Neptune).
After an installed capacity supplier clears in an auction, it has several obligations required by the
NYISO. The NYISO requires any resource that cleared in the auction to either bid into the day-ahead
market or declare to be unavailable. Planned or maintenance outages must be scheduled in advance
of the day-ahead market bidding. Forced outages must be reported to NYISO, so that NYISO can
properly evaluate the resource’s UCAP the next time it bids into an NYISO auction. NYISO makes some
exceptions to this rule. SCRs (demand response resources) are not subject to daily bidding; instead,
each month that the SCR supplies UCAP, the operator of the SCR must submit to NYISO an offer price
associated with its performance so that NYISO can determine when, if at all, to call on the SCR to
perform. Some qualifying variable resources may not have to bid into the day-ahead market, provided
they perform up to the standards that were used to determine their UCAP. If an installed capacity
supplier is found, at any point during the capability period, to have had a “shortfall” in capacity, i.e. it
was not able to provide the UCAP that it sold in the auction, it is subject to a “deficiency charge” equal
to 1.5 times the auction clearing price times the amount of capacity shortfall.
One of the unique features of the NYISO market is the market power mitigation process applied in the
New York City market, and especially the buyer-side measures meant to prevent price suppression for
new resources. New York City has a unique combination of market concentration on both the supply
and demand sides, expensive construction costs, and the coexistence of merchant and contracted
resources. Furthermore, the supply mix is heterogeneous, with both baseload and peaking resources
of varying vintages. Because of this, the New York City market (and only the NYC and Southeast NY
markets) enforce price floor restrictions for resources deemed to be uneconomic by the NYISO.

Charles River Associates
Page 99
Numerous resources in New York City are contracted to entities such as NYPA, and as such, could
potentially offer capacity into the market at a price below that which would be required by a competitive
merchant entrant, potentially suppressing the price below a competitive equilibrium. In other words,
projects which would otherwise be unprofitable without contractual support could enter the market and
push down prices for competitive projects.
As a result, the NYISO has developed a complex mitigation process that forces such projects deemed
unprofitable, or uneconomical, to offer their capacity into the market at a price no less than 75% of the
net CONE.75 Because these units are forced to “bid high” in a market where most units are price takers,
it increases the chances that such units would not earn capacity revenues. This provides, in theory, a
strong financial penalty associated with entering the market with an unprofitable project.
The NYISO employs a pivotal supplier test on the supply side to ensure that owners of significant
amounts of generation cannot artificially increase the price, though in practice this supply-side
mitigation has had less of an effect on the market than the buyer-side measures.
Evolution of Capacity Market Design
The overall design of the ICAP market has remained relatively unchanged since its inception, with a
few major exceptions.
At the inception of the ICAP market, NYISO initially employed an inelastic, or vertical, demand curve to
represent overall LSE demand, with the quantity equal to 100% of the UCAP requirement. This ensured
that the auction would clear at the desired amount of capacity. One unintended result of the vertical
demand curve, though, was price volatility. Figure 15 shows the clearing prices for NYCA in ICAP
auctions from 2000 to 2003. Incremental reductions in supply cause the price to spike drastically in
2001, and then fall back to virtually zero as supply increased. 76
75 This explanation necessarily omits some details of the full market rules. An important point to recognize is that this is
not a floor on the market price, only a floor on what a particular unit can bid. In fact, it can represent a ceiling on market
prices when there are mitigated units in the market.
76 Source: NYISO
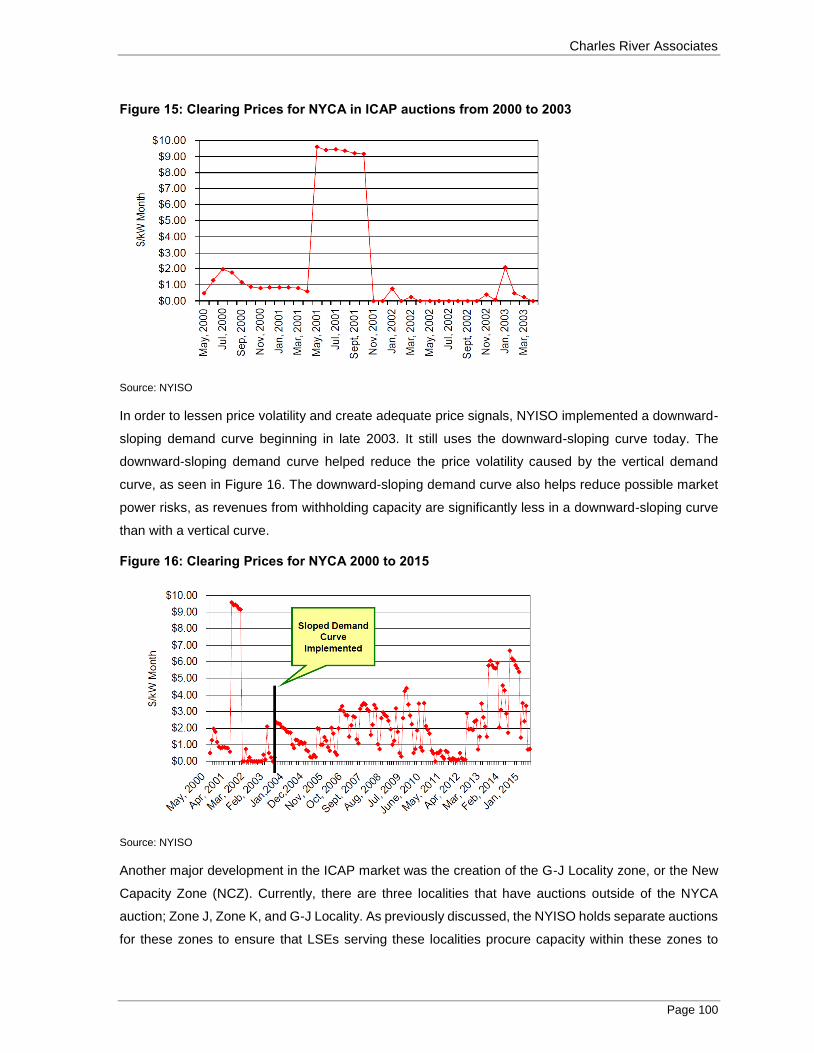
Charles River Associates
Page 100
Figure 15: Clearing Prices for NYCA in ICAP auctions from 2000 to 2003
Source: NYISO
In order to lessen price volatility and create adequate price signals, NYISO implemented a downward-
sloping demand curve beginning in late 2003. It still uses the downward-sloping curve today. The
downward-sloping demand curve helped reduce the price volatility caused by the vertical demand
curve, as seen in Figure 16. The downward-sloping demand curve also helps reduce possible market
power risks, as revenues from withholding capacity are significantly less in a downward-sloping curve
than with a vertical curve.
Figure 16: Clearing Prices for NYCA 2000 to 2015
Source: NYISO
Another major development in the ICAP market was the creation of the G-J Locality zone, or the New
Capacity Zone (NCZ). Currently, there are three localities that have auctions outside of the NYCA
auction; Zone J, Zone K, and G-J Locality. As previously discussed, the NYISO holds separate auctions
for these zones to ensure that LSEs serving these localities procure capacity within these zones to

Charles River Associates
Page 101
ensure reliability, with the LCR dictating the amount of UCAP procured. For most of the ICAP market’s
history, NYISO only held separate auctions for zones J and K. Beginning in the summer 2014 capability
period, NYISO began running a separate auction for UCAP in G-J NYISO zones, to be procured by all
LSEs operating in these zones. NYISO commissioned a study in 2013 to identify if there were significant
transmission issues into one or more NYISO zones, or “a constrained highway interface”.
The study found that there was significant congestion on the transmission system in the Lower Hudson
Valley (zones G-I) into New York City and Long Island, and thus NYISO created the G-J Locality to
create adequate price signals and encourage development of capacity in the region.
Capacity Market Performance
The NYISO market has, by and large, served its purpose of sending price signals to competitive
suppliers, though some of its unique features present unique challenges to investors.
Foremost among these is the spot nature of the capacity market. Compared to other markets such as
PJM and New England, there is no forward lock-in of capacity revenues from the NYISO, increasing
investor uncertainty. In New York, most merchant generation is financed by outside investors and is
not on the balance sheet of the developer. As a result, equity and debt investors place a high value on
predictability of revenues, and the month-to-month nature of the market can reduce confidence in future
revenues. The NYISO has evaluated a change to a forward market in the past, but does not appear
predisposed to change the market structure at this time.
Uncertainty and unpredictability regarding changes in the demand requirement, LCR, and CONE
determination have also been a concern for investors. The mechanics through which these values are
set are not always clear for investors, and unexpected changes in the parameters have decreased
certainty for investors.
The net CONE is determined administratively every three years, which can affect forward revenues.
Market participants have not always agreed with the NYISO regarding the setting of the proxy unit, and
many participants believe that the proxy unit costs are unrealistically low, especially for the New York
City region.
New York is a state with an ambitious political agenda related to the electricity industry, and the
coexistences of regulatory objectives with private capital is unique, perhaps along with California and
Ontario. This contrast results in political objectives that can have the effect of reducing generator
revenues, but with a fundamental market structure that relies on private capital to be committed. A
critical design element of the NYISO market has been to ensure that appropriate financial incentives
still exist for competitive generation at the same time public policy objectives are being funded.

Charles River Associates
Page 102
Several of the unique features of the New York market result from its relatively small size and high
degree of market concentration–both attributes which are also common to Alberta. In contrast to
Alberta, the exercise of market power is prohibited, and numerous measures have been put in place to
prevent it.

Charles River Associates
Page 103
Appendix D: Midcontinent ISO (MISO)
Market at a Glance
The Midcontinent Independent System Operator (MISO) operates the transmission system and
competitive wholesale electricity markets in the Midwest from Montana through Michigan, and then
down through the South to Louisiana. It also includes the Canadian province of Manitoba. The MISO
covers all or portions of 15 states with over 400 market participants representing over 42 million people.
It has over 180,000 MW of supply, with historic peak demand of over 126,000 MW. Headquartered in
Carmel, Indiana, the MISO was the nation’s first ISO approved by FERC in 2001. The majority of the
generation mix is coal (~40% in 2015) or gas (~40%), with the remainder dominated by nuclear (~8%)
and wind (~9%). The resource mix and the capacity levels are changing significantly due to a string of
retirements in the past few years, with several more announced. The MISO is forecasted to move from
nearly 30% reserve margins in the recent past to reserve margins in the low teens in about five years.
While the MISO region borders many other electricity markets and service territories, the ties with PJM
and SPP are generally the most active and noteworthy.
The MISO operates energy and operating reserve markets that include a day-ahead market, a real-
time market, and a financial transmission rights (FTR) market. These markets are operated and settled
separately. In addition, the MISO facilitates resource adequacy by administering tariff-defined Resource
Adequacy Requirements for the LSEs. The LSEs are ultimately responsible for achieving resource
adequacy with oversight by their respective States. The MISO Resource Adequacy Requirements
include a planning reserve margin (PRM), an annual planning resource auction (PRA), and resource
qualification standards. There is a locational mechanism that allows the MISO to designate local
resource zones (LRZ), of which there are currently nine that can clear separately in the PRA. The PRA
currently employs vertical demand curves and a single, sealed-bid style auction.
The PRA has historically seen very low clearing prices in most zones (such as the $3.48 per MW-day
seen across most zones in 2015/16). There were exceptions for a few constrained zones, such as Zone
4 (Illinois), which for one year cleared at a price ($150 per MW-day) closer to the prevailing clearing
price in PJM. Higher prices are expected in the several zones that have the option of clearing in PJM,
thus creating some theoretical opportunity for driving pricing parity between RTOs. However, the
opportunity is constrained by market design. In the latest auction, prices met in the middle for the
majority of zones ($72 per MW-day for zones 2-7) while Zone 1 and MISO South lagged due to
constraints.
There continues to be concern that the capacity market is not driving adequate investment, which will
be needed more in the coming years according to most MISO forecasts. The only significant additions
have been wind resources and some gas capacity in regulated states, such as in MISO South. The
biggest concern is in competitive retail areas (CRAs) where the MISO’s capacity market is relied upon

Charles River Associates
Page 104
for ensuring reliability. For example, the MISO cites the possibility that Zone 4 could be short of its local
resource requirement by up to 1,500 MW by 2018. As a result, the MISO has sought significant changes
to the capacity market for these zones. In November 2016, the MISO filed a proposal with FERC that
would add a forward resource auction (FRA) to procure capacity three years before the delivery year,
and would also add a downward-sloping demand curve. Each of these changes would bring the rules
closer to those of PJM and ISO-NE. In February 2017, FERC rejected the MISO’s proposal. The
grounds for rejection focused on concerns over the potential interactions between the two parallel
capacity markets systems (for competitive and non-competitive retail zones) and a lack of support for
this proposal. This report offers the description of the proposal, as this is indicative of what was
considered appropriate capacity market practice by the MISO, and therefore provides useful
information.
Evolution of Capacity Market Design
The MISO resource adequacy construct is defined in Module E of the MISO Tariff. The first resource
adequacy plan was approved by FERC as an interim plan in 2004 and an updated plan was approved
in 2007. At the time of the capacity market’s inception, the MISO had stated a public goal of becoming
energy only in the long-term, with the capacity market to only be used as a tool for the short-term. The
MISO began with a monthly voluntary capacity auction (VCA), but replaced it with the current annual
PRA construct in 2012, before the 2013/14 delivery year. During that same period, the MISO had
applied to make the capacity market mandatory, but was rejected by FERC on that motion (as they
were again in late 2015).
The PRA was added to allow for separation of prices between zones based on capacity and
transmission needs. In the same year of the first PRA, there was a separate auction for the newly added
MISO South zones. This recent start date makes the PRA relatively new compared to PJM and ISO-
NE capacity markets. There have been only four PRAs to-date, with no major modifications until the
recently proposed changes filed with FERC.
In general, throughout the MISO’s resource adequacy history, the capacity market’s evolution has been
driven by the constant struggle to appease the starkly different stakeholders in the retail choice states
and in the traditionally regulated states with vertically integrated utilities (or with mostly contracted
capacity). The evolution has also been driven by attempts to integrate non-traditional resources, such
as demand response and renewables. Yet another driver has been the response to the observed
clearing prices, which have generally been quite low compared to other RTOs, but which also saw a
massive jump in a single zone in one year (Zone 4 in the 2015/16 PRA). That jump was driven mostly
by a binding constraint on the amount of local generation required from within zone. As a result, there
were adjustments before the 2016/17 auction, specifically around the reference level for all units ($0)
and other market power mitigation measures.
Charles River Associates
Page 105
Current Capacity Market Design
The current capacity market design is fairly in-flux given that MISO filed the Competitive Retail Solution
(CRS) proposal with FERC on November 1 2016 and subsequent rejection by FERC in February 2017.
As stated above, the grounds for rejection focused on concerns over the potential interactions between
the two parallel capacity markets systems (for competitive and non-competitive retail zones) and a lack
of positive support for this proposal. This report offers the description of the proposal, as this is indicative
of what was considered appropriate capacity market practice by MISO, and therefore provides useful
information. We cover each of the designs separately, starting with the existing rules.
Resource Adequacy Obligation
MISO guides the resource adequacy requirements (RAR) process in accordance with its tariff, with
responsibility for setting the planning reserve margin (PRM), LCR, LRR, capacity import limits (CIL) and
capacity export limits (CEL) for each LRZ. The standards are set to result in less than one LOLE per
10 years. The PRMs for specific LRZs can be set by the respective member states, if they so desire.
CELs and CILs define the amount of exports and imports allowed from and to each LRZ. They are
defined by local resource needs and the transmission limitations.
Unlike in several other RTOs, such as PJM, the LSEs provide coincident peak load estimates that
ultimately drive their reserve requirements, or PRMR. Once the PRMRs are set for each LSE, the
resource adequacy construct allows load-serving entities (LSEs) to procure capacity to meet their
requirements either through bilateral contracts, self-supply, or by purchasing resource credits through
the planning resource auction (PRA). Those that do not meet their requirements are subject to a
capacity deficiency charge, which is nearly three times the net cost of new entry in MISO.
Load Resource Zones (LRZs)
MISO was required via a FERC Order to construct a resource adequacy approach that takes resource
location into account and determines a value for such locations using a market-based approach.
Starting in 2010, the MISO began to incorporate a locational capacity market mechanism. It was fully
implemented in the 2013/14 PRA. The LRZs have been configured taking into account geographical
boundaries of local balancing authorities (LBAs), state boundaries, the relative strength of the
transmission interconnections between LBAs, the results of LOLE studies, the location of existing and
proposed resources, and the relative size of zones.

Charles River Associates
Page 106
Products
There are three types of planning resources that can participate in the PRA. The following list is an
excerpt from MISO training material that succinctly summarizes the resource types: 77
Capacity Resources (CR) - electrical generating units or stations known as Generation Resources or
External Resources (if located outside of MISO), and loads that can be dispatched to reduce demand
known as Demand Response Resources (DRR). Within the Generation Resources category, separate
qualifications exist for Non-Variable Generation, Variable Generation Resources, Limited Resources,
External Resources, and Demand Response Resources (dispatchable, which is different from Demand
Resources that only qualify as Load Management Resources, not Generation Resources).
Load Modifying Resources (LMR) - include Behind-the-Meter Generation (BTMG) that are available
for use during emergencies and loads that can be interrupted or directly controlled to reduce demand
during emergencies known as Demand Resources (DR). These resources are not subject to testing
procedures on a comparable basis to other generating resources, but are still granted a 100% capacity
credit. MISO has rarely deployed these resources, but its limited experience suggests a lower response
rate. Over time, MISO’s certification requirements, data collection from LBAs on available demand
response, and penalties for failing to respond have improved. Therefore, we anticipate a higher
response rate now than the apparent 50 % response rate MISO received in 2006 when demand
response was called.
Energy Efficiency Resources - A Planning Resource consisting of installed measures on retail
customer facilities that achieves a permanent reduction in electric energy usage while maintaining a
comparable quality of service.
Demand Curve Parameters
The PRA uses a vertical demand curve set at the level of load plus the planning reserve margin. In
addition, the MISO employs a price cap of 1x CONE. This is lower than in most other RTOs.
Forward Period
The MISO conducts a PRA in April for the Planning Year that starts in June.
77 Matlock, R. (2015), “Level 200 – Resource Accuracy.” Available at https://www.misoenergy.org/Library/Reposi-
tory/Meeting%20Material/Stakeholder/Training%20Materials/200%20Level%20Training/Level%20200%20-%20Re-
source%20Adequacy.pdf.

Charles River Associates
Page 107
Commitment Period
The PRA commitment period, or planning year, spans portions of two calendar years and is defined as
the period from June 1 to May 31.
Multi-Period Commitment for New Resources
None.
Resource Use of Supplementary Auctions
Residual Auctions.
Qualified Capacity
As described in the tariff
“In order for the Transmission Provider to account for resource performance and
availability, Capacity Resources will be given capacity values based on Unforced
Capacity for the applicable PRA and FRA; LMRs will be given capacity values which
recognize historical performance and availability; and EE Resources will be given
capacity values based on the measurement and verification data provided for such
resources, as provided in the BPM for Resource Adequacy.”
For capacity resources, the default method is based on the reporting of generator availability data. For
capacity resources that are not required to submit such data, the forced outage rate is based on the
class average for its resource type.
Market Power Mitigation
The PRA exhibits certain design features and market characteristics that could make it vulnerable to
market power issues. An example is the combination of a vertical demand curve and supply curves that
have segments with very significant slopes. This combination leads to significant price changes from
small changes in MW offered or demanded.
Buyer market power. There is currently no MOPR in MISO. The idea has been rejected by FERC. The
FERC claims that, unlike in PJM, the MISO does not have participants that could clearly benefit from
suppressing clearing prices using their generation assets. Supplier market power is of more concern,
though that may change as some new out-of-market subsidy proposals advance in certain member
states.
Seller market power. The IMM is charged with identifying physical withholding by suppliers of planning
resources. It employs a screen for market participants, currently set at 50 MW as a minimum in each
LRZ. In its 2015 State of the Market report, the IMM proposed to apply physical withholding rules more
strictly to affiliates, but that issue has not been resolved and it stands before the Resource Adequacy

Charles River Associates
Page 108
Sub-committee. For now, the withholding is evaluated for each market participant, not for affiliated mar-
ket participants. Resources are deemed to have not withheld capacity if they can demonstrate any of
the following:: reasonable outage plans, no pattern of affecting the price with outage plans, that they
are contracted bilaterally, that they are designated to satisfy the owners own capacity requirements,
are not economic, export their capacity, have been approved to retire, have a total amount of capacity
less than the threshold, or a meet other conditions outlined in the Tariff.
The maximum bid allowed for resources before IMM review is referred to as the “reference level.” For
auctions through 2015/16, the reference level was set based on the clearing prices in neighbouring
markets using the idea of opportunity cost. Due to the jump in Zone 4’s price for the 2015/16 auction,
FERC issued an order directing MISO to stop relying on PJM Interconnection prices to set maximum
bids. The following summarizes that order’s provision on the reference level:
“…MISO must set the Initial Reference Level to $0/MW-day and no longer calculate that
level on the basis of the opportunity costs of selling capacity into the PJM Interconnection
market. This means that a bid exceeds the Conduct Threshold, which is 10 percent of
Cost of New Entry (CONE), will be mitigated to the applicable reference level unless a
unit demonstrates facility-specific reference levels supported by documentation of its
going forward costs. To mitigate the effects of conduct that would substantially distort
competitive outcomes, market power mitigation provisions authorize mitigation of any
conduct that exceeds well- defined conduct thresholds. Anticipating an increase in the
number of requests for facility-specific cost-based offers, the FERC Order requires MISO
to propose revisions to develop default technology-specific avoidable costs.”
Proposed Forward Capacity Construct
This section is based on the filing made by MISO on November 1, 2016.78 The proposal was rejected
by FERC on February 2, 201779. In this order, FERC found that the proposal was not adequately
supported in a way that demonstrated it to be just and reasonable and not unduly discriminatory or
preferential. FERC stated:
78 MISO, (2016), “FERC Docket No. ER17-284-000.” Available at https://www.misoenergy.org/Library/Repository/Tar-
iff/FERC%20Filings/2016-11-01%20Docket%20No.%20ER17-284-000.pdf.
79 On February 2, 2017 FERC voted 3-0 to deny MISO’s Competitive Retail Solution proposal (“CRS Proposal”) which
sought to establish a three-year forward capacity auction for its states with retail choice to complement its existing
auction for rate-regulated markets (the Planning Resource Auction). In the Order, FERC found that the CRS Proposal
was not adequately supported and in a way that demonstrated it to be just and reasonable and not unduly discrimina-
tory or preferential.

Charles River Associates
Page 109
“Given the limited amount of demand that will be represented in the Forward Auction,
relatively small changes in supply participation from non-Competitive Retail Areas on a
year-to-year basis could result in substantial unnecessary year-to-year differences in
Forward Auction clearing prices, even with a downward sloping demand curve that
should reduce price volatility. Because the Forward Auction and the Prompt Auction
occur at different times, the prices in those two auctions could diverge based on supply
participant behavior, even when such divergence is not supported by underlying supply
and demand fundamentals.”80
FERC’s rejection of the MISO proposal does not seem to be a rejection of any of the proposed design
for the competitive retail zones, but rather for the problem of separate forward periods in a context of
little positive support. The following diagram from MISO displays the bifurcated approach proposed by
MISO.
Figure 17: MISO Resource Adequacy
The two main proposed changes are the forward period of three years (Tariff Section 69A.12.8) and
the use of a sloped demand curve (Tariff Section 69A.12.3.). The following are highlights of key
80 FERC (February 2, 2017), “Order Rejecting Tariff Filing Docket No.ER17-284-000.” Available at
https://www.ferc.gov/CalendarFiles/20170202164853-ER17-284-000.pdf.
Charles River Associates
Page 110
differences between the new construct and the existing construct described in the previous section.
There are significant similarities that won’t change, such as the allowance of alternative methods of
compliance for LSEs to avoid the forward auctions.
Resource Participation
Capacity resources located in CRS zones have a must-offer requirement. There are exemptions avail-
able, such as a Safe Harbor provision and an exemption for resources physically unable to participate.
In addition, resources located outside the CRS are eligible for participation, but if they are owned by
LSEs serving non-CRS demand, then there is a test to determine if they are pivotal. Also, the owners
must demonstrate that they can meet their own load first before participating. This was a contentious
issue during the stakeholder process, particularly among merchant generators that did not want to have
the FRA clearing prices weighed down by rate-based resources, so the pivotal test is a compromise.
Once a capacity resource clears in an FRA, it must place a must-offer into all subsequent FRAs until
MISO is notified of withdrawal. It also may avoid the next FRA if it commits to sell its capacity into an
external region.
Demand Participation
Participation is mandatory for retail choice loads that meet the materiality threshold, which is the
“quantity of demand that LRZs with Competitive Retail Choice will be measured against to determine
whether the Competitive Retail Solution applies to such demand.”81 There is a Safe Harbor exemption
available.
Demand Curve
The FRA utilizes a downward sloping demand curve called the variable reliability target (VRT). Much
like the PJM curve, the VRT is set based on net CONE and reliability values driven by the LOLE study.
There will be separate VRTs for each LRZ. The VRT is drawn relative to the retail choice load share of
each zone’s total load. It currently has a price cap of 1.4x net CONE.
Interaction with the Existing PRA
Capacity resources that clear in the FRA must self-schedule into the PRA for the planning year as zero-
price offers. Demand that cleared in the FRA will participate in the PRA as price-insensitive demand.
The amount of demand procured in the PRA is adjusted based on the amount that cleared in the FRA.
There will not be incremental auctions after the FRA, and thus the PRA is the only venue for curing any
shortfalls in capacity.
81 MISO proposed Tariff modifications

Charles River Associates
Page 111
There are also interactions between the two auctions that could cause complications. One method to
address such complications is the CRS congestion charge, which addresses the costs that result when
capacity obligations from the FRA are not deliverable into the zone by the time of the PRA.
Market Power
The filed CRS provides for a pivotal supplier test that determines if resources will be subject to IMM
tests for economic or physical withholding. It does not introduce a MOPR, as MISO determined that it
was not necessary for the same reasons it has not been necessary in the existing market structure.
New Resources
A new resource must have a facilities study and a system impact study completed seven calendar days
in advance of an FRA. New demand response must submit a demand response capability plan to
participate. There is no price lock-in or other provisions to ensure prices beyond the first planning year
for new resources.
Capacity Market Performance
In terms of meeting the primary goal of resource adequacy, the MISO capacity market has been a small
factor in the mix of factors that have driven healthy historical reserve margins across the system. In
fact, it could be argued that the MISO region has high reserve margins despite the capacity market’s
low clearing prices in most zones throughout its existence. As mentioned previously, the MISO originally
expressed an interest in relying almost entirely on the energy markets to drive returns, with the capacity
market as a fallback mechanism when resource scarcity became an issue. Most of the region has not
had scarcity issues due to significant reserve capacity that is either contracted or owned by vertically
integrated utilities. Therefore, it could be argued that the capacity market has performed as expected
to-date.
However, a glimpse into the near future tells a different story. The reserve margins are shrinking rapidly
in several MISO zones, with the competitive retail zones (zones 4 and 7) the most at risk of becoming
resource inadequate, while the vertically-integrated jurisdictions use integrated resource planning and
the ability to add capacity regardless of capacity price. In addition to losing capacity to retirements for
environmental and economic reasons, some of the MISO zones are losing capacity to neighbouring
RTOs that offer much higher capacity prices in most years. For this reason, it could be argued that the
MISO capacity market has not performed well in competitive retail zones.
The changes in progress are designed to improve capacity market performance going forward, with a
specific goal of increasing investment prospects in the zones that face possible shortages, as well as
increasing the prospects for retaining existing capacity. While the MISO capacity market will still lack
some of the incentives in place for new resources in other regions, the three-year forward period and a

Charles River Associates
Page 112
sloped demand curve add a longer term, more consistent signal to investors interested in one of the
markets most likely to be short of capacity in the entire US in the coming years.

Charles River Associates
Page 113
Appendix E: Great Britain (GB)
Market at a Glance
The total installed capacity in 2015 was approximately 78.3 GW made up primarily by gas-fired
capacity, representing approximately 40% of total installed capacity, Nuclear makes up 12% of the
installed capacity while wind is 10.6% and coal and biomass together make up approximately 20%.82
The GB electricity grid has 4 GW of interconnection (2 GW with France, 1 GW with the Netherlands,
500 MW with Northern Ireland, and 500 MW with Ireland).
Upon privatisation of the electricity industry in 1990, all electricity generation in the UK was offered into
a gross pool and dispatched centrally by the system operator (SO). Issues with market concentration
and lack of liquidity led to reforms in 2001 that created the New Electricity Trading Arrangements
(NETA). One of the aims of NETA was to encourage generators and suppliers to trade bilaterally to
meet the demands of customers. These arrangements were expanded in 2005 to include Scotland
under the British Electricity Trading and Transmission Arrangements (BETTA). Since then, the GB
electricity market has operated as a single pricing region.
Under BETTA, wholesale trading has three components:
1. A bilateral market in which generators, suppliers and others trade a variety of contract types, either
directly or via brokers or power exchanges.
2. A balancing mechanism (BM) in which a generator with flexible generation and suppliers with
flexible demand can make firm bids and offers to vary output/ consumption to the GB system
operator to help balance the system.
3. An imbalance settlement process that pays for the balancing actions taken by the GB system
operator.
Most of the electricity (around 98%) is traded in the bilateral market. Electricity is traded in a wholesale
market, with generators and suppliers entering into contracts with each other for every half hour of
every day; sometimes years in advance. This continues until “gate closure” (currently set at one hour
before time of delivery). From this time until delivery, all further trading (the remaining 2%) is with the
GB system operator (SO), National Grid Electricity Transmission, in the balancing mechanism.
The SO has a range of services to assist in balancing the system, and will try to balance it in the most
efficient and economical way. These balancing actions or services fall into three categories:
82 Power Stations in the UK (DUKES). May 2015

Charles River Associates
Page 114
1. Ancillary and commercial services. This includes reactive power, frequency response, black start
and reserve services.
2. Contract notifications ahead of gate closure. The system operator can buy and sell electricity ahead
of gate closure (like a standard contract notification). Depending on whether there is likely to be a
shortage of electricity or a surplus, it may choose to contract with parties for the electricity it believes
is needed ahead of gate closure.
3. Bid–offer acceptances. Bid–offer acceptances are instructions from the SO to a specific balancing
market (BM) unit to increase generation/reduce demand (offer) or to reduce generation/increase
demand (bid). Bid-offer acceptances are only made after gate closure for a settlement period.83
This system of bids and offers is called the balancing mechanism.
4. Balancing mechanism units (BM units)84 are obliged to submit physical information to the SO ahead
of gate closure. The parties must submit the expected generation or demand for a settlement
period. This is called a physical notification. At gate closure this becomes the final physical
notification (FPN).
5. The trading arrangements are designed so that all bilateral contracts are finalized before gate
closure and submitted to the SO. After gate closure, parties are expected to adhere to the
contracted volumes submitted to the SO. The SO has its forecast of demand for the settlement
period, which it compares against the physical data submitted by generators. This data is used to
determine whether there is likely to be a surplus or deficit of electricity in the settlement period.
Background – the Electricity Market Reform program
The UK government set out its intention to reform the electricity market in Great Britain (GB) 85 in the
“Electricity Market Reform” white paper of July 2011.86 This paper noted that around a quarter of GB’s
existing generating capacity, some 20 GW of mainly coal and nuclear plants, would be closing over the
83 Electricity is traded in half hourly periods. Each half hour is referred to as a settlement period. Each day is, therefore,
split into 48 settlement periods, with settlement period 1 equivalent to 00:00 to 00:30 and settlement period 48
equivalent to 23:30 to 00:00. Each settlement period is settled in isolation from the settlement periods around it.
84 Balancing Mechanism Units (BM Units) represent the generation or consumption at a particular location. Each party
is assigned BMUs for their power stations or areas of demand. BM Units are also assigned to interconnectors and
embedded generation.
85 GB comprises England, Wales, and Scotland. Northern Ireland is part of an all-island electricity market with the
Republic of Ireland.
86 Department of Energy & Climate Change (2011), “Planning our electric future: a white paper for secure, affordable and
low-carbon energy.” Available at http://www.decc.gov.uk/en/content/cms/legislation/white_pa-
pers/emr_wp_2011/emr_wp_2011.aspx,

Charles River Associates
Page 115
next decade and that as a result substantial new investment was required. The derated capacity margin
was expected to fall below 5% by 2020.
Figure 18: Extract from Capacity Market Impact Assessment
Moreover, it was concluded that the existing market mechanism would be unlikely to be sufficient to
ensure resource adequacy and accordingly the government decided to legislate for a new contracting
framework for capacity, the capacity market. In the white paper, the government presented two options
for a capacity market: a strategic reserve comprising centrally procured capacity that is held separate
from the energy market for use in extreme circumstances and a market-wide mechanism in which all
providers are incentivized to offer reliable capacity. Thus, while it was noted that Ofgem (the electricity
and gas national regulator) was considering reforms to the wholesale energy markets, the government
decided that these would be unlikely to be sufficient to incentivize the necessary investment in new
fossil-fueled generating capacity.87
The white paper of July 2011 also set out other proposed reforms. These comprised the introduction of
Contracts for Differences (CfDs) for the procurement of renewables, a carbon price floor to underpin
the European Union’s (EU) Emission Trading Scheme and an emissions performance standard with
87 Ofgem in August 2012 launched its Electricity Balancing Significant Code Review, which subsequently removed the
existing cap on prices in the Balancing Mechanism (BM), allowing them to rise to £6,000/MWh. Ofgem has also intro-
duced a mechanism for pricing utilisation of short-term operating reserve in the BM as a function of the Loss of Load
Probability multiplied by the Value of Lost of Load.

Charles River Associates
Page 116
the effect of preventing the construction of new coal-fired generating stations. In this way, the
introduction of the capacity market in GB was part of an overall reform program targeted on the policy
objectives of security of supply decarbonisation and affordability.
The CfD and capacity market are designed to work alongside the existing energy markets. Figure 19
illustrates the interaction.
Figure 19. EMR interaction with Energy and Ancillary Services Markets
Overview of the GB Capacity Market
Following consultation, the government decided on a market-wide capacity market and took powers to
implement it in the Energy Act 2013. The capacity market comprises periodic descending clock single
price auctions for capacity agreements four years ahead of delivery (with a further auction one year
ahead of delivery). The auction is limited to plant that are not receiving some other form of government
support (such as renewables). Demand-side reduction (DSR) and interconnectors were not included in
the first auction but provisions have subsequently been made for their inclusion. The capacity
agreements consist of one year agreements for existing plants (or DSR and storage providers) and
longer agreements for refurbishing plants (three years) and new plant (15 years) whereby capacity
providers are obligated to deliver energy (or balancing services) during system stress events. A system
stress event is notified by the SO following a four-hour advance capacity market warning that is

Charles River Associates
Page 117
determined subject to defined criteria.88 The UK government determines the overall capacity
requirement in each auction on the basis of a recommendation from National Grid, the SO.
Rationale for GB Capacity Market design choice
The case for the GB capacity market is set out in the government’s regulatory impact assessment.89
This reiterated the ‘missing money problem for incentivising new investment in terms of the energy
price failing to reflect the true cost of system balancing actions when there is scarcity’90 and the ‘lack
of a forward market to build capacity on the basis of expected scarcity rents’.
A market-wide capacity market was selected because the alternative, a Strategic Reserve might lead
to energy market prices still spiking, while potentially efficient plants were kept out of the market. It
could also lead over time to a preponderance of plant being segregated in a Strategic Reserve (as the
main mechanism for incentivising market entry) which would be unsatisfactory.91
A single price, pay-as-clear auction design was selected because providers should be incentivized to
bid their own economic cost of providing capacity. This avoids the ‘gaming’ likely under pay-as-bid price
setting where providers seek to anticipate the clearing price. In contrast, the pay-as-clear approach
should create better price signals for long-term investment and capacity utilization.92 The descending
clock auction was preferred over a sealed bid design because of the presumed benefits of greater price
discovery reducing uncertainty over common cost elements and so mitigating the possibility of the
‘winner’s curse’ inhibiting bidders and leading to inefficiently high prices.93 The length of capacity
88 Department of Energy & Climate Change (June 2014), “Implementing Electricity Market Reform (EMR).” Available at
https://www.gov.uk/government/uploads/system/uploads/attachment_data/file/324176/Implementing_Electricity_Mar-
ket_Reform.pdf.
89 DECC (2014), “Electricity Market Reform – Capacity Market.” Available at https://www.gov.uk/government/up-
loads/system/uploads/attachment_data/file/354677/CM_-_revised_IA_and_front_page__September_2014__pdf_-
_Adobe_Acrobat.pdf.
90 The government noted that Ofgem’s decision to allow prices to rise to £6,000/MWh was still substantially short of VOLL
estimated at £17,000/MWh.
91 Department of Energy & Climate Change (2011), “Planning our electric future: technical update,” paragraph 112. Avail-
able at http://webarchive.nationalarchives.gov.uk/20121025080026/http://decc.gov.uk/assets/decc/11/meeting-en-
ergy-demand/energy-markets/3884-planning-electric-future-technical-update.pdf and DECC (2011), “Electricity Mar-
ket Reform – Capacity Mechanism.” Available at http://webarchive.nation-
alarchives.gov.uk/20121025080026/http://decc.gov.uk/assets/decc/11/consultation/cap-mech/3883-capacity-mecha-
nism-consultation-impact-assessment.pdf.
92 DECC (2014), “Electricity Market Reform – Capacity Market,” pages 40-42. Available at https://www.gov.uk/government/up-
loads/system/uploads/attachment_data/file/354677/CM_-_revised_IA_and_front_page__September_2014__pdf_-
_Adobe_Acrobat.pdf.
93 Page 43 ibid

Charles River Associates
Page 118
agreement for new plant was extended to 15 years in part because of limitation in the UK capital
markets in which project finance lenders are unlikely to take any significant merchant risk.94 The
government’s cost benefit analysis resulted in a positive NPV due to investment occurring sooner than
would otherwise be the case (in the absence of a capacity market) and thereby reducing lost load.95
Evolution of Capacity Market Design
To date there have been only three T-4 capacity auctions (for delivery in 2018/19, 2019/20 and 2020/21)
that were held in December 2014, 2015 and 2016. There has also been one transitional capacity market
auction (offering targeted support to DSR, including storage and embedded generation) for delivery in
2016/17, which was held in January 2016. An ‘early auction’ to replace the transitional supplementary
balancing reserve will be held in January 2017.96 The first T-1 auction will be held in 2017.
Consequently, there have been only a limited number of auctions to date and as a result, the evolution
of the design of the capacity market has also been limited. The fundamental design has not changed
but there have been a number of significant rule changes.
Tightening delivery incentives
The first capacity market auction led to one new plant being awarded a capacity agreement, but it then
failed to reach financial close and didn’t raise the necessary finances with which to commence
construction. So rule changes have been made whereby:
failed projects may not compete again in future auctions for a two-year period;
increased monitoring and reporting on milestones have been introduced; and
pre-auction credit cover has been increased for new build projects from £5,000/MW to
£10,000/MW-of derated capacity. This is to deter speculative new build applications and secure
exposure against increased termination fees.
Termination fees were raised from £5k-25k/MW to £10k-35k/MW for all generating capacity market
units (CMUs) depending on the nature of the termination event. Penalties are higher the closer in time
to the delivery year.97
94 Page 50 ibid
95 Table 3 ibid
96 The Supplemental Balancing Reserve (“SBR”) enables National Grid to purchase additional reserve (and prevent some
plant retirements that might otherwise have occurred) in the expectation of reduced reserve margins in the short-run.
The Early Auction replaces the SBR as mechanism for supporting capacity in the winter of 2017/18.
97 Department of Energy and Climate Change (2016), “Government response to the March 2016 consultation on further
reforms to the Capacity Market,” pages 11-25. Available at https://www.gov.uk/government/uploads/system/up-
loads/attachment_data/file/521301/Govt_response_to_March_2016_consultation_FINAL.pdf.

Charles River Associates
Page 119
Price duration equivalence
The provision of contracts with different duration (for existing, refurbishing, and new capacity) proved
controversial with some market participants. In particular, it was argued that longer term contracts
unduly advantaged new plants. However, initiatives to equalize offer prices depending on the duration
of the capacity agreement were not successful owing to the difficulty in establishing a reliable and
acceptable methodology.
Interaction with other support or incentive mechanisms
Concerns were raised by market participants that some bidders were benefiting from tax incentives
(such as a regional enterprise initiative scheme and venture capital trust scheme that were not available
to all bidders. The government decided to make such benefits deductible from any payment under a
capacity agreement. Other distortions have arisen from small scale diesel generating sets avoiding
emissions restrictions (such as the EU’s Industrial Emissions Directive, the Medium Combustion Plant
Directive and Emissions Trading Scheme) due to their size and limited operating hours. In response,
the UK government is proposing to impose additional controls on NOx emissions from small scale
generators.
Finally, small scale generation embedded in distribution networks in the first and second auctions
benefitted from being able to use their generation to reduce the liability of suppliers (i.e. local retailers)
to network charges. This benefit is not available to transmission connected generation plants which
have complained that these incentives are not cost-reflective and as such constitute an undue benefit
for embedded generation. Ofgem has subsequently notified market participants that the network code
will be modified and network charges subjected to further review.98
Treatment of DSR
The government was concerned that the first Transitional Arrangements auction mainly led to
generation-led DSR being successful. So it decided to extend support only to turn-down DSR in the
second Transitional Arrangements auction.
Inclusion of interconnectors
Eligibility criteria were extended in the second and third T-4 auctions to include interconnectors from
the second capacity auction. Interconnectors are included in their own right (despite being transmission
infrastructure) subject to derating factors that range from 26% for the Irish interconnectors to 60-77%
98 Ofgem (December 2016), “Update on charging arrangements for Embedded Generation.” Available at
https://www.ofgem.gov.uk/system/files/docs/2016/12/update_letter_-_charging_arrangements_for_embedded_gen-
eration.pdf.

Charles River Associates
Page 120
for the continental and Norwegian interconnectors.99 They will receive the clearing price in the auction
and will hold the capacity obligation in line with requirements for other resources. (In other words, their
performance will be measured against delivered energy, not availability.) However, this is an interim
solution until a common EU approach for the participation of cross-border capacity in capacity
remuneration is reached (subject to determination of the UK’s future relationship with the EU following
the 2016 referendum to exit the EU).
Current Capacity Market Design
Institutional framework
Figure 19 shows how the key EMR mechanisms and institutions fit together. The government will retain
control of the policy approach and decisions, such as any security of electricity supply objectives and
the volume of capacity to contract for the capacity market. The SO will provide evidence and analysis
to inform government’s decisions. The SO will also administer the CfDs and the capacity market and
report to the government on delivery. Ofgem will regulate the SO and oversee its performance in
delivering the CfD and capacity market, to ensure value for money and incentivize effective
performance. It will also regulate the capacity market, taking responsibility for reviewing and deciding
on proposed rule changes.
The costs of capacity agreements are recovered through a levy on suppliers (i.e. retailers) by the
Electricity Settlements Company which is apportioned by share of demand. If a supplier defaults, and
has exhausted its available credit cover, then its charge is mutualized across non-defaulting
suppliers.100
99 National Grid (2016), “Capacity Market Auction Guidelines.” Available at https://www.emrdeliverybody.com/Lists/Lat-
est%20News/Attachments/71/Capacity%20Market%20Auction%20Guidelines%2015th%20November%202016.pdf.
100 EMR Settlement Limited. Available at https://www.emrsettlement.co.uk/.

Charles River Associates
Page 121
Figure 20: EMR Mechanisms and Institutions
Resource Adequacy Obligation
National Grid, the SO, prepares the “EMR Electricity Capacity Report” which provides the government
with recommended target volumes of capacity to procure in the auctions.101 More specifically the
government has requested National Grid to answer the question:
What is the volume of capacity to secure that will be required to meet the security of supply standard
of 3 hours Loss of Load Expectation (LOLE)?
The government has separately reached the three hours LOLE target on the basis of assuming an
average value of lost load (namely £17,000/MWh102) and a cost of new entry of £47.18/kW. 103
101 National Grid (2016), “National Grid EMR Electricity Capacity Report.” Available at https://www.emrdelivery-
body.com/Lists/Latest%20News/Attachments/47/Electricity%20Capacity%20Report%202016_Final_080716.pdf.
102 This figure was estimated by a consultancy advising Ofgem. London Economics (2013), “The Value of Lost Load
(VoLL) for Electricity in Great Britain.” Available at https://www.gov.uk/government/uploads/system/uploads/attach-
ment_data/file/224028/value_lost_load_electricty_gb.pdf.
103 Department of Energy & Climate Change (2013), “Annex C: Reliability Standard Methodology.”
Available at https://www.gov.uk/government/uploads/system/uploads/attachment_data/file/223653/emr_consulta-
tion_annex_c.pdf.

Charles River Associates
Page 122
Subsequently, estimates of the cost of new entry have changed, but the LOLE target has not been
updated to be consistent with these changes.
National Grid’s methodology and recommendations for target volumes of capacity are reviewed by an
independent panel of experts which reports to government. The government then instructs National
Grid on the target capacity to be set in the auction; in practice, slightly more or less may be procured
depending, as explained below, on the auction clearing process.
Planning Process
National Grid is both SO and transmission asset owner (though greater independence is being intro-
duced through separate boards) and accordingly undertakes both resource and transmission planning.
National Grid’s “Future Energy Scenarios” outlines scenarios for the possible sources of and demands
for gas and electricity though to 2050.104 These are intended to support decision-making across the
industry. National Grid does not itself invest in resources. National Grid’s transmission planning takes
place in conjunction with Ofgem’s process for setting network price controls.105
Clearing Mechanism
The GB capacity market is run in a descending clock format with multiple rounds. The first round starts
at the price cap. The price is then progressively reduced until the auction discovers the minimum price
at which there is sufficient capacity given the shape of the administered demand curve. Bidders respond
to the price set in each round by either staying in the auction or submitting an Exit bid and thereby
withdrawing capacity from the auction. More specifically in each round, Participants will have the op-
portunity to:
Revise the exit bid for price-maker capacity market units (CMUs);
Specify or revise the exit bid price for price-taker CMUs, if the price is below the price-taker
threshold;
Enter the price at which to reduce the capacity agreement length for new build or refurbishing
CMUs; and
Specify the minimum price acceptable for a refurbishing CMU before switching to a pre-
refurbishment state.106
104 National Grid (2016), “Future Energy Scenarios.” Available at http://fes.nationalgrid.com/fes-document/.
105 Ofgem, “Transmission networks.” Available at https://www.ofgem.gov.uk/electricity/transmission-networks.
106 Pre-refurbishing capacity refers to the element of the CMU which in existence and would be the CMU should the
refurbishing element exit the auction.

Charles River Associates
Page 123
The status of price-makers and price-takers together with refurbishing and new build plant is explained
further below.
At the end of each round, the excess capacity at the bidding round price floor is published. The bidding
round price Floor for the next round is then announced and the auctioneer updates the capacity required
in line with the demand curve. The capacity market clears when the remaining capacity is less than or
equal to the demand at the Bidding Round Price Floor. When there is no exact match between supply
capacity and the Demand Curve, a clearing algorithm is applied to optimize any over/under
procurement.
Demand Curve Parameters
In the third GB capacity market auction, target capacity of 51.7 GW was set (which excluded a provision
of 0.6 GW which was set aside for the T-1 auction.107 The price cap was set at £75/kW for 1.5 GW less
than the target, with a net CONE for generation of £49/kW.
Figure 21: GB Capacity Market demand curve for 3rd T-4 auction
Forward Period
The GB capacity market main auction is for four years prior to delivery. Thus participants securing a
capacity agreement in the December 2016 auction will have an obligation to deliver capacity during
system stress events commencing in the delivery year 2020/21. A delivery year runs from October 1st
through September 30th.
107 Department for Business, Energy & Industrial Strategy (2016), “National Grid.” Available at https://www.gov.uk/gov-
ernment/uploads/system/uploads/attachment_data/file/563438/161027_SoS_to_NG_on_CM_Parameters.pdf.

Charles River Associates
Page 124
There will also be an early capacity auction in January 2017 for the delivery year 2017/18 to meet short-
term security of supply requirements as well as a transitional capacity auction to support DSR also for
the delivery year 2017/18.
Commitment Periods
The GB auction has a range of commitment periods. Existing qualifying capacity may secure a capacity
agreement with a duration of one year. However, refurbishing capacity (RC) may secure a three-year
agreement. A CMU qualifies as RC where it is committed to spend at least £130/kW-derated (in the
2016 auction) prior to the commencement of the first delivery year. Participants may enter their plant in
the auction as Refurbishing plant and then re-designate it as an Existing plant during the course of the
auction. New plant which are committed to spend at least £255/kW-derated (in the 2016 auction) may
secure a 15-year agreement.
Multi-period Commitment for New Resources
As noted above, new plant which are committed to spend at least £255/kW-derated (in the 2016
auction) may secure a 15-year agreement.
System-wide
The GB capacity market is system wide and does not split the market in response to any locational
resource adequacy issues.
Resource Use of Supplementary Auctions
It is intended that the T-4 auction will be supplemented by a T-1 auction prior to the delivery year.
In addition, provisions have been made to enable participants to mitigate the risk of penalties in the
event that they are unable to meet their obligation. First, following the T-1 auction, capacity providers
with an active capacity obligation may trade with another party, transferring the obligation providing that
the receiving party has prequalified for the relevant delivery year and does not already hold a capacity
agreement. The original holder then no longer receives capacity payments and has no exposure to
penalties if there is a system stress event.
Second, a CMU that has over-delivered during a system stress event (relative to its capacity obligation)
may transfer its excess to another CMU that did not deliver all of its obligated capacity. The seller would
in this situation not receive over-delivery payments (but would receive some payment from the buyer
of the reallocated volume). Similarly, participants with an over-delivery capability may sell insurance or
hedges to other participants concerned about the risk of under-delivery.
Charles River Associates
Page 125
Qualified Capacity
Participation in the prequalification process is mandatory for licensed generating units that are eligible
to participant (i.e. not otherwise receiving support). CMUs may then submit opt-out declarations on the
basis that either they expect to be non-operational in the delivery year or are sufficiently concerned that
they may not be operational that they do not wish to take on the liability of a capacity agreement for
that year.
Qualifying capacity is derated by a technology specific general derating factor. For example, CCGTs
are subject to a 90% derating factor, while nuclear plants are derated by 84.36%. DSR is derated by
86.88%.
Resource Eligibility Requirements
Additional information must be submitted by CMUs seeking to qualify as refurbishing or new build
CMUs. New build CMUs will need to declare that all relevant planning consents have been obtained
(or will be obtained prior to the commencement of the auction). It is also necessary to submit a
construction plan with a description of the proposed works (including schedule for achieving
construction milestones) and the amount of capital expenditure. Transmission and distribution
connection agreements or offers must also be provided. Credit cover must also be provided. Similar
information must also be provided by a refurbishing CMU.
DSR may be aggregated to meet a minimum CMU size of 2 MW but in aggregate should not exceed
50MW. DSR is subject to testing either prior to prequalification or prior to the delivery year.
Resource Obligations
CMUs that have secured a capacity agreement must deliver against their capacity obligation at times
of system stress. Capacity providers will not be called upon or individually dispatched. Capacity
providers can meet their obligation by scheduling generation or proactively reducing consumption to
deliver the adjusted load following capacity obligation (ALFCO) following a capacity market warning.
The capacity provider’s base obligation is the derated capacity bid into the auction. But this may be
modified proportionately to system demand during the period of system stress. The ALFCO also takes
into account any instructions from the SO in accordance with balancing service contracts that may
impede the CMU from meeting its obligation.
A capacity market warning is issued when the anticipated system margin in four hours is less than
500MW. However, a capacity market warning will also apply even where the system stress event has
not been forecast. It remains in place until the forecast available margin is greater than 500MW. When
a capacity market warning has been issued, providers must deliver their ALFCO in four hours to avoid
a penalty, should a system stress event be active at that time. A system stress event has occurred
Charles River Associates
Page 126
where there has been involuntary demand reduction (as instructed by the SO and which was not due
to network failures).
Non-Performance Penalties
The penalty rate is equal to a maximum of 1/24th of the auction clearing price expressed in MWh. (For
example, £19.40 clearing price leads to a maximum penalty of £808.33/MWh.) No more than 200% of
a monthly capacity payment can be forfeited in any single month through capacity payments and no
more than 100% of annual capacity payments in total can be forfeited through penalties.
Measurement and Verification
EMR Settlement Limited (see Figure 20) receives metered data, calculates payments and charges,
issues invoices and collects payments and manages settlements and any payment reconciliations that
may be required.108 The Electricity Settlements Company has outsourced the Metering Technical
Assurance process to a Management Services Provider (MSP). The MSP will appoint a suitably
qualified agent to check compliance to the technical specifications and perform onsite testing.
Cost Recovery Mechanisms
The costs of the capacity market are recovered through a levy on suppliers. Final retail rates are not
regulated but any levy may be passed through to the final customers if it is levied equally (in proportion
to load) across all suppliers.
Market Power Mitigation
The GB capacity market has several market power mitigation mechanisms:
Mandatory participation with opt-outs. The requirement for existing plants to opt out, if they expect
to be non-operational, results in greater regulatory focus on these plants if they do not subsequently
shut-down or mothball.
Price-taker threshold. Existing plants are designated price-takers and may not exit the auction until
prices fall at least as low as £25/kW-yr.
Price cap. The auction commences at the price cap.
One-way exits. Plants that exit the auction may not re-enter at a lower price.
108 https://www.emrsettlement.co.uk/
Charles River Associates
Page 127
Capacity Market Performance
December 2014 T-4 Auction
Market expectations for the first T-4 auction ranged from around £30/kW to £50/kW. The market
clearing price was expected to be set by older coal-fired plants deferring retirement. However, the
auction concluded after 11 rounds with a clearing price of only £19.40/kW-yr. A total of 65.4 GW of
capacity pre-qualified for the auction against a target of 48.6 GW. In outturn, 75% of prequalified
capacity, or 49.3 GW, were awarded contracts following application of the auction clearing algorithm.
Only 2.6GW of contracts were awarded to new build generating capacity. Capacity that exited the
auction above the clearing price included 5.9 GW of existing generation and 6.8 GW of new build. The
pre-qualified new build of 9.8 GW was mostly CCGT (7.2 GW) but included in addition 2.6 GW of
embedded generation (connected to distribution networks). Around 1 GW of new embedded generation
cleared the auction. The remaining new build that cleared the auction was Trafford Power a 1.6GW
CCGT. But Trafford Power subsequently failed to reach financial close and was compelled to cancel its
capacity agreement.
December 2015 T-4 Auction
In the 2015 capacity market auction, a total of 57.7 GW derated capacity pre-qualified against an initial
target capacity of 44.7 GW. Net CONE and the price cap remained unchanged from the first auction.
There was a substantial increase in prequalification by embedded generation, mainly small scale diesel
and gas-fired gensets, with about 8.6 GW of new and existing distribution-connected capacity pre-
qualifying for the auction. Around 3% of the prequalified capacity was derated interconnector capacity.
As in the first auction, there was limited DSR.
Following the pre-qualification, National Grid recommended a reduction in the target capacity to 45.4
GW to reflect 5 CMUs which opted out, but nevertheless are likely to remain operational in the coming
delivery year.
A total of 46,354MW of capacity was awarded in the 2015 T-4 auction at a clearing price of
£18.00/kW/year. This resulted in 1,689MW of extra capacity being awarded over the target level. New
build generating capacity accounted for around 1.94GW of total acquired capacity, whilst existing
interconnector CMU capacity accounted for another 1.86GW. Almost half of this new build capacity that
secured an agreement was due to Carrington Power Limited’s CCGT project (805MW) which was
already largely complete (and which accepted a one-year agreement as opposed to a 15-year
agreement). The remaining 1.13GW of capacity comprised mainly small scale distribution-connected
generators, such as small scale diesel and gas reciprocating engines and energy from waste.
The low clearing price (relative to CONE) of £49/kW and the success of embedded generation then led
some market participants to raise concerns about the structure of network charges. Suppliers can net
Charles River Associates
Page 128
off from their peak demand any contribution of generation from embedded gensets and thereby mitigate
their liability to network charges. This benefit, was, in practice, shared with embedded generators,
allowing them to substantially reduce their capacity market bids. Prior to the December 2016 auction,
Ofgem announced that network charges would be reviewed and, in effect, that gensets should not rely
on such network charge avoidance to support their bids.
December 2016 T-4 Auction
In the December 2016 T-4 auction, 69.8 GW prequalified against a target capacity of 51.7 GW. 52.4
GW of capacity were awarded capacity agreements at a clearing price of £22.50/kW/year.109 This
included new build capacity of 3.4 GW and 0.8 GW of refurbishing or pre-refurbishing capacity. A
substantial amount of storage (3.2 GW) was successful at winning an agreement. Small scale gensets
were again successful. A total of 316 units, at 25MW or below, won contracts, bringing the total number
contracted to nearly 500, an increase of around 50% over last year. New build CCGTs or OCGTs were
again largely unsuccessful; Centrica won an agreement for a small-scale gas plant at Kings Lynn and
Intergen for an extension of their existing plant at Spalding.
109 Provisional results as of 13th December 2016.

Charles River Associates
Page 129
Appendix F: Ireland
Market at a Glance
The Republic of Ireland and Northern Ireland has had a single electricity market (SEM) since November
2007. It has approximately 11 GW of registered capacity and 76 participants, with 50% of its capacity
coming from gas-fired generation sources and the remaining 50% coming from wind (14.5%), coal
(11%), and others.110 The market functions as a centrally-traded pool where all electricity is sold and
purchased. It is presently an island market with no interconnection capability. Electricity prices track
fuel prices quite closely in the SEM with gas (49% of all generation in 2015) and coal (19% of all
generation in 2015)111 being the leading fuels.
Background
The EU is in the process of developing an internal market for electricity and has set in place provisions
for the implementation of a European Electricity Target Model. This is a set of harmonized
arrangements for cross-border trading of wholesale electricity and balancing services across Europe.
As a result, the authorities in Dublin and Belfast are required to reform the wholesale electricity trading
arrangements in the Single Electricity Market of Ireland (I-SEM).112 This in turn means that the existing
method for the remuneration of capacity will soon cease to be feasible. The existing method is a simple
‘adder’ to the wholesale power price calculated as a function of the best new entrant price, or CONE,
and the LOLP. It is not compatible with the European Electricity Target Model because the capacity
price is not finally fixed until after real-time and is inconsistent with cross-border market coupling
arrangements which make trades on the basis of revealed prices prior to real-time. Consequently, the
SEM committee is in the process of designing a new capacity remuneration mechanism.113
The decisions that have been taken in relation to the design of the new capacity remuneration
mechanism are set out below. However, the new mechanism has not yet been implemented; the design
is still subject to change and there is yet no experience of its performance.
Currently, I-SEM is a gross mandatory pool with a single market clearing price, the system marginal
price (SMP) for period. However, the renewable energy feed-in tariff (REFIT) does provide a
110 SEMO (July 2013), “SEM Market Overview.” Available at http://www.sem-o.com/Publications/Gen-
eral/SEMO%20Market%20Overview.pdf.
111 IEA (2015), “Ireland – Energy System Overview.” Available at http://www.iea.org/media/countries/Ireland.pdf.
112 The island of Ireland has a single electricity market encompassing both the Republic of Ireland and Northern Ireland.
113 SEM Committee (September 2014), “Single Electricity Market Committee.: Available at https://www.semcommit-
tee.com/sites/semcommittee.com/files/media-files/SEM-14-085a%20I-SEM%20SEMC%20Decision%20on%20HLD.pdf.

Charles River Associates
Page 130
guaranteed minimum unit price regardless of the SMP. There is also a capacity payment mechanism
for available capacity. The market also rewards the provision of capacity and ancillary services such as
fast-acting reserve by generators. There is a day-ahead market where generators are legally required
to bid based on their short run marginal costs (comprising fuel, carbon and variable operation and
maintenance costs). Generation dispatch is merit-order-based and the market schedule does not
consider reserve or transmission constraints. Deviations between the market and the system are
captured by dispatch balancing costs.114 Competition is enforced primarily by regulating and monitoring
spot market bids to ensure they are reflective of generator’s true marginal costs. Through the regulation
and bidding code of practice, generators are legally required to bid their short-run marginal costs. This,
along with constraint payments, based on the difference between expected and actual dispatch, helps
to ensure wholesale prices remain at competitive levels.115
High-level summary of proposed capacity market
The proposed capacity market116 comprises the centralized auction of reliability options (ROs). These
are call option contracts where the holder of the option is paid an annual payment in return for the TSO
having the right to call on the option holder to provide energy at a pre-determined strike price. This
means that the holders of ROs are required to rebate to the TSO the difference between the relevant
market price and the strike price when the market price exceeds the strike price. This provides the
holders of ROs with an incentive to generate (or sell back energy) at such times of high market prices.
Figure 22: Reliability Option Difference Payments
114 SEMO (July 2013), “SEM Market Overview.” Available at http://www.sem-o.com/Publications/Gen-
eral/SEMO%20Market%20Overview.pdf.
115 Di Cosmo, V and Lynch, MÁ. (2015), “Competition and the Single Electricity Market: Which Lessons for Ireland?” ESRI
Working Paper No. 497.
116 Information for this section has been principally derived from a series of decision papers prepared by the SEM
Committee. These are available on the SEM Committee website at https://www.semcommittee.com/i-sem.

Charles River Associates
Page 131
The centralized auction is settled on a pay-as-cleared, single price basis. The resources issuing ROs
must be backed by a physical resource that is capable of providing capacity when required.
Evolution of Capacity Market Design
The SEM committee considered adopting an energy-only market but was concerned, among other
issues, about the ‘missing money’ problem due mainly to regulatory intervention, as well as the inability
of market participants to find long-term price or volume hedges.117 So, the SEM committee considered
the full scope of possible capacity remuneration mechanisms, as shown in Figure 23.
Figure 23: Capacity Remuneration Mechanisms
Source: https://www.semcommittee.com/sites/semcommittee.com/files/media-files/SEM-14008%20ISEM%20HLD%20
Consultation%20Document.pdf
In summary:
Strategic reserves were considered an overly regulated solution and with the risk of becoming the
principal ‘market’ for new entry.
Quantity-based mechanisms were preferred over price-based mechanisms as being more market-
based with potentially lower regulatory uncertainty and risk for market participants.
Quantity-based capacity obligations required a more proactive engagement from suppliers and
investor certainty is dependent on the hedging appetite of suppliers.
117 I-SEM (February 2014) “Integrated Single Electricity Market,” paragprah 10.3.3. Available at https://www.semcommit-
tee.com/sites/semcommittee.com/files/media-files/SEM-14-008%20ISEM%20HLD%20Consultation%20Document.pdf.

Charles River Associates
Page 132
Centralized ROs were preferred over decentralized ROs due to the lack of experience with
decentralized ROs and their greater complexity.
Proposed Capacity Market Design
Institutional arrangements
The TSOs of the Republic of Ireland and Northern Ireland will be responsible for the delivery of the
capacity auction and ROs, including administration and qualification for the capacity auction and
administration of the capacity market rules, subject to approval and oversight by the regulatory
authorities of the Republic of Ireland and Northern Ireland.
There is no central counterparty body sitting between suppliers and capacity providers. Instead,
payment flows between suppliers and capacity providers subject to pre-defined rules. This is illustrated
below.
Figure 24: Settlement arrangements
Resource Adequacy Obligation
The LOLE security standard is eight hours (in contrast to the three hours LOLE standard in the
interconnected GB market). It was concluded that moving to 3 hours would increase costs without
delivering an improvement in value (since a higher margin would be required in Ireland to provide a 3
hours LOLE than in GB given the smaller size of the system). In any case, given the small size of the
system and the tendency for capacity additions to be ‘lumpy’, it is expected that in practice LOLE will
be mostly lower than 8 hours.
The aggregate capacity requirement will be determined by the TSOs, subject to approval by the regu-
latory authorities, on the basis of analyzing a number of demand scenarios and considering de-rated
capacity. The approach is expected to evolve in line with the guidelines from the European Network of

Charles River Associates
Page 133
Transmission System Operators (ENTSO-E). The TSOs then have the obligation to procure the target
capacity.
Product design - the Reliability Option
The RO takes the form of a one-way contract for difference (CfD) with a strike price (SP) and a market
reference price (MRP).
Energy market prices will rise above the SP during periods of system stress due, in part, to ad-
ministered scarcity pricing (ASP). ASP is triggered when capacity is scarce and there is insufficient
capacity to cover demand and the target level of reserve prior to load shedding. ASP is implemented
in the balancing mechanism using a function specifying the loss of load probability (LOLP) times full
ASP.118 The full ASP will initially be €3000/MWh (the maximum day-ahead price in the target model
software) but will subsequently rise to be based on a percentage of VOLL. The SP is set on a ‘floating’
basis. This means that it will vary in line with changes in fuel costs for a low efficiency, high variable
cost plant.
Figure 25: Piecewise linear Administered Scarcity Pricing Function
The MRP is a ‘split’ reference price whereby a capacity providers’ ROs are settled on the capacity
provider’s:
volumes sold in the day-ahead market (DAM) at the DAM reference price;
118 This is similar to the scarcity pricing function recently implemented in the GB balancing mechanism.

Charles River Associates
Page 134
volumes sold in intra-day markets at the intra-day MRPs; and
any remaining volumes at the BM reference price.
If the sum of the capacity provider’s volumes exceeds RO volumes, then DAM volumes are settled
ahead of intra-day volumes, which are settled ahead of BM volumes. Capacity providers responding to
TSO instructions will have the relevant part of their RO commitment settled with reference to their
reserve/system services income.
The same split market RO settlement will apply to suppliers. Suppliers receive the difference payments
made by capacity providers, as shown below. The cost of capacity from the RO fees are recovered
from suppliers as a fixed €/MWh charge allocated across supplier demand in a pre-defined set of half
hours that are judged to be those most likely to have high LoLP values. This is shown below.
Figure 26: Reliability Option Cash-flows
Clearing Mechanism
Unlike the GB auction, the SEM committee rejected the option of a multiple round descending clock
auction. This is principally from concern that such a design increases the risk for the exercise of
unilateral market power or tacit collusion by bidders. Instead, the committee decided that bidders may
offer a single sealed bid price-quantity pair. A bidder may also declare its bid inflexible which then
compels the auctioneer to except all or nothing of the bid.

Charles River Associates
Page 135
The auction will pay-as-clear for all bids accepted within an unconstrained merit order and pay-as-bid
for any bids accepted out of merit either for “lumpiness” reasons119 or in the context of transmission
constraints. If the marginal bid is inflexible, then a social welfare test will be applied to determine
whether to accept it or to accept out-of-merit bids. The SEM committee has noted that in time it may
move to a full combinatorial auction format.
Demand Curve Parameters
A sloped demand curve has been adopted because it mitigates the exercise of market power as the
target required capacity is approached in the auction. It also allows for the procurement of more/less
capacity in respond to market prices which is economically efficient.
Forward Period
The SEM committee has decided that the main auction will be four years prior to delivery (T-4 auction).
There will be transitional T-1 auctions for each of the delivery years prior to the first T-4 delivery year
and T-1 auctions for subsequent delivery years. The subsequent T-1 auctions will allow for residual
capacity requirements (not anticipated at T-4) and for DSUs uncertain of their demand at T-4.
Commitment Period
Existing resources that clear the auction will be awarded an RO for a period of one year. However, any
new capacity provider meeting the significant financial commitment criteria will be able to bid for a
contract for any number of integer years up to a maximum of 10 years. This allowed duration may be
amended from time to time (but only for new contracts). There is no distinction between new and
refurbishing plant; the same financial commitment criteria are applied.
System-wide or Locational Based
It was initially decided that the I-SEM capacity requirement should be determined for I-SEM as a whole
rather than for separate geographic zones. However, there is a risk that a plant needed for locational
reasons may not clear in the auction and so may be at risk of premature closure. It has most recently
been decided that, for locational reasons, some bidders may not be rejected in the unconstrained merit
order of bids. Consequently, capacity secured to meet constraints is additional to that which clears in
the unconstrained auction. Capacity requirements are specified in nested capacity areas within the
overall capacity requirement.
119 This problem arises where the marginal bid is marked inflexible.

Charles River Associates
Page 136
Resource Use of Supplementary Auctions
In addition to T-1 auctions, secondary trading of RO is permitted. The SEM committee decided to
develop a mandatory centralized market for secondary trading of standardized products. Capacity
available for trading may come from the margin between nameplate and derated capacity and from
load-following (i.e. the reduction in obligated capacity in periods away from peak demand). Stop-loss
limits (explained below in relation to performance penalties) are not transferred between trading plants.
Also, participants may offset their ROs with back-to-back financial contracts.
Qualified Capacity
It is mandatory for dispatchable generation to participate in the capacity auction (unless it will be closed
before the end of the delivery period). Such generators are not deemed to be exposed to excessive
risk by being required to participate, but will be able to adjust their bid capacity within tolerance bands.
Derating is applied to generators’ MW capacity based on technology type, but with an allowance for
plant size, and after taking account of the correlation between the availability of a given technology type
and the occurrence of system stress periods. It may only be adjusted for individual generators subject
to further technical justification. This approach is regarded as a mitigation against the exercise of market
power. Variable generation is eligible but may choose not to submit a bid. Generation that is receiving
support from other sources (such as peat and wind generation) is eligible in the Irish capacity auction
(unlike GB which excludes such plant). This approach is intended to maximize competition.
The I-SEM will adopt broadly the same approach to interconnector participation as GB. Interconnectors
may directly participate and will receive the same fee as other resource providers. The interconnector
only pays difference payments if it is technically unavailable when the MRP exceeds the RO SP. A de-
rating methodology for interconnector has yet to be developed.
Demand-side Units (DSUs) are also able to participate. DSUs are not credited with the value of demand
reduction and do not make RO difference payments when contracted demand reduction is applied.
However, an RO difference payment is required when the demand reduction is not delivered when the
SP exceeds the MRP.
Resource Eligibility Requirements
Requirements for new plants to participate include provision of information relating to planning
consents, connection agreements, property rights and financial commitments.
Resource Obligations
RO MW obligations may be scaled down if a period of system stress occurs outside peak demand
periods.

Charles River Associates
Page 137
Non-Performance Penalties
The SEM committee has decided that with the introduction of the ASP, RO difference payments with a
split MRP should be sufficient to incentivize capacity providers to make their capacity available at times
of system stress without any additional performance incentives. Variable generators are subject to the
same performance incentives as conventional generators. This is on the basis that volume bids may
be adjusted to manage output risks. However, an overall ‘stop-loss’ limit will be set capping annual
losses at 1.5 times annual capacity fees.
It is not mandatory for variable plant to participate in the RO auctions. This means that suppliers may
not be fully covered against high prices during system stress events. There are several other reasons
why there may be insufficient cover for suppliers, including demand forecast error, capacity providers’
stop-loss caps, and the treatment of demand response. Any shortfall in the hedge provided through
ROs will be socialized across all suppliers.
There is a termination fee payable by new or refurbished plants failing to complete their works. The
final levels of termination fees and performance bonds have yet to be determined. It is expected that
the termination will rise progressively through the construction period and may reach €47-55/kW.
Cost Recovery Mechanisms
RO fees are recovered from suppliers on the basis of their share of peak demand.
Market Power Mitigation
Market power is mitigated in a number of ways. Most importantly, mandatory participation is required
for existing dispatchable generation that must bid their declared MW and remain in the auction until a
pre-defined maximum exit price is reached. Variable generation having committed to bid must also bid
their declared MW into the auction until a pre-defined maximum exit price is reached.
Further market power mitigation measures include the following.
Auction price cap. Most auctions will have an Auction price Cap setting a maximum price which
qualified bidders may offer.
Existing Capacity Price Cap. All existing generators will be required to bid their full qualified
capacity into the auctions at a price no higher than the existing capacity price cap (unless they
apply for an exemption). New build capacity and DSUIs are not subject to the existing capacity
price cap. Existing generation capacity that can show it has higher gong-forward costs than the
existing capacity price cap may apply for an exemption to bid up to the level of these going-forward
costs (which are estimated net of intra-marginal rents from the energy and ancillary services
markets).

Charles River Associates
Page 138
Sloping demand curve. The sloping demand curve is intended to mitigate the impact of strategic
bidding and capacity withdrawals close to the target capacity amount.
Locational market power. New build capacity will only be able to obtain a RO of more than
1 year duration if it is in merit in the unconstrained auction (though this may be revisited on a
case-by-case basis).
Charles River Associates
Page 139
Appendix G: California ISO (CAISO)
Market at a Glance
The competitive market for electric power in California is run by the California ISO (CAISO). The CAISO
operates a day-ahead and real-time market in a territory that includes about 80% of California, has a
peak load of approximately 47,000 MW, and serves more than 30 million ultimate customers. The
CAISO market began operation in 1998. Following the Western energy crisis in 2000-2001, the CAISO
suspended market operations until 2010, at which point the CAISO began operations under a
redesigned and modernized set of market rules. Market participants include vertically integrated utilities
and merchant generators. More recently, the CAISO has begun operation of a market for imbalance
energy that spans a larger portion of the United States’ western interconnection. In California some
choice in retail providers is available for a capped percentage of commercial and industrial consumers
of the three major investor owned utilities (IOU).
The CAISO does not, however, operate a centralized capacity market. Rather, CAISO rules support
resource adequacy requirements established by the California Public Utilities Commission (CPUC) and
resource planning activities that are undertaken in part by a number of entities, including the CPUC,
the ISO, the California Energy Commission (CEC), and the IOUs and other LSEs. This section will first
describe the different processes and rules related to resource adequacy constructs in California. Then,
where possible, the California constructs will be detailed in the same terms as are used in the wholesale
markets with traditional capacity markets. Finally, there will be a description of identified concerns in
the capacity constructs in California and some of the proposals for remedying those issues.
California’s Capacity Constructs
Long-Term Planning for Resource Adequacy
The primary long term planning for resource adequacy is performed by the CPUC, in collaboration with
the IOUs. Following the Western energy crisis, responsibility for procuring generation supplies was
assigned to the CPUC in state legislation. The CPUC and IOUs fulfill this responsibility by developing
long-term procurement plans (LTPP) on a biennial basis. These plans look forward 10 years and
consider forecasted supply, demand, new builds, retirements, demand response, and other system
conditions. When completed, the plans are used for two purposes. First, they inform short- and medium-
term procurement–largely contracts–to meet the needs of bundled customers. Second, the LTPPs are
used to determine long-term system-wide needs, including those of competitive service providers and
community choice aggregators, and whether the IOUs will contract to build new conventional
generators. When considering resource procurement, state policy dictates a “loading order,” which
requires, in order, consideration of energy efficiency, demand response, renewables, and efficient fossil
fuel generation to serve system needs. If the plan ultimately determines that new conventional

Charles River Associates
Page 140
generation is necessary, that generation is procured using a request for offers by which the assets are
developed through long-term contracts or IOU ownership. To ensure funding, beginning in 2007 the
CPUC authorized new generation resource – procured for reliability purposes as part of the LTPP
process – to have their costs allocated to benefitting ratepayers as part of the cost allocation mechanism
(CAM).
Resource Adequacy Requirements of the CPUC
Short-term resource adequacy, establishing requirements for capacity needs just prior to delivery, is
based in the CPUC’s Resource Adequacy Requirements (RAR). The RAR mechanism has three parts:
System-wide resource adequacy: Implemented in 2004 following the Western energy crisis, RAR
obligation calls for each LSE under CPUC jurisdiction to procure capacity sufficient to meet its
customers’ peak load plus a 15% reserve requirement.
Local resource adequacy: Implemented in 2006, local RAR obligations ensure that LSEs are able
to serve load reliably within import-constrained load areas.
Flexible resource adequacy: Implemented in 2015, largely in response to increased ramping
needs resulting from high renewables penetrations. Requirements are set on a monthly basis
based on the maximum forecasted contiguous three-hour net load plus a contingency factor. This
program is still considered “interim” with the hope that a more permanent solution is developed for
implementation after 2017.
Each LSE must demonstrate that it has fulfilled its RAR obligation and reference the specific resources
from which it has procured capacity.120 In October, LSEs submit supply plans for each month of the
coming calendar year showing 90% of system and flexible requirements and 100% of local
requirements. Then, ahead of each month, each LSE must demonstrate 100% of both requirements.
This creates a short-term bilateral market for capacity where LSEs procure their incremental capacity
needs to fulfil their full RAR obligation. LSEs that fail to fulfill their obligation are subject to a penalty
and the cost that the CAISO will incur in replacing capacity on their behalf, though this has never
happened.
CAISO Backstop
If any LSE’s fail to fulfill their RAR requirements prior to delivery, or if there are other circumstances
that may introduce resource adequacy concerns, the CAISO has a backstop reliability mechanisms to
allow it to address any deficiencies. If an LSE is deficient in procuring capacity sufficient to meet its
120 These requirements only apply to non-CPUC-jurisdictional entities or entities that are not within the CAISO footprint
(i.e. the Los Angeles Department of Water and Power).

Charles River Associates
Page 141
RAR obligations–a circumstance that has not taken place to date–the CAISO will procure an amount
of capacity necessary to remedy the deficiency. As described prior, the LSE will then be responsible
for a penalty plus the cost of capacity procurement.
The CAISO may also determine the need to procure backstop capacity under the capacity procurement
mechanism (CPM) for reliability reasons other than those associated with RAR obligations. For
example, if the CAISO establishes that a resource is slated to retire but will be needed to meet future
RAR obligations, it may intervene to prevent retirement. CPM payments may also be provided if LSEs
have met their RAR obligations, but the CAISO nonetheless anticipates deficiencies that will affect
reliability, due to “significant events” or other issues, or if the CAISO sees a need to manually dispatch
(“exceptional dispatch”) a unit for reliability purposes. In recent years, these provisions have primarily
been used to support two reliability must-run (RMR) power plants and a limited number of additional
short-term procurements to resolve local reliability issues.
Elements of Current Resource Adequacy Construct
Resource Adequacy Obligation
LSEs generally bear the obligation to procure sufficient capacity to satisfy resource adequacy
requirements. What exactly the requirements for resource adequacy are on a system, local, and flexible
basis are developed based on CPUC standards and in coordination with the CPUC and the CAISO.
Integrated Planning Process
The LTPP is part of a suite of planning processes performed by the CPUC, the CAISO, and California
Energy Commission (CE). The CEC’s roll is focused on forecasting energy demand. Like the LTPP,
the CEC develops an integrated energy policy report on a biennial basis. The resulting demand
forecasts are used as inputs to the other planning processes. As described above, the LTPP is
conducted by the CPUC and focused on both needs assessment and procurement of resources needed
to maintain resource adequacy. The third interlinked planning process is the CAISO’s transmission
planning process (TPP). The full TPP cycle is also two years long and staggered relative to the LTPP
process. The TPP is informed the by resource plan established in the LTPP, and its outputs also serve
to inform LTPP processes by providing information on transmission development, transmission
constraints, and establishment of flexible capacity needs.
Forward Period
Most resources that are used to fulfill RAR obligations are announced in October before the calendar
year in which they will be used. Incremental resources used to fulfill the ultimate requirements must be
reported immediately ahead of the delivery month. One might consider the forward period to be longer
for resources that enter into long-term contracts for capacity with LSEs or that are kept online for RMR

Charles River Associates
Page 142
purposes, but there is no other formal forward period that extends further in advance of the delivery
year or month.
Commitment Period
Most resources are committed for the full year to fulfill an LSE’s RAR obligations. However, resources
traded bilaterally may only effectively be committed ahead of each month for a one-month period.
Multi-Period Commitment for New Resources
To the extent that a new resource is able to enter a long-term contract to provide capacity, or that it is
owned by an LSE or IOU, it could be considered for a multi-period commitment. However, there is no
explicit provision for new resources to be committed to provide resource adequacy capacity for periods
longer than a year.
System-wide or Locational Based
As described above, the RAR mechanism has both system-wide and locational components. Local
resource adequacy requirements are established in instances where load centers are import
constrained.
Resource Use of Supplementary Auctions
While not technically a supplemental auction, the bilateral markets ahead of each delivery month allow
LSE’s to buy and sell capacity to ensure that RAR obligations are met for the delivery period.
Qualified Capacity
Qualified capacity is defined by the CPUC and varies by resource type. For dispatchable resources,
the qualifying capacity is based on the most recent PMax performance test, which requires a
demonstration of maximum generator output for 30 minutes. For renewable generators and non-
dispatchable hydro, the qualified capacity value is based on historical performance. For CHP and
biomass resources that are not fully dispatchable, qualifying capacity values are based on MW offered
in the day-ahead market. Qualifying capacity values can be adjusted downward if they are determined
to be non-deliverable due to transmission constraints.
Resource Obligations
Resources that are counted toward the RAR obligations generally have a must-offer obligation into the
day-ahead and real-time energy markets, though allowances are made for outages. Certain resources
are excluded from this obligation and are not required to offer for all hours of the month, including hydro
resources, use-limited thermal resources, and non-dispatchable generators. Satisfying the must-offer
obligation can be accomplished by submitting economic offers or self-schedules as follows:

Charles River Associates
Page 143
Day-ahead energy and ancillary services market. All available obligated resources must-offer
or self-schedule for all qualified services (i.e., if a resource is certified to provide ancillary services,
it must-offer that capacity into that market).
Residual unit commitment process. All resource adequacy capacity must bid at $0/MWh for this
process
Real-time market. Any resource committed in day-ahead or in the residual unit commitment
process must be available in the real-time market. Quick-start resources must bid into the real-time
market regardless of whether they are committed in the earlier markets.
Additionally, flexibility capacity resources have different must-offer obligations depending on their
characteristics. There are three levels of flexibility resources–base, peak, and super-peak–each with a
different set of offer requirements that reflect the need for ramping capability at different times.
Non-Performance Penalties
The CAISO’s previous generator performance and availability program is called the standard capacity
product (SCP). SCP monitored and penalized a scheduling coordinator based on resource performance
and availability. Units that under-performed relative to a monthly standard (and outside of a tolerance
range) were penalized, while resources that over-performed were eligible to receive incentive payments
from the pool of underperformance payments. The CAISO has recently implemented a new mechanism
to ensure that capacity resources are available to the ISO, called resource adequacy availability
incentive mechanisms (RAAIM). RAAIM replaces the SCP program; it functions similarly but introduces
a penalty system based on a resource’s economic and self-scheduled bids rather SCP’s evaluation of
availability based on forced outages. The RAAIM penalty is 3.79/kw-month, 60% of the soft offer cap
that CAISO would use if it needed to procure back up resources for a RAR noncompliant LSE.
Cost Recovery Mechanism
The CPUC reports that most forward capacity procurement is accomplished through bilateral
contracting. However, some resource may have their costs allocated through the CAISO tariff, including
cost allocation mechanism (CAM) and RMR units. Resources procured through with the CAM
mechanism are procured either on behalf of the IOUs’ bundled customers or on behalf of all benefitting
customers. Costs are allocated accordingly. When procurement is on behalf of bundled customers,
those customers pay. When procurement is on behalf of all customers, the project costs may be
allocated to all customers through non-bypassable charges in retail rates. Rights to a portion of the
capacity supplied as granted to all paying parties. If customers purchasing from competitive suppliers
are determined to benefit, they may also be allocated costs as well as being granted a right to a portion
of the associated supply.

Charles River Associates
Page 144
Market Power Mitigation
There is no separate process for the mitigation of market power in the California resource adequacy
construct. However, RAR obligations plus must-offer requirements provide protection to the market by
ensuring sufficient supply and preventing physical withholding. Of course, additional market power mit-
igation measures are in place in the day-ahead and real-time markets to address the economic aspects
of submitted offers.
Other Resource Adequacy Considerations
Due to progressive policies, California has significant penetrations of EE and distributed generation
(DG) assets. EE and DG and netted from system load forecasts by the CEC in the process that leads
to the CPUCs determination of LSEs’ RAR obligations.
Resource Adequacy Mechanism Performance
In its most recent report on market issues and performance, the CAISO Department of Market Monitor-
ing (DMM) reports that the RAR mechanism is working well at procuring sufficient capacity to maintain
reliability. At both system and local levels, capacity was sufficient to meet requirements. The only major
exception is the retirement of the 2.2 GW of capacity associated with the retirement of the San Onofre
Nuclear Generating Station, which has led to the need to maintain RMR contracts with several nearby
units acting as synchronous condensers. Additionally, the flexible RAR requirements were satisfied
(and exceeded) for 2015 all months but January, and availability levels were high, even without an
incentive mechanism. However, hour-specific flexible resource availability sometimes fell short of the
ramping need during periods of maximum net load ramp.
The DMM also expressed concern over several aspects of the resource adequacy construct. First,
though the CAISO has been working to establish performance metrics by measuring compliance with
must-offer obligations, the DMM notes that this method has flaws. Specifically, relying on the presence
of market offers as a measure of compliance may allow a resource to offer without necessarily having
the ability to perform. Such behavior could lead to the errors ISO’s assumptions about resource
characteristics, thus causing the resource adequacy process to fail to ensure reliability. The DMM
recommends that ISO “consider performance based enhancements to this mechanism to penalize
resources that cannot consistently perform at the standards the ISO assumes for the resources in the
ISO’s reliability studies.” Separately, the DMM has expressed concern about the RAR penalty price; if
it is too low, resources may opt to pay the penalty rather than procuring costly capacity resource to fulfill
their obligations.