Embed Size (px)
Citation preview

City of Socorro Water Conservation Plan
2016

Prepared by Torres Research & Consulting Services
Engineering and Water Audit provided by
Dennis Engineering Company Graphics provided by Greenwood Technical Support Services
Acknowledgment
With special thanks to the City of Socorro Utility and Management Staff,
whose cooperation and participation made the completion of this project possible.
Planning Team:
Suzanne Smith, Torres Research & Consulting Services
Steve Williams, Tappan Mahoney, Cory Pierce, Dennis Engineering Company
Lloyd Martinez, Mable Gonzales, Bobbi Gonzales, Ruby Lopez, City of Socorro
Gina Dello Russo, Planning Coordinator


Water Conservation Plan 2016
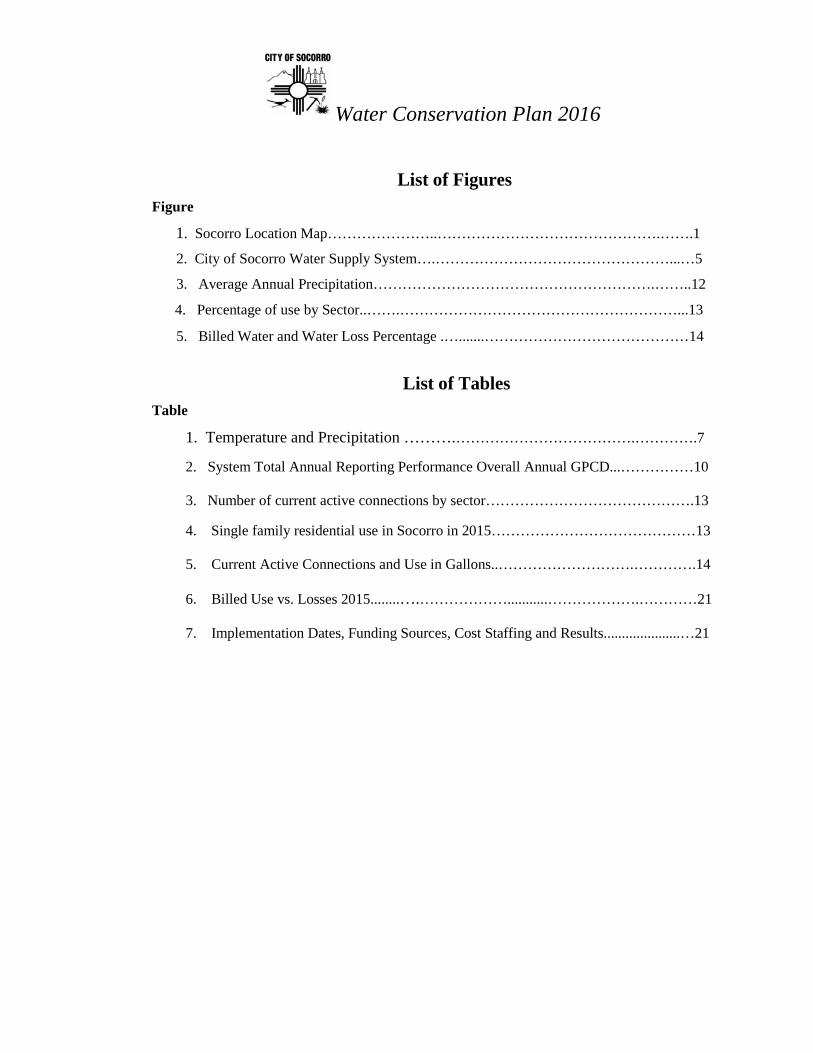
List of Figures
Figure
1. Socorro Location Map…………………..……………………………………….…….1
2. City of Socorro Water Supply System….…………………………………………...…5
3. Average Annual Precipitation………………………………………………….……..12
4. Percentage of use by Sector..…….…………………………………………………...13
5. Billed Water and Water Loss Percentage .….......……………………………………14
List of Tables
Table
1. Temperature and Precipitation ……….……………………………….………….7
2. System Total Annual Reporting Performance Overall Annual GPCD...……………10
3. Number of current active connections by sector…………………………………….13
4. Single family residential use in Socorro in 2015……………………………………13 5. Current Active Connections and Use in Gallons..……………………….………….14 6. Billed Use vs. Losses 2015........….………………...........……………….…………21 7. Implementation Dates, Funding Sources, Cost Staffing and Results.....................…21

Water Conservation Plan 2016
1
EXECUTIVE SUMMARY Socorro, New Mexico is located in the central part of the State within the Rio Grande Valley. It is known for its pure water, and its public water supply system was one of the first in the state to become organized and established. Socorro relies on two springs and 3 production wells for its water supply (City of Socorro 2015), with 3183 connections serving a population of 8750. The system includes 5 storage tanks, 100 miles of delivery lines, and two metered wells for Sedillo Park. Although the City has an ample supply of water from both sources, the City anticipates future growth and wants to ensure that existing available water supplies will be sufficient to meet future demand (City of Socorro 40 Year Supply Plan 2016 in draft). The way to meet future demand with existing supplies is through water conservation. Even if growth objectives are not realized, conservation is an important component of a sustainable water plan for the City of Socorro for several reasons:
• Annual rainfall in our area is limited and water is one of our most precious resources. • The New Mexico water code calls for conservation planning as a prerequisite for
applying for funding from key state funding agencies (NMSA 1978, Section 72-14-3.2). • Water conservation can prevent or delay the need for expensive capital expenditures for
developing new water supplies and acquiring additional water rights. By planning and implementing conservation measures, the City will be better prepared for changes which might affect supply and demand of the resource.
• If the City of Socorro finds the need to make application for changes to their water supply
or rights they will have to apply to the Office of the State Engineer (OSE). The OSE evaluates water rights transactions (including changes in point of diversion or place or purpose of use, as well as new permit applications) with respect to certain criteria that include impairment of existing water rights and conservation and public welfare (Office of the State Engineer, Rules and Regulations). It has been demonstrated that water suppliers with excessive losses will be required to address these issues before the OSE will approve an application to appropriate additional water.
Water conservation statute (NMSA 72-14-3.2) also requires that the City coordinate its planning efforts with Regional Water Planning. The City of Socorro has been represented as part of the
Water Conservation Plan 2016
2
steering committee of the ongoing Socorro-Sierra Regional Water Planning process (New Mexico Office of the State Engineer 2003 and 2016 in draft). The City has demonstrated that it has implemented alternatives and strategies identified in the 2003 regional plan and City of Socorro Water Conservation Plan addresses the State requirements outlined above, and includes emergency conservation measures to be implemented during times of drought (New Mexico Office of the State Engineer 2003). The Water Conservation Bureau of the Office of the State Engineer has provided tools to assist Cities in conservation planning. These include a GPCD (gallons per capita per day) calculator, and AWWA audit software. The results of the calculation and audit are included in Appendix A and B. The GPCD analysis shows that the total present uses for the Socorro water system to be approximately 197 gallons per capita per day. The water audit completed in conjunction with this planning process, scored the City of Socorro 82 out of 100 points for its water management for the period examined. In order to maintain its existing supply and for the reasons outlined above, the City has established the following Conservation Goals:
o Utilize efficient water system management including upgraded water operating system, limiting leaks and losses, and streamlining the data and billing where possible to reduce non-revenue water by 10% from the 2015 analysis by 2020.
o Maintain residential gallon per capita per day (GPCD) at or below 77 to 2020. o Perform water audit and increase the audit validity score from 82 to 90 by 2020. o Reduce waste by improving City irrigation by 2020. o Promote public awareness of conservation programs and public participation in
voluntary conservation measures by 2017. o Design and incorporate water conservation features into new construction by
2020. o Update Water Conservation Plan for long term loss control by evaluating results
and strategies by 2021
For the last several years the City has made substantial improvements to its metering, system management and infrastructure. As an example, in the past few months metering of the springs was upgraded, making measurements more accurate. The City also upgraded their residential metering and billing, making them capable of generating a monthly water disposition report which reconciles estimated versus actual use. Through this planning process and existing conservation practices, the City of Socorro has demonstrated that it is striving to be a “conserving” water supplier based on state criteria.

Water Conservation Plan 2016
3
1. Data Collection
1.1 Purpose As with any other planning process, the purpose of the creation of a water conservation program for the City of Socorro allows the city to analyze its present use, and project future demand, using conservation as a way to sustain a long term water supply for its citizens.
1.2 Planning Team The Planning team was organized utilizing the City of Socorro staff, Torres Research and Consulting Services personnel, Dennis Engineering Company, and a consulting ecologist. The team has the capability to assess, implement and monitor the Water Conservation Plan using existing City staff and hired specialists.
1.3 Local Conditions
1.3.1 Location The City of Socorro is located 70 miles south of Albuquerque and 150 miles north of Las Cruces, and is situated within the Rio Grande Corridor. The Town of Socorro Grant includes Socorro, and encompasses the smaller communities of Escondida, Florida, and the New Mexico School of Mines and covers approximately 28 square miles. The Rio Grande River runs through a portion of the Socorro Grant (Figure 1).

Water Conservation Plan 2016
4
Figure 1
1.3.2 Water Supply Overview The City of Socorro obtains its water supply from two springs and three primary production wells, all located in the Middle Rio Grande Basin which is part of the larger Rio Grande aquifer system. The aquifer system consists of a network of hydraulically interconnected aquifers in basin fill deposits located along the Rio Grande Valley (US Geological Survey). The wells and water system for Socorro is highlighted in blue in Figure 2 below.

Water Conservation Plan 2016
5
Figure 2 The City water supply system is almost entirely gravity fed, and has five pressure zones on the system. These are routinely checked daily and monitored for pressure loss and utility staff strives to maintain working range pressures in each pressure zone. However, leaks, losses, fire hydrant usage, and other localized demand spikes can cause pressure drops. Average city pressure is maintained at approximately 64 psi.
Water Conservation Plan 2016
6
Leak detection on the system itself is determined by monitoring water levels in the storage tanks and observing meters on the main system. Monitoring of tank water levels is done twice a day, and main meters are checked daily for assurance that water pressure and volume remain constant. Recharge to the groundwater system occurs as groundwater inflow, mountain front recharge, and direct infiltration of precipitation on the basin floor and seepage from the surface water features in the basin (MRGWSS, S.S. Papadopulos & Associates 2000). This study included well field data from the City of Socorro. Short term pumping of the three highest capacity wells at rates between 740 and 850 gpm, resulted in less than three feet of drawdown in any well, suggesting that drawdown will not likely be a limiting factor in development. This same study, using the Hearne-Dewey model (Roybal 1991) estimates mountain front recharge in the Socorro and San Marcial areas to be 16,700 acre feet/year.
1.3.3 Demographics The City of Socorro public water delivery was initiated prior to 1876 (History of Socorro; Office of the State Engineer [OSE] files RG-3501 et al). In 1877, the U.S. Surveyor General described the springs at the foot of the Socorro Mountain as capable of providing water to thousands of head of livestock (Sawyer and White 1877). Within a few years the springs were diverted into a large reservoir, and distributed within the Socorro Grant through acequias (earthen ditches) into smaller reservoirs and contra-acequias. In 1887 the public water system was formally organized (W. Carlos Powell 1949). The development of public water distribution at that time was one of the most important attractions to both people and commerce. The railroad, built in 1880, and the industries that boomed during that period, were totally reliant on the abundant water from the Socorro springs. The establishment of the New Mexico School of Mines in 1889 added additional demand on the supply. In 2010, the population of the City of Socorro was 9043 inhabitants; in 2012 the population was 8,906 versus the 2015 population of 8,722 (US Census Quick Facts). Until 1970 the population remained under 6,000 persons with the largest growth occurring from 1970 to 2010. The decline in population since 2010 represents the effect of economic decline in the area, with approximately 32.3% of the population below the poverty line with 23.6% of that, age 65 or over.

Water Conservation Plan 2016
7
1.3.4 Housing As mentioned above the City of Socorro has suffered a population decline over the past ten years and many commercial businesses have closed. The result has created a decline in new home construction and occupancy rate of current housing. As reported by the U.S. Census “Fact Finder” the estimated total housing units from 2010 to 2014 was 3595, with 2681 occupied housing units and a vacancy rate of 914 units. The American Community Survey (ACS) indicates that 243 new homes were built since the year 2000, with 768 homes built in the previous 10 years, with 234 new homes built from 1994 to 1999. If the homes built after 1994 were in compliance with the Energy Policy Act, which required more energy efficient fixtures and appliances, then it can be assumed that of the 3595 housing units reported, an estimated 477 have energy efficient fixtures or appliances. In addition, there were 59 homes without complete plumbing and kitchen fixtures in 2000 (U.S. Census) as opposed to 0% in 2014. It is assumed that the 59 homes which added fixtures and plumbing facilities since 2000 would also be in compliance with the Energy Policy Act, for a total of 14.9% of the total housing.
1.3.5 Temperature and Precipitation .
Table 1
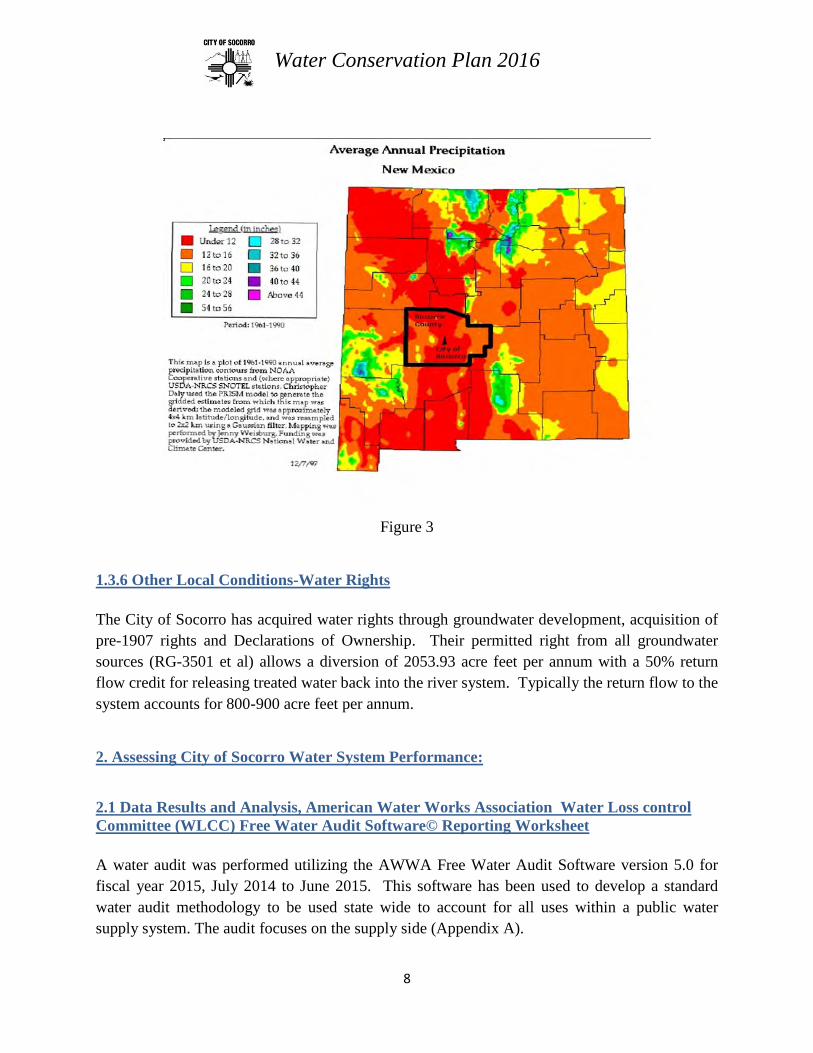
Socorro, New Mexico is located in the central part of the State within the Rio Grande Valley At an elevation of 4,585 feet, it has an annual rainfall of 8-10 inches per year as shown in Figure 3 below. Table 1 above provides that from the period studied 1914-2005, the average maxium temperature is 74.1 degrees, the average minuimum at 40.90 degrees and a total annual rainfall of 8.36 inches.
Water Conservation Plan 2016
8
Figure 3
1.3.6 Other Local Conditions-Water Rights The City of Socorro has acquired water rights through groundwater development, acquisition of pre-1907 rights and Declarations of Ownership. Their permitted right from all groundwater sources (RG-3501 et al) allows a diversion of 2053.93 acre feet per annum with a 50% return flow credit for releasing treated water back into the river system. Typically the return flow to the system accounts for 800-900 acre feet per annum.
2. Assessing City of Socorro Water System Performance:
2.1 Data Results and Analysis, American Water Works Association Water Loss control Committee (WLCC) Free Water Audit Software© Reporting Worksheet A water audit was performed utilizing the AWWA Free Water Audit Software version 5.0 for fiscal year 2015, July 2014 to June 2015. This software has been used to develop a standard water audit methodology to be used state wide to account for all uses within a public water supply system. The audit focuses on the supply side (Appendix A).

Water Conservation Plan 2016
9
2.1.1 Performance Indicators The City of Socorro metered water comes from three City wells and two springs totaling approximately 1813.325 acre feet per annum (af/an) of water and metered export water of approximately 23.44 af /an is provided to the Energetic Materials Research and Training Center (EMRTC) Water System, which serves the New Mexico Tech Campus. Considering meter error adjustments, the total water supplied to the City was approximately 1787.058 acre feet (af) during the study period. These measurements, along with the recommended default of percent value for unbilled unmetered water provided with and recommended by the audit software was utilized for evaluation of authorized consumption of 1509.88 af/an. Water losses were evaluated as the difference of authorized consumption from water supplied at 277.17 af/an. Unauthorized consumption, which includes water illegally drawn from fire hydrants, illegal connections, bypass of customer meters, tampering with meters, and other methods used to steal water; was evaluated at 4.468 af by applying the software default factor to water supplied. Customer metering inaccuracies, a value the City recorded with account specific information, was 5.85 af. The losses due to systematic data handling errors, was evaluated by applying the software default factor to the billed metered volume to yield 3.078 af. Total apparent losses (unauthorized consumption + customer metering inaccuracies + systematic data handling errors) were 13.396 af/an. Non-Revenue water, water which does not provide revenue potential to the utility, is the summation of water losses, unbilled metered, and unbilled unmetered totaling 299.508 af. Therefore, this conservation plan will focus on reducing non-revenue water. Performance indicators are as follows: a. Financial
Non-Revenue water as percent by volume of water supplied was 16.8% which puts forth potential lost revenue of 5.7% when valued at the Variable Production Cost of $249.69 per acre foot. Total annual cost to the City is $74,784.00 per year.
b. Operational Efficiency
The portion of water loss that is real loss was approximately 263.774 af. Unavoidable Annual Real Losses (UARL) is a theoretical value based on system parameters including length of lines, number of system connections, and average system pressure.

Water Conservation Plan 2016
10
UARL for the City was estimated at 82.20 af. When compared to Current Annual Real Losses (CARL), the Infrastructure Leakage Index (ILI which is CARL/UARL) was estimated at 3.21. Apparent losses per service connection per day and real losses per service connection per day in gallons were 2.96 and 58.29, respectively.
The audit software evaluates a data validity score based on many system monitoring characteristics and techniques including whether or not flow is metered, and accuracy of metering devices, in addition to the technology utilized to monitor and meter production and usage flows. The software gathers these characteristics with the Grading Matrix and a grade is assigned to each system monitoring characteristic. The Grading Matrix was completed following evaluation by City Water Department staff knowledgeable of any particular monitoring component and evaluation by the auditor based on information provided for the audit.
2.1.2 Data Validity Score Based on a compilation of the grades, the Water Audit Data Validity score for the City was 82 of 100. The software cited the following system components for priority monitoring improvements for future audits: 1. Volume from Own Sources: The grade evaluated by City Staff for monitoring of this system component was 8 of 10. Improvement for this rating includes repair or replacement of meters outside of +/- 3% accuracy, investigate new meter technology, and install and verify one or more replacements with innovative meters in an attempt to further improve meter accuracy. 2. Billed Unmetered: The grade evaluated by the auditor for monitoring of this system component was 6 of 10 based on information received from the City. Improvement from this rating includes refinement of metering policy and procedures to ensure that all accounts, including municipal properties, are designated for meters and implementing procedures to obtain a reliable consumption estimate for the remaining unmetered accounts. Specifically, this rating would improve with provision of metering irrigation to the City parks and fields. 3. Unauthorized Consumption: The grade for monitoring of this system component was 5 of 10, which is the recommended default in absence of detailed information for these loss occurrences. Improvement from this rating includes updating policies to clearly identify the types of water consumption authorized, identify usage that falls outside of this policy and are unauthorized, and conduct regular field checks to determine if a great volume of such use is suspected.

Water Conservation Plan 2016
11
Other system components with room for monitoring improvement include: water exported, systematic data handling errors, length of mains, number of active and inactive service connections, and average operating pressure. Among other actions for improvement recommended by the audit, these system monitoring components may be improved by updating and verifying the system map from existing records and field survey; preparation of a GIS system map with defined meters and other appurtenances with parameters and attributes, preparation of a system hydraulic model; and provision of a supervisory control and data acquisition (SCADA) system.
2.1.3 Priority Areas for Attention The water audit includes a water loss control planning guide that offers five levels of recommendations for functional focus areas (Appendix B). The water data validity score is what determines the level of recommendations. A water data validity score of 82 placed the City into level IV recommendations which include:
• Audit Data Collection: Refine data collection practices and establish as routine business process.
• Short-term loss control: Refine, enhance or expand ongoing programs based upon economic justification.
• Long-term loss control: Conduct detailed planning and budgeting, and launch comprehensive improvements for metering, billing or infrastructure management.
• Target-setting: Establish mid-range (five (5) year horizon) apparent and real loss reduction goals.
• Benchmarking: Establish Performance Benchmarking – ILI is meaningful in comparing real loss standing.
2.2 Data Results and Analysis, GPCD Calculator Table The New Mexico Office of the State Engineer has provided software to be used in completing the Gallons Per Capita per Day calculations as a standard for Public Water Suppliers. The results of this analysis can be found in Appendix B.
2.2.1 Period of Study Annual consumption information for this sector was received from the Socorro Water System. The Socorro Water System cannot provide the historical number of connections for the Single Family Residential sector; so, the current SFR active connections (filtered from total active

Water Conservation Plan 2016
12
connections for SFR) was entered for 2015 and the historical connections were back calculated based on the census population data for 2014, 2013, 2012, and 2011. Because the connections data was estimated per year, only annual data was entered. Table 2 below includes the System Total Annual Reporting Performance Overall Annual GPCD (Gallons Per Capita per Day)
Table 2
2.2.2 Average Size of Household Per capita demand is based on the total population each year and the total water pumped. Socorro’s population has been in a decline with a reduction of 100 residential connections from 2011 to 2015 (R. Lopez, City of Socorro Billing.). As shown in Table 3, single family residential use is 207, 804,200 gallons consumed, accounting for 87% of water with a per capita demand of 76.77 gallons per person per day (gpcd), based on a constant of 2.33 persons per household.
System Total Annual Reporting Performance Overall Annual GPCD (based on Total Population)
Year
Single-Family
Residence (SFR
)
M
ulti-Family
Residence (M
FR)
Industrial, C
omm
ercial, Institutional (IC
I)
Other M
etered
Reuse
Non-R
evenue Water
Total Supplied
Non-R
evenue V
olume T
housand
2015 71.60 N/A 38.87 N/A N/A 86.68
197.14 243.03
2014 71.90 N/A 52.72 N/A N/A 101.43
226.05 287.91
2013 67.27 N/A 44.01 N/A N/A 114.10
225.38 327.26
2012 65.58 N/A 46.61 N/A N/A 103.89
216.08 295.64
2011 69.80 N/A 45.12 N/A N/A 91.87
206.79 241.12

Water Conservation Plan 2016
13
Water Use per Connection Single Family Residences (SFR)
ANNUAL SYSTEM CONSUMPTION (gallons)
Year Number of connections
Connection Gallons per Day (average)
Number of Persons Per House hold
Gallons Per Capita Per Day
2015 3183 179 207,804,200 2.33 76.77 2014 3183 180 208,662,000 2.33 77.08 2013 3223 168 197,511,400 2.33 72.06 2012 3223 163 192,556,900 2.33 70.25 2011 3281 174 208,387,700 2.33 74.68
Table 3
2.2.3 Estimated Single Family Residential Indoor and Outdoor Uses In order to determine SFR indoor and outdoor uses, random billings were evaluated in January and June. Table 4 below represents the average water use percentage of indoor versus outdoor use in the City of Socorro.
Single Family Demand Type gpcd % of use Indoor 49.9 65 Outdoor 26.87 35 Total per capita demand 100
Table 4
2.2.4 Multifamily Use As indicated in Figure 4 below, Multifamily Residential (MFR) connections only account for 3% of the total water used. In general, multifamily use is less than single family residential use due to limited landscaping areas, smaller living area, and fewer water-using appliances. As the exact number of units supplied by 94 connections is not known, MRF usage was combined with the

Water Conservation Plan 2016
14
Industrial Commercial and Institutional (ICI) metered usage, per the instructions provided with the GPCD calculator.
Figure 4
2.2.5 Industrial, Commercial, Institutional (ICI) and Other Metered As previously, mentioned Single Family Residential use accounts for 87% of the total amount of metered use. Table 5 below reflects the number of current active connections by sector and the number of gallons used.
Type of Connection # of connections Gallons used Residential 3183 207,804,200 Multifamily 94 112,800,000 Industrial 9 Institutional 20 Commercial 283 Multi Commercial 18
Table 5
Residential 3183 87%
Multifamily 94 3%
Industrial 9
<1%
Institutional 20
>1%
Commercial 283 8%
Multi Commercial 18
<1% Sprinklers 46 1%
Active Connections by Sector (2016)

Water Conservation Plan 2016
15
As shown above, the City of Socorro has 425 ICI connections, consuming 112,880,000 gallons. ICI use accounts for 13% of all the water supplied by the city, and also includes the New Mexico Institute of Mining and Technology (NMIMT). The one golf course in Socorro is owned and operated by NMIMT, and the school has irrigation wells that are used to supply the course. The City has created an Industrial Park which will most likely develop to its full potential, over the next 20 years. In addition to the industrial and residential properties, the City of Socorro is comprised of government offices, schools, and commercial properties, including car washes, laundromats, restaurants, hotels, merchandise stores, gas stations, art galleries, and museums. The City also maintains a senior center, animal shelter, library and several parks including Sedillo Park, and the recent Sports Complex soon to be completed. Sedillo Park is supplied water from two wells that are metered; using approximately 40 acre feet per annum for irrigation purposes.
3. Setting Water Conservation Goals
3.1 Objective and Reasons for Developing a Water Conservation Plan The overall objective of the City of Socorro Water Conservation Plan is to lower water use through a variety of conservation measures that can be easily implemented by the City and its residents in a phased approach. The New Mexico water code calls for conservation planning as a prerequisite for applying for funding from key state funding agencies. Water conservation can prevent or delay the need for expensive capital expenditures for developing new water supplies and acquiring additional water rights. By planning and implementing conservation measures, the City will be better prepared for changes which might affect supply and demand of the resource.
3.2 Identifying and Prioritizing Water Conservation Goals As previously mentioned, the City of Socorro’s nonrevenue water accounts for nearly 300 acre feet per year at a cost of nearly $75,000. Based on this information the City of Socorro has established the following goals with priority as shown below:
1. Utilize efficient water system management including an upgraded water operating system, limiting leaks and losses, and streamlining the data and billing where possible to reduce non-revenue water by 10% by 2020.
2. Maintain residential gallon per capita per day (GPCD) at or below 77 to 2020.

Water Conservation Plan 2016
16
3. Perform water audit and increase the audit validity score from 82 to 90 by 2020.
4. Reduce waste by improving City irrigation by 2020.
5. Promote public awareness of conservation programs and public participation in voluntary conservation measures by 2020. 6. Design and incorporate water conservation features into new construction by 2020. 7. Update Water Conservation Plan for long term loss control by evaluating results and strategies by 2021.
3.3 Evaluate Goals In order to evaluate progress towards achieving primary goals, the City will determine their non-revenue water and average GPCD on an annual basis. The City will perform the AWWA Water Audit to determine their data validity score every five years.
3.4 Best Management Practices (BMP’s)
3.4.1 Description of Best Management Practices Considered The City considered the following best management practices to determine their cost-effectiveness, feasibility for implementation and their appropriateness for the community of Socorro:
• Analyze non-accounted for water • Water System Audit/GPCD Analysis • Leak detection & repair strategy • Automated Sensors/Telemetry (SCADA) • Program to test, calibrate, repair & replace meters systematically • Workshops • Conservation information available • Water bill inserts • Rate increase for excessive use • Public School Education Program • Home Water Conservation Equipment Reimbursement Program • Promotion of landscape efficiency • Rebates and incentives (nonresidential) • Rebates and incentives (residential) • Requirements for new developments (Efficient Fixtures/Landscaping/Irrigation)
3.4.2 BMPs Selected

Water Conservation Plan 2016
17
After careful consideration, the City of Socorro’s Conservation Planning Team evaluated the most effective BMP’s that would result in the best conservation result without affecting the financial balance or the water utility. The following were selected:
• Analyze non-revenue water • Water System Audit/GPCD Analysis • Automated Sensors/Telemetry (SCADA) • Program to test, calibrate, repair & replace meters systematically • Water bill Inserts • Conservation information available • Requirements for new developments (Efficient Fixtures/Landscaping/Irr.)
4. Public Involvement, Education, and Outreach 4.1 Public Involvement during the Planning Process The first public meeting was held at City Hall after the first draft of the Conservation Plan was completed. The planning team prepared a slide presentation that included information on the Water Utility, Water Supply, Water Use by Sector, How Water is Measured and Rate Structure, Reasons and Objective for Planning and Setting Goals, the Planning Process, Goals and Timeframes. Attendees were provided a survey to determine whether they considered themselves a “conserving household”. They were also asked in the survey if there were suggestions for better conservation in Socorro, with no written response. Of the attendees polled 60% answered yes to the following questions:
• Do you have a low flow toilet? • Do you have a low flow showerhead in your shower? • Do you have a water efficient washing machine? • Do you have a water-efficient dishwasher? • Do you turn water off when brushing your teeth? • Do you have a graywater system? • Do you have a rain harvest system? • Do you have xeriscaping in your yard?
Throughout the process, the public was invited to review and comment on the plan. These solicitations were made through billing announcements, and at public meetings. The second public meeting was the June 6, 2016 City Council held at City Hall, and was also televised. The City council was provided copies of the draft plan for their review and comments.

Water Conservation Plan 2016
18
4.2 Describe Outreach Program Activities Water conservation is important for our community’s current and future economic health, its current and future generations of citizens, and our local natural environment. Public outreach generates a greater understanding of these water uses and creates acceptance of water conservation efforts. Successful water conservation education is comprised of multiple components. These include water system employee training, public information programs, and school programs. The City will continue existing outreach and education, and expand these to include additional outreach and education measures. The City will update their website to include links to water conservation materials such as the New Mexico State Engineer’s Office Water Conservation Program Page and other water conservation resources. Since toilets, washing machines, faucets, and showers account for more than 90 percent of indoor use, efficient-water-use appliances can significantly reduce indoor water use (New Mexico Office of the State Engineer 2001). At a minimum, the City will promote education on water-efficient appliances including programs that will provide cost savings on purchase and installation of these devices. The City will advertise programs, such as the Socorro Soil and Water Conservation District’s water conservation cost share program (Socorro Soil and Water Conservation District 2016), that are available to city residents. The suggestions outlined in Appendix C, Water Conservation Outreach and Education, are provided for the City’s consideration during Water Conservation Plan implementation. The City will consider which options are feasible and most likely to benefit the community and their conservation efforts. Also included are educational materials regarding Indoor and Outdoor Use Water Conservation, which highlights use practices that can be shared with the public. 5. Developing a Water Conservation Program 5.1 Challenges Socorro is a poor community, as previously mentioned nearly one third of its population is living below the poverty level. In order to provide utility services that are affordable for everyone, the City of Socorro is tasked with keeping water rates at a minimum. Socorro is also a historic community and much of its enhancement is the old growth trees, lawns and gardens within the City. The City will work to keep this in balance, by providing conservation education materials to the public and encouraging voluntary water conservation measures, as well as other measures outlined. 5.2 Program Components

Water Conservation Plan 2016
19
5.2.1 Program Title City of Socorro Water Conservation Plan 2016 5.2.2 Summary of Program Efficient utility management and efficient water use for City-supplied parks and recreational facilities are essential components of the City’s Water Conservation Plan. The water system management programs described in Section 3.2, 1-6 will be implemented within the next five years. The program will include:
• A supervisory control and data acquisition system (SCADA). A feasibility study was performed by Dennis Engineering Company in 2011; updated in 2016 for the purpose of identifying requirements for the water distribution system. The study evaluated linking all production and tank/storage facility elevation change data to a supervisory control and data acquisition (SCADA) system (Appendix D). If the SCADA system is installed the City can establish automatic flow balancing algorithms and regularly calibrate between SCADA and source meters. Funding sources have been identified in the Regional Water Plan for Socorro and Sierra Counties (New Mexico OSE 2003 update approved October 2016) as well as in the City’s 40 year water planning effort (in development). As funding becomes available, the City will upgrade its system with improved technology for management of the water system, including system maintenance and leak detection. • Improved record-keeping will be completed so that billing system reports are analyzed and reported every billing cycle and utilized to assure all customer accounts are billed. • Quality assurance checks of residential and commercial meters will be performed. This measure will ensure accurate results in maintaining annual meter accuracy and testing for all meters, including exported water. Water Utility staff will investigate new meter technology to assure state of the art meters are utilized as possible. A refined metering policy and procedures will insure that all accounts including municipal properties are designated for meters. • Water line and meters will continue to be replaced to upgrade all lines and meters to the highest industry standards. The City will continue replacement of old sprinkler systems with new systems that are more water efficient. Priority areas have been identified for replacement (L. Martinez, Utilities Director).
Water Conservation Plan 2016
20
• Promote public awareness of conservation programs and public participation in voluntary conservation measures by 2020. • Design and incorporate water conservation features into new construction by 2020.
• Update Water Conservation Plan for long term loss control by evaluating results and
strategies by 2021
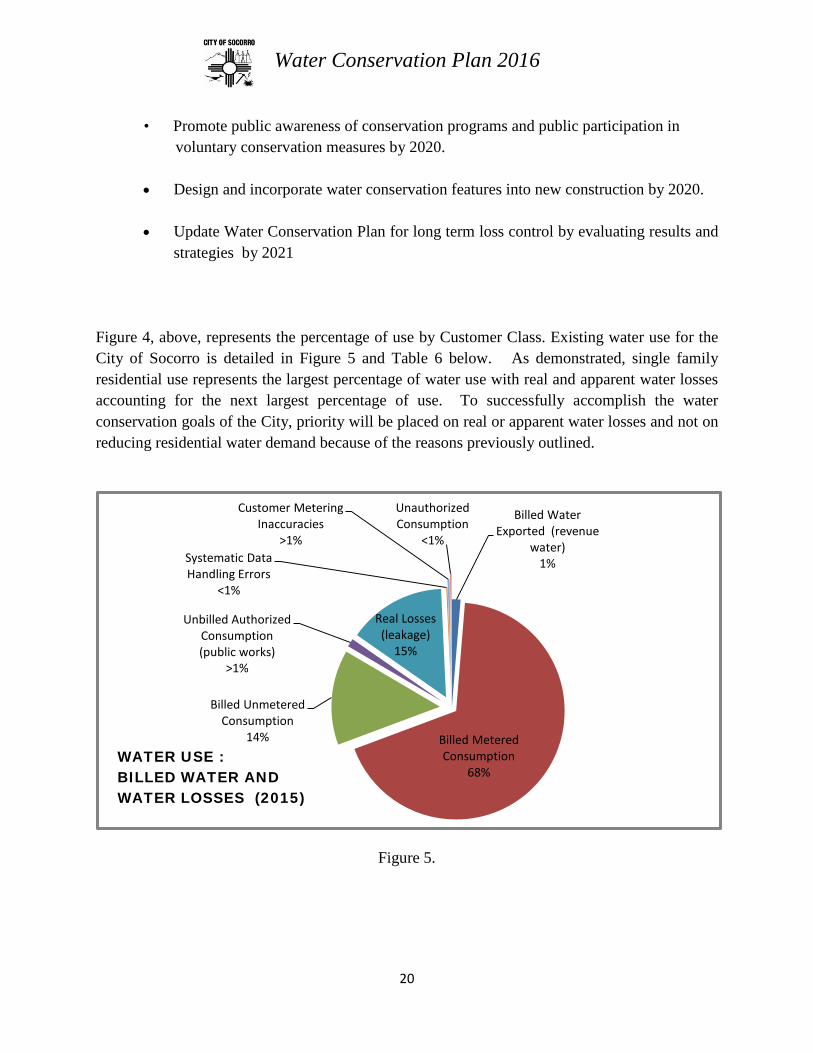
Figure 4, above, represents the percentage of use by Customer Class. Existing water use for the City of Socorro is detailed in Figure 5 and Table 6 below. As demonstrated, single family residential use represents the largest percentage of water use with real and apparent water losses accounting for the next largest percentage of use. To successfully accomplish the water conservation goals of the City, priority will be placed on real or apparent water losses and not on reducing residential water demand because of the reasons previously outlined.
Figure 5.
Billed Water Exported (revenue
water) 1%
Billed Metered Consumption
68%
Billed Unmetered Consumption
14%
Unbilled Authorized Consumption (public works)
>1%
Real Losses (leakage)
15%
Systematic Data Handling Errors
<1%
Customer Metering Inaccuracies
>1%
Unauthorized Consumption
<1%
WATER USE : BILLED WATER AND WATER LOSSES (2015)

Water Conservation Plan 2016
21
Table 6. 5.2.3 Implementation Dates, Funding Source, Anticipated Cost, Anticipated Staffing,
Targeted User, Anticipated Results
Table 7.
Goal Implemention Dates Funding Source Anticipated Cost Anticipated Staffing Targeted User ResultsEfficient Utility Management, SCADA System Installation, 2018-2020 Water Trust Board $560,500.00
Present Staff Dennis Engineering
Company Supply Side
Reduction in non-revenue water
Quality Assurance Checks for Metering refine metering policy (including City Irrigation) 2017-2020 City of Socorro Budgeted Present Staff Supply Side
Reduction in Billed unmetered
Water Lines and Meter Replacement 2016-2020 City of Socorro Budgeted Present Staff Supply Side
Reduction in real losses
Improved billing and data handling, 2016-2020 City of Socorro N/A Present Staff
Industry, Residential
Users
Reduction in non-revenue water
Promote public awareness 2016-2020 City of Socorro N/A Present Staff
Industry and Residential
UsersReduction in SFR and ICI
Design and incorporate water conservation features into new construction 2016-2020 City of Socorro N/A Present Staff Supply Side
Reduction in non-revenue water
AWWA Audit and Update Water Conservation Plan 2020-2021 City of Socorro $25,000.00
Dennis Engineering Torres Research and
Consulting
Supply Side, Industry,
Residential Users
Overall reduction in water use
GPCD Calculation & Update 2016-2020 City of Socorro $2,500.00Dennis Engineering
Company
Supply Side, Industry,
Residential Users
Overall reduction in water use
Water use : Billed vs. Losses (2015) Acre Feet % total Billed Water Exported (revenue water) 23.37 1% Billed Metered Consumption 1231.28 68% Billed Unmetered Consumption 256.27 14% Unbilled Authorized Consumption (public works) 22.34 >1% Real Losses (leakage) 263.77 15% Systematic Data Handling Errors 3.08 <1% Customer Metering Inaccuracies 5.85 <1% Unauthorized Consumption 4.47 <1%

Water Conservation Plan 2016
22
It is anticipated that the focus on water conservation through efficient water management will provide the highest result in the City’s water conservation effort. Existing City staff are qualified to incorporate additional management measures in order to accomplish the goals of the program. With the installation of SCADA, the City will be able to have high quality monitoring of the entire water system, allowing a faster response time to problem areas, leaks, losses and pressure changes.
5.2.4 Why the Program was Chosen After consideration of the number of Best Management Practices by the City, selection was made with resources, budget and time considerations. After careful review the City selected the most affective goals which would result in the highest reduction in water use; and improved conservation of the resource. 5.2.5 How the Program Will Be Implemented Implementation of the City Conservation program actually began with the analysis of the data generated in the water audit and GPCD calculator. This process has made the City staff aware of strengths and weaknesses regarding water use in general, and where priority needs to be placed in conservation measures. The next step in this process will be to acquire the funding needed for the SCADA system. The upgrade to the water system will be paramount for implementation of the plan, as reducing non-revenue water is established as a priority for the City. Replacement of old water lines will continue, with 80% of the system already replaced. The City will repair or replace meters outside of +/-3% accuracy. The City already has existing Conservation practices as outlined in Section 5.3. These practices will continue to be improved over time, with staff continuing to investigate improved technologies and methods for billing, accounting and meter accuracy. The City will also install improved irrigation methods for parks, landscaped medians, and other property owned by the city to insure that the highest efficiency is being achieved. All of these efforts are presently ongoing. In order to achieve public outreach and education, beginning with the approval of the plan, the City will update its website to include the objectives of the plan, information on water use and conservation and links to sites that offer specific methods for reducing indoor and outdoor water use. In addition materials will be made available at City Hall in an area designated especially for hand-outs and information. The City will continue to include water conservation materials in monthly billing statements on a regular basis.

Water Conservation Plan 2016
23
An action proposed to be taken within the first year is to draft water conservation regulations for new development, to include water conserving fixtures and water-conserving landscaping. If approved by the City Council, these measures could be in place by the next fiscal year. The City will also evaluate the need and timing for developing a Drought Management Plan, to address potential future water shortages (Appendix E). Each year, the City will conduct the GPCD analysis to see if the program is effective. Every five years, a water audit will be performed, and the Conservation Plan will be updated with priorities redefined to accomplish the long term goal of a total system supply of 130 gpcd. 5.2.6 Explanation of Tracking and Evaluation Each water conservation program will be evaluated by City staff and consultants including time and costs incurred in implementing the program. Evaluation measures can be developed and used during the operation of each conservation program to establish a measure of effectiveness. 5.2.7 Annual Reporting and Updates Evaluation of the program will be done on an annual basis. It is anticipated that the existing planning team will remain in place, and updates will be provided to the City Administrators. The results of the updated AWWA Water Audit and/or GPCD Analysis will be reported to the New Mexico State Engineer Office, along with any updates to the Conservation Plan. 5.2.8 Estimated Lifetime Impact of the Program The City of Albuquerque is a prime example of how conservation measures can impact water use over the life of a program. In 1995 the City introduced water conservation measures. At that time the per capita daily usage was 251 gpcd. This year it was reported that in 2015 Albuquerque set a record with an all-time low of 127 gpcd. (Albuquerque Water Authority and Albuquerque Journal) In 2015, Santa Fe also reported a reduction of residential use to less than 100 gpcd. (City of Santa Fe) The GPCD calculation is a key performance measure of any municipal water conservation program. By analyzing its GPCD on an annual basis, the City of Socorro will be in a position to gage the progress of its program. 5.3 Current and Past Water Conservation Programs

Water Conservation Plan 2016
24
5.3.1 Summary, Time Frame and Results The City has been very proactive in the past in implementing improved efficiencies and programs, in order to reduce waste and non-revenue water. These include the following measures, which are already in place, and are producing beneficial results.
1. Radio Read Metering for improved leak detection
With the installation of a “radio read” two way communication metering system, completed in 2013, City employees are now able to recognize “high usage” and determine what time of day the high use occurred. By analyzing the time of day of the high use, staff can determine if a leak might be the cause. This also allows customers to determine what day and time the excess use occurred so that they can take measures to remedy the situation; in some cases, something as simple as repairing a running toilet. As shown in Table 2, the City can demonstrate that because of this measure, along with actual meter maintenance, non-revenue water usage, measured in gallons per capita per day, has already been reduced.
2. Meter Maintenance and Replacement
The City implemented replacement of residential meters with Badger™ meters, containing endpoint hardware communication with an Orion™ operating system. This has provided advanced, comprehensive metering analysis for interval meter reading and data capture using two-way communications. Status reports provide the reader of conditions such as tampering, reverse flow, no usage and potential leaks. All residential meters have been replaced as of 2013.
3. Automated Billing System
The City of Socorro staff use lap-top computers to obtain water usage data from meters through wireless communication. The data is entered into the billing system, which uses Aptean 4 Gov™ software. This software can track and flag anomalies in customer accounts and flags accounts when monthly use is out of the normal range of the previous month, or the same month of the previous year. Utility staff investigates the flagged accounts on a monthly basis to identify potential leaks and notify customers. Hand held devises are used for meter “re-reads” when usage is high, or when requested by a customer.
4. Standards for Water Line Construction
The City complies with all new standards for water lines as they are developed. When lines are replaced, it improves the conservation value of that line and the city’s utility in general.
Water Conservation Plan 2016
25
The city is very proactive about this and takes advantage of road work and other construction to upgrade lines as part of the project. Typical water line projects replace old water lines or expand the water system with new PVC pipe conforming to the dimensional, chemical, and physical requirements of AWWA C900, with integral bell socket connection joints with elastomeric seals conforming to ASTM F477. Fittings are typically compact mechanical joints conforming to ANSI/AWWA C153/ A 21.53. Water line installation is performed in accordance with the New Mexico Standard Specifications for Public Works Construction (NMSSPWC), 2006 Edition. Pressure testing during construction assures that leakage in new water lines is less than allowed in accordance with, NMSSPWC, 2006 Edition. The City follows AWWA, NMED, and NMSSPWC standards, and typically uses Class 160 or Class 200 pipe consistently when replacing lines, which provide adequate pressure ratings for use in any given Socorro Water System pressure zone. Approximately 80% of the system has been replaced since 1984. The City maintains approximately 100 miles of lines within the service area.
5. City Xeriscaping
The City has implemented xeriscape designs for all of the medians on the main street of California, and along the School of Mines road. The use of water thrifty plantings and automatic timers has improved water efficiency in these areas. The City will continue xeriscaping areas that are suitable for this type of landscape management.
6. Outreach and Education
The City of Socorro has existing outreach materials for public education in efficient water use. The City has an existing Water System Employee Training program. This program includes continuing education and certification for Water Utility staff, procedures for utility operations, and clear measures of successful improvements in water utility system function (L. Martinez, City of Socorro Utilities Director). The City’s Water Utility staff has extensive knowledge and experience in the latest technology and procedures in efficient water delivery. The City also has an existing outreach program to the general public. Periodic written materials in utility bills provide information on water quality, water use, and upcoming water utility projects to water users.
School programs that provide water utility information to adults and children are also in place in Socorro. Class field trips to the water treatment facility are available and utilized by the Socorro Consolidated School System (A. Salome, City Socorro Consolidated School

Water Conservation Plan 2016
26
Superintendent’s Office). Some schools have programs that take children to the river and area ditches to learn about water quality. Lectures on water system engineering and water quality are presented by the City and New Mexico Tech professors on a regular basis (M. Gonzales, City of Socorro Administration.).
5.4 Proposed Water Conservation Program
5.4.1 Narrative Describing How Selected Water Conservation Programs Meet Stated Goals and Objectives The overall objective of the City of Socorro Water Conservation Plan is to lower water use through a variety of conservation measures that can be easily implemented by the City and its residents in a phased approach. The programs outlined in the plan will allow the City to meet its goals and objectives by:
o Utilizing efficient water system management including upgraded water operating system, limiting leaks and losses, and streamlining the data and billing where possible.
o Reducing waste by improving City irrigation.
o Promoting public awareness of conservation programs and public participation in
voluntary conservation measures.
o Designing and incorporating water conservation features into new construction. 5.4.2 Overall Timeline of Programs as Related to Objectives The anticipated time frame for the programs outlined will be accomplished in a phased approach, with benchmarks at five year increments. All of the goals and objectives will be implemented prior to the year 2020, with AWWA Water Audit update and Conservation Plan revisions by the year 2021. This information will be provided to the New Mexico OSE, as provided in NMSA 72-14-3.2 Section F. 5.4.3 Anticipated / Reported Results for the Entire Water Conservation Plan The OSE developed GPCD (gallons per capita per day) calculation is to be used statewide, standardizing the methods calculating population, defining use, and analyzing use by category (Socorro-Sierra Regional Water Plan 2016). For future projections, a consistent method is now
Water Conservation Plan 2016
27
being used statewide that assumes conservation would reduce future per capita demand in each county by the following amounts:
• For current average per capita use greater than 300 gpcd, assume a reduction in future per capita demand to 180 gpcd.
• For current average per capita use between 200-300 gpcd, assume a reduction in future per capita demand to 150 gpcd.
• For current average per capita use between 130 and 200 gpcd, assume a reduction in future per capita demand to 130 gpcd.
• For current average per capita demand less than 130 gpcd, no reduction in future per capita demand is assumed.
As the City’s present use average per capita per day falls between 130 and 200 gpcd, the ultimate goal is to strategically reduce the system total over time to 130 gpcd. By establishing bench marks of five year periods for evaluating apparent and real losses and refining ongoing programs based upon economic justification, the City will be able to maximize control over both short and long term losses, thus substantially reducing overall water use over time. References Office of the State Engineer, New Mexico Water Conservation Bureau Water Conservation Planning Guide. Daniel B. Stephens & Associates, Inc. (DBS&A). 2005. City of City of Hobbs Water Conservation Plan. APWA. 2006. New Mexico standard specifications for public works construction City of Socorro. 2015. Annual Drinking Water Quality Report. City of Socorro, 1918. Socorro City Council minutes of April 22, 1918 . California Natural Resources Agency. 2010. California Drought Contingency Plan. 89 pp. U.S. Department of Interior. 2011. Water SMART Strategic Implementation Plan. 26 pp.
Water Conservation Plan 2016
28
Johnpeer, Gary D. and B.M. Hamil. 1983. Engineering Geology of the Socorro area, New Mexico, in: Socorro region II, Chapin, C. E., New Mexico Geological Society, Guidebook, 34th Field Conference, pp. 339-344. New Mexico Office of the State Engineer. 2003. Socorro-Sierra Regional Water Plan. New Mexico Office of the State Engineer. 2016 in draft. Socorro-Sierra Regional Water Plan Update. New Mexico Office of the State Engineer. 2001. Agua Action, a Guide to Water Conservation in New Mexico. New Mexico Office of the State Engineer. 2001. A Water Conservation Guide for Public Utilities. 206pp. Powell, W. Carlos, Engineer Feasibility Report of Proposed Improvements, April 1949. Socorro Soil and Water Conservation District. 2016. Residential Cost Share Application. U.S. Bureau of Reclamation. 2003. Water Shortage Contingency Drought Planning Handbook. 46pp. United States Census Bureau Quick Facts www.census.gov/quickfacts Vickers, Amy, P.E.. 2001. Handbook of Water Use and Conservation. WaterPlow Press . Sawyer and White Survey of the Socorro Grant 1877, U.S. Department of Interior www.blmglorecords.gov/surveys Office of the State Engineer File RG-3501 et al
Water Conservation Plan 2016
APPENDIX A
GPCD CALCULATOR

Value to be entered by user
Dropdown box, pick from list Look for the following boxes that provide additional information
Value calculated based on input data Instructions
No longer available for input
Please begin by providing the following information, then proceed through each sheet:
NAME OF CITY OR UTILITY:
REPORTING YEARS:
Enter the most recent
reporting year: 2015
Data can be entered back to: 2011
NAME OF CONTACT PERSON: Cory Pierce, P.E. E-MAIL:
Ext.
SELECT THE REPORTING UNITS FOR VOLUME DATA: For unit converter click here:
If you have questions or comments regarding the software please contact us at: [email protected]
All parties reserve the right to validate the data recorded in this document. This does not bind the OSE or the Utility to the
results. It is a tool used for planning purposes.
Multi-Family residential gallons and population
505.281.2880TELEPHONE:
Use this sheet to understand terms used in the audit process
The calculated data graphical review of monthly performance indicators
The calculated data graphical review of annual performance indicators
The calculated data graphical review of most common performance indicators
Gallons (US)
Other data including Commercial, Industrial and Institutional [1.3] and Other metered [1.4] categories
Total Production and Diverted Water
Data related to water reuse projects
Gallons per Capita - v2.05
Single-Family residential gallons and population
Census data and the portal to get the data from the Census website
This sheet
This spreadsheet-based GPCD calculator is designed to help quantify and track water uses associated with water distribution systems. The spreadsheet contains several separate worksheets.
Sheets can be accessed using the tabs towards the bottom of the screen, or by clicking the buttons on the left below. Descriptions of each sheet are also given below.
New Mexico
THE FOLLOWING KEY APPLIES
THROUGHOUT:
It should be noted that all the recorded data should be from actual metered results and should not include any estimates.
Socorro Water System
Census Data
Definitions
Multi-Family
Single-Family
Instructions & Utility
ICI & Other Metered
Total Diverted
Monthly Performance
Converter
Annual Performance
Reported Data
Release Date: August 2015
Reuse
Info
NMOSE GPCD Calculator v2.02 1

Census Information Data Table 2.1
2015 TO 2011
OR Use the most recent census data
DATA
US Census Table Description INPUT
DP-1 Profile of General Population and Housing Characteristics Census Year 2010
Subject
Relationship In group quarters Total 535
Housing Occupancy Total housing units Total 4,066
Occupied housing units 3,649
Vacant housing units 417
Households by Type Average household size Total 2.33
Formula: Household Size = Total Population / Total Number of Housing Units
Vacancy Rate % 10.3%
COMMENTS:
This information was found and entered in accordance to the latest instructions for this module which indicate the current census data web pages.
Return to Instructions
Click here for
instructions on how to
find the data on the
Census website
Click here to
access the Census
Web site
Info
NMOSE GPCD Calculator v2.02

Socorro Water System
Instructions
TABLE 3.1 2015 TO 2011 TABLE 3.6 TABLE 3.7
SFR BILLED WATER CONSUMPTION (Gallons (US))
Year JAN FEB MAR APR MAY JUN JUL AUG SEP OCT NOV DEC
2015 207,804,200 207,804,200
2014 208,662,000 208,662,000
2013 197,511,400 197,511,400
2012 192,556,900 192,556,900
2011 208,387,700 208,387,700
2010 N/A
2009 N/A
TABLE 3.2 You have chosen to enter Active Connections Only, enter the monthly values below, TABLE 3.8 TABLE 3.9
or enter annual values in table 3.8 Check message above Table 3.3 to see if additional data is required.
Year JAN FEB MAR APR MAY JUN JUL AUG SEP OCT NOV DEC
2015 3,183 3,183
2014 3,183 3,183
2013 3,223 3,223
2012 3,223 3,223
2011 3,281 3,281
2010 N/A
2009 N/A
TABLE 3.3 You have entered Active Connections Only in Table 3.2; leave the cells below blank TABLE 3.10 TABLE 3.11
INACTIVE (ZERO USE) SFR CONNECTIONS (Monthly)
Year JAN FEB MAR APR MAY JUN JUL AUG SEP OCT NOV DEC
2015 0.00% 0
2014 -1.24% 0
2013 0.00% 0
2012 -1.77% 0
2011 N/A 0
2010 N/A N/A
2009 N/A
TABLE 3.4 Formula = (No. of Connections - No. of Zero Use Accounts) * Ave. Household Size TABLE 3.12 TABLE 3.13
SFR POPULATION (Monthly)
Year JAN FEB MAR APR MAY JUN JUL AUG SEP OCT NOV DEC
2015 No Data No Data No Data No Data No Data No Data No Data No Data No Data No Data No Data No Data 2.33 7,416
2014 No Data No Data No Data No Data No Data No Data No Data No Data No Data No Data No Data No Data 2.33 7,416
2013 No Data No Data No Data No Data No Data No Data No Data No Data No Data No Data No Data No Data 2.33 7,510
2012 No Data No Data No Data No Data No Data No Data No Data No Data No Data No Data No Data No Data 2.33 7,510
2011 No Data No Data No Data No Data No Data No Data No Data No Data No Data No Data No Data No Data 2.33 7,645
2010 No Data No Data No Data No Data No Data No Data No Data No Data No Data No Data No Data No Data 2.33 N/A
2009 No Data No Data No Data No Data No Data No Data No Data No Data No Data No Data No Data No Data 2.33 N/A
TABLE 3.5 Formula = Billed Water Consumption (SFR only) / Calculated Population (SFR only) TABLE 3.14
SFR GPCD CALCULATION (Monthly)
Year JAN FEB MAR APR MAY JUN JUL AUG SEP OCT NOV DEC
2015 No Data No Data No Data No Data No Data No Data No Data No Data No Data No Data No Data No Data
2014 No Data No Data No Data No Data No Data No Data No Data No Data No Data No Data No Data No Data
2013 No Data No Data No Data No Data No Data No Data No Data No Data No Data No Data No Data No Data
2012 No Data No Data No Data No Data No Data No Data No Data No Data No Data No Data No Data No Data
2011 No Data No Data No Data No Data No Data No Data No Data No Data No Data No Data No Data No Data
2010 No Data No Data No Data No Data No Data No Data No Data No Data No Data No Data No Data No Data
2009 No Data No Data No Data No Data No Data No Data No Data No Data No Data No Data No Data No Data
COMMENTS:
70.25
3. SINGLE-FAMILY RESIDENTIAL (SFR)
AVG CONN.
CALCULATION
Active Connections Only
ANNUAL DATAMONTHLY DATA
ANNUAL
CONSUMPTION
DATA INPUT SHEET
NUMBER OF SFR CONNECTIONS (Monthly)
Annual consumtion information for this sector was received from the Socorro Water System. The Socorro Water System cannot provide the historical number of connections for the Single Family Residential sector; so, the
current SFR active connections (filtered from total active connections for SFR) was entered for 2015 and the historical connections were back calculated based on the census population data for 2014, 2013, 2012, and
2011. Because the connections data was estimated per year, only annual data was entered.
ANNUAL
CALCULATION
AVG. ANNUAL
CONNECTIONS
SFR
POPULATION
SIZE OF
HOUSEHOLD
CALCULATED
GROWTH RATE
No. VACANT SFR
CONNECTIONS
ANNUAL SFR GPCD
74.68
N/A
N/A
76.77
77.08
72.06
Info
Return to
Instructions
Info
Info
Info
Info
Info
Info
NMOSE GPCD Calculator v2.02

Socorro Water System
Instructions
2015 TO 2011
TABLE 4.1 TABLE 4.5 TABLE 4.6
Year JAN FEB MAR APR MAY JUN JUL AUG SEP OCT NOV DEC
2015 N/A
2014 N/A
2013 N/A
2012 N/A
2011 N/A
2010 N/A
2009 N/A
TABLE 4.2 If only Current Number of Units is Known, put this number in Table 4.7 TABLE 4.7 TABLE 4.8
NUMBER OF MFR UNITS (Monthly)
Year JAN FEB MAR APR MAY JUN JUL AUG SEP OCT NOV DEC
2015 N/A
2014 N/A X
2013 N/A X
2012 N/A X
2011 N/A X
2010 N/A
2009 N/A
X = calculated from Single-family growth-rate data
TABLE 4.3 Formula = (Number of Units - Vacant MFR Connections) * Ave. Household Size TABLE 4.9 TABLE 4.10
MFR POPULATION (Monthly)
Year JAN FEB MAR APR MAY JUN JUL AUG SEP OCT NOV DEC
2015 No Data No Data No Data No Data No Data No Data No Data No Data No Data No Data No Data No Data N/A N/A
2014 No Data No Data No Data No Data No Data No Data No Data No Data No Data No Data No Data No Data N/A N/A
2013 No Data No Data No Data No Data No Data No Data No Data No Data No Data No Data No Data No Data N/A N/A
2012 No Data No Data No Data No Data No Data No Data No Data No Data No Data No Data No Data No Data N/A N/A
2011 No Data No Data No Data No Data No Data No Data No Data No Data No Data No Data No Data No Data N/A N/A
2010 No Data No Data No Data No Data No Data No Data No Data No Data No Data No Data No Data No Data N/A N/A
2009 No Data No Data No Data No Data No Data No Data No Data No Data No Data No Data No Data No Data N/A N/A
TABLE 4.4 Formula = MFR Billed Water Consumption (Monthly) / MFR Population (Monthly) TABLE 4.11
MFR GPCD CALCULATION (Monthly)
Year JAN FEB MAR APR MAY JUN JUL AUG SEP OCT NOV DEC
2015 No Data No Data No Data No Data No Data No Data No Data No Data No Data No Data No Data No Data
2014 No Data No Data No Data No Data No Data No Data No Data No Data No Data No Data No Data No Data
2013 No Data No Data No Data No Data No Data No Data No Data No Data No Data No Data No Data No Data
2012 No Data No Data No Data No Data No Data No Data No Data No Data No Data No Data No Data No Data
2011 No Data No Data No Data No Data No Data No Data No Data No Data No Data No Data No Data No Data
2010 No Data No Data No Data No Data No Data No Data No Data No Data No Data No Data No Data No Data
2009 No Data No Data No Data No Data No Data No Data No Data No Data No Data No Data No Data No Data
4. MULTI-FAMILY RESIDENTIAL (MFR)
MFR
POPULATION
ANNUAL DATAMONTHLY DATA
N/A
ANNUAL UNIT
CALCULATION
No. CURRENT
UNITS
DATA INPUT SHEET
MFR BILLED WATER CONSUMPTION (Monthly) (Gallons (US))
N/A
ANNUAL
CONSUMPTION
ANNUAL
CALCULATION
ANNUAL MFR GPCD
VACANT MFR
CONNECTIONS
N/A
N/A
N/A
N/A
N/A
Return to
Instructions
Info
Info
Info
NMOSE GPCD Calculator v2.02

Socorro Water System
Instructions
2015 TO 2011
TABLE 5.1 TABLE 5.3 TABLE 5.4 TABLE 5.5
ICI WATER CONSUMPTION (Gallons (US))
Year JAN FEB MAR APR MAY JUN JUL AUG SEP OCT NOV DEC
2015 112,800,000 38.87 112,800,000
2014 153,014,600 52.72 153,014,600
2013 129,225,800 44.01 129,225,800
2012 136,855,700 46.61 136,855,700
2011 134,710,500 45.12 134,710,500
2010 N/A N/A
2009 N/A N/A
TABLE 5.2 TABLE 5.6 TABLE 5.7 TABLE 5.8
OTHER METERED (Gallons (US))
Year JAN FEB MAR APR MAY JUN JUL AUG SEP OCT NOV DEC
2015 N/A N/A
2014 N/A N/A
2013 N/A N/A
2012 N/A N/A
2011 N/A N/A
2010 N/A N/A
2009 N/A N/A
COMMENTS:
ICI ANNUAL
CONSUMPTIONICI GPCD
DATA INPUT SHEET
Annual ICI data was entered which includes the Multi-Family Residential water consumption.
ICI ANNUAL
CALCULATED
OTHER ANNUAL
CALCULATED
ANNUAL DATA
5. INDUSTRIAL, COMMERCIAL & INSTITUTIONAL (ICI) AND OTHER METERED
OTHER ANNUAL
CONSUMPTION
OTHER
METERED GPCD
MONTHLY DATA
Return to
Instructions
Info
NMOSE GPCD Calculator v2.02
Socorro Water System
Instructions
2015 TO 2011
TABLE 6.1 TABLE 6.2 TABLE 6.3
REUSE DIVERSIONS (Monthly) (Gallons (US))
Year JAN FEB MAR APR MAY JUN JUL AUG SEP OCT NOV DEC
2015 N/A
2014 N/A
2013 N/A
2012 N/A
2011 N/A
2010 N/A
2009 N/A
COMMENTS:
ANNUAL DATA
6. REUSE
MONTHLY DATA
REUSE ANNUAL
DIVERSIONSREUSE GPCD
DATA INPUT SHEET Return to
Instructions Info
0
0
0
1
1
1
1
JAN FEB MAR APR MAY JUN JUL AUG SEP OCT NOV DEC
Vo
lum
e
Reuse Volume Graph 6.1
2009
2010
0.00
0.10
0.20
0.30
0.40
0.50
0.60
0.70
0.80
0.90
1.00
2015 2014 2013 2012 2011 2010 2009
GP
CD
Year
Reuse GPCD Graph 6.2
NMOSE GPCD Calculator v2.02

Socorro Water System
TABLE 7.1 2015 TO 2011 TABLE 7.6 TABLE 7.7
Year JAN FEB MAR APR MAY JUN JUL AUG SEP OCT NOV DEC
2015 34,603,800 35,993,200 46,986,600 52,162,800 54,484,700 54,596,600 48,340,500 56,797,300 61,878,500 49,855,100 40,756,600 35,702,600 572,158,300
2014 41,894,000 43,133,000 55,240,300 56,539,000 63,574,000 76,644,700 69,637,700 56,831,700 53,176,000 53,235,400 43,749,400 42,406,100 656,061,300
2013 47,321,400 47,733,200 49,896,200 40,128,500 74,373,800 80,533,900 70,662,800 66,115,200 53,498,500 50,826,900 40,556,800 40,116,900 661,764,100
2012 36,646,900 26,768,000 31,279,600 53,113,000 67,253,200 67,561,700 67,561,700 59,540,100 59,540,100 61,770,800 51,872,600 51,552,500 634,460,200
2011 46,350,300 52,411,000 49,128,600 32,707,600 41,845,500 38,309,900 37,592,900 111,724,000 63,417,400 56,150,800 51,111,800 36,646,900 617,396,700
2010 N/A
2009 N/A
TABLE 7.2 TABLE 7.8 TABLE 7.9
Year JAN FEB MAR APR MAY JUN JUL AUG SEP OCT NOV DEC
2015 N/A
2014 N/A
2013 N/A
2012 N/A
2011 N/A
2010 N/A
2009 N/A
TABLE 7.3 TABLE 7.10 TABLE 7.11
Year JAN FEB MAR APR MAY JUN JUL AUG SEP OCT NOV DEC
2015 8,519,800 8,519,800
2014 6,474,800 6,474,800
2013 7,766,700 7,766,700
2012 9,410,200 9,410,200
2011 33,182,700 33,182,700
2010 N/A
2009 N/A
TABLE 7.4 Formula = Total Water Diverted + Imported water - Exported Water TABLE 7.12 TABLE 7.13
TOTAL WATER SUPPLY (Monthly) (Gallons (US))
Year JAN FEB MAR APR MAY JUN JUL AUG SEP OCT NOV DEC
2015 34,603,800 35,993,200 46,986,600 52,162,800 54,484,700 54,596,600 48,340,500 56,797,300 61,878,500 49,855,100 40,756,600 35,702,600 563,638,500 7,951
2014 41,894,000 43,133,000 55,240,300 56,539,000 63,574,000 76,644,700 69,637,700 56,831,700 53,176,000 53,235,400 43,749,400 42,406,100 649,586,500 7,951
2013 47,321,400 47,733,200 49,896,200 40,128,500 74,373,800 80,533,900 70,662,800 66,115,200 53,498,500 50,826,900 40,556,800 40,116,900 653,997,400 8,045
2012 36,646,900 26,768,000 31,279,600 53,113,000 67,253,200 67,561,700 67,561,700 59,540,100 59,540,100 61,770,800 51,872,600 51,552,500 625,050,000 8,045
2011 46,350,300 52,411,000 49,128,600 32,707,600 41,845,500 38,309,900 37,592,900 111,724,000 63,417,400 56,150,800 51,111,800 36,646,900 584,214,000 8,180
2010 0 0 0 0 0 0 0 0 0 0 0 0 0 N/A
2009 0 0 0 0 0 0 0 0 0 0 0 0 0 N/A
Table 7.5 TABLE 7.14
Year JAN FEB MAR APR MAY JUN JUL AUG SEP OCT NOV DEC
2015 140 162 191 219 221 229 196 230 259 202 171 145 2015 197.14
2014 170 194 224 237 258 321 283 231 223 216 183 172 2014 226.05
2013 190 212 200 166 298 334 283 265 222 204 168 161 2013 225.38
2012 147 119 125 220 270 280 271 239 247 248 215 207 2012 216.08
2011 183 229 194 133 165 156 148 441 258 221 208 145 2011 206.79
2010 No Data No Data No Data No Data No Data No Data No Data No Data No Data No Data No Data No Data 2010 NA
2009 No Data No Data No Data No Data No Data No Data No Data No Data No Data No Data No Data No Data 2009 NA
COMMENTS:
ANNUAL TOTAL
IMPORTED
ANNUAL TOTAL
EXPORTED
Year
This information was received and entered from monthly water usage reports which indicate water production in 1000's of gallons. The information was entered in 1000's of gallons in the user created table
(columns AE through AP) and the cells in Table 7.1 convert the user table data from 1000's of gallons to gallons.
The Socorro Water System does not import water.
The Socorro Water System exports water to the NM Tech Research Park. The data was entered annually like the sector consumption data.
SYSTEM TOTAL
GPCD
ANNUAL TOTAL
DIVERTED
TOTAL POP. EST.
SYSTEM TOTAL GPCD (Monthly)
IMPORTED WATER (Monthly)(Gallons (US))
ANNUAL TOTAL
WATER SUPPLY
ANNUAL TOTAL
IMPORT CALC
ANNUAL TOTAL
EXPORT CALC
EXPORTED WATER (Monthly) (Gallons (US))
DATA INPUT SHEET
TOTAL WATER DIVERTED (Monthly) (Gallons (US))
MONTHLY DATA
7. TOTAL WATER DIVERTED AND SUPPLIED
ANNUAL DATA
ANNUAL TOTAL
DIVERTED CALC
Return to
Instructions
Info
Info
NMOSE GPCD Calculator v2.02

ANNUAL 2015 To: 2011
Year
SYSTEM
GPCD
2015 197.14
2014 226.05
2013 225.38
2012 216.08
2011 206.79
2010 NA
2009 NA
Socorro Water System8. SUMMARY GPCD REPORTED DATA
0
50
100
150
200
250
2015 2014 2013 2012 2011 2010 2009
GP
CD
Year
ANNUAL - SYSTEM TOTAL GPCD
NMOSE GPCD Calculator v2.02

9. System Total Annual Reporting Performance
Overall Annual GPCD (based on Total Population)
SF
R (S
yste
m T
ota
l)
MF
R (S
yste
m T
ota
l)
ICI
Oth
er M
ete
red
No
n-R
even
ue W
ate
r
To
tal S
up
plie
d
No
n-R
even
ue V
olu
me M
illion
Gallo
ns (U
S)
SF
R (S
yste
m T
ota
l)
MF
R (S
yste
m T
ota
l)
ICI
Oth
er M
ete
red
Re
use
No
n-R
even
ue W
ate
r
Year 2015 72 N/A 39 N/A Not Graphed 87
On Graph? Yes Yes Yes Yes Yes 2014 72 N/A 53 N/A Not Graphed 101
2015 71.60 N/A 38.87 N/A 86.68 197.14 243.03 2013 67 N/A 44 N/A Not Graphed 114
2014 71.90 N/A 52.72 N/A 101.43 226.05 287.91 2012 66 N/A 47 N/A Not Graphed 104
2013 67.27 N/A 44.01 N/A 114.10 225.38 327.26 2011 70 N/A 45 N/A Not Graphed 92
2012 65.58 N/A 46.61 N/A 103.89 216.08 295.64 2010 N/A N/A N/A N/A Not Graphed#VALUE!
2011 69.80 N/A 45.12 N/A 91.87 206.79 241.12 2009 N/A N/A N/A N/A Not Graphed#VALUE!
2010 N/A N/A N/A N/A ###### #VALUE! -
2009 N/A N/A N/A N/A ###### #VALUE! -
to 2011
Socorro Water System
2015
72 72 67 66 70
0 0
0 0 0 0 0
0 0
39 53
44 47 45
0 0
0
0
0 0 0
0 0
87
101 114 104 92
0 0 0
50
100
150
200
250
2015 2014 2013 2012 2011 2010 2009
GP
CD
Year
Annual Analysis of GPCD - Viewer (based on Total Population)
SFR (System Total) MFR (System Total) ICI Other Metered Non-Revenue Water
Info
NMOSE GPCD Calculator v2.02

10. Monthly Reporting Performance
Choose Sector
Monthly GPCD
Sin
gle
-Fa
mily
Re
sid
en
tial
Mu
lti-Fa
mily
Re
sid
en
tial
ICI
Oth
er M
ete
red
No
n-R
ev
en
ue
Sin
gle
-Fa
mily
Re
sid
en
tial
Mu
lti-Fa
mily
Re
sid
en
tial
ICI
Oth
er M
ete
red
#R
EF
!
No
n-R
eve
nu
eMonth GPCD GPCD GPCD GPCD GPCD January #N/A Single-Family Residential 2015
February #N/A Multi-Family Residential 2014
JAN #N/A #N/A #N/A #N/A #N/A 31 March #N/A Yes ICI 2013
FEB #N/A #N/A #N/A #N/A #N/A 28 April #N/A No Other Metered 2012
MAR #N/A #N/A #N/A #N/A #N/A 31 May #N/A Reuse 2011
APR #N/A #N/A #N/A #N/A #N/A 30 June #N/A Non-Revenue 2010
MAY #N/A #N/A #N/A #N/A #N/A 31 July #N/A 2009
JUN #N/A #N/A #N/A #N/A #N/A 30 August #N/A
JUL #N/A #N/A #N/A #N/A #N/A 31 September #N/A
AUG #N/A #N/A #N/A #N/A #N/A 31 October #N/A
SEP #N/A #N/A #N/A #N/A #N/A 30 November #N/A
OCT #N/A #N/A #N/A #N/A #N/A 31 December #N/A
NOV #N/A #N/A #N/A #N/A #N/A 30
DEC #N/A #N/A #N/A #N/A #N/A 31
to2015 2011
Choose Year for Monthly Analysis
Single-Family Residential
Socorro Water System
0 0 0 0 0 0 0 0 0 0 0 0 0
0
0
0
0
0
0
0
0
0
0
0
0 0 0 0 0 0 0 0 0 0 0 0 0
0
0
0
0
0
0
0
0
0
0
0
0
50
Jan
uary
Feb
ruary
Marc
h
Ap
ril
May
Ju
ne
Ju
ly
Au
gu
st
Sep
tem
ber
Octo
ber
No
vem
ber
Decem
ber
Secto
r G
PC
D
Monthly Analysis of GPCD - Viewer (based on sector-specific population)
Single-Family Residential Multi-Family Residential ICI Other Metered Non-Revenue
NMOSE GPCD Calculator v2.02

Item Name
Active Connections
Annual Multi-Family Residential GPCD
Calculation
Annual Single Family Residential GPCD
Calculation
Billed Water Consumption (Multi-Family
Residential)
Billed Water Consumption (Single-Family
Residential)
Calculated Growth Rate
Census Data
Converter
Gallons (US) = 0.134 Cubic Feet
Exported Water
GPCD
General Information
Graphing Results
Imported Water
Inactive and Zero Connections
1
All active Single Family Residential connections within the utility. Connections that
are not occupied or show zero activity are not counted in this category.
The Census data is used to standardize the calculation of population by utilizing numbers
of people per household. It also records information on the vacancy rate within each city
which enables calculation of the number of households actually being used. There is a
link to a pdf document in Definitions showing the user how to find and record the
relevant data.
Datasets will automatically be graphed when using the graphing data tools in both the
Annual and Monthly Performance worksheets. For example, choosing the year and the use
sector from the purple dropdown boxes will allow these variables to be graphed.
Gallons per capita per day (GPCD) is a method utilized internationally to measure water
use by drinking water suppliers. It is most commonly used to describe historical and
current water uses, providing a baseline of water use that is not as susceptible to
changes in population. GPCD is also used for planning purposes, allowing estimates of
future demand requirements based on localized population projections. More sophisticated
planning efforts utilize GPCD to determine conservation potential, track the results of
program implementation, and calculate projections based on conservation adjusted GPCD.
The white boxes are data entry cells and are used for inputting data. All other cells
except dropdown menus (purple boxes) are protected for the user’s benefit to stop any
overwriting of formulas and calculated cells. The green boxes are values that have been
calculated based on inputs.
Enter all water imported from other systems. This will include any retail contracts with
other drinking water suppliers where this utility purchases water from another utility
and is not the permit holder.
The inactive and zero connections are recorded in Table 3.3 so that unused single family
residential connections will be removed from the calculation of single family population
when Total Units is chosen from the drop down list in Table 3.2.
Enter all water exported from the system. This will include any pass-through arrangements
or wholesale contracts to other drinking water suppliers, where the reporting utility is
the water rights permit holder.
NMOSE GPCD Software: Definitions
Description
The MFR GPCD is Annual MF Calculation (4.6) divided by the annual MFR Population (4.9).
This is the total billed consumption for Multi-Family Residential uses only. Provide the
amount of water used (gallons) for multi-family residential connections by month in Table
4.1, or by year in Table 4.5. If multi-family residential is not available as a separate
category, provide an explanation in the Comments Box and include usage in the Industrial,
Commercial and Institutional Table 5.1 or Other Metered Table 5.2 on Sheet 5.
The user may develop a GPCD Analysis based on one of two input unit selections:
1) Gallons (US)
2) Cubic feet
Please select the units from the instructions worksheet. An interactive unit converter is
also provided below. Input volume in first box below and select units to be converted.
The SFR GPCD is Annual SFR Calculation (3.7) divided by the annual SFR Population average
(3.13).
This is the total billed consumption for Single-Family residential uses only.
The calculated growth rate is a calculation developed to normalize the data to the growth
in the utility. The growth is determined by evaluating the percentage change in the
number of connections within the utility on an annual basis, provided in Table 3.9
Average Connections Calculated. If there are no more than one years’ data, then this
will not be calculated. This Table is for the utilities use in checking the growth
percentage calculated against their own estimates. It is also used in Table 4.8 Number
of (Multi-Family) Units if only the current number of multi-family units can be provided.
Back to Instructions
Find
Find
Find
Find
Find
Find
GPCD v2.0 ©
Find
Find
Find
Find
Find
NMOSE GPCD Calculator v2.02 1

Industrial, Commercial and Institutional (ICI)
Multi-Family Residential Connections
Multi-Family Residential Population
Non-Revenue Water
Other Metered
Reuse
Single Family Residential Connections
Single Family Residential Population
Size of Average Household
Total Connections
System Total GPCD
Total Population
Vacant Single-Family Residential
Connections
How to find the data required for Census section
This is a calculated field using either i) the average of the monthly vacant SFR
connections, if monthly data are available or ii) an estimated value based on the Census
data vacancy rate multiplied by the number of Total SFR connections. When Total
Connections is chosen in Table 3.2, vacant single family residential connections are
subtracted from Total Connections prior to calculating a population (based on household
size) and a single family GPCD.
Multi-family population is calculated from number of MFR units in the Annual Unit
Calculation (4.8) minus Vacant MFR Connections (4.10). That number is then multiplied by
Average Size of Occupied Housing Units from the US Census (2.1).
All categories of billed metered use that is not otherwise classified in SFR, MFR or ICI.
This provides the user the opportunity to track alternative categories. Examples included
irrigation only, stand pipes, and fire hydrant/construction meters. Everything not
included in SFR, MFR, ICI or Other will end up in non-revenue water.
Includes industrial properties, such as manufacturing, commercial properties such as
restaurants, shopping malls, and institutional customers such as schools, universities
and prisons.
Non-revenue water is all the water the utility diverts and/or produces, but does not get
paid for. Non-revenue water includes apparent losses such as meter inaccuracies, theft,
and database errors, real losses such as leaks. It also includes unbilled authorized
uses such as fire-fighting, line flushing and disinfection. The Calculator does not
provide data entry for unmetered billed water. This might include bulk sales or monthly
fees not based on usage. The non-revenue water in the Calculator includes all water that
is not metered.
A multifamily unit is living units in an apartment complex, duplexes, triplexes, trailer
parks, and condo or town houses that have multiple units serviced by a single connection.
They are not counted in the single-family residential category.
The Total Population estimate is the sum of the single-family population + multi-family
population + group quarters population.
Reuse, or Recycled water is former wastewater (sewage) that has been treated to remove
solids and certain impurities and reused by a water supplier. In most locations, it is
only intended to be used for nonpotable uses, such as irrigation, and dust control. This
data is not included in any other calculation. It is provided as a tracking tool for the
user.
This Table is determined from the US Census data in Table 2.1, Sheet 2. This data is used
to determine a total single-family population and total multi-family population for both
the monthly and annual data (Tables 3.4 and 3.13, Tables 4.3 and 4.9 respectively).
All active and inactive Single Family Residential connections within the utility.
SFR Connection is a stand alone or independently metered housing unit. The number used
in the Calculator can be Total Connections or Active Connections only.
The System Total GPCD is calculated by dividing the quantity of Total Water Diverted
(plus imports minus exports) by the System Total Population
Single Family Population (3.13) is calculated from number of active connections times
size of average household (3.12). It can be calculated monthly or annually depending on
the data provided. If Total Connections is chosen (3.2), then inactive connections are
subtracted prior to multiplying by size of average household (3.12). If Active
Connections is chosen (3.2), then number of connections are multiplied by size of average
household (3.12) without any subtractions.
Find
Find
Find
Find
Find
Find
Find
Find
Find
Find
Find
NMOSE GPCD Calculator v2.02 2

www.census.gov
click on [Census 2000]
Click on [Summary File 1]
Click on [Access to all tables and maps in American FactFinder]
NMOSE GPCD Calculator v2.02 3
Click on [Detailed tables]
Click on the dropdown boxes andSelect [Place]
When “Select a State” box appearsSelect [New Mexico]
Select Geographic area from drop down list that is the closest description of your service areaAdd this to the base box as shown below
NMOSE GPCD Calculator v2.02 4

Click [Next]
Add boxes P37, H3, and H12 to the base box by highlighting them and then click [Add]
Once all the tables show in the base box click [Show Result]
Transfer results to spreadsheet
END Beginning of
Section
NMOSE GPCD Calculator v2.02 5

Water Conservation Plan 2016
APPENDIX B
AWWA AUDIT
5
Name of Contact Person: All audit data are entered on the Reporting Worksheet
Email Address: Value can be entered by user
Telephone | Ext.: 505.281.2880 Value calculated based on input data
Name of City / Utility: These cells contain recommended default values
City/Town/Municipality:
State / Province: Pcnt: Value:
Country: 0.25%
Year: 2015 Financial Year
Start Date: 07/2014 Enter MM/YYYY numeric format
End Date: 06/2015 Enter MM/YYYY numeric format
Audit Preparation Date: 3/7/2016
Volume Reporting Units:
PWSID / Other ID:
If you have questions or comments regarding the software please contact us via email at: [email protected]
AWWA Free Water Audit Software v5.0
Socorro Water System
The following worksheets are available by clicking the buttons below or selecting the tabs along the bottom of the page
City of Socorro
Auditors are strongly encouraged to refer to the most current edition of AWWA M36 Manual for Water Audits for detailed guidance on the water auditing process and targetting loss reduction levels
This spreadsheet-based water audit tool is designed to help quantify and track water losses associated with water distribution systems and identify areas for improved efficiency and cost recovery. It provides a "top-down" summary water audit format, and is not meant to take the place of a full-scale, comprehensive water audit format.
NM3523728
USAUse of Option
(Radio) Buttons:
The spreadsheet contains several separate worksheets. Sheets can be accessed using the tabs towards the bottom of the screen, or by clicking the buttons below.
Cory Pierce, P.E.
Acre-feet
Please begin by providing the following information The following guidance will help you complete the Audit
New Mexico (NM)
American Water Works Association Copyright © 2014, All Rights Reserved.
Select the default percentage by choosing the option button on the left
To enter a value, choose this button and enter a value in the cell to the right
Instructions
The current sheet.Enter contact
information and basic audit details (year,
units etc)
Performance IndicatorsReview the
performance indicators to evaluate the results
of the audit
Comments
Enter comments to explain how values were calculated or to document data sources
Water Balance
The values entered in the Reporting
Worksheet are used to populate the Water
Balance
Dashboard
A graphical summary of the water balance and Non‐Revenue Water
components
Grading Matrix
Presents the possible grading options for
each input component of the audit
Service Connection Diagram
Diagrams depicting possible customer service
connection line configurations
Acknowledgements
Acknowledgements for the AWWA Free Water Audit Software v5.0
Loss Control Planning
Use this sheet to interpret the results of the audit validity score
and performance indicators
Definitions
Use this sheet to understand the terms
used in the audit process
Example Audits
Reporting Worksheet and Performance
Indicators examples are shown for two validated audits
Reporting WorksheetEnter the required data on this worksheet to calculate the water
balance and data grading
AWWA Free Water Audit Software v5.0 Instructions 1

Water Audit Report for:Reporting Year:
All volumes to be entered as: ACRE-FEET PER YEAR
Master Meter and Supply Error Adjustments
WATER SUPPLIED Pcnt: Value:Volume from own sources: 8 1,813.325 acre-ft/yr 2 0.16% acre-ft/yr
Water imported: n/a 0.000 acre-ft/yr n/a acre-ft/yrWater exported: 8 23.440 acre-ft/yr 2 0.30% acre-ft/yr
Enter negative % or value for under-registrationWATER SUPPLIED: 1,787.058 acre-ft/yr Enter positive % or value for over-registration
.AUTHORIZED CONSUMPTION
Billed metered: 10 1,231.280 acre-ft/yrBilled unmetered: 6 256.270 acre-ft/yrUnbilled metered: n/a 0.000 acre-ft/yr Pcnt: Value:
Unbilled unmetered: 10 22.338 acre-ft/yr 1.25% acre-ft/yr
AUTHORIZED CONSUMPTION: 1,509.888 acre-ft/yr
WATER LOSSES (Water Supplied - Authorized Consumption) 277.170 acre-ft/yr
Apparent Losses Pcnt: Value:Unauthorized consumption: 4.468 acre-ft/yr 0.25% acre-ft/yr
Customer metering inaccuracies: 10 5.850 acre-ft/yr acre-ft/yrSystematic data handling errors: 8 3.078 acre-ft/yr 0.25% acre-ft/yr
Apparent Losses: 13.396 acre-ft/yr
Real Losses (Current Annual Real Losses or CARL)Real Losses = Water Losses - Apparent Losses: 263.774 acre-ft/yr
WATER LOSSES: 277.170 acre-ft/yr
NON-REVENUE WATERNON-REVENUE WATER: 299.508 acre-ft/yr
= Water Losses + Unbilled Metered + Unbilled Unmetered
SYSTEM DATA
Length of mains: 5 99.6 milesNumber of active AND inactive service connections: 6 4,040
Service connection density: 41 conn./mile main
YesAverage length of customer service line: ft
Average operating pressure: 3 64.1 psi
COST DATA
Total annual cost of operating water system: 10 $1,609,129 $/YearCustomer retail unit cost (applied to Apparent Losses): 10 $4.64
Variable production cost (applied to Real Losses): 10 $249.69 $/acre-ft
WATER AUDIT DATA VALIDITY SCORE:
PRIORITY AREAS FOR ATTENTION:
1: Volume from own sources
2: Billed unmetered
3: Unauthorized consumption
100.000
AWWA Free Water Audit Software: Reporting Worksheet
Default option selected for Unbilled unmetered - a grading of 5 is applied but not displayed
2015 7/2014 - 6/2015Socorro Water System (NM3523728)
<----------- Enter grading in column 'E' and 'J' ---------->
Based on the information provided, audit accuracy can be improved by addressing the following components:
$/1000 gallons (US)
Default option selected for unauthorized consumption - a grading of 5 is applied but not displayed
*** YOUR SCORE IS: 82 out of 100 ***
A weighted scale for the components of consumption and water loss is included in the calculation of the Water Audit Data Validity Score
Default option selected for Systematic data handling errors - a grading of 5 is applied but not displayed
Average length of customer service line has been set to zero and a data grading score of 10 has been applied
Are customer meters typically located at the curbstop or property line?
5.850
??
?
?
?
? Click to access definition
?
?
?
?
?
?
Please enter data in the white cells below. Where available, metered values should be used; if metered values are unavailable please estimate a value. Indicate your confidence in the accuracy of the input data by grading each component (n/a or 1-10) using the drop-down list to the left of the input cell. Hover the mouse over the cell to obtain a description of the grades
?
??
?
?
?
(length of service line, beyond the property boundary, that is the responsibility of the utility)
Use buttons to selectpercentage of water
suppliedOR
value
?Click here: for help using option buttons below
?
?
?
?
+
+ Click to add a comment
WAS v5.0
++
++
+
+
American Water Works Association.Copyright © 2014, All Rights Reserved.
???
+
++
+
+
+
+
+
+
+
+
+
+
?
To select the correct data grading for each input, determine the highest grade where the utility meets or exceeds all criteria for that grade and all grades below it.
Use Customer Retail Unit Cost to value real losses
AWWA Free Water Audit Software v5.0 Reporting Worksheet 1

Water Audit Report for: Socorro Water System (NM3523728)Reporting Year:
System Attributes:Apparent Losses: 13.396 acre-ft/yr
+ Real Losses: 263.774 acre-ft/yr
= Water Losses: 277.170 acre-ft/yr
Unavoidable Annual Real Losses (UARL): 82.20 acre-ft/yr
Annual cost of Apparent Losses: $20,254
Annual cost of Real Losses: $65,862 Valued at Variable Production Cost
Performance Indicators:
Non-revenue water as percent by volume of Water Supplied: 16.8%
Non-revenue water as percent by cost of operating system: 5.7% Real Losses valued at Variable Production Cost
Apparent Losses per service connection per day: 2.96 gallons/connection/day
Real Losses per service connection per day: 58.29 gallons/connection/day
Real Losses per length of main per day*: N/A
Real Losses per service connection per day per psi pressure: 0.91 gallons/connection/day/psi
From Above, Real Losses = Current Annual Real Losses (CARL): 263.77 acre-feet/year
3.21
* This performance indicator applies for systems with a low service connection density of less than 32 service connections/mile of pipeline
AWWA Free Water Audit Software: System Attributes and Performance Indicators
*** YOUR WATER AUDIT DATA VALIDITY SCORE IS: 82 out of 100 ***
Infrastructure Leakage Index (ILI) [CARL/UARL]:
2015 7/2014 - 6/2015
Return to Reporting Worksheet to change this assumpiton
?
?
American Water Works Association.
WAS v5.0
Financial:
Operational Efficiency:
AWWA Free Water Audit Software v5.0 Performance Indicators 1

General Comment:
Audit Item
Volume from own sources:
Vol. from own sources: Master meter error adjustment:
Water imported:
Water imported: master meter error adjustment:
Water exported:
Water exported: master meter error adjustment:
Billed metered:
Billed unmetered:
Unbilled metered:
Unbilled unmetered:
Unauthorized consumption:
Customer metering inaccuracies:
Systematic data handling errors:
Length of mains:
Number of active AND inactive service connections:
Average length of customer service line:
Average operating pressure:
Total annual cost of operating water system:
Customer retail unit cost (applied to Apparent Losses):
Variable production cost (applied to Real Losses):
AWWA Free Water Audit Software: User Comments
Data was provided by the Socorro Water System which included: Water Adjustments, Water Leaks, and Irregular Readings.
*Calculated by AWWA spreadsheet utilizing recommended default values*
The Socorro Water System exports water to NM Tech Research Park. The exported volume was found in the Institutional sector billed usage sheets provided by the Socorro Water System.
The billed metered volume was evaluated from the billed usage sheets from all the sectors (Residential, Multi-Family, Commercial, Industrial, and Institutional). The exported water to NM Tech Research Park was excluded from this total.
The metered data was provided by the City for five (5) sources: Industrial Park well, Sedillo Spring, Socorro Spring, Eagle Pitcher well, and the Evergreen well. The data was reviewed for meter rollovers and other irregularities. The beginning July 2014 readings were subtracted from the ending June 2015 readings for source totals. The summation of the totals was entered. The metered units were 1000's of gallons except the Industrial Park well which meters as 100's of gallons. It was converted to 1000's of gallons in the information provided by the City.
*Calculated by AWWA spreadsheet*
Use this worksheet to add comments or notes to explain how an input value was calculated, or to document the sources of the information used.
Comment
This water audit is from 7/1/2014 to 6/30/2015 which is the financial year for the Socorro Water System. Data for the audit was provided by the Socorro Water System utility billing clerk (water usage) and the Production department (source well information, hydrant pressures, system map, meter information). The information Grading Matrix was mostly completed by the Socorro Water System, though some of the Grades were evaluated by the preparer based on information recieved (Billed Unmetered, Length of Mains, Average Operating Pressure).
This cost was provided by the Socorro Water System budget.
This was evaluated from the list of active accounts. The water rate and the sewer rate were associated with each active account from the rate codes, next the water rate and sewer rate were summed for each active account, then the result column was averaged for all the active accounts.
This was evaluated by dividing the production budget actual expenditures (separate from the Water Department) by the Volume from Own Sources (total metered from wells and springs).
Meter accuracy variations were estimated for each meter, then an overall accuracy was calculated by the average of the accuracies weighted by the amount of water metered for each source. Accuracies for the Industrial Park and Eagle Picher wells were estimated based on information for similar size and make meters.
The Socorro Water System does not import water.
It was verified with the Socorro Water System that the meters are located at the City side of the property line.
Evaluated by averaging static fire hydrant pressures from hydrant testing for the folllowing zones: Spring, Southwest I, Southwest II, Southeast, Northwest II, Northwest I, Northeast II, and Northeast I. Data was reviewed and the hydrants for which static pressure was not measured or was obviously eroneous were omitted from the average.
Per discussion with the Utlilty Billing Clerk; this entry is zero for the Socorro Water System.
The City irigates City parks and fields with unmetered water. The volume is estimated by the City and the estimate is indicated in the monthly well meters reports. The monthly estimates were summed for the total.
Excel spreadsheet lists were provided by the Socorro Water System for active and inactive service connections. The hydrants and wells were deleted from the list (identified by rate code). The active and inactive service connections were totaled.
Map was provided by the Socorro Water System. The PDF map was referenced into AutoCAD, then scaled. The mains were then overlaid by polyline tracing; then the polyline lenghts were totaled with the AutoCAD software.
The Socorro Water System does not import water.
*Calculated by AWWA spreadsheet*
Meter accuracy was estimated for a similar size and make meter.
WAS v5.0American Water Works Association.
Copyright © 2014, All Rights Reserved.
AWWA Free Water Audit Software v5.0 Comments 1

Water Audit Report for:
Reporting Year: 2015 7/2014 - 6/2015
Data Validity Score: 82
Water Exported Revenue Water23.370 23.370
Billed Metered Consumption (water exported is removed) Revenue Water
1,231.280
Own Sources Authorized Consumption 1,487.550 Billed Unmetered Consumption 1,487.550
256.2701,509.888 Unbilled Metered Consumption
0.000
1,810.428 22.338 Unbilled Unmetered Consumption
22.338
System Input Water Supplied Unauthorized Consumption 299.508
1,810.428 Apparent Losses 4.4681,787.058 13.396 Customer Metering Inaccuracies
5.850
Systematic Data Handling Errors
Water Losses 3.078
Water Imported 277.170 Leakage on Transmission and/or Distribution Mains
Real Losses Not broken down
0.000 263.774 Leakage and Overflows at Utility's Storage TanksNot broken downLeakage on Service ConnectionsNot broken down
AWWA Free Water Audit Software: Water Balance
Non-Revenue Water (NRW)
Billed Authorized Consumption
Unbilled Authorized Consumption
(Adjusted for known errors)
Billed Water Exported
Socorro Water System (NM3523728)
WAS v5.0American Water Works Association.
Copyright © 2014, All Rights Reserved.
AWWA Free Water Audit Software v5.0 Water Balance 1

Water Audit Report for:
Reporting Year: 2015 Show me the VOLUME of Non-Revenue Water
Data Validity Score: 82 Show me the COST of Non-Revenue Water
AWWA Free Water Audit Software: Dashboard
7/2014 - 6/2015Socorro Water System (NM3523728)
0
50
100
150
200
250
300
Volume (acre‐ft/yr)
Total Volume of NRW = 300 acre‐ft/yr
Unbilled metered (valued at Var. Prod. Cost)
Unbilled unmetered (valued at Var. Prod. Cost)
Unauth. consumption
Cust. metering inaccuracies
Syst. data handling errors
Real Losses (valued at Var. Prod. Cost)
WAS v5.0American Water Works Association.
Copyright © 2014, All Rights Reserved.
Water Exported
Authorized Consumption
Water Losses
0%
10%
20%
30%
40%
50%
60%
70%
80%
90%
100%
Water Exported
Water Imported
Volume From Own Sources
Water Exported
Billed Auth. Cons.
Unbilled Auth. Cons.
Apparent Losses
Real Losses
Water Exported
Revenue Water
Non Revenue Water
The graphic below is a visual representation of the Water Balance with bar heights propotional to the
volume of the audit components
Water Exported
Water Supplied
AWWA Free Water Audit Software v5.0 Dashboard 1

AWWA Free Water Audit Software v5.0 Grading Matrix 1
Grading >>> n/a 1 2 3 4 5 6 7 8 9 10
Volume from own sources:
Select this grading only if the water utility
purchases/imports all of its water resources (i.e.
has no sources of its own)
Less than 25% of water production sources are metered, remaining
sources are estimated. No regular meter accuracy testing or electronic
calibration conducted.
25% - 50% of treated water production sources are metered;
other sources estimated. No regular meter accuracy testing or electronic
calibration conducted.
Conditions between 2 and 4
50% - 75% of treated water production sources are metered,
other sources estimated. Occasional meter accuracy testing or electronic
calibration conducted.
Conditions between 4 and 6
At least 75% of treated water production sources are metered, or at least 90% of the source flow is derived
from metered sources. Meter accuracy testing and/or electronic
calibration of related instrumentation is conducted annually. Less than 25% of tested meters are found outside of +/-
6% accuracy.
Conditions between 6 and 8
100% of treated water production sources are metered, meter accuracy
testing and electronic calibration of related instrumentation is conducted
annually, less than 10% of meters are found outside of +/- 6% accuracy
Conditions between 8 and 10
100% of treated water production sources are metered, meter accuracy
testing and electronic calibration of related instrumentation is conducted
semi-annually, with less than 10% found outside of +/- 3% accuracy. Procedures
are reviewed by a third party knowledgeable in the M36
methodology.
Improvements to attain higher data grading for "Volume from
own Sources" component:
to qualify for 2:Organize and launch efforts to
collect data for determining volume from own sources
to maintain 10:Standardize meter accuracy test
frequency to semi-annual, or more frequent, for all meters. Repair or replace meters outside of +/- 3%
accuracy. Continually investigate/pilot improving metering technology.
Volume from own sources master meter and supply error
adjustment:
Select n/a only if the water utility fails to have meters on its sources of supply
Inventory information on meters and paper records of measured volumes exist but are incomplete and/or in a
very crude condition; data error cannot be determined
No automatic datalogging of production volumes; daily readings
are scribed on paper records without any accountability controls. Flows are not balanced across the water distribution system: tank/storage
elevation changes are not employed in calculating the "Volume from own sources" component and archived
flow data is adjusted only when grossly evident data error occurs.
Conditions between 2 and 4
Production meter data is logged automatically in electronic format and reviewed at least on a monthly basis
with necessary corrections implemented. "Volume from own
sources" tabulations include estimate of daily changes in tanks/storage facilities. Meter data is adjusted when gross data errors occur, or
occasional meter testing deems this necessary.
Conditions between 4 and 6
Hourly production meter data logged automatically & reviewed on at least a
weekly basis. Data is adjusted to correct gross error when
meter/instrumentation equipment malfunction is detected; and/or error is confirmed by meter accuracy testing.
Tank/storage facility elevation changes are automatically used in calculating a balanced "Volume from own sources"
component, and data gaps in the archived data are corrected on at least
a weekly basis.
Conditions between 6 and 8
Continuous production meter data is logged automatically & reviewed each
business day. Data is adjusted to correct gross error from detected meter/instrumentation equipment
malfunction and/or results of meter accuracy testing. Tank/storage facility elevation changes are automatically used in "Volume from own sources"
tabulations and data gaps in the archived data are corrected on a daily
basis.
Conditions between 8 and 10
Computerized system (SCADA or similar) automatically balances flows from all sources and storages; results
are reviewed each business day. Tight accountability controls ensure that all data gaps that occur in the archived flow data are quickly detected and
corrected. Regular calibrations between SCADA and sources meters ensures
minimal data transfer error.
Improvements to attain higher data grading for "Master meter and supply error adjustment"
component:
to qualify for 2:Develop a plan to restructure
recordkeeping system to capture all flow data; set a procedure to review flow data on a daily basis to detect input errors. Obtain more reliable
information about existing meters by conducting field inspections of
meters and related instrumentation, and obtaining manufacturer
literature.
to maintain 10:Monitor meter innovations for
development of more accurate and less expensive flowmeters. Continue to
replace or repair meters as they perform outside of desired accuracy limits. Stay abreast of new and more accurate water level instruments to
better record tank/storage levels and archive the variations in storage
volume. Keep current with SCADA and data management systems to ensure
that archived data is well-managed and error free.
Water Imported:
Select n/a if the water utility's supply is
exclusively from its own water resources (no bulk
purchased/ imported water)
Less than 25% of imported water sources are metered, remaining
sources are estimated. No regular meter accuracy testing.
25% - 50% of imported water sources are metered; other sources
estimated. No regular meter accuracy testing.
Conditions between 2 and 4
50% - 75% of imported water sources are metered, other sources
estimated. Occasional meter accuracy testing conducted.
Conditions between 4 and 6
At least 75% of imported water sources are metered, meter accuracy testing and/or electronic calibration of related instrumentation is conducted annually for all meter installations.
Less than 25% of tested meters are found outside of +/- 6% accuracy.
Conditions between 6 and 8
100% of imported water sources are metered, meter accuracy testing and
electronic calibration of related instrumentation is conducted annually,
less than 10% of meters are found outside of +/- 6% accuracy
Conditions between 8 and 10
100% of imported water sources are metered, meter accuracy testing and
electronic calibration of related instrumentation is conducted semi-
annually for all meter installations, with less than 10% of accuracy tests found
outside of +/- 3% accuracy.
to qualify for 10:Link all production and tank/storage facility elevation change data to a Supervisory Control & Data Acquisition (SCADA) System, or similar computerized monitoring/control system,
and establish automatic flow balancing algorithm and regularly calibrate between SCADA and source meters. Data is
reviewed and corrected each business day.
AWWA Free Water Audit Software: Grading Matrix The grading assigned to each audit component and the corresponding recommended improvements and actions are highlighted in yellow. Audit accuracy is likely to be improved by prioritizing those items shown in red
to qualify for 6:Refine computerized data collection and archive to include hourly production meter data that is reviewed at least on a weekly basis to detect specific data anomalies and gaps.
Use daily net storage change to balance flows in calculating "Water Supplied" volume. Necessary corrections to data
errors are implemented on a weekly basis.
to qualify for 8:Ensure that all flow data is collected and archived on at least
an hourly basis. All data is reviewed and detected errors corrected each business day. Tank/storage levels variations
are employed in calculating balanced "Water Supplied" component. Adjust production meter data for gross error
and inaccuracy confirmed by testing.
to qualify for 10:Maintain annual meter accuracy testing and calibration of
related instrumentation for all meter installations. Repair or replace meters outside of +/- 3% accuracy. Investigate new
meter technology; pilot one or more replacements with innovative meters in attempt to further improve meter
accuracy.
WATER SUPPLIED
to qualify for 4:Locate all water production sources on maps and in the field, launch meter accuracy testing for existing meters, begin to install meters on unmetered water production sources and replace any obsolete/defective meters.
to qualify for 6:Formalize annual meter accuracy testing for all source
meters; specify the frequency of testing. Complete installation of meters on unmetered water production
sources and complete replacement of all obsolete/defective meters.
to qualify for 8:Conduct annual meter accuracy testing and calibration of
related instrumentation on all meter installations on a regular basis. Complete project to install new, or replace defective existing, meters so that entire production meter population is
metered. Repair or replace meters outside of +/- 6% accuracy.
to qualify for 4:Install automatic datalogging equipment on production
meters. Complete installation of level instrumentation at all tanks/storage facilities and include tank level data in
automatic calculation routine in a computerized system. Construct a computerized listing or spreadsheet to archive
input volumes, tank/storage volume changes and import/export flows in order to determine the composite
"Water Supplied" volume for the distribution system. Set a procedure to review this data on a monthly basis to detect
gross anomalies and data gaps.
WAS 5.0American Water Works Association. Copyright © 2014, All Rights Reserved.

AWWA Free Water Audit Software v5.0 Grading Matrix 2
Grading >>> n/a 1 2 3 4 5 6 7 8 9 10
The grading assigned to each audit component and the corresponding recommended improvements and actions are highlighted in yellow. Audit accuracy is likely to be improved by prioritizing those items shown in red
Improvements to attain higher
data grading for "Water Imported Volume" component:
(Note: usually the water supplier selling the water -
"the Exporter" - to the utility being audited is responsible to
maintain the metering installation measuring the
imported volume. The utility should coordinate carefully with the Exporter to ensure
that adequate meter upkeep takes place and an accurate
measure of the Water Imported volume is
quantified. )
to qualify for 2:Review bulk water purchase
agreements with partner suppliers; confirm requirements for use and
maintenance of accurate metering. Identify needs for new or
replacement meters with goal to meter all imported water sources.
to maintain 10:Standardize meter accuracy test
frequency to semi-annual, or more frequent, for all meters. Continue to
conduct calibration of related instrumentation on a semi-annual basis. Repair or replace meters outside of +/-
3% accuracy. Continually investigate/pilot improving metering
technology.
Water imported master meter and supply error adjustment:
Select n/a if the Imported water supply is
unmetered, with Imported water quantities estimated on the billing invoices sent
by the Exporter to the purchasing Utility.
Inventory information on imported meters and paper records of
measured volumes exist but are incomplete and/or in a very crude
condition; data error cannot be determined Written agreement(s) with water Exporter(s) are missing
or written in vague language concerning meter management and
testing.
No automatic datalogging of imported supply volumes; daily readings are scribed on paper
records without any accountability controls to confirm data accuracy
and the absence of errors and data gaps in recorded volumes. Written agreement requires meter accuracy testing but is vague on the details of how and who conducts the testing.
Conditions between 2 and 4
Imported supply metered flow data is logged automatically in electronic format and reviewed at least on a monthly basis by the Exporter with
necessary corrections implemented. Meter data is adjusted by the
Exporter when gross data errors are detected. A coherent data trail exists
for this process to protect both the selling and the purchasing Utility.
Written agreement exists and clearly states requirements and roles for meter accuracy testing and data
management.
Conditions between 4 and 6
Hourly Imported supply metered data is logged automatically & reviewed on at least a weekly basis by the Exporter. Data is adjusted to correct gross error when meter/instrumentation equipment malfunction is detected; and to correct for error confirmed by meter accuracy testing. Any data gaps in the archived data are detected and corrected during
the weekly review. A coherent data trail exists for this process to protect both the selling and the purchasing
Utility.
Conditions between 6 and 8
Continuous Imported supply metered flow data is logged automatically & reviewed each business day by the
Exporter. Data is adjusted to correct gross error from detected
meter/instrumentation equipment malfunction and/or results of meter
accuracy testing. Any data errors/gaps are detected and
corrected on a daily basis. A data trail exists for the process to protect both the selling and the purchasing Utility.
Conditions between 8 and 10
Computerized system (SCADA or similar) automatically records data
which is reviewed each business day by the Exporter. Tight accountability
controls ensure that all error/data gaps that occur in the archived flow data are
quickly detected and corrected. A reliable data trail exists and contract provisions for meter testing and data
management are reviewed by the selling and purchasing Utility at least
once every five years.
Improvements to attain higher data grading for "Water
imported master meter and supply error adjustment"
component:
to qualify for 2:Develop a plan to restructure
recordkeeping system to capture all flow data; set a procedure to review flow data on a daily basis to detect input errors. Obtain more reliable
information about existing meters by conducting field inspections of
meters and related instrumentation, and obtaining manufacturer
literature. Review the written agreement between the selling and
purchasing Utility.
to maintain 10:Monitor meter innovations for
development of more accurate and less expensive flowmeters; work with the
Exporter to help identify meter replacement needs. Keep
communication lines with Exporters open and maintain productive relations. Keep the written agreement current with clear and explicit language that meets
the ongoing needs of all parties.
Water Exported:
Select n/a if the water utility sells no bulk water to neighboring water utilities (no exported water sales)
Less than 25% of exported water sources are metered, remaining
sources are estimated. No regular meter accuracy testing.
25% - 50% of exported water sources are metered; other sources
estimated. No regular meter accuracy testing.
Conditions between 2 and 4
50% - 75% of exported water sources are metered, other sources
estimated. Occasional meter accuracy testing conducted.
Conditions between 4 and 6
At least 75% of exported water sources are metered, meter accuracy
testing and/or electronic calibration conducted annually. Less than 25% of tested meters are found outside of +/-
6% accuracy.
Conditions between 6 and 8
100% of exported water sources are metered, meter accuracy testing and
electronic calibration of related instrumentation is conducted annually,
less than 10% of meters are found outside of +/- 6% accuracy
Conditions between 8 and 10
100% of exported water sources are metered, meter accuracy testing and
electronic calibration of related instrumentation is conducted semi-
annually for all meter installations, with less than 10% of accuracy tests found
outside of +/- 3% accuracy.
to qualify for 10:Conduct meter accuracy testing for all meters on a semi-
annual basis, along with calibration of all related instrumentation. Repair or replace meters outside of +/- 3%
accuracy. Investigate new meter technology; pilot one or more replacements with innovative meters in attempt to improve
meter accuracy.
to qualify for 10:Conduct accountability checks to confirm that all Imported
supply metered data is reviewed and corrected each business day by the Exporter. Results of all meter accuracy tests and data corrections should be available for sharing between the
Exporter and the purchasing Utility. Establish a schedule for a regular review and updating of the contractual language in the
written agreement between the selling and the purchasing Utility; at least every five years.
to qualify for 8:Complete project to install new, or replace defective, meters
on all imported water interconnections. Maintain annual meter accuracy testing for all imported water meters and
conduct calibration of related instrumentation at least annually. Repair or replace meters outside of +/- 6%
accuracy.
to qualify for 4:Install automatic datalogging equipment on Imported
supply meters. Set a procedure to review this data on a monthly basis to detect gross anomalies and data gaps. Launch discussions with the Exporters to jointly review
terms of the written agreements regarding meter accuracy testing and data management; revise the terms as
necessary.
to qualify for 6:Refine computerized data collection and archive to include
hourly Imported supply metered flow data that is reviewed at least on a weekly basis to detect specific data anomalies
and gaps. Make necessary corrections to errors/data errors on a weekly basis.
to qualify for 8:Ensure that all Imported supply metered flow data is
collected and archived on at least an hourly basis. All data is reviewed and errors/data gaps are corrected each
business day.
To qualify for 4:Locate all imported water sources on maps and in the field, launch meter accuracy testing for existing meters, begin to
install meters on unmetered imported water interconnections and replace obsolete/defective meters.
to qualify for 6:Formalize annual meter accuracy testing for all imported water meters, planning for both regular meter accuracy testing and calibration of the related instrumentation.
Continue installation of meters on unmetered imported water interconnections and replacement of obsolete/defective
meters.

AWWA Free Water Audit Software v5.0 Grading Matrix 3
Grading >>> n/a 1 2 3 4 5 6 7 8 9 10
The grading assigned to each audit component and the corresponding recommended improvements and actions are highlighted in yellow. Audit accuracy is likely to be improved by prioritizing those items shown in red
Improvements to attain higher
data grading for "Water Exported Volume" component:
(Note: usually, if the water utility being audited sells
(Exports) water to a neighboring purchasing Utility,
it is the responsibility of the utility exporting the water to
maintain the metering installation measuring the
Exported volume. The utility exporting the water should
ensure that adequate meter upkeep takes place and an
accurate measure of the Water Exported volume is
quantified. )
to qualify for 2:Review bulk water sales
agreements with purchasing utilities; confirm requirements for use & upkeep of accurate metering.
Identify needs to install new, or replace defective meters as
needed.
to maintain 10:Standardize meter accuracy test
frequency to semi-annual, or more frequent, for all meters. Repair or replace meters outside of +/- 3%
accuracy. Continually investigate/pilot improving metering technology.
Water exported master meter and supply error adjustment:
Select n/a only if the water utility fails to have meters
on its exported supply interconnections.
Inventory information on exported meters and paper records of
measured volumes exist but are incomplete and/or in a very crude
condition; data error cannot be determined Written agreement(s) with the utility purchasing the water
are missing or written in vague language concerning meter management and testing.
No automatic datalogging of exported supply volumes; daily readings are scribed on paper
records without any accountability controls to confirm data accuracy
and the absence of errors and data gaps in recorded volumes. Written agreement requires meter accuracy testing but is vague on the details of how and who conducts the testing.
Conditions between 2 and 4
Exported metered flow data is logged automatically in electronic format and reviewed at least on a monthly basis,
with necessary corrections implemented. Meter data is adjusted
by the utility selling (exporting) the water when gross data errors are
detected. A coherent data trail exists for this process to protect both the utility exporting the water and the
purchasing Utility. Written agreement exists and clearly states
requirements and roles for meter accuracy testing and data
management.
Conditions between 4 and 6
Hourly exported supply metered data is logged automatically & reviewed on
at least a weekly basis by the utility selling the water. Data is adjusted to
correct gross error when meter/instrumentation equipment
malfunction is detected; and to correct for error found by meter accuracy
testing. Any data gaps in the archived data are detected and corrected during
the weekly review. A coherent data trail exists for this process to protect both the selling (exporting) utility and
the purchasing Utility.
Conditions between 6 and 8
Continuous exported supply metered flow data is logged automatically & reviewed each business day by the utility selling (exporting) the water.
Data is adjusted to correct gross error from detected meter/instrumentation equipment malfunction and any error confirmed by meter accuracy testing.
Any data errors/gaps are detected and corrected on a daily basis. A data trail exists for the process to protect both the selling (exporting) Utility and the
purchasing Utility.
Conditions between 8 and 10
Computerized system (SCADA or similar) automatically records data
which is reviewed each business day by the utility selling (exporting) the water.
Tight accountability controls ensure that all error/data gaps that occur in the
archived flow data are quickly detected and corrected. A reliable data trail
exists and contract provisions for meter testing and data management are reviewed by the selling Utility and
purchasing Utility at least once every five years.
Improvements to attain higher data grading for "Water
exported master meter and supply error adjustment"
component:
to qualify for 2:Develop a plan to restructure
recordkeeping system to capture all flow data; set a procedure to review flow data on a daily basis to detect input errors. Obtain more reliable
information about existing meters by conducting field inspections of
meters and related instrumentation, and obtaining manufacturer
literature. Review the written agreement between the utility selling
(exporting) the water and the purchasing Utility.
to maintain 10:Monitor meter innovations for
development of more accurate and less expensive flowmeters; work with the
purchasing utilities to help identify meter replacement needs. Keep
communication lines with the purchasing utilities open and maintain productive relations. Keep the written
agreement current with clear and explicit language that meets the ongoing
needs of all parties.
to qualify for 10:Conduct accountability checks to confirm that all exported
metered flow data is reviewed and corrected each business day by the utility selling the water. Results of all meter
accuracy tests and data corrections should be available for sharing between the utility and the purchasing Utility. Establish a schedule for a regular review and updating of the contractual
language in the written agreements with the purchasing utilities; at least every five years.
To qualify for 4:Locate all exported water sources on maps and in field,
launch meter accuracy testing for existing meters, begin to install meters on unmetered exported water
interconnections and replace obsolete/defective meters
to qualify for 6:Refine computerized data collection and archive to include
hourly exported supply metered flow data that is reviewed at least on a weekly basis to detect specific data anomalies
and gaps. Make necessary corrections to errors/data errors on a weekly basis.
to qualify for 8:Ensure that all exported metered flow data is collected and archived on at least an hourly basis. All data is reviewed and errors/data gaps are corrected each business day.
to qualify for 4:Install automatic datalogging equipment on exported
supply meters. Set a procedure to review this data on a monthly basis to detect gross anomalies and data gaps. Launch discussions with the purchasing utilities to jointly review terms of the written agreements regarding meter
accuracy testing and data management; revise the terms as necessary.
to qualify for 6:Formalize annual meter accuracy testing for all exported
water meters. Continue installation of meters on unmetered exported water interconnections and replacement of
obsolete/defective meters.
to qualify for 8:Complete project to install new, or replace defective, meters
on all exported water interconnections. Maintain annual meter accuracy testing for all exported water meters. Repair
or replace meters outside of +/- 6% accuracy.
to qualify for 10:Maintain annual meter accuracy testing for all meters. Repair or replace meters outside of +/- 3% accuracy. Investigate new
meter technology; pilot one or more replacements with innovative meters in attempt to improve meter accuracy.

AWWA Free Water Audit Software v5.0 Grading Matrix 4
Grading >>> n/a 1 2 3 4 5 6 7 8 9 10
The grading assigned to each audit component and the corresponding recommended improvements and actions are highlighted in yellow. Audit accuracy is likely to be improved by prioritizing those items shown in red
Billed metered:
n/a (not applicable). Select n/a only if the entire
customer population is not metered and is billed for water service on a flat or fixed rate basis. In such a case the volume entered
must be zero.
Less than 50% of customers with volume-based billings from meter readings; flat or fixed rate billing
exists for the majority of the customer population
At least 50% of customers with volume-based billing from meter reads; flat rate billing for others.
Manual meter reading is conducted, with less than 50% meter read
success rate, remainding accounts' consumption is estimated. Limited
meter records, no regular meter testing or replacement. Billing data
maintained on paper records, with no auditing.
Conditions between 2 and 4
At least 75% of customers with volume-based, billing from meter reads; flat or fixed rate billing for
remaining accounts. Manual meter reading is conducted with at least
50% meter read success rate; consumption for accounts with failed
reads is estimated. Purchase records verify age of customer meters; only very limited meter accuracy testing is conducted.
Customer meters are replaced only upon complete failure. Computerized billing records exist, but only sporadic
internal auditing conducted.
Conditions between 4 and 6
At least 90% of customers with volume-based billing from meter reads;
consumption for remaining accounts is estimated. Manual customer meter reading gives at least 80% customer
meter reading success rate; consumption for accounts with failed reads is estimated. Good customer meter records eixst, but only limited meter accuracy testing is conducted. Regular replacement is conducted for
the oldest meters. Computerized billing records exist with annual auditing of summary statistics conducting by utility personnel.
Conditions between 6 and 8
At least 97% of customers exist with volume-based billing from meter
reads. At least 90% customer meter reading success rate; or at least 80% read success rate with planning and
budgeting for trials of Automatic Meter Reading (AMR) or Advanced Metering
Infrastructure (AMI) in one or more pilot areas. Good customer meter records. Regular meter accuracy
testing guides replacement of statistically significant number of
meters each year. Routine auditing of computerized billing records for global and detailed statistics occurs annually by utility personnel, and is verified by
third party at least once every five years.
Conditions between 8 and 10
At least 99% of customers exist with volume-based billing from meter reads. At least 95% customer meter reading success rate; or minimum 80% meter reading success rate, with Automatic Meter Reading (AMR) or Advanced Metering Infrastructure (AMI) trials underway. Statistically significant
customer meter testing and replacement program in place on a
continuous basis. Computerized billing with routine, detailed auditing, including
field investigation of representative sample of accounts undertaken
annually by utility personnel. Audit is conducted by third party auditors at
least once every three years.
Improvements to attain higher data grading for "Billed Metered Consumption"
component:
If n/a is selected because the customer meter
population is unmetered, consider establishing a new policy to meter the
customer population and employ water rates based upon metered volumes.
to qualify for 2:Conduct investigations or trials of
customer meters to select appropriate meter models. Budget
funding for meter installations. Investigate volume based water rate
structures.
to maintain 10:Continue annual internal billing data
auditing, and third party auditing at least every three years. Continue customer meter accuracy testing to ensure that accurate customer meter readings are obtained and entered as the basis for volume based billing. Stay abreast of
improvements in Automatic Meter Reading (AMR) and Advanced Metering
Infrastructure (AMI) and information management. Plan and budget for
justified upgrades in metering, meter reading and billing data management to maintain very high accuracy in customer
metering and billing.
Billed unmetered:
Select n/a if it is the policy of the water utility to meter all customer connections and it has been confirmed by detailed auditing that all customers do indeed have
a water meter; i.e. no intentionally unmetered
accounts exist
Water utility policy does not require customer metering; flat or fixed fee
billing is employed. No data is collected on customer consumption.
The only estimates of customer population consumption available are derived from data estimation
methods using average fixture count multiplied by number of connections,
or similar approach.
Water utility policy does not require customer metering; flat or fixed fee billing is employed. Some metered
accounts exist in parts of the system (pilot areas or District Metered Areas) with consumption read
periodically or recorded on portable dataloggers over one, three, or
seven day periods. Data from these sample meters are used to infer
consumption for the total customer population. Site specific estimation
methods are used for unusual buildings/water uses.
Conditions between 2 and 4
Water utility policy does require metering and volume based billing in general. However, a liberal amount of exemptions and a lack of clearly
written and communicated procedures result in up to 20% of
billed accounts believed to be unmetered by exemption; or the
water utility is in transition to becoming fully metered, and a large
number of customers remain unmetered. A rough estimate of the
annual consumption for all unmetered accounts is included in
the annual water audit, with no inspection of individual unmetered
accounts.
Conditions between 4 and 6
Water utility policy does require metering and volume based billing but
established exemptions exist for a portion of accounts such as municipal buildings. As many as 15% of billed accounts are unmetered due to this
exemption or meter installation difficulties. Only a group estimate of
annual consumption for all unmetered accounts is included in the annual water audit, with no inspection of individual unmetered accounts.
Conditions between 6 and 8
Water utility policy does require metering and volume based billing for all customer accounts. However, less
than 5% of billed accounts remain unmetered because meter installation is hindered by unusual circumstances. The goal is to minimize the number of
unmetered accounts. Reliable estimates of consumption are obtained for these unmetered
accounts via site specific estimation methods.
Conditions between 8 and 10
Water utility policy does require metering and volume based billing for
all customer accounts. Less than 2% of billed accounts are unmetered and exist because meter installation is hindered by unusual circumstances. The goal
exists to minimize the number of unmetered accounts to the extent that is
economical. Reliable estimates of consumption are obtained at these accounts via site specific estimation
methods.
Improvements to attain higher data grading for "Billed
Unmetered Consumption" component:
to qualify for 2: Conduct research and evaluate cost/benefit of a new water utility policy to require metering of the
customer population; thereby greatly reducing or eliminating unmetered accounts. Conduct pilot metering
project by installing water meters in small sample of customer accounts and periodically reading the meters
or datalogging the water consumption over one, three, or
seven day periods.
to maintain 10: Continue to refine estimation methods
for unmetered consumption and explore means to establish metering, for as many billed remaining unmetered
accounts as is economically feasible.
AUTHORIZED CONSUMPTION
to qualify for 4:Purchase and install meters on unmetered accounts. Implement policies to improve meter reading success. Catalog meter information during meter read visits to identify age/model of existing meters. Test a minimal
number of meters for accuracy. Install computerized billing system.
to qualify for 6:Purchase and install meters on unmetered accounts.
Eliminate flat fee billing and establish appropriate water rate structure based upon measured consumption. Continue to
achieve verifiable success in removing manual meter reading barriers. Expand meter accuracy testing. Launch regular meter replacement program. Launch a program of
annual auditing of global billing statistics by utility personnel.
to qualify for 10:Purchase and install meters on unmetered accounts. Launch
Automatic Meter Reading (AMR) or Advanced Metering Infrastructure (AMI) system trials if manual meter reading
success rate of at least 99% is not achieved within a five-year program. Continue meter accuracy testing program. Conduct
planning and budgeting for large scale meter replacement based upon meter life cycle analysis using cumulative flow
target. Continue annual detailed billing data auditing by utility personnel and conduct third party auditing at least once every
three years.
to qualify for 8:Purchase and install meters on unmetered accounts. If customer meter reading success rate is less than 97%, assess cost-effectiveness of Automatic Meter Reading
(AMR) or Advanced Metering Infrastructure (AMI) system for portion or entire system; or otherwise achieve ongoing
improvements in manual meter reading success rate to 97% or higher. Refine meter accuracy testing program. Set
meter replacement goals based upon accuracy test results. Implement annual auditing of detailed billing records by utility
personnel and implement third party auditing at least once every five years.
to qualify for 8:Push to install customer meters on a full scale basis. Refine metering policy and procedures to ensure that all accounts, including municipal properties, are designated for meters. Plan special efforts to address "hard-to-access" accounts.
Implement procedures to obtain a reliable consumption estimate for the remaining few unmetered accounts awaiting
meter installation.
to qualify for 10:Continue customer meter installation throughout the service
area, with a goal to minimize unmetered accounts. Sustain the effort to investigate accounts with access difficulties, and
devise means to install water meters or otherwise measure water consumption.
to qualify for 4: Implement a new water utility policy requiring customer
metering. Launch or expand pilot metering study to include several different meter types, which will provide data for
economic assessment of full scale metering options. Assess sites with access difficulties to devise means to
obtain water consumption volumes. Begin customer meter installation.
to qualify for 6:Refine policy and procedures to improve customer metering participation for all but solidly exempt accounts. Assign staff
resources to review billing records to identify errant unmetered properties. Specify metering needs and funding requirements to install sufficient meters to significant reduce
the number of unmetered accounts

AWWA Free Water Audit Software v5.0 Grading Matrix 5
Grading >>> n/a 1 2 3 4 5 6 7 8 9 10
The grading assigned to each audit component and the corresponding recommended improvements and actions are highlighted in yellow. Audit accuracy is likely to be improved by prioritizing those items shown in red
Unbilled metered:select n/a if all billing-
exempt consumption is unmetered.
Billing practices exempt certain accounts, such as municipal
buildings, but written policies do not exist; and a reliable count of unbilled
metered accounts is unavailable. Meter upkeep and meter reading on
these accounts is rare and not considered a priority. Due to poor recordkeeping and lack of auditing,
water consumption for all such accounts is purely guesstimated.
Billing practices exempt certain accounts, such as municipal
buildings, but only scattered, dated written directives exist to justify this practice. A reliable count of unbilled
metered accounts is unavailable. Sporadic meter replacement and meter reading occurs on an as-needed basis. The total annual
water consumption for all unbilled, metered accounts is estimated based upon approximating the
number of accounts and assigning consumption from actively billed accounts of same meter size.
Conditions between 2 and 4
Dated written procedures permit billing exemption for specific accounts, such as municipal
properties, but are unclear regarding certain other types of accounts.
Meter reading is given low priority and is sporadic. Consumption is
quantified from meter readings where available. The total number of
unbilled, unmetered accounts must be estimated along with consumption
volumes.
Conditions between 4 and 6
Written policies regarding billing exemptions exist but adherence in
practice is questionable. Metering and meter reading for municipal buildings is reliable but sporadic for other unbilled
metered accounts. Periodic auditing of such accounts is conducted. Water
consumption is quantified directly from meter readings where available, but the majority of the consumption is
estimated.
Conditions between 6 and 8
Written policy identifies the types of accounts granted a billing exemption.
Customer meter management and meter reading are considered
secondary priorities, but meter reading is conducted at least annually to
obtain consumption volumes for the annual water audit. High level auditing
of billing records ensures that a reliable census of such accounts
exists.
Conditions between 8 and 10
Clearly written policy identifies the types of accounts given a billing exemption,
with emphasis on keeping such accounts to a minimum. Customer
meter management and meter reading for these accounts is given proper priority and is reliably conducted.
Regular auditing confirms this. Total water consumption for these accounts
is taken from reliable readings from accurate meters.
Improvements to attain higher data grading for "Unbilled Metered Consumption"
component:
to qualify for 2:Reassess the water utility's policy
allowing certain accounts to be granted a billing exemption. Draft
an outline of a new written policy for billing exemptions, with clear
justification as to why any accounts should be exempt from billing, and
with the intention to keep the number of such accounts to a
minimum.
to maintain 10:Reassess the utility's philosophy in
allowing any water uses to go "unbilled". It is possible to meter and bill all
accounts, even if the fee charged for water consumption is discounted or
waived. Metering and billing all accounts ensures that water
consumption is tracked and water waste from plumbing leaks is detected and
minimized.
Unbilled unmetered:
Extent of unbilled, unmetered consumption is unknown due to
unclear policies and poor recordkeeping. Total consumption is quantified based upon a purely
subjective estimate.
Clear extent of unbilled, unmetered consumption is unknown, but a number of events are randomly
documented each year, confirming existence of such consumption, but without sufficient documentation to quantify an accurate estimate of the
annual volume consumed.
Conditions between 2 and 4
Extent of unbilled, unmetered consumption is partially known, and
procedures exist to document certain events such as miscellaneous fire hydrant uses. Formulae is used to quantify the consumption from such events (time running multiplied by
typical flowrate, multiplied by number of events).
Default value of 1.25% of system input volume is employed
Coherent policies exist for some forms of unbilled, unmetered consumption but others await closer evaluation. Reasonable recordkeeping for the
managed uses exists and allows for annual volumes to be quantified by
inference, but unsupervised uses are guesstimated.
Conditions between 6 and 8
Clear policies and good recordkeeping exist for some uses (ex: water used in
periodic testing of unmetered fire connections), but other uses (ex:
miscellaneous uses of fire hydrants) have limited oversight. Total
consumption is a mix of well quantified use such as from formulae (time running multiplied by typical flow,
multiplied by number of events) or temporary meters, and relatively
subjective estimates of less regulated use.
Conditions between 8 and 10
Clear policies exist to identify permitted use of water in unbilled, unmetered
fashion, with the intention of minimizing this type of consumption. Good records
document each occurrence and consumption is quantified via formulae (time running multiplied by typical flow, multiplied by number of events) or use
of temporary meters.
Improvements to attain higher data grading for "Unbilled Unmetered Consumption"
component:
to qualify for 5:Utilize the accepted default value of
1.25% of the volume of water supplied as an expedient means to gain a reasonable quantification of
this use.to qualify for 2:
Establish a policy regarding what water uses should be allowed to
remain as unbilled and unmetered. Consider tracking a small sample of
one such use (ex: fire hydrant flushings).
to qualify for 5:Utilize accepted default value of
1.25% of the volume of water supplied as an expedient means to
gain a reasonable quantification of all such use. This is particularly
appropriate for water utilities who are in the early stages of the water
auditing process, and should focus on other components since the volume of unbilled, umetered
consumption is usually a relatively small quatity component, and other larger-quantity components should
take priority.
to qualify for 6 or greater:
Finalize policy and begin to conduct field
checks to better establish and quantify such usage. Proceed
if top-down audit exists and/or a great volume of such use is
suspected.
to maintain 10:Continue to refine policy and
procedures with intention of reducing the number of allowable uses of water
in unbilled and unmetered fashion. Any uses that can feasibly become billed and metered should be converted
eventually.
to qualify for 4:Review historic written directives and policy documents allowing certain accounts to be billing-exempt. Draft an outline of a written policy for billing exemptions, identify criteria that grants an exemption, with a goal of keeping
this number of accounts to a minimum. Consider increasing the priority of reading meters on unbilled
accounts at least annually.
to qualify for 6:Draft a new written policy regarding billing exemptions based
upon consensus criteria allowing this occurrence. Assign resources to audit meter records and billing records to obtain
census of unbilled metered accounts. Gradually include a greater number of these metered accounts to the routes for
regular meter reading.
to qualify for 10:Refine written procedures to ensure that all uses of unbilled,
unmetered water are overseen by a structured permitting process managed by water utility personnel. Reassess policy
to determine if some of these uses have value in being converted to billed and/or metered status.
to qualify for 10:Ensure that meter management (meter accuracy testing, meter replacement) and meter reading activities for unbilled accounts
are accorded the same priority as billed accounts. Establish ongoing annual auditing process to ensure that water
consumption is reliably collected and provided to the annual water audit process.
to qualify for 8:Communicate billing exemption policy throughout the
organization and implement procedures that ensure proper account management. Conduct inspections of accounts
confirmed in unbilled metered status and verify that accurate meters exist and are scheduled for routine meter readings.
Gradually increase the number of unbilled metered accounts that are included in regular meter reading routes.
to qualify for 5:Utilize accepted default value of 1.25% of the volume of
water supplied as an expedient means to gain a reasonable quantification of this use.
to qualify for 4:Evaluate the documentation of events that have been
observed. Meet with user groups (ex: for fire hydrants - fire departments, contractors to ascertain their need and/or
volume requirements for water from fire hydrants).
to qualify for 8:Assess water utility policy and procedures for various
unmetered usages. For example, ensure that a policy exists and permits are issued for use of fire hydrants by persons
outside of the utility. Create written procedures for use and documentation of fire hydrants by water utility personnel.
Use same approach for other types of unbilled, unmetered water usage.
AWWA Free Water Audit Software v5.0 Grading Matrix 6
Grading >>> n/a 1 2 3 4 5 6 7 8 9 10
The grading assigned to each audit component and the corresponding recommended improvements and actions are highlighted in yellow. Audit accuracy is likely to be improved by prioritizing those items shown in red
Unauthorized consumption:
Extent of unauthorized consumption is unknown due to unclear policies
and poor recordkeeping. Total unauthorized consumption is
guesstimated.
Unauthorized consumption is a known occurrence, but its extent is a mystery. There are no requirements to document observed events, but
periodic field reports capture some of these occurrences. Total
unauthorized consumption is approximated from this limited data.
conditions between 2 and 4
Procedures exist to document some unauthorized consumption such as observed unauthorized fire hydrant openings. Use formulae to quantify
this consumption (time running multiplied typical flowrate, multiplied
by number of events).
Default value of 0.25% of volume of
water supplied is employed
Coherent policies exist for some forms of unauthorized consumption (more than simply fire hydrant misuse) but
others await closer evaluation. Reasonable surveillance and
recordkeeping exist for occurrences that fall under the policy. Volumes quantified by inference from these
records.
Conditions between 6 and 8
Clear policies and good auditable recordkeeping exist for certain events
(ex: tampering with water meters, illegal bypasses of customer meters);
but other occurrences have limited oversight. Total consumption is a
combination of volumes from formulae (time x typical flow) and subjective
estimates of unconfirmed consumption.
Conditions between 8 and 10
Clear policies exist to identify all known unauthorized uses of water. Staff and
procedures exist to provide enforcement of policies and detect
violations. Each occurrence is recorded and quantified via formulae (estimated time running multiplied by typical flow) or similar methods. All records and
calculations should exist in a form that can be audited by a third party.
Improvements to attain higher data grading for "Unauthorized
Consumption" component:
to qualify for 5:Use accepted default of 0.25% of
volume of water supplied.to qualify for 2:
Review utility policy regarding what water uses are considered
unauthorized, and consider tracking a small sample of one such
occurrence (ex: unauthorized fire hydrant openings)
to qualify for 5:Utilize accepted default value of
0.25% of volume of water supplied as an expedient means to gain a
reasonable quantification of all such use. This is particularly appropriate for water utilities who are in the early stages of the water auditing process.
to qualify for 6 or greater:
Finalize policy updates to clearly
identify the types of water consumption that are authorized from those usages
that fall outside of this policy and are,
therefore, unauthorized. Begin
to conduct regular field checks. Proceed if the top-down audit already exists and/or
a great volume of such use is suspected.
to maintain 10:Continue to refine policy and
procedures to eliminate any loopholes that allow or tacitly encourage
unauthorized consumption. Continue to be vigilant in detection, documentation
and enforcement efforts.
Customer metering inaccuracies:
select n/a only if the entire customer population is
unmetered. In such a case the volume entered must
be zero.
Customer meters exist, but with unorganized paper records on
meters; no meter accuracy testing or meter replacement program for any
size of retail meter. Metering workflow is driven chaotically with no proactive management. Loss volume due to aggregate meter
inaccuracy is guesstimated.
Poor recordkeeping and meter oversight is recognized by water
utility management who has allotted staff and funding resources to
organize improved recordkeeping and start meter accuracy testing.
Existing paper records gathered and organized to provide cursory
disposition of meter population. Customer meters are tested for accuracy only upon customer
request.
Conditions between 2 and 4
Reliable recordkeeping exists; meter information is improving as meters
are replaced. Meter accuracy testing is conducted annually for a small number of meters (more than
just customer requests, but less than 1% of inventory). A limited number of the oldest meters are replaced each year. Inaccuracy volume is largely an estimate, but refined based upon limited testing data.
Conditions between 4 and 6
A reliable electronic recordkeeping system for meters exists. The meter population includes a mix of new high performing meters and dated meters with suspect accuracy. Routine, but limited, meter accuracy testing and
meter replacement occur. Inaccuracy volume is quantified using a mix of
reliable and less certain data.
Conditions between 6 and 8
Ongoing meter replacement and accuracy testing result in highly
accurate customer meter population. Testing is conducted on samples of
meters of varying age and accumulated volume of throughput to determine optimum replacement time
for various types of meters.
Ongoing meter replacement and
accuracy testing result in highly accurate customer meter
population. Statistically significant number of meters are tested in audit year.
This testing is conducted on samples
of meters of varying age and accumulated volume of throughput to determine optimum replacement time for
these meters.
Good records of all active customer meters exist and include as a minimum:
meter number, account number/location, type, size and manufacturer. Ongoing meter
replacement occurs according to a targeted and justified basis. Regular
meter accuracy testing gives a reliable measure of composite inaccuracy
volume for the customer meter population. New metering technology is
embraced to keep overall accuracy improving. Procedures are reviewed by a third party knowledgeable in the M36
methodology.
to quality for 8:Assess water utility policies to ensure that all known
occurrences of unauthorized consumption are outlawed, and that appropriate penalties are prescribed. Create written procedures for detection and documentation of various occurrences of unauthorized consumption as they are
uncovered.
to qualify for 10:Refine written procedures and assign staff to seek out likely
occurrences of unauthorized consumption. Explore new locking devices, monitors and other technologies designed to
detect and thwart unauthorized consumption.
APPARENT LOSSES
to qualify for 5:Use accepted default of 0.25% of system input volume
to qualify for 4:Review utility policy regarding what water uses are
considered unauthorized, and consider tracking a small sample of one such occurrence (ex: unauthorized fire
hydrant openings)

AWWA Free Water Audit Software v5.0 Grading Matrix 7
Grading >>> n/a 1 2 3 4 5 6 7 8 9 10
The grading assigned to each audit component and the corresponding recommended improvements and actions are highlighted in yellow. Audit accuracy is likely to be improved by prioritizing those items shown in red
Improvements to attain higher data grading for "Customer meter inaccuracy volume"
component:
If n/a is selected because the customer meter
population is unmetered, consider establishing a new policy to meter the
customer population and employ water rates based upon metered volumes.
to qualify for 2:Gather available meter purchase
records. Conduct testing on a small number of meters believed to be the
most inaccurate. Review staffing needs of the metering group and
budget for necessary resources to better organize meter management.
to qualify for 9:Continue efforts to manage meter
population with reliable recordkeeping. Test a statistically significant number of meters each year and analyze test results in an ongoing manner to serve
as a basis for a target meter replacement strategy based upon accumulated volume throughput.
to qualify for 10:Continue efforts to
manage meter population with reliable recordkeeping, meter
testing and replacement. Evaluate new meter types and install one or more
types in 5-10 customer accounts each year in order to pilot improving metering technology.
to maintain 10:Increase the number of meters tested
and replaced as justified by meter accuracy test data. Continually monitor
development of new metering technology and Advanced Metering
Infrastructure (AMI) to grasp opportunities for greater accuracy in
metering of water flow and management of customer consumption
data.
Systematic Data Handling Errors:
Note: all water utilities incur some amount of this
error. Even in water utilities with unmetered
customer populations and fixed rate billing, errors occur in annual billing tabulations. Enter a
positive value for the volume and select a
grading.
Policies and procedures for activation of new customer water
billing accounts are vague and lack accountability. Billing data is
maintained on paper records which are not well organized. No auditing is conducted to confirm billing data handling efficiency. An unknown
number of customers escape routine billing due to lack of billing
process oversight.
Policy and procedures for activation of new customer accounts and
oversight of billing records exist but need refinement. Billing data is maintained on paper records or insufficiently capable electronic
database. Only periodic unstructured auditing work is
conducted to confirm billing data handling efficiency. The volume of
unbilled water due to billing lapses is a guess.
Conditions between 2 and 4
Policy and procedures for new account activation and oversight of billing operations exist but needs refinement. Computerized billing
system exists, but is dated or lacks needed functionality. Periodic,
limited internal audits conducted and confirm with approximate accuracy
the consumption volumes lost to billing lapses.
Conditions between 4 and 6
Policy and procedures for new account activation and oversight of billing
operations is adequate and reviewed periodically. Computerized billing
system is in use with basic reporting available. Any effect of billing
adjustments on measured consumption volumes is well
understood. Internal checks of billing data error conducted annually.
Reasonably accurate quantification of consumption volume lost to billing
lapses is obtained.
Conditions between 6 and 8
New account activation and billing operations policy and procedures are
reviewed at least biannually. Computerized billing system includes an array of reports to confirm billing
data and system functionality. Checks are conducted routinely to flag and explain zero consumption accounts.
Annual internal checks conducted with third party audit conducted at least
once every five years. Accountability checks flag billing lapses.
Consumption lost to billing lapses is well quantified and reducing year-by-
year.
Conditions between 8 and 10
Sound written policy and procedures exist for new account activation and
oversight of customer billing operations. Robust computerized billing system gives high functionality and reporting
capabilities which are utilized, analyzed and the results reported each billing
cycle. Assessment of policy and data handling errors are conducted internally and audited by third party at least once
every three years, ensuring consumption lost to billing lapses is
minimized and detected as it occurs.
Improvements to attain higher data grading for "Systematic Data Handling Error volume"
component:
to qualify for 2:Draft written policy and procedures
for activating new water billing accounts and oversight of billing
operations. Investigate and budget for computerized customer billing system. Conduct initial audit of
billing records by flow-charting the basic business processes of the customer account/billing function.
to maintain 10:Stay abreast of customer information
management developments and innovations. Monitor developments of
Advanced Metering Infrastructure (AMI) and integrate technology to ensure that customer endpoint information is well-monitored and errors/lapses are at an
economic minimum.
to qualify for 10:Close policy/procedure loopholes that allow some customer
accounts to go unbilled, or data handling errors to exist. Ensure that billing system reports are utilized, analyzed and reported every billing cycle. Ensure that internal and third
party audits are conducted at least once every three years.
to qualify for 4:Finalize written policy and procedures for activation of new billing acocunts and overall billing operations management.
Implement a computerized customer billing system. Conduct initial audit of billing records as part of this
process.
to qualify for 6:Refine new account activation and billing operations
procedures and ensure consistency with the utility policy regarding billing, and minimize opportunity for missed
billings. Upgrade or replace customer billing system for needed functionality - ensure that billing adjustments don't corrupt the value of consumption volumes. Procedurize
internal annual audit process.
to qualify for 8:Formalize regular review of new account activation process and general billing practices. Enhance reporting capability of
computerized billing system. Formalize regular auditing process to reveal scope of data handling error. Plan for periodic third party audit to occur at least once every five
years.
to qualify for 4:Implement a reliable record keeping system for customer
meter histories, preferably using electronic methods typically linked to, or part of, the Customer Billing System
or Customer Information System. Expand meter accuracy testing to a larger group of meters.
to qualify for 6:Standardize the procedures for meter recordkeeping within
an electronic information system. Accelerate meter accuracy testing and meter replacements guided by testing
results.
to qualify for 8:Expand annual meter accuracy testing to evaluate a
statistically significant number of meter makes/models. Expand meter replacement program to replace statistically significant number of poor performing meters each year.

AWWA Free Water Audit Software v5.0 Grading Matrix 8
Grading >>> n/a 1 2 3 4 5 6 7 8 9 10
The grading assigned to each audit component and the corresponding recommended improvements and actions are highlighted in yellow. Audit accuracy is likely to be improved by prioritizing those items shown in red
Length of mains:
Poorly assembled and maintained paper as-built records of existing water main installations makes
accurate determination of system pipe length impossible. Length of
mains is guesstimated.
Paper records in poor or uncertain condition (no annual tracking of
installations & abandonments). Poor procedures to ensure that new water
mains installed by developers are accurately documented.
Conditions between 2 and 4
Sound written policy and procedures exist for documenting new water
main installations, but gaps in management result in a uncertain
degree of error in tabulation of mains length.
Conditions between 4 and 6
Sound written policy and procedures exist for permitting and commissioning
new water mains. Highly accurate paper records with regular field
validation; or electronic records and asset management system in good condition. Includes system backup.
Conditions between 6 and 8
Sound written policy and procedures exist for permitting and commissioning
new water mains. Electronic recordkeeping such as a Geographical
Information System (GIS) and asset management system are used to store
and manage data.
Conditions between 8 and 10
Sound written policy exists for managing water mains extensions and replacements. Geographic Information
System (GIS) data and asset management database agree and
random field validation proves truth of databases. Records of annual field
validation should be available for review.
Improvements to attain higher data grading for "Length of Water Mains" component:
to qualify for 2:Assign personnel to inventory current as-built records and
compare with customer billing system records and highway plans
in order to verify poorly documented pipelines. Assemble policy
documents regarding permitting and documentation of water main installations by the utility and
building developers; identify gaps in procedures that result in poor
documentation of new water main installations.
to maintain 10:Continue with standardization and
random field validation to improve the completeness and accuracy of the
system.
Number of active AND inactive service connections:
Vague permitting (of new service connections) policy and poor paper
recordkeeping of customer connections/billings result in suspect
determination of the number of service connections, which may be 10-15% in error from actual count.
General permitting policy exists but paper records, procedural gaps, and weak oversight result in questionable
total for number of connections, which may vary 5-10% of actual
count.
Conditions between 2 and 4
Written account activation policy and procedures exist, but with some gaps
in performance and oversight. Computerized information
management system is being brought online to replace dated paper
recordkeeping system. Reasonably accurate tracking of service connection installations &
abandonments; but count can be up to 5% in error from actual total.
Conditions between 4 and 6
Written new account activation and overall billing policies and procedures
are adequate and reviewed periodically. Computerized information
management system is in use with annual installations & abandonments totaled. Very limited field verifications and audits. Error in count of number of service connections is believed to be
no more than 3%.
Conditions between 6 and 8
Policies and procedures for new account activation and overall billing
operations are written, well-structured and reviewed at least biannually. Well-
managed computerized information management system exists and routine, periodic field checks and
internal system audits are conducted. Counts of connections are no more
than 2% in error.
Conditions between 8 and 10
Sound written policy and well managed and audited procedures ensure reliable
management of service connection population. Computerized information management system, Customer Billing System, and Geographic Information System (GIS) information agree; field validation proves truth of databases.
Count of connections recorded as being in error is less than 1% of the entire
population.
Improvements to attain higher data grading for "Number of Active and Inactive Service Connections" component:
Note: The number of Service Connections does not include fire hydrant leads/lines
connecting the hydrant to the water main
to qualify for 2:Draft new policy and procedures for new account activation and overall billing operations. Research and
collect paper records of installations & abandonments for several years
prior to audit year.
to maintain 10:Continue with standardization and random field validation to improve
knowledge of system.
Gradings 1-9 apply if customer properties are unmetered, if customer meters exist and are located inside the customer building premises, or if the water utility owns and is responsible for the entire service connection piping from the water main to the customer building. In any of these cases the average distance between the curb stop or boundary separating utility/customer responsibility for service connection piping, and the typical first point of use (ex: faucet) or the customer meter must be quantified. Gradings of 1-9 are used to grade the validity of the means to
quantify this value. (See the "Service Connection Diagram" worksheet)
to qualify for 8:Formalize regular review of new account activation and
overall billing operations policies and procedures. Launch random field checks of limited number of locations. Develop
reports and auditing mechanisms for computerized information management system.
to qualify for 8:Launch random field checks of limited number of locations.
Convert to electronic database such as a Geographic Information System (GIS) with backup as justified. Develop
written policy and procedures.
to qualify for 10:Link Geographic Information System (GIS) and asset
management databases, conduct field verification of data. Record field verification information at least annually.
to qualify for 6:Finalize updates/improvements to written policy and procedures for permitting/commissioning new main
installations. Confirm inventory of records for five years prior to audit year; correct any errors or omissions.
to qualify for 10:Close any procedural loopholes that allow installations to go undocumented. Link computerized information management
system with Geographic Information System (GIS) and formalize field inspection and information system auditing processes. Documentation of new or decommissioned
service connections encounters several levels of checks and balances.
to qualify for 4:Refine policy and procedures for new account activation and overall billing operations. Research computerized
recordkeeping system (Customer Information System or Customer Billing System) to improve documentation
format for service connections.
to qualify for 6:Refine procedures to ensure consistency with new account activation and overall billing policy to establish new service
connections or decommission existing connections. Improve process to include all totals for at least five years prior to
audit year.
to qualify for 4:Complete inventory of paper records of water main
installations for several years prior to audit year. Review policy and procedures for commissioning and documenting
new water main installation.
SYSTEM DATA
Either of two conditions can be met for a grading of 10:
Note: if customer water meters are located

AWWA Free Water Audit Software v5.0 Grading Matrix 9
Grading >>> n/a 1 2 3 4 5 6 7 8 9 10
The grading assigned to each audit component and the corresponding recommended improvements and actions are highlighted in yellow. Audit accuracy is likely to be improved by prioritizing those items shown in red
Vague policy exists to define the delineation of water utility ownership
and customer ownership of the service connection piping. Curb
stops are perceived as the breakpoint but these have not been
well-maintained or documented. Most are buried or obscured. Their location varies widely from site-to-site, and estimating this distance is
arbitrary due to the unknown location of many curb stops.
Policy requires that the curb stop serves as the delineation point
between water utility ownership and customer ownership of the service connection piping. The piping from
the water main to the curb stop is the property of the water utility; and the
piping from the curb stop to the customer building is owned by the customer. Curb stop locations are
not well documented and the average distance is based upon a
limited number of locations measured in the field.
Conditions between 2 and 4
Good policy requires that the curb stop serves as the delineation point between water utility ownership and customer ownership of the service connection piping. Curb stops are generally installed as needed and
are reasonably documented. Their location varies widely from site-to-
site, and an estimate of this distance is hindered by the availability of
paper records of limited accuracy.
Conditions between 4 and 6
Clear written policy exists to define utility/customer responsibility for
service connection piping. Accurate, well-maintained paper or basic
electronic recordkeeping system exists. Periodic field checks confirm
piping lengths for a sample of customer properties.
Conditions between 6 and 8
Clearly worded policy standardizes the location of curb stops and meters,
which are inspected upon installation. Accurate and well maintained
electronic records exist with periodic field checks to confirm locations of
service lines, curb stops and customer meter pits. An accurate number of
customer properties from the customer billing system allows for reliable averaging of this length.
Conditions between 8 and 10
Improvements to attain higher data grading for "Average
Length of Customer Service Line" component:
to qualify for 2:Research and collect paper records of service line installations. Inspect several sites in the field using pipe
locators to locate curb stops. Obtain the length of this small sample of
connections in this manner.
to maintain 10:Continue with standardization and random field validation to improve knowledge of service connection
configurations and customer meter locations.
Average operating pressure:
Available records are poorly assembled and maintained paper
records of supply pump characteristics and water distribution
system operating conditions. Average pressure is guesstimated based upon this information and
ground elevations from crude topographical maps. Widely varying distribution system pressures due to undulating terrain, high system head
loss and weak/erratic pressure controls further compromise the validity of the average pressure
calculation.
Limited telemetry monitoring of scattered pumping station and water
storage tank sites provides some static pressure data, which is
recorded in handwritten logbooks. Pressure data is gathered at individual sites only when low
pressure complaints arise. Average pressure is determined by averaging relatively crude data, and is affected
by significant variation in ground elevations, system head loss and gaps in pressure controls in the
distribution system.
Conditions between 2 and 4
Effective pressure controls separate different pressure zones; moderate
pressure variation across the system, occasional open boundary valves are
discovered that breech pressure zones. Basic telemetry monitoring of the distribution system logs pressure data electronically. Pressure data
gathered by gauges or dataloggers at fire hydrants or buildings when low
pressure complaints arise, and during fire flow tests and system
flushing. Reliable topographical data exists. Average pressure is
calculated using this mix of data.
Conditions between 4 and 6
Reliable pressure controls separate distinct pressure zones; only very
occasional open boundary valves are encountered that breech pressure
zones. Well-covered telemetry monitoring of the distribution system (not just pumping at source treatment
plants or wells) logs extensive pressure data electronically. Pressure gathered by gauges/dataloggers at fire
hydrants and buildings when low pressure complaints arise, and during
fire flow tests and system flushing. Average pressure is determined by
using this mix of reliable data.
Conditions between 6 and 8
Well-managed, discrete pressure zones exist with generally predictable pressure fluctuations. A current full-
scale SCADA System or similar realtime monitoring system exists to monitor the water distribution system and collect data, including real time pressure readings at representative
sites across the system. The average system pressure is determined from
reliable monitoring system data.
Conditions between 8 and 10
Well-managed pressure districts/zones, SCADA System and hydraulic model
exist to give very precise pressure data across the water distribution system. Average system pressure is reliably
calculated from extensive, reliable, and cross-checked data. Calculations are
reported on an annual basis as a minimum.
Improvements to attain higher data grading for "Average
Operating Pressure" component:
to qualify for 2:Employ pressure gauging and/or datalogging equipment to obtain
pressure measurements from fire hydrants. Locate accurate
topographical maps of service area in order to confirm ground
elevations. Research pump data sheets to find pump pressure/flow
characteristics
to maintain 10: Continue to refine the hydraulic model of the distribution system and consider linking it with SCADA System for real-
time pressure data calibration, and averaging.
a) Customer water meters exist outside of customer buildings next to the curb
stop or boundary separating utility/customer responsibility for service connection piping. If so, answer "Yes"
to the question on the Reporting Working asking about this condition. A value of zero and a Grading of 10 are automatically entered in the Reporting
Worksheet .b). Meters exist inside customer
buildings, or properties are unmetered. In either case, answer "No" to the
Reporting Worksheet question on meter location, and enter a distance
determined by the auditor. For a Grading of 10 this value must be a very
reliable number from a Geographic Information System (GIS) and
confirmed by a statistically valid number of field checks.
Average length of customer service line:
to qualify for 10: Annually, obtain a system-wide average pressure value from the hydraulic model of the distribution system that has been calibrated via field measurements in the water distribution
system and confirmed in comparisons with SCADA System data.
to qualify for 4:Formalize and communicate policy delineating
utility/customer responsibilities for service connection piping. Assess accuracy of paper records by field
inspection of a small sample of service connections using pipe locators as needed. Research the potential migration
to a computerized information management system to store service connection data.
to qualify for 10:Link customer information management system and
Geographic Information System (GIS), standardize process for field verification of data.
to qualify for 6:Establish coherent procedures to ensure that policy for curb stop, meter installation and documentation is followed. Gain consensus within the water utility for the establishment of a
computerized information management system.
to qualify for 8:Implement an electronic means of recordkeeping, typically
via a customer information system, customer billing system, or Geographic Information System (GIS). Standardize the
process to conduct field checks of a limited number of locations.
meters are located
outside of the customer building next to the curb
stop or boundary separating utility/customer
responsibility, then the auditor should answer
"Yes" to the question on the Reporting Worksheet asking about this. If the
answer is Yes, the grading description listed under the Grading of 10(a) will be followed, with a value
of zero automatically entered at a Grading of
10. See the Service Connection Diagram
worksheet for a visual presentation of this
distance.
to qualify for 4: Formalize a procedure to use pressure
gauging/datalogging equipment to gather pressure data during various system events such as low pressure
complaints, or operational testing. Gather pump pressure and flow data at different flow regimes. Identify faulty pressure controls (pressure reducing valves, altitude valves, partially open boundary valves) and plan to
properly configure pressure zones. Make all pressure data from these efforts available to generate system-wide
average pressure.
to qualify for 6: Expand the use of pressure gauging/datalogging equipment to gather scattered pressure data at a representative set of sites, based upon pressure zones or areas. Utilize pump pressure and flow data to determine supply head entering each pressure zone or district. Correct any faulty pressure controls (pressure reducing valves, altitude valves, partially
open boundary valves) to ensure properly configured pressure zones. Use expanded pressure dataset from these
activities to generate system-wide average pressure.
to qualify for 8: Install a Supervisory Control and Data Acquisition (SCADA)
System, or similar realtime monitoring system, to monitor system parameters and control operations. Set regular calibration schedule for instrumentation to insure data
accuracy. Obtain accurate topographical data and utilize pressure data gathered from field surveys to provide
extensive, reliable data for pressure averaging.
AWWA Free Water Audit Software v5.0 Grading Matrix 10
Grading >>> n/a 1 2 3 4 5 6 7 8 9 10
The grading assigned to each audit component and the corresponding recommended improvements and actions are highlighted in yellow. Audit accuracy is likely to be improved by prioritizing those items shown in red
Total annual cost of operating water system:
Incomplete paper records and lack of financial accounting
documentation on many operating functions makes calculation of water
system operating costs a pure guesstimate
Reasonably maintained, but incomplete, paper or electronic
accounting provides data to estimate the major portion of water system
operating costs.
Conditions between 2 and 4
Electronic, industry-standard cost accounting system in place.
However, gaps in data are known to exist, periodic internal reviews are
conducted but not a structured financial audit.
Conditions between 4 and 6
Reliable electronic, industry-standard cost accounting system in place, with all pertinent water system operating
costs tracked. Data audited periodically by utility personnel, but not a Certified Public Accountant (CPA).
Conditions between 6 and 8
Reliable electronic, industry-standard cost accounting system in place, with all pertinent water system operating costs tracked. Data audited at least annually by utility personnel, and at
least once every three years by third-party CPA.
Conditions between 8 and 10
Reliable electronic, industry-standard cost accounting system in place, with all pertinent water system operating costs tracked. Data audited annually by utility
personnel and annually also by third-party CPA.
Improvements to attain higher data grading for "Total Annual Cost of Operating the Water
System" component:
to qualify for 2:Gather available records, institute
new financial accounting procedures to regularly collect and audit basic
cost data of most important operations functions.
to maintain 10:Maintain program, stay abreast of expenses subject to erratic cost
changes and long-term cost trend, and budget/track costs proactively
Customer retail unit cost (applied to Apparent Losses):
Customer population unmetered, and/or only a fixed fee is charged for
consumption.
Antiquated, cumbersome water rate structure is used, with periodic historic amendments that were
poorly documented and implemented; resulting in classes of customers being billed inconsistent
charges. The actual composite billing rate likely differs significantly
from the published water rate structure, but a lack of auditing
leaves the degree of error indeterminate.
Dated, cumbersome water rate structure, not always employed
consistently in actual billing operations. The actual composite
billing rate is known to differ from the published water rate structure, and a reasonably accurate estimate of the
degree of error is determined, allowing a composite billing rate to
be quantified.
Conditions between 2 and 4
Straight-forward water rate structure in use, but not updated in several years. Billing operations reliably employ the rate structure. The
composite billing rate is derived from a single customer class such as residential customer accounts,
neglecting the effect of different rates from varying customer classes.
Conditions between4 and 6
Clearly written, up-to-date water rate structure is in force and is applied
reliably in billing operations. Composite customer rate is
determined using a weighted average residential rate using volumes of water
in each rate block.
Conditions between 6 and 8
Effective water rate structure is in force and is applied reliably in billing
operations. Composite customer rate is determined using a weighted
average composite consumption rate, which includes residential,
commercial, industrial, institutional (CII), and any other distinct customer
classes within the water rate structure.
Conditions between 8 and 10
Current, effective water rate structure is in force and applied reliably in billing operations. The rate structure and
calculations of composite rate - which includes residential, commercial,
industrial, institutional (CII), and other distinct customer classes - are reviewed
by a third party knowledgeable in the M36 methodology at least once every
five years.
Improvements to attain higher data grading for "Customer
Retail Unit Cost" component:
to qualify for 2:Formalize the process to implement
water rates, including a secure documentation procedure. Create a current, formal water rate document
and gain approval from all stakeholders.
to qualify for 6:Evaluate volume of water used in each usage block by residential
users. Multiply volumes by full rate structure.
Launch effort to fully meter the customer
population and charge rates based upon
water volumes
to maintain 10:Keep water rate structure current in
addressing the water utility's revenue needs. Update the calculation of the
customer unit rate as new rate components, customer classes, or other
components are modified.
Variable production cost (applied to Real Losses):
Note: if the water utility purchases/imports its
entire water supply, then enter the unit purchase cost of the bulk water
supply in the Reporting Worksheet with a grading
of 10
Incomplete paper records and lack of documentation on primary
operating functions (electric power and treatment costs most
importantly) makes calculation of variable production costs a pure
guesstimate
Reasonably maintained, but incomplete, paper or electronic
accounting provides data to roughly estimate the basic operations costs (pumping power costs and treatment costs) and calculate a unit variable
production cost.
Conditions between 2 and 4
Electronic, industry-standard cost accounting system in place. Electric
power and treatment costs are reliably tracked and allow accurate weighted calculation of unit variable production costs based on these two inputs and water imported purchase
costs (if applicable). All costs are audited internally on a periodic basis.
Conditions between 4 and 6
Reliable electronic, industry-standard cost accounting system in place, with all pertinent water system operating costs tracked. Pertinent additional costs beyond power, treatment and water imported purchase costs (if
applicable) such as liability, residuals management, wear and tear on
equipment, impending expansion of supply, are included in the unit variable
production cost, as applicable. The data is audited at least annually by
utility personnel.
Conditions between 6 and 8
Reliable electronic, industry-standard cost accounting system in place, with all pertinent primary and secondary
variable production and water imported purchase (if applicable)
costs tracked. The data is audited at least annually by utility personnel, and at least once every three years by a third-party knowledgeable in the M36
methodology.
Conditions between 8 and 10
Either of two conditions can be met to obtain a grading of 10:
1) Third party CPA audit of all pertinent primary and secondary variable production and water imported
purchase (if applicable) costs on an annual basis.
or:2) Water supply is entirely purchased as
bulk water imported, and the unit purchase cost - including all applicable marginal supply costs - serves as the
variable production cost. If all applicable marginal supply costs are not
included in this figure, a grade of 10 should not be selected.
Improvements to attain higher data grading for "Variable
Production Cost" component:
to qualify for 2:Gather available records, institute new procedures to regularly collect and audit basic cost data and most
important operations functions.
to maintain 10:Maintain program, stay abreast of expenses subject to erratic cost changes and budget/track costs
proactively
to qualify for 6:Formalize process for regular internal audits of production costs. Assess whether additional costs (liability, residuals management, equipment wear, impending infrastructure
expansion) should be included to calculate a more representative variable production cost.
to qualify for 8:Formalize the accounting process to include direct cost components (power, treatment) as well as indirect cost
components (liability, residuals management, etc.) Arrange to conduct audits by a knowledgable third-party at least once
every three years.
to qualify for 10:Standardize the process to conduct a third-party financial audit
by a CPA on an annual basis.
to qualify for 4:Implement an electronic cost accounting system,
structured according to accounting standards for water utilities
to qualify for 4:Review the water rate structure and update/formalize as needed. Assess billing operations to ensure that actual billing operations incorporate the established water rate
structure.
to qualify for 8:Evaluate volume of water used in each usage block by all
classifications of users. Multiply volumes by full rate structure.
to qualify for 10:Conduct a periodic third-party audit of water used in each
usage block by all classifications of users. Multiply volumes by full rate structure.
to qualify for 4:Implement an electronic cost accounting system,
structured according to accounting standards for water utilities
to qualify for 10:Standardize the process to conduct a third-party financial audit
by a CPA on an annual basis.
COST DATA
to qualify for 6:Establish process for periodic internal audit of water system
operating costs; identify cost data gaps and institute procedures for tracking these outstanding costs.
to qualify for 8:Standardize the process to conduct routine financial audit on an annual basis. Arrange for CPA audit of financial records
at least once every three years.

Item Name
Apparent Losses
AUTHORIZED CONSUMPTION
Average length of customer service line
Average operating pressure
Billed Authorized Consumption
Billed metered consumption
Billed unmetered consumption
All consumption that is billed and authorized by the utility. This may include both metered and unmetered consumption. See "Authorized Consumption" for more information.
All metered consumption which is billed to retail customers, including all groups of customers such as domestic, commercial, industrial or institutional. It does NOT include water supplied to neighboring utilities (water exported) which is metered and billed. Be sure to subtract any consumption for exported water sales that may be included in these billing roles. Water supplied as exports to neighboring water utilities should be included only in the Water Exported component. The metered consumption data can be taken directly from billing records for the water audit period. The accuracy of yearly metered consumption data can be refined by including an adjustment to account for customer meter reading lag time since not all customer meters are read on the same day of the meter reading period. However additional analysis is necessary to determine the lag time adjustment value, which may or may not be significant.
All billed consumption which is calculated based on estimates or norms from water usage sites that have been determined by utility policy to be left unmetered. This is typically a very small component in systems that maintain a policy to meter their customer population. However, this quantity can be the key consumption component in utilities that have not adopted a universal metering policy. This component should NOT include any water that is supplied to neighboring utilities (water exported) which is unmetered but billed. Water supplied as exports to neighboring water utilities should be included only in the Water Exported component.
AWWA Free Water Audit Software: Definitions
Description
= billed water exported + billed metered + billed unmetered + unbilled metered + unbilled unmetered consumption
The volume of metered and/or unmetered water taken by registered customers, the water utility's own uses, and uses of others who are implicitly or explicitly authorized to do so by the water utility; for residential, commercial, industrial and public-minded purposes.
Typical retail customers' consumption is tabulated usually from established customer accounts as billed metered consumption, or - for unmetered customers - billed unmetered consumption. These types of consumption, along with billed water exported, provide revenue potential for the water utility. Be certain to tabulate the water exported volume as a separate component and do not "double-count" it by including in the billed metered consumption component as well as the water exported component. Unbilled authorized consumption occurs typically in non-account uses, including water for fire fighting and training, flushing of water mains and sewers, street cleaning, watering of municipal gardens, public fountains, or similar public-minded uses. Occasionally these uses may be metered and billed (or charged a flat fee), but usually they are unmetered and unbilled. In the latter case, the water auditor may use a default value to estimate this quantity, or implement procedures for the reliable quantification of these uses. This starts with documenting usage events as they occur and estimating the amount of water used in each event. (See Unbilled unmetered consumption)
This is the average length of customer service line, Lp, that is owned and maintained by the customer; from the point of ownership transfer to the customer water meter, or building line (if unmetered). The quantity is one of the data inputs for the calculation of Unavoidable Annual Real Losses (UARL), which serves as the denominator of the performance indicator: Infrastructure Leakage Index (ILI). The value of Lp is multiplied by the number of customer service connections to obtain a total length of customer owned piping in the system. The purpose of this parameter is to account for the unmetered service line infrastructure that is the responsibility of the customer for arranging repairs of leaks that occur on their lines. In many cases leak repairs arranged by customers take longer to be executed than leak repairs arranged by the water utility on utility-maintained piping. Leaks run longer - and lose more water - on customer-owned service piping, than utility owned piping.
If the customer water meter exists near the ownership transfer point (usually the curb stop located between the water main and the customer premises) this distance is zero because the meter and transfer point are the same. This is the often encountered configuration of customer water meters located in an underground meter box or "pit" outside of the customer's building. The Free Water Audit Software asks a "Yes/No" question about the meter at this location. If the auditor selects "Yes" then this distance is set to zero and the data grading score for this component is set to 10.
If water meters are typically located inside the customer premise/building, or properties are unmetered, it is up to the water auditor to estimate a system-wide average Lp length based upon the various customer land parcel sizes and building locations in the service area. Lp will be a shorter length in areas of high density housing, and a longer length in areas of low density housing and varied commercial and industrial buildings. General parcel demographics should be employed to obtain a composite average Lp length for the entire system.
Refer to the "Service Connection Diagram" worksheet for a depiction of the service line/metering configurations that typically exist in water utilities. This worksheet gives guidance on the determination of the Average Length, Lp, for each configuration.
This is the average pressure in the distribution system that is the subject of the water audit. Many water utilities have a calibrated hydraulic model of their water distribution system. For these utilities, the hydraulic model can be utilized to obtain a very accurate quantity of average pressure. In the absence of a hydraulic model, the average pressure may be approximated by obtaining readings of static water pressure from a representative sample of fire hydrants or other system access points evenly located across the system. A weighted average of the pressure can be assembled; but be sure to take into account the elevation of the fire hydrants, which typically exist several feet higher than the level of buried water pipelines. If the water utility is compiling the water audit for the first time, the average pressure can be approximated, but with a low data grading. In subsequent years of auditing, effort should be made to improve the accuracy of the average pressure quantity. This will then qualify the value for a higher data grading.
= unauthorized consumption + customer metering inaccuracies + systematic data handling errors
Apparent Losses include all types of inaccuracies associated with customer metering (worn meters as well as improperly sized meters or wrong type of meter for the water usage profile) as well as systematic data handling errors (meter reading, billing, archiving and reporting), plus unauthorized consumption (theft or illegal use).NOTE: Over-estimation of Apparent Losses results in under-estimation of Real Losses. Under-estimation of Apparent Losses results in over-estimation of Real Losses.
A
WAS v5.0American Water Works Association.
Copyright © 2014, All Rights Reserved.
Find
Find
Find
Find
ViewService
Connection Diagram
Find
Find
AWWA Free Water Audit Software v5.0 Definitions 1

Item Name Description
Customer metering
inaccuracies
Customer retail unit cost
Infrastructure Leakage Index
(ILI)
Length of mains
NON-REVENUE WATER
Number of active AND inactive
service connections
Real Losses
Revenue Water
Service Connection
Density
Physical water losses from the pressurized system (water mains and customer service connections) and the utility’s storage tanks, up to the point of customer consumption. In metered systems this is the customer meter, in unmetered situations this is the first point of consumption (stop tap/tap) within the property. The annual volume lost through all types of leaks, breaks and overflows depends on frequencies, flow rates, and average duration of individual leaks, breaks and overflows.
= Apparent Losses + Real Losses + Unbilled Metered Consumption + Unbilled Unmetered Consumption. This is water which does not provide revenue potential to the utility.
=number of customer service connections / length of mains
Length of all pipelines (except service connections) in the system starting from the point of system input metering (for example at the outlet of the treatment plant). It is also recommended to include in this measure the total length of fire hydrant lead pipe. Hydrant lead pipe is the pipe branching from the water main to the fire hydrant. Fire hydrant leads are typically of a sufficiently large size that is more representative of a pipeline than a service connection. The average length of hydrant leads across the entire system can be assumed if not known, and multiplied by the number of fire hydrants in the system, which can also be assumed if not known. This value can then be added to the total pipeline length. Total length of mains can therefore be calculated as:
Length of Mains, miles = (total pipeline length, miles) + [ {(average fire hydrant lead length, ft) x (number of fire hydrants)} / 5,280 ft/mile ] orLength of Mains, kilometres = (total pipeline length, kilometres) + [ {(average fire hydrant lead length, metres) x (number of fire hydrants)} / 1,000 metres/kilometre ]
Those components of System Input Volume that are billed and have the potential to produce revenue.
Number of customer service connections, extending from the water main to supply water to a customer. Please note that this includes the actual number of distinct piping connections, including fire connections, whether active or inactive. This may differ substantially from the number of customers (or number of accounts). Note: this number does not include the pipeline leads to fire hydrants - the total length of piping supplying fire hyrants should be included in the "Length of mains" parameter.
Apparent water losses caused by the collective under-registration of customer water meters. Many customer water meters gradually wear as large cumulative volumes of water are passed through them over time. This causes the meters to under-register the flow of water. This occurrence is common with smaller residential meters of sizes 5/8-inch and 3/4 inch after they have registered very large cumulative volumes of water, which generally occurs only after periods of years. For meters sized 1-inch and larger - typical of multi-unit residential, commercial and industrial accounts - meter under-registration can occur from wear or from the improper application of the meter; i.e. installing the wrong type of meter or the wrong size of meter, for the flow pattern (profile) of the consumer. For instance, many larger meters have reduced accuracy at low flows. If an oversized meter is installed, most of the time the routine flow will occur in the low flow range of the meter, and a significant portion of it may not be registered. It is important to properly select and install all meters, but particularly large customer meters, size 1-inch and larger.
The auditor has two options for entering data for this component of the audit. The auditor can enter a percentage under-registration (typically an estimated value), this will apply the selected percentage to the two categories of metered consumption to determine the volume of water not recorded due to customer meter inaccuracy. Note that this percentage is a composite average inaccuracy for all customer meters in the entire meter population. The percentage will be multiplied by the sum of the volumes in the Billed Metered and Unbilled Metered components. Alternatively, if the auditor has substantial data from meter testing activities, he or she can calculate their own loss volumes, and this volume may be entered directly.
Note that a value of zero will be accepted but an alert will appear asking if the customer population is unmetered. Since all metered systems have some degree of inaccuracy, a positive value should be entered. A value of zero in this component is valid only if the water utility does not meter its customer population.
The Customer Retail Unit Cost represents the charge that customers pay for water service. This unit cost is applied routinely to the components of Apparent Loss, since these losses represent water reaching customers but not (fully) paid for. Since most water utilities have a rate structure that includes a variety of different costs based upon class of customer, a weighted average of individual costs and number of customer accounts in each class can be calculated to determine a single composite cost that should be entered into this cell. Finally, the weighted average cost should also include additional charges for sewer, storm water or biosolids processing, but only if these charges are based upon the volume of potable water consumed.
For water utilities in regions with limited water resources and a questionable ability to meet the drinking water demands in the future, the Customer Retail Unit Cost might also be applied to value the Real Losses; instead of applying the Variable Production Cost to Real Losses. In this way, it is assumed that every unit volume of leakage reduced by leakage management activities will be sold to a customer.
Note: the Free Water Audit Software allows the user to select the units that are charged to customers (either $/1,000 gallons, $/hundred cubic feet, or $/1,000 litres) and automatically converts these units to the units that appear in the "WATER SUPPLIED" box. The monetary units are United States dollars, $.
The ratio of the Current Annual Real Losses (Real Losses) to the Unavoidable Annual Real Losses (UARL). The ILI is a highly effective performance indicator for comparing (benchmarking) the performance of utilities in operational management of real losses.
Find
Find
Find
Find
Find
Find
Find
Find
AWWA Free Water Audit Software v5.0 Definitions 2

Item Name Description
Systematic data handling errors
Total annual cost of operating the
water system
Unauthorized consumption
Includes water illegally withdrawn from fire hydrants, illegal connections, bypasses to customer consumption meters, or tampering with metering or meter reading equipment; as well as any other ways to receive water while thwarting the water utility's ability to collect revenue for the water. Unauthorized consumption results in uncaptured revenue and creates an error that understates customer consumption. In most water utilities this volume is low and, if the water auditor has not yet gathered detailed data for these loss occurrences, it is recommended that the auditor apply a default value of 0.25% of the volume of water supplied. However, if the auditor has investigated unauthorized occurrences, and has well validated data that indicates the volume from unauthorized consumption is substantially higher or lower than that generated by the default value, then the auditor should enter a quantity that was derived from the utility investigations. Note that a value of zero will not be accepted since all water utilities have some volume of unauthorized consumption occurring in their system.
Note: if the auditor selects the default value for unauthorized consumption, a data grading of 5 is automatically assigned, but not displayed on the Reporting Worksheet.
These costs include those for operations, maintenance and any annually incurred costs for long-term upkeep of the drinking water supply and distribution system. It should include the costs of day-to-day upkeep and long-term financing such as repayment of capital bonds for infrastructure expansion or improvement. Typical costs include employee salaries and benefits, materials, equipment, insurance, fees, administrative costs and all other costs that exist to sustain the drinking water supply. Depending upon water utility accounting procedures or regulatory agency requirements, it may be appropriate to include depreciation in the total of this cost. This cost should not include any costs to operate wastewater, biosolids or other systems outside of drinking water.
Unavoidable Annual Real
Losses (UARL)
UARL (gallons)=(5.41Lm + 0.15Nc + 7.5Lc) xP, orUARL (litres)=(18.0Lm + 0.8Nc + 25.0Lc) xP
where:Lm = length of mains (miles or kilometres) Nc = number of customer service connectionsLp = the average distance of customer service connection piping (feet or metres) (see the Worksheet "Service Connection Diagram" for guidance on deterring the value of Lp) Lc = total length of customer service connection piping (miles or km) Lc = Nc X Lp (miles or kilometres)P = Pressure (psi or metres)
The UARL is a theoretical reference value representing the technical low limit of leakage that could be achieved if all of today's best technology could be successfully applied. It is a key variable in the calculation of the Infrastructure Leakage Index (ILI). Striving to reduce system leakage to a level close to the UARL is usually not needed unless the water supply is unusually expensive, scarce or both.
NOTE: The UARL calculation has not yet been proven as fully valid for very small, or low pressure water distribution systems. If, in gallons:(Lm x 32) + Nc < 3000 orP <35psiin litres:(Lm x 20) + Nc < 3000 orP < 25mthen the calculated UARL value may not be valid. The software does not display a value of UARL or ILI if either of these conditions is true.
Apparent losses caused by accounting omissions, errant computer programming, gaps in policy, procedure, and permitting/activation of new accounts; and any type of data lapse that results in under-stated customer water consumption in summary billing reports.
Systematic Data Handling Errors result in a direct loss of revenue potential. Water utilities can find "lost" revenue by keying on this component.
Utilities typically measure water consumption registered by water meters at customer premises. The meter should be read routinely (ex: monthly) and the data transferred to the Customer Billing System, which generates and sends a bill to the customer. Data Transfer Errors result in the consumption value being less than the actual consumption, creating an apparent loss. Such error might occur from illegible and mis-recorded hand-written readings compiled by meter readers, inputting an incorrect meter register unit conversion factor in the automatic meter reading equipment, or a variety of similar errors.
Apparent losses also occur from Data Analysis Errors in the archival and data reporting processes of the Customer Billing System. Inaccurate estimates used for accounts that fail to produce a meter reading are a common source of error. Billing adjustments may award customers a rightful monetary credit, but do so by creating a negative value of consumption, thus under-stating the actual consumption. Account activation lapses may allow new buildings to use water for months without meter readings and billing. Poor permitting and construction inspection practices can result in a new building lacking a billing account, a water meter and meter reading; i.e., the customer is unknown to the utility's billing system.
Close auditing of the permitting, metering, meter reading, billing and reporting processes of the water consumption data trail can uncover data management gaps that create volumes of systematic data handling error. Utilities should routinely analyze customer billing records to detect data anomalies and quantify these losses. For example, a billing account that registers zero consumption for two or more billing cycles should be checked to explain why usage has seemingly halted. Given the revenue loss impacts of these losses, water utilities are well-justified in providing continuous oversight and timely correction of data transfer errors & data handling errors.
If the water auditor has not yet gathered detailed data or assessment of systematic data handling error, it is recommended that the auditor apply the default value of 0.25% of the the Billed Authorized Consumption volume. However, if the auditor has investigated the billing system and its controls, and has well validated data that indicates the volume from systematic data handling error is substantially higher or lower than that generated by the default value, then the auditor should enter a quantity that was derived from the utility investigations and select an appropriate grading. Note: negative values are not allowed for this audit component. If the auditor enters zero for this component then a grading of 1 will be automatically assigned.
Find
Find
Find
Find
AWWA Free Water Audit Software v5.0 Definitions 3

Item Name Description
Unbilled Authorized
Consumption
Unbilled metered consumption
Unbilled unmetered
consumption
Convert From…
Million Gallons (US) = 3.06888329 Acre-feet
Use of Option Buttons
Variable production cost (applied to Real
Losses)
Volume from own sources
1
The cost to produce and supply the next unit of water (e.g., $/million gallons). This cost is determined by calculating the summed unit costs for ground and surface water treatment and all power used for pumping from the source to the customer. It may also include other miscellaneous unit costs that apply to the production of drinking water. It should also include the unit cost of bulk water purchased as an import if applicable.
It is common to apply this unit cost to the volume of Real Losses. However, if water resources are strained and the ability to meet future drinking water demands is in question, then the water auditor can be justified in applying the Customer Retail Rate to the Real Loss volume, rather than applying the Variable Production Cost.
The Free Water Audit Software applies the Variable Production costs to Real Losses by default. However, the auditor has the option on the Reporting Worksheet to select the Customer Retail Cost as the basis for the Real Loss cost evaluation if the auditor determines that this is warranted.
The volume of water withdrawn (abstracted) from water resources (rivers, lakes, streams, wells, etc) controlled by the water utility, and then treated for potable water distribution. Most water audits are compiled for utility retail water distribution systems, so this volume should reflect the amount of treated drinking water that entered the distribution system. Often the volume of water measured at the effluent of the treatment works is slightly less than the volume measured at the raw water source, since some of the water is used in the treatment process. Thus, it is useful if flows are metered at the effluent of the treatment works. If metering exists only at the raw water source, an adjustment for water used in the treatment process should be included to account for water consumed in treatment operations such as filter backwashing, basin flushing and cleaning, etc. If the audit is conducted for a wholesale water agency that sells untreated water, then this quantity reflects the measure of the raw water, typically metered at the source.
Any kind of Authorized Consumption which is neither billed or metered. This component typically includes water used in activities such as fire fighting, flushing of water mains and sewers, street cleaning, fire flow tests conducted by the water utility, etc. In most water utilities it is a small component which is very often substantially overestimated. It does NOT include water supplied to neighboring utilities (water exported) which is unmetered and unbilled – an unlikely case. This component has many sub-components of water use which are often tedious to identify and quantify. Because of this, and the fact that it is usually a small portion of the water supplied, it is recommended that the auditor apply the default value, which is 1.25% of the Water Supplied volume. Select the default percentage to enter this value.
If the water utility has carefully audited the unbilled, unmetered activities occurring in the system, and has well validated data that gives a value substantially higher or lower than the default volume, then the auditor should enter their own volume. However the default approach is recommended for most water utilities.
Note that a value of zero is not permitted, since all water utilities have some volume of water in this component occurring in their system.
The user may develop an audit based on one of three unit selections: 1) Million Gallons (US)2) Megalitres (Thousand Cubic Metres)3) Acre-feetOnce this selection has been made in the instructions sheet, all calculations are made on the basis of the chosen units. Should the user wish to make additional conversions, a unit converter is provided below (use drop down menus to select units from the yellow unit boxes):
Enter Units:
Units and Conversions
All consumption that is unbilled, but still authorized by the utility. This includes Unbilled Metered Consumption + Unbilled Unmetered Consumption. See "Authorized Consumption" for more information. For Unbilled Unmetered Consumption, the Free Water Audit Software provides the auditor the option to select a default value if they have not audited unmetered activities in detail. The default calculates a volume that is 1.25% of the Water Supplied volume. If the auditor has carefully audited the various unbilled, unmetered, authorized uses of water, and has established reliable estimates of this collective volume, then he or she may enter the volume directly for this component, and not use the default value.
(conversion factor = 3.06888328973723)
Metered consumption which is authorized by the water utility, but, for any reason, is deemed by utility policy to be unbilled. This might for example include metered water consumed by the utility itself in treatment or distribution operations, or metered water provided to civic institutions free of charge. It does not include water supplied to neighboring utilities (water exported) which may be metered but not billed.
Converts to…..
To use the default percent value choose this button To enter a value choose this button and enter the value in the cell to the right
NOTE: For Unbilled Unmetered Consumption, Unauthorized Consumption and Systematic Data Handling Errors, a recommended default value can be applied by selecting the Percent option. The default values are based on fixed percentages of Water Supplied or Billed Authorized Consumption and are recommended for use in this audit unless the auditor has well validated data for their system. Default values are shown by purple cells, as shown in the example above.
If a default value is selected, the user does not need to grade the item; a grading value of 5 is automatically applied (however, this grade will not be displayed).
Find
Find
Find
Find
AWWA Free Water Audit Software v5.0 Definitions 4
Item Name Description
Volume from own sources: Master meter and supply error adjustment
Water exported
Water exported: Master meter and
supply error adjustment
Water imported
Water imported: Master meter and
supply error adjustment
WATER LOSSES= apparent losses + real losses
Water Losses are the difference between Water Supplied and Authorized Consumption. Water losses can be considered as a total volume for the whole system, or for partial systems such as transmission systems, pressure zones or district metered areas (DMA); if one of these configurations are the basis of the water audit.
An estimate or measure of the volume in which the Water Imported volume is incorrect. This adjustment is a weighted average that represents the collective error for all of the metered and archived imported flow for all days of the audit year. Meter error can occur in different ways. A meter may be inaccurate by under-registering flow (did not capture all the flow), or by over-registering flow (overstated the actual flow). Error in the metered, archived data can also occur due to data gaps caused by temporary outages of the meter or related instrumentation. All water utilities encounter some level of meter inaccuracy, particularly if meters are aged and infrequently tested. Occasional errors also occur in the archived metered data. Thus, a value of zero should not be entered. Enter a negative percentage or value for metered data under-registration; or, enter a positive percentage or value for metered data over-registration. If regular meter accuracy testing is conducted on the meter(s) - which is usually conducted by the water utility selling the water - then the results of this testing can be used to help quantify the meter error adjustment.
An estimate or measure of the volume in which the Water Exported volume is incorrect. This adjustment is a weighted average that represents the collective error for all of the metered and archived exported flow for all days of the audit year. Meter error can occur in different ways. A meter may be inaccurate by under-registering flow (did not capture all the flow), or by over-registering flow (overstated the actual flow). Error in the metered, archived data can also occur due to data gaps caused by temporary outages of the meter or related instrumentation. All water utilities encounter some degree of error in their metered data, particularly if meters are aged and infrequently tested. Occasional errors also occur in the archived data. Thus, a value of zero should not be entered. Enter a negative percentage or value for metered data under-registration; or enter a positive percentage or value for metered data over-registration. If regular meter accuracy testing is conducted on the meter(s) - which is usually conducted by the water utility selling the water - then the results of this testing can be used to help quantify the meter error adjustment. Corrections to data gaps or other errors found in the archived data should also be included as a portion of this meter error adjustment.
The Water Imported volume is the bulk water purchased to become part of the Water Supplied volume. Typically this is water purchased from a neighboring water utility or regional water authority, and is metered at the custody transfer point of interconnection between the two water utilities. Usually the meter(s) are owned by the water supplier selling the water to the utility conducting the water audit. The water supplier selling the bulk water usually charges the receiving utility based upon a wholesale water rate.
An estimate or measure of the degree of inaccuracy that exists in the master (production) meters measuring the annual Volume from own Sources, and any error in the data trail that exists to collect, store and report the summary production data. This adjustment is a weighted average number that represents the collective error for all master meters for all days of the audit year and any errors identified in the data trail. Meter error can occur in different ways. A meter or meters may be inaccurate by under-registering flow (did not capture all the flow), or by over-registering flow (overstated the actual flow). Data error can occur due to data gaps caused by temporary outages of the meter or related instrumentation. All water utilities encounter some degree of inaccuracy in master meters and data errors in archival systems are common; thus a value of zero should not be entered. Enter a negative percentage or value for metered data under-registration; or, enter a positive percentage or value for metered data over-registration.
The Water Exported volume is the bulk water conveyed and sold by the water utility to neighboring water systems that exists outside of their service area. Typically this water is metered at the custody transfer point of interconnection between the two water utilities. Usually the meter(s) are owned by the water utility that is selling the water: i.e. the exporter. If the water utility who is compiling the annual water audit sells bulk water in this manner, they are an exporter of water.
Note: The Water Exported volume is sold to wholesale customers who are typically charged a wholesale rate that is different than retail rates charged to the retail customers existing within the service area. Many state regulatory agencies require that the Water Exported volume be reported to them as a quantity separate and distinct from the retail customer billed consumption. For these reasons - and others - the Water Exported volume is always quantified separately from Billed Authorized Consumption in the standard water audit. Be certain not to "double-count" this quantity by including it in both the Water Exported box and the Billed Metered Consumption box of the water audit Reporting Worksheet. This volume should be included only in the Water Exported box.
Find
Find
Find
Find
Find
Find
AWWA Free Water Audit Software v5.0 Definitions 5

AWWA Free Water Audit Software: Customer Service Line Diagrams
Average Length of Customer Service Line
The three figures shown on this worksheet display the assignment of the Average Length of Customer Service Line, Lp, for the three most common piping configurations.
Figure 1 shows the configuration of the water meter outside of the customer building next to the curb stop valve. In this configuration Lp = 0 since the distance between the curb stop and the customer metering point is essentially zero.
Figure 2 shows the configuration of the customer water meter located inside the customer building, where Lp is the distance from the curb stop to the water meter.
Figure 3 shows the configuration of an unmetered customer building , where Lp is the distance from the curb stop to the first point of customer water consumption, or, more simply, the building line.
In any water system the Lp will vary notably in a community of different structures, therefore the average Lp value is used and this should be approximated or calculated if a sample of service line measurements has been gathered.
Figure 1
Figure 2
Figure 3
American Water Works Association.Copyright © 2014, All Rights Reserved.
WAS v5.0
Click for more information
AWWA Free Water Audit Software v5.0 Service Connection Diagram 1

Water Audit Report for:
Reporting Year: 2015
Data Validity Score: 82
Functional Focus Area
Audit Data Collection
Short-term loss control
Long-term loss control
Target-setting
Benchmarking
Target ILI Range
1.0 - 3.0
>3.0 -5.0
>5.0 - 8.0
Greater than 8.0
Less than 1.0
AWWA Free Water Audit Software: Determining Water Loss Standing
Water resources are believed to be sufficient to meet long-term needs, but demand management interventions (leakage management, water conservation) are included in the long-term planningWater resources are plentiful, reliable, and easily extracted.
Although operational and financial considerations may allow a long-term ILI greater than 8.0, such a level of leakage is not an effective utilization of water as a resource. Setting a target level greater than 8.0 - other than as an incremental goal to a smaller long-term target - is discouraged.
If the calculated Infrastructure Leakage Index (ILI) value for your system is 1.0 or less, two possibilities exist. a) you are maintaining your leakage at low levels in a class with the top worldwide performers in leakage control. b) A portion of your data may be flawed, causing your losses to be greatly understated. This is likely if you calculate a low ILI value but do not employ extensive leakage control practices in your operations. In such cases it is beneficial to validate the data by performing field measurements to confirm the accuracy of production and customer meters, or to identify any other potential sources of error in the data.
Water resources can be developed or purchased at reasonable expense; periodic water rate increases can be feasibly imposed and are tolerated by the customer population.
Cost to purchase or obtain/treat water is low, as are rates charged to customers.
Existing water supply infrastructure capability is sufficient to meet long-term demand as long as reasonable leakage management controls are in place.
Superior reliability, capacity and integrity of the water supply infrastructure make it relatively immune to supply shortages.
Financial Considerations
Water resources are costly to develop or purchase; ability to increase revenues via water rates is greatly limited because of regulation or low ratepayer affordability.
Water Resources Considerations
Available resources are greatly limited and are very difficult and/or environmentally unsound to develop.
Operational Considerations
Operating with system leakage above this level would require expansion of existing infrastructure and/or additional water resources to meet the demand.
General Guidelines for Setting a Target ILI(without doing a full economic analysis of leakage control options)
Preliminary Comparisons - can begin to rely upon the
Infrastructure Leakage Index (ILI) for performance
comparisons for real losses (see below table)
Performance Benchmarking - ILI is meaningful in comparing real
loss standing
Identify Best Practices/ Best in class - the ILI is very reliable as
a real loss performance indicator for best in class service
Once data have been entered into the Reporting Worksheet, the performance indicators are automatically calculated. How does a water utility operator know how well his or her system is performing? The AWWA Water Loss Control Committee provided the following table to assist water utilities is gauging an
approximate Infrastructure Leakage Index (ILI) that is appropriate for their water system and local conditions. The lower the amount of leakage and real losses that exist in the system, then the lower the ILI value will be.
Note: this table offers an approximate guideline for leakage reduction target-setting. The best means of setting such targets include performing an economic assessment of various loss control methods. However, this table is useful if such an assessment is not possible.
For validity scores of 50 or below, the shaded blocks should not be focus areas until better data validity is achieved.
Research information on leak detection programs. Begin
flowcharting analysis of customer billing system
Level II (26-50) Level V (91-100)
Analyze business process for customer metering and billing
functions and water supply operations. Identify data gaps.
Stay abreast of improvements in metering, meter reading, billing,
leakage management and infrastructure rehabilitation
Conduct loss assessment investigations on a sample
portion of the system: customer meter testing, leak survey,
unauthorized consumption, etc.
Establish ongoing mechanisms for customer meter accuracy testing, active leakage control and infrastructure monitoring
Refine, enhance or expand ongoing programs based upon
economic justification
Launch auditing and loss control team; address production
metering deficiencies
Evaluate and refine loss control goals on a yearly basis
Begin to assess long-term needs requiring large expenditure:
customer meter replacement, water main replacement
program, new customer billing system or Automatic Meter
Reading (AMR) system.
Begin to assemble economic business case for long-term needs based upon improved
data becoming available through the water audit process.
Conduct detailed planning, budgeting and launch of
comprehensive improvements for metering, billing or
infrastructure management
Continue incremental improvements in short-term and
long-term loss control interventions
Establish long-term apparent and real loss reduction goals
(+10 year horizon)
Establish mid-range (5 year horizon) apparent and real loss
reduction goals
Socorro Water System (NM3523728)7/2014 - 6/2015
Water Loss Control Planning Guide
Establish/revise policies and procedures for data collection
Refine data collection practices and establish as routine
business process
Annual water audit is a reliable gauge of year-to-year water
efficiency standing
Level III (51-70) Level IV (71-90)
Water Audit Data Validity Level / Score
Level I (0-25)
American Water Works Association.Copyright © 2014, All Rights Reserved.
WAS v5.0
AWWA Free Water Audit Software v5.0 Loss Control Planning 1

Water Conservation Plan 2016
APPENDIX C
WATER CONSERVATION OUTREACH AND EDUCATION

1
Appendix C
Water Conservation Outreach and Education
All water conservation efforts will benefit from public awareness and understanding. By taking advantage of many available resources, Socorro citizens can learn about and practice water conservation to provide a safe and sustainable water supply to our area. Success is measured by changes in water use by several sectors within our community: commercial, residential, industrial, agricultural, and environmental, and includes all water sources including rainwater, storm water, public water supply, agricultural water use, and environmental water availability. Water conservation education programs also build political support and participation in water utility planning and implementation.
Water System Employee Training
• Adopt or update water conservation policies and incorporate water conservation practices into the official standard operating procedures for your water system facilities.
• Adopt clear measures of success when considering water utility system improvements and staff training
• Continue staff training and offer additional training and certification as necessary to assure staff knowledge of state of the art technology and industry standards.
• Offer eductional material and advanced training opportunities for facility managers and staff leaders.
• Conduct regular water audits • Review past audits for areas to improve • Plan recurrance of audits to provide tracking of improvements
• Encourages innovative ideas, new ways to save water and money
Note: AWWA offers advanced training in water conservation at least once per year.
Public Information Programs
Basic understanding enhanced through a public information program includes:
• Water conservation helps water quality • The environmental benefits of keeping water local, reducing water demands, and minimizing
water withdrawls • Investiments in efficiency and conservation will prpovide water users with long term savings
comparted to the cost of developing and terating new water supply sources and wastwater treatment facilities
• The costs involved in providing water • Water-smart landscaping, gardening efficient irrigation, and lawn care practices • Why it is equally important for self-supplied water users (homes or businesses on private wells)
to conserve water
There are numerous ways to share information about the importance of conservation (see New Mexico Office of the State Engineer online resources below) . Information allows the general public to stay up to date on new technologies, ideas, programs, and incentives the City is considering. The steps to develop a general water information program to inform, involve, and educate the public on issues related to water management and the importance of water conservation include:
• Create a local or regional staff position or assign existing personnel the task

2
• Develop a Water Conservation Outreach Plan which can include the following as discrete steps: o Create an interactive and informative website page on City’s website for water
conservation o Continue to use the water bill as the first line educational tool o Offer retrofit and rebate programs for high-water devices o Provide additional educational bill stuffers o Offer or suggest speakers for community organizations o Organize and promote special events such as Conseravation Fairs and Workshops o Offer free self-retrofit water conservation kits to water users o Offer public service announcements o Provide public space advertising for water conservation topics and sources o Develop joint advertising with hardware stores for devices o Build partnerships o Provide contests and offer recognition for innovation in the conservation field o Offer multi-lingual materials to communities as needed o Work with commercial and industrial uses to review and improve water use o Build government involvement
Adopt a general water conservation ordinance Describe ways the local government is conserving water and helping community Communication among outreach staff and billing department to target
appropriate customers
Most general water conservation outreach through the above actions is geared towards adults. Outreach materials can include interesting facts that adults may not be aware of that can lead to water savings; most work towards either retrofitting appliances or changing daily habits (from online resources listed below). The following are provided as examples:
A regular showerhead uses as much as 7 gallons of water every minute. Let adults know they could get a free low-flow showerhead at the local water district. Alternatively, suggest that they look for a low flow showerhead that has a cut-off valve that shuts off the water flow while lathering your hair or shaving legs. You can then turn the water back on, without it starting cold again. This will help to conserve even more water while showering.
A leaky faucet that drips at the rate of one drip per second can waste more than 3,000 gallons per year.
A showerhead leaking at 10 drips per minute wastes more than 500 gallons per year. That is enough water to wash 60 loads of dishes in your dishwasher. Most leaky showerheads can be fixed by ensuring a tight connection using pipe tape and a wrench.
Fixing a leak in your toilet can save about 600 gallons of water each month! In the tank part of the toilets in your house, put several drops of food coloring into the water. If you see the coloring seeping into the bowl, there is a leak. If your toilet is leaking, the cause is most often an old, faulty toilet flapper. Over time, this inexpensive rubber part decays or minerals build up on it. It is usually best to replace the whole rubber flapper—a relatively easy, inexpensive do-it-yourself project that pays for itself in no time.
Check for hidden water leaks in your home. To check, turn off all indoor and outdoor faucets and water-using appliances, then watch the meter. If it continues to run or turn, you probably have a leak.
Is there a garbage disposal in your kitchen sink? Then, you know the water has to run into it when you turn on the switch. Why not start composting food waste instead of sending water and waste down your sink? The compost can be added to a garden and the water saved.
3
Many water savings tips have to do with changing habits or behavior throughout the day. The following are simple tips that the City could develop into outreach materials for their water users:
Do you have plants in your house? When meals are prepared and vegetables or other fresh produce are washed, collect that water and use it to water the plants.
Do you like a drink of cold water now and then? Rather than running the kitchen faucet for several minutes to get cold water, keep a pitcher of water in the refrigerator.
Put a barrel outdoors to catch rainwater, and then use that water for things like watering plants or flushing toilets and save hundreds of gallons of water a year!
Encourage the others in your home, and your friends, not to leave any faucet running when brushing their teeth or washing dishes.
If there is a dishwasher in your house, encourage everyone to scrape their plates rather than rinse them before loading them into the machine. It should always be full before turning it on.
If there is a pool or a hot tub at your house, encourage those who use it to cover it afterwards. This prevents evaporation and having to keep refilling.
If the adults in your home occasionally water the lawn, encourage them to water in the cooler parts of the day (early morning, or at or after sunset), and never on windy days. These practices allow water to reach the soil instead of most of the water being lost to evaporation.
School Programs
In addition to a Water Conservation Outreach Plan, the city can develop a Water Conservation Education Plan and implement a program specifically designed to complement and expand the existing water conservation education in the Socorro Consolidated School system. The priority will be to form partnerships with public education institutions such as K-12 schools, universities, museums, nature centers, science centers, and other government programs to accomplish the education outreach goals established in a Water Conservation Education Plan. Suggested steps include:
• Develop a Memorandum of Understanding between City and appropriate entities • With partners, develop a plan to build and implement water conservation learning in schools.
This plan would include: o Offering water conservation education workshops for teachers o Offering water conservation field experiences and in-class programs for K-12 students o Promoting school programs that:
Presents fair and accurate information Use constructive techniques to empower people and draw on their own
conclusions Provide educational resources that contain concepts, language, and activities that
are developmentally appropriate for the intended audience. o Providing K-12 educational opportunites like an annual school calendar contest o Providing education activities at events within the city and county
The following learning suggestions for water conservation education in schools are specifically designed to move students to greater understanding of water in their surroundings. Ideas presented here come from

4
communities as diverse as Hillsboro, Oregon and Seattle, Washington, state organizations like the Georgia Environmental Protection Division, and the New Mexico State Engineers Office (see online resources below). They provide options for the City of Socorro when developing a Water Conservation Education Plan and Program.
K-2nd (Primary benchmarks: water cycle, weather)
Children can make a very important difference towards water conservation. First off, why do we even need to know about conserving water? Water is a natural resource that we derive from the Earth. Without it, we would not be able to live! Imagine a world with no water at all. You would not be able to drink it, bathe, and swim and so on. Without clean water, other creatures, such as plants, animals, birds and ocean life would also get sick and die. Although kids do not work at large companies or the government, they can still make a huge impact simply by starting at home and changing the way their families, friends and classmates use water.
Some simple ideas:
• Whenever you wash your hands, do not leave the water running. Wet your hands and turn the water off. Use soap and lather your hands well, then turn the water on to rinse. Turn off the water and make sure it is off completely. Then dry your hands.
• Do the same when you brush your teeth. Turn the faucet on to get your toothbrush and toothpaste wet, and then again to rinse your mouth and toothbrush. Do not leave the water running while you are brushing.
• Tell your friends what you are doing and why and encourage them to do the same. • Tell adults when faucets are dripping. • Since baths use a lot of water (about 37 gallons on average), take short showers instead and
use only about 20 gallons of water, instead. • In the summertime, it is fun to play under the lawn sprinkler. When you do, make sure it is
when the lawn is being watered at the same time. • Do you have other summer water toys that require a running hose? These might be fun, but
they also waste gallons and gallons of water. • Is there a leaky faucet or toilet in the bathroom at school? Be sure to let someone know so
that it can be repaired. • Use a wastebasket for used tissues, or things like gum wrappers, paper towels, or even dead
bugs or goldfish. Do not flush them – the average flush uses as much as 5 gallons of water! Even if the toilets in your house are “low-flow” toilets, using them for trash still uses 1.5 gallons of water unnecessarily.
• If the adults in your home occasionally water the lawn, encourage them to water in the cooler parts of the day (early morning, or at or after sunset), and never on windy days. This keeps in the soil all the water being sprayed instead of most of the water being lost to evaporation.
• Provide positive reinforcements for each lesson: even if you do just one of these things you make a difference and save water.
• Repeat some for 3rd and 4th
3rd & 4th (Primary benchmarks: our community’s environment including the geology, springs, the Rio Grande and groundwater, a more advanced water cycle)
Exercises can include:
• From Project Wet, for example, include “Drop in the Bucket” and “Common Water.”
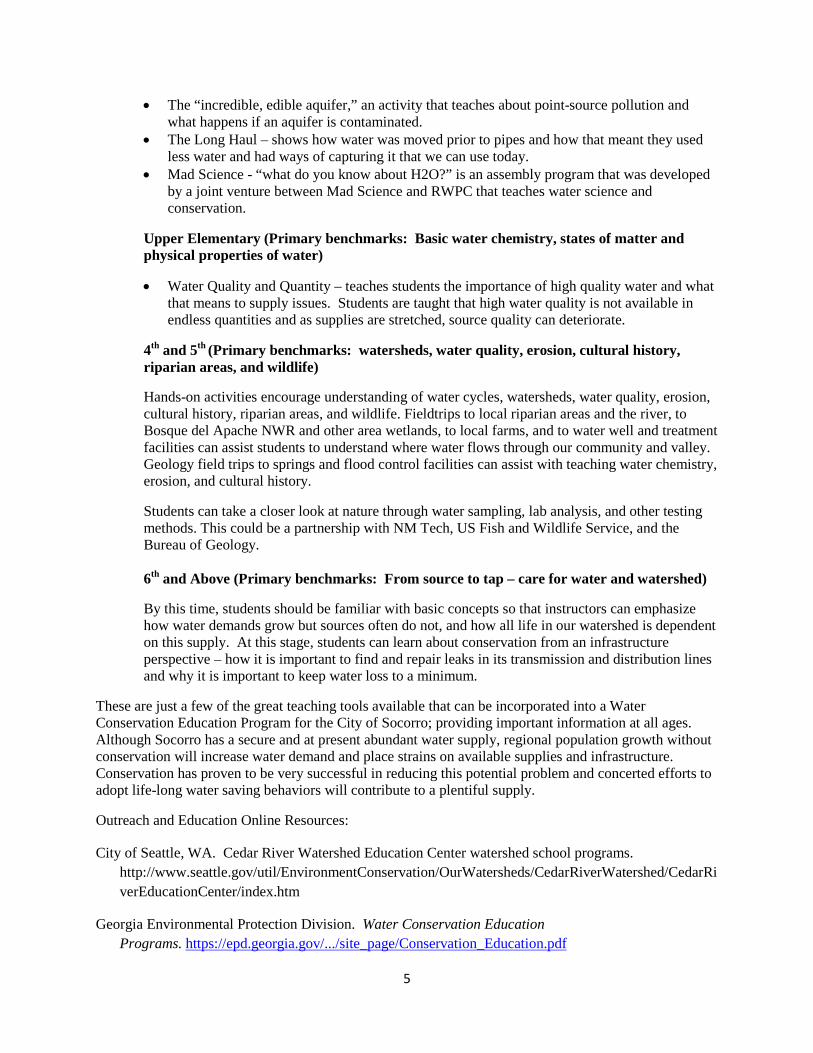
5
• The “incredible, edible aquifer,” an activity that teaches about point-source pollution and what happens if an aquifer is contaminated.
• The Long Haul – shows how water was moved prior to pipes and how that meant they used less water and had ways of capturing it that we can use today.
• Mad Science - “what do you know about H2O?” is an assembly program that was developed by a joint venture between Mad Science and RWPC that teaches water science and conservation.
Upper Elementary (Primary benchmarks: Basic water chemistry, states of matter and physical properties of water)
• Water Quality and Quantity – teaches students the importance of high quality water and what that means to supply issues. Students are taught that high water quality is not available in endless quantities and as supplies are stretched, source quality can deteriorate.
4th and 5th (Primary benchmarks: watersheds, water quality, erosion, cultural history, riparian areas, and wildlife)
Hands-on activities encourage understanding of water cycles, watersheds, water quality, erosion, cultural history, riparian areas, and wildlife. Fieldtrips to local riparian areas and the river, to Bosque del Apache NWR and other area wetlands, to local farms, and to water well and treatment facilities can assist students to understand where water flows through our community and valley. Geology field trips to springs and flood control facilities can assist with teaching water chemistry, erosion, and cultural history.
Students can take a closer look at nature through water sampling, lab analysis, and other testing methods. This could be a partnership with NM Tech, US Fish and Wildlife Service, and the Bureau of Geology.
6th and Above (Primary benchmarks: From source to tap – care for water and watershed)
By this time, students should be familiar with basic concepts so that instructors can emphasize how water demands grow but sources often do not, and how all life in our watershed is dependent on this supply. At this stage, students can learn about conservation from an infrastructure perspective – how it is important to find and repair leaks in its transmission and distribution lines and why it is important to keep water loss to a minimum.
These are just a few of the great teaching tools available that can be incorporated into a Water Conservation Education Program for the City of Socorro; providing important information at all ages. Although Socorro has a secure and at present abundant water supply, regional population growth without conservation will increase water demand and place strains on available supplies and infrastructure. Conservation has proven to be very successful in reducing this potential problem and concerted efforts to adopt life-long water saving behaviors will contribute to a plentiful supply.
Outreach and Education Online Resources:
City of Seattle, WA. Cedar River Watershed Education Center watershed school programs. http://www.seattle.gov/util/EnvironmentConservation/OurWatersheds/CedarRiverWatershed/CedarRiverEducationCenter/index.htm
Georgia Environmental Protection Division. Water Conservation Education Programs. https://epd.georgia.gov/.../site_page/Conservation_Education.pdf

6
Hillsboro, Oregon. Water Conservation Education Program examples. www.hillsborowatersupply.org/conservation.aspx and https://www.chamberofcommerce.com/hillsboro-or/environmental-programs
New Mexico Office of the State Engineer. Agua action (in English and Spanish). Finding, fixing, and preventing water leaks. A waterwise guide to ultra-low-flow toilets. A water conservation guide for public utilities. A waterwise guide to evaporative coolers. A waterwise guide to clothes washers. http://www.ose.state.nm.us/WUC/index.php
Socorro Soil and Water Conservation District. 2016. Residential cost share program application. http://socorroswcd.com/cost-share-program.htm
Texas Water Development Board. K-12 conservation education resources. Water IQ. http://www.twdb.texas.gov/conservation/index.asp
U.S. Bureau of Reclamation. Water conservation outreach and education resources. www.watersmart.net/action
U.S. Environmental Protection Agency: www.epa.gov/watersense, http://nepis.epa.gov/Adobe/PDF/40000KLY.PDF, and https://www.epa.gov/statelocalclimate
Weber Basin, Utah Water Conservation Outreach and Education Programs. www.weberbasin.com/conservationCity of Seattle: http://www.seattle.gov/util/EnvironmentConservation/OurWatersheds/CedarRiverWatershed/CedarRiverEducationCenter/index.htm
7
Outdoor Use Water Conservation
Outdoor water conservation is possible when education and application combine to result in improved practices. Focus of outreach could include: reducing peak season water use, water-wise plantings to beautify Socorro, and youth education focused by age group and continuing education on outdoor water use. The following is a summary of outdoor water conservation public education and application tips available to public utilities and private citizens (New Mexico Office of the State Engineer online resources listed below).
Have a Plan
Before you move a shovelful of dirt or plant a single flower, have an overall plan for your xeriscape. Look at your site from a perspective of what it has to offer and what you want it to provide. Areas already shaded by the walls of the building or existing trees might become additional patio space to take advantage of existing cool spots, or you may want to plant trees or vines to shade existing patios where summer sun makes them less usable because of the heat. Consider views, privacy screening, and wind protection when choosing sites for large shrubs. Consider the mature size of plants when you include them in your garden. Well-adapted plants will reach their maximum size fairly quickly. The more you consider how you want to use space and how you want the space to look and feel, the more likely you will develop a well-designed outdoor space that meets our needs. If you have limited time or energy to invest in gardening, the places where you spend the most time or that you can see through your windows may be the focal points for color and accent, while the rest of the landscape is planned for very low maintenance (City of Albuquerque online resources).
Seven Steps for Water Efficient Gardening 1. Water Early or Late
The first big step to conserving water (if you haven't heard it before) is to water in the evening or early in the morning. The hot mid-day sun often evaporates water before it can help your garden grow. In addition, consider what wind can do to your watering efforts. Wind blows the water to sidewalks, patios and other areas where it's not needed.
2. Water in Bursts Rather than watering continuously for 20 minutes to a half hour, water heavily for 10 minutes, then stop. Let the ground and plants absorb the water they need. Then begin again as needed for optimal garden water conservation.
3. Use Timers Ever forget to turn off your sprinklers and look outside to see a flooded mess? Hopefully, your crop will survive, but that wasted water is gone (at least for a while). Consider putting your sprinklers on timers; it's inexpensive, more convenient for vacation and lets you water in those "sprinkle and soak" cycles that are great for conserving water.
4. Utilize Rain Barrels Speak to a garden specialist or water conservation organization about how to use rain barrels to capture all the water you need for your garden. By collecting rainwater, you will be fully prepared when the dry season comes around.
5. Avoid Overwatering Make sure you're not overwatering your plants, trees and vegetables. In the first two years, plants may need more water to ensure solid rooting. But after deep roots have formed, plants and vegetables (after a few months) can be "weaned" to require less water. This makes plants heartier and able to withstand a drought better, and deep roots make your garden healthier.
6. Switch to Drip Irrigation

8
Use drip irrigation for your garden, plants and flowers, rather than sprinkler irrigation. During drip irrigation, water "drips" or bubbles directly onto the area above the roots of the plant, creating less water waste and run-off and producing a healthier, well-watered garden.
7. Consider Xeriscaping
Xeriscaping
Contrary to perception, a xeriscape is not all rocks, sand and cactus plants (Albuquerque Bernalillo County Water Utility Authority online resource). Instead, a xeriscaping professional will study your yard to determine soil conditions and the best grasses, plants, shrubs, trees and vegetables to grow there. Large, blocky areas (rather than narrow, winding paths) make watering easier while conserving water and preventing run-off.
Step 1: Proper Planting and Design
A water-wise landscape is designed to be functional and water-efficient. Consider the lay of the land — differences in soil and changes in sunlight levels throughout the day. Existing vegetation on the site indicate the kinds of plants that grow well in the area. When designing a water-wise landscape, group plants according to water needs. Ideally, not more than 10 percent of the landscape should be zoned for high water use, 30 percent or less of the area should be zoned for moderate water use, while 60 percent or more of the landscape should be zoned for low water use. Place plants into one of three water-use zones:
High water-use zones — small, highly visible areas, such as the home entrance, are watered as needed, Moderate water-use zones — plants in these areas are watered only when they show signs of moisture stress by wilting and turning a gray-green color, Low water-use zones — plants in these zones are watered only during establishment.
Step 2: Soil Analysis and Improvements
An individual landscape may have many soil types. Evaluate the soils for: • Structure and texture • Topography and slope of the site • Chemical characteristics
To determine chemical characteristics of the soil, take a sample to your local county extension office for testing. The results will tell you whether your soil amendments are needed. Amend the soil with organic matter to improve:
• Structure and texture • Nutrient holding capacity; for poorly drained soils, add coarse-textured aggregate such as pea
gravel or stone. During landscape construction:
• Slope beds away from buildings • Introduce gentle swales to add interest and to retain soil moisture • Plant moisture-loving plants at low elevations • Plant drought-tolerant plants at higher elevations
Step 3: Appropriate Plant Selection
Today there is a huge variety of plants on the market, and selecting the right plant for each location in the landscape is confusing. Adaptability of the plant to the site in which it is to be grown should be an important consideration when selecting plants. Consider:

9
• Sun exposure • Light intensity • Typical wind conditions • Average summer and winter temperatures • Drainage patterns
Regardless of whether a plant is native to the area or an exotic import, if it is adapted to the soil, the climate, and local site conditions, it will thrive.
Step 4: Practical Turfgrass Areas
For recreational areas, turfgrass cannot be beat. It: • Reduces erosion • Provides aesthetic appeal • Absorbs pollutants
Turfgrass, however, also requires more frequent maintenance than most other plants, and it usually receives the highest amount of supplemental irrigation of any plant in the landscape. Turfgrass varieties differ tremendously in their drought tolerance. Bermuda grass, for instance, thrives in low water-use zones if it is kept healthy and well-maintained. It will actually go dormant during drought, then bounce back with vigor when rain returns. Ask your local county extension agent or nurseryman for a list of recommended drought-tolerant turfgrasses for your area. A native alternative to Bermudagrass recommended in southwest locations is buffalo grass. In a Xeriscape, the amount of lawn irrigated is minimized, just as the amount of irrigated ornamental plantings is minimized. Through careful plant selection and proper management, turfgrasses can grow in all three water-use zones in a Xeriscape.
Step 5: Efficient Irrigation
Efficient irrigation usually results from a carefully and appropriately designed irrigation system. The irrigation should be designed according to the water needs of plants. Never install an irrigation system before the landscape design is created. A well-designed irrigation system results in more efficient water use and less water waste. Consider using drip irrigation to water ornamental trees, shrubs, and flowers. It uses 30 percent to 50 percent less water than sprinkler irrigation, and less water is lost to evaporation than with sprinklers. Check your irrigation system each spring before use to make sure it was not damaged by frost or freezing. Check your garden hose for leaks at its connection to the spigot. If it leaks while you run your hose, replace the nylon or rubber hose washer and ensure a tight connection to the spigot using pipe tape and a wrench.
Step 6: Use of Mulches
Mulches provide many benefits in the landscape. They: • Aid in retention of water and minimize evaporative water loss from the soil surface • Help prevent weeds that compete with plants for moisture • Add organic matter and beneficial microorganisms to the soil • Moderate soil temperatures • Prevent erosion • Serve as a barrier to certain soil-borne plant diseases
Step 7: Appropriate Maintenance
A Xeriscape is a low-maintenance landscape. It requires: • Less water

10
• Less fertilizer • Less frequent fertilization • Less routine pruning • Fewer pesticides
Water, fertilization, and pruning encourage new vegetative growth, and new growth increases the overall water requirements of the plant. This succulent new growth wilts readily during periods of limited rainfall, which encourages additional irrigation. Applying less fertilizer and fertilizing less frequently reduces the chance of nutrient runoff into rivers, lakes, and streams. “Grasscycling”, the practice of letting clippings fall back into the lawn when mowing, is another important part of Xeriscape maintenance. Clippings provide natural mulch at the soil surface, helping reduce watering.
Outdoor Water Use Online Resources:
Albuquerque Bernalillo County Water Utility Authority. Xeriscaping, the complete how to guide. Lean and Green, a simple guide to water-wise lawn care. http://www.cabq.gov/community-services/environment-and-health/water/water
City of Albuquerque. Low volume irrigation design and installation guide. www.ose.state.nm.us/WUC/Albq-brochures/irrigation-manual.pdf
City of Albuquerque. The complete how to guide of xeriscaping. www.cabq.gov/resources/waterconservation
City of Santa Fe, New Mexico. Landscape Irrigation Design Standards. www.santafenm.gov/document_center/document/1473Garden View Landscape Nursery and Pools. Waterwise Landscaping Guide. www.garden-view.com/water-wise-landscaping-guide
New Mexico Office of the State Engineer. Xeriscape 101, a step-by-step guide to creating a water-wise garden. A water-wise guide to trees. A water wise guide to rainwater harvesting. New Mexico gray water guide. Irrigation basics, a guide to smart water use. The enchanted xeriscape, a guide to water-wise landscaping in New Mexico. http://www.ose.state.nm.us/WUC/index.php
New Mexico Environment Department. Gray water irrigation guide. https://www.env.nm.gov/OOTS/gray water irrigation guide1.pdf
Rainbird, Inc. Low volume landscape irrigation design manual. www.rainbird.com/documents/drip/LowVolumeGuide.pdf

Water Conservation Plan 2016
APPENDIX D
SCADA FEASIBLITY STUDY

po box 909 21 main st suite 201 edgewood, nm 87015 o) 505.281.2880 f) 505.281.3640
lasting solutions towards a better civilization
Memo
Date: October 12, 2011 To: Pauline Taylor and Lloyd Martinez, City of Socorro From: Ege Richardson, PhD, PE, Aegean Consulting LLC Tappan Mahoney, PE, dennis ENGINEERING company Copy: File 717-B Steve Williams, Vice-President/ Managing Principal Re: City-Wide SCADA System for Water and Wastewater Components 1. Scope of Work The scope of work for installing a Supervisory Control and Data Acquisition (SCADA) system for the City of Socorro can be summarized as follows:
• Phase 1a: Upgrade the existing SBR control panel to get the panel SCADA ready (See discussion in Section 4.2)
• Phase 1b: Install a main computer workstation with its accessories to house the SCADA system at the wastewater treatment plant (WWTP) main office. Install a main Radio Telemetry Unit (RTU) at the WWTP together with an antenna mast and devices for communication with remote sites
• Phase 2: Connect the two arsenic treatment plants to the SCADA, install an antenna mast and devices for communication. Connect the two springs to the SCADA, install solar equipment, flow meters, and a level transmitter (The work at the two springs can be separated, if necessary).
• Phase 3: Connect all the WWTP components (including all SBR equipment, bar screen, influent pumps, digester aeration, sludge pumps, chlorination system) to the SCADA
• Phase 4: Connect the water storage tanks and well pumps to the SCADA, install an antenna mast and devices for communication, as well as pressure transducers, flow meters, level transmitters for well drawdown monitoring, tank intrusion alarms, chlorine detection and alarm
• Phase 5: Connect the seventeen sewer lift stations to the SCADA to monitor alarm conditions, pump run times, and install an antenna mast and devices for communication
• Phase 6: Connect the booster pump station to the SCADA, install automated valves, pressure transducers, an antenna mast and devices for communication

City-Wide SCADA System for Water and Wastewater Components Technical Memo Page 2 October 12, 2011
• Phase 7: Connect the three Pressure Reducing Valve (PRV) sites to the SCADA, install solar equipment and pressure transmitters
2. SCADA Options A City-wide SCADA system to include all the water and wastewater system components listed above can be developed and installed based on one of the three following options:
• Option #1 - City-wide SCADA by a local control systems contractor • Option #2 - City-wide SCADA by ITT-Sanitaire, who is the WWTP system controls
manufacturer • Option #3 - Hybrid system: Wastewater system SCADA by ITT-Sanitaire and all other
telemetry SCADA by a local control systems contractor 2.1. Option #1 - City-Wide SCADA by a Local Control Systems Contractor A local control systems contractor would build, program and provide SCADA software that can control the wastewater treatment plant components as well as the remote sites. The main computer workstation and its accessories would also be provided by the same entity. All wastewater plant instrumentation inputs/outputs (including the data from the SBR control panel) would route to this main SCADA system. This SCADA would also display activity at all remote sites (including arsenic treatment plants), and also receive data and alarms from these sites using radio telemetry unit (RTU), which would also be installed by the same local contractor. For the preparation of this Technical Memo, the I&C Solutions (Rio Rancho) were contacted. Advantages:
• Having a local control systems contractor may help facilitate solving any future problems, as the local company may be more readily available at the plant site as compared to ITT-Sanitaire.
• The SCADA package provided by a local contractor could be cheaper. • I&C Solutions is also the contractor for instrumentation and controls of the two arsenic
treatment plants. Having the same contractor on both projects would help facilitate the installation of the City-wide SCADA.
Disadvantages: • The SCADA system would be dependent on the support from the local individual for the next
20-years. It would be critical to establish a thorough documentation package on how the system was developed. If the local contractor ceases its business in the future, then the knowledge could be lost, creating difficulty to upgrade or manage the system. For example, in the case of Socorro, time and effort will have to be spent in order to determine the terminal tags that were installed in the main plant PLC in the main office, since these terminals were not properly labeled during construction.
• It is unlikely that the local control systems contractor would be able to provide knowledge and expertise in both SCADA controls and wastewater treatment process, as ITT-Sanitaire can.
• Control of SBR equipment would be available in the SBR control room using the SBR PLC. The SCADA that would be located in the main office would be used to monitor status of SBR equipment and/or alarm conditions. The operator(s) would then have to go to the SBR controls room, where the SBR PLC is located, in order to control the SBR equipment. As an

City-Wide SCADA System for Water and Wastewater Components Technical Memo Page 3 October 12, 2011
alternative, if the City desires, the SBR control panel Human Machine Interface (HMI) can be mimicked at the main office SCADA, at additional cost. This cost will have to be determined by the local control systems contractor, depending on City’s preference regarding how many input/output parameters are desired to be controlled from the main office. The costs presented in this Technical Memo were based on no SBR equipment control (only monitor and alarm conditions) using the main SCADA located at the main office.
2.2. Option #2 - City-Wide SCADA by ITT-Sanitaire ITT-Sanitaire would build, program and provide SCADA software that can control the wastewater treatment plant as well the remote sites. The main computer workstation and its accessories would also be provided by ITT-Sanitaire. All wastewater plant instrumentation inputs/outputs (including the data from the SBR control panel) would route to this main SCADA system. This SCADA would also display activity at all remote sites (including arsenic treatment plants), and also receive data and alarms from these sites using a radio telemetry unit (RTU), which would have to be installed by a local control systems contractor. Advantages:
• The SCADA system would be built by the Sequencing Batch Reactor (SBR) process manufacturer. Since the SBR is the most critical component of wastewater treatment in Socorro, it is an advantage to have ITT-Sanitaire combine its process and SCADA expertise, and have a single point of responsibility and technical support for both process and SCADA.
• ITT-Sanitaire is an industry leading manufacturer and we believe its technical staff will be in the wastewater market 20-years from now to support their product line.
• Control of SBR equipment would be available both in the SBR PLC room and the main office control room, at no additional cost.
Disadvantages:
• The SCADA system would be more expensive than a product built by a local control systems contractor.
• ITT-Sanitaire cannot complete the entire field work, and hence a local control systems contractor would still be required to install the RTUs and other field hardware.
2.3. Option #3 - Hybrid System: Wastewater System SCADA by ITT-Sanitaire and All Other
Telemetry SCADA by a Local Control Systems Contractor ITT-Sanitaire would build, program and provide SCADA software that can control the wastewater treatment plant, and a local control systems contractor would build, program and provide SCADA software that can control all the remote sites. The main computer workstation and its accessories can be provided by either party. In this alternative, the main SCADA computer would have two SCADA software systems installed, and the operator(s) would switch to either system readily easily by one mouse click. All wastewater plant instrumentation inputs/outputs (including the data from the SBR control panel) would route to the SCADA system provided by ITT-Sanitaire. The second SCADA by the local contractor would display activity at all remote sites (including arsenic treatment plants), and also receive data and alarms from

City-Wide SCADA System for Water and Wastewater Components Technical Memo Page 4 October 12, 2011
these sites using radio telemetry units (RTU), which would have to be installed by the local control systems contractor. Advantages:
• The wastewater SCADA system would be built by the Sequencing Batch Reactor (SBR) process manufacturer. Since the SBR is the most critical component of wastewater treatment in Socorro, it is an advantage to have ITT-Sanitaire to be responsible from the wastewater SCADA system.
• Control of SBR equipment would be available both in the SBR PLC room and the main control room, at no additional cost.
• Having a local control systems contractor may help facilitate solving any future problems, as the local company may be more readily available at the plant site.
Disadvantages:
• Even though the individual responsibilities would be clearly defined based on whether it is a wastewater system or a remote site component, these two systems would have to come together in one main computer screen. Since there would be two parties involved with the SCADA, it may be harder to identify responsibilities, in case of a problem with the system.
• The SCADA system would be more expensive than a single party providing the entire system, due to economies of scale.
3. Preliminary Opinion of Probable Costs for City-Wide SCADA The quotes received from ITT-Sanitaire and the local controls system contractor (I&C Solutions) are summarized in Table 1. Selection of a SCADA provider is a critical decision for the City and therefore all parties that will be impacted by this decision should be involved to determine the option that is the best for the City. From a technical perspective, it is advantageous to have the single source control responsibility, whether it is ITT-Sanitaire or the local control systems contractor, in order to ensure compatibility of all software and hardware pieces. An important point that should be considered for the design of the City-wide SCADA is how the project will be completed. The City may prefer to directly hire a SCADA contractor (whether it is the local systems contractor or ITT-Sanitaire) to complete the project as design-build, or the City may choose to hire an electrical engineer to complete the design of the SCADA system to complete the project as design-bid-build. While the first option may potentially provide cost savings to the City, hiring an electrical engineer to provide an unbiased instrumentation expertise may be to the City’s best interest in getting the most effective SCADA established for the system. Even if the City chooses to proceed with design-build option, we believe that hiring an electrical engineer to overview the first phase of the SCADA, as designed and submitted by the SCADA contractor will be beneficial to the City. After this first phase, when protocols and hardwares are selected and major components of the system are identified, the City may proceed without the services of the electrical engineer. 4. Additional Topics for Discussion Regardless of the SCADA software provider, the existing main plant control panel located in the main office and the existing SBR PLC should be further discussed to determine the need for upgrades.

City-Wide SCADA System for Water and Wastewater Components Technical Memo Page 5 October 12, 2011
4.1. Upgrade of the Existing Main Control Panel (MCP) at the WWTP The main control panel (MCP) which is currently located in the main office brings in all the input/output (I/O) parameters from all the wastewater treatment plant components to this centralized location. Upgrades to this MCP are necessary to complete the plant SCADA and properly communicate with the new SBR control panel. Two options were identified for this MCP:
1. This main plant PLC enclosure and the I/O hardware will remain, but the processor (CPU) will be replaced with a remote I/O interface card that would communicate back to the new SBR PLC. The program associated with the I/O in the MCP would become part of the new SBR PLC. This would provide a cohesive solution enabling remote access technical support. The cost for this upgrade is anticipated to be about $28,000 plus NMGRT. Purchasing this together with the SBR control panel upgrade or SCADA can reduce the costs by about $5000 by eliminating one field trip. This upgrade proposal prepared by ITT-Sanitaire is an acceptable solution with a lower cost, and therefore was included in the costs presented in Table 1.
2. The second option for this main control panel would be to remove it completely and upgrade it with a wall mounted box that will house remote I/O parameters and be connected via Ethernet to the new SBR PLC located in the other room. Under these conditions, this panel will no longer serve as a PLC. The main advantage of this upgrade would be the smaller size of the replacement box, approximately 48-inches by 36-inches, which will help provide additional room for this main office. The cost for this upgrade is anticipated to be about $42,000 plus NMGRT. Purchasing this together with the SBR control panel upgrade or SCADA can reduce the costs by about $5000 by eliminating one field trip. This upgrade proposal prepared by ITT-Sanitaire is not a necessity at this point, and therefore was not included in the costs presented in Table 1.
4.2. Upgrade of the SBR PLC The SBR control panel which is currently located next to the blower room brings in all the input/output (I/O) parameters from the SBR basins (decanters, blowers, sludge pumps, instrumentation) to this centralized location. Upgrade to this panel is necessary in order to connect the SBR operations to a SCADA system and also to eliminate the current problems that the operators are experiencing with the programming. The technical memo dated July 6, 2011 was submitted to the City recommending upgrading the existing SBR control panel. However, during a field visit in July, it was recommended by the local control systems contractor (I&C Solutions) to utilize the existing SBR control panel until its functional lifetime, and connect it to the main SCADA in its current condition. Therefore, two options were identified for the upgrade of this SBR PLC:
1. Upgrade the existing SBR PLC with an Allen Bradley CompactLogix L32E and replace the existing Panelmate HMI interface screen with an Allen Bradley Panel View Plus 1000 HMI. This option was proposed by Sanitaire and is expected to cost about $55,000 plus NMGRT. The main advantage of this option is resolving all the ongoing software problems that the plant operators have been experiencing. With this option, the panel will be upgraded to meet Sanitaire’s latest programming in terms of hardware and software, and it will also be ready for a SCADA connection in the future.
City-Wide SCADA System for Water and Wastewater Components Technical Memo Page 6 October 12, 2011
2. The second option would be to upgrade the processor and the HMI screen for the SBR PLC, and also make the panel Ethernet accessible. This option would then continue utilizing the existing code (programming) in the panel. Therefore, any potential software problems would be harder to resolve since the panel will continue being a PLC5 instead of the newer CompactLogix panel that ITT-Sanitaire currently supports. This option was proposed by the local controls system contractor (I&C) and is expected to cost about $15,000 plus NMGRT. While this option can provide cost savings, it would also bring in an increased risk factor, due to potential programming and software related problems. In addition, if the City chooses to implement Dissolved Oxygen (DO) control and/or correct the air header piping layout that is currently in place, the existing software will not be able to support these modifications and will have to be re-programmed by Sanitaire. At that point, Sanitaire will have to evaluate the conditions and propose their pricing, since this panel will not be their up-to-date standard panel that they currently utilize in their projects.
Based on this discussion and the costs obtained from responsible parties, it is once again our recommendation to upgrade the existing SBR control panel. The new control panel will be an Allen Bradley CompactLogix L32E. We recommend the City to contact JCH as soon as possible to have ITT-Sanitaire build a new Ethernet-ready SBR control panel with a PLC to operate the aeration blowers, equipment and instrumentation mounted within the SBR basins. This is the option that was listed in the cost estimates presented in Table 1.
It should be noted that since the SBR PLC will be upgraded, the existing desktop computer with the existing limited SCADA will not be operational with the new SBR PLC. The digester pumps I/O that are currently controlled from the existing desktop computer will then have to be sent to the SBR PLC until the new SCADA software is established.

Option 1 Option 2 Option 3SCADA by
a local contractor
SCADA by ITT-
SanitaireHybrid System
1a See Section 4.2
WWTP Install new SBR control panel $55,000 $55,000 $55,000
Install RTU, antenna tower and devices for communications
$17,000
Install base PC workstation and accessoriesDevelop SCADA software to include ALL remote sitesDevelop SCADA software to include WWTP components
$85,000
Total for Phase 1b $69,000 $110,000 $145,000
Install PLC/RTU at arsenic plants 1 and 2
Install two flowmeters, level transmitter and solar equipment at Springs
3a No options WWTP Connect the WWTP components to SCADA, field wiring
$10,000* $10,000* $10,000*
3b See Section 4.1
WWTP Upgrade MCP in the main office $28,000* $28,000 $28,000
3c No options WWTP Wiring between SBR PLC and MCP $3,000 $3,000 $3,000Install a PLC/RTU, anntenna mast, cables, devices for communicationInstall new flowmeters, pressure transmitters, and pressure switches at each wellInstall level transmitters at each well for drawdown monitoringInstall door intrusion switchesInstall new chlorine gas detection and alarm system
Optional Replace existing MCC at wells 1 & 2 $35,000 $35,000 $35,0005 No options Lift
StationsInstall PLC/RTU, antenna, cables and devices for communication
$103,000 $103,000 $103,000
6 No options Booster Pump Station
Install automated control valves, PLC/ RTU, pressure transducers, antenna, cables and devices for communication
$43,000 $43,000 $43,000
7 No options PRV Stations
Install PLC/RTU, solar equip-ment, pressure transmitters
$59,000 $59,000 $59,000
TOTAL $589,000 $630,000 $665,000* estimated cost.
Services to be provided by a local controls system contractorServices to be provided by ITT-Sanitaire
2
4
Arsenic Treatment Plants
Well and Storage Tank Sites
Phase Options Location
No options
No options
$59,000
$125,000
$60,000*
$59,000
$125,000
$93,000
$59,000
$125,000
Table 1. Alternative Opinions of Probable Costs for City-Wide SCADA System
$69,000WWTP Main Office
1b No options
Task

Water Conservation Plan 2016
APPENDIX E
DROUGHT MANAGEMENT
Appendix E
Drought Management Considerations in Water Shortage Contingency, Drought Management and Predicted Climate Changes
This Appendix will help the City of Socorro with its evaluation of need and development of a Drought Management Plan. The following information and list of resources discuss the reasons for and process to develop a plan aimed at addressing limited water supplies.
There are a number of benefits realized through water conservation which specifically assist the community in times of drought (U.S. EPA 2015). These benefits include:
• Increase operational flexibility and resilience of service: Sustainable use of existing water resources can reduce risks related to projected decreases in water supply and increases in service demand. Water conservation reduces the need to develop new source water supplies or to expand the infrastructure at water and wastewater facilities. Water efficiency and conservation programs can preserve natural resources and increase the sustainability of water supplies, leaving more water for future use and improving the ambient water quality and aquatic habitat.
• Cost savings and opportunity to reinvest: More efficient use of water often reduces operating and treatment costs, resulting in a net savings which can be reinvested to help address other challenges – such as the need for rate increases, the need to address gaps in funding or can be used to support additional adaptation efforts. When faced with potential water shortages, developing and implementing water efficiency and conservation measures almost always involves a lower cost than developing a new water source or expanding water or wastewater infrastructure to meet demand or other goals.
• Deferred and avoided capital investments: Water demand management practices will often allow the utility to continue to meet water demand without needing to expand existing facilities or build new facilities. Water demand management can also extend the life of existing facilities.
• Maintain environmental benefits of water resources: Reduced water consumption helps to maintain reservoir water levels and groundwater tables, and supports the use of lakes, rivers and streams for recreation and wildlife. When use of these resources reduces surface or groundwater levels, natural and human pollutant levels can increase and threaten human and ecological health. Using water more efficiently helps maintain supplies at safe levels, protecting human health and the environment.
• Decrease carbon footprint: The delivery of water requires energy to pump, treat and distribute water. End users also use energy to heat water for certain uses. Implementing water efficiency and conservation projects can reduce the amount of water withdrawals from sources and demand on wastewater services, thereby reducing energy needs and associated greenhouse gas emissions. Use of more water efficient products by customers can also decrease energy needed to heat water.
• Improve public image: Communicating utility actions to increase water efficiency and encouraging water conservation practices to customers can establish a utility as a steward of local water resources and a leader in pursuing financially and socially responsible actions.
Present and predicted changes to the climate of the southwestern United States include average temperature rises on average over the year, changes in precipitation patterns, timing, and accumulated volumes over the year (U.S. EPA 2015).
From the U.S. Global Change Research Program of the Environmental Protection Agency assessments, these quantified patterns include:

• The 2001-2010 decade was the warmest on record. Average observed temperatures in the Southwest were almost 2°F higher than historic averages, with the region experiencing more heat waves and fewer cold snaps.
• The area burned in the Southwest has increased by more than 300% compared to the 1970s and 1980s. Drought has been widespread in the Southwest since 2000; the drought conditions during the 2000s were the most severe average drought conditions of any decade.
Predictions from the same resource for our area include: • Future droughts are projected to be substantially hotter, • Projected increases in summertime temperatures are greater than the increase of annual average temperature
in parts of the region and will likely be exacerbated locally by expanding urban heat island effects, • Less winter precipitation falling as snow and earlier spring snowmelt are projected to shift runoff and most
of the annual streamflow to earlier in the year, • Increased flood risk in the Southwest is likely to result from a combination of decreased snow cover on the
lower slopes of high mountains and an increased fraction of winter precipitation falling as rain, which will run off more rapidly and alter the timing of flooding,
• Increasing temperature will cause more droughts, wildfires and invasive species colonization, which will accelerate transformation of the landscape.
Under different categories of impacts to water supplies, drought is predicted to reduce groundwater recharge, lower lake and reservoir levels, and change seasonal runoff with resulting loss of snowpack (EPA 2015). All of these would affect drinking water from shallow groundwater wells in rural areas, surface flows in the Rio Grande, and the ability of New Mexico to adhere to water agreements with adjoining states. Although this does not necessarily affect Socorro’s water supply, as a region it highlights a potential vulnerability in terms of long-term water resources for a multitude of uses. In terms of water quality, saltwater intrusion into aquifers and changes in surface water quality are potential risks due to drought and changing climate patterns.
One interesting and potentially important aspect of predicted changes in climate patterns is the increase in the severity of flood events. The Socorro area has a history of floods from both the Rio Grande and from tributary watersheds. With less average flow volume on the Rio Grande, watershed sediments from occasional floods on area arroyo and tributaries accumulate locally. When large, flashy Rio Grande floods occur, sediments alter the river’s ability to pass these high flows safely downstream. As a community, Socorro is somewhat protected from these floods through the levee system recently upgraded by the Corps of Engineers. The surrounding communities are less secure.
Likewise, the Rio Grande ecosystem is affected by drought and changing climate with a predicted loss of native plant and wildlife species and increases in both fire risk along the bosque and nonnative plant species occurrence (Mueller et al 2005). These changes influence the environmental, recreational, and economic benefits of the bosque adjacent to Socorro (Enquist and Gori 2008).
The result of drought and climate change can therefore affect the overall water volume, temperature, availability, and the demand for agricultural and environmental water, and change energy sector and utility needs (U.S. Bureau of Reclamation online resources below). This could affect both drinking water and wastewater supplies.
Components of a Drought Management Plan
When the City of Socorro finds it necessary to protect limited water supplies in the event of drought and climate change, the following are general aspects of drought management comment to planning efforts in other communities (see numerous online resources below). Available water uses in drought management plans typically follow these priorities:
1. Health and Safety – interior residential and fire fighting 2. Commercial, Industrial, and Institutional – maintain economic base, protect jobs 3. Permanent Crops – takes fi ve to 10 years to replace 4. Annual Crops – protect jobs

5. Landscaping – direct water to trees and shrubs 6. New Demand – generally, two years of construction projects are already approved
Water Conservation Ordinances are designed to provide the city with a way to require citizens and businesses to reduce per capita water use and to enforce water conservation regulations (City of Santa Fe online resources below). Ordinances are usually amended and changed as new strategies and programs are devised and are coupled with financial incentives for water conservation. Emergency Water Use Ordinances are designed to allow the city to impose more severe water-use restrictions if needed when demand for water exceeds available supplies. Landscape Water Use Ordinances are designed to restrict outdoor water use during drought. As an example, the Denver Drought Response Plan (2002), has adopted the following principles to guide restrictions: • Avoid irretrievable loss of natural resources. • Allow watering of irreplaceable trees and avoid killing perennial landscaping if possible, i.e. tailor water
restrictions as much as possible to known landscape needs. • Restrict less essential uses before essential uses. • Restrict water use for misters, fountains and other aesthetic water features first. • Avoid using water as a substitute for something else (for example, cleaning impervious surfaces or
washing personal vehicles). • Curtail outdoor water use (except for watering trees and shrubs), along with restrictions on commercial
use, before restricting domestic indoor use. • Affect individuals or small groups before affecting large groups or the public as a whole, allowing as
much public activity as possible to be unaffected. • Preserve community pools rather than residential pools. • Restrict golf courses before public parks. • Restrict water use on less heavily used areas of parks where grass can go dormant before restricting use
on formal and informal playing fields, where recreational activity would either kill the grass or have to be prohibited.
Water rates can be tiered to encourage water conservation practices. Higher rates and surcharges are placed on water use beyond a defined amount allowed during drought periods. Rules adopted by cities to promote water conservation in general and to address drought and climate change specifically can include: • No outside watering from 10 am to 6 pm during the growing season, May through October, to limit
evaporation in the heat of the day, • Limiting outside watering to no more than three days a week, • Overspray and runoff while watering plants is prohibited, • Overhead spray irrigation is prohibited for watering trees and shrubs, • Turf grass sod or grass seed mixed must contain less than 25 percent Kentucky bluegrass. Use grass
species adapted to dry conditions, • In some cities, a permit is required for all new irrigation system installations and for major renovations
of existing systems, with backflow prevention devices required for those connected to the city water system,
• Hand washing with a hose, whether for irrigation or car washing (once per month allowed) at home will have an automatic shut off nozzle,
• No spray washers to clean driveways, parking lots, outdoor eating areas, or other hard surfaces, • Cover swimming pools when not in use,

• In addition, low water use landscape literature and water-efficient irrigation guidelines must be provided to landscape business customers with the purchase of perennial plants and sod or grass seed, or with a landscape service contract.
For indoor use, cities have adopted various strategies to inform the public and to limit water use in public facilities. • Water conservation information is posted in public, semi-public, and governmental facilities, provided
to new home buyers, and new water customers, • Lodging facilities shall provide a water conservation information in each guest room, • Public facility owners must repair minor leaks in a required time period; severe leaks must be repaired
immediately, • Eating establishments provide water only on request, • In addition, lodging facilities shall limit changing linens when guests are staying for multiple days.
In most cities, there is a policy in place to allow violation fees to be charged based on number of violations or severity of water waste. In addition, water restrictions increase as drought conditions or water shortages are predicted or observed. Restrictions can go from recommendations to obligatory requirements based on water supply and drought conditions. When water is in limited supply, landscape irrigation is limited to no more than twice a week with staggered watering schedules for properties and vehicle washing is discouraged (only with a shut-off nozzle), Other restrictions say that ponds and fountains can continue to function by initial filling of swimming pools and spas, but have limited additional water added. In addition, public outdoor spaces like parks, public schools, athletic fields and roadside landscaping is reduced by a certain percentage.
A water crisis is determined by a certain percentage loss of water supply, with most outdoor water uses prohibited. Outdoor gray water use is not limited. Some of the prohibited water uses include landscape watering, vehicle washing, ponds or fountains, and swimming pools and spas.
The City of Seattle established criteria for curtailments during water shortages (Seattle Water Shortage Contingency Plan), gearing magnitude of curtailment to shortage level: Timing: Can the measures or actions produce results in the necessary timeframe? Magnitude of savings: Will the measures or actions result in enough water savings to make a
meaningful difference. That is, will it reduce demand to the level the impaired water system can handle?
Season: Are the actions or measures relevant to the time of year? That is, banning lawn watering during the summer irrigation season versus during non-irrigation season.
Drought Management Online Resources:
City of Santa Fe, New Mexico. Water conservation and drought management plan. www.santafenm.gov/document_center/document/2754
City of Santa Fe, New Mexico. Summary of water conservation rules and regulations, policies and ordinances. www.savewatersantafe.com/water-conservation-rules-and-regulations and www.santafenm.gov/water_policies_and_ordinances/print

Enquist, C. and D. Gori. 2008. A Climate Change Vulnerability Assessment for Biodiversity in New Mexico. The Nature Conservancy, Santa Fe.
Mueller,R.C., C.M. Scudder, M.E. Porter, R.T. Trotter III, C.A. Gehring, and T.G. Whitham. 2005. Differential tree mortality in response to severe drought: Evidence for long-term vegetation shifts. Journal of Ecology 93:1085-1093.
New Mexico State Environment Department. Municipal drought management plan guidance document https://www.env.nm.gov/dwb/tools/documents/MunicipalDroughtMgmt
State of California, Department of Water Resources. 2008 updated addition. Urban drought guidebook. www.water.ca.gov/wateruseefficiency
U.S. Bureau of Reclamation. WaterSmart, a three year progress report. www.usbr.gov/watersmart
U.S. Bureau of Reclamation. Drought Contingency Plan. https://www.usbr.gov/mp/watershare/documents/Contingency-Drought-Planning.pdf
U.S. Environmental Protection Agency. 2015. Adaptation strategies guide for water utilities. https://www.epa.gov/sites/production/files/2015-04/documents/updated_adaptation_strategies_guide_for_water_utilities.pdf
U.S. Environmental Protection Agency. Guidelines for water reuse. https://www3.epa.gov/region9/water/recycling/