Embed Size (px)
Citation preview
Green Building Council of Australia Page 1 of 33
Green Star – Healthcare PILOT
Energy Calculator Guide
Prepared by: Advanced Environmental

Green Building Council of Australia Page 2 of 33
Executive Summary The Green Star Healthcare Rating Tool has been developed to evaluate the predicted performance of healthcare facilities based on a variety of environmental criteria. The Energy Credit Calculator within this tool will compare the predicted energy consumption of a healthcare facility to a benchmark. This comparison will then be used to award points to any facility which improves on the benchmark.
To use the calculator the predicted energy consumption of the facility must be calculated. Important components of this calculation are the heating and cooling energy consumption of the facility, which must be determined using computer modelling. This guide specifies standard inputs to be used when modelling the heating, ventilation and cooling (HVAC) systems of the facility. The standard inputs include operational profiles and internal heat loads which facilitate comparison between different healthcare facilities.
The predicted ancillary load energy consumption, such as that from lighting, mechanical ventilation and lifts, must also calculated. This guide includes details on how to calculate these loads in such a way that they can be fairly compared to the benchmark.
Finally, this guide includes information on how to enter the simulation outputs and the ancillary load calculations into the Healthcare Energy Credit Calculator. The calculator compares the performance of the facility relative to set benchmarks. Information on how these benchmarks were set can be found in The Healthcare “Standard Practice” Benchmark document.

Green Building Council of Australia Page 3 of 33
TABLE OF CONTENTS Guidelines for Simulation Input Parameters ................................................................5
General Parameters..................................................................................................5 Building Envelope.....................................................................................................6 Internal Loads...........................................................................................................8 A/C Pumping ............................................................................................................9 HVAC System Simulations .....................................................................................10 HVAC Controls .......................................................................................................12
Ancillary Services .......................................................................................................14 Guidelines for simulation outputs ..............................................................................16 Case Study – On-site Energy Generation ..................................................................17
LIST OF FIGURES Figure 1: Screenshot of the energy calculator ................................................................................16 Figure 2: Entry of case study into the calculator ............................................................................18
Issue/Status Revision Date Issued Author Checked Approved Comment
Draft for Review
A August 2006
MA AK, MJ MJ Draft for TWG Review
Draft for Review
B August 2006
MA AK, MJ MJ Captures comments from TWG
Final C September 2006
MA AK, MJ MJ Update of language

Green Building Council of Australia Page 4 of 33
INTRODUCTION The Green Building Council Australia (GBCA) has developed a suite of rating tools to assess the environmental performance of buildings in Australia. As part of this package, the Green Star Healthcare Rating Tool assesses the environmental performance of healthcare facilities by measuring their environmental impact.
Part of this assessment of environmental performance includes determining the predicted energy consumption of a healthcare facility. The Healthcare Energy Credit Calculator has been developed to compare this to a benchmark. More information on how the benchmarks were set can be found in The Healthcare “Standard Practice” Benchmark document.
The building must be simulated using computer modelling software in order to determine the predicted energy consumption of its Heating, Ventilation and Cooling (HVAC) system. In addition, the predicted energy consumption of the ancillary loads in the building must be calculated.
This report has been written as a guide to these calculations, and how they should be entered into the Energy Calculator for comparison.

Green Building Council of Australia Page 5 of 33
Guidelines for Simulation Input Parameters
The parameters used to simulate the HVAC energy consumption of a healthcare facility is given in this section. These are standard criteria that must be adhered to in ordered to comply with the Green Star energy credit requirements. The outputs from this simulation will then be entered in the calculator, as outlined in Section 4.
If a common central plant is shared by the rated development and another building or space, the central plant must be treated as follows:
1) The size of the central plant used for the energy calculations in this rating tool must be assumed as equivalent to the peak demand of the development to be rated;
2) The part load curves for the actual central plant shall be applied proportionally to the central plant used for the energy calculations.
General Parameters
Modelling Parameter
Requirements Documentation
GE
NE
RA
L
Simulation Package
• Passed the BESTEST1 validation test; or • The European Union draft standard EN13791 July 2000;
or • Be certified in accordance with ANSI/ASHRAE Standard
140-2001. Please contact the Green Building Council of Australia if none of the above options can be complied with.
Energy Report: • Simulation brief for assessor (see Appendix
A).
1 The International Energy Agency, working with the U.S. National Renewable Energy Lab, has created a benchmark for building energy simulation programs. This benchmark is entitled "BESTEST – International Energy Agency Building Energy Simulation Test and Diagnostic Method".

Green Building Council of Australia Page 6 of 33
Weather Data
• A Test Reference Year (TRY) if the building location is within 50km of a TRY location; or
• In the absence of local TRY weather data, an actual year of recorded weather data from a location within 50km of the building location; or
• In the absence of TRY or actual weather data within 50km, interpolated data based upon 3 points within 250km of the building location.
Please contact the Green Building Council of Australia if none of the above options can be complied with.
Energy Report: • Type of data (TRY / year / interpolated). • Weather station location.
Over -shadowing • Demonstrate that overshadowing from the surrounding
environment has been taken into account in the model.
Verification Documents: • Relevant architectural drawings.
Energy Report: • Details of how overshadowing from the
external environment has been represented in the model.
Table 1: General Parameters Table
Building Envelope
Modelling Parameter Requirements Documentation
BU
ILD
ING
E
NV
EL
OP
E
Building Form
• Demonstrate that the simulation model is an accurate representation of the building's shape;
• Demonstrate that all floors in the building are modelled; and
• Show that there are limited simplifications to the building form.
Verification Documents: • Relevant architectural drawings.
Energy Report: • Details of how the building’s physical shape
has been represented in the model. • Details of any simplifications in the model
and their effect.

Green Building Council of Australia Page 7 of 33
Insulation • Demonstrate that insulation in the walls, ceiling and floors has been accurately represented.
Verification Documents: • Relevant architectural drawings. • Materials schedule.
Energy Report: • Details on how the insulation has been
represented in the model.
Glazing
• Demonstrate that glazing is modelled using the following parameters:
• Visible light transmission; • Solar transmission; • Internal and external solar reflectance; and • Emissivity.
Verification Documents: • Relevant pages from the glazing or façade
specification. Energy Report: • Details of how glazing has been modelled.
Windows and Spandrel
• Demonstrate that the sizes of windows and spandrel are accurately represented.
Verification Documents: • Relevant architectural drawings.
Energy Report: • Details of the window and spandel sizes that
have been used in the model.
Shading • Demonstrate that all shading of windows and external building fabric has been accurately represented.
Verification Documents: • Relevant architectural drawings.
Energy Report: • Details of how window shading and external
building fabric are represented in the model.
Orientation • Demonstrate that the building orientation has been included in the model.
Verification Documents: • Relevant architectural drawings.
Energy Report: • Details of how the orientation has been
represented in the model.

Green Building Council of Australia Page 8 of 33
Infiltration
• Demonstrate that infiltration has been modelled to reflect façade design specification. Typical default values are 0.5 air changes per hour for perimeter zones and zero air changes per hour for central zones.
Verification Documents: • Relevant architectural drawings. • Relevant pages from the façade
specification that show infiltration or façade sealing characteristics.
Energy Report: • Details of how infiltration has been
modelled.
Table 2: Building envelope parameters
Internal Loads
Modelling Parameter Requirements Documentation
INT
ER
NA
L L
OA
DS
Lighting
• Demonstrate that lighting is calculated based on floor area.
• Demonstrate that the appropriate HVAC Model Operational Profile (see Appendix C) has been used in the HVAC Model
Verification Documents: • Area schedule. • Reflected ceiling plans with base building
lighting design. • Relevant pages from electrical specification
showing occupancy sensors (if any), time clock (if any), lights and light fittings.
Energy Report: • Details of space type areas using the
definitions in Appendix B. • Details of how the lighting power densities
have been modelled. • Details of how the operational profiles for
the building have been modelled.

Green Building Council of Australia Page 9 of 33
Equipment
• Demonstrate that all equipment loads is calculated based on floor area.
• Demonstrate that the equipment loads are modelled using the operational profiles as prescribed in Appendix C.
Verification Documents: • Area schedule.
Energy Report: • Details of space type areas using the
definitions in Appendix B. • Details of how the equipment load densities
have been calculated. • Details of how the operational profiles have
been modelled.
Occupancy
• Demonstrate that all occupancies are calculated based on floor area.
• Demonstrate that the occupancy profile used is that prescribed for each space type in Appendix C.
Verification Documents: • Area schedule.
Energy Report: • Details of space type areas using the
definitions in Appendix B • Details on how the occupancy loads have
been modelled • Details on the profiles used for occupancy
Table 3: Internal loads parameters A/C Pumping
Modelling Parameter Requirements Documentation
A/C
PU
MP
ING
• Chilled water
• Demonstrate that chilled water pumping is calculated using the building cooling load, the static pressure of the chilled water pumps (typically 250kPa) and the flow rate in L/s.
Verification Documents: • Relevant pages from the hydraulic and
mechanical specifications showing chilled water pump data – static pressure and flow rate in L/s.
Energy Report: • Calculation of chilled water pumping.

Green Building Council of Australia Page 10 of 33
Heating hot water
• Demonstrate that the hot water pumping is calculated using the building heating load, the static pressure of the hot water pumps (typically 250kPa) and the flow rate in L/s.
Verification Documents: • Relevant pages from the hydraulic and
mechanical specifications showing hot water pump data – static pressure and flow rate in L/s.
Energy Report: • Calculation of hot water pumping.
Tenant condenser
water
• If a tenant condenser water loop is provided, show that allowance has been made for the additional energy used for tenant supplementary condenser water pumping.
• If relevant, demonstrate that the tenant condenser water loop pumping is calculated based on a tenant supplementary cooling load, the static pressure of the tenant condenser water pumps (typically 250kPa) and the flow rate in L/s.
Verification Documents: • Relevant pages from the hydraulic and
mechanical specifications showing the tenant water condenser loop data (or lack thereof); static pressure and the flow rate in L/s.
Energy Report: • If relevant, details on how the tenant
condenser water loop pumping was calculated.
Table 4: A/C pumping parameters
HVAC System Simulations
Modelling Parameter Requirements Documentation
HVAC System design
• Demonstrate that the HVAC system modelled represents the system design for each part of the building.
Verification Documents: • Relevant pages from mechanical
specification and mechanical drawings which accurately and thoroughly describe the basic HVAC system design.
Energy Report: • Details of how the HVAC system has been
represented in the model.
HV
AC
Sys
tem
Sim
ulat
ion
Zoning • Demonstrate that all air conditioning zones represented in the thermal model accurately reflect system performance and zonal solar diversity.
Energy Report:• Details of how the air conditioning zones
have been represented in the model, and how these zones accurately represent the mechanical design drawings and

Green Building Council of Australia Page 11 of 33
specification.
Chiller plant
• Demonstrate that the chiller plant size is accurately reflected in the model.
• Demonstrate that the actual efficiency curves of the installed plant are used in the model.
• Water cooled equipment: Demonstrate that chiller data is specified under conditions that reflect the intended condenser water temperature controls.
• Air cooled equipment: Demonstrate that the air cooled chiller COP profiles have been accurately modelled with regard to loading and ambient conditions
Verification Documents: • Relevant pages from the mechanical
specification showing the chiller plant size and any condenser water operation.
• Documentation from chiller supplier giving part load curves (and condenser water temperatures where applicable).
Energy Report: • Details of how the chiller plant size has been
represented in the model. • Details of how the actual efficiency curves
have been used in the model. • Details of how the chiller data is relevant to
the intended condenser water temperature controls.
Boiler plant • Demonstrate that the boiler plant size, thermal efficiency
and distribution efficiency are accurately reflected in the model.
Verification Documents: • Relevant pages from the mechanical
specification which show details of the boiler plant size, thermal efficiency and distribution efficiency.
Energy Report: • Details of how the boiler has been modelled.
Supply Air and Exhaust
Fans
• Demonstrate that fan performance curves are accurately represented in the model.
• Demonstrate that index run pressure drops are accurately represented to include the total static inclusive of filters, coils and diffusers.
Verification Documents: • Pages from the mechanical specification
showing fan performance curves and fan size.
Energy Report: • Details of how the index run pressure drops
have been calculated. • Details of how these have been modelled.
Cooling Tower Fans
• Demonstrate that allowance for energy consumption from cooling tower fans has been made, based upon the annual cooling load of the building and the supplementary cooling load for tenancy air conditioning.
Energy Report: • Details of how the cooling tower fans have
been modelled.

Green Building Council of Australia Page 12 of 33
Cooling Tower and Condenser
Water Pumping
• Demonstrate that allowance for energy consumption from cooling tower and condenser water pumping has been made, based upon the annual cooling load of the building.
Energy Report: • Details of how the cooling tower and
condenser water pumping have been modelled.
Table 5: HVAC system simulation
HVAC Controls
Modelling Parameter Requirements Documentation
Outside Air
• Demonstrate that outdoor air flows have been modelled as documented in the mechanical design drawings and specifications, and in compliance with the appropriate standards.
Verification Documents: • Relevant pages from mechanical
specification giving details on the correct minimum outside air flow
Energy Report: • Detail of how outside air flow has been
represented in the system
Economy Cycle • Demonstrate that economy cycles have been
modelled to reflect system specification noting any enthalpy/temperature cut-off and control point.
Verification Documents: • Relevant pages from mechanical
specification giving details on the economy cycle of the system
Energy Report: • Detail of how the economy cycle has been
modelled HV
AC
Co
ntro
ls
Primary duct temperature
control
• Constant Volume Systems: Demonstrate that modelling has allowed supply air temperatures to vary to meet loads in the space
• Variable Volume Systems: Demonstrate that modelling has allowed supply air volumes to vary to meet loads in the space
• Demonstrate that setpoints have been rescheduled as specified. Note that simplifications may be made to consider average zone temperature in lieu of high/low select.
Verification Documents: • Relevant pages from mechanical
specification giving details of the design temperature and HVAC cooling and heating setpoints
Energy Report: • Detail of how design temperatures and
setpoints have been modelled

Green Building Council of Australia Page 13 of 33
Airflow Control
• Demonstrate that control logic describing the operation of the dampers to control outside and re-circulated airflow is inherent in the model and accurately reflects the airflow characteristics of the system.
Verification Documents: • Relevant pages from the mechanical
specification giving details of the operation of the dampers to control outside and recirculated air
Energy Report: • Details of how these have been represented
in the model •
Minimum turndown
• Demonstrate, where relevant, that the minimum turndown airflow of each air supply is accurately reflected in the model.
Verification Documents: • Relevant pages from the mechanical
specification giving details of the minimum turndown airflow of each air supply
Energy Report: • Details of how the minimum turndown is
modelled for each air supply
Chiller staging
• Demonstrate that for systems that employ multiple chillers with a chiller staging strategy, the correct controls are modelled to reflect the actual relationship between the chillers.
Verification Documents: • Relevant pages from the mechanical
specification giving details of the chiller staging strategy
Energy Report: • Details of how chiller staging has been
modelled
Temperature control bands
• Demonstrate that the temperature control bands of the system accurately reflect the thermal model.
Verification Documents: • Relevant pages from the mechanical
specification giving details of the design specification for the thermal model
Energy Report: • Details of how the temperature control
bands have been modelled
Table 6: HVAC Controls parameters
Green Building Council of Australia Page 14 of 33
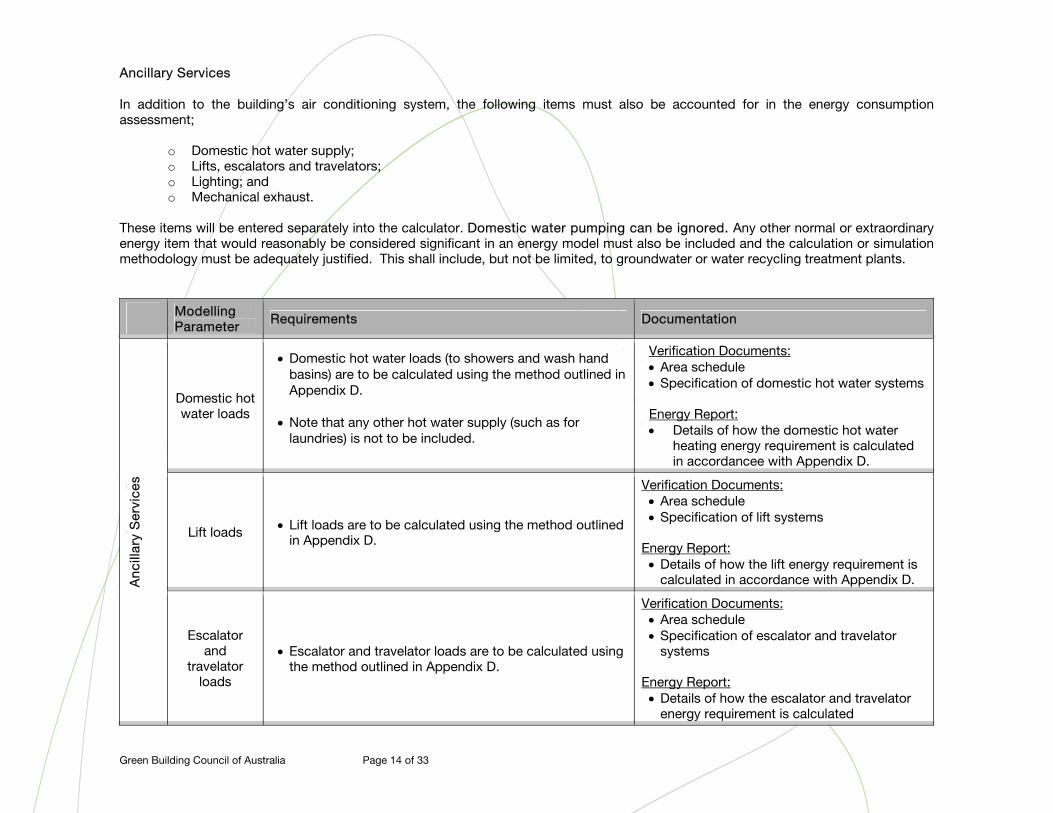
Ancillary Services
In addition to the building’s air conditioning system, the following items must also be accounted for in the energy consumption assessment;
o Domestic hot water supply; o Lifts, escalators and travelators; o Lighting; and o Mechanical exhaust.
These items will be entered separately into the calculator. Domestic water pumping can be ignored. Any other normal or extraordinary energy item that would reasonably be considered significant in an energy model must also be included and the calculation or simulation methodology must be adequately justified. This shall include, but not be limited, to groundwater or water recycling treatment plants.
Modelling Parameter Requirements Documentation
Domestic hot water loads
• Domestic hot water loads (to showers and wash hand basins) are to be calculated using the method outlined in Appendix D.
• Note that any other hot water supply (such as for laundries) is not to be included.
Verification Documents: • Area schedule • Specification of domestic hot water systems Energy Report: • Details of how the domestic hot water
heating energy requirement is calculated in accordancee with Appendix D.
Lift loads • Lift loads are to be calculated using the method outlined in Appendix D.
Verification Documents: • Area schedule • Specification of lift systems
Energy Report: • Details of how the lift energy requirement is
calculated in accordance with Appendix D. Anc
illar
y S
ervi
ces
Escalator and
travelator loads
• Escalator and travelator loads are to be calculated using the method outlined in Appendix D.
Verification Documents: • Area schedule • Specification of escalator and travelator
systems Energy Report: • Details of how the escalator and travelator
energy requirement is calculated

Green Building Council of Australia Page 15 of 33
Lighting
• Demonstrate that lighting is calculated based on floor area.
• Demonstrate that the appropriate Lighting Energy Consumption Profile in Appendix C has been used.
The lighting profile can be adjusted if the following are
installed: • Occupancy sensors: Lighting must follow the
appropriate lighting profile whenever the appropriate occupancy profile is larger than 0.
• Time Clocks: If lighting operates on a time clock then common area lighting must follow the appropriate lighting profile when specified as “on” by the electrical specification. This must operate for no less time than described for the previous point.
• Daylight dimming: Details on this system must be provided
Verification Documents: • Area schedule • Reflected ceiling plans with base building
lighting design • Relevant pages from electrical specification
showing occupancy sensors (if any), time clock (if any), lights and light fittings
Energy Report: • Details of space type areas using the
definitions in Appendix B • Details of how the lighting power densities
have been modelled • Details of how the operational profiles for
the building have been modelled • Details of the lighting control systems and
how they have been modelled
Mechanical exhaust systems
• Demonstrate that the energy requirements for mechanical exhaust systems (such as those installed for toilets, kitchens and any other purpose specific systems such as photocopy or computer server room exhausts) are calculated using the following parameters:
• Maximum power of the fan; • 50% fan efficiency; and • An operational profile based on the operational profiles.
That is, the fan should be on anytime that the HVAC system is on.
Verification Documents: • Relevant pages from the mechanical
specification showing details of mechanical exhaust systems.
Energy Report: • Details of how the energy requirements for
mechanical exhaust systems are calculated.
Table 7: Ancillary services parameters
Green Building Council of Australia Page 16 of 33
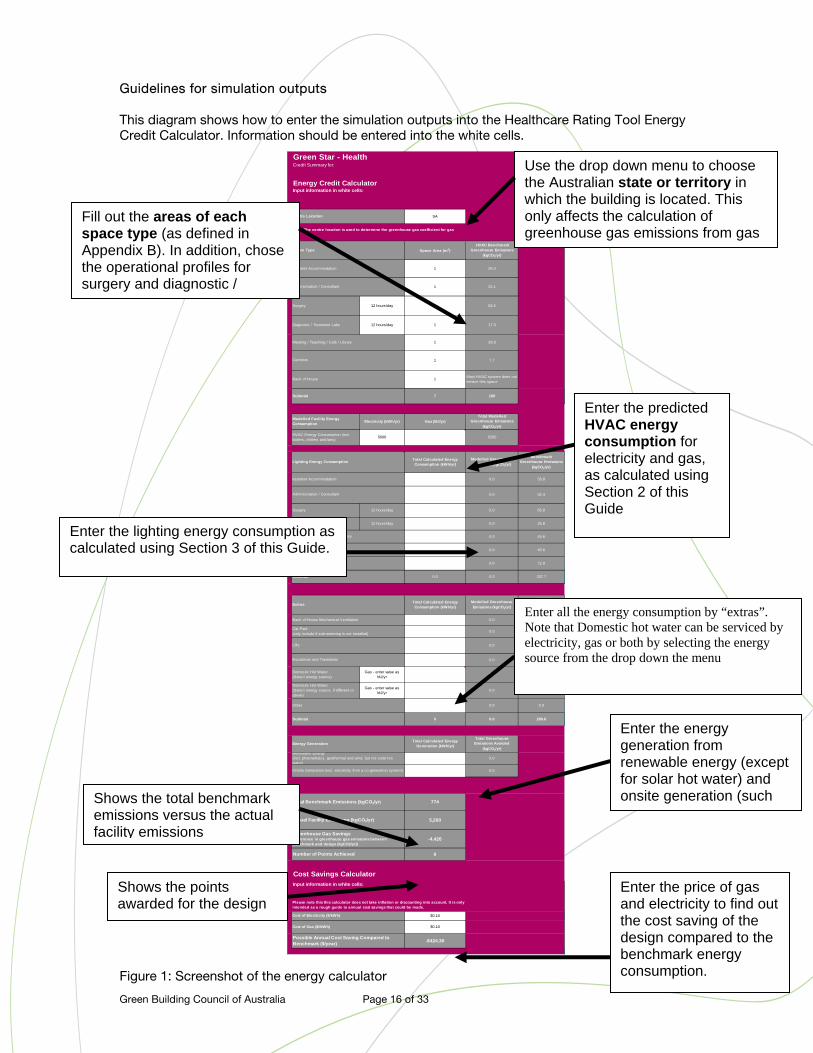
Guidelines for simulation outputs
This diagram shows how to enter the simulation outputs into the Healthcare Rating Tool Energy Credit Calculator. Information should be entered into the white cells.
Figure 1: Screenshot of the energy calculator
Green Star - HealthCredit Summary for:
Energy Credit CalculatorInput information in white cells:
SA
Space Area (m2) HVAC Benchmark
Greenhouse Emissions (kgCO2/yr)
1 26.0
1 23.1
Surgery 12 hours/day 1 62.5
Diagnosis / Treatment Labs 12 hours/day 1 17.3
1 29.8
1 7.7
1 Main HVAC system does not service this space
Subtotal 7 166
Modelled Facility Energy Consumption Electricity (kWh/yr) Gas (MJ/yr)
Total Modelled Greenhouse Emissions
(kgCO2/yr)
HVAC Energy Consumption (incl. boilers, chillers and fans)
5000 5200
Total Calculated Energy Consumption (kWh/yr)
Modelled Greenhouse Emissions (kgCO2/yr)
Benchmark Greenhouse Emissions
(kgCO2/yr)
0.0 58.8
0.0 32.4
Surgery 12 hours/day 0.0 55.8
Diagnosis / Treatment Labs 12 hours/day 0.0 26.8
0.0 45.6
0.0 45.6
0.0 72.9
0.0 0.0 337.7
Total Calculated Energy Consumption (kWh/yr)
Modelled Greenhouse Emissions (kgCO2/yr)
Benchmark Greenhouse Emissions
(kgCO2/yr)
0.0 109.3
0.0 0.0
0.0 160.2
0.0 0.0
Domestic Hot Water (Select energy source)
Gas - enter value as MJ/yr
0.0 0.2
Domestic Hot Water (Select energy source, if different to above)
Gas - enter value as MJ/yr
0.0 0.0
0.0 0.0
0 0.0 269.6
Energy GenerationTotal Calculated Energy
Generation (kWh/yr)
Total Greenhouse Emissions Avoided
(kgCO2/yr)
0.0
0.0
774
5,200
-4,426
0
Cost Savings CalculatorInput information in white cells:
$0.10
$0.10
-$424.30
Corridors
Back of House
Other
Lifts
Car Park(only include if sub-metering is not installed)
Back of House Mechanical Ventilation
Escalators and Travelators
Administration / Consultant
Meeting / Teaching / Café / Library
Lighting Energy Consumption
Inpatient Accommodation
Administration / Consultant
Meeting / Teaching / Café / Library
Corridors
Back of House
Subtotal
Onsite Generation (incl. electricity from a co-generation system)
Renewable Energy (incl. photovoltaics, geothermal and wind, but not solar hot water)
Subtotal
Centre Location
The centre location is used to determine the greenhouse gas coefficient for gas
Extras
Space Type
Inpatient Accommodation
Possible Annual Cost Saving Compared to Benchmark ($/year)
Cost of Electricity ($/kWh)
Cost of Gas ($/MWh)
Number of Points Achieved
Greenhouse Gas Savings (Difference in greenhouse gas emissions between benchmark and design (kgCO2/yr))
Please note this this calculator does not take inflation or discounting into account. It is only intended as a rough guide to annual cost savings that could be made.
Actual Facility Emissions (kgCO2/yr)
Total Benchmark Emissions (kgCO2/yr)
Use the drop down menu to choose the Australian state or territory in which the building is located. This only affects the calculation of greenhouse gas emissions from gas
Fill out the areas of each space type (as defined in Appendix B). In addition, chose the operational profiles for surgery and diagnostic /
Enter the predicted HVAC energy consumption for electricity and gas, as calculated using Section 2 of this Guide
Enter the lighting energy consumption as calculated using Section 3 of this Guide.
Shows the points awarded for the design
Shows the total benchmark emissions versus the actual facility emissions
Enter the price of gas and electricity to find out the cost saving of the design compared to the benchmark energy consumption.
Enter the energy generation from renewable energy (except for solar hot water) and onsite generation (such
Enter all the energy consumption by “extras”. Note that Domestic hot water can be serviced by electricity, gas or both by selecting the energy source from the drop down the menu
Green Building Council of Australia Page 17 of 33
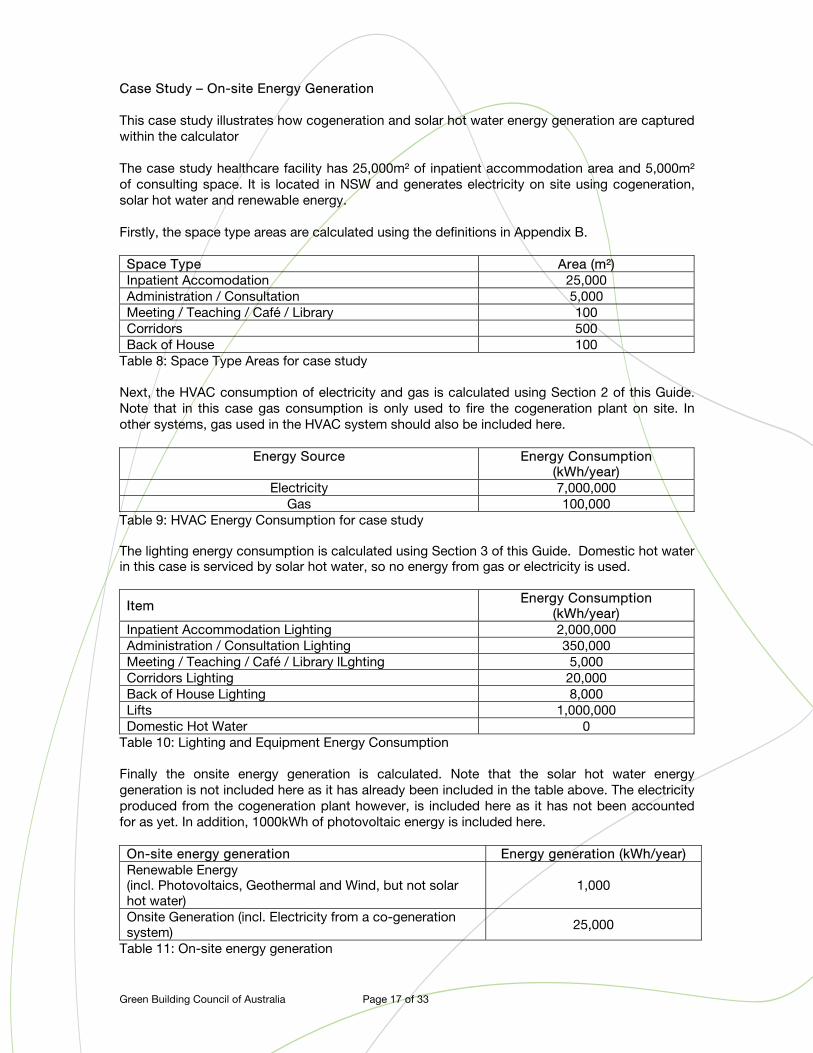
Case Study – On-site Energy Generation
This case study illustrates how cogeneration and solar hot water energy generation are captured within the calculator
The case study healthcare facility has 25,000m² of inpatient accommodation area and 5,000m² of consulting space. It is located in NSW and generates electricity on site using cogeneration, solar hot water and renewable energy.
Firstly, the space type areas are calculated using the definitions in Appendix B.
Space Type Area (m²) Inpatient Accomodation 25,000 Administration / Consultation 5,000 Meeting / Teaching / Café / Library 100 Corridors 500 Back of House 100
Table 8: Space Type Areas for case study Next, the HVAC consumption of electricity and gas is calculated using Section 2 of this Guide. Note that in this case gas consumption is only used to fire the cogeneration plant on site. In other systems, gas used in the HVAC system should also be included here.
Energy Source Energy Consumption (kWh/year)
Electricity 7,000,000 Gas 100,000
Table 9: HVAC Energy Consumption for case study The lighting energy consumption is calculated using Section 3 of this Guide. Domestic hot water in this case is serviced by solar hot water, so no energy from gas or electricity is used.
Item Energy Consumption (kWh/year)
Inpatient Accommodation Lighting 2,000,000 Administration / Consultation Lighting 350,000 Meeting / Teaching / Café / Library lLghting 5,000 Corridors Lighting 20,000 Back of House Lighting 8,000 Lifts 1,000,000 Domestic Hot Water 0
Table 10: Lighting and Equipment Energy Consumption Finally the onsite energy generation is calculated. Note that the solar hot water energy generation is not included here as it has already been included in the table above. The electricity produced from the cogeneration plant however, is included here as it has not been accounted for as yet. In addition, 1000kWh of photovoltaic energy is included here.
On-site energy generation Energy generation (kWh/year) Renewable Energy (incl. Photovoltaics, Geothermal and Wind, but not solar hot water)
1,000
Onsite Generation (incl. Electricity from a co-generation system) 25,000
Table 11: On-site energy generation

Green Building Council of Australia Page 18 of 33
This information is entered into the calculator as detailed below.
Figure 2: Entry of case study into the calculator
Any on-site generation should be entered here. This includes electricity generated from co-generation and from renewables such as Photovoltaics. This does not however, include energy generated from solar hot water.
If domestic hot water is supplied by gas or electricity, then the energy consumption should be entered here. If it is supplied by solar thermal then no value should be entered.
Green Star - HealthCredit Summary for:
Energy Credit CalculatorInput information in white cells:
NSW
Space Area (m2) HVAC Benchmark
Greenhouse Emissions (kgCO2/yr)
25,000 649,038
10,000 230,769
Surgery 12 hours/day 0
Diagnosis / Treatment Labs 12 hours/day 0
100 2,981
500 3,846
100 Main HVAC system does not service this space
Subtotal 35,700 886,635
Modelled Facility Energy Consumption Electricity (kWh/yr) Gas (MJ/yr)
Total Modelled Greenhouse Emissions
(kgCO2/yr)
HVAC Energy Consumption (incl. boilers, chillers and fans)
7,000,000 400,000 7,308,520
Total Calculated Energy Consumption (kWh/yr)
Modelled Greenhouse Emissions (kgCO2/yr)
Benchmark Greenhouse Emissions
(kgCO2/yr)
2,000,000 2,080,000 1,469,052
350,000 364,000 324,480
Surgery 12 hours/day 0 0
Diagnosis / Treatment Labs 12 hours/day 0 0
5,000 5,200 4,555
20,000 20,800 22,776
8,000 8,320 7,288
2,383,000 2,478,320 1,828,152
Total Calculated Energy Consumption (kWh/yr)
Modelled Greenhouse Emissions (kgCO2/yr)
Benchmark Greenhouse Emissions
(kgCO2/yr)
20,000 20,800 10,932
0 0
1,000,000 1,040,000 816,816
0 0
Domestic Hot Water (Select energy source)
Gas - enter value as MJ/yr
0 12,506,710
Domestic Hot Water (Select energy source, if different to above)
Gas - enter value as MJ/yr
0 0
0 0
1,020,000 1,060,800 13,334,458
Energy GenerationTotal Calculated Energy
Generation (kWh/yr)
Total Greenhouse Emissions Avoided
(kgCO2/yr)
1,000 1,040
25,000 26,000
16,049,244
10,820,600
5,228,644
6
Corridors
Back of House
Other
Lifts
Car Park(only include if sub-metering is not installed)
Back of House Mechanical Ventilation
Escalators and Travelators
Administration / Consultant
Meeting / Teaching / Café / Library
Lighting Energy Consumption
Inpatient Accommodation
Administration / Consultant
Meeting / Teaching / Café / Library
Corridors
Back of House
Subtotal
Onsite Generation (incl. electricity from a co-generation system)
Renewable Energy (incl. photovoltaics, geothermal and wind, but not solar hot water)
Subtotal
Centre Location
The centre location is used to determine the greenhouse gas coefficient for gas
Extras
Space Type
Inpatient Accommodation
Number of Points Achieved
Greenhouse Gas Savings (Difference in greenhouse gas emissions between benchmark and design (kgCO2/yr))
Actual Facility Emissions (kgCO2/yr)
Total Benchmark Emissions (kgCO2/yr)
Green Building Council of Australia Page 19 of 33
APPENDIX A – SIMULATION BRIEF FOR ASSESSORS In order to assess the validity of the final results, it is critical that the assessor and the simulator understand the limitations of the simulation package which has been used. The simulator must provide the assessor with a briefing of the simulation package and model used which shows that the following requirements have been met: • The simulation package has passed external validation standards such as BESTEST2; • The model analyses building performance on an hourly basis for a full year; • The model accurately represents:
• The proposed HVAC system; • The HVAC controls which are to be used; • Glazing on the building – whether the model represents glazing as only a U-
value and shading coefficient; • The performance curves and sizes for plant items; • The daylight effects and the operation of daylight controls; and
• All other aspects of the building have been modelled correctly, with no significant compromises made.
If these requirements are not met, then the reasons for this will need to be adequately justified.
2 The International Energy Agency, working with the U.S. National Renewable Energy Lab, has created a benchmark for building energy simulation programs. This benchmark is entitled "BESTEST – International Energy Agency Building Energy Simulation Test and Diagnostic Method".

Green Building Council of Australia Page 20 of 33
APPENDIX B: SPACE TYPE DEFINITIONS
The following provides definitions of the space types used within the Healthcare Energy Credit Calculator.
Inpatient Accommodation These spaces include: Medical and surgical spaces for adults and children, overnight rooms, palliative care, aged care inpatient units, maternity inpatient units, adult mental health inpatient units, child and adolescent inpatient units, ambulatory mental health units and psychogeriatric unit. Administration/Consultant These spaces include: aged care therapy units, allied health units (social work, dieticians etc), interpreter services, diabetes education, reception, cashier, admissions, chapels, quiet rooms, pastoral care, security, switchboard, volunteers, retail, corporate and executive services, human resources and payroll, nursing administration, medical administration, finance, facilities management, information management and communications, occupational health and safety and central staff change rooms. Surgery These spaces include: operating suites, day surgery units and mortuaries. Diagnosis/Treatment Labs These spaces includes special care nurseries, birthing units, radiotherapy, oncology day units, acute and rehabilitation spinal units, specialist outpatient clinics, therapy units (physiotherapy, occupational therapy, speech therapy), day procedure units (including endoscopy and oncology), renal dialysis units, oral health units, audiology, ophthalmology units, otolaryngology (ear nose and throat) units, cardiac diagnostic units, respiratory units (lung function testing), neurology units, satellite pharmacies, intensive care (coronary care, paediatric, cardiac surgery, neonatal), burns units, emergency departments, acute assessment units, psychiatric care centres, anaesthetics and pain management units, sterile supply units, cardiac catheterisation units, medical imaging (general and interventional), nuclear medicine (and PET if included), pathology services (laboratory medicine), pharmacies, clinical information areas, anesthetics, biomedical engineering, infection control and staff clinic. Meeting/Café/Library/Teaching These spaces include conference and seminar rooms, education centres, health libraries, medical staff lounges and retail food services. Circulation Spaces These spaces include corridors main entry foyer & public amenities. Back of House These spaces include food services (kitchens), environmental services, laundry / linen services, transport services, engineering and maintenance services, and materials management (stories, supplies and purchasing).

Green Building Council of Australia Page 21 of 33
APPENDIX C: OPERATIONAL PROFILES Inpatient Accommodation Note When calculating the HVAC energy consumption of these spaces, the model should use the specified lighting densities in the HVAC Model Operational Profile. When calculating the energy consumption of the lighting in the facility, the lighting profile should be used in conjunction with the lighting densities as per the lighting specifications. Input Upper Temperature Limit: 27°C Lower Temperature Limit: 20°C Humidity Upper Limit: 50% Air change rate: In accordance with AS1668.2 or engineered design HVAC Model Operational Profile
Weekdays and Weekends
Occupancy Gains (W/m²)
Time Lighting
Gain (W/m²)
Equipment Sensible
Gain (W/m²)
Sensible Latent
Occupancy Profile
(m²/person)
Plant Operation
0000-0600 3 2.5 1.03 0.89 68 On
0600-1800 8.4 5 1.45 1.24 48 On
1800-2000 12 5 2.06 1.77 34 On
2000-2400 3 2.5 1.03 0.89 68 On
Table 12: Inpatient accommodation operational profile Lighting Energy Consumption Profile
Weekdays (note that there are no weekend loads in this space)
Time Lighting Profile (% of maximum)
0000 - 0600 25% 0600 - 1800 70% 1800 - 2000 100% 2000 - 2400 100%
Table 13: inpatient accommodation lighting energy consumption profile

Green Building Council of Australia Page 22 of 33
Administration / Consultant Note: When calculating the HVAC energy consumption of these spaces, the model should use the specified lighting densities in the HVAC Model Operational Profile. When calculating the energy consumption of the lighting in the facility, the lighting profile should be used in conjunction with the lighting densities as per the lighting specifications. Input Upper Temperature Limit: 27°C Lower Temperature Limit: 20°C Humidity Upper Limit: 50% Air change rate: In accordance with AS1668.2 or engineered design HVAC Model Operational Profile
Weekdays (note that there are no weekend loads in this space)
Occupancy Gains (W/m²)
Time Lighting Profile (W/m²)
Equipment (W/m²)
Sensible Latent
Occupancy (m²/person)
Plant Operation
0000 - 0800 0 0 0 0 0 Off
0800 - 1100 12 15 2.8 2.4 25 On
1100 - 1400 12 12 1.68 1.44 42 On
1400 - 1700 12 15 2.8 2.4 25 On
1700 - 1800 12 7.5 0.56 0.48 125 On
1800 - 2400 0 0 0 0 0 Off
Table 14: Administration / Consultation operational profile Lighting Energy Consumption Profile
Weekdays (note that there are no weekend loads in this space)
Time Lighting Profile (% of maximum)
0000 - 0800 0% 0800 - 1100 100% 1100 - 1400 100% 1400 - 1700 100% 1700 – 1800 100% 1800 - 2400 0%
Table 15: Administration / Consultation lighting energy consumption profile

Green Building Council of Australia Page 23 of 33
Surgery – 12 Hour Profile
Note: 1. The surgery space will either have this 12 hour profile, or it will have the 24 hour profile as listed next. 2. When calculating the HVAC energy consumption of these spaces, the model should use the specified lighting densities in the HVAC Model Operational Profile. When calculating the energy consumption of the lighting in the facility, the lighting profile should be used in conjunction with the lighting densities as per the lighting specifications. Input Upper Temperature Limit: 24°C Lower Temperature Limit: 20°C Humidity Upper Limit: 50% Air change rate: In accordance with AS1668.2 or engineered design Lighting Energy Consumption Profile
Weekdays (note that there are no weekend loads in this space)
Occupancy Gains (W/m²)
Time
Lighting Profile (%
of maximum
Equipment Sensible
Gain (W/m²)
Sensible Latent
Occupancy Profile
(m²/person)
Plant Operation
0000 - 0600 0 0 0 0 0 Off
0600 - 0900 6.25 10 0.73 0.63 116 On
0900 - 1600 25 40 2.42 2.07 29 On
1600 - 1800 6.25 10 0.73 0.63 116 On
1800 - 2400 0 0 0 0 0 Off
Table 166: Surgery 12 hour operational profile Lighting energy consumption profile
Weekdays (note that there are no weekend loads in this space)
Time Lighting Profile (% of maximum)
0000 - 0600 0% 0600 - 0900 25% 0900 - 1600 100% 1600 - 1800 25% 1800 - 2400 0%
Table 17: Surgery 12 hour lighting energy consumption profile

Green Building Council of Australia Page 24 of 33
Surgery – 24 Hour Profile
Note: 1. The surgery space will either have this 24 hour profile, or it will have the 12 hour profile as listed previously. 2. When calculating the HVAC energy consumption of these spaces, the model should use the specified lighting densities in the HVAC Model Operational Profile. When calculating the energy consumption of the lighting in the facility, the lighting profile should be used in conjunction with the lighting densities as per the lighting specifications. Input Upper Temperature Limit: 24°C Lower Temperature Limit: 20°C Humidity Upper Limit: 50% Air change rate: In accordance with AS1668.2 or engineered design HVAC Model Occupancy Profile
Weekdays and Weekends
Occupancy Gains (W/m²)
Time Lighting Profile (W/m²)
Equipment (W/m²)
Sensible Latent
Occupancy (m²/person)
Plant Operation
0000 - 0600 3.75 6 0.37 0.32 189 On
0600 - 0900 6.25 10 0.73 0.63 96 On
0900 - 1600 25 40 2.42 2.07 29 On
1600 - 1800 6.25 10 0.73 0.63 96 On
1800 - 2400 3.75 6 0.37 0.32 189 On
Table 18: Surgery 24 hour operational profile
Weekdays (note that there are no weekend loads in this space)
Time Lighting Profile (% of maximum)
0000 - 0600 15% 0600 - 0900 25% 0900 - 1600 100% 1600 - 1800 25% 1800 - 2400 15%
Table 19: Surgery 24 hour lighting energy consumption profile

Green Building Council of Australia Page 25 of 33
Diagnostic / Treatment Labs - 12 hour profile Note: 1. The diagnostic lab / treatment space will either have this 12 hour profile, or it will have the 24 hour profile as listed next. 2. When calculating the HVAC energy consumption of these spaces, the model should use the specified lighting densities in the HVAC Model Operational Profile. When calculating the energy consumption of the lighting in the facility, the lighting profile should be used in conjunction with the lighting densities as per the lighting specifications. Input Upper Temperature Limit: 24°C Lower Temperature Limit: 20°C Humidity Upper Limit: 50% Air change rate: In accordance with AS1668.2 or engineered design HVAC Model Occupancy Profile
Weekdays and Weekends
Occupancy Gains (W/m²)
Time Lighting Profile (W/m²)
Equipment (W/m²)
Sensible Latent
Occupancy (m²/person)
Plant Operation
0000 - 0600 0 0 0 0 0 Off
0600 - 0900 3 1.25 0.96 0.82 73 On
0900 - 1600 12 5 3.19 2.73 22 On
1600 - 1800 3 1.25 0.96 0.82 73 On
1800 - 2400 0 0 0 0 0 Off
Table 20: Diagnostic / Treatment Labs 12 hour operational profile Lighting Energy Consumption Profile
Weekdays (note that there are no weekend loads in this space)
Time Lighting Profile (% of maximum)
0000 - 0600 0% 0600 - 0900 25% 0900 - 1600 100% 1600 - 1800 25% 1800 - 2400 0%
Table 21: Diagnostic / Treatment Labs 12 hour lighting energy consumption profile

Green Building Council of Australia Page 26 of 33
Diagnostic / Treatment Labs - 24 hour profile Note: 1. The diagnostic lab / treatment space will either have this 24 hour profile, or it will have the 12 hour profile as listed previously. 2. When calculating the HVAC energy consumption of these spaces, the model should use the specified lighting densities in the HVAC Model Operational Profile. When calculating the energy consumption of the lighting in the facility, the lighting profile should be used in conjunction with the lighting densities as per the lighting specifications. Input Upper Temperature Limit: 24°C Lower Temperature Limit: 20°C Humidity Upper Limit: 50% Air change rate: In accordance with AS1668.2 or engineered design HVAC Model Occupancy Profile
Weekdays and Weekends
Occupancy Gains (W/m²)
Time Lighting Profile (W/m²)
Equipment (W/m²)
Sensible Latent
Occupancy (m²/person)
Plant Operation
0000 - 0600 1.8 0.75 0.48 0.41 146 On
0600 - 0900 3 1.25 0.96 0.82 71.43 On
0900 - 1600 12 5 3.19 2.73 22 On
1600 - 1800 3 1.25 0.96 0.82 71.43 On 1800 - 2400 1.8 0.75 0.48 0.41 146 On
Table 22: Diagnostic / Treatment Labs 24 hour operational profile Lighting Energy Consumption Profile
Weekdays (note that there are no weekend loads in this space)
Time Lighting Profile (% of maximum)
0000 - 0600 15% 0600 - 0900 25% 0900 - 1600 100% 1600 - 1800 25% 1800 - 2400 15%
Table 23: Diagnostic / Treatment Labs 24 hour lighting energy consumption profile

Green Building Council of Australia Page 27 of 33
Meeting /Café / Library / Teaching
Note that when calculating the HVAC energy consumption of these spaces, the model should use the specified lighting densities in the HVAC Model Operational Profile. When calculating the energy consumption of the lighting in the facility, the lighting profile should be used in conjunction with the lighting densities as per the lighting specifications. Input Upper Temperature Limit: 27°C Lower Temperature Limit: 20°C Humidity Upper Limit: 50% Air change rate: In accordance with AS1668.2 or engineered design HVAC Model Occupancy Profile
Weekdays and Weekends
Occupancy Gains (W/m²)
Time Lighting Profile (W/m²)
Equipment (W/m²)
Sensible Latent
Occupancy (m²/person)
Plant Operation
0000 - 0800 0 0 0 0 0 Off
0800 - 1100 12 15 1.75 1.5 40 On
1100 - 1400 12 12 1.05 0.9 67 On
1400 - 1700 12 15 1.75 1.5 40 On
1700 - 1800 12 7.5 0.35 0.3 200 On
1800 - 2400 0 0 0 0 0 Off
Table 24: Meeting / Café / Library / Teaching operational profile Lighting Energy Consumption Profile
Weekdays (note that there are no weekend loads in this space)
Time Lighting Profile (% of maximum)
0000 - 0800 0% 0800 - 1100 100% 1100 - 1400 100% 1400 - 1700 100% 1700 - 1800 100%
Table 25: Meeting / Café / Library / Teaching lighting energy consumption profile

Green Building Council of Australia Page 28 of 33
Corridors
Note that when calculating the HVAC energy consumption of these spaces, the model should use the specified lighting densities in the HVAC Model Operational Profile. When calculating the energy consumption of the lighting in the facility, the lighting profile should be used in conjunction with the lighting densities as per the lighting specifications. Input Upper Temperature Limit: 27°C Lower Temperature Limit: 20°C Humidity Upper Limit: 50% Air change rate: In accordance with AS1668.2 or engineered design HVAC Model Occupancy Profile
Weekdays and Weekends
Occupancy Gains (W/m²)
Time Lighting Profile (W/m²)
Equipment (W/m²)
Sensible Latent
Occupancy (W/m²)
Plant Operation
0000 - 0600 2 0 3.12 2.67 22 On
0600 - 1800 8 0 3.12 2.67 22 On
1800 - 2400 2 0 3.12 2.67 22 On
Table 26: Corridors operational profile
Lighting Energy Consumption Profile
Weekdays (note that there are no weekend loads in this space)
Time Lighting Profile (% of maximum)
0000 - 0600 25% 0600 - 1800 100% 1800 - 2400 25%
Table 27: Corridors lighting energy consumption profile

Green Building Council of Australia Page 29 of 33
Back of House
Note that when calculating the HVAC energy consumption of these spaces, the model should use the specified lighting densities in the HVAC Model Operational Profile. When calculating the energy consumption of the lighting in the facility, the lighting profile should be used in conjunction with the lighting densities as per the lighting specifications. Input Upper Temperature Limit: None Lower Temperature Limit: 20°C Humidity Upper Limit: 50% Air change rate: In accordance with AS1668.2 or engineered design HVAC Model Occupancy Profile
Weekdays and Weekends
Occupancy Gains (W/m²)
Time Lighting Profile (W/m²)
Equipment (W/m²)
Sensible Latent
Occupancy (W/m²)
Plant Operation
0000 - 2400 8 5 0 0 0 On
Table 28: Back of House operational profile
Lighting Energy Consumption Profile
Weekdays (note that there are no weekend loads in this space)
Time Lighting Profile (% of maximum)
0000 -2400 100% Table 29: Back of House lighting energy consumption profile
Green Building Council of Australia Page 30 of 33
Car Parks and Loading Docks There is no specific operational or lighting profile for car parks and loading docks. This information must be determined and provided to the GBCA. Note that energy consumption from the car parks and loading docks should only be included if sub-metering of these spaces is not included.

Green Building Council of Australia Page 31 of 33
APPENDIX D: LIFT, ESCALATOR AND DOMESTIC HOT WATER ENERGY CONSUMPTION Domestic hot water energy consumption
The following table shows the hot water consumption that is to be assumed for each space type when calculating the energy consumption of a hot water system.
Occupancy (m²/person/day)
Hot Water Consumption (L/person/day)
Domestic hot water supply (L/m²/day)
Data Source AS1668.2 TRA-3 compliance
with 3 star showers
Calculated
Inpatient Accommodation 34 72 2.12
Administration / Consultation 25 1.35 0.05
Surgery (12 hours) 22 2.03 0.09
Surgery (24 hours) 22 4.05 0.18
Diagnostic / Treatment Labs (12 hours) 29 2.03 0.07
Diagnostic / Treatment Labs (24 hours) 29 4.05 0.14
Meeting / Café / Library / Teaching Spaces 40 1.35 0.03
Corridors 22.5 1.35 0.06
Back of House 0 0 0 Table 30: Benchmarks for hot water energy consumption
*The hot water supply is a fixed component. It may only be reduced if documentation is provided proving that hot water consumption is less than average. Protocol for calculating energy use
1. Calculate the Daily Domestic Hot Water Requirements multiplying the hot water
supply (L/m²/day) found in the table above by each of the space type areas (m²). 2. Calculate the Daily Domestic Hot Water Energy Requirements by determining how
much primary energy input is required to heat this amount of water to 60°C per day using the domestic hot water systems as designed for the healthcare facility. Ensure distribution and generation efficiencies are included.
3. Multiply the Daily Domestic Hot Water Energy Requirement by 365 days to calculate the Yearly Hot Water Energy Requirement. This is the figure to be entered into the Green Star Healthcare Energy Credit Calculator.
Example (yellow section to be filled in)

Green Building Council of Australia Page 32 of 33
Table 31: Example to how to calculate hot water energy consumption The figure to be entered into the Energy Calculator is 104,463. Protocol for calculating lift energy use
1. Determine the lift power ratings (both freight and customer lifts) from supplier specifications.
2. The Usage Factor is 0.75 and takes into account stopping and starting of the lift. 3. Calculate the Yearly Energy Usage. This can be done by multiplying the lift power rating
by the number of lifts, then by the usage factor and finally by 12 hours a day, 365 days a year (3285 hours/year). This is the figure to be entered into the Healthcare Energy Credit Calculator.
Example (yellow sections are those that are to be filled in)
LIFT POWER RATING (kW)
NUMBER OF LIFTS
USAGE FACTOR
HOURS IN A YEAR
YEARLY ENERGY USAGE
(kWh/year)
30kW (passenger lift)
1 0.75 3285 73912.5
50kW (passenger lift)
1 0.75 3285 123187.5
40kW (freight lift)
1 0.75 3285 98550
TOTAL YEARLY ENERGY CONSUMPTION (kWh/year) 295650 Table 32: Example of how to calculate lift energy consumption Protocol for calculating escalator and travelator energy use
1. Determine the escalator or travelator power rating from supplier specifications.
2. Determine the Usage Factor based on the presence of an escalator or travelator sensor. These sensors detect movement and start the escalator or travelator moving if someone is walking towards it. The usage factor is:
a. 0.75 if there is sensor; and b. 1 with a no sensor.
3. Calculate the Yearly Energy Usage. This can be done by multiplying the power rating
by the number of escalators or travelators, then by the usage factor and finally by 9 hours a day, 365 days a year (3285 hours/year). This is the figure to be entered into the Healthcare Energy Credit Calculator.
WATER SUPPLIED TO:
HOT WATER REQUIREMENTS (L/m²/da
y)
TOTAL AREA (m²)
HOT WATER REQUIREMENT
S (L/day)
DAILY ENERGY
REQUIRED TO HEAT
HOT WATER (kWh/day)
YEARLY ENERGY
REQUIRED TO HEAT
HOT WATER (kWh/year)
Inpatient Accommodation 2.12 2500 5300 286.2 104,463

Green Building Council of Australia Page 33 of 33
Example (yellow sections are those that are to be filled in)
ESCALATOR TRAVELATOR
POWER RATING
NUMBER OF ESCALATORS
USAGE FACTOR (sensor dependent)
HOURS IN A
YEAR
YEARLY ENERGY USAGE
(kWh/year)
8kW (without sensor)
4 1 3285 105120
8kW
(with sensor) 2 0.75 3285 39420
TOTAL YEARLY ENERGY CONSUMPTION (kWh/year) 144540
Table 33: Example of how to calculate escalator or travelator energy consumption


![Demonstration of GestureCalc: An Eyes-Free Calculator for ...bindita/papers/gesturecalc_assets19_demo.pdfnumeric input) [2], and BrailleTap (Braille-based gesture calculator) [1]](https://img.dokumen.tips/doc/110x75/5e434446a0a6657af40c10a7/demonstration-of-gesturecalc-an-eyes-free-calculator-for-binditapapersgesturecalcassets19demopdf.jpg)


