Embed Size (px)
Citation preview
Preparatory Survey on Chittagong Area
Coal Fired Power Plant Development Project in Bangladesh
Final Report
on
Power Plant / Port /
Transmission Line / Access Road /
Execution Survey of Natural Condition
Book 5
For Publishing
March 2015
Japan International Cooperation Agency (JICA)
Tokyo Electric Power Services Co., LTD
Tokyo Electric Power Co., LTD
Ministry of Power, Energy and Mineral Resources
People's Republic of Bangladesh


Preparatory Survey on Chittagong Area Coal Fired Power Plant Development Project in Bangladesh Final Report on Power Plant / Port / Transmission Line / Access Road / Execution Survey of Natural Condition
i
Table of Contents
Table of Contents
Page
Book 1
Chapter 1 Preface
Chapter 2 Basic Concept of the Project
Chapter 3 Current Situation of Bangladesh and Necessity, Justification of the Project
Chapter 4 Selection of the Suitable Site
Chapter 5 Site Conditions
Chapter 6 Fuel Supply Plan
Chapter 7 Conceptual Design
Chapter 8 Study on Civil and Construction Work
Chapter 9 Power System Analysis and Transmission Line/Substation Plan
Chapter 10 Project Construction Plan
Chapter 11 Project Implementation System
Chapter 12 Management of New Power Generation Company
Chapter 13 Operation and Maintenance Management
Chapter 14 Economic and Financial Analysis
Book 2
Chapter 15 Environmental and Social Consideration
Book 3
Chapter 16 Plan and Design of Access Road
Chapter 17 Execution Survey of Natural Condition

Preparatory Survey on Chittagong Area Coal Fired Power Plant Development Project in Bangladesh Final Report on Power Plant / Port / Transmission Line / Access Road / Execution Survey of Natural Condition
ii
Book 4
Appendices for
Chapter 5
Chapter 10
Chapter 12
Chapter 15
Book 5
Appendices
Chapter 16 Plan and Design of Access Road
Appendix C-16.3-1 Traffic Count Survey
Appendix C-16.3-2 Topographic Survey
Appendix C-16.3-3 Geotechnical Survey and Laboratory Test
Appendix C-16.3-4 Details of Preliminary Analysis of Soft Soil Ground
Appendix C-16.3-5 Dynamic Cone Penetration (DCP) Test
Appendix C-16.3-6 Hydrological and morphological analysis
Appendix C-16.3-7 Drawings
Chapter 17 Execution Survey of Natural Condition
Appendix-C-17-01 Drilling Logs
Appendix-C-17-02 Results of Swedish Weight Soundings Logs
Appendix-C-17-03 Results of Laboratory Tests
Appendix-C-17-04 Reference Data of National Bench Mark
Appendix C-17-05 Entry Permission
Appendix-C16.3-1
Traffic Count Survey

1
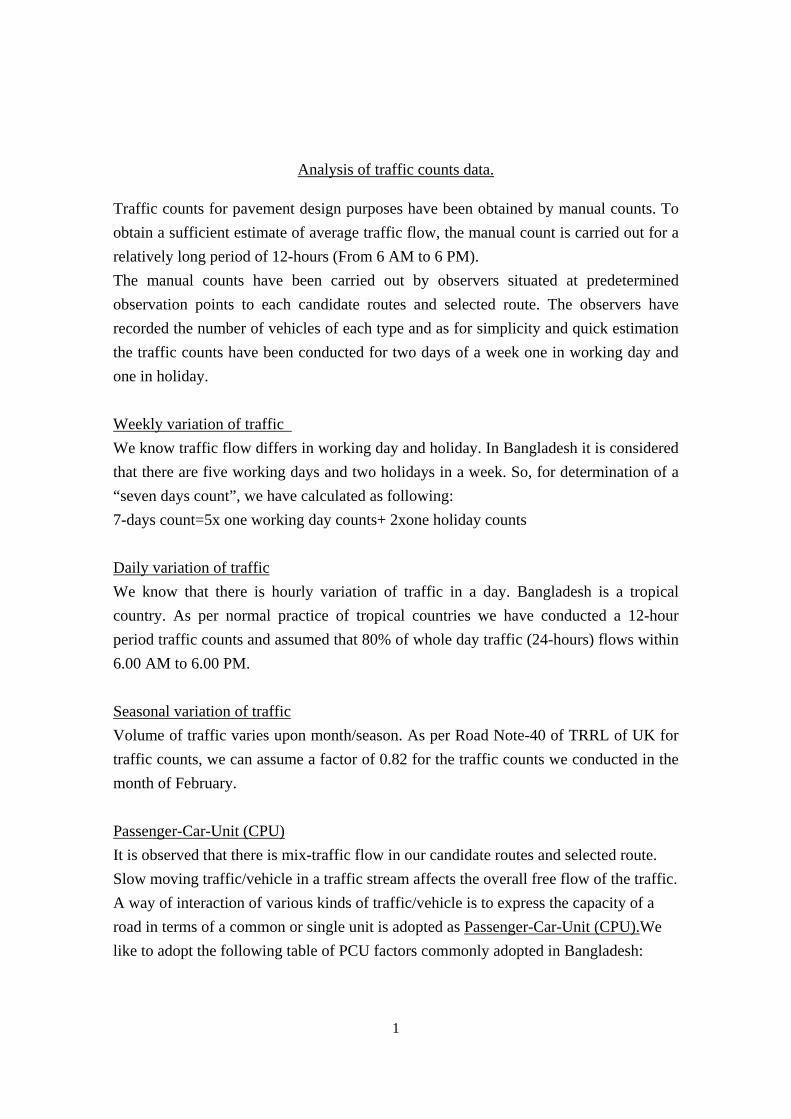
Analysis of traffic counts data.
Traffic counts for pavement design purposes have been obtained by manual counts. To
obtain a sufficient estimate of average traffic flow, the manual count is carried out for a
relatively long period of 12-hours (From 6 AM to 6 PM).
The manual counts have been carried out by observers situated at predetermined
observation points to each candidate routes and selected route. The observers have
recorded the number of vehicles of each type and as for simplicity and quick estimation
the traffic counts have been conducted for two days of a week one in working day and
one in holiday.
Weekly variation of traffic
We know traffic flow differs in working day and holiday. In Bangladesh it is considered
that there are five working days and two holidays in a week. So, for determination of a
“seven days count”, we have calculated as following:
7-days count=5x one working day counts+ 2xone holiday counts
Daily variation of traffic
We know that there is hourly variation of traffic in a day. Bangladesh is a tropical
country. As per normal practice of tropical countries we have conducted a 12-hour
period traffic counts and assumed that 80% of whole day traffic (24-hours) flows within
6.00 AM to 6.00 PM.
Seasonal variation of traffic
Volume of traffic varies upon month/season. As per Road Note-40 of TRRL of UK for
traffic counts, we can assume a factor of 0.82 for the traffic counts we conducted in the
month of February.
Passenger-Car-Unit (CPU)
It is observed that there is mix-traffic flow in our candidate routes and selected route.
Slow moving traffic/vehicle in a traffic stream affects the overall free flow of the traffic.
A way of interaction of various kinds of traffic/vehicle is to express the capacity of a
road in terms of a common or single unit is adopted as Passenger-Car-Unit (CPU).We
like to adopt the following table of PCU factors commonly adopted in Bangladesh:
2
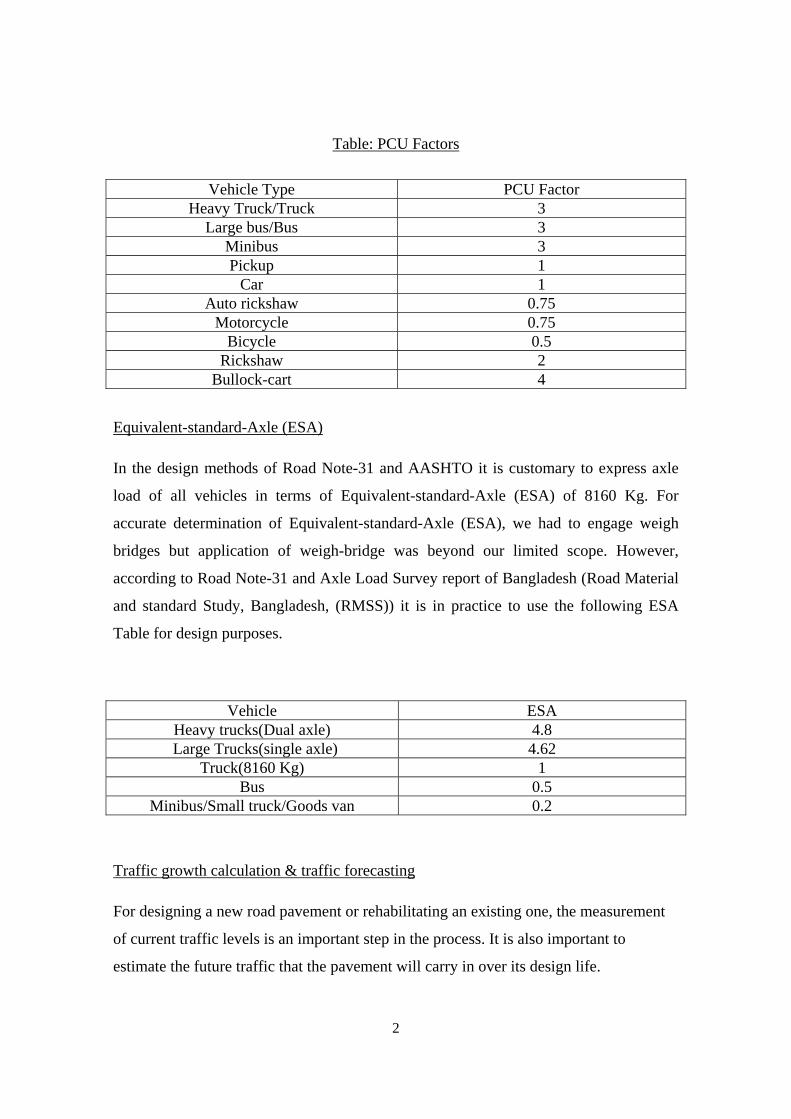
Table: PCU Factors
Vehicle Type PCU Factor
Heavy Truck/Truck 3 Large bus/Bus 3
Minibus 3 Pickup 1
Car 1 Auto rickshaw 0.75
Motorcycle 0.75 Bicycle 0.5
Rickshaw 2 Bullock-cart 4
Equivalent-standard-Axle (ESA)
In the design methods of Road Note-31 and AASHTO it is customary to express axle
load of all vehicles in terms of Equivalent-standard-Axle (ESA) of 8160 Kg. For
accurate determination of Equivalent-standard-Axle (ESA), we had to engage weigh
bridges but application of weigh-bridge was beyond our limited scope. However,
according to Road Note-31 and Axle Load Survey report of Bangladesh (Road Material
and standard Study, Bangladesh, (RMSS)) it is in practice to use the following ESA
Table for design purposes.
Vehicle ESA Heavy trucks(Dual axle) 4.8
Large Trucks(single axle) 4.62 Truck(8160 Kg) 1
Bus 0.5 Minibus/Small truck/Goods van 0.2
Traffic growth calculation & traffic forecasting
For designing a new road pavement or rehabilitating an existing one, the measurement
of current traffic levels is an important step in the process. It is also important to
estimate the future traffic that the pavement will carry in over its design life.
3
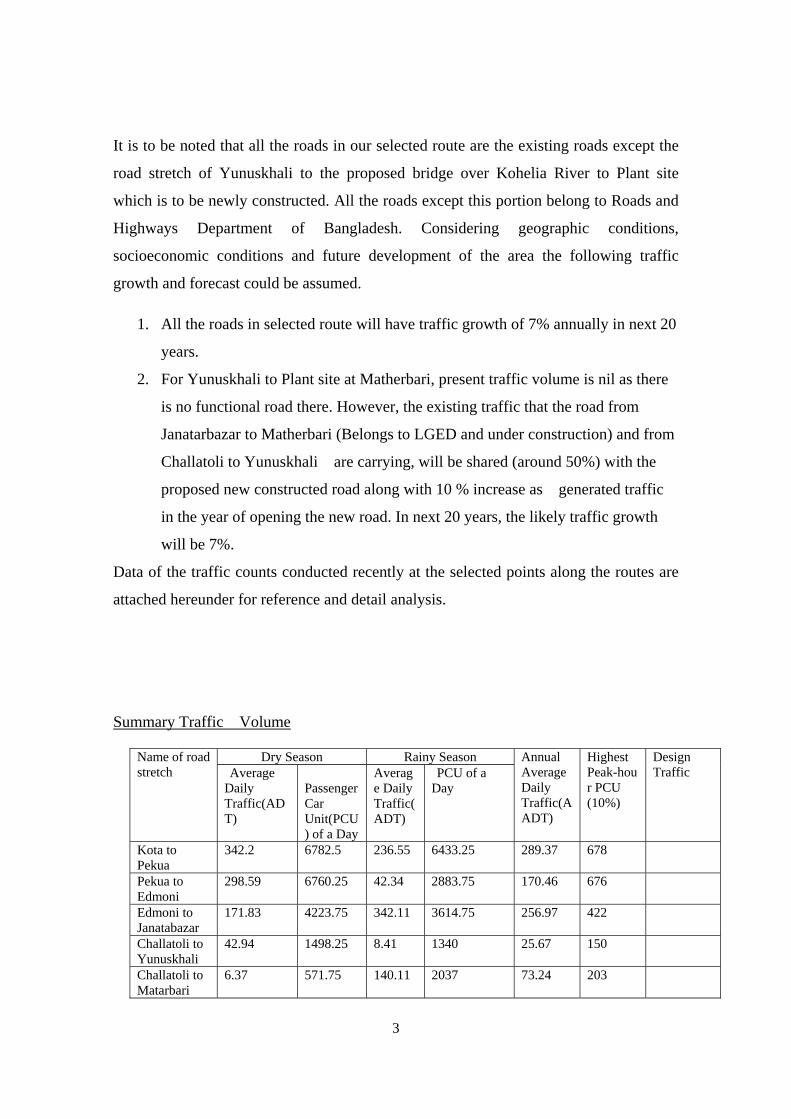
It is to be noted that all the roads in our selected route are the existing roads except the
road stretch of Yunuskhali to the proposed bridge over Kohelia River to Plant site
which is to be newly constructed. All the roads except this portion belong to Roads and
Highways Department of Bangladesh. Considering geographic conditions,
socioeconomic conditions and future development of the area the following traffic
growth and forecast could be assumed.
1. All the roads in selected route will have traffic growth of 7% annually in next 20
years.
2. For Yunuskhali to Plant site at Matherbari, present traffic volume is nil as there
is no functional road there. However, the existing traffic that the road from
Janatarbazar to Matherbari (Belongs to LGED and under construction) and from
Challatoli to Yunuskhali are carrying, will be shared (around 50%) with the
proposed new constructed road along with 10 % increase as generated traffic
in the year of opening the new road. In next 20 years, the likely traffic growth
will be 7%.
Data of the traffic counts conducted recently at the selected points along the routes are
attached hereunder for reference and detail analysis.
Summary Traffic Volume
Name of road stretch
Dry Season Rainy Season Annual Average Daily Traffic(AADT)
Highest Peak-hour PCU (10%)
Design Traffic Average
Daily Traffic(ADT)
Passenger Car Unit(PCU) of a Day
Average Daily Traffic(ADT)
PCU of a Day
Kota to Pekua
342.2 6782.5 236.55 6433.25 289.37 678
Pekua to Edmoni
298.59 6760.25 42.34 2883.75 170.46 676
Edmoni to Janatabazar
171.83 4223.75 342.11 3614.75 256.97 422
Challatoli to Yunuskhali
42.94 1498.25 8.41 1340 25.67 150
Challatoli to Matarbari
6.37 571.75 140.11 2037 73.24 203

4
Traffic Volume for the new road from Yunuskhali to Matarbari Power-plant:
1. Existing traffic is nil as there is no functional road there. People of Matarbari
union and Dhalghata union use Challatoli-Matarbari road and
Challatoli/Janatabazar to Moheskhali road via Yunuskhali. It could be assumed
that 50% of the existing traffic of these two roads will be diverted to this new
road after opening. So, total traffic of the road at the time of opening could be
calculated as following:-
1. Existing traffic= 0.00 ESL
2. Diverted traffic= (73.24+25.67) X 50%= 49.45 ESL and (1340+2037) X50%
PCU=1688.5 PCU.
3. Generated traffic: Soon after opening the road, some heavy trucks will be
plying to transport materials for construction of the proposed power-plant as
well as for transporting salt and fish produced in the area. Following vehicles
are likely to ply daily at the opening period :-
Vehicle ESA Number Total ESA Total PCUHeavy trucks(Dual axle) 4.8 5 24 15
Large Trucks(single axle) 4.62 7 32.34 21 Truck(8160 Kg) 1 5 5 15
Bus 0.5 6 3 9 Minibus/Small truck/Goods van 0.2 10 2 10
Total 66.34 70
So, the total average annual daily traffic (AADT) after completion of the road will be as
following:-
Traffic after completion of the road construction in the year of 2020=49.45(1+.07) ^7=79.40
ESA (AADT).Also there will be generated traffic, as above, 66.34 ESA (AADT).
So, total traffic in the year of 2020(The year of opening) = 0+79.4+66.34= 145.79 ESA
(AADT).

5
ID
Wo
rkin
gd
ay/H
oll
yday
Sta
tio
n/R
oad
Nam
e
Lo
cati
on
Dir
ecti
on
Dat
e
Per
iod
Sta
rt T
ime
(hh
mm
)
Per
iod
En
d T
ime
(hh
mm
)
Hea
vy T
ruck
/T
rail
er /
Co
nta
iner
/ T
ruck
3-a
xle
Med
ium
Tru
ck /
Tru
ck L
orr
y /
Tru
ck 2
-axl
e
Sm
all
Tru
ck /
Pic
kup
/ S
mal
l V
an
Lar
ge
Bu
s
Med
ium
Bu
s /
Min
iB
us
Mic
ro B
us
Uti
lity
/Jee
p/
Lag
un
a /
Max
i/H
aule
r/ T
emp
o
Car
/ S
tati
on
Wag
on
/ T
axi
Cab
Au
to R
icks
wa/
CN
G /
Mis
hu
k /
Au
to T
emp
o
Mo
tor
Cyc
le
Bic
ycle
Ric
ksh
aw /
Ric
ksh
aw V
an
An
imal
/ P
ush
Car
t
ES
A
AA
DT
PC
U
1 2 PekuaFrom Ekota to
Pekua2013/11/2 600 1800 0 169 226 37 278 207 144 0 429 230 139 527 0
2 2 PekuaFrom Pekua to
Ekota2013/11/2 600 1800 0 99 204 2 108 140 310 73 533 302 299 503 0
Total 0 268 430 39 386 347 454 73 962 532 438 1030 0 439 6782.5
1 2 PekuaFrom Ekota to
Pekua2013/8/2 600 1800 0 94 131 0 73 94 244 3 548 353 55 617 1
2 2 PekuaFrom Pekua to
Ekota8/2/2013. 600 1800 2 45 155 13 94 145 85 108 557 320 200 514 4
Total 2 139 286 13 167 239 329 111 1105 673 255 1131 5 247.2 56712 407 716 52 553 586 783 184 2067 1205 693 2161 5
384.2
Ho
llyd
ay
Grand Total of Hollyday and Working day[2 Days]
Consulting Services for Planning and Design of Access Road for Preparatory Survey for Chittagong Area Coal Fired Power Plant Development Project in Bangladesh [Jica Study]BETS Consulting Services Ltd.
Traffic Count Survey-
Wo
rkin
gd
ay
ID
Wo
rkin
gd
ay/H
oll
yday
Sta
tio
n/R
oad
Nam
e
Lo
cati
on
Dir
ecti
on
Dat
e
Per
iod
Sta
rt T
ime
(hh
mm
)
Per
iod
En
d T
ime
(hh
mm
)
Hea
vy T
ruck
/T
rail
er /
Co
nta
iner
/ T
ruck
3-a
xle
Med
ium
Tru
ck /
Tru
ck L
orr
y /
Tru
ck 2
-axl
e
Sm
all
Tru
ck /
Pic
kup
/ S
mal
l V
an
Lar
ge
Bu
s
Med
ium
Bu
s /
Min
iB
us
Mic
ro B
us
Uti
lity
/Jee
p/
Lag
un
a /
Max
i/H
aule
r/ T
emp
o
Car
/ S
tati
on
Wag
on
/ T
axi
Cab
Au
to R
icks
wa/
CN
G /
Mis
hu
k /
Au
to T
emp
o
Mo
tor
Cyc
le
Bic
ycle
Ric
ksh
aw /
Ric
ksh
aw V
an
An
imal
/ P
ush
Car
t
ES
A
AA
DT
PC
U
1 2 PekuaFrom Pekua to
Edmoni2013/11/2 600 1800 1 144 221 16 181 157 218 27 491 234 185 505 0
2 2 PekuaFrom Edmoni to
Pekua2013/11/2 600 1800 0 51 177 3 46 173 517 137 637 419 506 558 0
Total 1 195 398 19 227 330 735 164 1128 653 691 1063 0 331.3 6760.25
1 2 PekuaFrom Pekua to
Edmoni2013/8/2 600 1800 0 87 184 4 96 136 179 110 529 265 101 504 0
2 2 PekuaFrom Edmoni to
Pekua8/2/2013. 600 1800 4 10 148 8 9 60 21 30 577 431 430 575 14
Total 4 97 332 12 105 196 200 140 1106 696 531 1079 14 216.8 53535 292 730 31 332 526 935 304 2234 1349 1222 2142 14
298.58571
Ho
llyd
ay
Grand Total of Hollyday and Working day[2 Days]
Consulting Services for Planning and Design of Access Road for Preparatory Survey for Chittagong Area Coal Fired Power Plant Development Project in Bangladesh [Jica Study]BETS Consulting Services Ltd.
Traffic Count Survey-
Wo
rkin
gd
ay

6
ID
Workingday/H
olly
day
Station
/Road
Nam
e
Location
Direction
Date
Period Start Tim
e
(hhmm)
Period End Tim
e
(hhmm)
Heavy Truck /
Trailer / Container
/ Truck 3‐axle
Medium Truck /
Truck Lorry /
Truck 2‐axle
Small Truck /
Pickup / Small
Van
Large Bus
Medium Bus /
Mini B
us
Micro Bus
Utility/Jeep/
Laguna / Maxi/
Hauler/ Tempo
Car / Station
Wagon / Taxi Cab
Auto Rickswa/
CNG / M
ishuk /
Auto Tempo
Motor Cycle
Bicycle
Rickshaw
/
Rickshaw
Van
Anim
al / Push
Cart
ES
A
AA
DT
PCU
1 3Edmoni
From Edmoni toJanatabazar
2013/10/2 600 1800 0 55 83 17 59 83 400 60 672 295 83 278 3
2 3Edmoni
FromJanatabazar toEdmoni
2013/10/2 600 1800 0 52 92 6 47 42 360 11 656 234 117 162 0
Total 0 107 175 23 106 125 760 71 1328 529 200 440 3 167.8 4223.75
1 3 EdmoniFrom Edmoni toJanatabazar
23/2/2013 600 1800 0 55 111 2 25 9 140 0 339 151 0 159 0
2 3 Edmoni
FromJanatabazar toEdmoni
23/2/2013 600 1800 1 60 128 0 31 17 197 0 339 151 0 159 0
Total 1 115 239 2 56 26 337 0 678 302 0 318 0 181.9 24951 222 414 25 162 151 1097 71 2006 831 200 758 3
171.8286
Hollyday
Grand Total of Hollyday and Working day[2 Days]
Consulting Services for Planning and Design of Access Road for Preparatory Survey for Chittagong Area Coal Fired Power Plant Development Project in Bangladesh [Jica Study]BETS Consulting Services Ltd.
Traffic Count Survey-
Workingday
ID
Wo
rkin
gd
ay/H
oll
yday
Sta
tio
n/R
oad
Nam
e
Lo
cati
on
Dir
ecti
on
Dat
e
Per
iod
Sta
rt T
ime
(hh
mm
)
Per
iod
En
d T
ime
(hh
mm
)
Hea
vy T
ruck
/T
rail
er /
Co
nta
iner
/ T
ruck
3-a
xle
Med
ium
Tru
ck /
Tru
ck L
orr
y /
Tru
ck 2
-axl
e
Sm
all
Tru
ck /
Pic
kup
/ S
mal
l V
an
Lar
ge
Bu
s
Med
ium
Bu
s /
Min
iB
us
Mic
ro B
us
Uti
lity
/Jee
p/
Lag
un
a /
Max
i/H
aule
r/ T
emp
o
Car
/ S
tati
on
Wag
on
/ T
axi
Cab
Au
to R
icks
wa/
CN
G /
Mis
hu
k /
Au
to T
emp
o
Mo
tor
Cyc
le
Bic
ycle
Ric
ksh
aw /
Ric
ksh
aw V
an
An
imal
/ P
ush
Car
t
ES
A
AA
DT
PC
U
15
Matherbaribridge
From MatharbariBridge ToJanatabazar
2013/10/2 600 1800 0 0 16 0 0 16 15 5 231 74 0 0 0
2
5Matherbaribridge
FromJanatabazar toMatharbaribridge
2013/10/2 600 1800 0 0 19 0 0 1 8 3 214 102 22 6 0
Total 0 0 35 0 0 17 23 8 445 176 22 6 0 7 571.75
1 5Matherbaribridge
From MatharbariBridge ToJanatabazar
23/2/2013 600 1800 0 0 6 0 0 1 0 0 126 19 0 82 0
2 5Matherbaribridge
FromJanatabazar toMatharbaribridge
23/2/2013 600 1800 0 0 18 0 0 1 0 0 157 25 0 102 0
Total 0 0 24 0 0 2 0 0 283 44 0 184 0 4.8 639.250 0 59 0 0 19 23 8 728 220 22 190 0
6.3714286
Ho
llyd
ay
Grand Total of Hollyday and Working day[2 Days]
Consulting Services for Planning and Design of Access Road for Preparatory Survey for Chittagong Area Coal Fired Power Plant Development Project in Bangladesh [Jica Study]BETS Consulting Services Ltd.
Traffic Count Survey-
Wo
rkin
gd
ay

7
ID
Wo
rkin
gd
ay/H
oll
yday
Sta
tio
n/R
oad
Nam
e
Lo
cati
on
Dir
ecti
on
Dat
e
Per
iod
Sta
rt T
ime
(hh
mm
)
Per
iod
En
d T
ime
(hh
mm
)
Hea
vy T
ruck
/T
rail
er /
Co
nta
iner
/ T
ruck
3-a
xle
Med
ium
Tru
ck /
Tru
ck L
orr
y /
Tru
ck 2
-axl
e
Sm
all
Tru
ck /
Pic
kup
/ S
mal
l V
an
Lar
ge
Bu
s
Med
ium
Bu
s /
Min
iB
us
Mic
ro B
us
Uti
lity
/Jee
p/
Lag
un
a /
Max
i/H
aule
r/ T
emp
o
Car
/ S
tati
on
Wag
on
/ T
axi
Cab
Au
to R
icks
wa/
CN
G /
Mis
hu
k /
Au
to T
emp
o
Mo
tor
Cyc
le
Bic
ycle
Ric
ksh
aw /
Ric
ksh
aw V
an
An
imal
/ P
ush
Car
t
ES
A
AA
DT
PC
U
1 7 JanatabazarFrom JanataBazar toEunuskhali
25/2/2013 600 1800 0 15 52 0 27 1 92 0 362 133 1 31 0
2 7 JanatabazarFrom Eunuskhalito Janata Bazar
25/2/2013 600 1800 0 14 45 0 26 8 171 0 230 36 20 120 0
Total 0 29 97 0 53 9 263 0 592 169 21 151 0 59 1498.25
1 7 JanatabazarFrom JanataBazar toEunuskhali
23/2/2013 600 1800 0 0 42 0 25 11 53 0 161 49 0 29 0
2 7 JanatabazarFrom Eunuskhalito Janata Bazar
23/2/2013 600 1800 0 0 48 0 25 2 48 0 139 24 0 26 0
Total 0 0 90 0 50 13 101 0 300 73 0 55 0 28 743.750 29 187 0 103 22 364 0 892 242 21 206 0
42.942857
Ho
llyd
ay
Grand Total of Hollyday and Working day[2 Days]
Consulting Services for Planning and Design of Access Road for Preparatory Survey for Chittagong Area Coal Fired Power Plant Development Project in Bangladesh [Jica Study]BETS Consulting Services Ltd.
Traffic Count Survey-
Wo
rkin
gd
ay
8
ID
Workingday/Hollyday
Station
/Road
Nam
e
Location
Direction
Date
Period Start Tim
e (hhmm)
Period End Tim
e (hhmm)
Heavy Truck / Trailer / Container /
Truck 3‐axle
Medium Truck / Truck Lorry / Truck 2‐
axle
Small Truck / Pickup / Small V
an
Large Bus
Medium Bus / Mini Bus
Micro Bus
Utility/Jeep/ Laguna / Maxi/ Hauler/
Tempo
Car / Station W
agon / Taxi Cab
Auto Rickswa/ CNG / M
ishuk / Auto
Tempo
Motor Cycle
Bicycle
Rickshaw
/ Rickshaw
Van
Anim
al / Push Cart
ESA
AADT
PCU
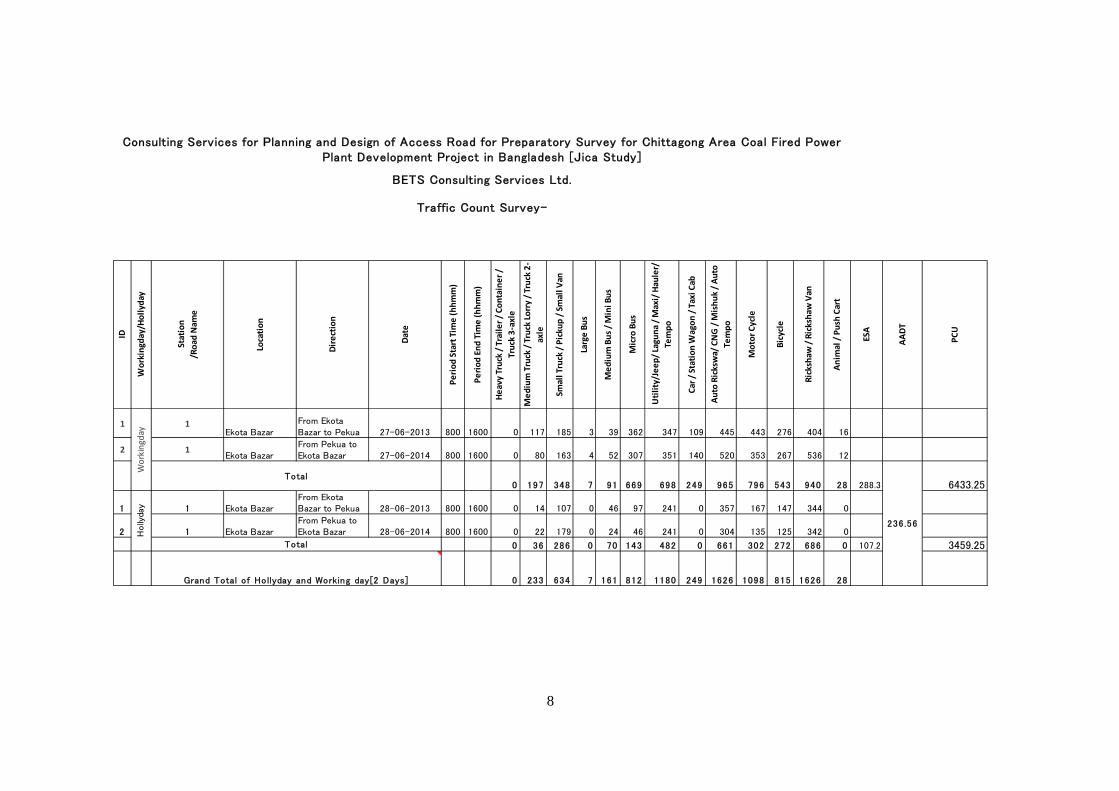
1 1Ekota Bazar
From EkotaBazar to Pekua 27-06-2013 800 1600 0 117 185 3 39 362 347 109 445 443 276 404 16
2 1Ekota Bazar
From Pekua toEkota Bazar 27-06-2014 800 1600 0 80 163 4 52 307 351 140 520 353 267 536 12
0 197 348 7 91 669 698 249 965 796 543 940 28 288.3 6433.25
1 1 Ekota BazarFrom EkotaBazar to Pekua 28-06-2013 800 1600 0 14 107 0 46 97 241 0 357 167 147 344 0
2 1 Ekota BazarFrom Pekua toEkota Bazar 28-06-2014 800 1600 0 22 179 0 24 46 241 0 304 135 125 342 0
0 36 286 0 70 143 482 0 661 302 272 686 0 107.2 3459.25
0 233 634 7 161 812 1180 249 1626 1098 815 1626 28
236.56
Holly
day
Total
Grand Total of Hollyday and Working day[2 Days]
Consulting Services for Planning and Design of Access Road for Preparatory Survey for Chittagong Area Coal Fired PowerPlant Development Project in Bangladesh [Jica Study]
BETS Consulting Services Ltd.
Traffic Count Survey-
Workingday
Total

9
ID
Workingday/Hollyday
Station
/Road
Nam
e
Location
Direction
Date
Period Start Tim
e (hhmm)
Period End Tim
e (hhmm)
Heavy Truck / Trailer / Container /
Truck 3‐axle
Medium Truck / Truck Lorry / Truck 2‐
axle
Small Truck / Pickup / Small V
an
Large Bus
Medium Bus / Mini Bus
Micro Bus
Utility/Jeep/ Laguna / Maxi/ Hauler/
Tempo
Car / Station W
a gon / Taxi Cab
Auto Rickswa/ CNG / M
ishuk / Auto
Tempo
Motor Cycle
Bicycle
Rickshaw
/ Rickshaw
Van
Anim
al / Push Cart
ESA
AADT
PCU
1 2Pekua Bazar
From Eidmoni toPekua 27-06-2013 800 1600 0 14 99 0 62 62 107 0 217 146 198 207 0
2 2Pekua Bazar
From Pekua toEidmoni 27-06-2014 800 1600 0 2 11 0 4 21 91 16 343 167 130 479 0
0 16 110 0 66 83 198 16 560 313 328 686 0 51.2 2843.75
1 2 Pekua BazarFrom Eidmoni toPekua 28-06-2013 800 1600 0 1 9 0 0 15 53 16 220 186 160 489 1
2 2 Pekua BazarFrom Pekua toEidmoni 28-06-2014 800 1600 0 3 42 0 30 24 121 0 214 45 54 146 5
0 4 51 0 30 39 174 16 434 231 214 635 6 20.2 2281.75
0 20 161 0 96 122 372 32 994 544 542 1321 6
42.343
Holly
day
Total
Grand Total of Hollyday and Working day[2 Days]
Consulting Services for Planning and Design of Access Road for Preparatory Survey for Chittagong Area Coal Fired PowerPlant Development Project in Bangladesh [Jica Study]
BETS Consulting Services Ltd.
Traffic Count Survey-
Workingday
Total

10
ID
Workingday/Hollyday
Station
/Road
Nam
e
Location
Direction
Date
Period Start Tim
e (hhmm)
Period End Tim
e (hhmm)
Heavy Truck / Trailer / Container /
Truck 3‐axle
Medium Truck / Truck Lorry / Truck 2‐
axle
Small Truck / Pickup / Small V
an
Large Bus
Medium Bus / Mini Bus
Micro Bus
Utility/Jeep/ Laguna / Maxi/ Hauler/
Tempo
Car / Station W
agon / Taxi Cab
Auto Rickswa/ CNG / M
ishuk / Auto
Tempo
Motor Cycle
Bicycle
Rickshaw
/ Rickshaw
Van
Anim
al / Push Cart
ESA
AADT
PCU
1 4Yunuskhali
From Challatoli toYunuskhali 27-06-2013 800 1600 1 0 9 0 3 6 122 0 250 27 32 100 2
2 4Yunuskhali
From Yunuskhali toChallatoli 27-06-2014 800 1600 0 0 9 0 0 0 90 0 348 65 117 146 0
1 0 18 0 3 6 212 0 598 92 149 246 2 11.7 1340
1 4 YunuskhaliFrom Challatoli toYunuskhali 28-06-2013 800 1600 0 0 0 0 0 0 65 0 133 18 7 125 0
2 4 YunuskhaliFrom Yunuskhali toChallatoli 28-06-2014 800 1600 0 0 1 0 0 30 115 0 150 18 26 163 0
0 0 1 0 0 30 180 0 283 36 33 288 0 0.2 1042.75
1 0 19 0 3 36 392 0 881 128 182 534 2
8.41
Holly
day
Total
Grand Total of Hollyday and Working day[2Days]
Consulting Services for Planning and Design of Access Road for Preparatory Survey for Chittagong Area CoalFired Power Plant Development Project in Bangladesh [Jica Study]
BETS Consulting Services Ltd.
Traffic Count Survey-
Workingday
Total

11
ID
Workingd
ay/Hollyday
Station
/Road
Nam
e
Location
Direction
Date
Period Start Tim
e (hhmm)
Period End Tim
e (hhmm)
Heavy Truck / Trailer / Container /
Truck 3‐axle
Medium Truck / Truck Lorry / Truck 2‐
axle
Small Truck / Pickup / Small V
an
Large Bus
Medium Bus / Mini Bus
Micro Bus
Utility/Jeep/ Laguna / Maxi/ Hauler/
Tempo
Car / Station W
agon / Taxi Cab
Aut o Rickswa/ CNG / M
ishuk / Auto
Tempo
Motor Cycle
Bicycle
Rickshaw
/ Rickshaw
Van
Anim
al / Push Cart
ESA
AADT
PCU
1 5Materbari
From Materbari toChallatoli 27-06-2013 800 1600 0 32 128 0 0 0 252 0 247 54 37 74 0
2 5Materbari
From Challatoli toMatarbari 27-06-2014 800 1600 4 80 129 2 4 19 92 0 186 147 138 170 0
4 112 257 2 4 19 344 0 433 201 175 244 0 195.2 2037
1 5 Materbari From Materbari toChallatoli 28-06-2013 800 1600 0 0 3 0 0 12 60 0 63 13 20 23 2
2 5 Materbari From Challatoli toMatarbari 28-06-2014 800 1600 0 0 9 0 0 6 48 0 61 24 18 21 1
0 0 12 0 0 18 108 0 124 37 38 44 3 2.4 377.75
4 112 269 2 4 37 452 0 557 238 213 288 3
140.11
Holly
day
Total
Grand Total of Hollyday and Working day[2Days]
Consulting Services for Planning and Design of Access Road for Preparatory Survey for Chittagong Area CoalFired Power Plant Development Project in Bangladesh [Jica Study]
BETS Consulting Services Ltd.
Traffic Count Survey-
Workingday
Total
12
ID
Workingday/Hollyday
Station
/Road
Nam
e
Location
Direction
Date
Period Start Tim
e (hhmm)
Period End Tim
e (hhmm)
Heavy Truck / Trailer / Container /
Truck 3‐axle
Medium Truck / Truck Lorry / Truck 2‐
axle
Small Truck / Pickup / Small V
an
Large Bus
Medium Bus / Mini Bus
Micro Bus
Utility/Jeep/ Laguna / Maxi/ Hauler/
Tempo
Car / Station W
agon / Taxi Ca b
Auto Rickswa/ CNG / M
ishuk / Auto
Tempo
Motor Cycle
Bicycle
Rickshaw
/ Rickshaw
Van
Anim
al / Push Cart
ESA
AADT
PCU
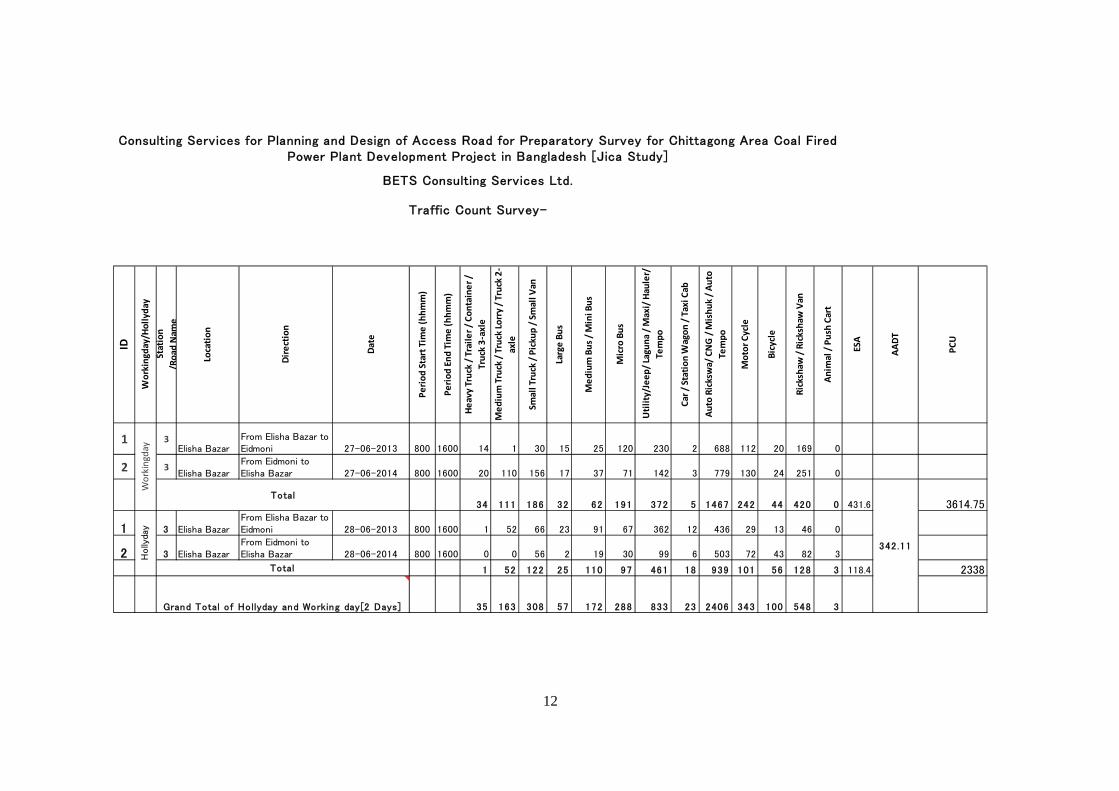
1 3Elisha Bazar
From Elisha Bazar toEidmoni 27-06-2013 800 1600 14 1 30 15 25 120 230 2 688 112 20 169 0
2 3Elisha Bazar
From Eidmoni toElisha Bazar 27-06-2014 800 1600 20 110 156 17 37 71 142 3 779 130 24 251 0
34 111 186 32 62 191 372 5 1467 242 44 420 0 431.6 3614.75
1 3 Elisha BazarFrom Elisha Bazar toEidmoni 28-06-2013 800 1600 1 52 66 23 91 67 362 12 436 29 13 46 0
2 3 Elisha BazarFrom Eidmoni toElisha Bazar 28-06-2014 800 1600 0 0 56 2 19 30 99 6 503 72 43 82 3
1 52 122 25 110 97 461 18 939 101 56 128 3 118.4 2338
35 163 308 57 172 288 833 23 2406 343 100 548 3
342.11
Workingday
Grand Total of Hollyday and Working day[2 Days]
Holly
day
Consulting Services for Planning and Design of Access Road for Preparatory Survey for Chittagong Area Coal FiredPower Plant Development Project in Bangladesh [Jica Study]
BETS Consulting Services Ltd.
Traffic Count Survey-
Total
Total

Appendix-C16.3-2
Topographic Survey

1
2

3
4
5

6
7

8
9
10

11
12
13

14
15

16
Appendix-C16.3-3
Geotechnical Survey and Laboratory Test

1
2

3
4

5

6
7
8

9

10

11
12

13

14
15
16
17

18

19

20

21
22
23
24

25
26

27

28

29
30
31

32

33
34
35

36
37

38
39
40
41

42

43
44

45
46

47

48

49
50

51
52

53
54

55

56
57

58
59
60
61

62
63

64
65

66
67

68

69

70
71

72
73

74

75

76
77

78
79
80

81
82
83
84
85

86

87
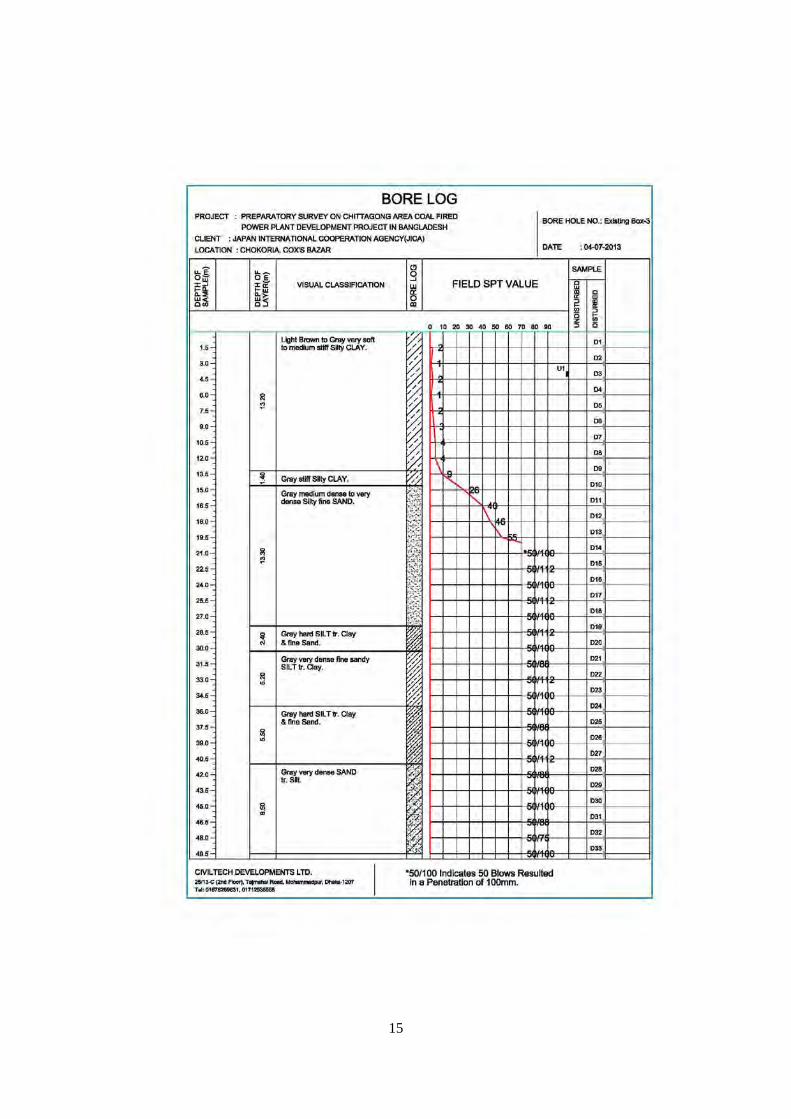
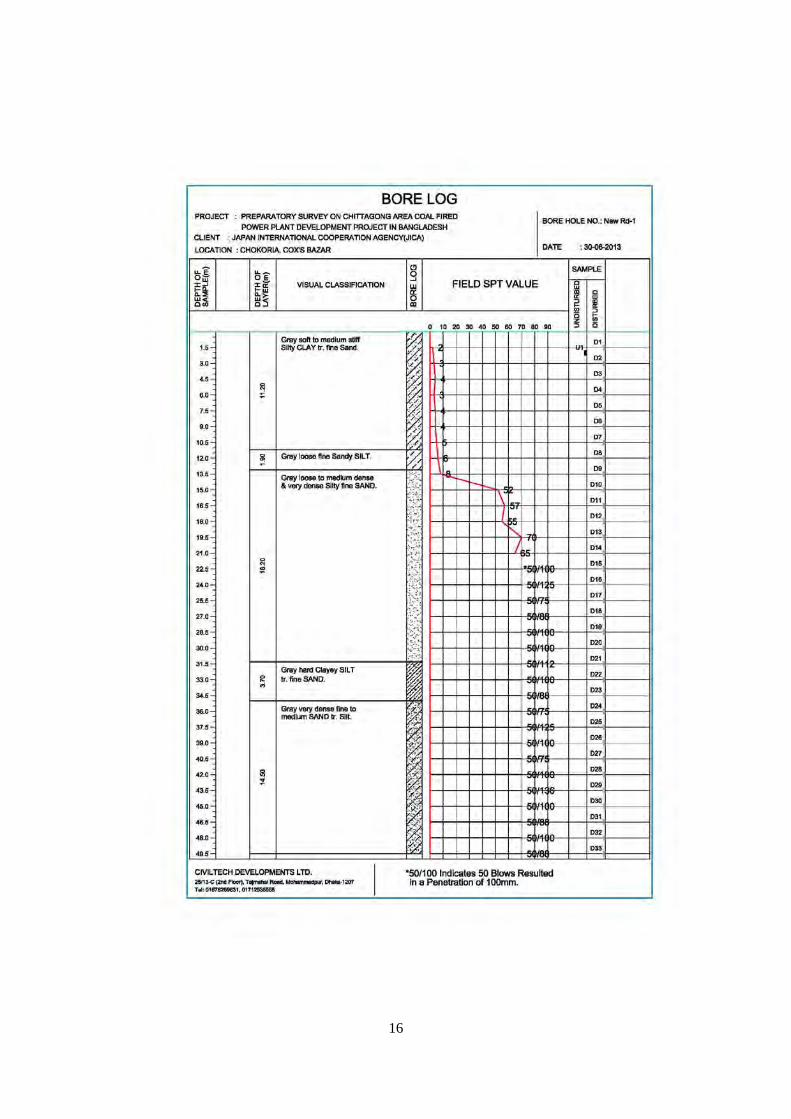
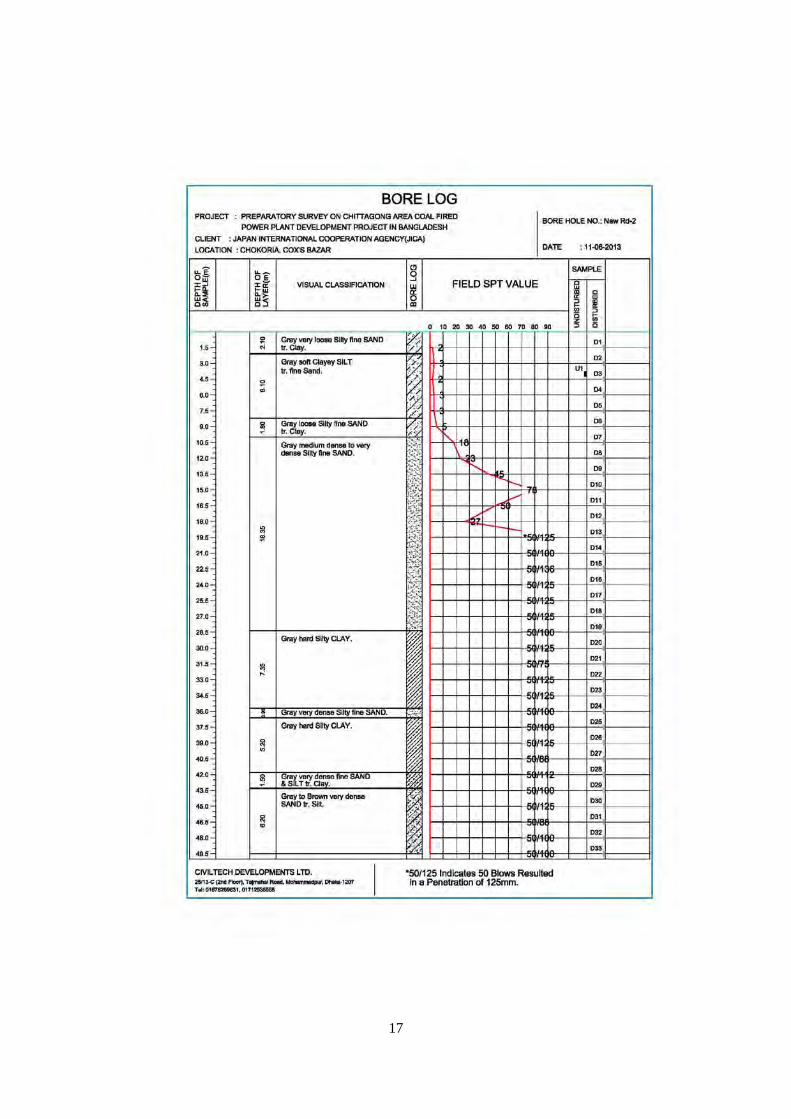
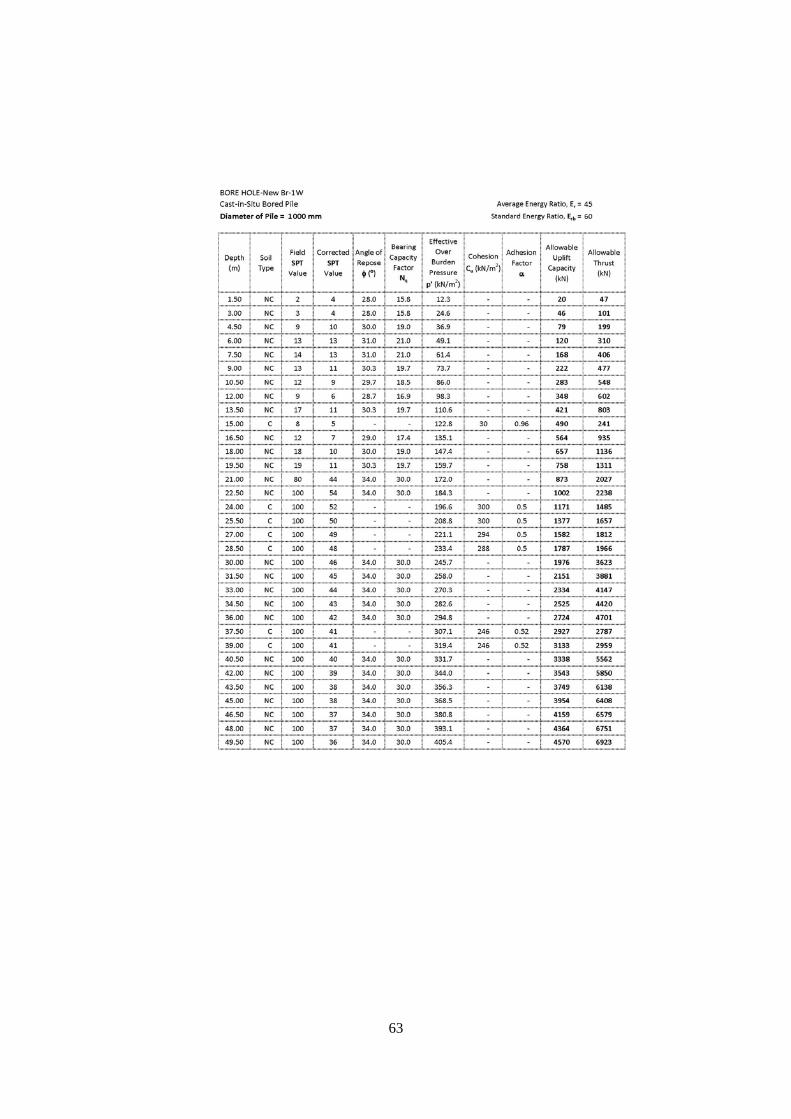
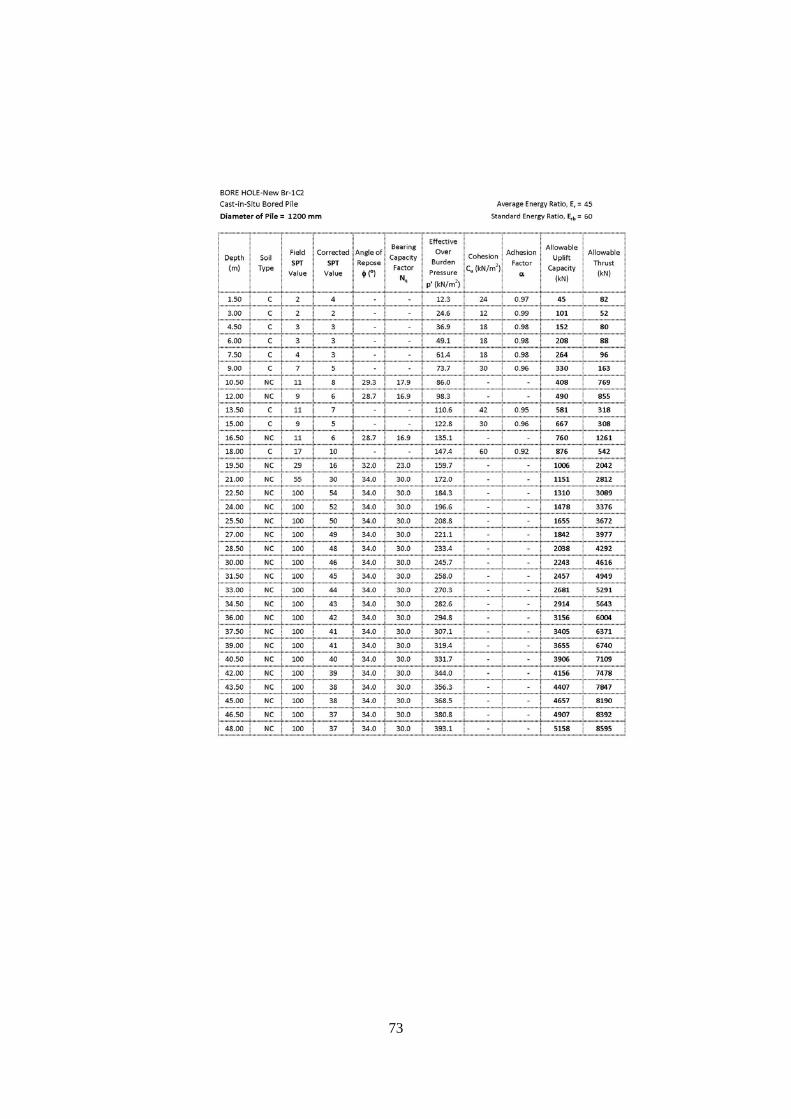
2.4.2StandardPenetration Test (SPT)
Standard Penetration test using Raymond Sampler and Drive Hammer shall be performed @t
1.5 m interval following the progress of mechanical drilling work. All the tools needed for the
standard Penetration tests shall be in compliance with ASTM-D1586-84 requirements.
2.4.3 Soil Sampling
All undisturbed samples shall be sampled using a Shelby tube which is able to obtain
undisturbed soil samples for a precise evaluation of soils density and porosity. The Sampling
Method and instrument shall be approved in advance by the Engineer.
All the above undisturbed samples and all disturbed samples obtained by SPT shall be kept in an
airtight and transport vinyl bags to preserve it from drying and being desiccated to an accurate
soil tests. Samples have been transported without disturbance. During the site work to obtain the
undisturbed sample, the contractor shall request the Engineers presence
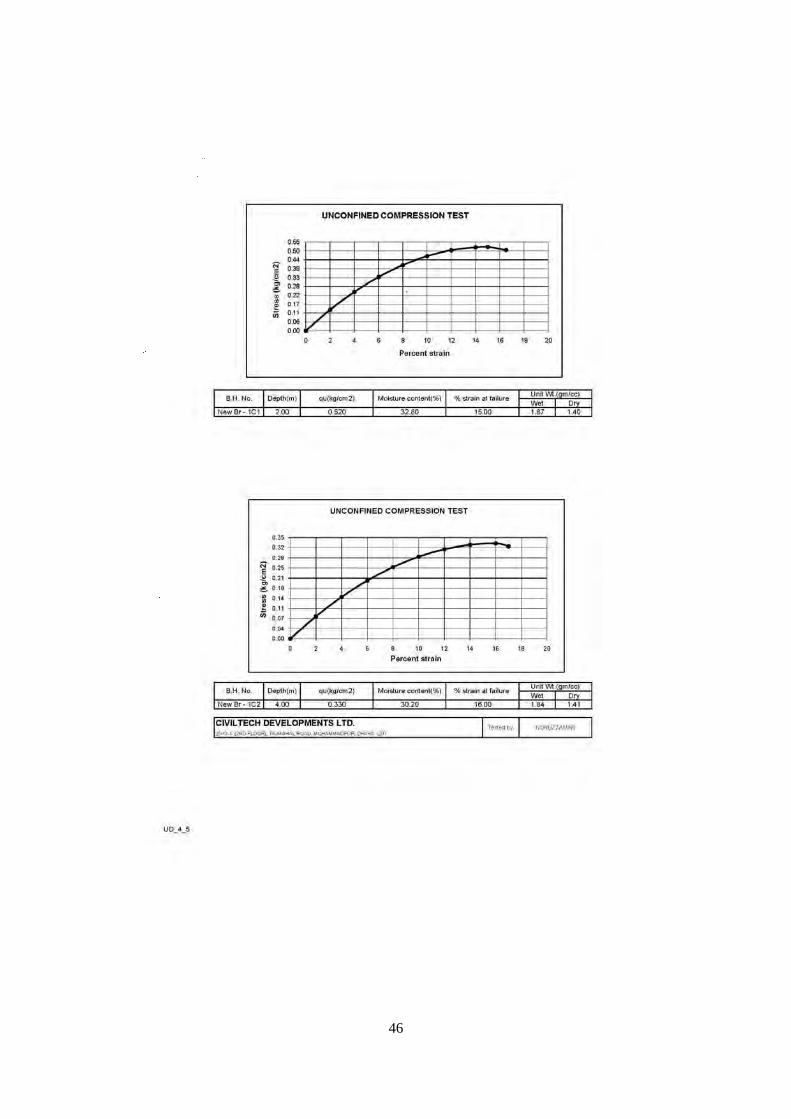
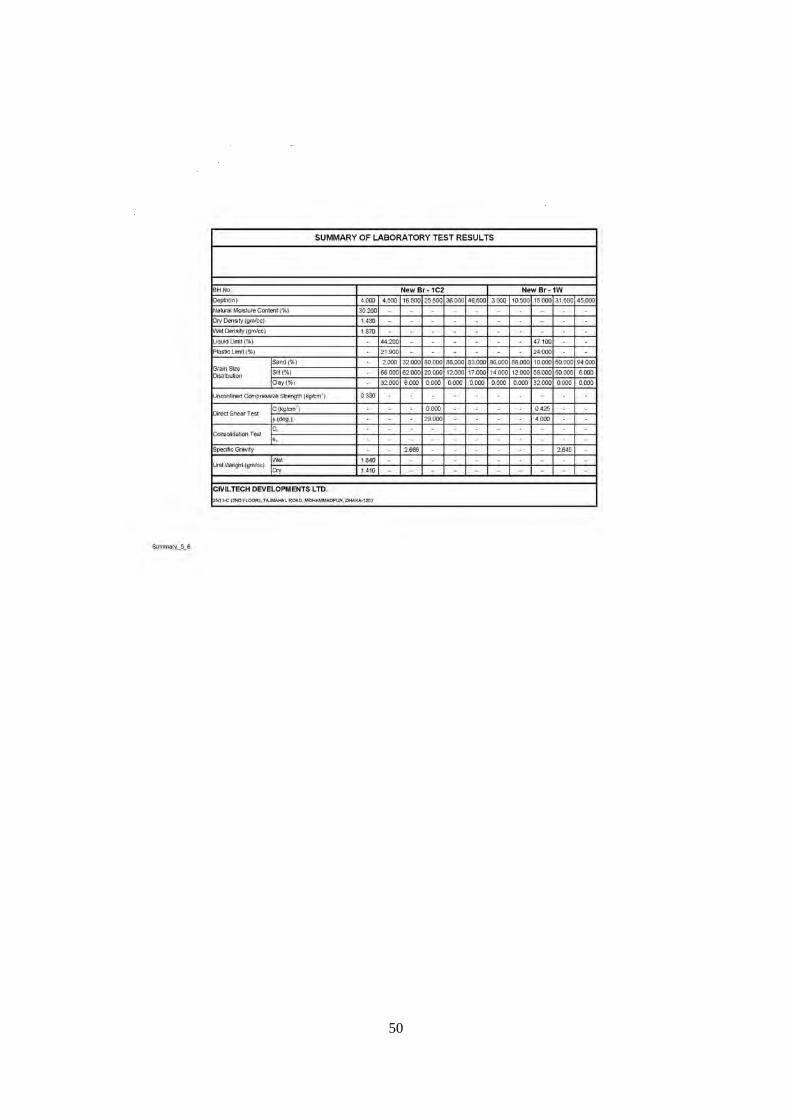
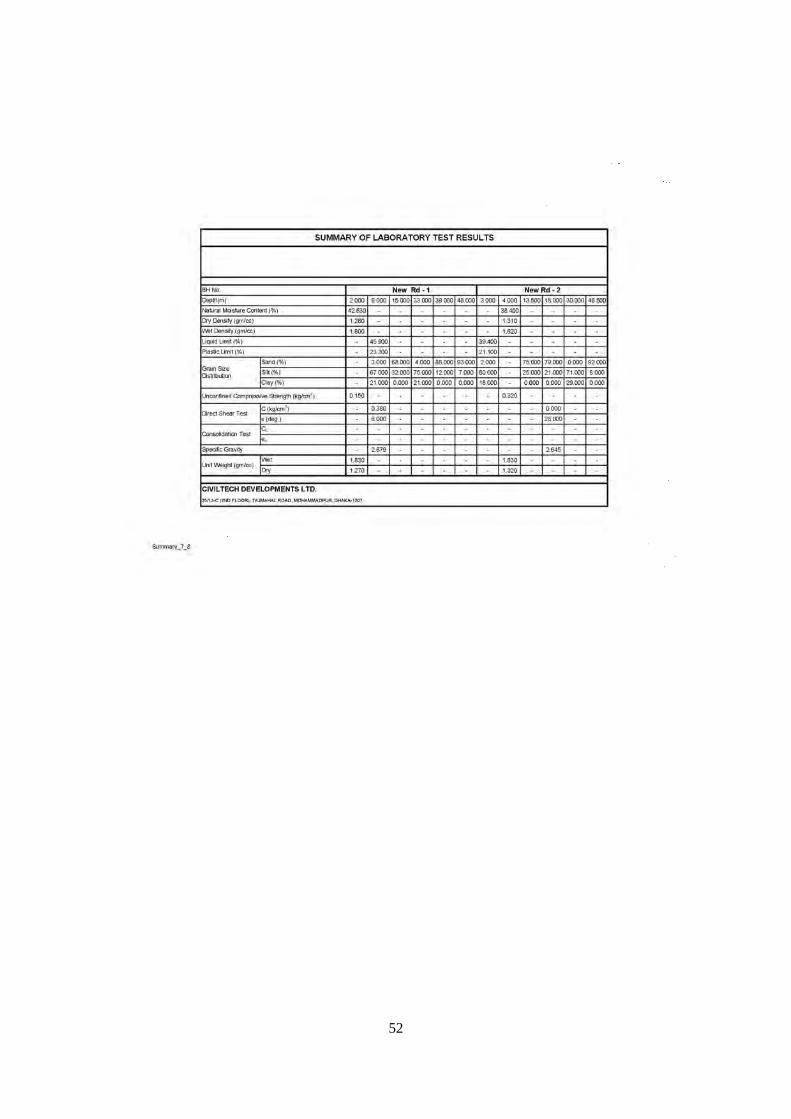
2.5 Laboratory Tests:
The laboratory tests are to be done for determination of the following.
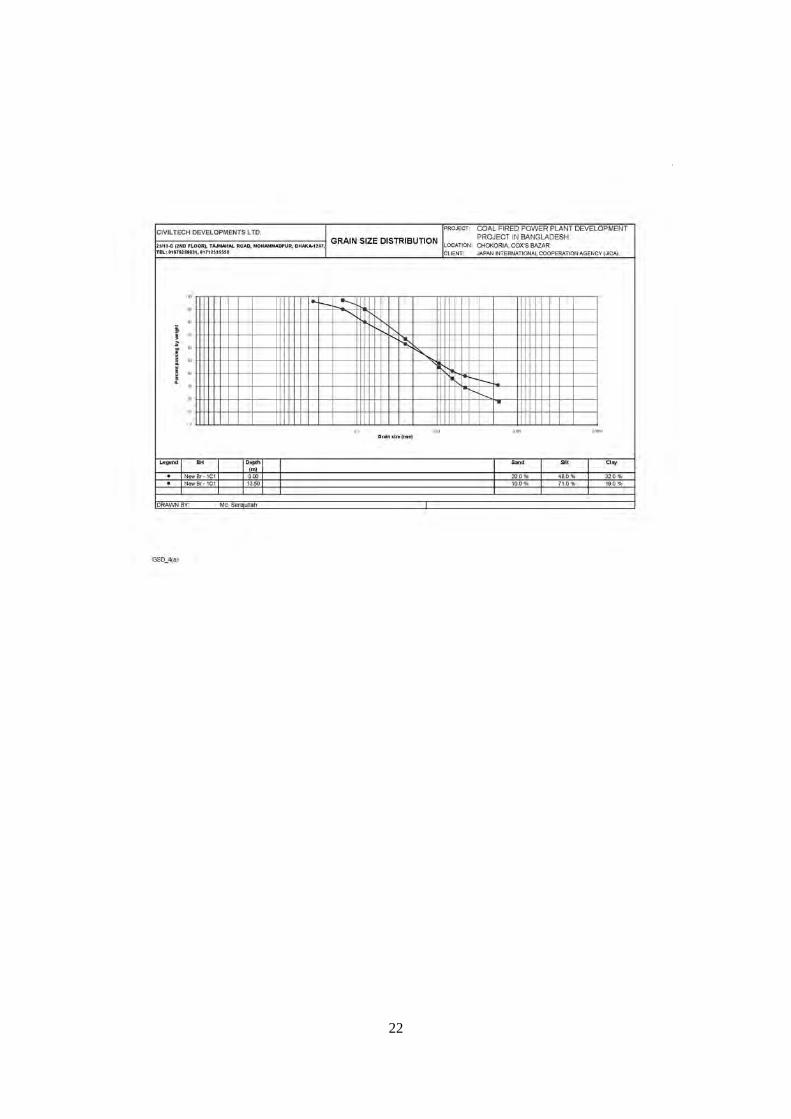
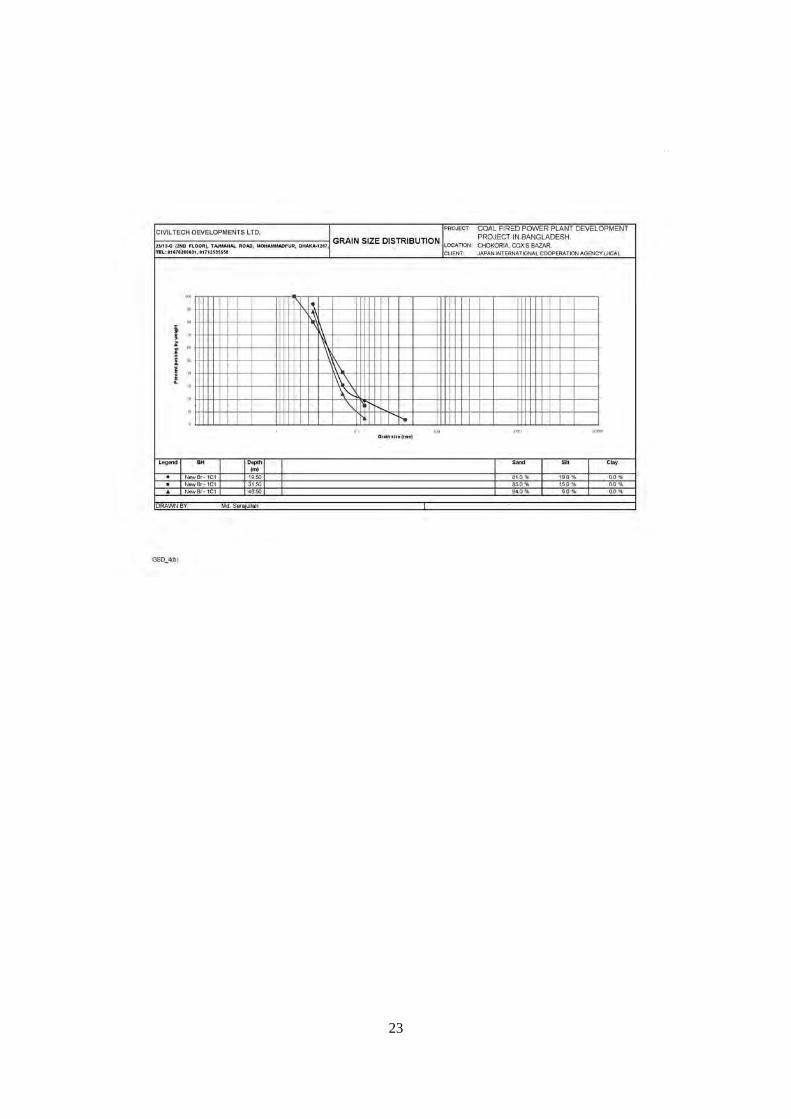
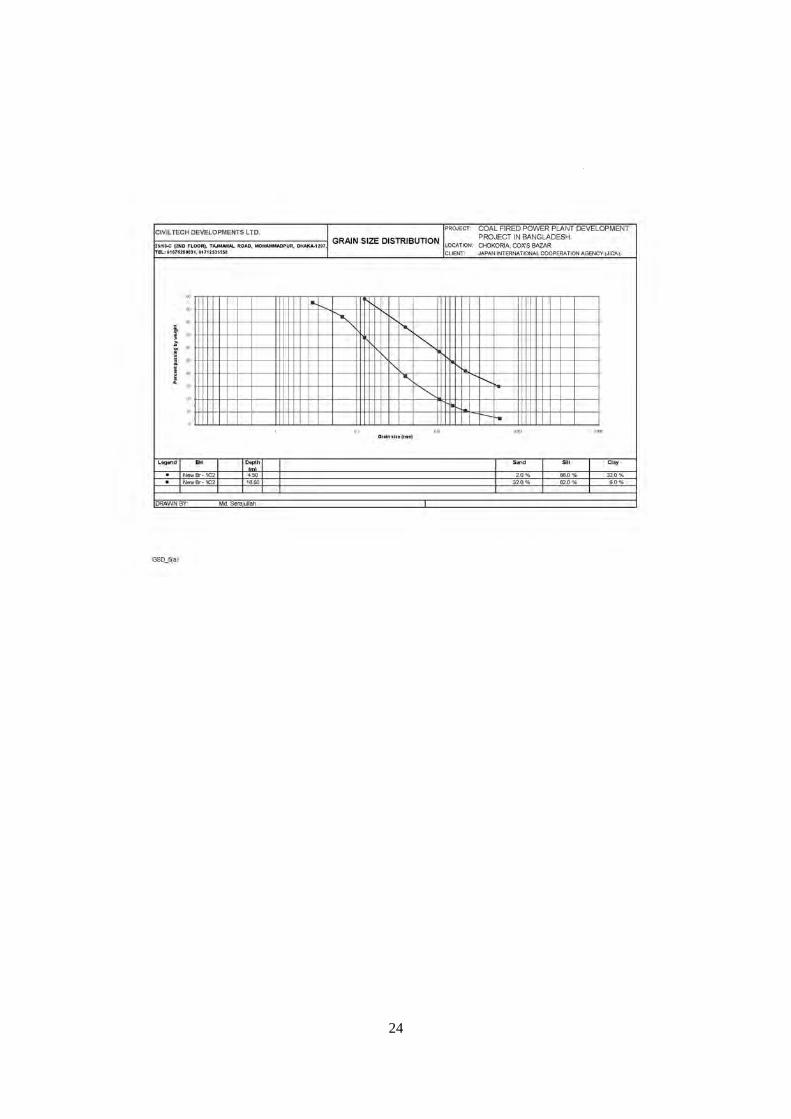
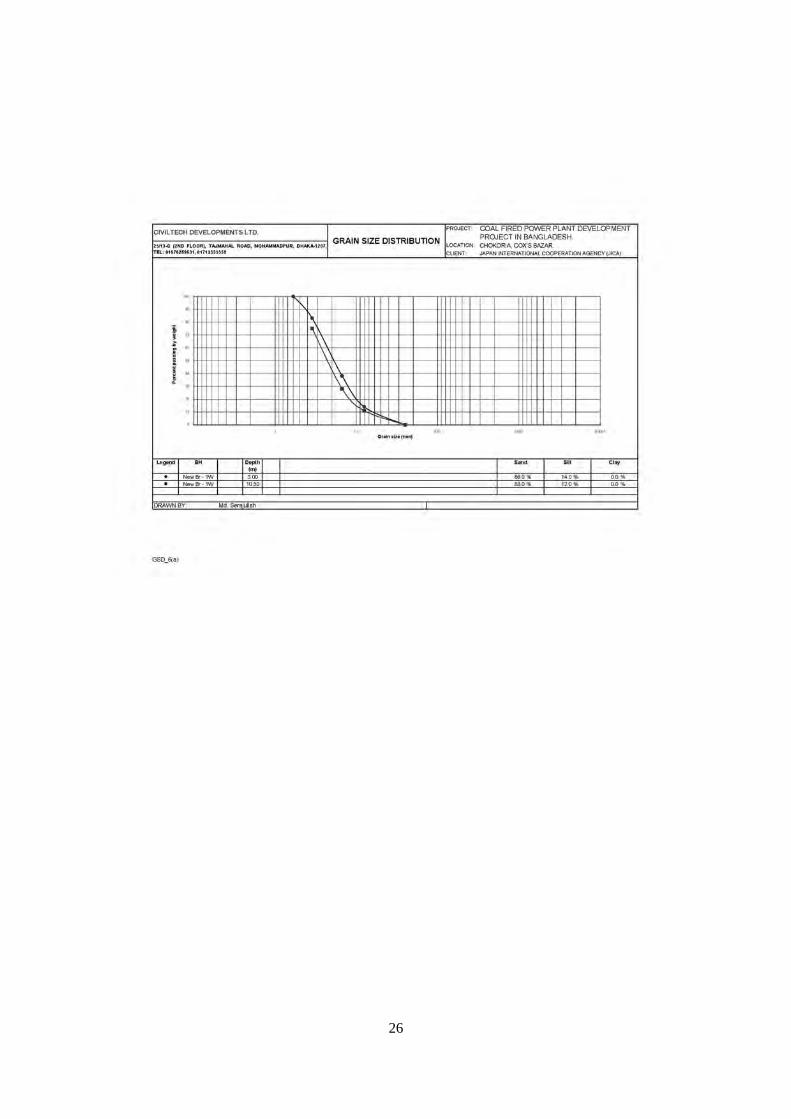
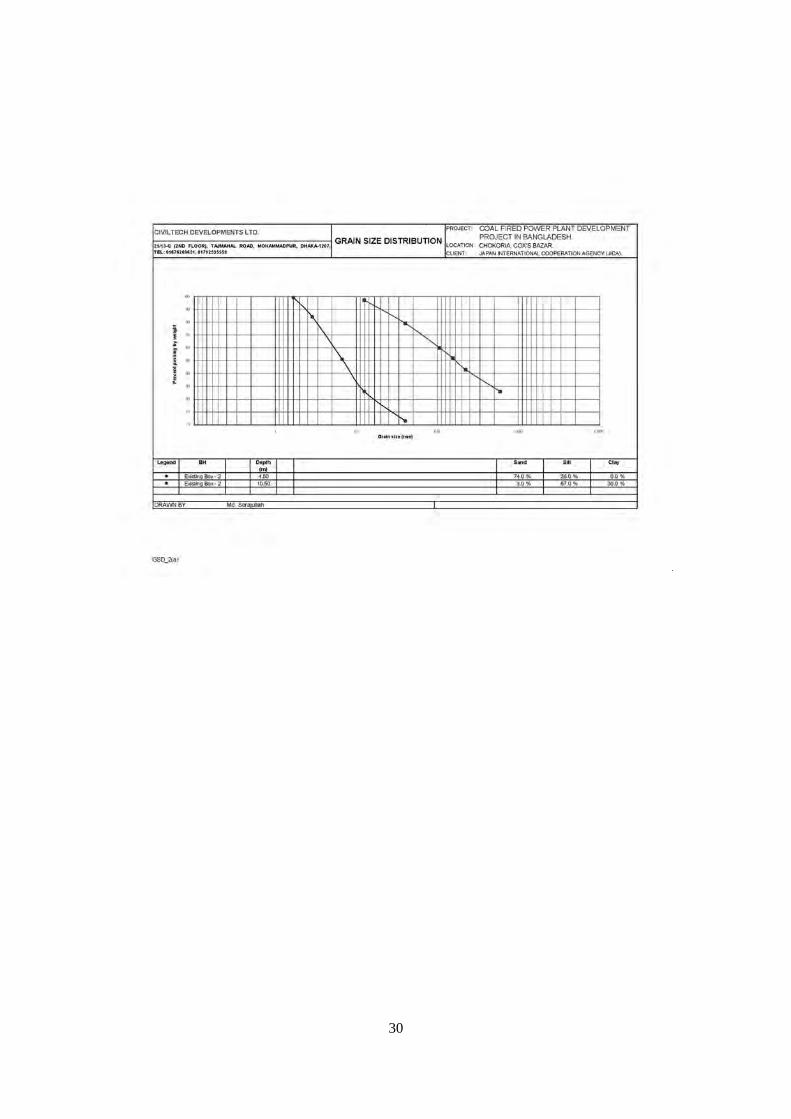
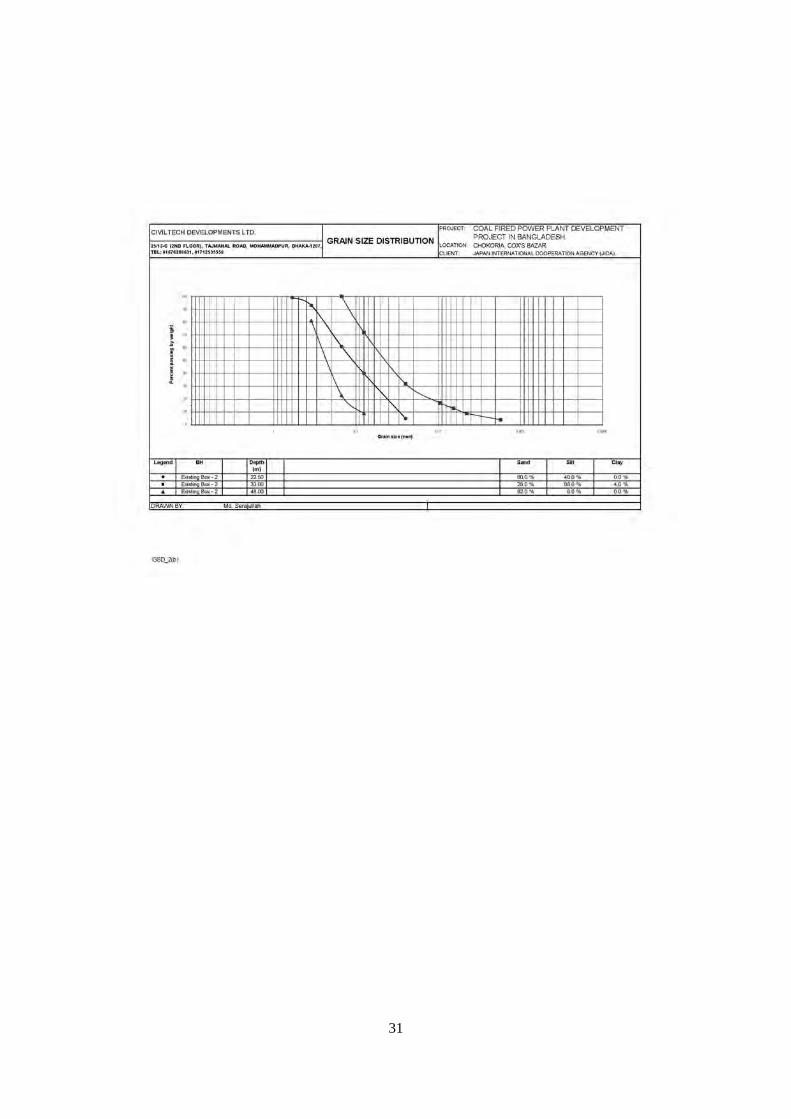
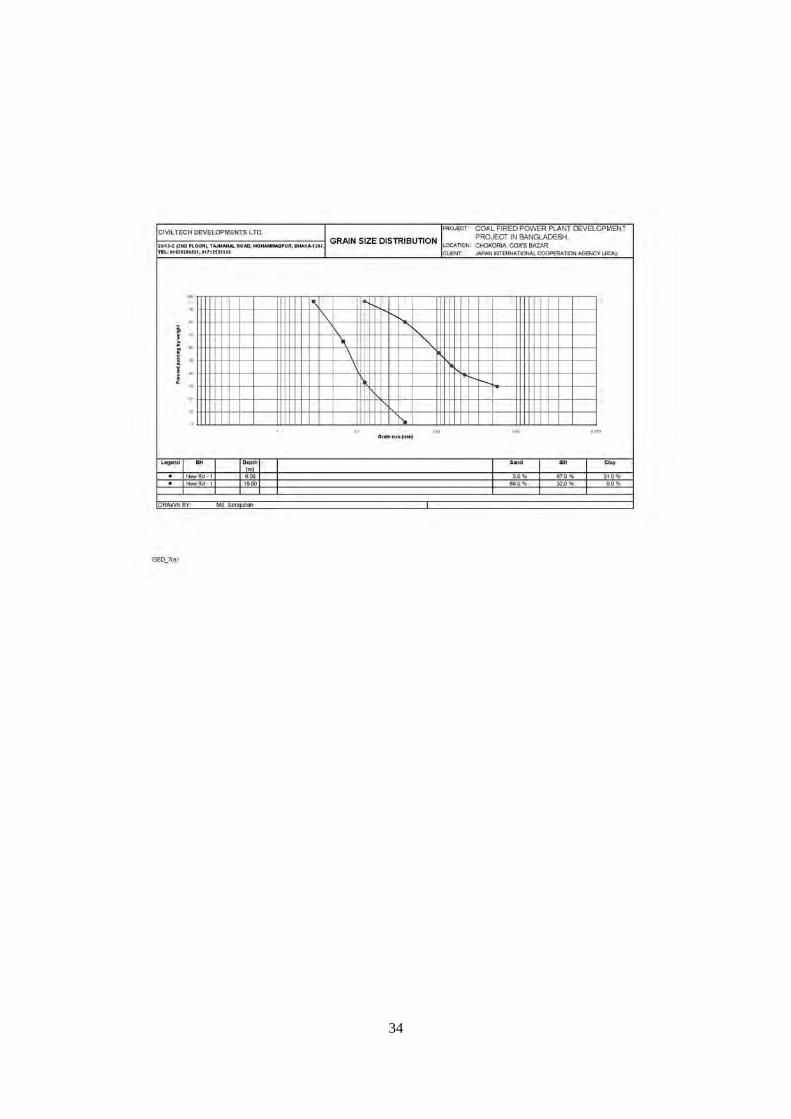
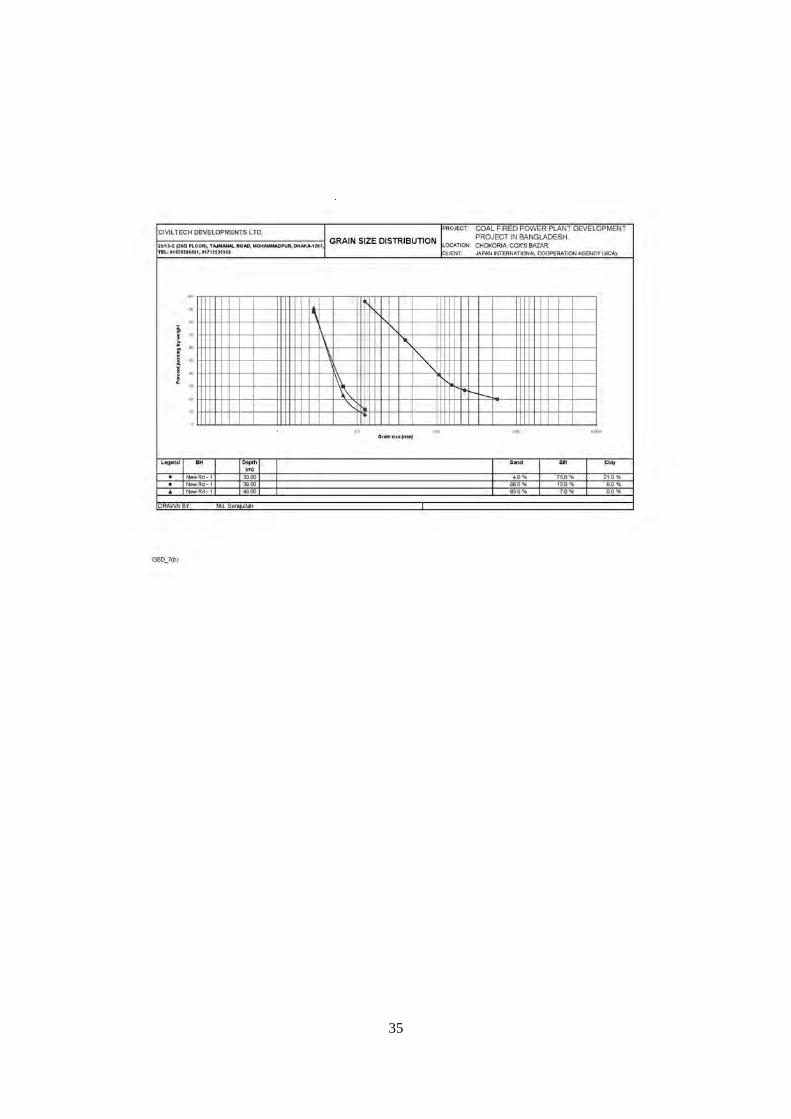
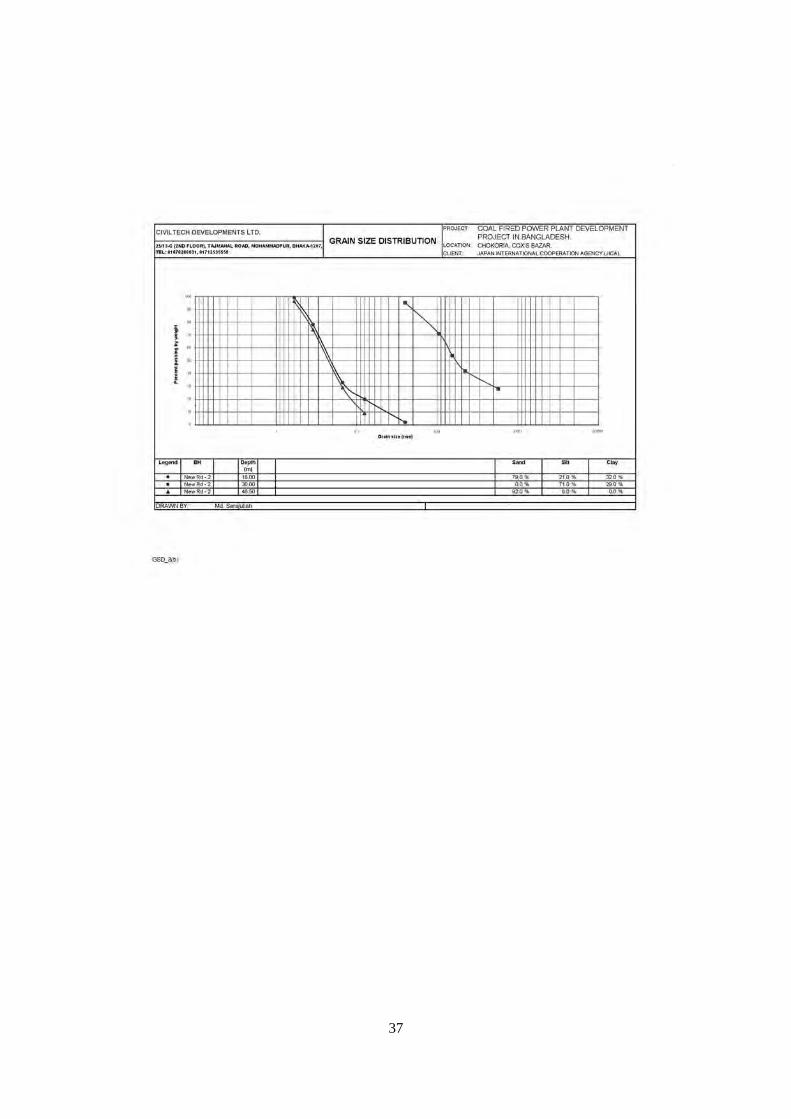
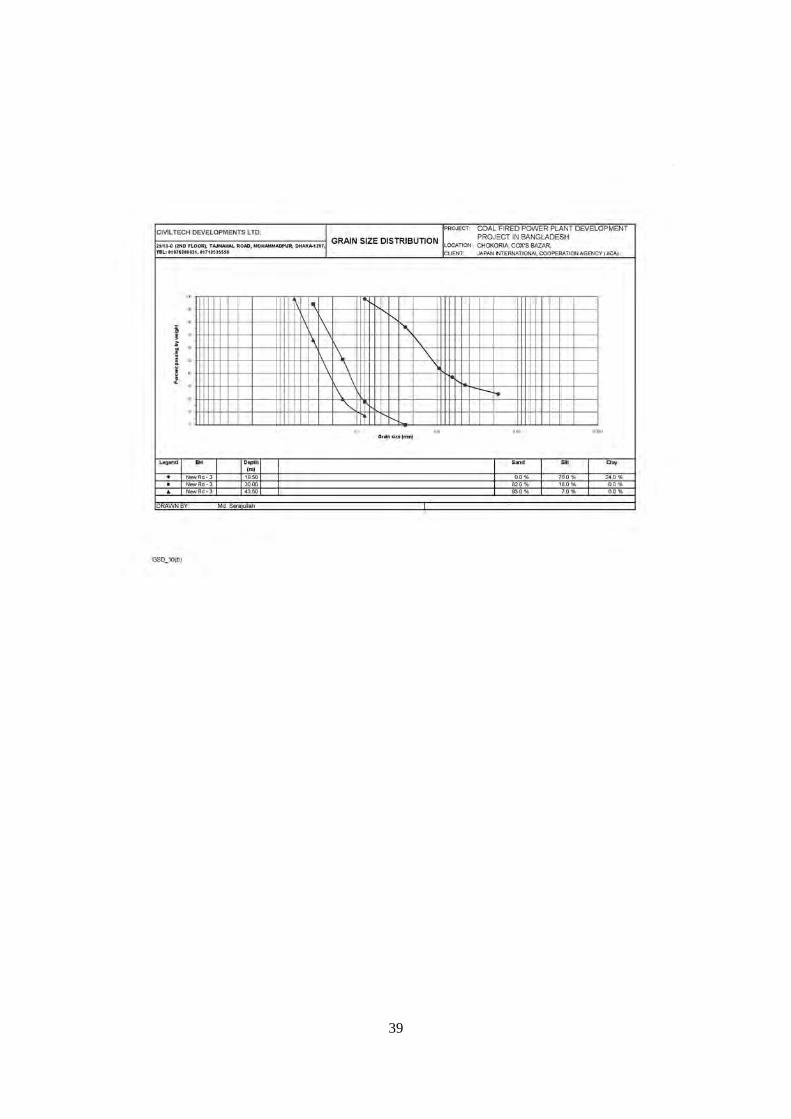
a) Grain size distribution
b) Atterberg limits
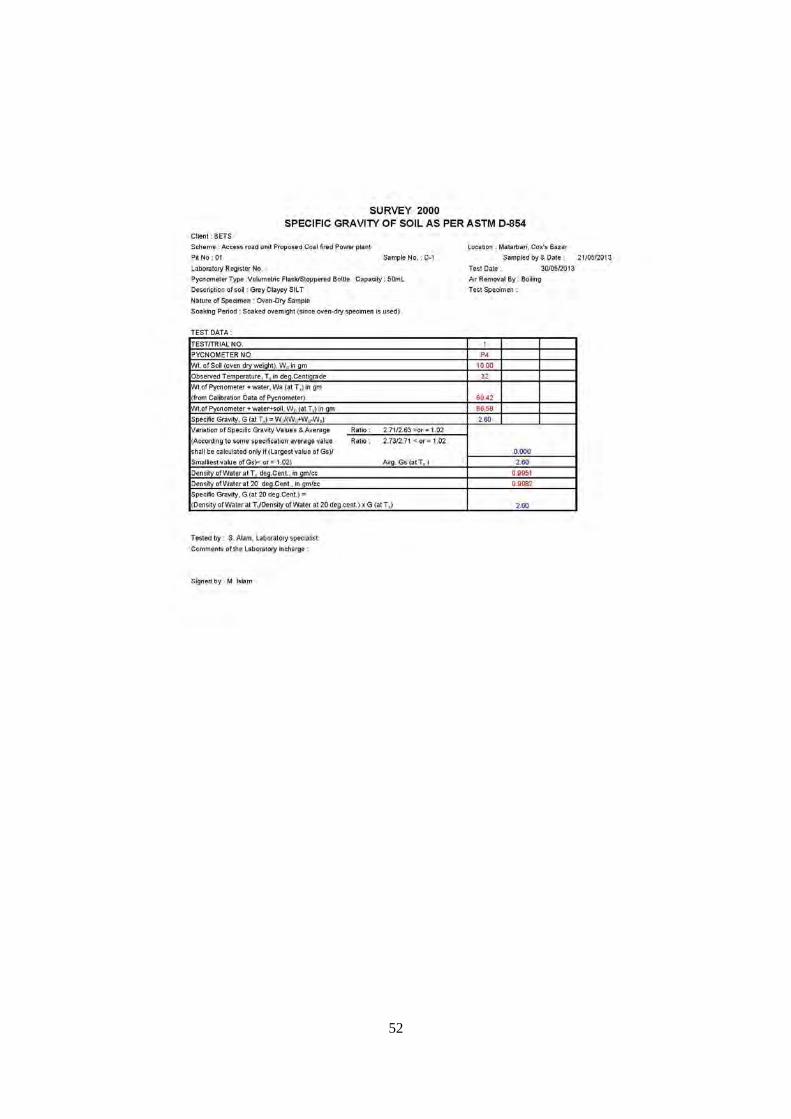
c) Specific Gravity of soil
d) Unit Weight
e) Unconfined Compression Tests
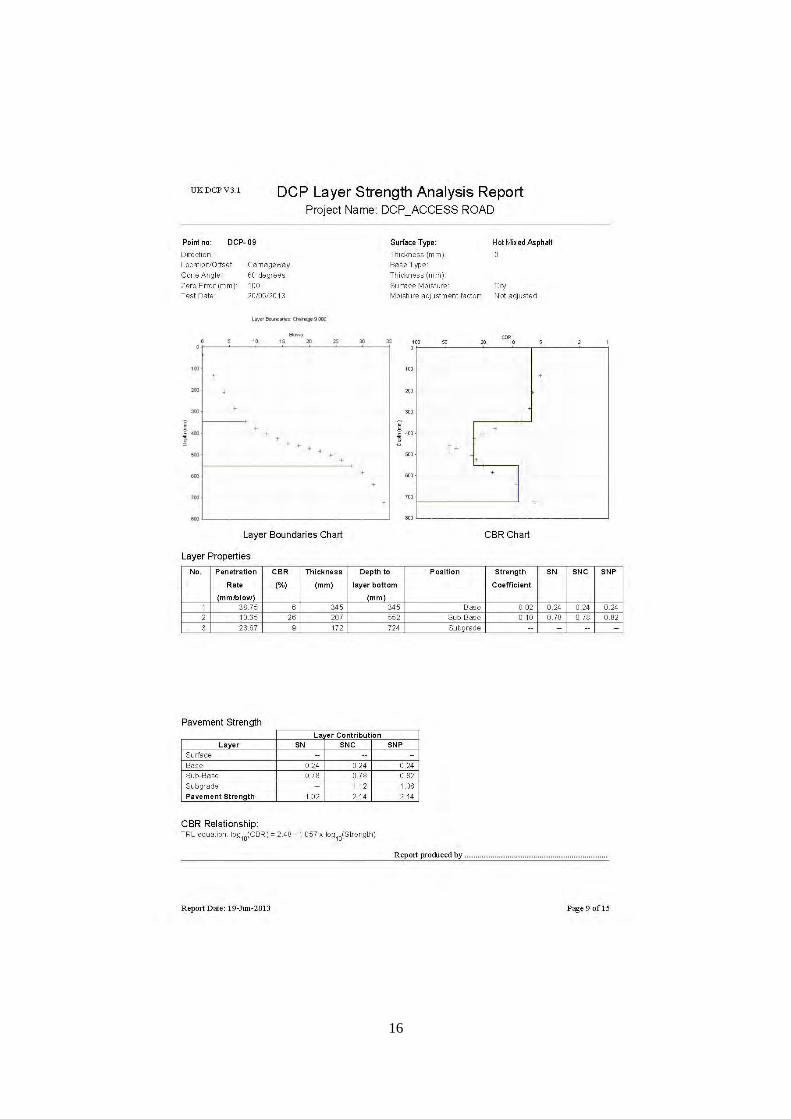
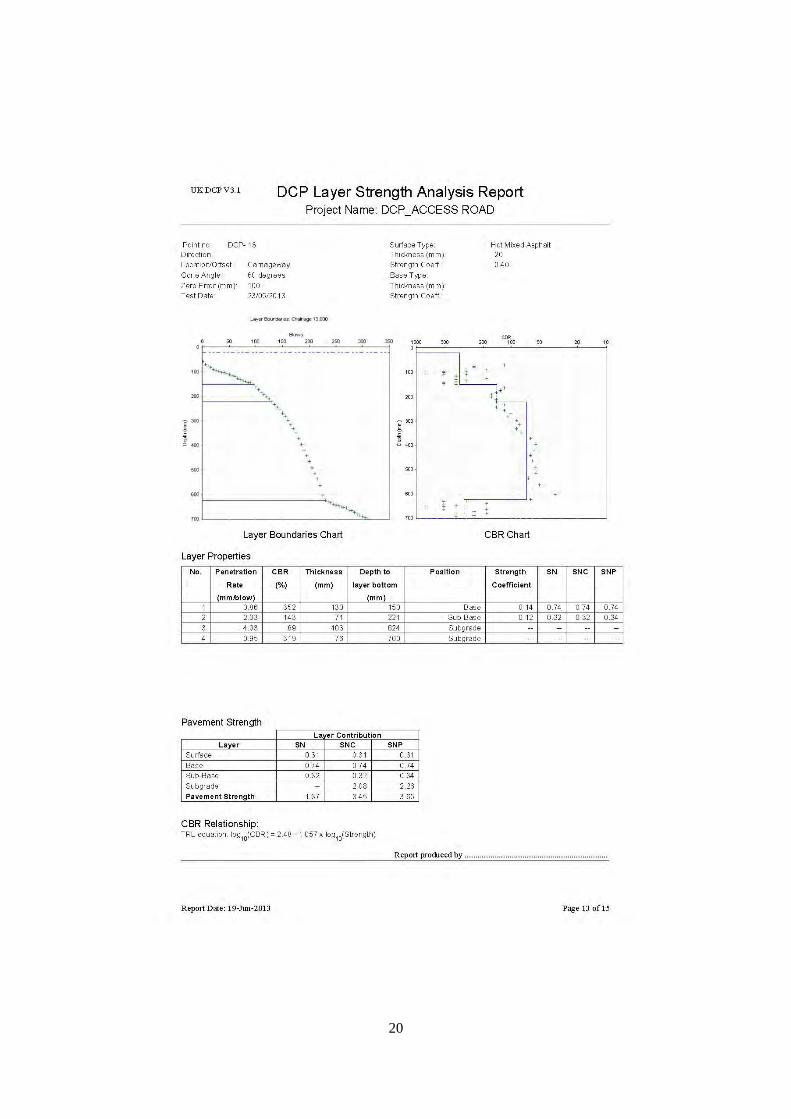
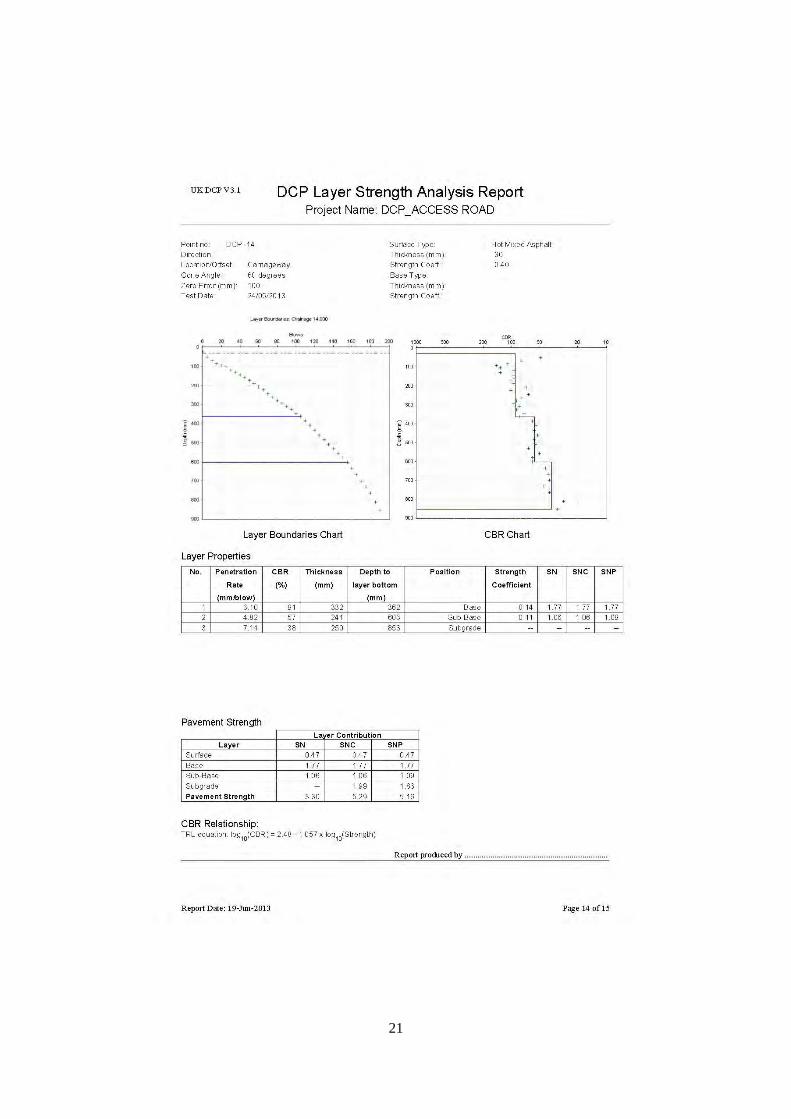
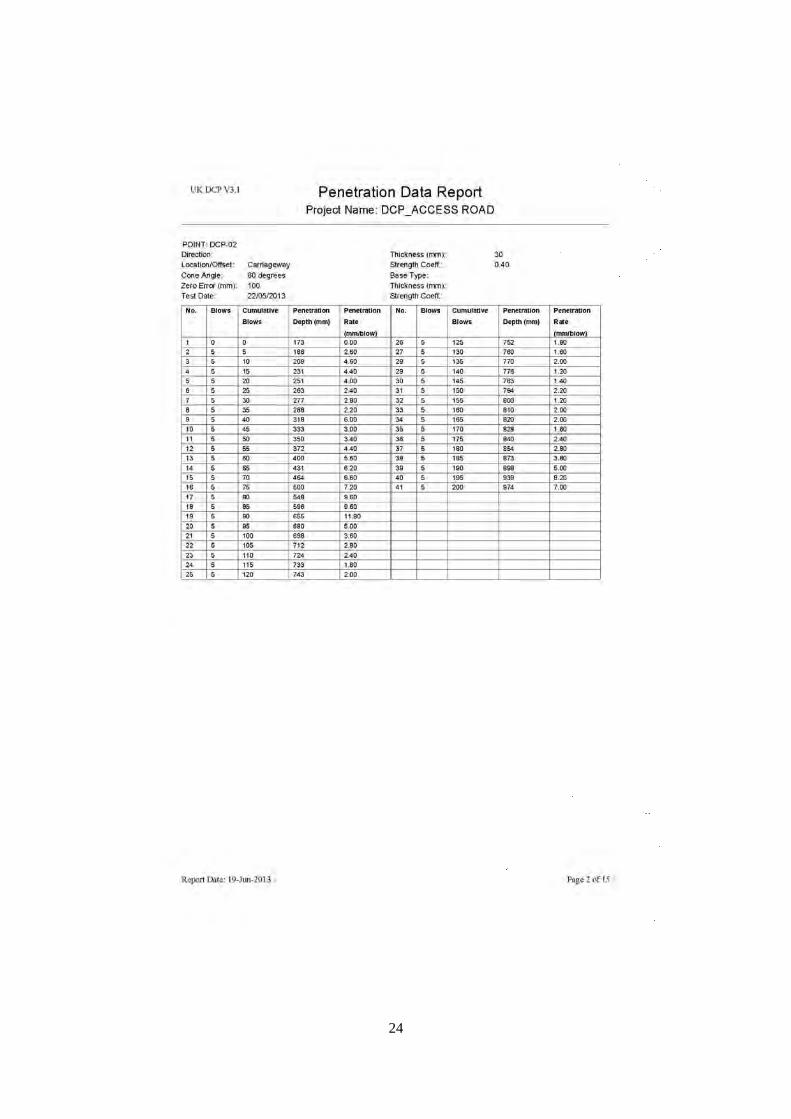
2.6 Dynamic Cone Penetrometer (DCP) tests and Existing Road Material
sampling
2.6.1 General:
The Main purpose of the works is to analyze and evaluate the characteristic of existing soil The
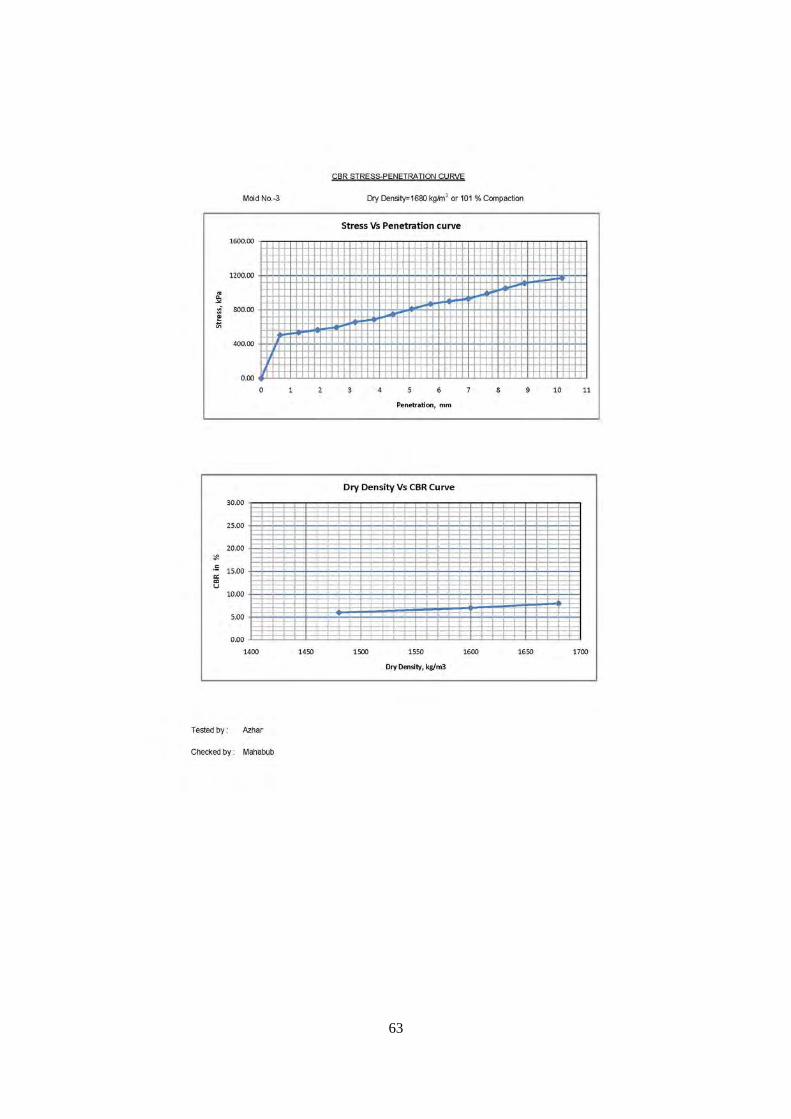
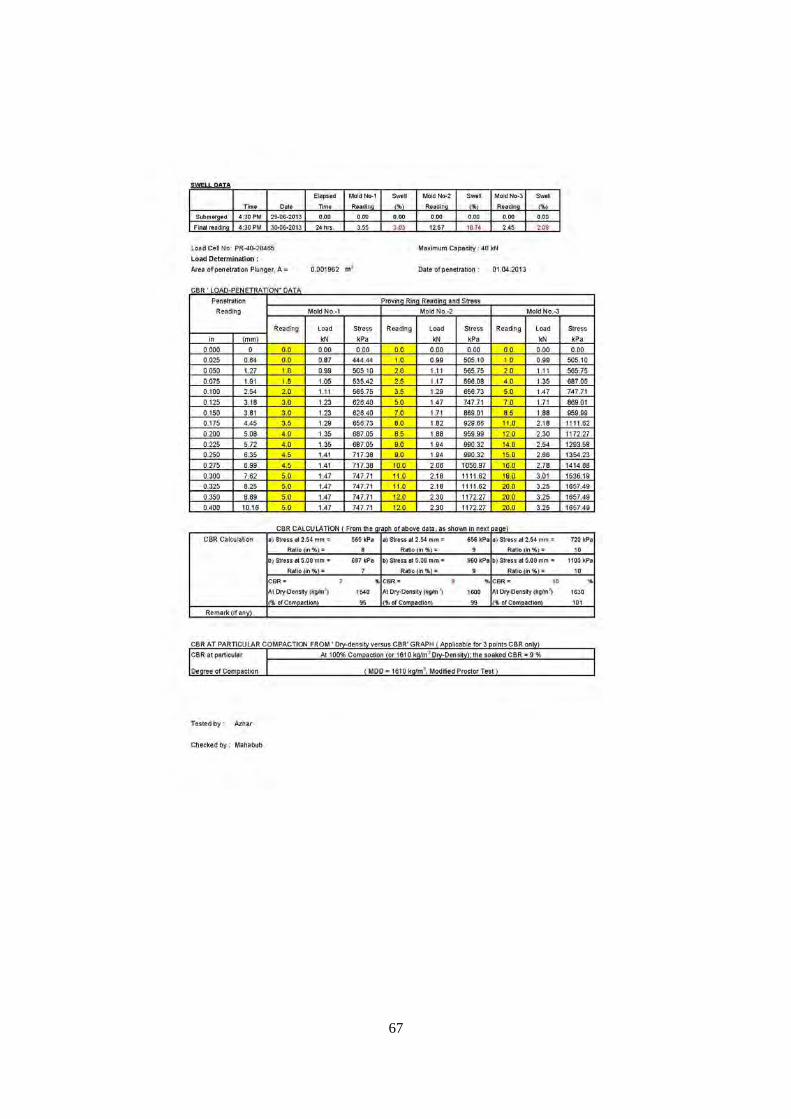
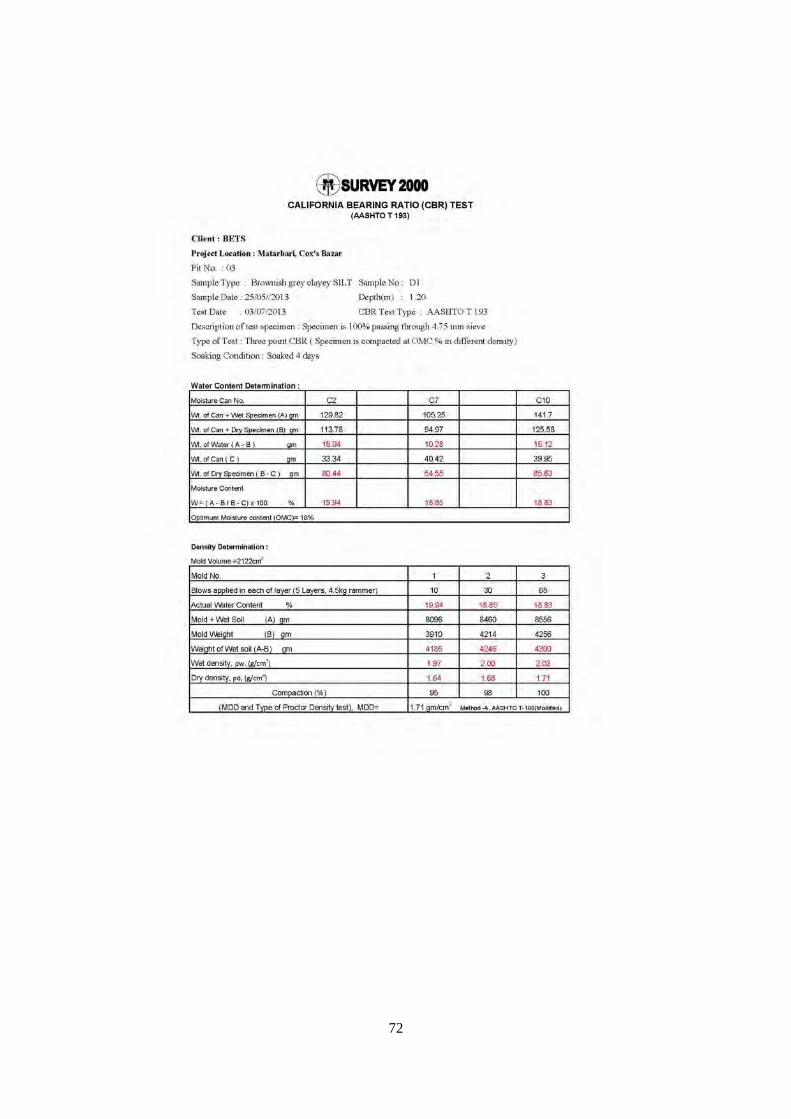
CBR value worked out from this tests have been recorded for design of the pavement.
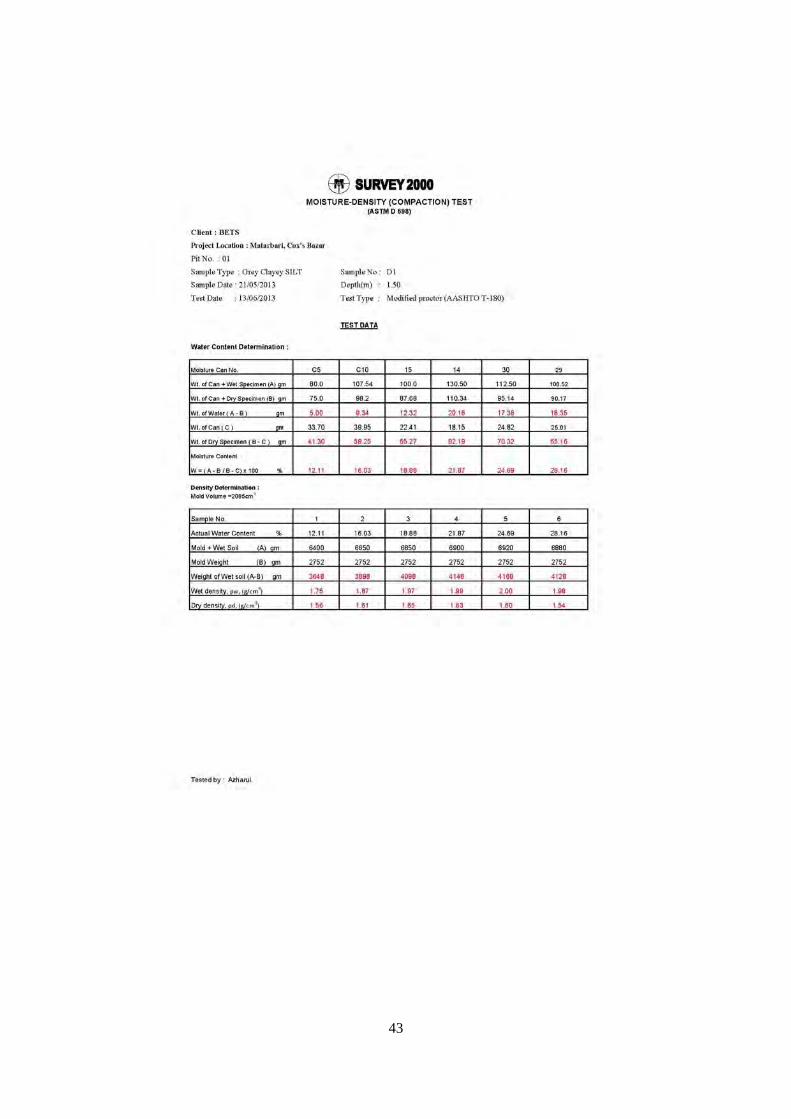
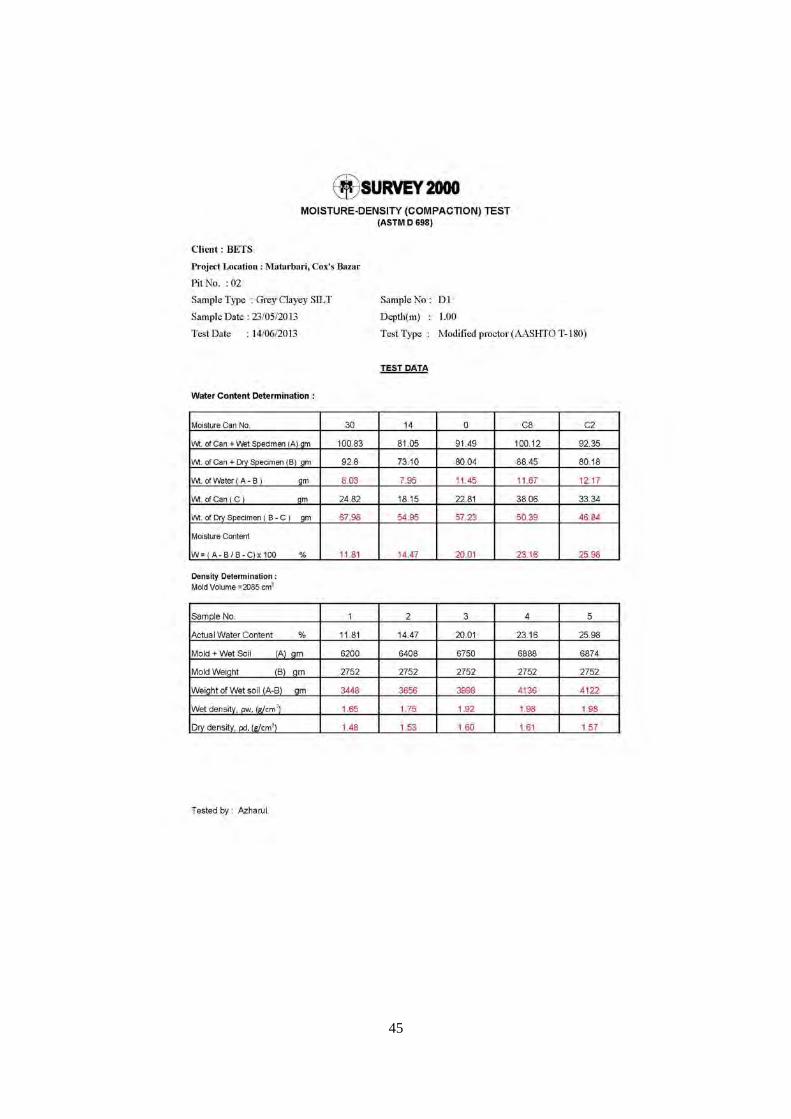
2.6.2Summary of PIT soil test

88
SUMMARY PIT SOIL Tests
Chainage m 4445 5235 6205 Note
Road Section
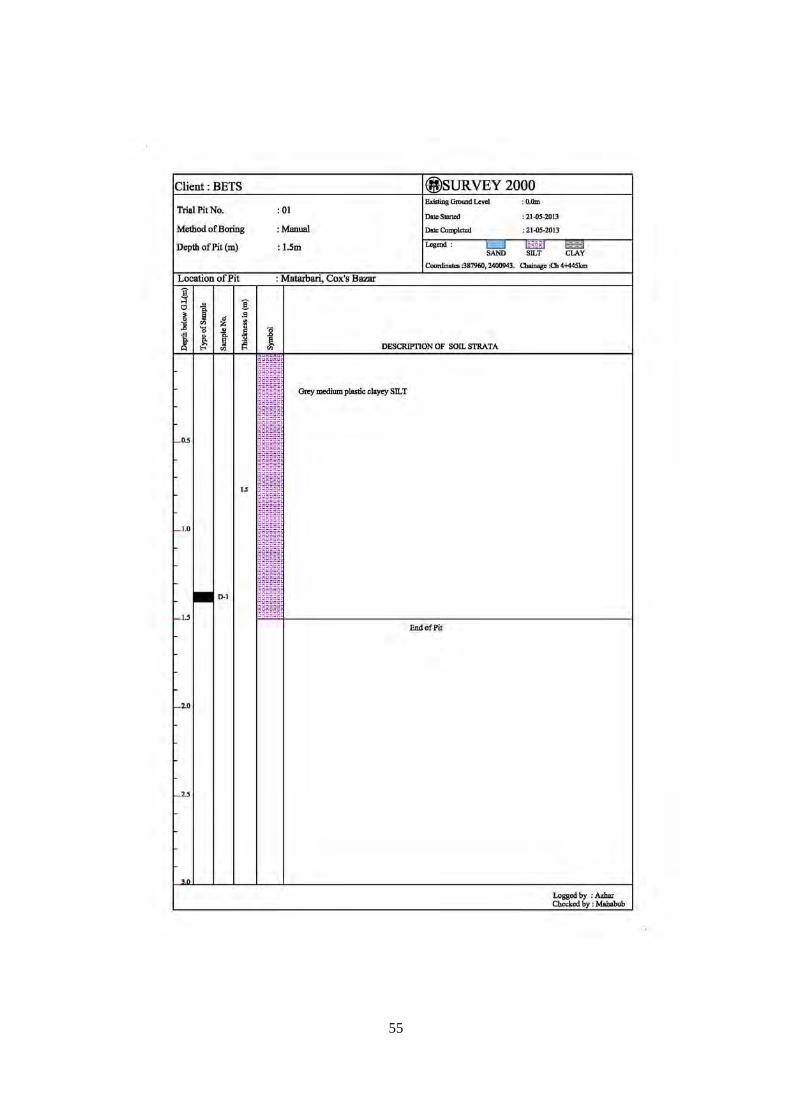
PIT No 1 2 3
Northing /Easting
DEPTH (m) 1.5 1.0 1.2
Qty of Atterberg limit Tests 1 1 1
Qty of Specific gravity of Soil 1 1 1
Grain Size Analysis 1 1 1
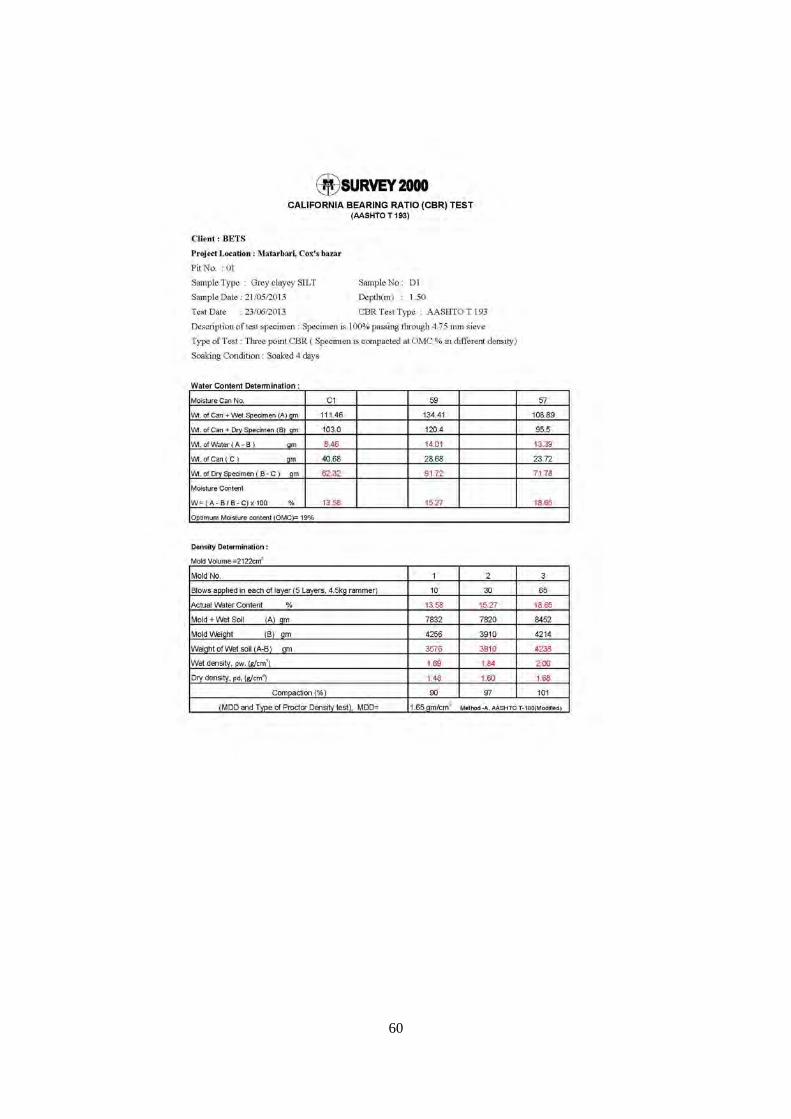
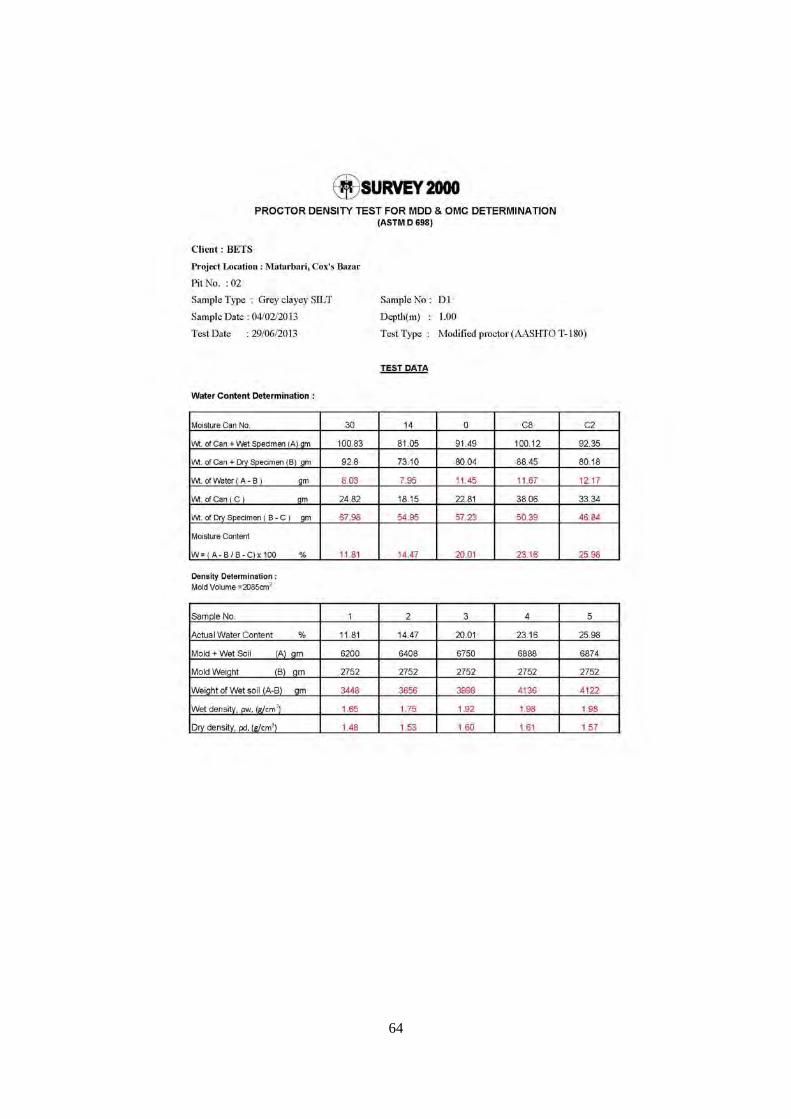
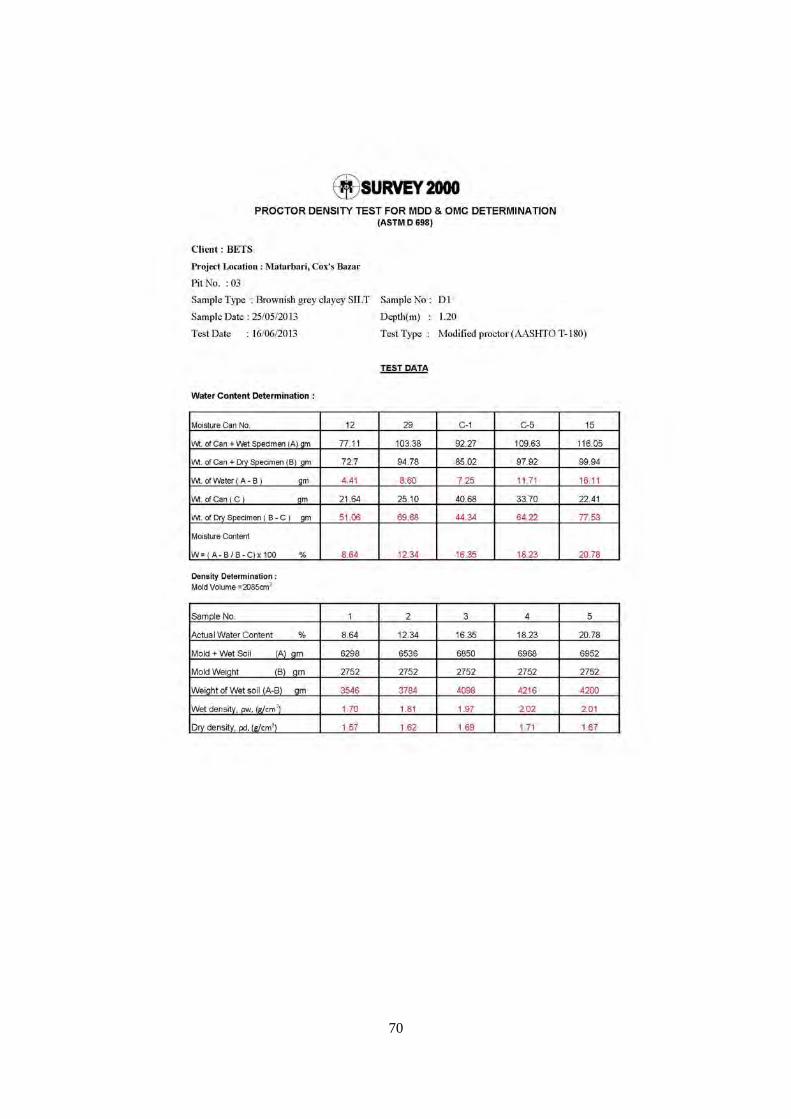
Proctor Test 1 1 1
Reporting:
1) Location Map with Description of Location of testing /sampling No
2) Comprehensive results of tests on site
3) Result of DCP tests analysis
4) Photos showing the site conditions before during and after sampling
5) Others
Road material Sampling: Along the route between Yunuskhali and the power Plant site
(3 Samples)
2.6.3 Test Pit Soil Evaluation
Evaluation of soils sample collected from roadway.
The desirable properties of good fill materials is that it should have high stability and strength and
for that it should not exhibit large change of volume with change of moisture content, have good
drainage properties, not contain much organic matter and not favor capillary rise of water. In
India and Bangladesh, following criteria are adopted in selecting soils for road embankment:-
Soils having a maximum dry density less than 1440 kg/cum are ordinarily considered
unsuitable for embankment construction.
Soils having a maximum dry density less than 1520 kg/cum are ordinarily considered
unsuitable for use in embankments exceeding 3 m in height or in embankments in any height
subject to long periods of inundation.
89
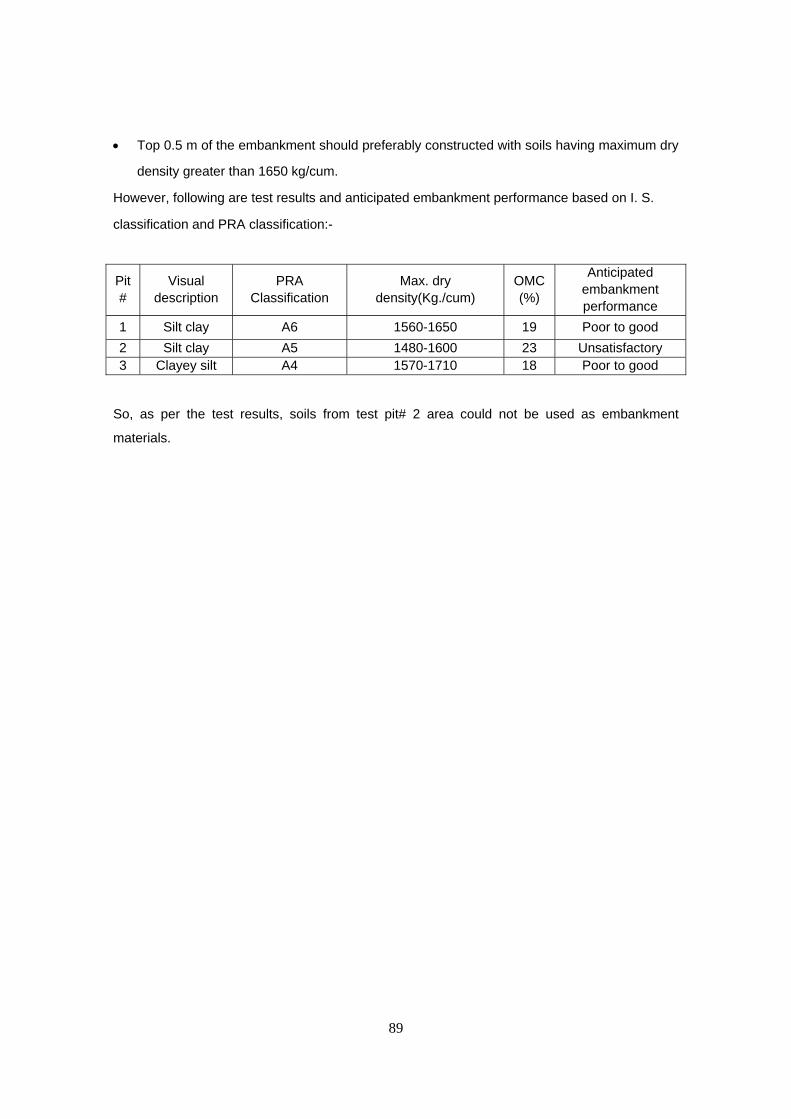
Top 0.5 m of the embankment should preferably constructed with soils having maximum dry
density greater than 1650 kg/cum.
However, following are test results and anticipated embankment performance based on I. S.
classification and PRA classification:-
Pit #
Visual description
PRA Classification
Max. dry density(Kg./cum)
OMC (%)
Anticipated embankment performance
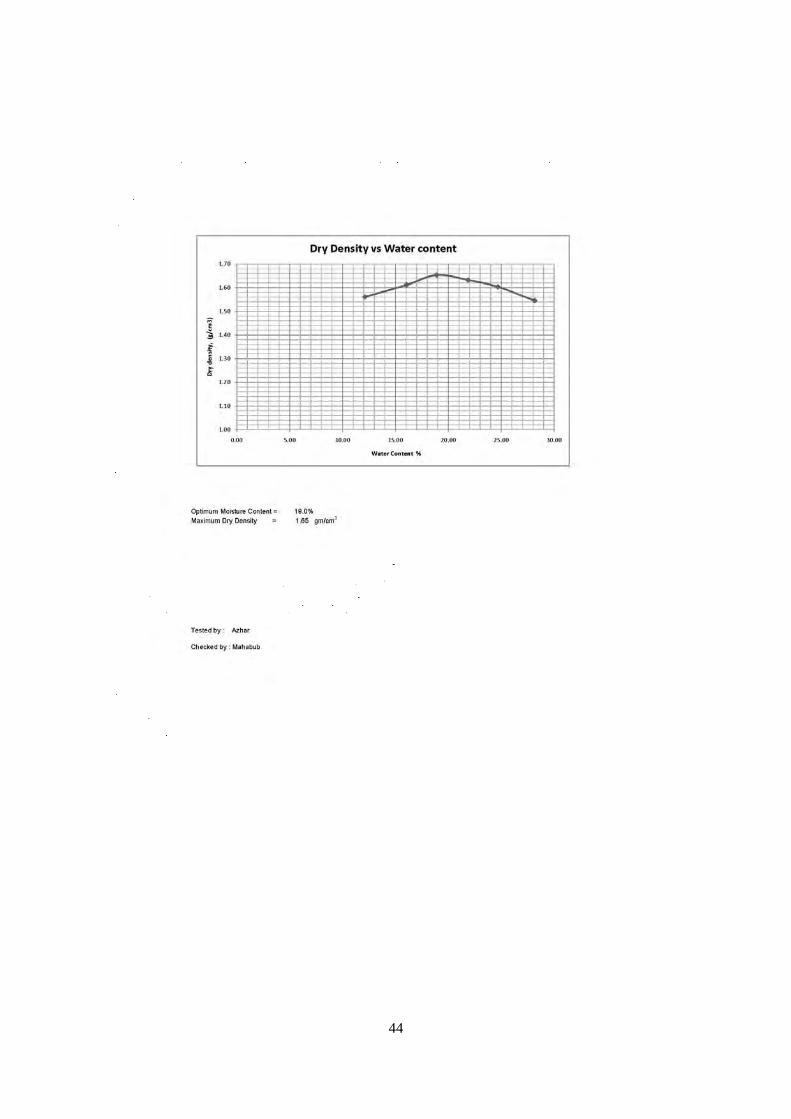
1 Silt clay A6 1560-1650 19 Poor to good
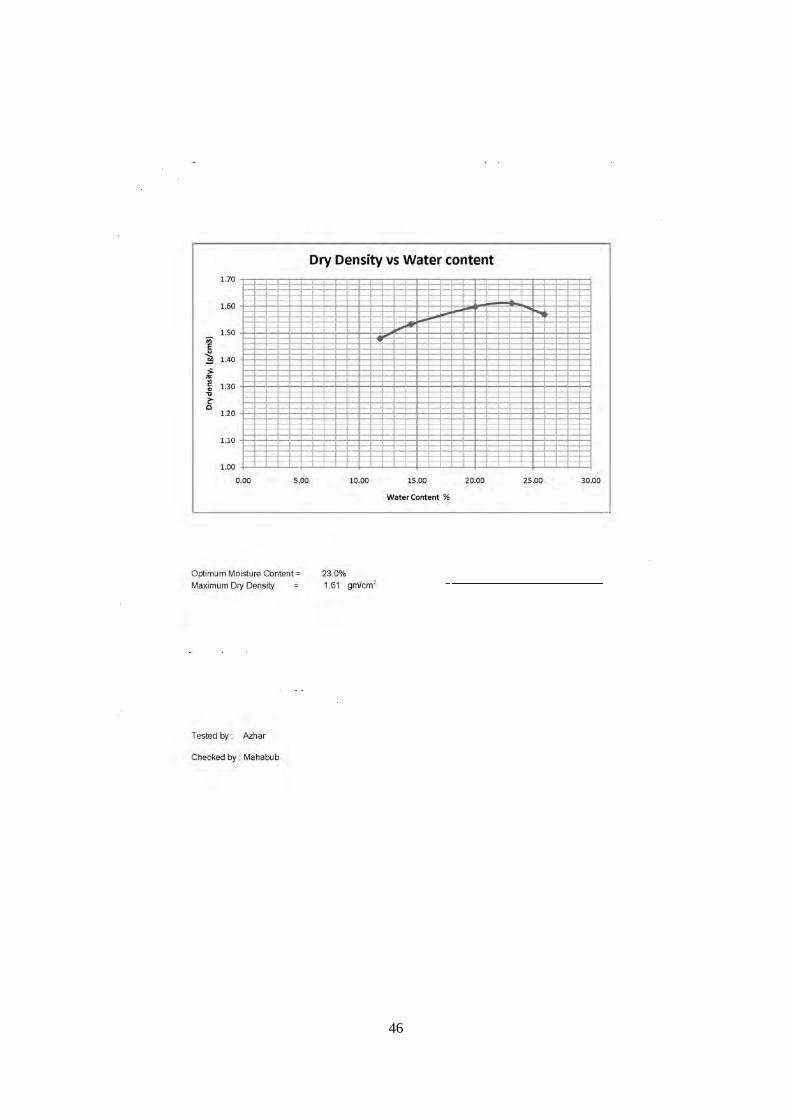
2 Silt clay A5 1480-1600 23 Unsatisfactory 3 Clayey silt A4 1570-1710 18 Poor to good
So, as per the test results, soils from test pit# 2 area could not be used as embankment
materials.

Appendix-C16.3-4
Details of Preliminary Analysis of Soft Soil Ground

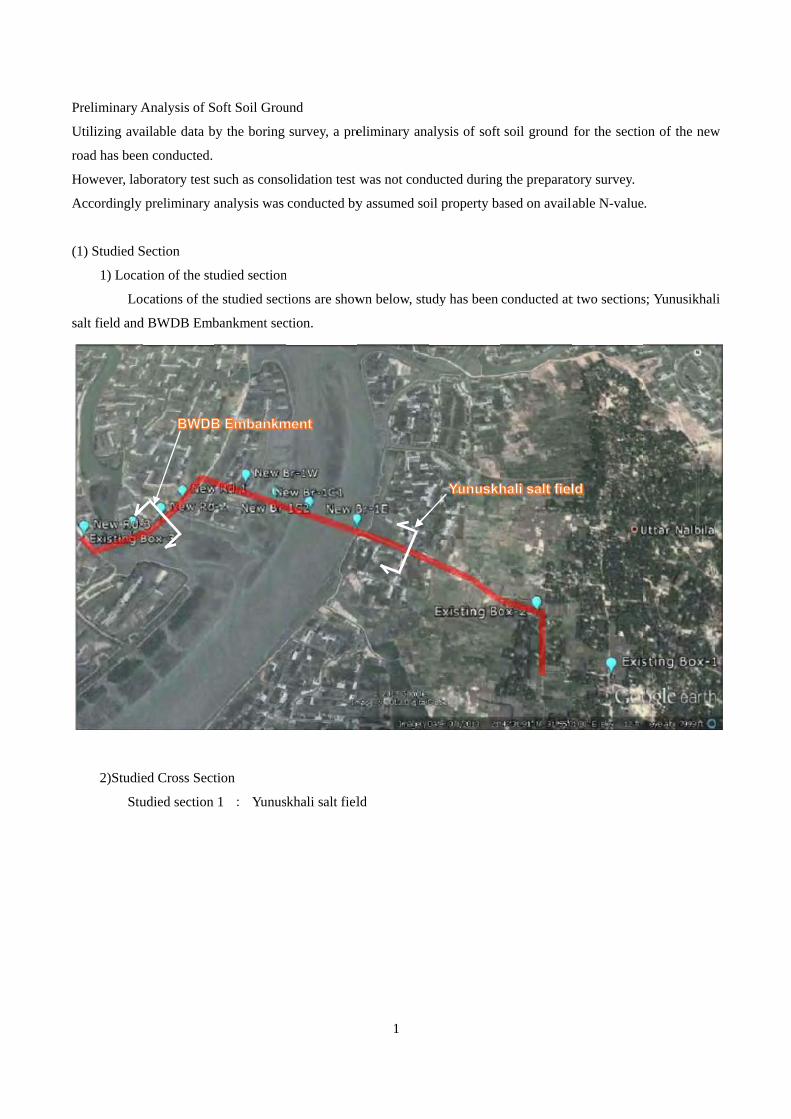
Preliminary A
Utilizing ava
road has been
However, lab
Accordingly
(1) Studied S
1) Locat
Lo
salt field and
2)Studie
Stu
Analysis of S
ailable data b
n conducted.
boratory test s
preliminary a
Section
tion of the stu
cations of the
d BWDB Emb
ed Cross Sect
udied section
Soft Soil Grou
by the boring
such as conso
analysis was
udied section
e studied sect
bankment sec
tion
1 : Yunus
und
survey, a pre
olidation test
conducted by
n
tions are show
ction.
skhali salt fiel
1
eliminary ana
was not cond
y assumed so
wn below, stu
ld
alysis of soft
ducted during
oil property ba
udy has been
soil ground
g the preparat
ased on availa
conducted at
for the sectio
tory survey.
able N-value
t two sections
on of the new
.
s; Yunusikhal
w
li

2
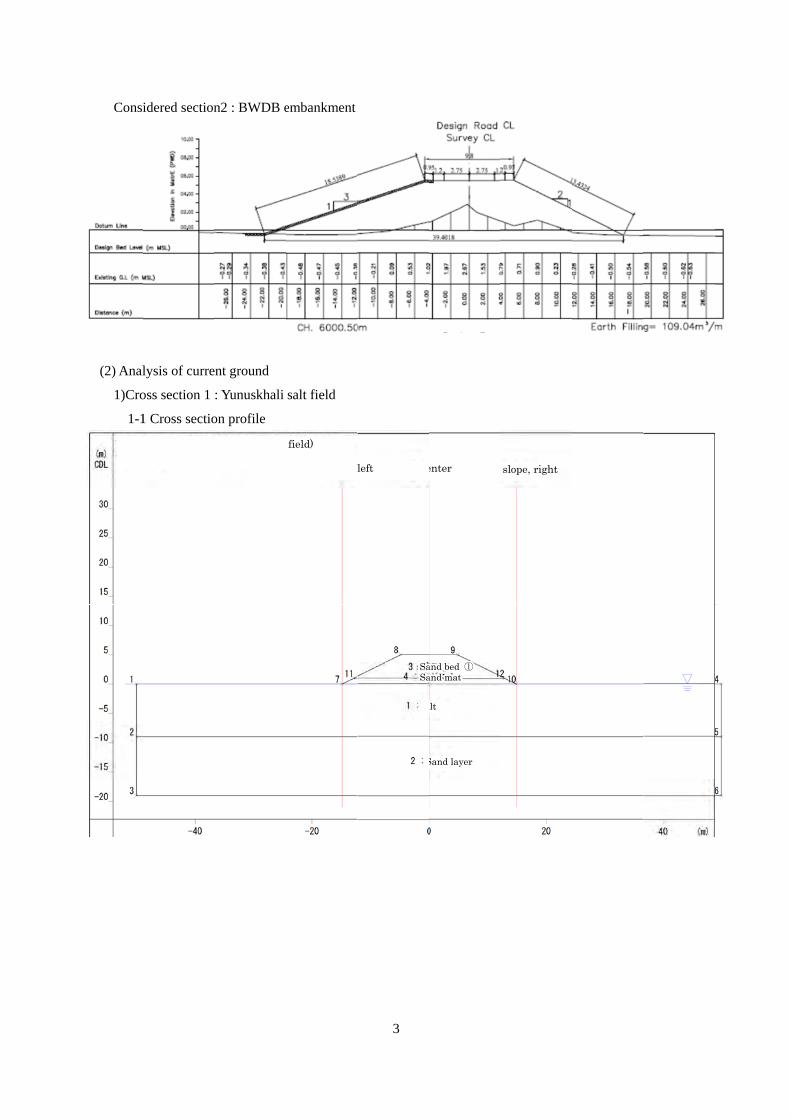
Consi
(2) Anal
1)Cro
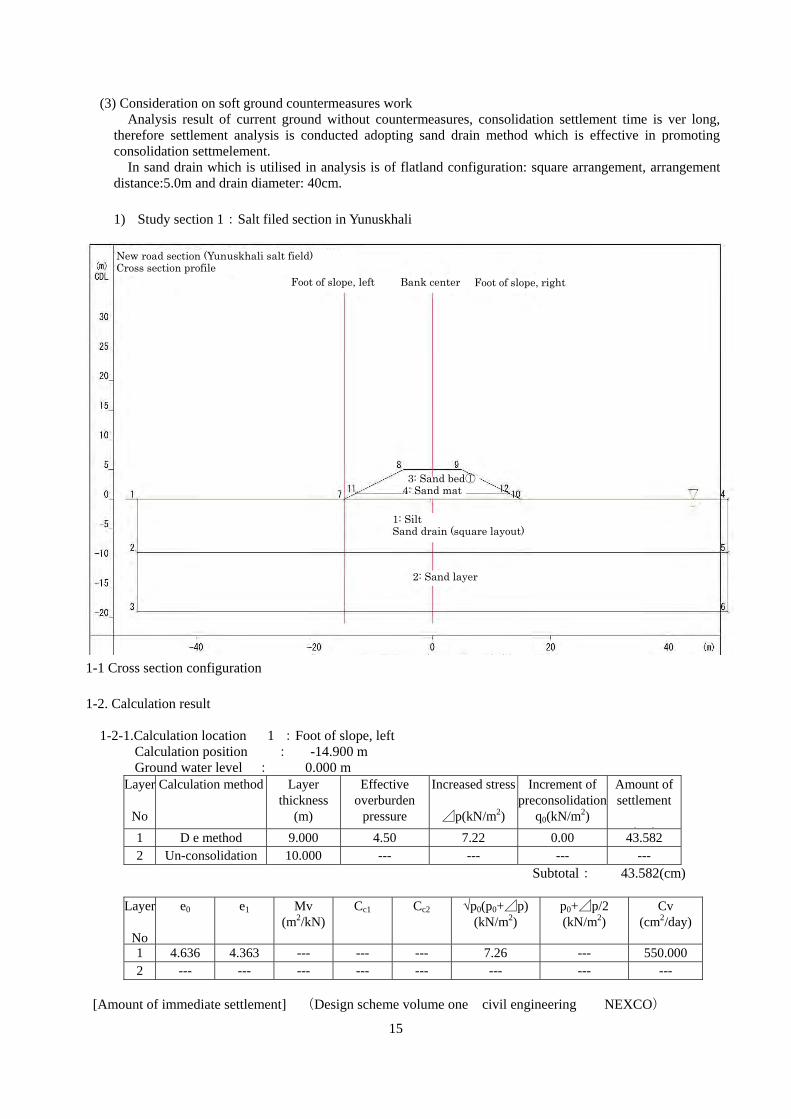
1-1
New rCross
idered section
lysis of curre
oss section 1
1 Cross sectio
road section (Ys section profile
n2 : BWDB e
ent ground
: Yunuskhali
on profile
Yunuskhali salt e
embankment
salt field
field)
Foot of slope, l
3
left Bank ce
SaSa
Si
S
enter Foot of
and bed ①and mat
ilt
Sand layer
slope, right

4
1-2. Calculation result
1-2-1. Calculation location 1 : Foot of slope, left Calculation position : -14.900 m Ground water level : 0.000 m
Layer
No
Calculation method
Layer thickness
(m)
Effective overburden
pressure p0(kN/m2)
Increased stress
⊿p(kN/m2)
Increment of preconsolidation
q0(kN/m2)
Settlement
(cm)
1 � e method 9.000 4.50 7.22 0.00 43.582
2 Un-consolidation layer
10.000 --- --- --- ---
Subtotal: 43.582(cm)
Layer
No
e0 e1 Mv (m2/kN)
Cc1 Cc2 √p0(p0+⊿p)(kN/m2)
p0+⊿p/2 (kN/m2)
Cv (cm2/day)
1 4.636 4.363 --- --- --- 7.26 --- 550.000
2 --- --- --- --- --- --- --- --- [Amount of immediate settlement] (Design scheme volume one civil engineering NEXCO)
Load
step
Immediate
settlement
factor 1
[Amount of immediate settlement] (Design scheme volume one civil engineering NEXCO)
Layer
No
Average of E50
Amount of immediate settlement
1 0.000 0.000 2 0.000 0.000
Subtotal (Immediate settlement): 0.000(cm) Total(End amount of settlement): 43.582(cm) [Cross section profile] [Residual amount of settlement] Degree of consolidation:100%(Calculation location= 0.000m)
Standing duration: 621days Layer
No
Output Degree of
consolidation (%)
Amount of settlement
(cm)
Settlement degree of consolidation
in standing duration
(%)
Conversion layer degree of consolidation after standing
duration (%)
Amount of settlement in
standing duration
(cm)
1 100.000 43.582 68.858 --- 30.010 2 --- --- --- --- ---
Subtotal(Amount of settlement): 43.582(cm)
Subtotal (amount of settlement in standing duration): 30.010(cm) Residual amount of settlement: 13.572(cm)
5
1-2-2.Caluculation location 2 :Bank center Calculation position : 0.000 m Ground water level : 0.000 m
Layer
No
Calculations method Layer thickness
(m)
Effective overburden
pressure p0(kN/m2)
Increased stress
⊿p(kN/m2)
Increment of preconsolidation
q0(kN/m2)
Settlement
(cm)
4 Un-consolidation layer
1.000 --- --- --- ---
1 � e method 9.000 22.50 65.88 0.00 103.7682 Un-consolidation
layer 10.000 --- --- --- ---
Subtotal: 103.768(cm)
Layer
No
e0 e1 Mv (m2/kN)
Cc1 Cc2 √p0(p0+⊿p)(kN/m2)
p0+⊿p/2 (kN/m2)
Cv (cm2/day)
4 --- --- --- --- --- --- --- ---1 4.145 3.551 --- --- --- 44.59 --- 550.0002 --- --- --- --- --- --- --- ---
[Amount of immediate settlement](Design scheme volume one civil engineering NEXCO)
Load
step
Immediate settlement
factor 1
[Amount of immediate settlement] (Design scheme volume one civil engineering NEXCO)
Layer
No
Average of E50
Amount of Immediate settlement
(cm) 4 0.000 0.000 1 0.000 0.000 2 0.000 0.000
Subtotal(Immediate settlement): 0.000(cm) Total(End amount of settlement): 103.768(cm) [Cross section profile] [Residual amount of settlement] Degree of consolidation:100%(Calculation location= 0.000m)
Standing duration: 147days Layer
No
Output Degree of
Consolidation (%)
Amount of settlement
(cm)
Settlement degree of consolidation in standing duration
(%)
Conversion layer degree of
consolidation after standing
duration (%)
Amount of settlement in
standing duration
(cm)
4 --- --- --- --- --- 1 100.000 103.768 28.959 --- 30.050 2 --- --- --- --- ---
Subtotal(Amount of settlement): 103.768(cm) Subtotal(Amount of settlement in standing duration): 30.050(cm)
Residual amount of settlement: 73.718(cm)

6
1-2-3.Calcuation location 3 :Foot of slope, right
Calculation position : 14.900 m Ground water level : 0.000 m
Layer
No
Calculation method Layer thickness
(m)
Effective overburden
pressure p0(kN/m2)
Increased stress⊿p(kN/m2)
Increment of preconsolidation
q0(kN/m2)
Amount of settlement
(cm)
1 D e method 9.000 4.50 7.22 0.00 43.5822 Un-consolidation 10.000 --- --- --- ---
Subtotal: 43.582(cm) Layer
No
e0 e1 Mv (m2/kN)
Cc1 Cc2 √p0(p0+⊿p)(kN/m2)
p0+⊿p/2 (kN/m2)
Cv (cm2/day)
1 4.636 4.363 --- --- --- 7.26 --- 550.0002 --- --- --- --- --- --- --- ---
[Amount of immediate settlement] (Design scheme volume one civil engineering NEXCO)
Load ste
Immediate settlement
factor 1
[Amount of immediate settlement] (Design scheme volume one civil engineering NEXCO)
Layer
No
Average of E50
Amount of immediate settlement
(cm) 1 0.000 0.000 2 0.000 0.000
Subtotal(Amount of immediate settlement): 0.000(cm) Total(End amount of settlement): 43.582(cm) [Cross section profile] [Residual amount of settlement] Degree of consolidation:100%(Calculation location= 0.000m)
Standing duration: 621 days Layer
No
Output degree of consolidation
(%)
Amount of settlement
(cm)
Settlement degree of consolidation in standing duration
(%)
Conversion layer degree of
consolidation after standing
duration (%)
Amount of settlement
(cm)
1 100.000 43.582 68.858 --- 30.010 2 --- --- --- --- ---
Subtotal(Amount of settlement): 43.582(cm) Subtotal(Amount of settlement in standing duration): 30.010(cm)
Residual amount of settlement: 13.572(cm)

7
1-2-4. Degree of consolidation - elapsed days Calculation location 1 :Foot of slope, left Calculation position : -14.900 m All layers degree of consolidation
Degree of consolidation
10 20 30 40 50 60 70 80 90 100
Elapsed days 62 98 155 236 340 472 644 886 1299 ---Amount of settlement
4.358 8.716 13.075 17.433 21.791 26.149 30.508 34.866 39.224 43.582
1st layer Soil layer:silt
Degree of consolidation
10 20 30 40 50 60 70 80 90 100
Elapsed days 62 98 155 236 340 472 644 886 1299 ---Amount of settlement
4.358 8.716 13.075 17.433 21.791 26.149 30.508 34.866 39.224 43.582
2nd layer Soil layer: sand layer
Degree of consolidation
10 20 30 40 50 60 70 80 90 100
Elapsed days --- --- --- --- --- --- --- --- --- ---Amount of --- --- --- --- --- --- --- --- --- ---
Calculation location 2 :Bank center Calculation position : 0.000 m All layers degree of consolidation
Degree of consolidation
10 20 30 40 50 60 70 80 90 100
Elapsed days 62 98 155 236 340 472 644 886 1299 ---
Amount of settlement
10.377 20.754 31.130 41.507 51.884 62.261 72.638 83.015 93.391 103.768
4th layer Soil layer:Sand mat Degree of
consolidation 10 20 30 40 50 60 70 80 90 100
Elapsed days --- --- --- --- --- --- --- --- --- ---
Amount of settlement
--- --- --- --- --- --- --- --- --- ---
1st layer Soil layer: silt Degree of
consolidation 10 20 30 40 50 60 70 80 90 100
Elapsed days 62 98 155 236 340 472 644 886 1299 ---Amount of settlement
10.377 20.754 31.130 41.507 51.884 62.261 72.638 83.015 93.391 103.768
2nd layer Soil layer:Sand layer Degree of
consolidation 10 20 30 40 50 60 70 80 90 100
Elapsed days --- --- --- --- --- --- --- --- --- ---
Amount of settlement
--- --- --- --- --- --- --- --- --- ---

8
Calculation location 3 :Foot of slope, right Calculation position : 14.900 m All layers degree of consolidation
Degree of consolidation
10 20 30 40 50 60 70 80 90 100
Elapsed days 62 98 155 236 340 472 644 886 1299 ---Amount of settlement
4.358 8.716 13.075 17.433 21.791 26.149 30.508 34.866 39.224 43.582
1st layer Soil layer: Silt
Degree of consolidation
10 20 30 40 50 60 70 80 90 100
Elapsed days 62 98 155 236 340 472 644 886 1299 ---Amount of settlement
4.358 8.716 13.075 17.433 21.791 26.149 30.508 34.866 39.224 43.582
2nd layer Soil layer: Sand layer
Degree o f consolidation
10 20 30 40 50 60 70 80 90 100
Elapsed days --- --- --- --- --- --- --- --- --- ---Amount of --- --- --- --- --- --- --- --- --- ---

9
2) Study section 2 :BWDB Embankment
2-1. Cross sectional profile
2-2.Calculation result
2-2-1.Calculation location 1 :Foot of slope, left Calculation position : -29.800 m Ground water level : 0.000 m
Layer
No
Caluculation method
Layer thickness
(m)
Effective overburden
pressure
p0(kN/m2)
Increased stress
⊿p(kN/m2)
Increment of preconsolidation
q0(kN/m2)
Amount of settlement
(cm)
1 � e method 12.000 6.00 4.99 0.00 33.1792 Un-consolidation 7.000 --- --- --- ---
Subtotal: 33.179(cm)
Layer e0 e1 Mv (m2/kN)
Cc1 Cc2 √p0(p0+⊿p)(kN/m2)
p0+⊿p/2 (kN/m2)
Cv (cm2/day)
1 4.531 4.378 --- --- --- 8.12 --- 550.0002 --- --- --- --- --- --- --- ---
[Amount of immediate settlement] (Design scheme volume one civil engineering NEXCO)
Load step
Immediate settlement
1 [Amount of immediate settlement] (Design scheme volume one civil engineering NEXCO)
No
Average of E50
Amount of immediate settlement
New road section (BWDB Embankment) Cross section profile
Foot of slope, left Bank center Foot of slope, right
Sand bed ①Sand mat
Silt
Sand layer
10
1 0.000 0.000 2 0.000 0.000
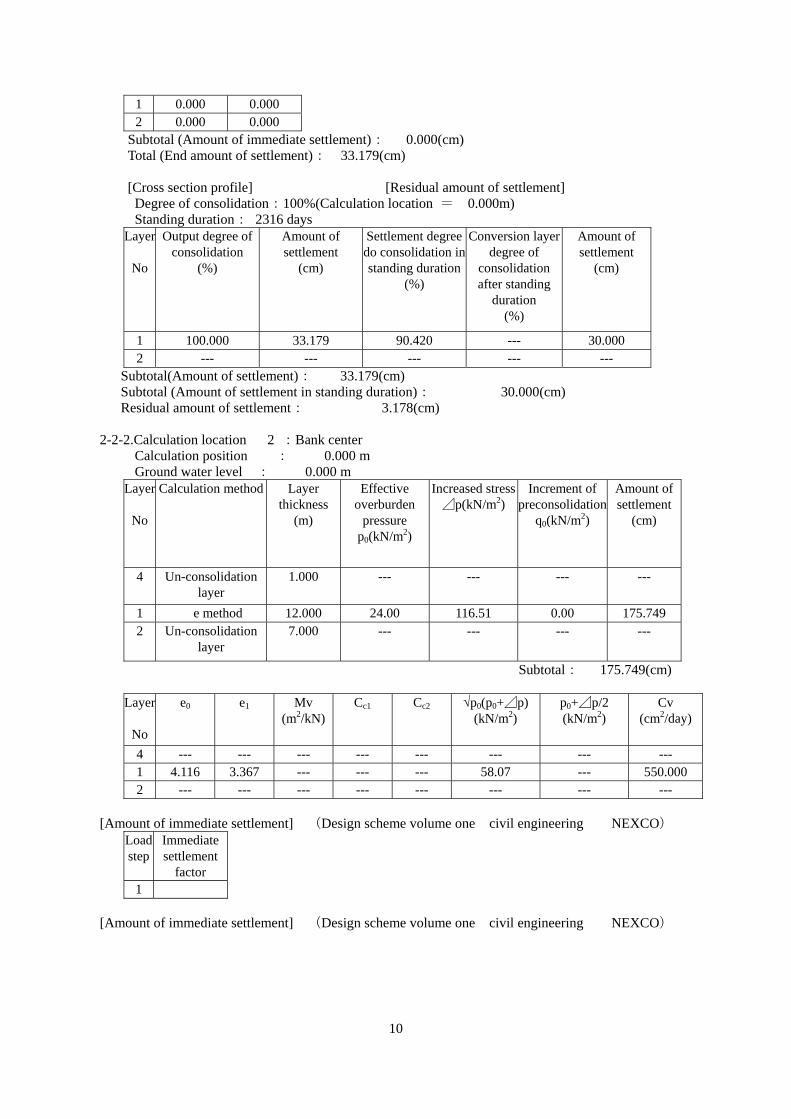
Subtotal (Amount of immediate settlement): 0.000(cm) Total (End amount of settlement): 33.179(cm) [Cross section profile] [Residual amount of settlement] Degree of consolidation:100%(Calculation location = 0.000m)
Standing duration: 2316 days Layer
No
Output degree of consolidation
(%)
Amount of settlement
(cm)
Settlement degree do consolidation in standing duration
(%)
Conversion layer degree of
consolidation after standing
duration (%)
Amount of settlement
(cm)
1 100.000 33.179 90.420 --- 30.000 2 --- --- --- --- ---
Subtotal(Amount of settlement): 33.179(cm) Subtotal (Amount of settlement in standing duration): 30.000(cm)
Residual amount of settlement: 3.178(cm)
2-2-2.Calculation location 2 :Bank center Calculation position : 0.000 m Ground water level : 0.000 m
Layer
No
Calculation method Layer thickness
(m)
Effective overburden
pressure p0(kN/m2)
Increased stress⊿p(kN/m2)
Increment of preconsolidation
q0(kN/m2)
Amount of settlement
(cm)
4 Un-consolidation layer
1.000 --- --- --- ---
1 � e method 12.000 24.00 116.51 0.00 175.7492 Un-consolidation
layer 7.000 --- --- --- ---
Subtotal: 175.749(cm)
Layer
No
e0 e1 Mv (m2/kN)
Cc1 Cc2 √p0(p0+⊿p)(kN/m2)
p0+⊿p/2 (kN/m2)
Cv (cm2/day)
4 --- --- --- --- --- --- --- ---1 4.116 3.367 --- --- --- 58.07 --- 550.0002 --- --- --- --- --- --- --- ---
[Amount of immediate settlement] (Design scheme volume one civil engineering NEXCO)
Load step
Immediate settlement
factor 1
[Amount of immediate settlement] (Design scheme volume one civil engineering NEXCO)
11
Layer
No
Average of E50
Amount of immediate settlement
(cm)
4 0.000 0.000 1 0.000 0.000 2 0.000 0.000
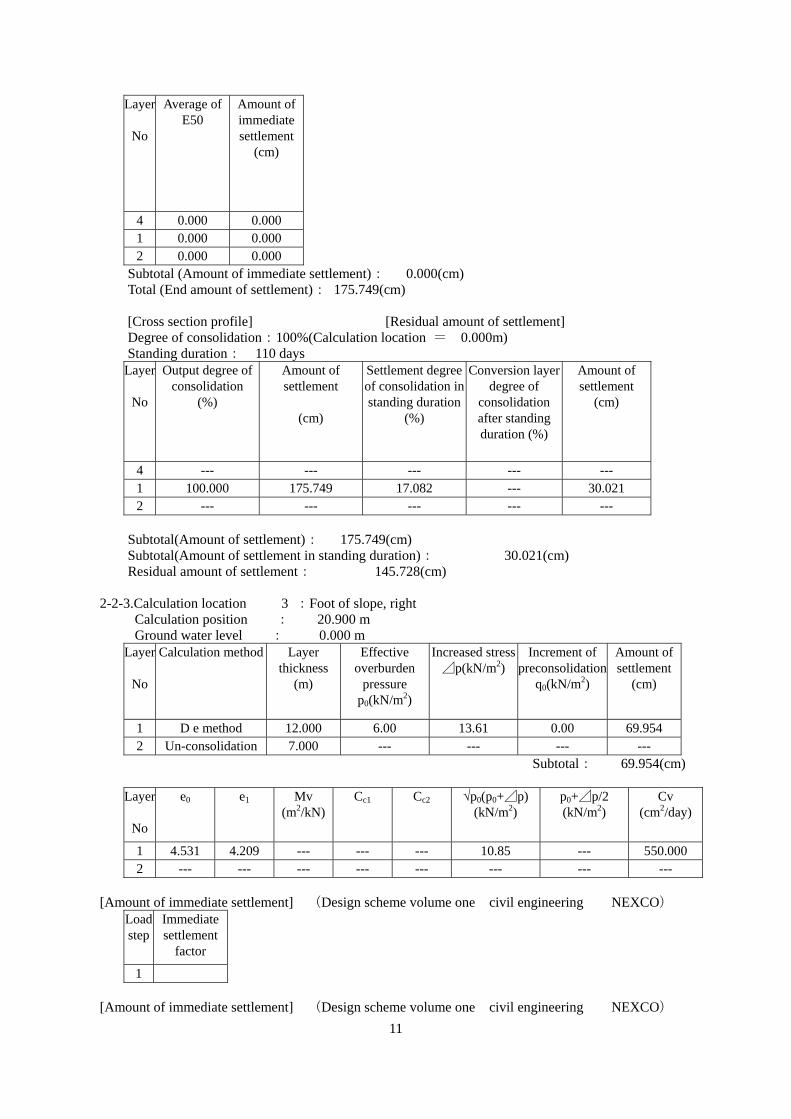
Subtotal (Amount of immediate settlement): 0.000(cm) Total (End amount of settlement): 175.749(cm) [Cross section profile] [Residual amount of settlement] Degree of consolidation:100%(Calculation location = 0.000m)
Standing duration: 110 days Layer
No
Output degree of consolidation
(%)
Amount of settlement
(cm)
Settlement degree of consolidation in standing duration
(%)
Conversion layer degree of
consolidation after standing duration (%)
Amount of settlement
(cm)
4 --- --- --- --- --- 1 100.000 175.749 17.082 --- 30.021 2 --- --- --- --- ---
Subtotal(Amount of settlement): 175.749(cm)
Subtotal(Amount of settlement in standing duration): 30.021(cm) Residual amount of settlement: 145.728(cm)
2-2-3.Calculation location 3 :Foot of slope, right Calculation position : 20.900 m Ground water level : 0.000 m
Layer
No
Calculation method Layer thickness
(m)
Effective overburden
pressure p0(kN/m2)
Increased stress⊿p(kN/m2)
Increment of preconsolidation
q0(kN/m2)
Amount of settlement
(cm)
1 D e method 12.000 6.00 13.61 0.00 69.9542 Un-consolidation 7.000 --- --- --- ---
Subtotal: 69.954(cm)
Layer
No
e0 e1 Mv (m2/kN)
Cc1 Cc2 √p0(p0+⊿p)(kN/m2)
p0+⊿p/2 (kN/m2)
Cv (cm2/day)
1 4.531 4.209 --- --- --- 10.85 --- 550.0002 --- --- --- --- --- --- --- ---
[Amount of immediate settlement] (Design scheme volume one civil engineering NEXCO)
Load step
Immediate settlement
factor
1 [Amount of immediate settlement] (Design scheme volume one civil engineering NEXCO)

12
Layer
No
Average of E50
Amount of immediate settlement
(cm)
1 0.000 0.000 2 0.000 0.000
Subtotal (Amount of immediate settlement): 0.000(cm) Total (End amount of settlement): 69.954(cm) [Cross section profile] [Residual amount of settlement] Degree of consolidation:100%(Calculation location = 0.000m)
Standing duration: 429 days Layer
No
Output degree of consolidation
(%)
Amount of settlement
(cm)
Settlement degree of consolidation in standing duration
(%)
Conversion layer degree of
consolidation after standing
duration (%)
Amount of settlement in
standing duration(cm)
1 100.000 69.954 42.926 --- 30.029 2 --- --- --- --- ---
Subtotal (Amount of settlement): 69.954(cm)
Subtotal(Amount of settlement in standing duration): 30.029(cm) Residual amount of settlement: 39.926(cm)

13
2-2-4. Degree of consolidation – Elapsed days Calculation location 1 :Foot of slope, left Calculation position : -29.800 m All layers degree of consolidation
Degree of consolidation
10 20 30 40 50 60 70 80 90 100
Elapsed days 75 133 236 380 566 800 1105 1535 2271 ---Amount of settlement
3.318 6.636 9.954 13.271 16.589 19.907 23.225 26.543 29.861 33.179
1st layer Soil layer:Silt Degree of
consolidation 10 20 30 40 50 60 70 80 90 100
Elapsed days 75 133 236 380 566 800 1105 1535 2271 ---
Amount of settlement
3.318 6.636 9.954 13.271 16.589 19.907 23.225 26.543 29.861 33.179
2nd layer Soil layer:Sand layer Degree of
consolidation 10 20 30 40 50 60 70 80 90 100
Elapsed days --- --- --- --- --- --- --- --- --- ---
Amount of settlement
--- --- --- --- --- --- --- --- --- ---
Calculation location 2 :Bank center Calculation position : 0.000 m All layers degree of consolidation
Degree of consolidation
10 20 30 40 50 60 70 80 90 100
Elapsed days 75 133 236 380 566 800 1105 1535 2271 ---Amount of settlement
17.575 35.150 52.725 70.299 87.874 105.449 123.024 140.599 158.174 175.749
4th layer Soil layer:Sand mat Degree of
consolidation 10 20 30 40 50 60 70 80 90 100
Elapsed days --- --- --- --- --- --- --- --- --- ---Amount of settlement
--- --- --- --- --- --- --- --- --- ---
1st layer Soil layer:Silt Degree of
consolidation 10 20 30 40 50 60 70 80 90 100
Elapsed days 75 133 236 380 566 800 1105 1535 2271 ---
Amount of settlement
17.575 35.150 52.725 70.299 87.874 105.449 123.024 140.599 158.174 175.749
2nd layer Soil layer:Sand layer Degree of
consolidation 10 20 30 40 50 60 70 80 90 100
Elapsed days --- --- --- --- --- --- --- --- --- ---
Amount of settlement
--- --- --- --- --- --- --- --- --- ---

14
Calculation location 3 :Foot of slope, right Calculation position : 20.900 m All layers degree of consolidation
degree of 10 20 30 40 50 60 70 80 90 100Elapsed days 75 133 236 380 566 800 1105 1535 2271 ---Amount of 6.995 13.991 20.986 27.982 34.977 41.973 48.968 55.963 62.959 69.954
1st layer Soil layer : Silt degree of 10 20 30 40 50 60 70 80 90 100
Elapsed days 75 133 236 380 566 800 1105 1535 2271 ---Amount of 6.995 13.991 20.986 27.982 34.977 41.973 48.968 55.963 62.959 69.954
2nd layer Soil layer : Sand layer degree of 10 20 30 40 50 60 70 80 90 100
Elapsed days --- --- --- --- --- --- --- --- --- ---Amount of --- --- --- --- --- --- --- --- --- ---
3)Analysis result At Yunuskhali salt field, 886 days are required to achieve 80% degree of consolidation and at BWDB
embankment, 1535 days are required to achieve 80% degrer of consolidation. From the above result, because time required for resettlment is long, consolidation settlement promoting
work is necessary as countermeasure.
15
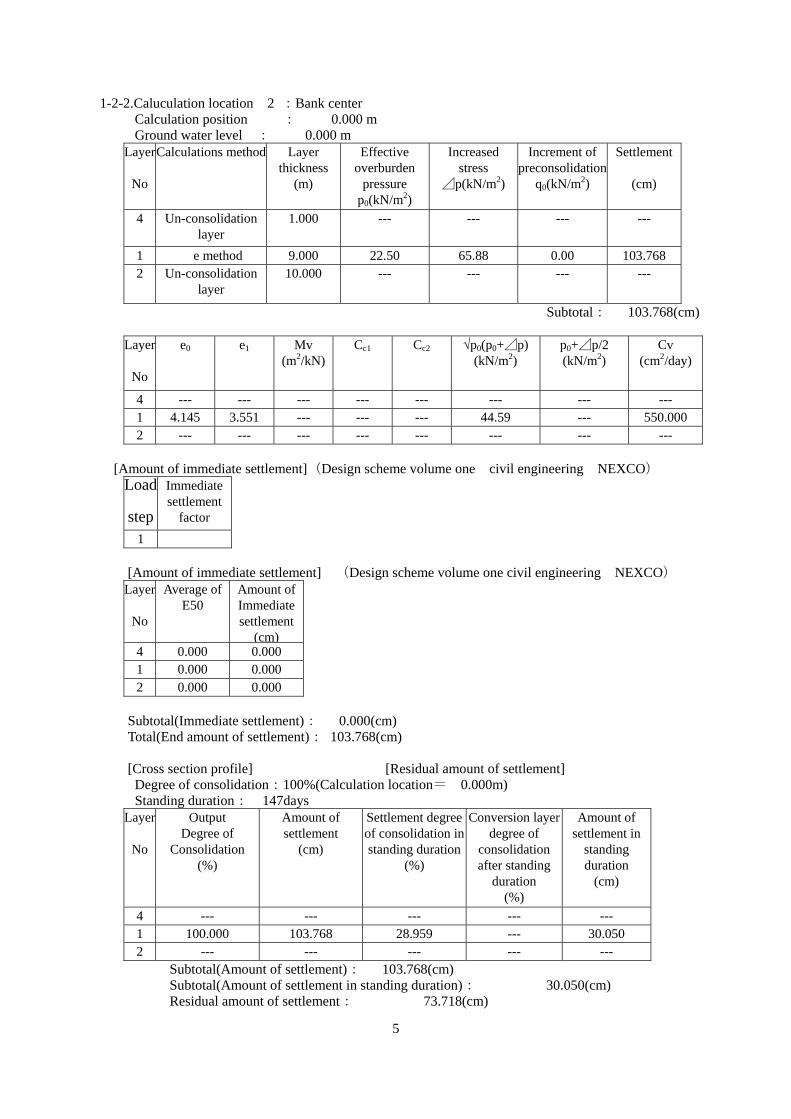
(3) Consideration on soft ground countermeasures work Analysis result of current ground without countermeasures, consolidation settlement time is ver long,
therefore settlement analysis is conducted adopting sand drain method which is effective in promoting consolidation settmelement.
In sand drain which is utilised in analysis is of flatland configuration: square arrangement, arrangement distance:5.0m and drain diameter: 40cm.
1) Study section 1:Salt filed section in Yunuskhali
1-1 Cross section configuration
1-2. Calculation result
1-2-1.Calculation location 1 :Foot of slope, left Calculation position : -14.900 m Ground water level : 0.000 m
Layer
No
Calculation method Layer thickness
(m)
Effective overburden
pressure
Increased stress
⊿p(kN/m2)
Increment of preconsolidation
q0(kN/m2)
Amount of settlement
( )1 D e method 9.000 4.50 7.22 0.00 43.582
2 Un-consolidation 10.000 --- --- --- --- Subtotal: 43.582(cm)
Layer
No
e0 e1 Mv (m2/kN)
Cc1 Cc2 √p0(p0+⊿p)(kN/m2)
p0+⊿p/2 (kN/m2)
Cv (cm2/day)
1 4.636 4.363 --- --- --- 7.26 --- 550.0002 --- --- --- --- --- --- --- ---
[Amount of immediate settlement] (Design scheme volume one civil engineering NEXCO)
New road section (Yunuskhali salt field) Cross section profile
Foot of slope, left Bank center Foot of slope, right
3: Sand bed①4: Sand mat
1: SiltSand drain (square layout)
2: Sand layer

16
Load step
Immediate settlement
factor
1 [Amount of immediate settlement] (Design scheme volume one civil engineering NEXCO)
Layer
No
Average of E50
Amount of immediate settlement
(cm) 1 0.000 0.000 2 0.000 0.000
Subtotal(Amount of immediate settlement): 0.000(cm) Total(End amount of settlement): 43.582(cm) [Cross section profile] [Residual amount of settlement] Degree of consolidation:100%(Calculation location = 0.000m)
Standing duration: 212 日 Layer
No
Output degree of consolidation
(%)
Amount of settlement
(cm)
Settlement degree of consolidation in standing duration
(%)
Conversion layer degree of
consolidation after standing
duration (%)
Amount of settlement in
standing duration
(cm)
1 100.000 43.582 69.047 --- 30.092 2 --- --- --- --- ---
Subtotal(Amount of settlement): 43.582(cm) Subtotal(Amount of settlement in standing duration): 30.092(cm)
Residual amount of settlement: 13.490(cm)
1-2-2.Calculation location 2 :Bank center Calculation position : 0.000 m Ground water level : 0.000 m
Layer
No
Calculation method Layer thickness
(m)
Effective overburden
pressure p0(kN/m2)
Increased stress⊿p(kN/m2)
Increment of preconsolidation
q0(kN/m2)
Amount of settlement
(cm)
4 Un-consolidation 1.000 --- --- --- --- 1 � e method 9.000 22.50 65.88 0.00 103.7682 Un-consolidation 10.000 --- --- --- ---
Subtotal: 103.768(cm)
Layer
No
e0 e1 Mv (m2/kN)
Cc1 Cc2 √p0(p0+⊿p)(kN/m2)
p0+⊿p/2 (kN/m2)
Cv (cm2/day)
4 --- --- --- --- --- --- --- ---1 4.145 3.551 --- --- --- 44.59 --- 550.0002 --- --- --- --- --- --- --- ---
[Amount of immediate settlement] (Design scheme volume one civil engineering NEXCO)
Load step
Immediate settlement
factor
1

17
[Amount of immediate settlement] (Design scheme volume one civil engineering NEXCO) Layer
No
Average of E50
Amount of immediate settlement
(cm)
4 0.000 0.000 1 0.000 0.000 2 0.000 0.000
Subtotal(Amount of immediate settlement): 0.000(cm) Total(End amount of settlement): 103.768(cm) [Cross section profile] [Residual amount of settlement] degree of consolidation:100%(Calculation location = 0.000m)
Standing duration: 98 days
Layer
No
Output degree of consolidation
(%)
Amount of settlement
(cm)
Settlement degree of consolidation in standing duration
(%)
Conversion layer degree of
consolidation after standing duration (%)
Amount of settlement
(cm)
4 --- --- --- --- --- 1 100.000 103.768 29.265 --- 30.368 2 --- --- --- --- ---
Subtotal(Amount of settlement): 103.768(cm) Subtotal(Amount of settlement in standing duration): 30.368(cm)
Residual amount of settlement: 73.400(cm)
1-2-3.Calculation location 3 :Foot of slope, right Calculation position : 14.900 m Ground water level : 0.000 m
Layer
No
Calculation method Layer thickness
(m)
Effective overburden
pressure p0(kN/m2)
Increased stress⊿p(kN/m2)
Increment of preconsolidation
q0(kN/m2)
Amount of settlement
(cm)
1 � e method 9.000 4.50 7.22 0.00 43.5822 Un-consolidation 10.000 --- --- --- ---
Subtotal: 43.582(cm)
Layer
No
e0 e1 Mv (m2/kN)
Cc1 Cc2 √p0(p0+⊿p)(kN/m2)
p0+⊿p/2 (kN/m2)
Cv (cm2/day)
1 4.636 4.363 --- --- --- 7.26 --- 550.0002 --- --- --- --- --- --- --- ---
[Amount of immediate settlement] (Design scheme volume one civil engineering NEXCO)
Load step
Immediate settlement
factor 1
[Amount of immediate settlement] (Design scheme volume one civil engineering NEXCO)

18
Layer No
Average of E5
Amount of immediate settlement Amount of settlement
(cm)
1 0.000 0.000 2 0.000 0.000
Subtotal (Amount of immediate settlement): 0.000(cm) Total (End amount of settlement): 43.582(cm) [Cross section profile] [Residual amount of settlement] Degree of consolidation:100%(Calculation location = 0.000m)
Standing duration: 212 days Layers
No
Output degree of consolidation
(%)
Amount of settlement
(cm)
Settlement degree of consolidation in standing duration
(%)
Conversion layer degree of
consolidation after standing
duration (%)
Amount of settlement in
standing duration
(cm)
1 100.000 43.582 69.047 --- 30.092 2 --- --- --- --- ---
Subtotal(Amount of settlement): 43.582(cm) Subtotal(Amount of settlement in standing duration): 30.092(cm)
Residual amount of settlement: 13.490(cm)

19
1-2-4.Degree of consolidation-Elapsed days
Calculation location 1 :Foot of slope, left Calculation position : -14.900 m All layers degree of consolidation
Degree of consolidation
10 20 30 40 50 60 70 80 90 100
Elapsed days 56 80 100 121 146 177 217 273 369 ---Amount of settlement
4.358 8.716 13.075 17.433 21.791 26.149 30.508 34.866 39.224 43.582
1st layer Soil layer : Silt Degree of
consolidation 10 20 30 40 50 60 70 80 90 100
Elapsed days 56 80 100 121 146 177 217 273 369 ---
Amount of settlement
4.358 8.716 13.075 17.433 21.791 26.149 30.508 34.866 39.224 43.582
2nd layer Soil layer : Sand layer Degree of
consolidation 10 20 30 40 50 60 70 80 90 100
Elapsed days --- --- --- --- --- --- --- --- --- ---
Amount of settlement
--- --- --- --- --- --- --- --- --- ---
Calculation location 2 :Bank center Calculation position : 0.000 m All layers degree of consolidation
Degree of consolidation
10 20 30 40 50 60 70 80 90 100
Elapsed days 56 80 100 121 146 177 217 273 369 ---
Amount of settlement
10.377 20.754 31.130 41.507 51.884 62.261 72.638 83.015 93.391 103.768
4th layer Soil layer: Sand mat Degree of
consolidation 10 20 30 40 50 60 70 80 90 100
Elapsed days --- --- --- --- --- --- --- --- --- ---
Amount of settlement
--- --- --- --- --- --- --- --- --- ---
1st layer Soil layer : Silt Degree of
consolidation 10 20 30 40 50 60 70 80 90 100
Elapsed days 56 80 100 121 146 177 217 273 369 ---
Amount of settlement
10.377 20.754 31.130 41.507 51.884 62.261 72.638 83.015 93.391 103.768
2nd layer Soil layer : Sand layer Degree of
consolidation 10 20 30 40 50 60 70 80 90 100
Elapsed days --- --- --- --- --- --- --- --- --- ---
Amount of settlement
--- --- --- --- --- --- --- --- --- ---
20
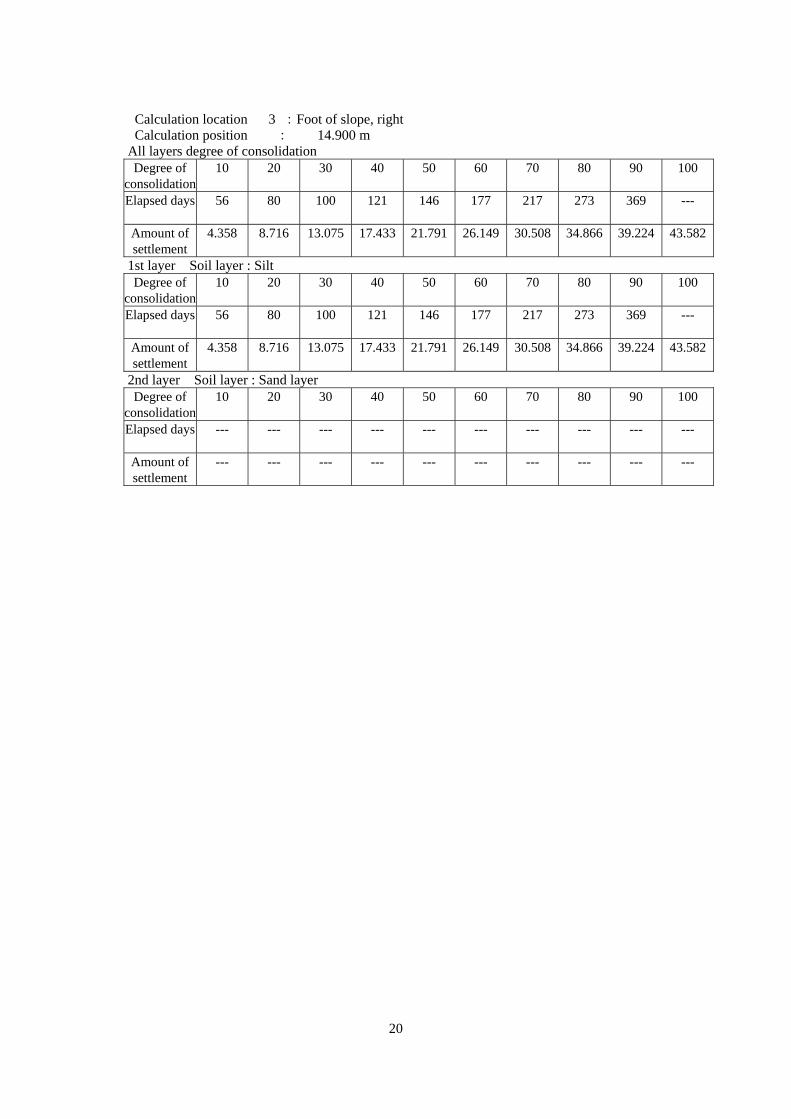
Calculation location 3 :Foot of slope, right Calculation position : 14.900 m All layers degree of consolidation
Degree of consolidation
10 20 30 40 50 60 70 80 90 100
Elapsed days 56 80 100 121 146 177 217 273 369 ---
Amount of settlement
4.358 8.716 13.075 17.433 21.791 26.149 30.508 34.866 39.224 43.582
1st layer Soil layer : Silt Degree of
consolidation 10 20 30 40 50 60 70 80 90 100
Elapsed days 56 80 100 121 146 177 217 273 369 ---
Amount of settlement
4.358 8.716 13.075 17.433 21.791 26.149 30.508 34.866 39.224 43.582
2nd layer Soil layer : Sand layer Degree of
consolidation 10 20 30 40 50 60 70 80 90 100
Elapsed days --- --- --- --- --- --- --- --- --- ---
Amount of settlement
--- --- --- --- --- --- --- --- --- ---
21
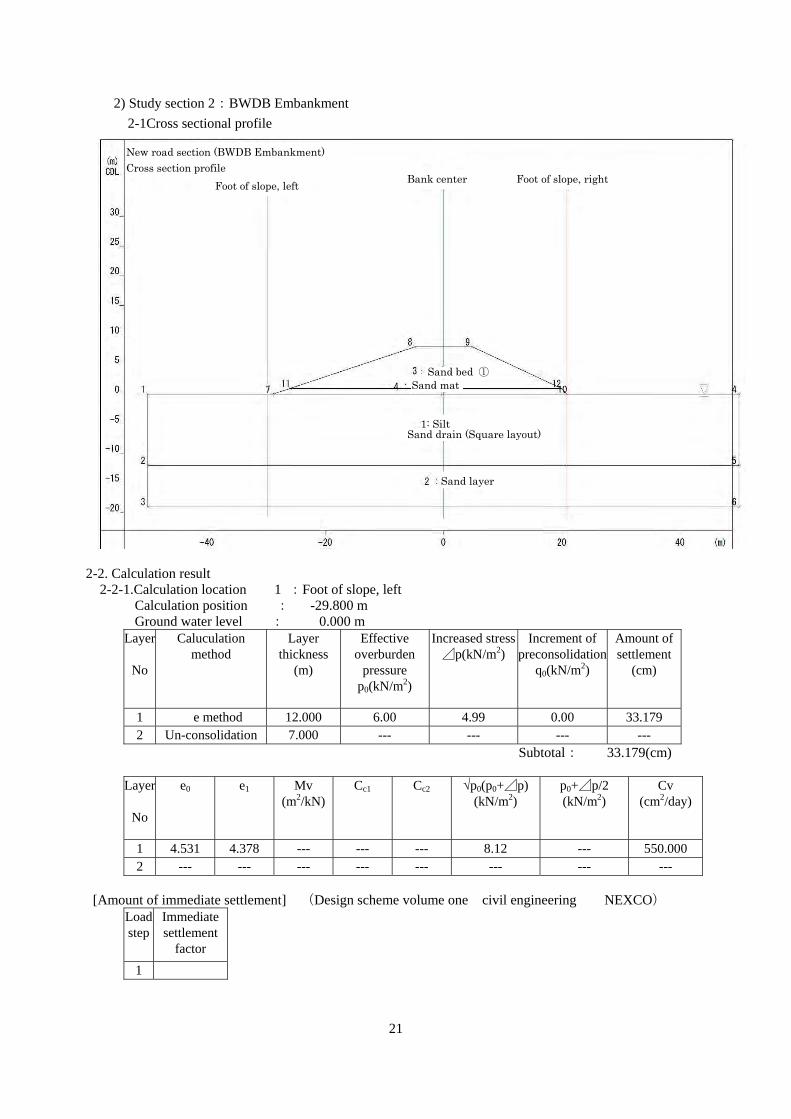
2) Study section 2:BWDB Embankment
2-1Cross sectional profile
2-2. Calculation result
2-2-1.Calculation location 1 :Foot of slope, left Calculation position : -29.800 m Ground water level : 0.000 m
Layer
No
Caluculation method
Layer thickness
(m)
Effective overburden
pressure p0(kN/m2)
Increased stress⊿p(kN/m2)
Increment of preconsolidation
q0(kN/m2)
Amount of settlement
(cm)
1 � e method 12.000 6.00 4.99 0.00 33.1792 Un-consolidation 7.000 --- --- --- ---
Subtotal: 33.179(cm)
Layer
No
e0 e1 Mv (m2/kN)
Cc1 Cc2 √p0(p0+⊿p)(kN/m2)
p0+⊿p/2 (kN/m2)
Cv (cm2/day)
1 4.531 4.378 --- --- --- 8.12 --- 550.0002 --- --- --- --- --- --- --- ---
[Amount of immediate settlement] (Design scheme volume one civil engineering NEXCO)
Load step
Immediate settlement
factor 1
New road section (BWDB Embankment) Cross section profile
Foot of slope, left Foot of slope, right Bank center
Sand bed ①Sand mat
1: Silt Sand drain (Square layout)
Sand layer
22
[Amount of immediate settlement] (Design scheme volume one civil engineering NEXCO) Layer
No
Average of E50
Amount of immediate settlement
(cm) 1 0.000 0.000 2 0.000 0.000
Subtotal(Amount of immediate settlement): 0.000(cm) Total(End amount of settlement): 33.179(cm) [Cross section profile] [Residual amount of settlement] Degree of consolidation:100%(Calculation location = 0.000m)
Standing duration: 375days Layer
No Output degree of
consolidation (%)
Amount of settlement
(cm)
Settlement degree of consolidation in standing duration
(%)
Conversion layer degree of
consolidation after standing
duration (%)
Amount of settlement in
standing duration
(cm)
1 100.000 33.179 90.488 --- 30.023 2 --- --- --- --- ---
Subtotal(Amount of settlement): 33.179(cm) Subtotal(Amount of settlement in standing duration): 30.023(cm)
Residual amount of settlement: 3.156(cm)
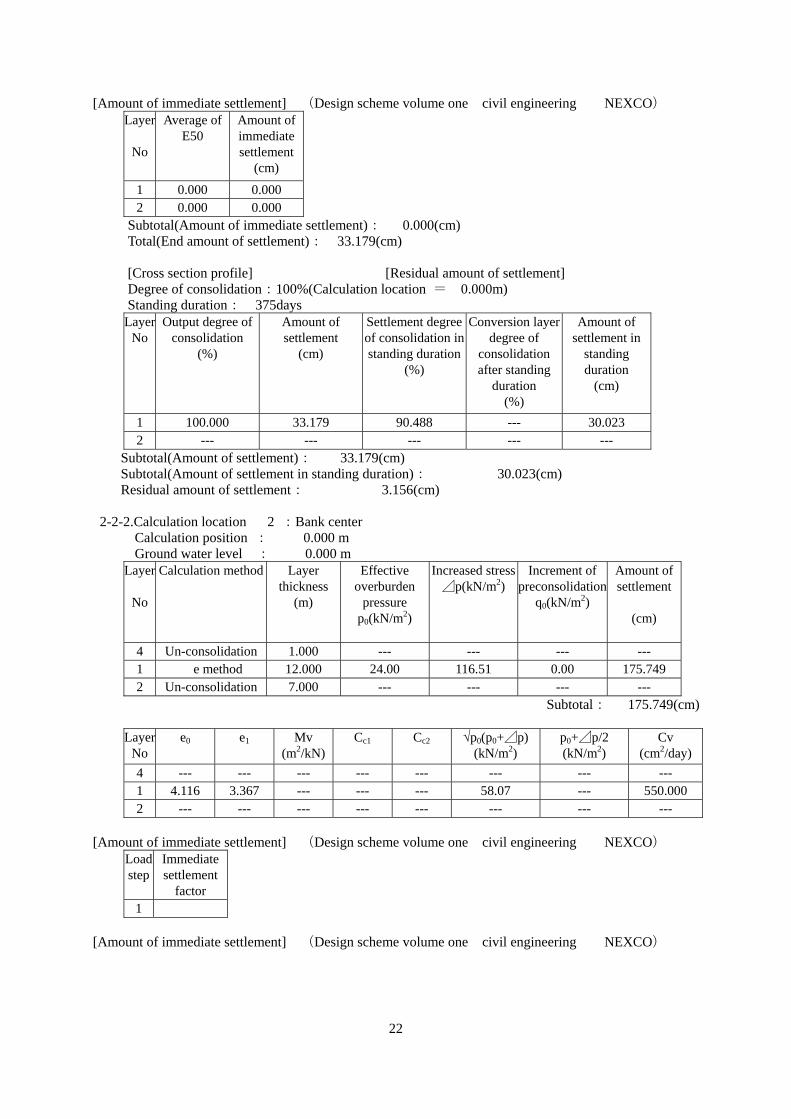
2-2-2.Calculation location 2 :Bank center Calculation position : 0.000 m Ground water level : 0.000 m
Layer
No
Calculation method Layer thickness
(m)
Effective overburden
pressure p0(kN/m2)
Increased stress⊿p(kN/m2)
Increment of preconsolidation
q0(kN/m2)
Amount of settlement
(cm)
4 Un-consolidation 1.000 --- --- --- --- 1 � e method 12.000 24.00 116.51 0.00 175.7492 Un-consolidation 7.000 --- --- --- ---
Subtotal: 175.749(cm)
Layer No
e0 e1 Mv (m2/kN)
Cc1 Cc2 √p0(p0+⊿p)(kN/m2)
p0+⊿p/2 (kN/m2)
Cv (cm2/day)
4 --- --- --- --- --- --- --- ---1 4.116 3.367 --- --- --- 58.07 --- 550.0002 --- --- --- --- --- --- --- ---
[Amount of immediate settlement] (Design scheme volume one civil engineering NEXCO)
Load step
Immediate settlement
factor 1
[Amount of immediate settlement] (Design scheme volume one civil engineering NEXCO)

23
Layer
No
Average of E50
Amount of immediate settlement
(cm)
4 0.000 0.000 1 0.000 0.000 2 0.000 0.000
Subtotal(Amount of immediate settlement): 0.000(cm) Total(End amount of settlement): 175.749(cm) [Cross section profile] [Residual amount of settlement] Degree of consolidation:100%(Calculation location = 0.000m)
Standing duration: 74days
層No
Output degree of consolidation
(%)
Amount of settlement
(cm)
Settlement degree do consolidation in standing duration
(%)
Conversion layer degree of
consolidation after standing
duration (%)
Amount of settlement in
standing duration
(cm)
4 --- --- --- --- --- 1 100.000 175.749 17.388 --- 30.559 2 --- --- --- --- ---
Subtotal(Amount of settlement): 175.749(cm) Subtotal(Amount of settlement in standing duration): 30.559(cm)
Residual amount of settlement: 145.190(cm)
2-2-3.Calculation location 3 :Foot of slope, right Calculation position : 20.900 m Ground water level : 0.000 m
Layer
No
Calculation method Layer thickness
(m)
Effective overburden
pressure p0(kN/m2)
Increased stress⊿p(kN/m2)
Increment of preconsolidation
q0(kN/m2)
Amount of settlement
(cm)
1 � e method 12.000 6.00 13.61 0.00 69.9542 Un-consolidation 7.000 --- --- --- ---
Subtotal: 69.954(cm)
Layer
No
e0 e1 Mv (m2/kN)
Cc1 Cc2 √p0(p0+⊿p)(kN/m2)
p0+⊿p/2 (kN/m2)
Cv (cm2/day)
1 4.531 4.209 --- --- --- 10.85 --- 550.0002 --- --- --- --- --- --- --- ---
[Amount of immediate settlement] (Design scheme volume one civil engineering NEXCO)
Load step
Immediate settlement
factor 1
[Amount of immediate settlement] (Design scheme volume one civil engineering NEXCO)

24
Layer
No
Average of E50
Amount of immediate settlement
(cm)
1 0.000 0.000 2 0.000 0.000
Subtotal(Amount of immediate settlement): 0.000(cm) Total(End amount of settlement): 69.954(cm) [Cross section profile] [Residual amount of settlement] Degree of consolidation:100%(Calculation location = 0.000m)
Standing duration: 128 days Layer
No
Output degree of consolidation
(%)
Amount of settlement
(cm)
Settlement degree of consolidation in standing duration
(%)
Conversion layer degree of
consolidation after standing
duration (%)
Amount of settlement in
standing duration
(cm)
1 100.000 69.954 43.144 --- 30.181 2 --- --- --- --- ---
Subtotal(Amount of settlement): 69.954(cm)
Subtotal(Amount of settlement in standing duration): 30.181(cm) Residual amount of settlement: 39.774(cm)
25
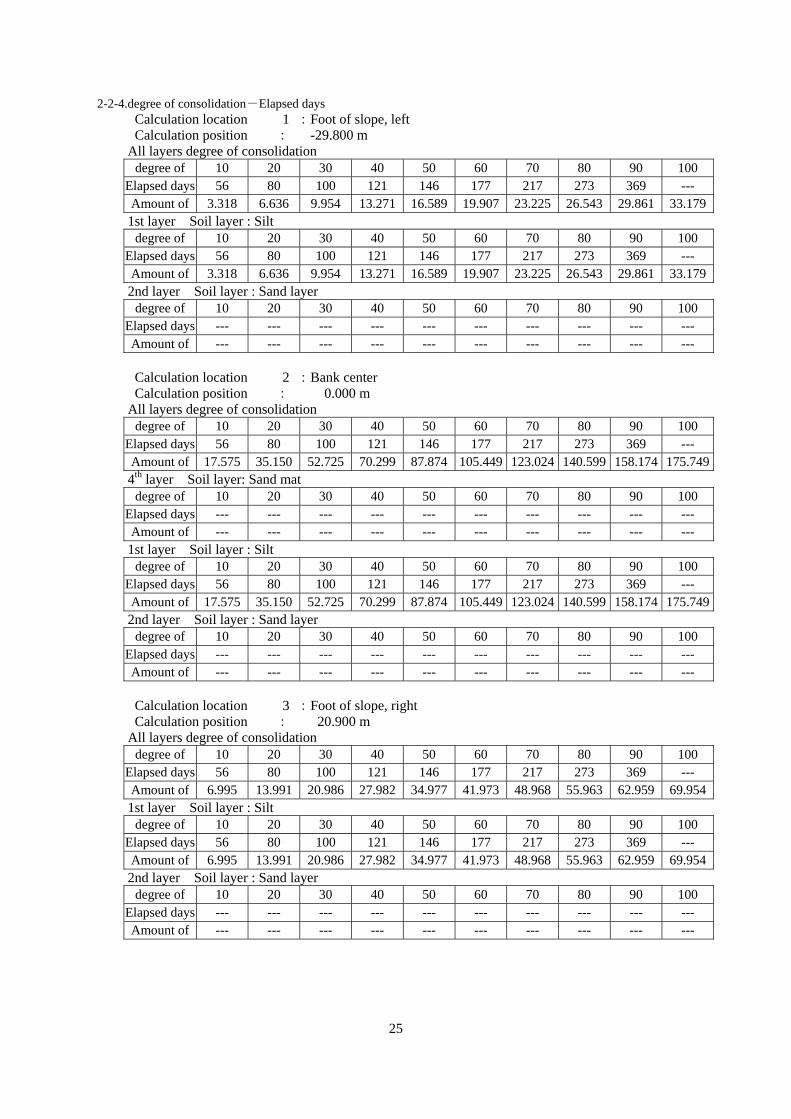
2-2-4.degree of consolidation-Elapsed days Calculation location 1 :Foot of slope, left Calculation position : -29.800 m All layers degree of consolidation
degree of 10 20 30 40 50 60 70 80 90 100Elapsed days 56 80 100 121 146 177 217 273 369 ---Amount of 3.318 6.636 9.954 13.271 16.589 19.907 23.225 26.543 29.861 33.179
1st layer Soil layer : Silt degree of 10 20 30 40 50 60 70 80 90 100
Elapsed days 56 80 100 121 146 177 217 273 369 ---Amount of 3.318 6.636 9.954 13.271 16.589 19.907 23.225 26.543 29.861 33.179
2nd layer Soil layer : Sand layer degree of 10 20 30 40 50 60 70 80 90 100
Elapsed days --- --- --- --- --- --- --- --- --- ---Amount of --- --- --- --- --- --- --- --- --- ---
Calculation location 2 :Bank center Calculation position : 0.000 m All layers degree of consolidation
degree of 10 20 30 40 50 60 70 80 90 100Elapsed days 56 80 100 121 146 177 217 273 369 ---Amount of 17.575 35.150 52.725 70.299 87.874 105.449 123.024 140.599 158.174 175.749
4th layer Soil layer: Sand mat degree of 10 20 30 40 50 60 70 80 90 100
Elapsed days --- --- --- --- --- --- --- --- --- ---Amount of --- --- --- --- --- --- --- --- --- ---
1st layer Soil layer : Silt degree of 10 20 30 40 50 60 70 80 90 100
Elapsed days 56 80 100 121 146 177 217 273 369 ---Amount of 17.575 35.150 52.725 70.299 87.874 105.449 123.024 140.599 158.174 175.749
2nd layer Soil layer : Sand layer degree of 10 20 30 40 50 60 70 80 90 100
Elapsed days --- --- --- --- --- --- --- --- --- ---Amount of --- --- --- --- --- --- --- --- --- ---
Calculation location 3 :Foot of slope, right Calculation position : 20.900 m All layers degree of consolidation
degree of 10 20 30 40 50 60 70 80 90 100Elapsed days 56 80 100 121 146 177 217 273 369 ---Amount of 6.995 13.991 20.986 27.982 34.977 41.973 48.968 55.963 62.959 69.954
1st layer Soil layer : Silt degree of 10 20 30 40 50 60 70 80 90 100
Elapsed days 56 80 100 121 146 177 217 273 369 ---Amount of 6.995 13.991 20.986 27.982 34.977 41.973 48.968 55.963 62.959 69.954
2nd layer Soil layer : Sand layer degree of 10 20 30 40 50 60 70 80 90 100
Elapsed days --- --- --- --- --- --- --- --- --- ---Amount of --- --- --- --- --- --- --- --- --- ---

26
3) Analysis result It is confirmed that implementing sand drain work enables to shorten elapsed days for achieving 80%
degree of consolidation from 1583 days to 273 days. From the above result, considering very long time required for settlement consolidation (4.2 years) and
adopting consolidation promoting work enables to achieve 80% of degree of consolidation for approximately 9 months, “sand drain work” will be adopted as consolidation promoting work at this area.

Appendix-C16.3-5
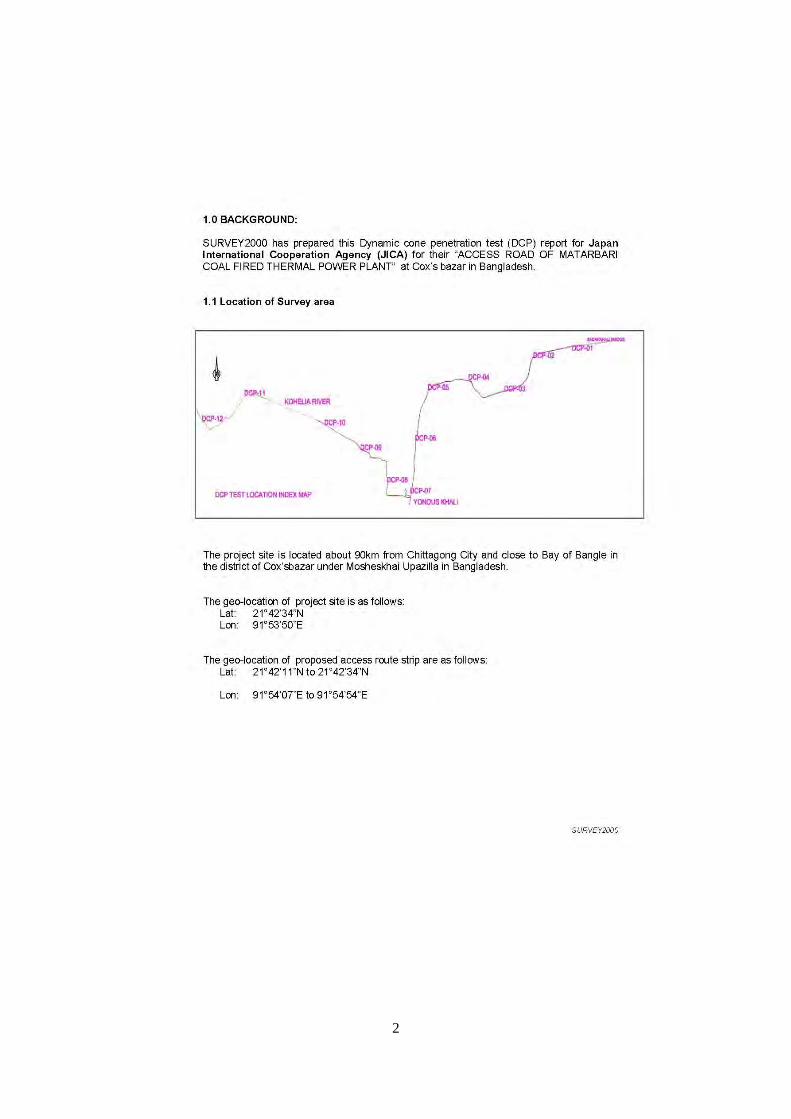
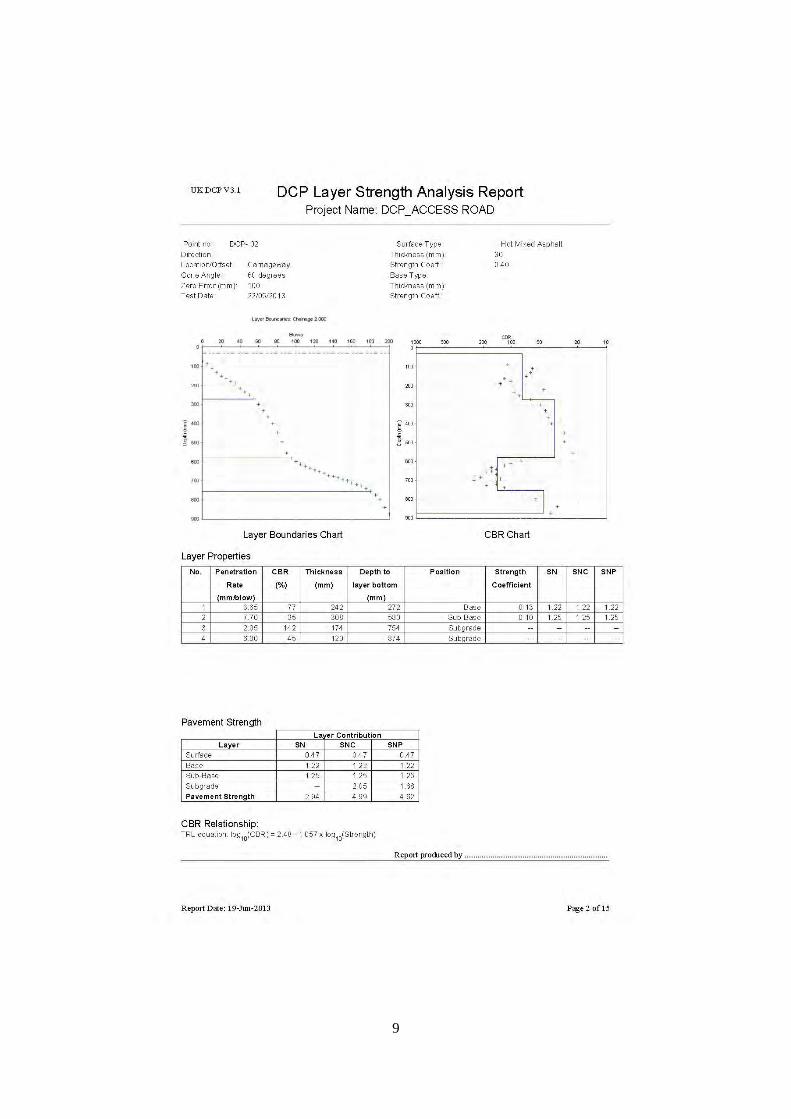
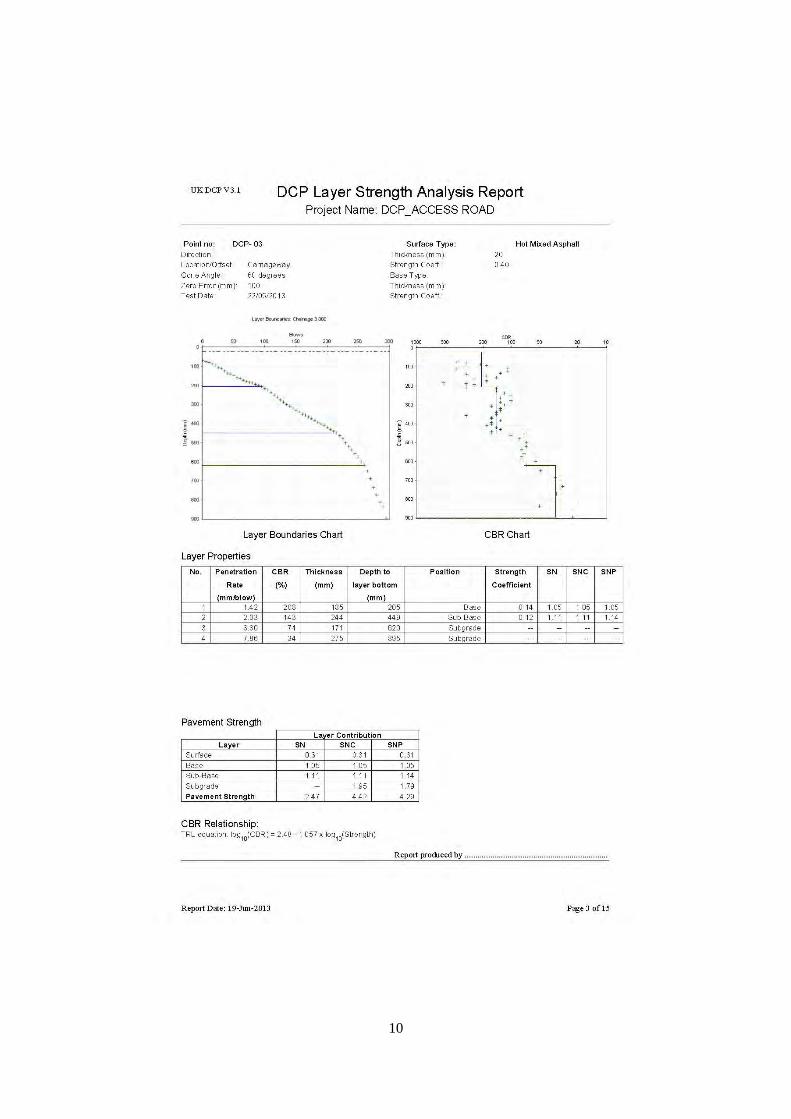
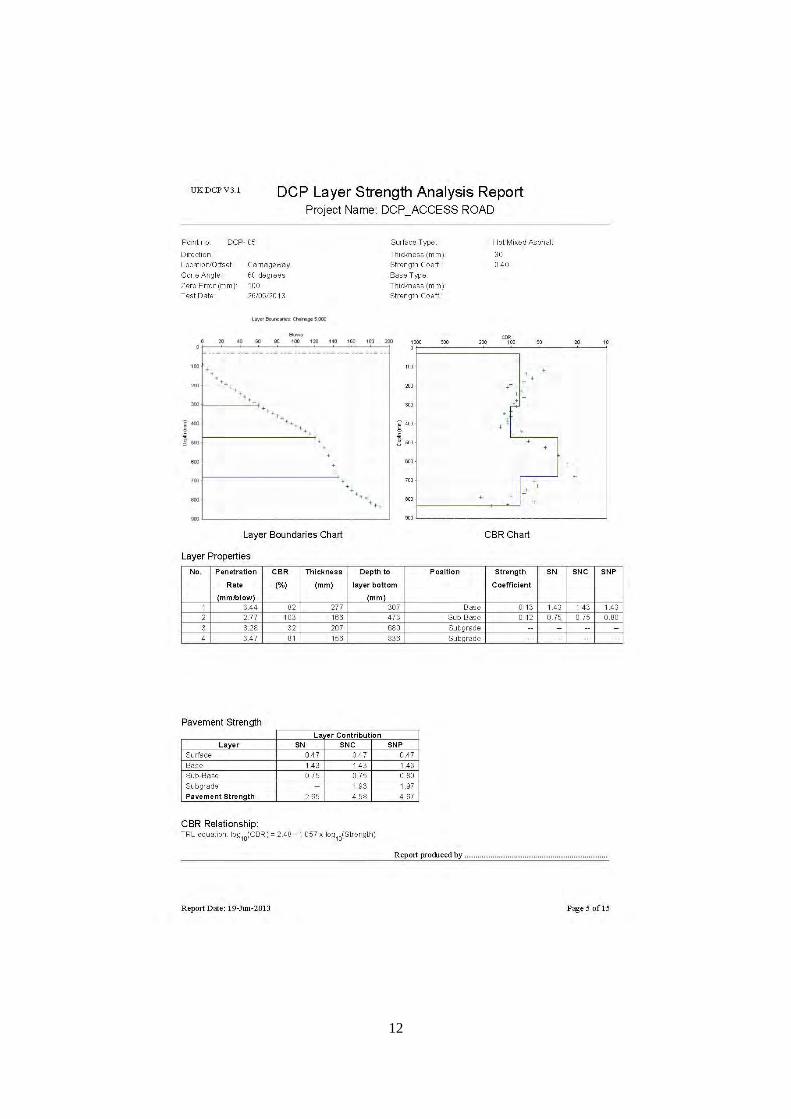
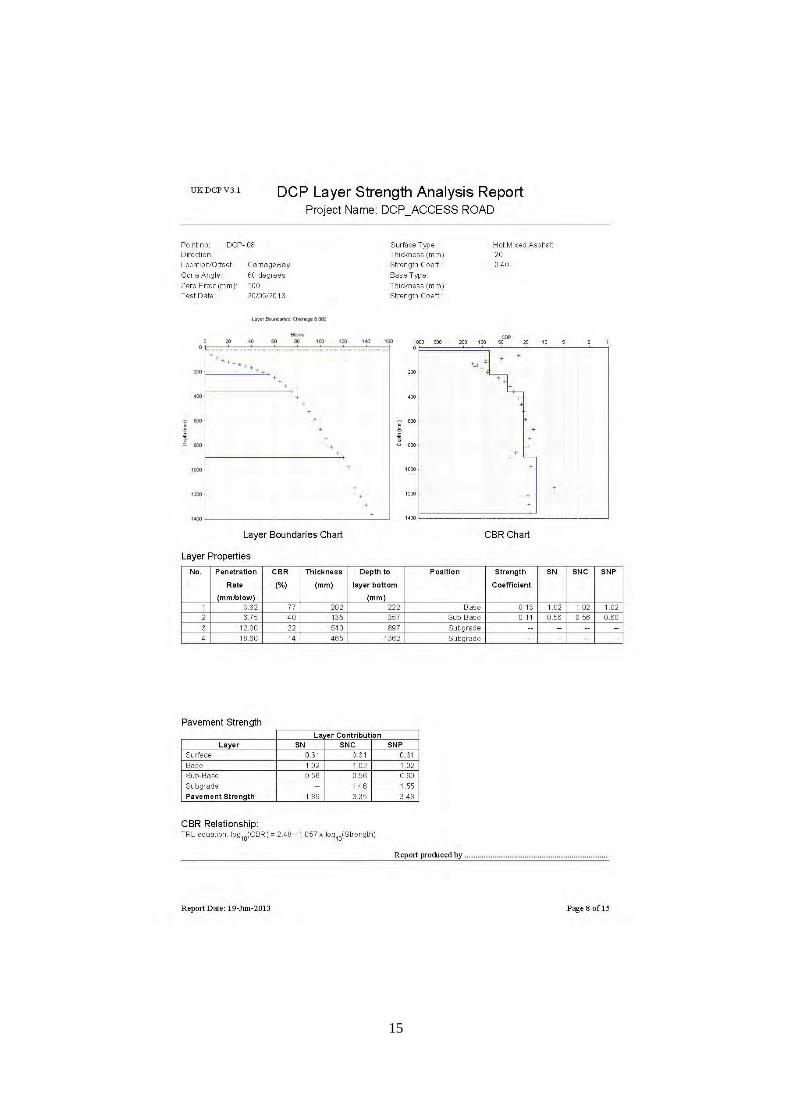
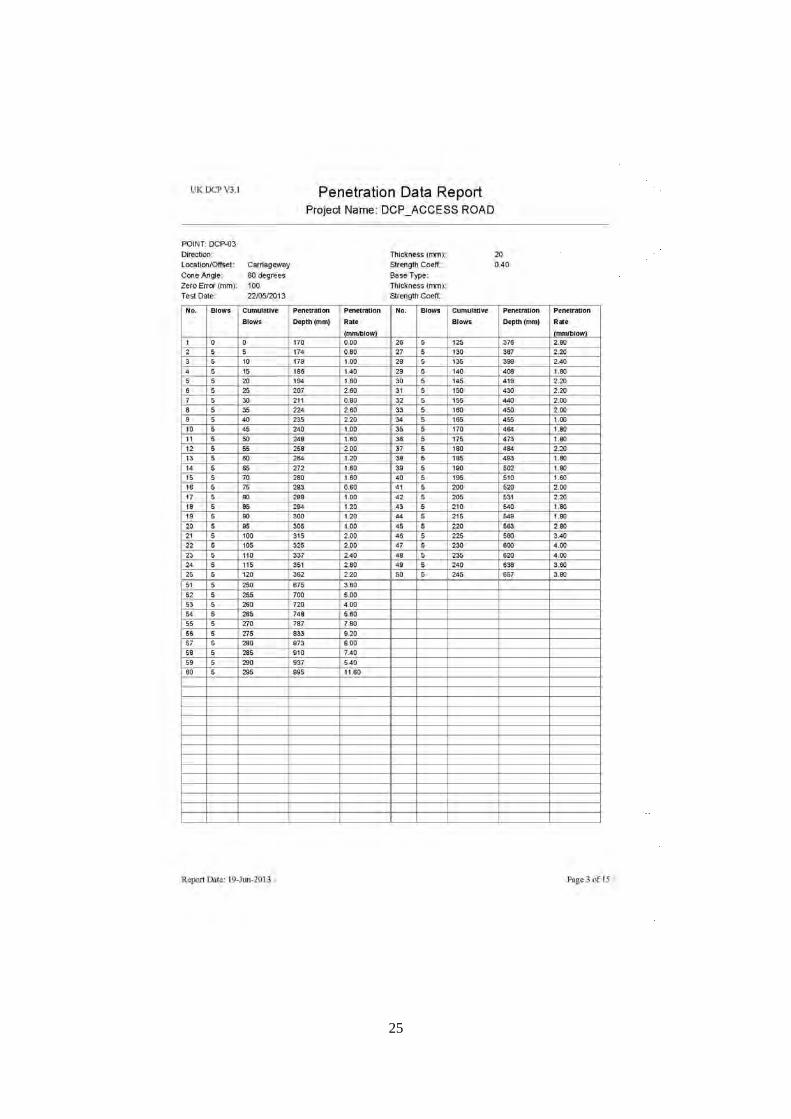
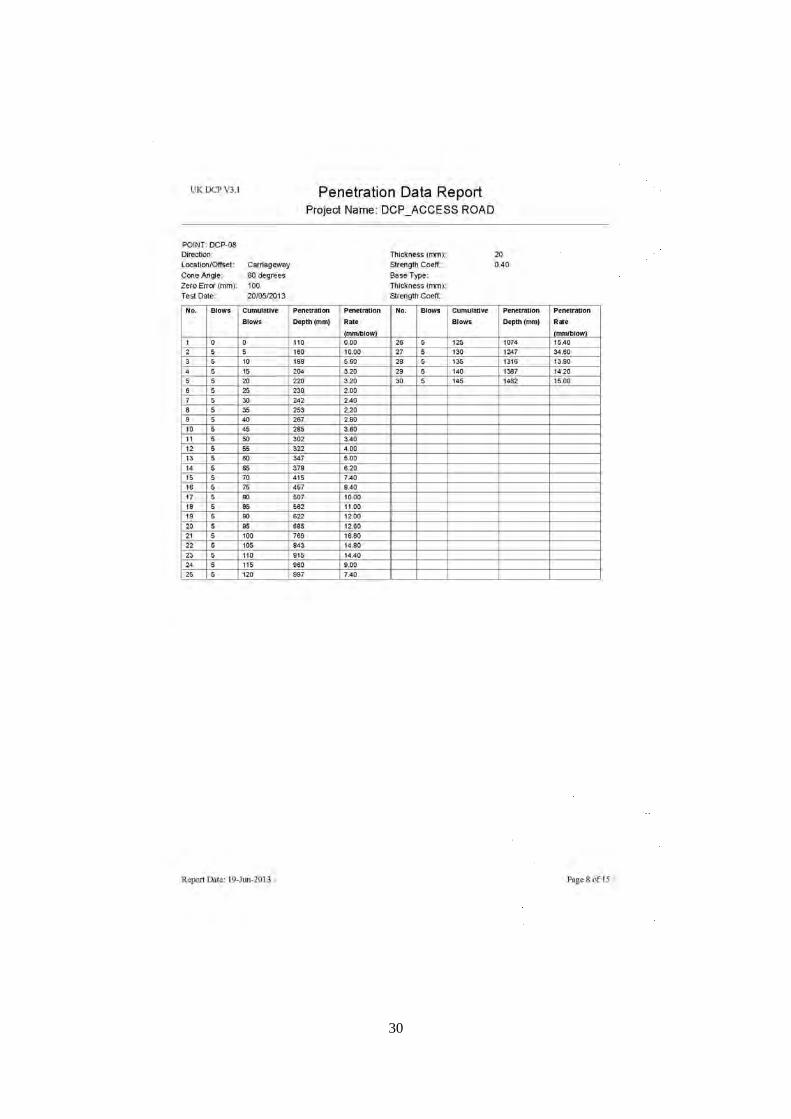
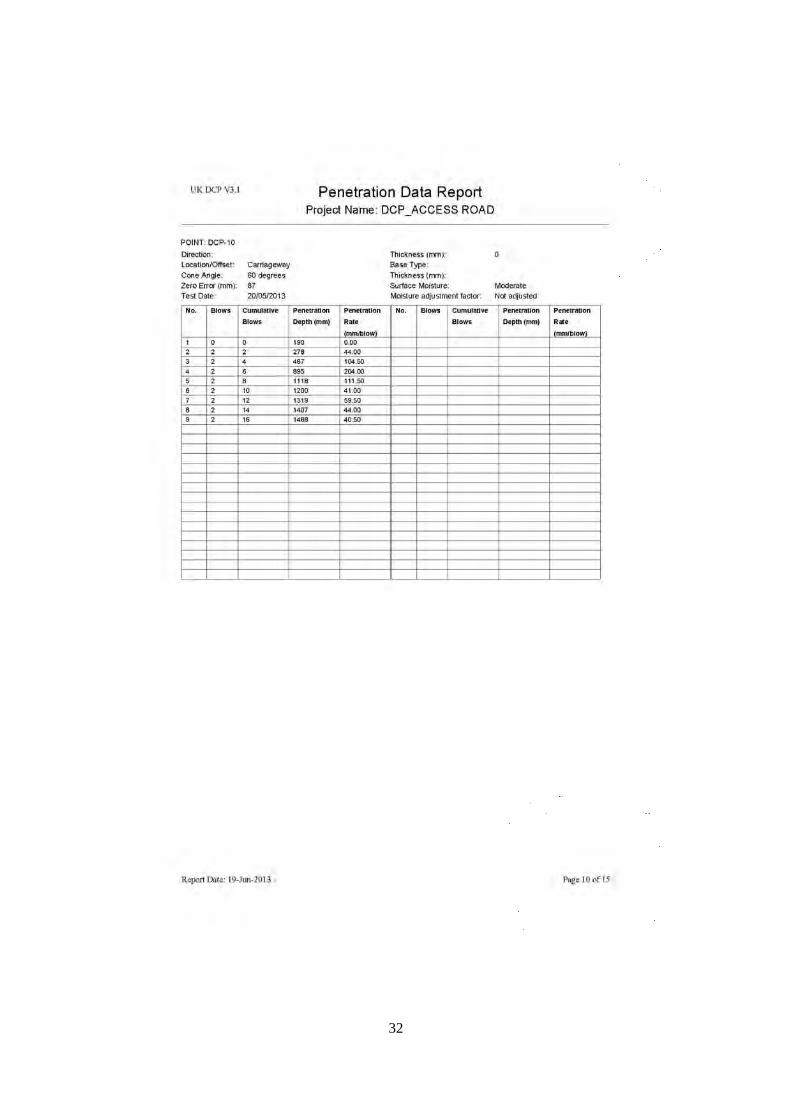
Dynamic Cone Penetration (DCP) Test


1
2
3
4

5
6

7

8
9
10

11
12

13

14
15
16

17

18

19
20
21

22

23
24
25

26

27

28

29
30

31
32

33

34

35

36

37

38
39

40

41

42
43
44
45
46

47

48

49

50

51
52

53

54
55

56

57

58

59
60

61

62
63
64

65

66
67

68

69
70

71
72
73

74

75

76