Embed Size (px)
Citation preview

Rare Metal Materials and Engineering
Volume 49, Issue 5, May 2020
Available online at www.rmme.ac.cn
Cite this article as: Rare Metal Materials and Engineering, 2020, 49(5): 1553-1560.
Received date: June 25, 2019
Foundation item: National Natural Science Foundation of China (11672138, 11602113); the Natural Science Foundation of Jiangsu Province (BK20161055)
Corresponding author: Wang Jinxiang, Ph. D., Professor, Nanjing University of Science and Technology, Nanjing 210094, P. R. China, Tel: 0086-25-84315276,
E-mail: [email protected]
Copyright © 2020, Northwest Institute for Nonferrous Metal Research. Published by Science Press. All rights reserved.
ARTICLE
Science Press
Preparation of Cu-Fe-Cu Composite Plate with Large
Thickness by Explosive Welding
Tang Kui
1
, Wang Jinxiang
1
, Fang Yu
2
, Zhou Nan
3
1
National Key Laboratory of Transient Physics, Nanjing University of Science and Technology, Nanjing 210094, China;
2
Anhui Honlly
Clad Metal Materials Technology Co., Ltd, Xuancheng 242000, China;
3
Nanjing Forest Police College, Nanjing 210023, China
Abstract: Fe-Cu composite plate has good ductility, electrical and thermal conductivity, the ferromagnetism of Fe, and the
diamagnetism of Cu, so it can be widely used in power, electronics and other industries. However, it is hard to weld Fe and Cu
using conventional methods due to their low mutual miscibility. In the present study, the explosive welding method was
adopted to prepare the Cu-Fe-Cu (with the thickness 17, 5, 17 mm) composite plate. Firstly, the theoretical model was adopted
to design explosive welding parameters. The weldability window, the detonation velocity and thickness of the charge, and the
gap size were obtained. Then, a new numerical simulation method, in which the SPH (smoothed particle hydrodynamic
method), Lagrange and Euler methods are used and no equivalent treatment of the explosive welding components is taken, was
used to analyze the explosive welding process. The collision velocity of the flyer plate, temperature and pressure distribution
near the bonding interface as well as wavy interface were obtained, and it proved the validity of the theoretical design
parameters. Finally, the Cu-Fe-Cu composite plate was successfully prepared by the explosive welding method. The hardness
distribution and the shear strength of the bonding interfaces were tested. The results show that parameters of the interface
wave obtained experimentally and numerically are basically the same; compared with that of the original ones, the hardness of
Fe and Cu near the bonding interface increases by about 34.2% and 49.8%, respectively; the average shear strength of the first
and the second interface is 212.7 MPa and 225.3 MPa, respectively.
Key words: explosive welding; Cu-Fe-Cu composite plate; weldability window; wavy interface
Explosive welding is a high-energy-rate solid-phase
welding method, which uses the detonation of explosive to
drive the flyer plate to collide with the base plate at high
speed to achieve welding
[1, 2]
. After welding, a wave-shape
ripple is formed at the bonding interface, which is called an
interface wave. Such a wavy interface increases the bond-
ing area between the metals, thereby contributing to an in-
crease in the bonding strength of the composite plate. Ex-
plosive welding of metals is known to be capable of pro-
ducing large area bonding between metal plates, including
couples of grossly different mechanical properties. A
well-known example is the bonding between large plates of
lead and steel, which cannot be achieved by any other me-
thods
[3]
.
Both iron and copper have good ductility, electrical con-
ductivity and thermal conductivity. Iron has strong ferro-
magnetism and it is a magnetic material. But, copper has
good diamagnetic resistance. The Fe-Cu composited plate
will be an ideal conductive transition material for industrial
sectors such as power, electrolysis and electronics, and even
for household cookware
[4]
. However, iron and copper are
two metals with very low mutual miscibility, which makes
it difficult to compound by conventional welding methods.
Livne and Munitz
[5]
had proved that thin iron and copper
plates can be bonded by explosive welding successfully.
However, preparation of thick Fe-Cu composite plate has
been seldom reported.
In the present research, the Cu plate with large thickness
1554 Tang Kui et al. / Rare Metal Materials and Engineering, 2020, 49(5): 1553-1560
of 17 mm and the Fe plate with thickness of 5 mm are used
as flyer plate to manufacture the Cu-Fe-Cu composite plate
with large thickness. The Fe plate is welded to a copper
plate firstly, and then another copper plate is welded to the
Fe-Cu composite plate. The parameters of explosive weld-
ing of Cu-Fe-Cu plate are designed by a theoretical model
firstly. Then, the effectiveness of the designed explosive
welding parameters is verified by a new numerical simula-
tion method. Finally, experimental preparation of Cu-Fe-Cu
composite plate is carried out. The microscopic morphology
and the shear strength of the two interfaces are studied, and
the micro-hardness across the interfaces is tested.
1 Design of Explosive Welding Parameters
In order to determine more suitable explosive welding
parameters, the ‘v
p
-v
c
window’ is determined herein.
The minimum velocity of the flyer plate (generating
metal jet) is determined by
[6]
v
p,min
= K (H
v
/ρ
f
)
0.5
(1)
where K is a constant, and it lies between 0.6 and 1.2. When
the surfaces to be bonded are well pretreated, the value of
0.6 can be taken. H
v
and ρ
f
are the Vickers hardness and the
density of the flyer plate, respectively.
The maximum velocity of the flyer plate (no
over-melting) is determined by
[7]
( )
1/ 4
2
4
2
m
0 1 2
p,max
1/
1 2
0
2
D 1 1
π2 2 c
T T
C h h
v
N v c h h
γ
ρ
+
=
−
(2)
where N=0.039, v
D
is the detonation velocity of the explo-
sive, T
m
, γ�and c are the lowest melting point, the lowest
thermal conductivity and the lowest specific heat of the
metal plates, respectively; T
0
is the room temperature, C
0
, c
1
and h
1
are the sound velocity, the volume wave velocity and
the thickness of the flyer plate, respectively; h
2
is the
thickness of the base plate.
Moreover, in order to ensure the formation of re-entrant
jet, it is generally considered that the pressure at the colli-
sion point is 10~12 times larger than the strength of the
metal material (i.e. the flow limit) and the moving speed of
the collision point must be less than the sound speed of the
material (i.e. the sound speed limit). They are determined
by the following formulas
v
c,max
= C
0 min
(3)
and
ρv
c,min
2
/2 ≥ 10σ
b
(4)
where v
c,max
and v
c,min
are the maximum and the minimum
moving velocities of the collision point, respectively; C
0 min
is the minimum sound velocity among welding materials, ρ
and σ
b
are the density and the static strength of the material,
respectively.
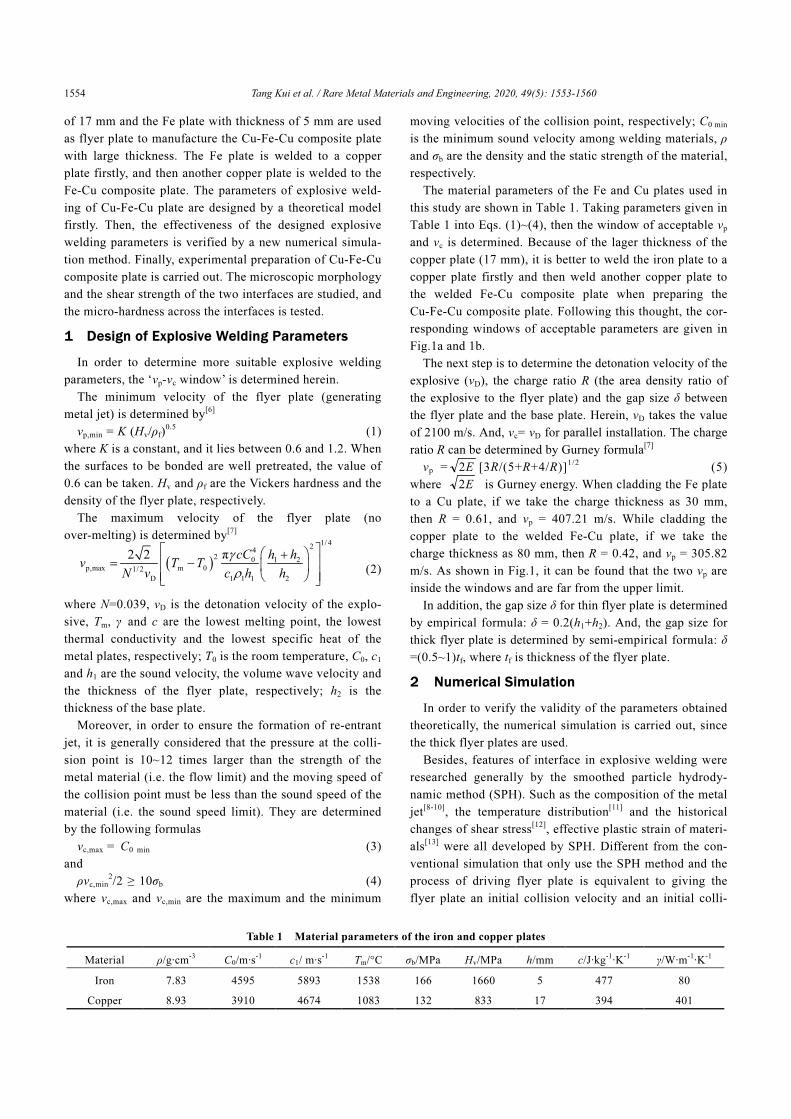
The material parameters of the Fe and Cu plates used in
this study are shown in Table 1. Taking parameters given in
Table 1 into Eqs. (1)~(4), then the window of acceptable v
p
and v
c
is determined. Because of the lager thickness of the
copper plate (17 mm), it is better to weld the iron plate to a
copper plate firstly and then weld another copper plate to
the welded Fe-Cu composite plate when preparing the
Cu-Fe-Cu composite plate. Following this thought, the cor-
responding windows of acceptable parameters are given in
Fig.1a and 1b.
The next step is to determine the detonation velocity of the
explosive (v
D
), the charge ratio R (the area density ratio of
the explosive to the flyer plate) and the gap size δ between
the flyer plate and the base plate. Herein, v
D
takes the value
of 2100 m/s. And, v
c
= v
D
for parallel installation. The charge
ratio R can be determined by Gurney formula
[7]
v
p
= E2 [3R/(5+R+4/R)]
1/2
(5)
where E2 is Gurney energy. When cladding the Fe plate
to a Cu plate, if we take the charge thickness as 30 mm,
then R = 0.61, and v
p
= 407.21 m/s. While cladding the
copper plate to the welded Fe-Cu plate, if we take the
charge thickness as 80 mm, then R = 0.42, and v
p
= 305.82
m/s. As shown in Fig.1, it can be found that the two v
p
are
inside the windows and are far from the upper limit.
In addition, the gap size δ for thin flyer plate is determined
by empirical formula: δ = 0.2(h
1
+h
2
). And, the gap size for
thick flyer plate is determined by semi-empirical formula: δ
=(0.5~1)t
f
, where t
f
is thickness of the flyer plate.
2 Numerical Simulation
In order to verify the validity of the parameters obtained
theoretically, the numerical simulation is carried out, since
the thick flyer plates are used.
Besides, features of interface in explosive welding were
researched generally by the smoothed particle hydrody-
namic method (SPH). Such as the composition of the metal
jet
[8-10]
, the temperature distribution
[11]
and the historical
changes of shear stress
[12]
, effective plastic strain of materi-
als
[13]
were all developed by SPH. Different from the con-
ventional simulation that only use the SPH method and the
process of driving flyer plate is equivalent to giving the
flyer plate an initial collision velocity and an initial colli-
Table 1 Material parameters of the iron and copper plates
Material ρ/g·cm
-3
C
0
/m·s
-1
c
1
/ m·s
-1
T
m
/°C σ
b
/MPa H
v
/MPa h/mm c/J·kg
-1
·K
-1
γ/W·m
-1
·K
-1
Iron 7.83 4595 5893 1538 166 1660 5 477 80
Copper 8.93 3910 4674 1083 132 833 17 394 401

Tang Kui et al. / Rare Metal Materials and Engineering, 2020, 49(5): 1553-1560 1555
Fig.1 Window of acceptable parameters: (a) explosive welding a
5 mm Fe plate to a 17 mm Cu plate, and (b) welding a
17 mm Cu plate to the welded Fe-Cu composite plate
sion angle
[8-13]
, SPH, Lagrange and Euler methods are all
used and no equivalent treatment is taken in this study. For
explosive, the Euler method is employed. For part of the
flyer plate and part of the base plate that chose to the
bonding interface, the SPH method is used. And, for the rest
of the flyer plate and the base plate, the Lagrange method is
used. The finite element software AUTODYN is adopted
and the corresponding 2D planar model is shown in Fig.2.
To describe the deformation near the bonding interface in
detail and reduce computation requirements, the SPH parti-
cles are divided into partitions with a minimum size of 15 µm
and a maximum size of 200 µm. Both Lagrange and Euler
elements have a size of 200 µm. Only the process of welding
the Fe plate to the Cu plate is simulated, and the length of the
plates is 200 mm. The thickness of the explosive, the Fe plate,
and the Cu plate is 30 mm, 5 mm, and 17 mm, respectively.
The gap size is 5 mm. The IRON, COPPER, ANFO and AIR
materials in the AUTODYN material library are used directly.
But, the density, the C-J detonation velocity, and the C-J
pressure of the ANFO explosive are changed to 0.8 g/cm
3
,
2100 m/s, and 923.4 MPa, respectively.
The numerical simulation result shows that both straight
and wavy interfaces are formed. The typical wavy interface
is given in Fig.3. The average values of the wavelength and
the amplitude of the interface wave measured from Fig.3
are about 505 µm and 140 µm, respectively.
The observation of a single wave formation is shown in-
Fig.4a~4d). As shown in Fig. 4a~4d, the re-entrant jet par-
Fig.2 Numerical simulation model of explosive welding
ticles come from both plates, i.e. the flyer plate and the base
plate, which is not accordance with the assumption given by
Bahrani et al.
[14]
that the base plate is perfectly rigid and the
re-entrant jet is all come from the flyer plate.
As shown in Fig.4, the interface wave formation mecha-
nism can be explained as follows. When the lifted upward
re-entrant jet is completely choked, the stagnation point
moves from the trough to the crest of the wave as shown in
Fig.4a. The high pressure at the stagnation point will de-
press and elongate the hump so that a forward trunk is
formed. As the hump continues to move downstream, the
stagnation point descends the forward slope of the hump as
shown in Fig.4b. As the re-entrant jet descends the forward
slope of the hump, a second stagnation point is formed and
part of the jet enters the cavity under the trunk, causing a
vortex, as shown in Fig.4c. As shown in Fig.4d, the new
stagnation point moves forward, a new hump forms and the
re-entrant jet is lifted upwards. The lifted upward re-entrant
jet will be trapped again and formed a vortex at the back of
the hump as shown in Fig.4a, and then a loop will go. And,
the front vortex and behind vortex have formed in Fig.4d.
The melted temperature of iron and copper are 1535 °C
and 1082 °C, respectively, as shown in Table 1. The tem-
perature shown in Fig.5a varies from 0 to 2500 K, and thus
it is clear that the re-entrant jet particles that escaped are
almost all melted. Meanwhile, some melted particles are
stored in the bonding interface and the wavy interface was
formed. And, most particles in the front and behind vortex
of the wavy interface are melted. The pressure distribution
shown in Fig.5b indicates that the pressure in the collision
area is much higher than that in other areas.
The pressure in the collision area is about 7.5 GPa, which
is much larger than 10σ
b
=1.66 GPa. The collision velocity
of the flyer plate obtained by numerical simulation is about
427 m/s, which is in good accordance with the theoretical
result (407.21 m/s). And, the wavy interface is formed. It
Fig.3 Enlarged view of wavy interface
0 1000 2000 3000 4000
0
1000
2000
3000
4000
(2100,183 .25)
(2100,1055.88)
v
p
/m·s
-1
v
c
/m· s
-1
Upper limit
Lower limit
Flow limit
Sound speed limit
b
0 1000 2000 3000 4000
0
1000
2000
3000
4000
(2 100,276.26)
v
p
/m·s
-1
Upper limit
L ower limit
Flow limit
Soun d sp eed limit
(21 00,1 177.03)
a

1556 Tang Kui et al. / Rare Metal Materials and Engineering, 2020, 49(5): 1553-1560
Fig.4 A single wave formation process: (a) 87.5 µs, (b) 87.6 µs, (c) 87.7 µs, and (d) 87.8 µs
Fig.5 Distribution of temperature (a) and pressure (b)
can be concluded from the above discussion that using the
welding parameters determined by theoretical model can
obtain a continuous wavy bonding interface.
3 Experiment
Cu plate with dimensions of 400 mm×200 mm×17 mm
and Fe plate with dimensions of 400 mm×200 mm×5 mm
are the raw materials used to prepare the Cu-Fe-Cu com-
posite plate. The Fe plate is sandwiched between the Cu
plates. As mentioned above, the Fe plate is clad to a Cu
plate firstly, and then another Cu plate is welded to the
Fe-Cu composite plate. The schematic of explosive welding
device is shown in Fig.6.
The modified ANFO explosive with low detonation
speed is used. The detonation velocity and the density of
the modified ANFO explosive are measured to be 2148.671
m/s and 0.8 g/cm
3
, respectively. When welding the Fe plate
to a Cu plate, the gap size and the thickness of the explosive
are set to 5 mm and 35 mm (a little larger than that used in
numerical simulation), respectively. While cladding the Cu
plate to the composited Fe-Cu plate, the gap size and the
Fig.6 Schematic of explosive welding set-up
thickness of the explosive are set to 15 mm and 80 mm, re-
spectively.
The Cu-Fe-Cu composite plate obtained after two times
of explosive welding has two bonding interfaces. To find
out the individual characteristics of the two bonding inter-
faces conveniently, the Fe-Cu interface formed after the
first explosive welding is called as the first bonding inter-
face and the Cu-Fe interface formed after the second explo-
sive welding is called as the second bonding interface.
3.1 Morphology of the first bonding interface
Micromorphology of the first bonding interface for dif-
b
a
b
a
d
c

Tang Kui et al. / Rare Metal Materials and Engineering, 2020, 49(5): 1553-1560 1557
ferent distances from the detonation end is illustrated in
Fig.7. As shown in Fig.7, the Fe-Cu interface formed by
the first explosive welding has a good bonding, and there
is no cracking and void. The cladding of Fe plate to Cu
plate is achieved successfully by the explosive welding
process. The interface morphology is mainly composed of
wavy interface, accompanied with few straight interface
and un-welded area. About 85% of the interface is wavy.
There is an un-welded area 0~40 mm close to the detona-
tion end. In the range of 40 mm to 120 mm, the interface
changes from straight to wavy. While, within the range of
160~280 mm from the detonation end, size of the interface
wave is basically the same. Then, the wavelength of the
interface wave is gradually increased, the amplitude is
gradually decreased, and the interface wave disappears
finally.
The wave parameters of the interface wave at different
distances from the detonation end measured from Fig.7 are
shown in Table 2. For distance in the range of 160~280 mm,
wavelength and amplitude of the interface wave remain at
about 520 and 147 µm, respectively. It indicates that the
numerical result is in good agreement with the experimental
result.
3.2 Morphology of the second bonding interface
Micromorphology of the second bonding interface for
different distances from the detonation end is illustrated in
Fig.8. Clearly, the interface morphology is mainly com-
posed of wavy interface and straight interface. About 95%
of the interface is wavy. Size of the interface wave within
the range of 120~280 mm from the detonation end is basi-
cally the same. However, the experimental results of the
Fe/Cu plate explosive welding conducted by Livne and
Munitz
[5]
indicated that both wavelength and amplitude are
increasing functions of the distance from the detonation
point under the same charge ratios R. Therefore, it is not in
accordance with the result obtained herein.
The parameters of the interface wave at different dis-
tances from the detonation end measured from Fig. 8 are
shown in Table 3. As shown in Table 3, wavelength in-
creases monotonically as distance increases from 40 mm to
120 mm, and it remains at about 305 µm for the distance
varies from 160 mm to 280 mm. While the wavelength de-
creases with increasing distance for it is larger than 280 mm.
However, the amplitude of the interface wave is gradually
increased first and then decreased sharply with the increas-
ing distance.
3.3 Mechanical properties
3.3.1 Micro-hardness test
Fig.7 A series of optical microscopy photographs demonstrating the first bonding interface for different distances from the detonation end:
(a) 40 mm, (b) 80 mm, (c) 120 mm, (d) 160 mm, (e) 200 mm, (f) 240 mm, (g) 280 mm, (h) 320 mm, and (i) 360 mm
a
b
c
d
e
f
g
h
i

1558 Tang Kui et al. / Rare Metal Materials and Engineering, 2020, 49(5): 1553-1560
Table 2 Parameters of the first bonding interface wave
Distance/mm 40 80 120 160 200 240 280 320 360
Wavelength/µm - - 528.9 518.6 529.1 519.9 512.7 437.5 554.2
Amplitude/µm - - 144.8 157.7 149.4 146.8 147.3 146.4 84.5
Fig.8 A series of optical microscopy photographs demonstrating the second bonding interface for different distances from the detonation
end: (a) 40 mm, (b) 80 mm, (c) 120 mm, (d) 160 mm, (e) 200 mm, (f) 240 mm, (g) 280 mm, (h) 320 mm, and (i) 360 mm
Table 3 Parameters of the second bonding interface wave
Distance/mm 40 80 120 160 200 240 280 320 360
Wavelength/µm 235.3 273.2 281.6 308.4 305.1 302.1 305.7 293.7 188.9
Amplitude/µm 114.6 117.0 115.9 122.6 127.1 133.2 116.3 84.9 71.7
Micro-hardness measurements are made across the bond-
ing interfaces using a load of 9.8 N. The micro-hardness pro-
file across the first and the second bonding interfaces after
explosive welding is shown in Fig.9. The maximum hardness
was obtained near the welding interface for both sides. It in-
dicates that the micro-hardness of the materials on both sides
of the interfaces increases significantly in comparison to the
original ones, which implies that the microstructure near the
interface is modified by the high degree of plastic deforma-
tion resulting from the collision of plates
[15]
. Deformation
during the crash of bonding plates is limited within a very
narrow thickness close to the interface. So the hardness of
the materials at 1.5 mm (Fe) and 2 mm (Cu) away from the
interfaces remain almost unchanged. Besides, the hardness of
Fe near the first and the second interfaces is 1561 and 1650
MPa, about 26.9% and 34.2% larger than that of the original
one (1230 MPa), respectively. And, the hardness of Cu near
the first and the second interfaces is 1402 and 1498 MPa,
about 40.2% and 49.8% larger than that of the original one
(1000 MPa), respectively.
a
b
c
d
e
f
g
h
i

Tang Kui et al. / Rare Metal Materials and Engineering, 2020, 49(5): 1553-1560 1559
Fig.9 Micro-hardness profile across the first and the second
bonding interfaces after explosive welding
3.3.2 Shear test
The shear test is conducted on the explosive welding
samples to obtain the bond strength. The images and ge-
ometries of samples before and after shear test are shown in
Fig.10. The crack firstly occurs on one side of the bonding
interface under the shear force. With the load increasing,
the crack propagates along the bonding interface and results
in the separation of composite plate at the bonding interface
finally. The typical load-displacement curve of shear test
for Cu/Fe bonding interface is shown in Fig.11. Clearly,
there is an obvious yield stage in the process of fracture. It
means that the fracture process presents the characteristic of
ductile fracture. And, shear strength test results show that
the average shear strength of the first and the second bond-
ing interface are 212.7 MPa and 225.3 MPa, respectively.
Fig.10 Shear test specimen and its geometric dimensions: (a) before shear test and (b) after shear test
Fig.11 Load-displacement curve of the second bonding interface
4 Conclusions
1) In this study, the explosive welding parameters of
Cu-Fe-Cu plate with large thickness are designed by theo-
retical model firstly. Then, the validity of the designed ex-
plosive welding parameters is verified by a new numerical
simulation method, in which the SPH, Lagrange and Euler
methods are used and no equivalent treatment of the explo-
sive welding process is taken. The result indicates that the
theoretical design parameters are valid. Finally, experimen-
tal preparation of Cu-Fe-Cu composite plate is carried out.
2) The Cu-Fe-Cu composite plate with large thickness is
successfully prepared by explosive welding. And, parame-
ters of the Fe-Cu interface obtained experimentally and
numerically are in good accordance. Micro-hardness test
show that the hardness near the interfaces is greatly higher
than other parts, about 34.2% and 49.8% for Fe and Cu, re-
spectively. And, shear strength test results show that aver-
age shear strength of the first and the second bonding in-
terface is 212.7 MPa and 225.3 MPa, respectively.
References
1 Zheng Yuanmou. The Principle and Application of Explosive
Welding and Metallic Composite[M]. Changsha: Central
South University Press, 2007: 15 (in Chinese)
2 Wang Xiaoxu, Wang Jinxiang, Zhao Zheng et al. Rare Metal
Materials and Engineering [J], 2014, 43(3): 682 (in Chinese)
3 Deng Guangping, Hou Facheng, Xu Yuhao et al. Development
and Application of Materials [J], 2012, 4: 16 (in Chinese)
0.0 0.2 0.4 0.6 0.8 1.0 1.2 1.4 1.6 1.8
0
2
4
6
8
10
12
14
16
18
The second bon ding inter face
Load/kN
Displacement/mm
(1.34,16.9)
-3 -2 -1 0 1 2 3 4 5 6 7 8
100
120
140
160
The first interface
Distance/mm
8.0 cm
24.0 cm
Cu Fe Cu
The second
interface
Micro
hard
ness, H
V/�
10
M
Pa
a
b

1560 Tang Kui et al. / Rare Metal Materials and Engineering, 2020, 49(5): 1553-1560
4 Ding Li. Rare Metal Materials and Engineering[J], 1988,
17(1): 56 (in Chinese)
5 Livne Z, Munitz A. Journal of Materials Science[J], 1987, 22:
1495
6 Wang Xiao, Zheng Yuanyuan, Liu Huixia et al. Materials and
Design[J], 2012, 35: 210
7 Deng Wei, Lu Ming, Tian Xiaojie. Explosion and Shock
Waves[J], 2015, 35(1): 82 (in Chinese)
8 Shougo Kakizaki, Mitsuhiro Watanabe, Shinji Kumai.
Materials Transactions[J], 2011, 52(5): 1003
9 Junto Nishiwaki, Yuya Sawa, Yohei Harada et al. Materials
Science Forum[J], 2014, 794-96: 383
10 Li X J, Mo F, Wang X H et al. Science and Technology of
Welding and Joining[J], 2012, 17(1): 36
11 Yusuke Aizawa, Junto Nishiwaki, Yohei Harada et al. Journal
of Manufacturing Processes[J], 2016, 24: 100
12 Li Ruiyu, Sun Yuxin, Fu Yansu et al. Transaction of the
China Welding Institution[J], 2017, 38(5): 92 (in Chinese)
13 Shao Binghuang, Zhang Kai. Explosive Welding Principle and
Its Engineering Application[M]. Dalian: Dalian Institute of
Technology Press, 1987: 8, 265 (in Chinese)
14 Bahrani A S, Black T J, Crossland B. Proceedings of the
Royal Society of London A[J], 1967, 296A: 123
15 Mastanaiah P, Reddy G M, Prasad K S et al. Journal of
Materials Processing Technology[J], 2014, 214(11): 2316
�������� Cu-Fe-Cu ��
�
� �
1
����
1
��
2
� �
3
(1. ������ ����� ������ �� 210094)
(2. ������������ !"#��� $% 242000)
(3. ��&'()�*��� �� 210023)
� ��+-,��-. /012345678694�: ,1,;48+1<;4�=>?@ABCD7E57FGHIJ
K+8,LM1NO4:PQRS��TUCVWXYZH[\J]^_`Cab[\XYZHc�de Cu-Fe-Cu��-1fgJ
hi�̀ Cab[\�jkQc?[4lm�nocbpaq5rpde8stuevwx�yz{|}~��PC SPH5Lagrange
8 EulerXY��|}c��ab[\���kQc�-1��qe5�����e8�E���c�j���z1 �4v�x�
�3cab[\�����fgc�de Cu-Fe-Cu��-���c������1�e��8�����e���D��8z{
|}� ¡jc��¢1£���J� ¤¥¦z{|}8��Q§1 Fe-Cu ����1¢£�z¨]©ªv,8+y���«
�1�eL¬��®¯c° 34.2%8 49.8%v±©8±²����1³´�e�µ 212.7 MPa8 225.3 MPaJ
����ab[\vCu-Fe-Cu��-v?[4lmv��¢
¶·¸¹¦º »�¼�1990½¾�¿À������������ ������ �� 210094�7Á¦025-84315276�E-mail: