Embed Size (px)
Citation preview

PREPARATION, CHARACTERIZATION AND
APPLICATIONS OF MULTI-FUNCTIONAL IRON
OXIDES-IMPREGNATED ACTIVATED CARBON
MATERIALS
IRFAN SHAH
UNIVERSITI SAINS MALAYSIA
2016

PREPARATION, CHARACTERIZATION AND
APPLICATIONS OF MULTI-FUNCTIONAL IRON
OXIDES-IMPREGNATED ACTIVATED CARBON
MATERIALS
by
IRFAN SHAH
Thesis submitted in fulfillment of the requirements
for the degree of
Doctor of Philosophy
March 2016

DECLARATION
Saya isytiharkan bahawa kandungan yang dibentangkan di dalam tesis ini adalah hasil
kerja saya sendiri dan telah dijalankan di Universiti Sains Malaysia kecuali
dimaklumkan sebaliknya. Tesis ini juga tidak pernah diserahkan untuk ijazah yang lain
sebelum ini.
I declare that the content which is presented in this thesis is my own work which was
done at Universiti Sains Malaysia unless informed otherwise. The thesis has not been
previously submitted for any other degree.
Tandatangan calon/ Signature of student
Nama calon/ Name of student:
Irfan Shah
Passport No.: KY5149562
Tandatangan Penyelia/ Signature of Supervisor
Nama Penyelia/ Name of Supervisor:
Prof. Dr. Rohana Adnan
K/P /Passport No.:

DEDICATION
“This dissertation is dedicated to all those loving people who contributed to my every
achievement, directly or indirectly, in anyways in their own capacity”
Irfan Shah

ii
ACKNOWLEDGMENT
The foremost gratitude to Almighty ALLAH, the most gracious, the most
compassionate, who blessed me with the thirst of searching quality education to
achieve the best with His blessings. Countless solat-o-salam on Prophet Muhammad
(PBUH) for his love and kindness to his Ummah and the entire humanity.
It is time to express my earnest feelings for my supervisor; Prof. Dr. Rohana
Adnan, for being more than a generous and loving mentor. This project and its
compilation would never be successful without her unremitting guidance, support,
dedication and feedback on every result we achieved. In fact, I would say that, her
accommodative attitude, intellectual input, urge to learn new things, patience and
sympathetic behavior kept me steadfast to achieve the aim and contribute to the
scientific community. In line to her thought provoking utterance, her encouragement
and appreciation made me able to do more, right things in right way, and
Alhamdulillah, I am at the verge of receiving this honor today.
I would extend my deepest gratefulness to both of my co-supervisors; Prof.
Dr. Wan Saime Wan Ngah and Prof. Dr. Norita Mohamed, for their valuable
suggestions and guidance throughout the research work conducted. I am extremely
thankful for, not only the help they provided, but also their appreciation is highly
acknowledged.
I must offer my sincere gratitude to the Dean, Senior Faculty, all teaching and
non teaching staff of School of Chemical Sciences for their polite and caring attitude,
that did not let me realize that I am far away from my family, and for providing an
excellent research environment with necessary facilities. I am grateful to Prof. Dr.
Taufiq Yup (UPM) for allowing me to work in his laboratory for catalytic studies.

iii
In particular, I would mention and acknowledge here, The World Academy of
Sciences (TWAS) and Universiti Sains Malaysia (USM) for awarding me the
prestigious TWAS-USM fellowship (FR# 3240255129) to pursue my PhD research.
In general, the RUI grants# 1001/PKIMIA/815099 and 1001/PKIMIA/814149 are
also acknowledged.
More or less, friends are the important part of our lives in achieving our goals.
I feel very fortunate having a long list of friends helping me around, making me
happy, arranging get together and trips to beautiful places in Malaysia during my
stay. I would mention here about HM Bakhsh, Faisal, Hazwan, Adnan, Najm, Leong,
Jaga, Erma, Shumaila, Imran, Shazia, Uzma, Javed, Ashfaq, Sajid and many more.
My heartiest gratitude goes to many loving people back in my home country
and staying outside. In this connection, I would like to thank my teachers and friends;
Prof. Dr. Khurshid, Prof. Dr. Naeem, Prof. Dr. Mustafa, Masroof, Ishtiaq, Saeed,
Sikandar, Mustajir, Yasir, Naveed, Dr. Khizar, Dr. Waseem, Mahroof, Zahid, Raziq,
Ghufran, Muzammil, Saba and a lot more for their love and prayers for my success.
At last but not the least, the endless and pure love of my family members,
(Sisters, Adan, Fasih, Abdullah, Api, Azlan, Salwa, Fiancee), their appreciation on
my every achievement, patience to send me abroad to achieve this milestone, is
highly acknowledged. In deed, I am nothing without them and I would not be able to
be successful without the sacrifices of my Father (Mehrfat Shah) and my brother
(Ehsan Shah). It is painful to say that, my Mother (late) is not around but I believe
that her prayers made me what I am today. May Allah grant her high place in Jannah
(Amin).

iv
TABLE OF CONTENTS
Page
Acknowledgment ii
Table of Contents iv
List of Tables x
List of Figures xii
List of Abbreviations xvii
List of Symbols xix
Abstrak xx
Abstract xxii
CHAPTER 1 – INTRODUCTION 1
1.1 Background of the Study 1
1.2 Problem Statements 5
1.3 Objectives of the Proposed Study 6
1.4 Scope of the Proposed Study 7
CHAPTER 2 – LITERATURE REVIEW 8
2.1 Activated Carbon 8
2.1.1 Production of AC from Raw Materials and Their Activation
Processes
10
2.1.2 Surface Functionalities on Activated Carbon 13
2.2 Water Scarcity, Pollution and Remediation 15
2.3 Dyes as Major Pollutants in the Wastewater 16
2.3.1 Classification of Dyes 16

v
2.3.2 Release of Dyes in Wastewater and Their Adverse Effects 18
2.4 Different Types of Dyes Wastewater Remediation
2.4.1 Biological Remediation
2.4.2 Chemical Remediation
2.4.3 Physical Remediation
20
22
24
26
2.5 Adsorption: A Versatile Technique for the Removal of Toxins 27
2.5.1 Adsorption via Activated Carbon
2.5.2 Various Carbon Based Materials as Adsorbents
2.5.3 Adsorption of Methylene Blue: A Model Dye
27
28
29
2.6 Evaluation of the Adsorption Date Using Kinetic Models 32
2.6.1 Pseudo-first Order Kinetic Model
2.6.2 Pseudo-second Order Kinetic Model
2.6.3 Intraparticle Diffusion Model
2.6.4 Bangham Kinetic Model
2.6.5 Elovich Kinetic Equation
32
33
34
35
35
2.7 Evaluation of the Adsorption Isotherm Models 36
2.7.1 Langmuir Isotherm Model
2.7.2 Freundlich Isotherm Model
37
38
2.8 Surface Modifications of Activated Carbon 39
2.8.1 Physical Treatment
2.8.2 Biological Treatment
2.8.3 Chemical Treatment
41
42
43
2.9 Chemical Treatment or Impregnation of Activated Carbon 44
2.9.1 Iron-Modified Activated Carbon
46
2.10 Regeneration of the Spent Adsorbents 48

vi
2.10.1 Biological Regeneration
2.10.2 Physical Regeneration
2.10.3 Chemical Regeneration
48
49
50
2.11 Activated Carbon as Catalyst Support for Biodiesel Production 52
CHAPTER 3 – MATERIALS AND METHODS 55
3.1 Chemical Reagents 55
3.2 List of Instruments 56
3.3 Scheme of Study 58
3.4 Preparation of Iron-Modified Activated Carbon Materials 58
3.5 Characterization of Native AC and Iron-Modified AC Materials
3.5.1 Surface Area Analysis
3.5.2 Scanning Electron Microscopy and Energy Dispersion X- ray
Studies
3.5.3 Transmission Electron Microscopy, High Resolution
Transmission Electron Microscopy and Selected Area
Electron Diffraction Studies
3.5.4 X-ray Diffraction Studies
3.5.5 Fourier Transform Infra-red Spectroscopy Studies
3.5.6 Thermogravimetric and Differential Thermal Analyses
3.5.7 Carbon, Hydrogen and Nitrogen Analyses
3.5.8 Total Carbon Contents Analyses
3.5.9 X-ray Photoelectron Spectroscopy Studies
3.5.10 Vibrating Sample Magnetometer Studies
3.5.11 Temperature Programmed Reduction and Temperature
60
60
61 62 62 63 63 64 64 65 65 65

vii
Programmed Desorption Analyses
3.5.12 Determination of the pH of Point of Zero Charge
67
3.6 Batch Adsorption Studies
3.6.1 Evaluation of the Effect of pH on the Adsorption of MB
3.6.2 Evaluation of the Effect of Adsorbent Dosage on the
Adsorption of MB
3.6.3 Evaluation of the Effect of Shaking Speed on the Adsorption
of MB
3.6.4 Evaluation of the Effect of Contact Time on the Adsorption of
MB
3.6.5 Evaluation of the Effect of MB Initial Concentration at
Different Temperatures on MB Adsorption
3.6.6 Evaluation of the Effect of Ionic Strength on the Adsorption
of MB
3.6.7 Regeneration of the Spent Adsorbents
3.7 Continuous Flow Adsorption (Column Test) of MB
3.8 Germination of Mung Beans Seeds in Different Aqueous Media
67
68
69
69
70
70
71
72
73
74
3.9 Modified Activated Carbon as Heterogeneous Catalyst 75
RESULTS AND DISCUSSION
CHAPTER 4 – PHYSICOCHEMICAL CHARACTERISTICS OF AC
AND IRON-MODIFIED ACTIVATED CARBON MATERIALS
77
4.1 Surface Area Analyses
4.2 SEM/EDX Analyses
4.3 TEM, HRTEM and SAED Analyses
77
84
88

viii
4.4 XRD Analyses
4.5 FTIR Studies
4.6 TG/DT Analyses
4.7 CHN and TCC Analyses
4.8 XPS Analyses
4.9 VSM Analyses
4.10 TPR and TPD Analyses
4.11 pH of Point of Zero Charge (pHpzc)
94
96
99
102
104
107
111
118
CHAPTER 5 – ADSORPTION STUDIES OF METHYLENE BLUE ON
AC AND IRON-MODIFIED ACTIVATED CARBON (E)
121
5.1 Adsorption Studies of Methylene Blue 121
5.1.1 Effect of pH on the Adsorption of MB 121
5.1.2 Effect of Adsorbent Dosage on the Adsorption of MB 125
5.1.3 Effect of Shaking Speed on the Adsorption of MB
127
5.1.4 Effect of Contact Time on the Adsorption of MB at Different
Temperatures
128
5.1.4(a) Pseudo-first Order Kinetic Model 130
5.1.4(b) Pseudo-second Order Kinetic Model 133
5.1.4(c) Intraparticle Diffusion Model 136
5.1.4(d) Bangham Kinetic Model 138
5.1.4(e) Elovich Kinetic Equation 140
5.1.5 Effect of MB Initial Concentration at Various Temperatures
on MB Adsorption
142
5.1.5(a) Langmuir Isotherm Model 145
5.1.5(b) Freundlich Isotherm Model 147

ix
5.1.5(c) Thermodynamic Parameters for MB Adsorption
onto AC and E
151
5.1.6 Effect of Ionic Strength on the Adsorption of MB 153
5.1.7 Regeneration of the Spent Adsorbents 156
5.2 Continuous Flow Adsorption (Column Study) of MB 163
5.3 Germination of Mung Beans Seeds: Biological Indicator for Water
Quality
165
CHAPTER 6 – CATALYTIC CONVERSION OF WASTE COOKING
OIL INTO BIODIESEL USING IRON OXIDES-IMPREGNATED AC
6.1 Production of Biodiesel from Waste Cooking Oil
6.1.1 Screening of the Heterogeneous Solid Catalysts for Biodiesel
Production from WCO
6.1.2 Reusability of the Heterogeneous Catalyst for Biodiesel
Production
170
170
171
179
CHAPTER 7 – CONCLUSIONS AND RECOMMENDATIONS 181
7.1 Major Conclusions Derived from the Current Work 181
7.2 Future Recommendations for the Extension of Current Work 185
REFERENCES 186
APPENDICES 222
LIST OF PUBLICATIONS AND CONFERENCE PRESENTATIONS 228
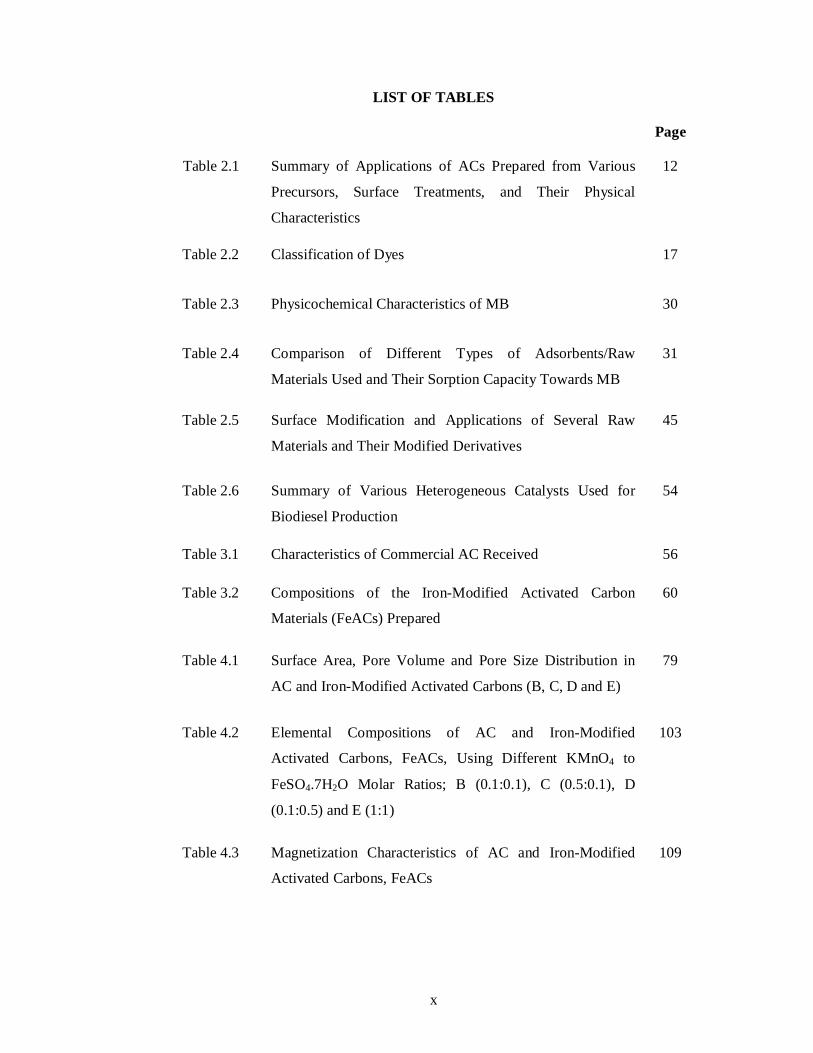
x
LIST OF TABLES
Page
Table 2.1 Summary of Applications of ACs Prepared from Various
Precursors, Surface Treatments, and Their Physical
Characteristics
12
Table 2.2 Classification of Dyes 17
Table 2.3 Physicochemical Characteristics of MB 30
Table 2.4 Comparison of Different Types of Adsorbents/Raw
Materials Used and Their Sorption Capacity Towards MB
31
Table 2.5 Surface Modification and Applications of Several Raw
Materials and Their Modified Derivatives
45
Table 2.6 Summary of Various Heterogeneous Catalysts Used for
Biodiesel Production
54
Table 3.1 Characteristics of Commercial AC Received 56
Table 3.2 Compositions of the Iron-Modified Activated Carbon
Materials (FeACs) Prepared
60
Table 4.1 Surface Area, Pore Volume and Pore Size Distribution in
AC and Iron-Modified Activated Carbons (B, C, D and E)
79
Table 4.2 Elemental Compositions of AC and Iron-Modified
Activated Carbons, FeACs, Using Different KMnO4 to
FeSO4.7H2O Molar Ratios; B (0.1:0.1), C (0.5:0.1), D
(0.1:0.5) and E (1:1)
103
Table 4.3 Magnetization Characteristics of AC and Iron-Modified
Activated Carbons, FeACs
109

xi
Table 4.4 The Summary of TPR–H2, TPD–CO2 and TPD–NH3 for AC
and Iron-Modified Activated Carbons, FeACs
113
Table 5.1 Kinetic Parameters for the MB Adsorption by AC and Iron-
Modified Activated Carbon, E, at Various Temperatures
131
Table 5.2 Elovich Equation’s Dimensionless Parameter for the MB
Kinetics by Various Materials
142
Table 5.3 Langmuir and Freundlich’s Parameters for MB Adsorption
by AC and E
147
Table 5.4 A Comparison of MB Adsorption by Various Adsorbents
with the Current Work
150
Table 5.5 Thermodynamic Parameters for MB Adsorption onto AC
and Iron-Modified Activated Carbon, E, at Different
Temperatures
152
Table 5.6 Germination of Mung Beans Seeds in Different Aqueous
Media
167
Table 6.1 Physicochemical Characteristics of WCO 170
Table 6.2 Retention Time of FAME Present in the Standard for
Comparison with Biodiesel Produced (T = 120 oC, t = 5 h,
catalyst loading = 9 wt. %, methanol/WCO ratio, 16:1)
174
Table 6.3 A Comparison of Reported Types of WCO with the Current
Findings of FAME Production
176

xii
LIST OF FIGURES
Page
Figure 2.1 Coalification process of plants and plants residues 9
Figure 2.2 Commonly used strategies to produce AC via activation of raw materials
11
Figure 2.3 Surface functional groups commonly found on the surface of AC
14
Figure 2.4 Flowchart describing the various wastewater treatment technologies
22
Figure 2.5 Chemical structure of MB salt 30
Figure 2.6 Schematic flowchart for the surface modification techniques of AC
41
Figure 3.1 Simplified flowchart of the proposed study 58
Figure 3.2 Pictorial image of continuous flow system set up for the
column study
74
Figure 3.3 Pictorial image of fresh cooking oil and waste cooking oil
used in the current study
76
Figure 4.1 (a) N2 adsorption–desorption isotherms of raw activated
carbon (AC) and iron-modified ACs. Figure (b), highlights
the mesoporous character of AC and E
78
Figure 4.2 Variations in the surface area with the increase in iron
contents in the iron-modified activated carbon materials
(FeACs)
80
Figure 4.3 Pore size distribution in AC and iron-modified activated
carbons, FeACs, using different KMnO4 to FeSO4.7H2O
molar ratios; B (0.1:0.1), C (0.5:0.1), D (0.1:0.5) and E (1:1).
The inset describes the PSD in AC and E
82

xiii
Figure 4.4 SEM images of (a) AC and iron-modified activated carbons,
FeACs, using different KMnO4 to FeSO4.7H2O molar ratios;
(b) B (0.1:0.1), (c) C (0.5:0.1), (d) D (0.1:0.5) and (e) E (1:1)
85
Figure 4.5 EDX spectra of AC and iron-modified activated carbons,
FeACs, using different KMnO4 to FeSO4.7H2O molar ratios;
B (0.1:0.1), C (0.5:0.1), D (0.1:0.5) and E (1:1)
87
Figure 4.6 TEM images of (a) AC and iron-modified activated carbons,
FeACs, using different KMnO4 to FeSO4.7H2O molar ratios;
(b) B (0.1:0.1), (c) C (0.5:0.1), (d) D (0.1:0.5) and (e) E (1:1)
89
Figure 4.7 HRTEM images of (a) AC and iron-modified activated
carbons, FeACs, using different KMnO4 to FeSO4.7H2O
molar ratios; (b) B (0.1:0.1), (c) C (0.5:0.1), (d) D (0.1:0.5)
and (e) E (1:1)
91
Figure 4.8 SAED patterns of (a) AC and iron-modified activated
carbons, FeACs, using different KMnO4 to FeSO4.7H2O
molar ratios; (b) B (0.1:0.1), (c) C (0.5:0.1), (d) D (0.1:0.5)
and (e) E (1:1)
93
Figure 4.9 XRD patterns of AC and iron-modified activated carbons,
FeACs, using different KMnO4 to FeSO4.7H2O molar ratios;
B (0.1:0.1), C (0.5:0.1), D (0.1:0.5) and E (1:1)
94
Figure 4.10 FTIR spectra of AC and iron-modified activated carbons,
FeACs, using different KMnO4 to FeSO4.7H2O molar ratios;
B (0.1:0.1), C (0.5:0.1), D (0.1:0.5) and E (1:1)
97
Figure 4.11 Thermal analyses (a) TG and (b) DT plots of AC and iron-
modified activated carbons, FeACs, using different KMnO4
to FeSO4.7H2O molar ratios; B (0.1:0.1), C (0.5:0.1), D
(0.1:0.5) and E (1:1)
100

xiv
Figure 4.12 XPS spectra of (a) AC and iron-modified activated carbons,
FeACs, using different KMnO4 to FeSO4.7H2O molar ratios;
(b) B (0.1:0.1), (c) C (0.5:0.1), (d) D (0.1:0.5) and (e) E (1:1)
105
Figure 4.13 M-H curves for AC and iron-modified activated carbons,
FeACs, Using Different KMnO4 to FeSO4.7H2O molar ratios;
B (0.1:0.1), C (0.5:0.1), D (0.1:0.5) and E (1:1)
108
Figure 4.14 TPR–H2 profiles of AC and iron-modified activated carbons,
FeACs, using different KMnO4 to FeSO4.7H2O molar ratios;
B (0.1:0.1), C (0.5:0.1), D (0.1:0.5) and E (1:1)
112
Figure 4.15 TPD–CO2 profiles of AC and iron-modified activated
carbons, FeACs, using different KMnO4 to FeSO4.7H2O
molar ratios; B (0.1:0.1), C (0.5:0.1), D (0.1:0.5) and E (1:1)
114
Figure 4.16 TPD–NH3 profiles of AC and iron-modified ACs, using
different KMnO4 to FeSO4.7H2O molar ratios; B (0.1:0.1), C
(0.5:0.1), D (0.1:0.5) and E (1:1). Inset shows the TPD-NH3
profiles of all materials in the range of 700 to 850 oC
117
Figure 4.17 Representation of the acidic and basic sites in correlation
with the iron contents in AC and iron-modified ACs, using
different KMnO4 to FeSO4.7H2O molar ratios; B (0.1:0.1), C
(0.5:0.1), D (0.1:0.5) and E (1:1)
118
Figure 4.18 Determination of the pHpzc for AC and iron-modified
activated carbons, FeACs, using different KMnO4 to
FeSO4.7H2O molar ratios; B (0.1:0.1), C (0.5:0.1), D
(0.1:0.5) and E (1:1)
119
Figure 5.1 MB uptake by AC and iron-modified activated carbon, E, (a)
at different pH, while (b) represents removal efficiency and
inset shows the pH changes
122

xv
Figure 5.2 Percentage removal of MB by AC and iron-modified
activated carbon, E, at different adsorbent dosage. Inset
shows the amount of MB adsorbed correspondingly
125
Figure 5.3 Effect of shaking speed on the adsorption of MB by AC and
iron-modified activated carbon, E
127
Figure 5.4 Equilibrium plots of MB adsorption onto AC and iron-
modified activated carbon, E, at different temperatures
129
Figure 5.5 Pseudo-first order plots for the MB adsorption onto AC and
iron- modified activated carbon, E, at various temperatures
130
Figure 5.6 Pseudo-second order plots for MB adsorption onto AC and
iron-modified activated carbon, E
134
Figure 5.7 Arrhenius plots for activation energy (Ea) for MB adsorption
by AC and iron-modified activated carbon, E
135
Figure 5.8 Intraparticle diffusion model plots for the MB adsorption
onto (a) AC and (b) iron-modified activated carbon, E, at
various temperatures
137
Figure 5.9 Bangham model plots for MB adsorption onto (a) AC and (b)
iron-modified activated carbon, E, at various temperatures
139
Figure 5.10 Dimensionless characteristic curves (Elovich Equation) of
MB sorption by (a) AC and (b) iron-modified activated
carbon, E, at various temperatures
141
Figure 5.11 Effect of initial MB concentration at various temperatures on
MB adsorption by AC and iron-modified activated carbon, E
144
Figure 5.12 Langmuir model plots for MB adsorption onto AC and iron-
modified activated carbon, E
146
Figure 5.13 Freundlich model plots for MB adsorption onto (a) AC and
(b) iron-modified activated carbon, E, at various temperatures
148

xvi
Figure 5.14 van’t Hoff plots for the MB adsorption by AC and iron-
modified activated carbon, E
151
Figure 5.15 Effect of ionic strength on the MB adsorption onto (a) AC
and (b) iron-modified activated carbon, E
154
Figure 5.16 Regeneration studies of spent adsorbents AC and iron-
modified activated carbon, E, using (a) H2SO4 (b) NaOH (c)
NaNO3 and (d) distilled water
157
Figure 5.17 MB adsorption/desorption profile on (a) AC and (b) iron-
modified activated carbon, E, by using 0.1 M H2SO4 as
desorbing agent
161
Figure 5.18 MB removal by AC and iron-modified activated carbon, E, in
a continuous flow system
164
Figure 5.19 Germination of mung beans seeds in different aqueous media 166
Figure 6.1 Reaction mechanism involved in biodiesel production from
WCO
172
Figure 6.2 Screening of solid catalysts for biodiesel production from
WCO
173
Figure 6.3 GC-MS chromatograms of (a) standard and (b) biodiesel
produced
175
Figure 6.4 FTIR spectra of WCO and biodiesel produced from WCO
using solid catalyst, E (T = 120 oC, t = 5 h, catalyst loading =
9 wt. %, methanol/WCO ratio = 16:1)
178
Figure 6.5 Reusability of the heterogeneous catalyst (E) for biodiesel
production from WCO
180

xvii
LIST OF ABBREVIATIONS
AAS
AC
Atomic Absorption Spectrophotometer
Activated Carbon
ACC
BET
BJH
BOD
CHN
C.I.
CNTs
COD
CTAB
CTAC
DFT
DNA
DO
DTA
E
EDX
FAA
FAME
FeACs
FTIR
GAC
HRTEM
JAC
JCPDS
MB
MG
MO
MRI
NaLS
NIA
Activated Carbon Cloth
Brunauer Emett Teller
Barrett Joyner Halenda
Biochemical Oxygen Demand
Carbon, Hydrogen and Nitrogen
Color Index
Carbon Nanotubes
Chemical Oxygen Demand
Cetyltrimethylammonium bromide
Cetyltrimethylammonium chloride
Density Functional Theory
Deoxyribonucleic acid
Dissolved Oxygen
Differential Thermal Analysis
Iron-modified AC with molar ratio 1 M KMnO4 : 1 M FeSO4.7H2O
Energy Dispersion X-ray
Free Fatty Acids
Fatty Acid Methyl Ester
Iron-Modified Activated Carbon materials
Fourier Transform Infrared Spectroscopy
Granular Activated Carbon
High Resolution Transmission Electron Microscopy
Jatropha curcus L. based Activated Carbon
Joint Committee on Powder Diffraction Standards
Methylene Blue
Malachite Green
Methyl Orange
Magnetic Resonance Imaging
Sodium lauryl sulfate
No information available

xviii
OMCs
PAC
PEI
pHeq
pHpzc
PSD
R
r2
SAA
SAED
SD
SEM
TCC
TDS
TEM
TG/DTA
TIC
TOC
TPR
TPD
TSS
UNICEF
USEPA
VSM
WCO
WHO
XPS
XRD
Ordered Mesoporous Carbons
Powdered Activated Carbon
Polyethyleneimine
pH at Equilibrium
pH of Point of Zero Charge (PZC)
Pore Size Distribution
Universal gas constant
Regression coefficient
Surface Area Analysis
Selected Area Electron Diffraction
Standard Deviation
Scanning Electron Microscopy
Total Carbon Contents
Total Dissolved Solids
Transmission Electron Microscopy
Thermo Gravimetric / Differential Thermal Analyses
Total Inorganic Carbon
Total Organic Contents
Temperature Programmed Reduction
Temperature Programmed Desorption
Total Suspended Solids
United Nations International Children’s Emergency Fund
United States Environmental Protection Agency
Vibrating Sample Magnetometer
Waste Cooking Oil
World Health Organization
X-ray Photoelectron Spectroscopy
X-ray Diffraction

xix
LIST OF SYMBOLS
A Arrhenius factor (g/mg min)
Å Angstrom
Co Initial concentration (mg/L)
Ce Equilibrium concentration (mg/L)
Dp Pore’s diameter (nm)
Ea Activation energy (kJ/mol)
h Hour or hours
KL Binding energy constant (L/mg)
k1
k2
ki
m
qe
qref
qt
RE
RL
Rt
T
t
tref
V
Vmac
Vmes
Vmic
Xm
G
H
S
Pseudo-first order rate constant (1/min)
Pseudo-second order rate constant (g/mg min)
Rate constant for intraparticle diffusion model (mg/g min0.5)
Mass/weight of the material taken (g)
Amount adsorbed at equilibrium (mg/g)
Amount adsorbed at tref (mg/g)
Amount adsorbed at time t (mg/g)
Dimensionless factor for Bangham model
Separation factor
Retention time (min)
Temperature (K and/or oC)
Time (min)
Reference time for Bangham model (min)
Volume of dye taken (mL)
Volume occupied by macropores (cm3/g)
Volume occupied by mesopores (cm3/g)
Volume occupied by micropores (cm3/g)
Maximum amount adsorbed (mg/g)
Gibb’s free energy change (kJ/mol)
Enthalpy change (kJ/mol)
Entropy change (J/mol K)
xx
PENYEDIAAN, PENCIRIAN DAN APLIKASI KARBON TERAKTIF
TERUBAHSUAI FERUM OKSIDA PELBAGAI FUNGSI
ABSTRAK
Kajian ini telah dijalankan untuk mengkaji penyediaan, pencirian dan aplikasi
berbeza karbon teraktif terubahsuai ferum oksida (FeACs). Permukaan karbon
teraktif (AC) pada awalnya telah dioksidakan dengan menggunakan kalium
permanganat (KMnO4) diikuti impregnasi ferum dengan ferum sulfat (FeSO4.7H2O)
sebagai prekursor ferum dengan nisbah molar agen pengoksidaan kepada ferum
berbeza untuk mengkaji kesan impregnasi ferum terhadap ciri fizikokimia bahan
karbon baru yang disediakan. Pelbagai teknik pencirian seperti analisis luas
permukaan, SEM, EDX, TEM, HRTEM, SAED, XRD, FTIR, CHN, TCC, TG/DTA,
XPS, VSM, TPR / TPD dan pHpzc telah dijalankan. Permukaan impregnasi AC
merubah dengan banyak luas permukaan disamping keliangan bahan yang baharu
disediakan. Peningkatan luas permukaan sehingga 1640 m2/g didapati untuk AC yang
terubahsuai, dengan nisbah molar 0.1 KMnO4 : 0.1 FeSO4.7H2O (B), adalah lebih
tinggi daripada AC mentah (1094 m2/g). Walau bagaimanapun, AC yang terubahsuai
dengan nisbah molar 1 KMnO4 : 1 FeSO4.7H2O (E), menunjukkan luas kawasan
permukaan 543 m2/g dan diameter liang paling besar (5.49 nm) jika dibandingkan
dengan semua bahan lain. Morfologi permukaan bahan karbon terubahsuai ferum
adalah tidak seragam dan menunjukkan kehadiran zarah ferum pada permukaan dan
liang AC. Corak XRD menunjukkan kehadiran Fe2O3 dan Fe3O4. Selain daripada
peningkatan kumpulan berfungsi permukaan, bahan karbon terubahsuai ferum juga
menunjukkan sifat kemagnetan melalui analisis VSM. Keputusan TPR/TPD bahan
terubahsuai ferum menunjukkan potensi untuk digunakan sebagai mangkin

xxi
heterogen. AC terubahsuai ferum menunjukkan perubahan drastik pada pHpzc
berbanding AC. Bahan yang telah disediakan telah digunakan bagi penjerapan
Metilena Biru (MB) sebagai model pewarna. Penyingkiran MB menggunakan AC
dan E telah dikaji dengan pelbagai parameter seperti pH, dos penjerap, kelajuan
goncangan, suhu, kepekatan awal pewarna, masa sentuhan dan kekuatan ionik.
Penyingkiran MB didapati meningkat dengan peningkatan pH dan kecekapan
penyingkiran pewarna mencapai kepada 89 dan 95 %, masing-masing untuk AC dan
E. Walau bagaimanapun, kecekapan penyingkiran MB oleh E mencapai sehingga 98
% hanya dengan menggunakan 0.2 g, manakala kecekapan yang sama telah
ditunjukkan oleh AC menggunakan dos yang lebih tinggi (1 g). Selain itu, kelajuan
goncangan tidak menunjukkan kesan drastik terhadap penyingkiran MB melebihi 400
rpm. Sementara itu, kesan suhu menunjukkan bahawa penjerapan MB oleh AC dan E
adalah eksotermik dan model isoterma Langmuir adalah yang terbaik untuk
menerangkan mekanisme tindak balas. Disamping itu, kajian kinetik menunjukkan
bahawa model kinetik tertib pseudo-kedua adalah padanan model terbaik kepada data
yang telah dianalisis. Penjanaan semula penjerap yang telah digunakan menunjukkan
AC terubahsuai ferum, E, dapat digunakan sehingga 10 kitaran berturut-turut tanpa
pengurangan kecekapan yang signifikan (≈ 98 %). Satu lagi aplikasi AC terubahsuai
ferum yang turut dikaji adalah tindak balas bermangkin penukaran sisa minyak masak
(WCO) kepada biodiesel menerusi tindak balas pengesteran dan trans-pengesteran.
Sifat pemangkinan E didapati yang terbaik dikalangan semua bahan karbon yang
disediakan dengan hasil FAME sebanyak 78 %. Disamping itu, penilaian
kebolehgunaan semula E juga menunjukkan hasil FAME yang tinggi dan konsisten
(sehingga 75–78 %) sehingga kitaran ketiga yang kemudiannya turun kepada 50 %
pada kitaran keenam.

xxii
PREPARATION, CHARACTERIZATION AND APPLICATIONS OF
MULTI-FUNCTIONAL IRON OXIDES-IMPREGNATED ACTIVATED
CARBON MATERIALS
ABSTRACT
This study was conducted to investigate the preparation, characterization and
different applications of iron oxides-impregnated activated carbon materials (FeACs).
The surface of activated carbon (AC) was initially oxidized by using potassium
permanganate (KMnO4) followed by the iron impregnation using ferrous sulphate
(FeSO4.7H2O) as iron precursor using different molar ratios of the oxidizing agent to
the iron precursor to examine the impact of iron impregnation on the physicochemical
characteristics of the newly prepared carbon materials. Various characterization
techniques such as surface area, SEM, EDX, TEM, HRTEM, SAED, XRD, FTIR,
CHN, TCC, TG/DTA, XPS, VSM, TPR/TPD and pHpzc analyses were carried out.
The surface impregnation of AC varies the surface area as well as the porosity of the
newly prepared materials to a great extent. It depicted an increase in the surface area
up to 1640 m2/g for modified AC having molar ratio 0.1 KMnO4 : 0.1 FeSO4.7H2O
(B), which was comparatively higher than the raw AC (1094 m2/g). Modified AC
having molar ratio 1 KMnO4 : 1 FeSO4.7H2O (E), however, shows a decrease in
surface area to 543 m2/g and the highest pore diameter (5.49 nm) as compared to all
other materials. Surface morphology of the iron-impregnated materials was non-
uniform and depicted the iron particles penetration on the surface and the pores of
AC. XRD pattern revealed the presence of iron oxide in the form of Fe2O3 and Fe3O4
in the iron-modified materials. Besides the increased in the surface functional groups,
the iron-impregnated materials have shown magnetic character as revealed from

xxiii
VSM analyses. In addition, TPR/TPD results reveal the potential application of FeAC
material as heterogeneous catalyst. The iron impregnation of AC also resulted in a
drastic change in the pHpzc of the modified materials compared to the AC. The
prepared materials were investigated for the adsorption of Methylene Blue (MB) as a
model dye. MB removal capacity of AC and E was examined using various
parameters such as pH, adsorbent dosage, shaking speed, temperature, initial
concentration of dye, contact time and the ionic strength. The MB removal increased
with the increase in pH and the dye removal efficiency reached 89 and 95 % for AC
and E, respectively. However, MB removal efficiency of E reached 98 % using only
0.2 g, while the similar efficiency was observed by AC at higher AC dosage (1 g).
The shaking speed did not show any drastic changes in the MB removal above 400
rpm. Meanwhile, the temperature effect study revealed that MB adsorption on AC
and E was exothermic and Langmuir isotherm model was the best to explain the
reaction mechanism. In addition, the kinetics studies demonstrated that pseudo-
second order kinetic model was the best model fitted to the data analyzed. The
regeneration of the spent adsorbent E was successfully applied up to 10 consecutive
cycles without any significant loss in its efficiency (≈ 98 %). Another application of
the iron-impregnated AC materials is in the catalytic conversion of waste cooking oil
(WCO) into biodiesel following the esterification and transesterification. The
catalytic potential of E was found the best among all materials with FAME yield of
78 %. In addition, the reusability of E was also evaluated and the Fe modified AC
shows consistently high FAME yield, up to 75–78 %, for the first three cycles and
reduced to below 50 % in the sixth cycle.

1
CHAPTER 1
INTRODUCTION
1.1 Background of the Study
Activated carbon (AC) is widely known and used as adsorbent material for
removing both organic and inorganic pollutants from aqueous system. AC is generally
produced from biomass with high carbon contents such as wood, coal, lignin etc.
following the pyrolysis of the organic matter and the activation of char residue either at
higher temperature i.e. physical treatments (Amin, 2009; Baklanova et al., 2003) or
using chemical reagents (Prahas et al., 2008; Qian et al., 2008) or following both
physical and chemical treatments (Bansal et al., 1988; Kopac & Toprac, 2007; Suhas et
al., 2007). The surface chemistry of AC plays an important role during the adsorption of
organic pollutants from water (Moreno-Castilla, 2004). It has been found that, the
surface charge density, surface area of the sorbent and correspondingly the charge of the
respective adsorbate molecules influence the removal of pollutants from the bulk.
The significance of AC is evident from the variety of their applications and in
whatever form they have been used. However, a notable thing is the treatment of ACs
surface during preparation and afterwards. There are many data available showing that
the efficiency of AC can be enhanced further via surface modifications as summarized in
a detailed review by Yin et al. (2007). The surface chemistry and characteristics of AC
can be tailored according to the applications. In general, chemical, physical and/or
biological treatments are adapted to modify the surface of AC. Ultimately, the surface
area and surface charge density of AC varies and the newly developed physicochemical
character lead to the enhanced sorption affinity of AC towards wide range of adsorbates.

2
One of the most essential elements of life on earth is the provision of clean
water. No doubt, the economical supply and availability of the fresh water is the
challenge of this century (Mukherjee et al., 2014). In a report by World Health
Organization, WHO (2012), a significant proportion of human population (780 millions)
is facing the scarcity of drinking water. Hence, it is indispensable to save water
resources to save life. The sources for drinking water are generalized as ground water,
seawater, lakes, canals, rain water and reservoirs. Back in the early 20th century,
particularly in Sub-Saharan Countries, less attention was paid to the environmental
aspects of the wastewater produced, sanitation and provision of fresh drinking water
(WHO/UNICEF, 2010). In the past, there were no such regulations set as
recommendation limits for the wastewater contaminants (Gupta & Suhas, 2009). Only
physical treatment through sedimentation to maintain the pH of the discharge water and
to remove total suspended solids (TSS) and total dissolved solids (TDS) from the
wastewater were used. However, since the last couple decades, the research on treating
wastewater for environmental safety has been given more attention. In this respect,
governments, users and manufacturers equally contribute to deliver treated water
following various water remediation pathways.
Dyes have been preferentially used as chemical compounds for coloration giving
more brightness and good finishing to the cloth/fabric. Synthetic dyes are frequently
used in textile industries, dyes manufacturing, paper, food processing, printing,
cosmetics, rubber, plastics and leather tanning industries. Most of the dyes known are
organic molecules having complex origin and are highly resistant to detergents, light and
chemicals etc. The molecular structure of the dyes consists of auxochromes and

3
chromophores. The auxochromes (e.g. ̶ COOH, ̶ NH2, ̶ OH and ̶ SO3H etc.) are the
substituents which donate or withdraw electron and help in intensifying the color of dyes
and provide the base to the chromophore and increase its solubility in water as well as
enhance its affinity towards fabric. Whereas, the chromophores (e.g. ̶ C=N ̶ , ̶ C=C ̶ , ̶
C=O, ̶ NO2 and ̶ N=N ̶ etc.) have delocalized electron system (alternating double
bonds) in their structure and gives color to the dyes molecules (Verma et al., 2012).
Based on the charged carried by the dissociated species of parent dye molecule, dyes are
classified as cationic dyes such as methylene blue (MB) and anionic dyes such as methyl
orange (MO).
Adsorption is commonly described as a surface phenomenon, whereby an
incoming molecule both from a gas or a liquid (adsorbate) interact with the surface of a
solid (adsorbent) and get accumulated forming a mono- or multi-layers (Atkins, 2010;
Dabrowski, 2001). According to these authors, adsorption dealt with the gathering or
concentration of the adsorbate molecules on the surface of the adsorbent. Whereby, the
reverse phenomenon of adsorption i.e. the removal of accumulated adsorbate molecules
from the surface of adsorbent back into the bulk is called desorption (Yagub et al.,
2014). Sometime, both adsorption and desorption occur simultaneously until an
equilibrium state is established. Another closely related term is called absorption, which
is defined as the penetration or diffusion of the adsorbate molecules into the solid phase
of adsorbent. In some cases, when the adsorption and absorption phenomena are unclear
to be identified, a collective term sorption is used instead. Adsorption has been further
divided into chemical adsorption (or chemisorption) and physical adsorption (or
physisorption) (Salleh et al., 2011). Both types of adsorption processes are based on the

4
strength of the intermolecular attraction forces between the adsorbent and the adsorbate.
In general, if the adsorbent and adsorbate interaction involve chemical bonding, then the
incoming molecules will be strongly adsorbed and the process will be chemisorptions.
However, if the interactions between adsorbent and adsorbate are weak due to van der
Waal forces, then physisorption will occur. The selection of suitable adsorbent material
for water remediation is generally based on factors like non hazardous nature of the
material, easily available, inexpensive and reusable (Ali et al., 2012).
Adsorption in general and adsorption via AC in particular, has been found the
best and oldest wastewater treatment technology due to the low cost, ease of operation,
high precision, simple design, suitable for laboratory scale as well as industrial scale
applications and effective for the uptake of a wide range of pollutants (Hameed et al.,
2007a; Kannan & Sundaram, 2001; Rafatullah et al., 2010; Tan et al., 2008). However,
there are some limitations to the adsorption of dyes pollutants or any other pollutant on
the adsorbents resulted from the dumping of loaded spent material. These spent
adsorbents can be disposed as such, incinerated or regenerated. However, the disposed
used materials will become secondary pollutants which ultimately increase the
operational cost and badly affect the environment (Sabio et al., 2004). Similarly, the
incineration of spent adsorbent may increase the greenhouse gases as well as destroy the
surface properties of the materials (Singh & Ward, 2013).
Worldwide debate on energy crises and global warming due to the extensive use
of fossil fuels as the ultimate energy source prompted researchers to explore alternative
energy sources. An interesting idea has been adapted in the form of biodiesel which has
been identified as clean burning fuel having low quantity of sulphur and aromatics

5
contents, high cetane number and lubricity, and also is helpful in reducing greenhouse
gases emission (Ma et al., 1999; Takase et al., 2014). The other advantageous aspects of
biodiesel are biodegradability, environmentally friendly, renewability and can be used as
such in the conventional ignition engines without requiring any specific setup of the
existing engines (Lee et al., 2005; Semwal et al., 2011). In general, the catalytic
transesterification of edible or non edible oils in the presence of alcohol (i.e. methanol or
ethanol etc) produces fatty acid methyl ester (FAME) referred to as biodiesel along with
a bye-product glycerin (Almeida et al., 2012). There are three major classes of catalysts
namely biocatalyst, homogeneous and heterogeneous catalysts used for the catalytic
conversion of glycerides and alcohols into biodiesel (Helwani et al., 2009; Lam et al.,
2010; Math et al., 2010; Meher et al., 2006).
1.2 Problem Statements
A simple and cost effective method to produce a reusable AC material with
improved physicochemical characteristics is the centre of our current study. Notably, a
comprehensive characterization of the powdered materials to investigate the
physicochemical properties of AC substrate before and after the surface modifications is
often overviewed to identify the properties as well as its potential applications. The
impact of surface modification of AC is to expand the utilization of AC and not limit its
usage only as adsorbent.
Despite the significant results associated with AC in the water remediation, there
exist some problems associated with the adsorption process itself. The foremost problem
is the dumping of the spent adsorbents loaded with toxin. These spent AC will be the
secondary pollutants to the environment if not properly treated. The regeneration of

6
spent adsorbents with consistent performances is still a challenge for many researchers
to be resolved as well as to make adsorption process more environmentally friendly and
cost effective. If otherwise, a bulk quantity of solid waste will be introduced into the
environment creating problems for the mankind.
Besides the adsorption characteristics of activated carbon based materials,
detailed knowledge of its potential to be used as carbon catalysts are still limited. In
addition to that, data on reusable character of the previously investigated catalysts is
insufficient. Moreover, the high production cost of biodiesel due to expensive feedstock
such as fresh oil, is an obstacle to overcome (Lim & Teong, 2010). This study describes
an environmentally friendly pathway of converting waste cooking oil into biodiesel
using a reusable AC based heterogeneous catalyst, which advances the carbon material’s
applications in energy and environmental sectors.
1.3 Objectives of the Proposed Study
This thesis reports on the preparation of reusable, cost effective and multi-
function adsorbent, following the surface modification of AC by iron impregnation. The
specific objectives of the proposed study are;
1. To prepare iron-modified activated carbon materials (FeACs) with improved
physicochemical characteristics via simple surface oxidization and foreign
materials impregnation.
2. To characterize the parent AC and its iron-modified derivatives thoroughly
using various characterization techniques and identify its potential
applications.
7
3. To compare the efficiencies of AC and the selected iron-modified activated
carbon material towards the adsorption of methylene blue (MB) besides
examining the regeneration capacity of the spent adsorbents.
4. To investigate the catalytic potential of the iron-modified AC substrate in the
conversion of waste cooking oil (WCO) to biodiesel.
1.4. Scope of the Proposed Study
This study corroborates the improved characteristics and applications of classical
material AC, mainly used as adsorbent material for water purification. The surface
modification of AC is beneficial in the enhancement of the overall performance of
otherwise inert AC. Detailed characterization of unmodified and modified AC materials
shed light on the various possible applications of the modified AC materials.
Particularly, the substantial dye’s removal efficiency and regeneration of the spent iron-
modified AC material are the advantageous factors of the proposed study. Moreover, the
successful conversion of waste cooking oil into biodiesel will be beneficial from
environmental aspects as well as will be crucial in the energy sector using waste
feedstock and low cost heterogeneous catalyst i.e. iron-modified AC material.
Furthermore, the reusable character of the proposed heterogeneous catalyst is crucial for
an eco-friendly pathway of producing biodiesel.

8
CHAPTER 2
LITERATURE REVIEW
2.1. Activated Carbon
The use of activated carbon as adsorbent material is very classical and many data
is available reporting the water decontamination using AC material. As briefly described
in Chapter 1, the widespread use of AC as adsorbent, is due to its unique surface
characteristics and high affinity towards a wide range of pollutants. Out of many data
reported, research on natural and commercial production of AC is summarized below.
Naturally, peat residue which is consists of the plants debris (i.e. roots, barks)
and decayed products undergo various changes with time under the influence of heat and
bacterial action, and is transformed into coal (Figure 2.1). The degradation and
transformation of the widespread resources of organic and inorganic matter in early ages
resulted in dumped deposits of carbonaceous materials, the raw material for AC (Jansen
et al., 2013). Besides that, biomass residues from the widespread deforestation or
burning of plant materials have also been used as the raw materials for AC production
(Wang et al., 2010a). ACs have high surface areas and unique porous texture. ACs are
chemically and thermally stable materials with a variety of surface functional groups
(Boumaza et al., 2012; Shi et al., 2010; Tongpoothorn et al., 2011; Yalcin & Sevinc,
2000; Yang & Qiu, 2010). The surface areas of AC have been reported to be between
500 to 2000 m2/g with a wide pore range of micropores (< 2 nm), mesopores (2–50 nm)
and macropores (> 50 nm) (Ahmad et al., 2007; Aljundi & Jarrah, 2008; Aworn et al.,
2008; Bhatnagar & Silanpaa, 2010; Girgis et al., 2007).

9
Figure 2.1. Coalification process of plants and plants residues (Adapted from Kentucky Geological Survey, 2012).
The activation of carbonaceous materials to produce AC is usually carried out in
the absence of air or any other gas (pyrolysis) to ensure that the raw materials are
transformed into char without undergoing gasification. However, to improve the porous
texture and enhance surface area, activation of the native material has been conducted
via oxidization in the presence of steam (El-Qada et al., 2006), gas such as carbon
dioxide (Toles et al., 2000a) or both simultaneously (Li et al., 2002). On the other hand,
chemical activation of carbonaceous materials is carried out using activating agents like
acids (Boumaza et al., 2012; Khadiran et al., 2015; Toles et al., 2000b), alkaline solution
(Lozano-Castello et al., 2001; Nowicki et al., 2010) or oxidizing agents such as H2O2,

10
HNO3, (NH4)2S2O8 (Moreno-Castilla et al., 2000). These treatments alter the surface
area, morphology, porosity and functionalities on the surface of AC.
2.1.1 Production of AC from Raw Materials and Their Activation Processes
The naturally occurring resources which are used as feedstock to produce
activated carbon consist of coal, wood, lignite and peat. These AC sources usually
contain 40–90 % carbon contents and having a density ranging from 0.4 to 1.45 g/mL
(Maurice Deul, 1959). Numerous studies including a number of detailed reviews (Dias
et al., 2007; Gupta & Ali, 2002; Ioannidou & Zaibaniotou, 2007; Mohan & Pittman,
2006; Rafatullah et al., 2010) have been reported in the literature, highlighting the use of
waste materials to produce AC.
Several other researchers have reported the use of raw materials such as
industrial wastes (Bhattnagar & Jain, 2005), plants remains (Bulut & Aydin, 2006;
Hameed, 2009; Thinakaran et al., 2008; Wang et al., 2010a), agriculture waste such as
bamboo (Hameed et al., 2007b; Ip et al., 2009; Wang, 2012), coconut husk (Al-Aoh et
al., 2014; Tan et al., 2008), oil palm frond (Salman et al., 2011), hermal seed residue
(Tofighi & Mohammadi, 2014), oil palm fiber (Tan et al., 2007), and vegetal fiber
(Cherifi et al., 2013) for manufacturing AC. In addition, organic precursors with high
carbon contents such as animal bone char (Ip et al., 2010), commercial wood based
carbon (Seredych & Bandosz, 2011), and coal based carbons (Li et al., 2014) have also
been used to prepare high quality activated carbons. Moreover, biomass such as Pisum
sativum (Gecgel et al., 2013), Euccalyptus camaldulensis barks (Balci et al., 2011),
Punica granatum pulp (Guzel et al., 2012), Salix psammophila (Bao & Zhang, 2012),

11
Prosopis cineraria (Garg et al., 2004a), and Pinus radiata (Sen et al., 2011) have also
been attempted to produce AC for the treatment of polluted water. Generally, the raw
materials are subjected to certain treatments to produce good quality AC, following any
of the routes depicted in Figure 2.2.
Figure 2.2. Commonly used strategies to produce AC via activation of raw materials (Mohan & Pittman Jr., 2006).

12
Besides the aforementioned works, a few more studies reported in the literature
depicting the use of raw materials to produce AC, surface treatments, impacts on its
physicochemical characteristics and the adsorption affinity towards different pollutants
have been summarized in Table 2.1.
Table 2.1
Summary of Applications of ACs Prepared from Various Precursors, Surface Treatments, and Their Physical Characteristics
Precursor Treatment Surface area (m2/g)
Pore diameter (nm)
Pollutant Reference
Raw materials
Coal blends Oxidation under CO2
1215 3.50 Arsenic Li et al. (2014)
Peat Air dried and soaked in HCl
NIA NIA Methylene Blue
Fernandes et al. (2007)
Commercial bituminous coal
No treatment applied
1100 NIA Remazol Yellow and Remazol Black
Al-Degs et al. (2009)
Sucrose Sol-gel technique was applied by mixing sucrose with H2SO4 and followed by carbonization
650 1.35 Reactive Black, Naphthol Blue Black and Remazol Brilliant Blue R
Galan et al. (2013)
Agricultural waste
Rattan sawdust
Activation with H3PO4
1037 2.56 Disperse dye Ahmad et al. (2009)
Bamboo waste
Chemical activation using H3PO4
988 2.82 Chemical oxygen demand (COD) and color
Ahmad and Hameed (2010)

13
removal
Waste rubber tire
Carbonization, oxidization and chemical treatment
562 NIA Acid Blue 113
Gupta et al. (2011)
Pomegranate peel
Physicochemical activation
NIA NIA Direct Blue-106
Amin, (2009)
Biomass
Polygonum orientale Linn (Oriental pepper)
Activation with phosphoric acid followed by the carbonization
1398 1.54 Malachite Green and Rhodamine B
Wang et al. (2010b)
Artocarpus heteropyllus (Jack fruit)
Drying, grinding and heating at 105 oC
NIA NIA Methylene Blue
Uddin et al. (2009)
Camellia sinensis (Tea)
Chemical activation with ZnCl2
1530 0.78 Methylene Blue
Gao et al. (2013a)
NIA = No Information Available
2.1.2 Surface Functionalities on Activated Carbon
It is well known that physicochemical characteristics of AC including surface
area, porosity, functional groups and particle size influence the performance of AC.
During the manufacturing of porous AC, the layer by layer arrangement may not be well
packed and homogenized thus producing porous texture among the layers (Boehm,
2002). Adsorption studies are usually correlated as the surface phenomenon, hence by
changing the surface characteristics, the overall efficiency is affected. Nevertheless, the
aforementioned characteristics of AC have great influence on its performance. It is
understood that, the adsorption efficiency increases with the increase in surface area as
more adsorbate molecules will be exposed to the available sites, while the converse is
true for lower surface area. In addition to that, the surface morphology and surface

14
functionalities greatly affect the performance of adsorbent. The oxygen molecules
interacting with the surface of AC generates a number of surface functional groups such
as hydroxyl, carbonyl, carboxylic etc. as shown in Figure 2.3.
Figure 2.3. Surface functional groups commonly found on the surface of AC (Boehm, 1994).
More often, these oxygen species find their way to the porous AC and bound to it
in the form of oxides which are responsible for the surface reactivity of AC. The surface
of AC becomes more acidic when the concentration of oxygen contents is high and
when the surface oxygen contents are low, AC gains its basic character and is considered
good for cationic and/or anionic exchange behavior, respectively (Boehm, 1994). This
identification is also crucial for the selective sorption of pollutants from the bulk.

15
2.2 Water Scarcity, Pollution and Remediation
The development in technology, population growth and increased consumption
of available water resources are responsible for the drastic shortage of available water,
which will seriously affect the life in the near future, if not properly preserved.
As summarized in a study conducted by Gupta and Suhas (2009), the demand of
fresh water supply is the necessity of the day as reported in United Nations World Water
Development Report by United Nations Educational Scientific and Cultural
Organization (UNESCO). To the best of known statistics, the consumption of water for
domestic, industrial and agricultural applications is 8, 22 and 70 %, respectively
(UNESCO, 2003). The extensive use of water in industrial processes is finally reverted
as discharge released in the form of wastewaters containing toxic pollutants (Helmer &
Hespanhol, 1997). These toxins mainly contain the unused dye residues, pesticides,
fertilizers etc. and/or the by-products produced during the process.
The robust development worldwide is the outcome of the recently triggered
industrialization. While the good impacts of such advancement on life style matter, their
environmental apprehension must not be forgotten. In a simple way to elaborate, besides
the good quality products introduced into the market, there are always some unwanted
and toxic by-products disposed into the environment through industrial effluents. If this
sludge is not properly treated prior to their accumulation into the sewerage system, they
will adversely affect the quality of life. In this context, the major pollutants which
frequently enter the water system are from the textile industries wastes containing the
dyes residues.

16
2.3 Dyes as Major Pollutants in the Wastewater
Although the exact figures are not known, it has been anticipated that
approximately 100,000 dyes are commercially available with the annual total production
of 7 × 10⁵ ton of dyestuff in the market (Crini, 2006). A total of 2 % of the dyes
produced were reported to have been directly released into the industrial effluents which
eventually enter the ground water. In a separate study by Pereira et al. (2003), the
authors revealed that up to 9 % of the total unused dye products was discharged as
textile effluents whereas, this amount was even higher (10–15 %) in other reported work
by Demirbas (2009). In whatever form, dyes residual sludge along with its by-products
are one of the major causes of water pollution.
The first reported dye was believed to be the Blue Indigo dye which was used as
organic colorant in the Egyptian tombs for packaging mummies, 4000 years ago. It was
claimed that up to the 19th century, most of the dyes used were natural dyes and obtained
mainly from plants, mollusks and/or insects. The first synthetic dye, mauveine, has been
discovered by Perkin in 1856 (Weissenbacher, 2009). This opened a new era for large
scale production of synthetic dyes for various industries.
2.3.1 Classification of Dyes
Dyes can be classified on the basis of their structure, which helps in identifying
the particular group of dyes with its characteristics such as azo and anthraquinone dyes.
However, due to complex dye structures, sometime it is difficult to follow such
classification. Dyes can be classified on the basis of their applications following the
Color Index (C. I.) system, which have been adopted worldwide. In this system, the

17
dye’s group, its color and a five digit number has been assigned to every dye. For
example, C. I. 52015 represents Methylene Blue (MB).
In common practices, the dyes classifications can be associated with the charge
on the dissociated ions of the dyes in aqueous media such as cationic dye or anionic dye.
The relevance of charges on the dissociated dyes molecules and the surface charge
density of the solids, are two important factors for the remediation of dyes wastewater.
The major groups of dyes have been summarized in Table 2.2.
Table 2.2
Classification of Dyes (Demirbas, 2009; Gupta & Suhas, 2009)
Class Solubility Name
Acid dyes Anionic, soluble in water
Azo, anthraquinone, azine, nitro, triphenylmethane, nitroso and xanthene etc.
Basic dyes
Soluble in water, have bright color
Cyanine, diazhemicyanine, hemicyanine, triarylmethane, thiazine, acridine and oxazine
Disperse dyes
Non-ionic, insoluble in water, show higher fixation rate
Azo, nitro, styryl, benxodifuranone and anthraquinone
Direct dyes Anionic compounds, soluble in water
Polyazo, oxazines, phthalocyanines and stilbenes
Reactive dyes Anionic compounds, soluble in water
Azo, oxazine, triarylmethane, formazan, phthalocyanine, anthraquinone and triarylmethane
Solvent dyes Soluble in organic solvents
Azo, triarylmethane, anthraquinone and phthalocyanine
Vat dyes Insoluble in water Indigoides and anthraquinone

18
2.3.2 Release of Dyes in Wastewater and Their Adverse Effects
With the increasing trend in industrialization, particularly in the textile and
related industries, the widespread use of water for wet processing is required which
ultimately release a large amount of wastewater. The wastewater released from
industries contains a large number of toxins that can cause severe problems to human
especially. A rough estimate of the amount of water required to produce 1 kg of cloth is
40 to 65 L (Manu & Chaudhari, 2002). Besides water, such industries have been
observed to use a wide range of chemicals (inorganic, organic and polymeric
compounds) for various operations (Robinson et al., 2001). However, the problems start
when the untreated wastewater is released into the hydrosphere. As reported in a
comprehensive review by Verma et al. (2012), the dyeing processes result in the release
of a large quantity of wastewater generated from disperse dyeing (91–129 L) and direct
and reactive dyeing (113–151 L) per ton of the dyestuff produced. Overall,
approximately 200 to 350 L wastewaters per ton products are generated during the
dyeing and finishing processes. Moreover, the increased chemical oxygen demand
(COD) estimated up to 100 kg per ton products was also reported.
Moreover, the extensive release of dyes in ground waters will be responsible for
the aesthetic problems and health related risks. In general, the color, COD, biochemical
oxygen demand (BOD), toxicity and turbidity of these effluents increased due to the
unused fractions of the synthetic dyes. Demirbas (2009) stated that, the wastewater
released from dye related textile industries have pH range of 2 to 14, total dissolved
solids between 50 to 6,000 mg/L, and COD of 50 to 18,000 mg/L. Dyes are considered
the color poison, prevailing color to water and also because the degraded products of

19
many dyes are toxic (mutagenic character), thus posing adverse effects on living
organisms (dos Santos et al., 2007; Salleh et al., 2011).
As reported in a review by Martinez-Huitle and Brillas (2009), even a small
quantity (1 mg/L) of dyes in the effluents imparts an undesired but visible color to the
discharge water which will limit the penetration of sunlight. Ultimately, the aquatic
photosynthesis and their biological activities will be disturbed. This colored water
directly or indirectly affects the aquatic flora and fauna which results in the death rise of
aquatic lives (plants, fish and mammals etc). Furthermore, the leaching of polluted water
into ground water; also affect the quality of the later. In general, the industrial
globalization, robust increase in the installation of industrial plants releasing a large
amount of effluents and climate change due to the rise in temperature and reduced
rainfall are the key factors deteriorating the quality and availability of fresh water.
Upon biological or chemical integration, these colored compounds may result in
eutrophication, increase in demand of dissolved oxygen (DO), hindrance in re-
oxygenation, and can cause microtoxicity and genotoxicity (Zaharia et al., 2009).
Eutrophication, in particular, comes out due to the excessive supply of neutrients upon
wastewater released into water bed which serves as feedstock for the growth of plants
and other microorganisms. These organisms will consume more oxygen upon their death
to be biodegraded; hence, the overall oxygen demand will be increased. The hazardous
effects of these toxins upon chronic exposure are respiratory problems, allergy, central
nervous system disorder, diarrhea, cyanosis, salivation, jaundice, tissue necrosis, skin or
eyes infections, immune diseases, leukemia, lung problems, irritation and vomiting etc
(Anliker, 1986; Foo & Hameed, 2010; Mukherjee et al., 2014). The severity of the dyes

20
adverse health effects have been investigated by various authorities such as World
Health Organization (WHO), United States Environmental Protection Agency (USEPA)
and United Nations International Children’s Emergency Fund (UNICEF). From the facts
revealed, Verma et al. (2012) quoted the improper wastewater treatments may be one of
the reasons for short life span (average 64 years) in developing countries such as India
whereas the life span in developed countries such as Japan is 83 year.
2.4 Different Types of Dyes Wastewater Remediation
Environmental protection agencies and researchers all over the world have made
many attempts to develop proper treatment technologies for the wastewater prior to the
disposal into the ground water to protect the environment. As reported in a study by Qu
et al. (2013), more focus should be given to the basic treatment technologies such as
sedimentation, disinfection via ozonation and/ or chlorination etc for the existing water.
The ultimate purpose to focuss on these treatments is to set up disinfection technologies
that do not produce harmful disinfection by-products. The currently existing water
treatment techniques have some limitations to be used to produce good water quality
required for the daily use. Hence, in some cases, two or more techniques are carried out
simultaneously to treat contaminated water (Chang et al., 2004).
Generally, the industrial wastewater released as effluents from any industrial
operations, undergoes three major steps before being disposed into the sewerage system
(Perry et al., 1997) which are; (1) primary treatment in which the industrial effluents
undergo mineralization (the oxidative decomposition of chemical substances into
organic matter which can be used by plants) followed by physical or chemical treatments

21
to remove the total suspended solids (TSS) and total dissolved solids (TDS), (2)
secondary treatment in which the effluents are then treated with microorganism such as
bacteria, which stabilizes the waste constituents and finally (3) tertiary treatment which
involve various physicochemical treatments such as adsorption, chemical oxidation, ion
exchange, and membrane separation to treat the industrial discharge to be delivered to
the sewarge system considered to be non toxic for aquatic organisms, irrigation and
agricultural reuse (Qu et al., 2013). These techniques can be applied in combination with
other treatments or individually.
The treatment technologies were thoroughly investigated and further advanced to
the use of filter beds and activated sludge for the biodegradation of wastewater
pollutants. Moreover, the research is currently going on to develop techniques which can
work alone or in combination to accelerate dyes removal from the wastewater.
The criteria for selecting the suitable method depend upon the ease of operation,
cost effectiveness, treatment duration, and efficiency. In a more precise manner, the
method should be safer, cleaner and greener. Usually, the wastewater treatment
technologies are divided into three broad categories such as; biological, chemical and
physical processes as described in detailed reviews reported elsewhere (Aksu, 2005;
Pereira et al., 2003; Slokar & Le Marechal, 1998; Yagub et al., 2014). These methods
have been in use since depending upon the working condition and the available
resources. A few of these methods are briefly discussed here; and more focus will be
given to the adsorption process which is a widely used and well known dye removal
technique due to its viability, accuracy, safe (no harmful end product) and simple
operation and comparatively less expensive (Tan et al., 2008; Xia et al., 2015; Zelmanov

22
& Semiat, 2014). Numerous physicochemical treatment technologies have been
employed for the water and wastewater remediation as described in Figure 2.4.
Figure 2.4. Flowchart describing the various wastewater treatment technologies (Crini, 2006).
2.4.1 Biological Remediation
Biological remediation processes are based on the use of microorganism such as
bacteria, fungi for the biodegradation of organic molecules following biosorption (Aksu,

23
2005; Mcmullan et al., 2001). The beneficial aspects of these treatments are the
complete mineralization of the dyestuff, no secondary pollution and of course the cost
effectiveness (dos Santos et al., 2007). Generally, these processes are classified as
aerobic, anaerobic and/or aerobic-anaerobic simultaneously.
Usually, the aerobic treatments are conducted by using various types of fungal or
bacterial strains and/or other microorganisms in the presence of oxygen whereby these
microorganisms secrete enzymes which are responsible for the breakdown of the dyes
molecules to the non toxic end products (Brown & Laboureur, 1983a; Husain, 2006;
Pazarlioglu et al., 2005). On the other hand, the anaerobic treatments of dyes
wastewaters are conducted in the absence of oxygen. These studies were found effective
in the degradation of persistent azo dyes during the aerobic treatments (Brown &
Laboureur, 1983b; Delee et al., 1998; Rai et al., 2005; van der Zee et al., 2001).
However, more effective remediation of wastewater can be achieved by applying both
the aerobic and anaerobic processes simultaneously (Stolz, 2001). The synergistic
effects of adsorption and biodegradation using microorganism results in increased
mineralization of the organic pollutants (e.g. aromatic amines etc.) besides the bond
cleavage of the azo dyes residues, which are usually considered not easy to degrade
under ordinary treatment technologies (Aksu, 2005).
Although, biological treatments of water remediation are suitable as they are
environmentally friendly and inexpensive, these treatment methods have some
limitations if applied in large scale such as longer time duration and poor biodegradation
of recalcitrant organic molecules etc (Crini, 2006). These treatments require longer
duration for the complete removal and/or mineralization of the dyes (Bhattacharyya &

24
Sarma, 2003; Robinson et al., 2001). The biodegradation of organics in aquatic system
normally requires 28 days (Slokar & Le Marechal, 1998). However, in some cases, the
persistent organic molecules may not biodegrade in this limited time. There are various
dyes that are either recalcitrant or cannot be transformed to the non toxic by-products
under the aerobic conditions. The poor degradation of such pollutants in water may be
due to the recalcitrant nature or complex molecular structure of dyes or unfavorable
environmental conditions (Claus et al., 2002; Mukherjee et al., 2014). For such
pollutants, oxygen catalyzed enzymes are used to degrade them (Stolz, 2001; Yoo et al.,
2001). Also, a significant quantity of nutrients is required for the microorganism
bioaccumulation. Moreover, the operations of such treatments are temperature
dependent i.e. the process can only be operated at certain temperature favorable for the
microorganism growth and cannot be carried out at all temperatures. The insufficient
BOD removal, refractory organics and other nutrients are also the non-beneficial aspects
of these processes (Demirbas, 2009). Lastly, the operational design of the whole system
for the application at large scale is difficult to be established requiring a large area for
plant installation (Bhattacharyya & Sarma, 2003). Hence, these treatments can only be
applied under certain experimental conditions.
2.4.2 Chemical Remediation
The chemical treatments of dyes involve the use of some chemical agents and are
comprised of different processes namely the oxidation (or advanced oxidation processes,
AOPs) (Bandala et al., 2008), coagulation (Hao et al., 2000), photocatalysis (Ghorai et
al., 2007), electrochemical (Faouzi et al., 2007), ultrasonic waves (Yaqub & Ajab, 2012)
and flocculation (Yue et al., 2008) etc. In oxidation process, the oxidizing agents such as