Embed Size (px)
Citation preview
PNNL-17758 WTP-RPT-180 Rev 0
Prepared for the U.S. Department of Energy Under Contract DE-AC05-76RL01830
Preparation and Characterization of Chemical Plugs Based on Selected Hanford Waste Simulants SV Mattigod KM Gunderson DM Wellman SR Baum KE Parker JE Crum EA Cordova AP Poloski September 2008

PNNL-17758 WTP-RPT-180 Rev 0
Preparation and Characterization of Chemical Plugs Based on Selected Hanford Waste Simulants SV Mattigod KM Gunderson DM Wellman SR Baum KE Parker JE Crum EA Cardova AP Poloski September 2008 Test Specification: 24590-WTP-TSP-RT-07-005, Rev. 0 Test Plan: TP-RPP-WTP-495, Rev. 0 24590-QL-HC9-WA49-00001-02-00001, Rev 0 Test Exception(s): 24590-WTP-TEF-RT-08-00005, Rev 0 Prepared for the U.S. Department of Energy under Contract DE-AC05-76RL01830 Pacific Northwest National Laboratory Richland, Washington 99352

iii
Testing Summary
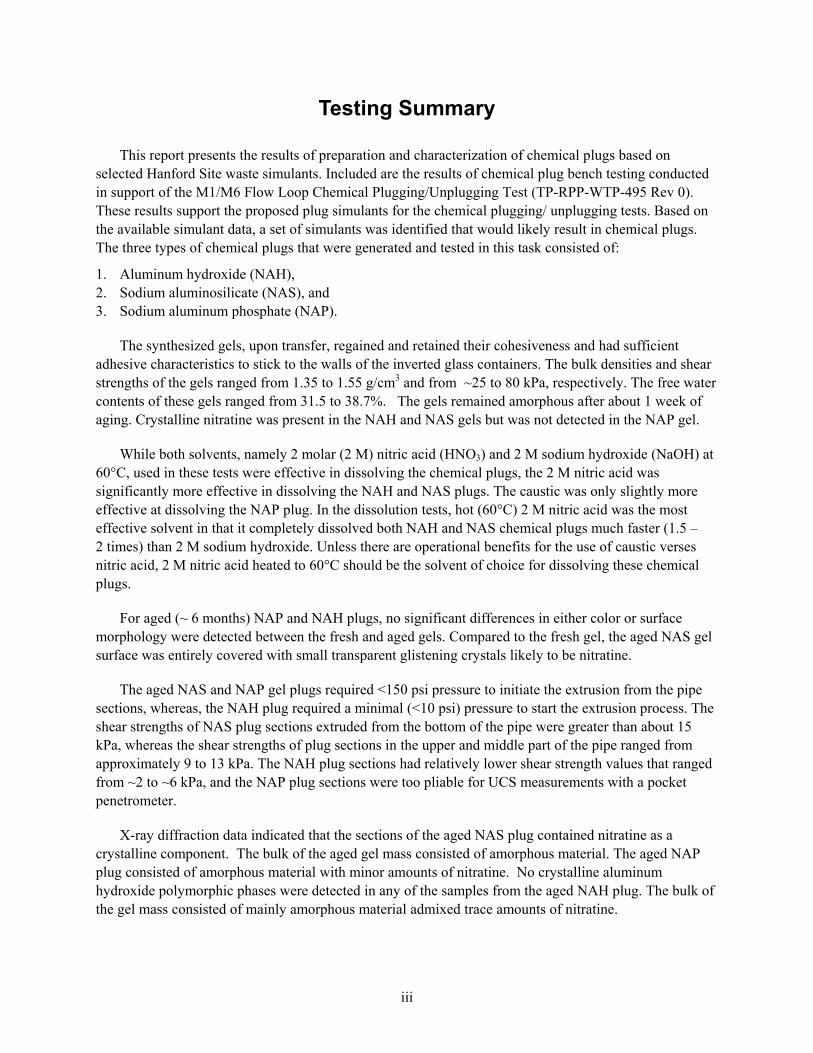
This report presents the results of preparation and characterization of chemical plugs based on selected Hanford Site waste simulants. Included are the results of chemical plug bench testing conducted in support of the M1/M6 Flow Loop Chemical Plugging/Unplugging Test (TP-RPP-WTP-495 Rev 0). These results support the proposed plug simulants for the chemical plugging/ unplugging tests. Based on the available simulant data, a set of simulants was identified that would likely result in chemical plugs. The three types of chemical plugs that were generated and tested in this task consisted of:
1. Aluminum hydroxide (NAH), 2. Sodium aluminosilicate (NAS), and 3. Sodium aluminum phosphate (NAP).
The synthesized gels, upon transfer, regained and retained their cohesiveness and had sufficient adhesive characteristics to stick to the walls of the inverted glass containers. The bulk densities and shear strengths of the gels ranged from 1.35 to 1.55 g/cm3 and from ~25 to 80 kPa, respectively. The free water contents of these gels ranged from 31.5 to 38.7%. The gels remained amorphous after about 1 week of aging. Crystalline nitratine was present in the NAH and NAS gels but was not detected in the NAP gel.
While both solvents, namely 2 molar (2 M) nitric acid (HNO3) and 2 M sodium hydroxide (NaOH) at 60°C, used in these tests were effective in dissolving the chemical plugs, the 2 M nitric acid was significantly more effective in dissolving the NAH and NAS plugs. The caustic was only slightly more effective at dissolving the NAP plug. In the dissolution tests, hot (60°C) 2 M nitric acid was the most effective solvent in that it completely dissolved both NAH and NAS chemical plugs much faster (1.5 – 2 times) than 2 M sodium hydroxide. Unless there are operational benefits for the use of caustic verses nitric acid, 2 M nitric acid heated to 60°C should be the solvent of choice for dissolving these chemical plugs.
For aged (~ 6 months) NAP and NAH plugs, no significant differences in either color or surface morphology were detected between the fresh and aged gels. Compared to the fresh gel, the aged NAS gel surface was entirely covered with small transparent glistening crystals likely to be nitratine.
The aged NAS and NAP gel plugs required <150 psi pressure to initiate the extrusion from the pipe sections, whereas, the NAH plug required a minimal (<10 psi) pressure to start the extrusion process. The shear strengths of NAS plug sections extruded from the bottom of the pipe were greater than about 15 kPa, whereas the shear strengths of plug sections in the upper and middle part of the pipe ranged from approximately 9 to 13 kPa. The NAH plug sections had relatively lower shear strength values that ranged from ~2 to ~6 kPa, and the NAP plug sections were too pliable for UCS measurements with a pocket penetrometer.
X-ray diffraction data indicated that the sections of the aged NAS plug contained nitratine as a crystalline component. The bulk of the aged gel mass consisted of amorphous material. The aged NAP plug consisted of amorphous material with minor amounts of nitratine. No crystalline aluminum hydroxide polymorphic phases were detected in any of the samples from the aged NAH plug. The bulk of the gel mass consisted of mainly amorphous material admixed trace amounts of nitratine.

iv
S.1 Test Objectives
The test objectives are summarized in Table S.1 with discussion of how the objectives were fulfilled.
Table S.1. Test Objectives and Results
Test Objective Objective
Met? (Y/N) Results
1. Prepare and physically and chemically characterize three chemical plug materials as per discussions and concurrence with WTP R&T personnel and RPT-RPP-WTP-495, Rev 0 and fill pipe sections with gel
Y
The following characterizations were conducted on the chemical plug material. • Qualitative determination of Shear strength • Chemical analysis • XRD analysis • Static dissolution • Chemical plugs prepared in pipe sections
2. Characterize the aged gels in pipe sections as per rescoping in Test Exception 24590-WTP-TEF-RT-08-00005, Rev 0
Y
The characterization of the chemical plugs in pipe section consisted of: • Visual observations of gel surface • Qualitative measure of force needed to
extrude chemical plugs from pipe sections. • Qualitative determination of Shear strength
of extruded gel sections. • XRD analysis
S.2 Test Exceptions
Test Exception 24590-WTP-TEF-RT-08-00005, Rev 0 applied to this work.
S.3 Results and Performance Against Success Criteria
The test plan TP-WTP-RPP-495 Rev 0 listed a number of criteria that were relevant to bench-scale chemical plug preparation and dissolution testing. Subsequently, several success criteria were enumerated for the rescoped work in Test Exception 24590-WTP-TEF-RT-08-00005, Rev 0. All these are listed in Table S.2

v
Table S.2. Success Criteria and Results
Success Criteria Results
Benchtop Testing to specify Line Plugging Simulant.
Three required chemical plug types such as, aluminum hydroxide, sodium phosphate, and aluminosilicate were prepared and physical and chemical characterization of these materials were completed and the results were communicated to WTP as an interim report to clear the Administrative Hold Point #2 TP-WTP-RPP-495 Rev 0. The results of these tests are included in an appropriate section of this report
Characterize the chemical plugs that were aged in pipe sections under ambient conditions before disposal
The characterization work was conducted on the aged chemical plugs are listed below.
• Photographing the chemical plugs in the pipes before extrusion to compare the morphology of aged gels with that of fresh gels.
• Setting up an extrusion apparatus and extruding the chemical plugs.
• Documenting the qualitative observations on the efforts to remove the chemical plug materials from the pipe sections.
• Performing X-ray diffraction (XRD) analysis of extruded gel samples to detect any crystallization of gel during storage.
• Disposing of the extruded gel as a waste.
The analytical results are included as a section of this test report.
S.4 Quality Requirements
PNNL’s Quality Assurance Program is based on requirements defined in U.S. Department of Energy (DOE) Order 414.1C, Quality Assurance, and 10 CFR 830, Energy/Nuclear Safety Management, Subpart A–Quality Assurance Requirements (a.k.a. the Quality Rule). PNNL has chosen to implement the requirements of DOE Order 414.1C and 10 CFR 830, Subpart A by integrating them into the Laboratory’s management systems and daily operating processes. The procedures necessary to implement the requirements are documented through PNNL’s Standards-Based Management System.
PNNL implements the RPP-WTP quality requirements by performing work in accordance with the River Protection Project—Waste Treatment Plant Support Program (RPP-WTP) Quality Assurance Plan (RPP-WTP-QA-001, QAP). Work was performed to the quality requirements of NQA-1-1989 Part I, Basic and Supplementary Requirements, NQA-2a-1990, Part 2.7, and DOE/RW-0333P, Rev 13, Quality Assurance Requirements and Descriptions (QARD). These quality requirements are implemented through the River Protection Project—Waste Treatment Plant Support Program (RPP-WTP) Quality Assurance Manual (RPP-WTP-QA-003, QAM).

vi
S.5 Test Conditions
Test conditions were controlled with administrative hold points. Several hold points are indentified in the Test Condition section of Test Specification 24590-WTP-TSP-RT-07-005, Rev. 0 (BNI 2007). These hold points were translated into PNNL Test Plan TP-RPP-WTP-495, Rev. 0. The status of each of the hold points is summarized in Table S.3:
Table S.3. Status of Project Hold Points
Test Plan Hold Point Approved On WTP Project
Document Number TP-RPP-WTP-495, Rev. 0 and Test Exception 24590-WTP-TEF-RT-08-00005
#1 BNI approve Test Plan. #2 BNI approve chemical plug simulants.
a. 6/19/07 b. 11/1/08
a.(Signed Test Plan) b CCN 169291
S.6 Simulant Use
Simulants were used in this testing. As discussed in the Test Conditions section, hold point #1 allowed BNI to review and accept the test simulants before testing. A detailed description of simulant development goals and properties are presented in this report.
S.7 Discrepancies and Follow-on Tests None

vii
Acronyms and Abbreviations
BNI Bechtel National, Inc. CP chemical plug DI de-ionized EMS engineering and mechanical systems ICP-OES inductively coupled plasma optical emission spectrometry kPa kilopascals ORNL Oak Ridge National Laboratory PNNL Pacific Northwest National Laboratory R&T research and technology SRTC Savannah River Technology Center UCS unconfined compressive strength WTP Waste Treatment Plant XRD X-ray diffraction


ix
Acknowledgements
This study benefited significantly from the guidance and feedback provided by Jennifer Meehan of Bechtel National, Inc. Emily Richards and Chase Bouvaird helped with photography and we thank Rosalind Schrempf for editorial assistance and Mike Parker for text formatting.


xi
Contents
Testing Summary .............................................................................................................................. iii Acronyms and Abbreviations ...........................................................................................................vii Acknowledgements............................................................................................................................ix 1.0 Introduction .............................................................................................................................1.1 2.0 Chemical Plug Bench-Scale Testing .......................................................................................2.1
2.1 Materials and Methods ....................................................................................................2.4 2.1.1 Formation of Chemical Plugs...............................................................................2.4 2.1.2 Physical Properties ...............................................................................................2.4 2.1.3 Chemical Characterization of Gel Samples..........................................................2.5 2.1.4 Static Dissolution Test .........................................................................................2.5
2.2 Results .............................................................................................................................2.5 2.2.1 Physical Properties ...............................................................................................2.5 2.2.2 Chemical Composition .........................................................................................2.7
2.3 Conclusions ...................................................................................................................2.13 3.0 Generation of Chemical Plugs in Pipe Sections ......................................................................3.1
3.1 Morphology of Fresh and Aged Chemical Plugs ............................................................3.1 3.2 Chemical Plug Extrusion Test.........................................................................................3.3 3.3 X-Ray Diffraction Analysis ............................................................................................3.6 3.4 Conclusions ...................................................................................................................3.15
4.0 References ...............................................................................................................................4.1

xii
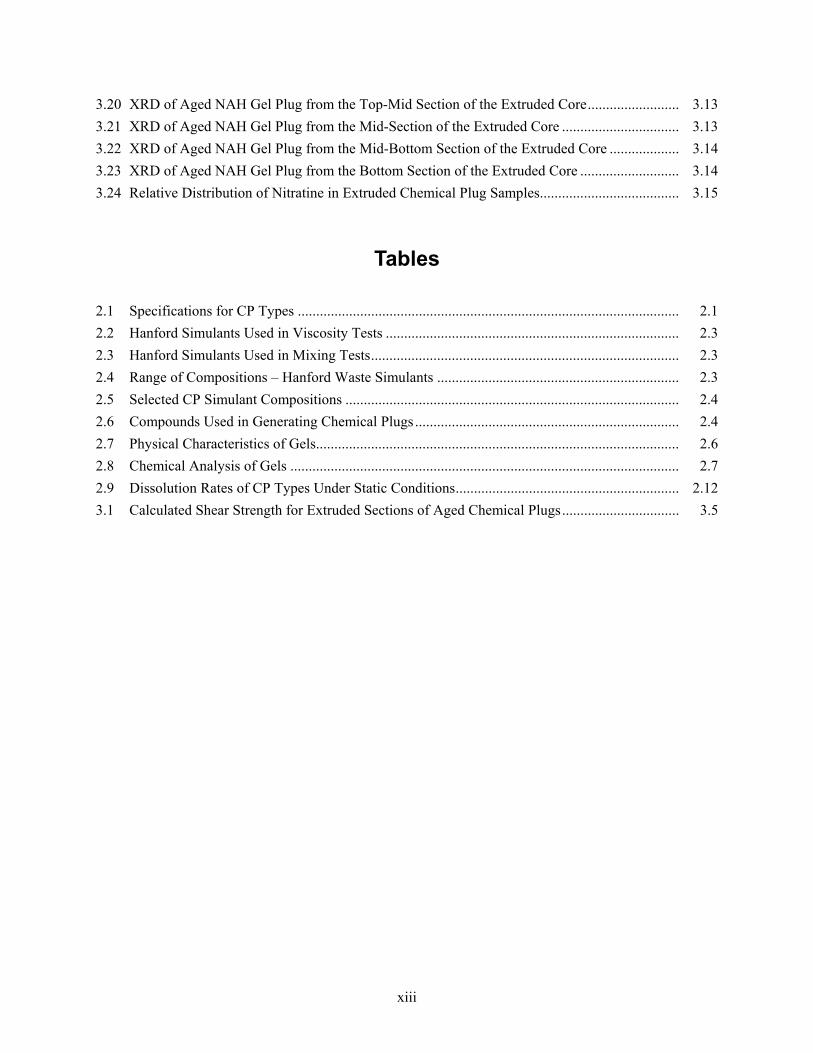
Figures
2.1 Proposed Scheme for Bench-top Tests for CP Types .................................................................. 2.2 2.2 A View of the NAH, NAS, NAP Gels Transferred Into Glass Containers.................................. 2.6 2.3 A View of the Inverted Glass Containers Showing the Cohesive Characteristics of the
NAH, NAS, and NAP. ................................................................................................................. 2.6 2.4 X-Ray Diffractogram of Fresh NAH Gel Material. The Crystalline Component was
Identified as Nitratine .................................................................................................................. 2.8 2.5 X-Ray Diffractogram of Fresh NAS Gel Material. The Crystalline Component was
Identified as Nitratine .................................................................................................................. 2.8 2.6 X-Ray Diffractogram of Fresh NAP Gel Material....................................................................... 2.9 2.7 Comparative X-Ray Diffractogram of Fresh Gel Materials with Characteristic Broad
Diffraction Peaks Centered at ~29°, 2θ ....................................................................................... 2.9 2.8 Cumulative Mass of NAH Dissolution as a Function of Time .................................................... 2.10 2.9 Cumulative Mass of NAS Dissolution as a Function of Time..................................................... 2.11 2.10 Cumulative Mass of NAP Dissolution as a Function of Time..................................................... 2.11 2.11 A View of the Intact NAP Gel Mass Before the Addition of Solvent, the Disaggregated Gel
After the Addition of Solvent, and After Complete Dissolution ................................................. 2.12 3.1 Freshly Prepared NAP Gel and a Typical Pipe Spool ................................................................. 3.1 3.2 The Morphology of the NAH Chemical Plug Freshly Prepared and After Aging for About
6 Months ...................................................................................................................................... 3.2 3.3 The Morphology of the NAS Chemical Plug Freshly Prepared and After Aging for About
6 Months ...................................................................................................................................... 3.2 3.4 The Morphology of the NAP Chemical Plug Freshly Prepared and After Aging for About
6 Months ...................................................................................................................................... 3.3 3.5 Hydraulic Press Set up for Extruding Aged Chemical Plugs....................................................... 3.4 3.6 A View of the Initial Extruded Section of the NAS Chemical Plug............................................ 3.4 3.7 Extruded Sections of Aged NAP Chemical Plug......................................................................... 3.5 3.8 Extruded Sections of Aged NAH Chemical Plug ........................................................................ 3.6 3.9 XRD of Aged NAS Gel Plug from the Top Section of the Extruded Core ................................. 3.7 3.10 XRD of Aged NAS Gel Plug from the Top-Mid Section of the Extruded Core ......................... 3.7 3.11 XRD of Aged NAS Gel Plug from the Mid-Section of the Extruded Core................................. 3.8 3.12 XRD of Aged NAS Gel Plug from the Mid-Bottom Section of the Extruded Core.................... 3.8 3.13 XRD of Aged NAS Gel Plug from the Bottom Section of the Extruded Core. ........................... 3.9 3.14 XRD of Aged NAP Gel Plug from the Top Section of the Extruded Core. ................................ 3.10 3.15 XRD of Aged NAP Gel Plug from the Top-Mid Section of the Extruded Core ......................... 3.10 3.16 XRD of Aged NAP Gel Plug from the Mid-Section of the Extruded Core................................. 3.11 3.17 XRD of Aged NAP Gel Plug from the Mid-Bottom Section of the Extruded Core.................... 3.11 3.18 XRD of Aged NAP Gel Plug from the Bottom Section of the Extruded Core............................ 3.12 3.19 XRD of Aged NAH Gel Plug from the Top-Section of the Extruded Core ................................ 3.12
xiii
3.20 XRD of Aged NAH Gel Plug from the Top-Mid Section of the Extruded Core......................... 3.13 3.21 XRD of Aged NAH Gel Plug from the Mid-Section of the Extruded Core ................................ 3.13 3.22 XRD of Aged NAH Gel Plug from the Mid-Bottom Section of the Extruded Core ................... 3.14 3.23 XRD of Aged NAH Gel Plug from the Bottom Section of the Extruded Core ........................... 3.14 3.24 Relative Distribution of Nitratine in Extruded Chemical Plug Samples...................................... 3.15
Tables
2.1 Specifications for CP Types ........................................................................................................ 2.1 2.2 Hanford Simulants Used in Viscosity Tests ................................................................................ 2.3 2.3 Hanford Simulants Used in Mixing Tests.................................................................................... 2.3 2.4 Range of Compositions – Hanford Waste Simulants .................................................................. 2.3 2.5 Selected CP Simulant Compositions ........................................................................................... 2.4 2.6 Compounds Used in Generating Chemical Plugs ........................................................................ 2.4 2.7 Physical Characteristics of Gels................................................................................................... 2.6 2.8 Chemical Analysis of Gels .......................................................................................................... 2.7 2.9 Dissolution Rates of CP Types Under Static Conditions............................................................. 2.12 3.1 Calculated Shear Strength for Extruded Sections of Aged Chemical Plugs................................ 3.5


1.1
1.0 Introduction
The U.S. Department of Energy (DOE) Office of River Protection’s Waste Treatment and Immobilization Plant (WTP) will process and treat radioactive waste that is stored in tanks at the Hanford Site.
The External Flowsheet Review Team (EFRT)1 identified gelation /precipitation and potential line plugging as one of the issues that should be resolved. The WTP Project is implementing a strategy to address the above EFRT issue identified as “Issue M1/P4—Plugging in Process Piping and gelation/precipitation”. Test objectives specified in test specification 24590-WTP-TSP-RT-07-005, Rev. 0 required the development of three types of chemical plugs mentioned in TP-RPP-WTP-495 Rev 0 (aluminum precipitate/gel-type, phosphate precipitate, and sodium aluminum silicate, NAS) using simulant recipes based on Hanford wastes followed by bench-top and ultimately flow loop test experiments. This demonstration required formation of a chemical plug in a removable section of pipe and evaluation of flush flow rates and pressures during unplugging. The test specification was developed to resolve the EFRT issue identified as ‘Issue M1- Plugging in Process Piping and P4 – Potential gelation/precipitation’.
This report describes the results of work and testing specified by the Test Exception 24590-WTP-TEF-RT-08-00005, Rev 0 as exception to 24590-WTP-TSP-RT-07-005, Rev 0 and 24590-QL-HC9-WA49-00001-02-00001, Rev 0. The work and any associated testing followed the quality assurance requirements of PNNL, outlined in the Test Specification, and Test Plan.
Flow-loop testing was planned to identify a combination of parameters such as pressure, flush solution, composition, and temperature that would effectively dissolve and flush each type of preformed chemical plugs in 3-inch-diameter and 4-feet-long pipe sections. However, based on a review of the results of the bench-top tests and technical discussions, the Waste Treatment Plant (WTP) Research and Technology (R&T), Engineering and Mechanical Systems (EMS), and Operations concluded that flow-loop testing of the chemically plugged pipe sections would not provide any additional information or useful data. The decision was communicated through the Test Exception 24590-WTP-TEF-RT-08-00005, Rev 0 that included a revised scope as follows: • Photographing the chemical plugs in the pipes before extrusion to compare the morphology of aged
gels with that of fresh gels. • Setting up an extrusion apparatus and extruding the chemical plugs. • Documenting the qualitative observations on the efforts to remove the chemical plug materials from
the pipe sections. • Performing X-ray diffraction (XRD) analysis of extruded gel samples to detect any crystallization of
gel during storage. • Disposing of the extruded gel as a waste. • Documenting the analytical results in a test report.
Determination of whether current in-tank waste conditions will bound the future multi-tank blended feed conditions for the Waste Treatment Plant is outside the scope of this study. 1 WTP Project Doc. No. CCN 132846 “Comprehensive Review of the Hanford Waste Treatment Plant Flowsheet and Throughput-Assessment Conducted by an Independent Team of External Experts,” March 2006. Available online at: http://www.hanford.gov/orp/uploadfiles/WTP%20Flowsheet%20Background%20Report_FINAL%20DRAFT_March06.pdf Accessed 09/17/08.

2.1
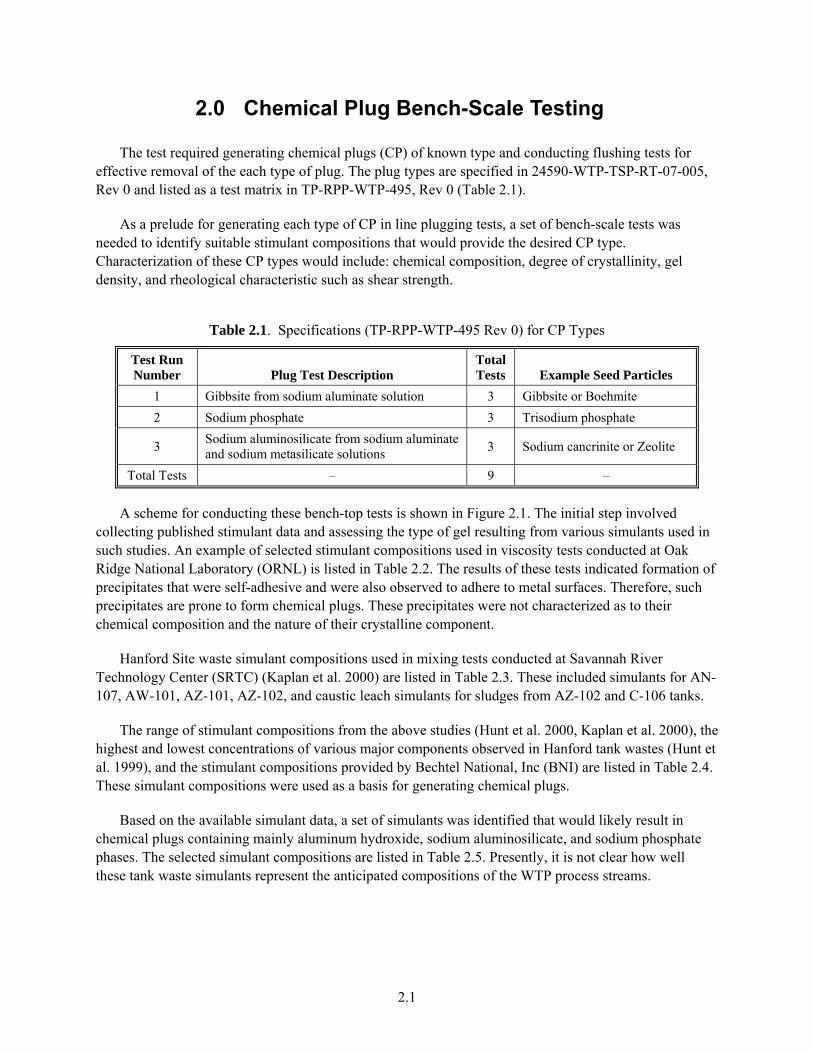
2.0 Chemical Plug Bench-Scale Testing
The test required generating chemical plugs (CP) of known type and conducting flushing tests for effective removal of the each type of plug. The plug types are specified in 24590-WTP-TSP-RT-07-005, Rev 0 and listed as a test matrix in TP-RPP-WTP-495, Rev 0 (Table 2.1).
As a prelude for generating each type of CP in line plugging tests, a set of bench-scale tests was needed to identify suitable stimulant compositions that would provide the desired CP type. Characterization of these CP types would include: chemical composition, degree of crystallinity, gel density, and rheological characteristic such as shear strength.
Table 2.1. Specifications (TP-RPP-WTP-495 Rev 0) for CP Types
Test Run Number Plug Test Description
Total Tests Example Seed Particles
1 Gibbsite from sodium aluminate solution 3 Gibbsite or Boehmite 2 Sodium phosphate 3 Trisodium phosphate
3 Sodium aluminosilicate from sodium aluminate and sodium metasilicate solutions 3 Sodium cancrinite or Zeolite
Total Tests – 9 –
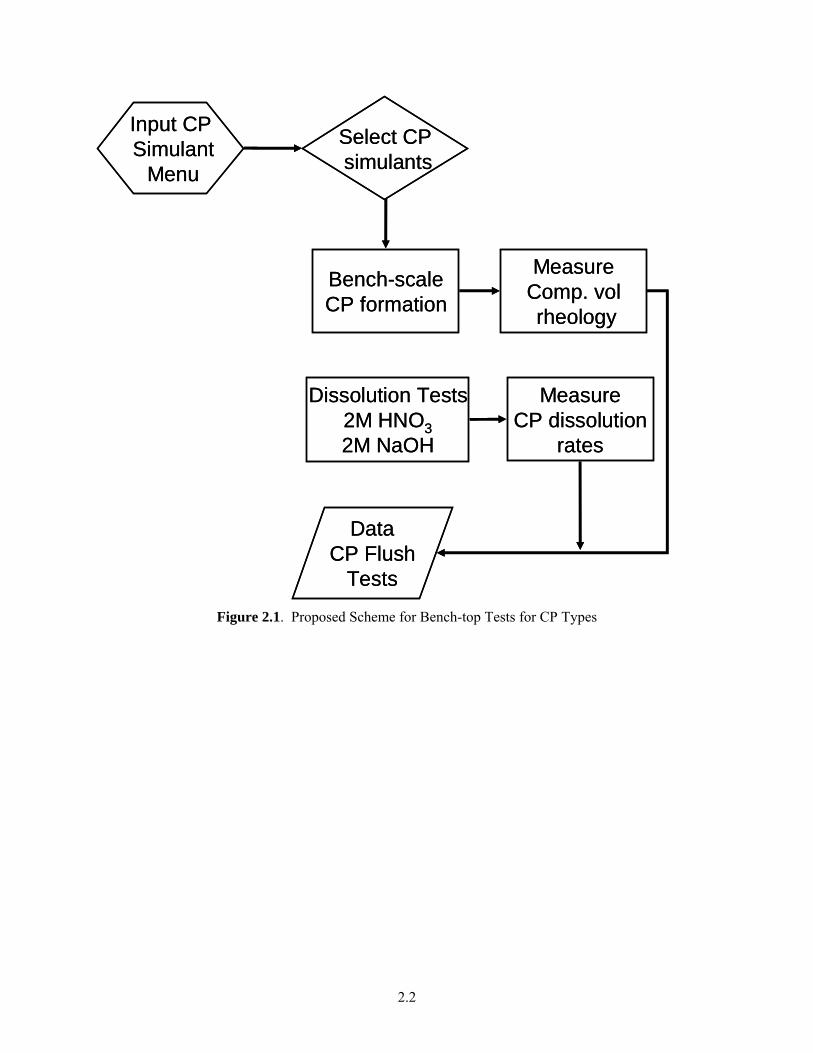
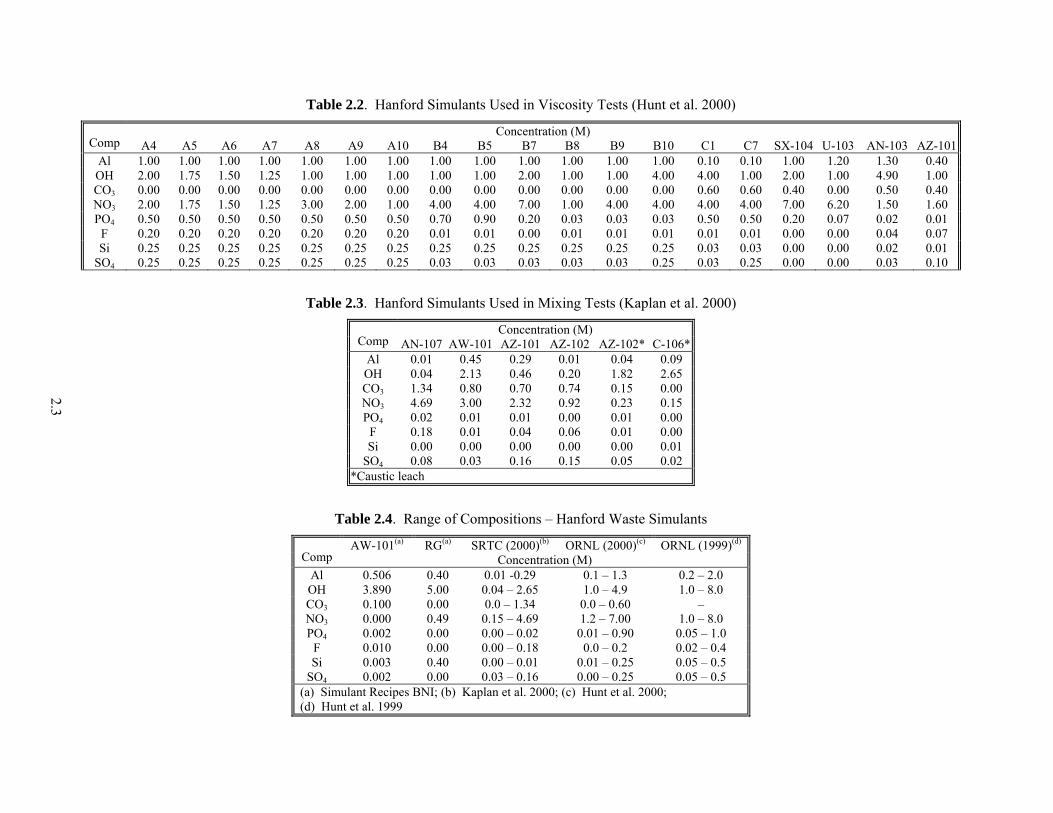
A scheme for conducting these bench-top tests is shown in Figure 2.1. The initial step involved collecting published stimulant data and assessing the type of gel resulting from various simulants used in such studies. An example of selected stimulant compositions used in viscosity tests conducted at Oak Ridge National Laboratory (ORNL) is listed in Table 2.2. The results of these tests indicated formation of precipitates that were self-adhesive and were also observed to adhere to metal surfaces. Therefore, such precipitates are prone to form chemical plugs. These precipitates were not characterized as to their chemical composition and the nature of their crystalline component.
Hanford Site waste simulant compositions used in mixing tests conducted at Savannah River Technology Center (SRTC) (Kaplan et al. 2000) are listed in Table 2.3. These included simulants for AN-107, AW-101, AZ-101, AZ-102, and caustic leach simulants for sludges from AZ-102 and C-106 tanks.
The range of stimulant compositions from the above studies (Hunt et al. 2000, Kaplan et al. 2000), the highest and lowest concentrations of various major components observed in Hanford tank wastes (Hunt et al. 1999), and the stimulant compositions provided by Bechtel National, Inc (BNI) are listed in Table 2.4. These simulant compositions were used as a basis for generating chemical plugs.
Based on the available simulant data, a set of simulants was identified that would likely result in chemical plugs containing mainly aluminum hydroxide, sodium aluminosilicate, and sodium phosphate phases. The selected simulant compositions are listed in Table 2.5. Presently, it is not clear how well these tank waste simulants represent the anticipated compositions of the WTP process streams.
2.2
Bench-scaleCP formation
MeasureComp. volrheology
Dissolution Tests2M HNO32M NaOH
MeasureCP dissolution
rates
Input CPSimulant
Menu
Select CPsimulants
DataCP Flush
Tests
Bench-scaleCP formation
MeasureComp. volrheology
Dissolution Tests2M HNO32M NaOH
MeasureCP dissolution
rates
Input CPSimulant
Menu
Select CPsimulants
DataCP Flush
Tests
Figure 2.1. Proposed Scheme for Bench-top Tests for CP Types
2.3
Table 2.2. Hanford Simulants Used in Viscosity Tests (Hunt et al. 2000)
Concentration (M) Comp A4 A5 A6 A7 A8 A9 A10 B4 B5 B7 B8 B9 B10 C1 C7 SX-104 U-103 AN-103 AZ-101
Al 1.00 1.00 1.00 1.00 1.00 1.00 1.00 1.00 1.00 1.00 1.00 1.00 1.00 0.10 0.10 1.00 1.20 1.30 0.40 OH 2.00 1.75 1.50 1.25 1.00 1.00 1.00 1.00 1.00 2.00 1.00 1.00 4.00 4.00 1.00 2.00 1.00 4.90 1.00 CO3 0.00 0.00 0.00 0.00 0.00 0.00 0.00 0.00 0.00 0.00 0.00 0.00 0.00 0.60 0.60 0.40 0.00 0.50 0.40 NO3 2.00 1.75 1.50 1.25 3.00 2.00 1.00 4.00 4.00 7.00 1.00 4.00 4.00 4.00 4.00 7.00 6.20 1.50 1.60 PO4 0.50 0.50 0.50 0.50 0.50 0.50 0.50 0.70 0.90 0.20 0.03 0.03 0.03 0.50 0.50 0.20 0.07 0.02 0.01
F 0.20 0.20 0.20 0.20 0.20 0.20 0.20 0.01 0.01 0.00 0.01 0.01 0.01 0.01 0.01 0.00 0.00 0.04 0.07 Si 0.25 0.25 0.25 0.25 0.25 0.25 0.25 0.25 0.25 0.25 0.25 0.25 0.25 0.03 0.03 0.00 0.00 0.02 0.01
SO4 0.25 0.25 0.25 0.25 0.25 0.25 0.25 0.03 0.03 0.03 0.03 0.03 0.25 0.03 0.25 0.00 0.00 0.03 0.10
Table 2.3. Hanford Simulants Used in Mixing Tests (Kaplan et al. 2000)
Concentration (M) Comp AN-107 AW-101 AZ-101 AZ-102 AZ-102* C-106*
Al 0.01 0.45 0.29 0.01 0.04 0.09 OH 0.04 2.13 0.46 0.20 1.82 2.65 CO3 1.34 0.80 0.70 0.74 0.15 0.00 NO3 4.69 3.00 2.32 0.92 0.23 0.15 PO4 0.02 0.01 0.01 0.00 0.01 0.00
F 0.18 0.01 0.04 0.06 0.01 0.00 Si 0.00 0.00 0.00 0.00 0.00 0.01
SO4 0.08 0.03 0.16 0.15 0.05 0.02 *Caustic leach
Table 2.4. Range of Compositions – Hanford Waste Simulants
AW-101(a) RG(a) SRTC (2000)(b) ORNL (2000)(c) ORNL (1999)(d)
Comp Concentration (M) Al 0.506 0.40 0.01 -0.29 0.1 – 1.3 0.2 – 2.0 OH 3.890 5.00 0.04 – 2.65 1.0 – 4.9 1.0 – 8.0 CO3 0.100 0.00 0.0 – 1.34 0.0 – 0.60 – NO3 0.000 0.49 0.15 – 4.69 1.2 – 7.00 1.0 – 8.0 PO4 0.002 0.00 0.00 – 0.02 0.01 – 0.90 0.05 – 1.0
F 0.010 0.00 0.00 – 0.18 0.0 – 0.2 0.02 – 0.4 Si 0.003 0.40 0.00 – 0.01 0.01 – 0.25 0.05 – 0.5
SO4 0.002 0.00 0.03 – 0.16 0.00 – 0.25 0.05 – 0.5 (a) Simulant Recipes BNI; (b) Kaplan et al. 2000; (c) Hunt et al. 2000; (d) Hunt et al. 1999

2.4
Table 2.5. Selected CP Simulant Compositions
NAH (sodium aluminum hydroxide)
NAS (sodium alumino silicate)
NAP (sodium aluminum phosphate)
Comp Conc (M) Mol. Ratio* Conc (M) Mol. Ratio* Conc (M) Mol. Ratio* Al 2.000 1.000 2.000 1.000 2.000 1.000 OH 6.000 3.000 4.000 2.000 3.000 1.500 CO3 0.200 0.100 0.000 0.000 0.150 0.075 NO3 6.000 3.000 6.000 3.000 6.000 3.000 PO4 0.002 0.001 0.002 0.001 2.000 1.000
F 0.010 0.005 0.010 0.005 0.000 0.000 Si 0.003 0.002 0.500 0.250 0.000 0.000
SO4 0.002 0.001 0.250 0.125 0.000 0.000 *Normalized to Al concentration.
2.1 Materials and Methods
2.1.1 Formation of Chemical Plugs
The chemical plugs were formed by mixing the appropriate compounds to achieve the required molar ratio of components for each type of gel. The source of compound for each component is listed in Table 2.6. All the compounds used were sodium salts with the exception of aluminum nitrate hydrate, which was used as the source of aluminum and nitrate.
Table 2.6. Compounds Used in Generating Chemical Plugs
Component Compound Al Al(NO3)3 9H2O OH NaOH CO3 NaHCO3 NO3 Al(NO3)3 9H2O PO4 NaH2PO4 2H2O
F NaF Si Na2SiO3 SO4 Na2SO4
The gels were formed by mixing the components in the sequence Si, SO4, F, PO4, OH, and Al. The mixing was conducted in an ice bath to minimize the heat of dissolution and neutralization. The gels were aged overnight before characterization was conducted.
2.1.2 Physical Properties
Bulk density measurements were conducted using cells with volumes calibrated with deionized distilled water. The tared cells were filled with gel and weighed, and the bulk density was calculated as
ρg = (Wg/Ww)ρw (2.1) where ρg = bulk density of gel Wg = wt of gel in the cell Ws = wt of water in the cell

2.5
ρw = density of DI water (0.9970 g/cm3 at 25 ºC.
The shear strength of the gels was calculated from measurements of unconfined compressive strength (UCS) using a pocket penetrometer. The penetrometer readings of UCS were converted to shear strength values in kPa by using the equation (Holtz and Kovacs 1981)
τ = 98.07 x (UCS/2) (2.2)
where τ = shear strength in kPa UCS = unconfined compressive strength in kg/cm2
2.1.3 Chemical Characterization of Gel Samples
The chemical composition of the gels was determined by dissolving a known mass of material in 30 ml of 15.8M nitric acid at 90 ºC and measuring the concentrations of Al, Na, P, Si, and S in the resulting solutions using inductively coupled plasma optical emission spectrometry (ICP-OES). The mass of free water in the gels was determined gravimetrically after oven-drying overnight at 100 ºC.
The samples were analyzed by X-ray diffraction analysis (XRD) to identify any crystalline phases present in the gel. The XRD apparatus used for this purpose is a Philips X'Pert MPD system (Model PW3040/00) with a Cu X-ray source operated at 45 kV, 45 mA (1.8 kW). The scan range was 5°-75°, 2θ and the typical scan rate was ~2°/min. The XRD data were analyzed using the program JADE (V5.0, V6.0, and V6.1, Materials Data Inc., Livermore, CA) and reference data from the Powder Diffraction File Database (PDF-2, International Centre for Diffraction Data, Newtown Square, PA).
2.1.4 Static Dissolution Test
Static dissolution tests were conducted on gel plugs weighing ~1.5 g each in contact with either 330 ml 2 M nitric acid or 2 M sodium hydroxide solution at 60°C. The volume of acid or caustic used provided sufficient molar excess, namely ~19 – 24, 50 – 60, 160 – 180 with respect to free water, sodium, and aluminum in the mass of gel, respectively. The purpose of using the molar excess of acid or alkali was to ensure that the gel dissolution was not limited by the available mass of reactants. The solutions were sampled at regular intervals, and the concentrations of aluminum were measured to monitor the rate of gel dissolution. Care was taken not to agitate the system so that the dissolution was controlled mainly by the diffusion of gel constituents. The point of complete gel dissolution was gauged by the complete disappearance of the remnants of the gel and the solution was clear without any traces of turbidity.
2.2 Results
2.2.1 Physical Properties
The gels resulting from the simulant composition used in these tests were opaque white and had sufficient cohesive strength to be self-supportive (Figures 2.2 and 2.3). Portions of the gels were stirred and transferred into glass tubes to better observe the redevelopment of cohesive characteristics. The observations indicated that gels following transfer regained and retained their cohesiveness and had sufficient adhesive characteristics to stick to the walls of the inverted glass containers (Figure 2.3)

2.6
Figure 2.2. A View of the NAH, NAS, NAP (left to right) Gels Transferred Into Glass Containers
Figure 2.3. A View of the Inverted Glass Containers Showing the Cohesive Characteristics of the NAH,
NAS, and NAP (left to right).
The bulk density and the shear strength data for the three gels are listed in Table 2.7.
Table 2.7. Physical Characteristics of Gels
CP Type
Bulk Density (g/cm3)
Shear Strength
(kPa) NAH 1.55 ~25 NAS 1.35 ~70 NAP 1.46 ~80

2.7
The results indicated that the bulk densities ranged from 1.35 g/cm3 for the NAS gel to 1.55 g/cm3 for the NAH gel. These values suggest that these gels were relatively dense with higher solids contents. The shear strength values ranged from ~25 – 80 kPa indicating that these gels were relatively compact.
2.2.2 Chemical Composition
The chemical analyses of the gels are listed in Table 2.8. The free water contents were 36.7%, 31.5%, and 38.7% for NAH, NAS, and NAP gels, respectively. Other major components of these gels were Al, Na, and NO3. The nitrate content of the gels could not be measured because the gels were dissolved in nitric acid before analysis using ICP. As expected, the NAP gel also contained phosphate as a major component.
Table 2.8. Chemical Analysis of Gels
CP Type NAH NAS NAP
Comp % wt Al 6.77 7.00 6.30 Na 16.8 18.48 16.30 Si 0.02 0.10 0.00 P 0.01 0.01 7.10 S 0.01 1.06 0.00
H2O 36.7 31.5 38.7
X-Ray Diffraction Analysis
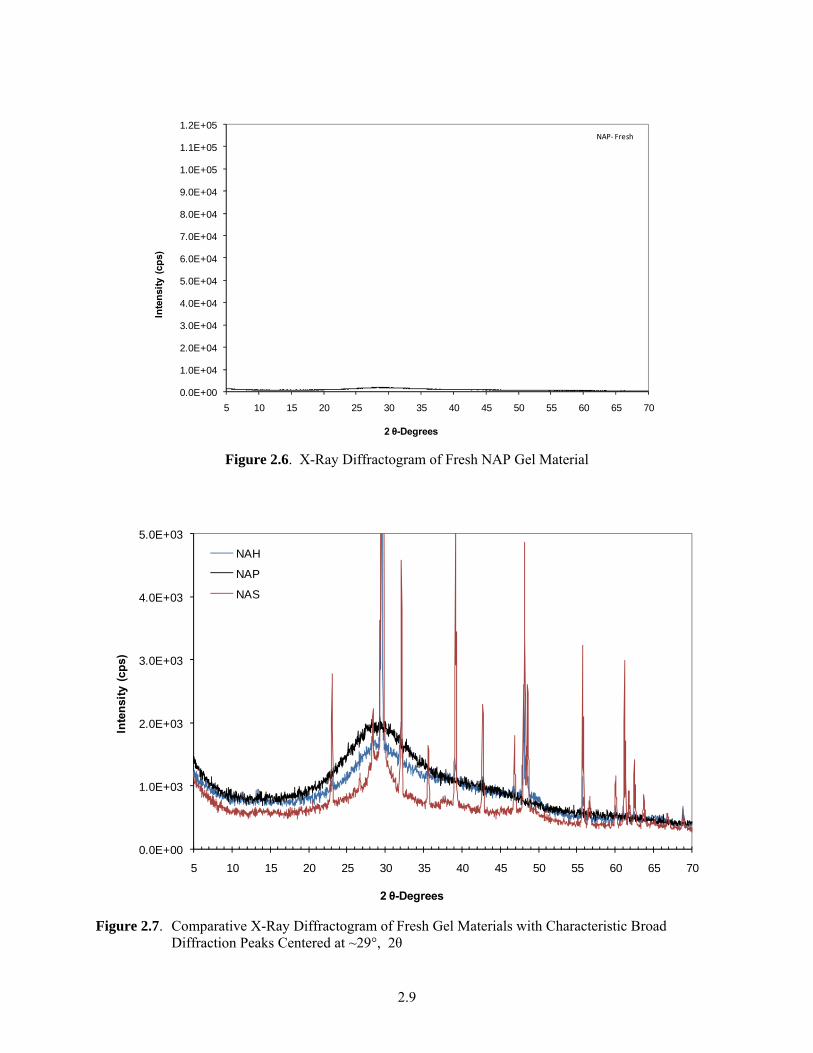
The X-ray diffractograms for fresh gels (sampled after one week ) are shown in Figures 2.4–2.6. The data indicated that in the NAH and NAS gels, there was a single crystalline component identified as nitratine (sodium nitrate) (Figures 2.4 and 2.5). However, the NAP gel did not contain any crystalline components (Figure 2.6). A detailed comparison of the diffractograms of the three gels exhibited broad peaks centered at ~29° 2θ that underlay nitratine peaks (Figure 2.7), which is indicative of the amorphous nature of these materials. As compared to the other two gels, the NAS material exhibited a narrower peak in the same position indicating incipient crystallization of this gel after one week of aging.

2.8
0.0E+00
1.0E+04
2.0E+04
3.0E+04
4.0E+04
5.0E+04
6.0E+04
7.0E+04
8.0E+04
9.0E+04
1.0E+05
1.1E+05
1.2E+05
5 10 15 20 25 30 35 40 45 50 55 60 65 70
Inte
nsity
(cps
)
2θ Degrees
NAH‐ Fresh
Figure 2.4. X-Ray Diffractogram of Fresh NAH Gel Material. The Crystalline Component was
Identified as Nitratine
0.0E+00
1.0E+04
2.0E+04
3.0E+04
4.0E+04
5.0E+04
6.0E+04
7.0E+04
8.0E+04
9.0E+04
1.0E+05
1.1E+05
1.2E+05
5 10 15 20 25 30 35 40 45 50 55 60 65 70
Inte
nsity
(cps
)
2θ Degrees
NAS ‐ Fresh
Figure 2.5. X-Ray Diffractogram of Fresh NAS Gel Material. The Crystalline Component was Identified
as Nitratine
2.9
0.0E+00
1.0E+04
2.0E+04
3.0E+04
4.0E+04
5.0E+04
6.0E+04
7.0E+04
8.0E+04
9.0E+04
1.0E+05
1.1E+05
1.2E+05
5 10 15 20 25 30 35 40 45 50 55 60 65 70
Inte
nsity
(cps
)
2 θ-Degrees
NAP‐ Fresh
Figure 2.6. X-Ray Diffractogram of Fresh NAP Gel Material
0.0E+00
1.0E+03
2.0E+03
3.0E+03
4.0E+03
5.0E+03
5 10 15 20 25 30 35 40 45 50 55 60 65 70
Inte
nsity
(cp
s)
2 θ-Degrees
NAH
NAP
NAS
Figure 2.7. Comparative X-Ray Diffractogram of Fresh Gel Materials with Characteristic Broad
Diffraction Peaks Centered at ~29°, 2θ

2.10
Static Dissolution Tests
The data from the static dissolution tests on the three CP types conducted at 60 °C are shown in Figures 2.8, 2.9, and 2.10. The dissolution of the NAH gel in both nitric acid and sodium hydroxide solutions appears to occur in two phases. The rate of dissolution initially was very slow but later was very rapid in both solutions. The rates of dissolution in acid during both the slow and fast phases were much more rapid than comparable rates in the sodium hydroxide solution. The differences in dissolution rates in the slow and the fast phases were about 12 x in acid and 35 x in alkaline solutions, respectively. Complete dissolution of the NAH gel in nitric acid occurred in 5 minutes, whereas it took twice as long (10 minutes) to totally dissolve in sodium hydroxide.
Visual observations during the static dissolution tests indicated that with the addition of the solvent, the gel plugs appeared to disaggregate and the solutions became turbid (Figure 2.9, Table 2.9). When the dissolution was complete, the solution turned clear. Therefore, the initial slow dissolution rate may reflect the disaggregation phase of the gel. Disaggregation results in increased surface area of contact with the solutions and therefore would promote an increased rate of dissolution.
Compared to the NAH gel, the NAS gel appeared to have a uniform rate of dissolution in both the acid and alkaline solutions. The data indicated that about a third of the mass of gel may have dissolved upon initial contact with the solvents (Figure 2.10). The rate of dissolution in the acid medium was faster (~ 1.5 x) than in the alkaline medium. Complete dissolution occurred in ~ 8.5 and 13 minutes in acid and alkaline solutions, respectively.
y = 0.0432x + 0.3207R2 = 0.9817
y = 0.517x - 1.0219R2 = 0.9991
y = 0.0255xR2 = 0.9225
y = 0.9486x - 8.0663R2 = 1
0.00
0.20
0.40
0.60
0.80
1.00
1.20
1.40
1.60
1.80
0 2 4 6 8 10 12 14
Time (min)
Cum
ulat
ive
NA
H M
ass
(g)
2M HNO3
2M NaOH
Figure 2.8. Cumulative Mass of NAH Dissolution as a Function of Time

2.11
Figure 2.9. Cumulative Mass of NAS Dissolution as a Function of Time
Figure 2.10. Cumulative Mass of NAP Dissolution as a Function of Time
2.12
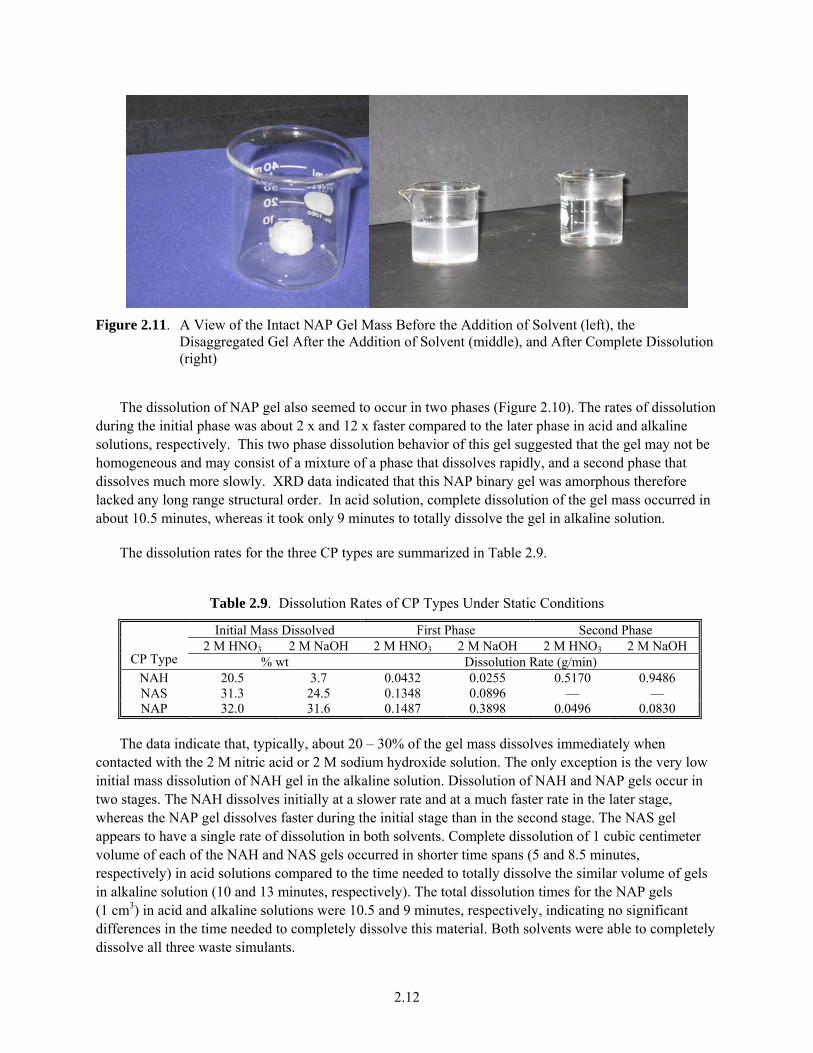
Figure 2.11. A View of the Intact NAP Gel Mass Before the Addition of Solvent (left), the
Disaggregated Gel After the Addition of Solvent (middle), and After Complete Dissolution (right)
The dissolution of NAP gel also seemed to occur in two phases (Figure 2.10). The rates of dissolution during the initial phase was about 2 x and 12 x faster compared to the later phase in acid and alkaline solutions, respectively. This two phase dissolution behavior of this gel suggested that the gel may not be homogeneous and may consist of a mixture of a phase that dissolves rapidly, and a second phase that dissolves much more slowly. XRD data indicated that this NAP binary gel was amorphous therefore lacked any long range structural order. In acid solution, complete dissolution of the gel mass occurred in about 10.5 minutes, whereas it took only 9 minutes to totally dissolve the gel in alkaline solution.
The dissolution rates for the three CP types are summarized in Table 2.9.
Table 2.9. Dissolution Rates of CP Types Under Static Conditions
Initial Mass Dissolved First Phase Second Phase 2 M HNO3 2 M NaOH 2 M HNO3 2 M NaOH 2 M HNO3 2 M NaOH
CP Type % wt Dissolution Rate (g/min) NAH 20.5 3.7 0.0432 0.0255 0.5170 0.9486 NAS 31.3 24.5 0.1348 0.0896 –– –– NAP 32.0 31.6 0.1487 0.3898 0.0496 0.0830
The data indicate that, typically, about 20 – 30% of the gel mass dissolves immediately when contacted with the 2 M nitric acid or 2 M sodium hydroxide solution. The only exception is the very low initial mass dissolution of NAH gel in the alkaline solution. Dissolution of NAH and NAP gels occur in two stages. The NAH dissolves initially at a slower rate and at a much faster rate in the later stage, whereas the NAP gel dissolves faster during the initial stage than in the second stage. The NAS gel appears to have a single rate of dissolution in both solvents. Complete dissolution of 1 cubic centimeter volume of each of the NAH and NAS gels occurred in shorter time spans (5 and 8.5 minutes, respectively) in acid solutions compared to the time needed to totally dissolve the similar volume of gels in alkaline solution (10 and 13 minutes, respectively). The total dissolution times for the NAP gels (1 cm3) in acid and alkaline solutions were 10.5 and 9 minutes, respectively, indicating no significant differences in the time needed to completely dissolve this material. Both solvents were able to completely dissolve all three waste simulants.

2.13
Effective flushing of chemical plugs from a piping system depends on the chemical nature of the plug and its rate of disaggregation, the type, concentration, and temperature of the flushing solvent, and the force imparted to the plug through system pressurization. The bench scale data showed that gels disaggregated readily when contacted with both acid and caustic solvents at 60°C and did dissolve readily in both solutions. However, the combined effect of disaggregation, dissolution, and pressurization on the rate of flushing of chemical plugs from pipe lines could not be assessed from bench-scale results.
2.3 Conclusions • Three types of chemical plugs (NAH, NAS, and NAP) were synthesized using selected stimulant
compositions for Hanford tank wastes.
• The synthesized gels, upon transfer, regained and retained their cohesiveness and had sufficient adhesive characteristics to stick to the walls of the inverted glass containers.
• The bulk densities and shear strengths of the gels ranged from 1.35 to 1.55 g/cm3 and from ~25 to 80 kPa, respectively. The free water contents of these gels ranged from 31.5 to 38.7%.
• The gels remained amorphous after about 1 week of aging. Crystalline nitratine was present in the NAH and NAS gels but was not detected in the NAP gel.
• Static dissolution tests conducted at 60°C showed that total dissolution of the these gels occurred in 4 – 10.5 minutes in 2 M nitric acid solution and in 9 – 13 minutes in 2 M sodium hydroxide solution.
• Data generated from these bench-scale tests on CP types are based on selected Hanford tank waste stimulant compositions. Therefore, these data will be useful only if these stimulant compositions are similar to the expected WTP process stream compositions.


3.1
3.0 Generation of Chemical Plugs in Pipe Sections
Three types of chemical plugs (NAS, NAP, and NAS) that were tested on bench-scale (Table 2.5) were prepared in pipe sections (3 inches in diameter and 4 feet long) and aged in a vertical position for about 6 months. The compounds used in formulating these gels are listed in Table 2.6. A sufficient volume of each gel was prepared in single batches to fill the respective pipe sections completely. Each batch was mixed thoroughly until the gels were appeared homogeneous (Figure 3.1). The pipe section used for chemical gel plugging was approximately 47 5/8 inches long with an internal diameter of approximately 3 inches (Figure 3.2). The bottom ends of the pipe sections were tightly capped, and each gel was poured or scooped into appropriately labeled pipes until full and then capped and stored overnight to allow the gels to solidify. The next day, the top caps were opened, and digital pictures were taken to document the morphology of the fresh gels. After refastening the top caps, all three chemical plugs were stored in a vertical position until needed for further testing.
Figure 3.1. Freshly Prepared NAP Gel (left) and a Typical Pipe Spool (right).
3.1 Morphology of Fresh and Aged Chemical Plugs
The pipe sections with chemical plugs were stored at ambient temperature to age for approximately 6 months. To document the morphologies of the aged gel, the top cap of each pipe section was removed, and digital photographs were taken and compared with photographs of the same gel surfaces when fresh.

3.2
Figure 3.2. The Morphology of the NAH Chemical Plug Freshly Prepared (left) and After Aging for
About 6 Months (right)
The morphologies of the fresh and aged gel surfaces are shown in Figures 3.2–3.4. No significant differences in either color or surface morphology were detected between any of the fresh and aged gels. However, a closer examination of the aged NAS gel plug revealed the growth of small, transparent glistening crystals covering the entire surface (Figure 3.3, right). A similar growth of crystals was not observed on the surfaces of aged NAH and NAP chemical plugs. Because the simulants used in generating these chemical plugs contained high concentrations of sodium and nitrate, it is likely that the diminutive crystals growing on the surface of the aged NAS gel consisted of nitratine (NaNO3).
Figure 3.3. The Morphology of the NAS Chemical Plug Freshly Prepared (left) and After Aging for
About 6 Months (right)

3.3
Figure 3.4. The Morphology of the NAP Chemical Plug Freshly Prepared (left) and After Aging for
About 6 Months (right)
3.2 Chemical Plug Extrusion Test
The objective of this test was to qualitatively ascertain the effort required to extrude the aged chemical plugs from the pipe sections and to obtain representative samples of the gel for XRD analysis.
The chemical plugs were extruded using a 25-ton capacity manual press (Figure 3.5) equipped with a piston extendable up to ~7 inches. A close-fitting 3-inch-diameter machined steel puck was used at the end of the ram to evenly distribute the applied force to the surface of the chemical plug. A mounting collar was designed so that there was sufficient clearance (~4– 6 inches) at the bottom of the pipe to collect the extruded chemical plug sections. Approximately 2-inch-diameter steel pipe sections ranging in length from 1 to 3.5 feet were used as needed to extend the reach of the piston to completely extrude all three chemical plugs.
Each pipe section containing aged chemical plug was mounted in turn on the press, and after the top and then bottom caps were removed, extrusion began by manually activating the press. Because the SCN 070 required only qualitative observations, the approximate pressure at which the extrusion began was noted from reading the pressure gauge connected to the hydraulic press. As extrusion proceeded, the extruded chemical plug sections were collected and samples were obtained for XRD analysis. A pocket penetrometer was used to determine the approximate unconfined compressive strength (UCS) of the extruded aged chemical plug sections, and these measurements were used to compute the shear strength of the gels.
The first chemical plug to be extruded (NAS) required approximately <150 psi pressure to initiate the process indicating that the plug was very cohesive and had adhered strongly to the pipe surface. The extruded chemical plug sections were firm and held their shape during handling (Figure 3.6). During sampling of the chemical plug sections, it appeared that the densities of sections from the bottom of the pipe were relatively higher compared to the extruded sections from the middle and top part of the pipe spool.
These observations were qualitatively confirmed from the calculated shear strength of the extruded plug sections (Table 3.1). The shear strengths of plug sections extruded from the bottom of the pipe were greater than about 15 kPa, whereas the shear strengths of plug sections in the upper and middle part of the pipe ranged from approximately 9 to 13 kPa.

3.4
Figure 3.5. Hydraulic Press Set up for Extruding Aged Chemical Plugs
Figure 3.6. A View of the Initial Extruded Section of the NAS Chemical Plug

3.5
Table 3.1. Calculated Shear Strength for Extruded Sections of Aged Chemical Plugs
Chemical Plug Type NAS NAP NAH
Relative Plug
Position kPa Top ~12 - - ~9 - - ~10 - - Middle ~11 - ~2 ~9 - ~4 ~13 - - Bottom ~>15 - ~6 ~>15 - ~2
Displacement of the NAP plug required less than 150 psi pressure. About 7 inches of piston travel was observed before the plug began to extrude from the bottom of the pipe indicating that the aged NAP chemical plug was very compressible (~15% on volume basis). Additionally, it was observed that the extruded sections of the plug began slumping, which increased progressively with elapsed time (Figure 3.7). After a few days of storage, the extruded NAP plug sections had completely lost their shape and were too pliable for conducting any UCS measurements using the pocket penetrometer.
Minimal force (too low to register on the gauge) was required to start the extrusion of the NAH plug indicating that the material did not exhibit any significant adhesion for pipe surfaces. The extruded plug sections, although cohesive, were manually disaggregated during sampling for XRD analysis (Figure 3.8). The extruded sections were firm and held their shape well during subsequent storage. Compared to the NAS plug, the NAH plug sections had relatively lower shear strength values that ranged from ~2 to ~6 kPa.
Figure 3.7. Extruded Sections of Aged NAP Chemical Plug
3.6
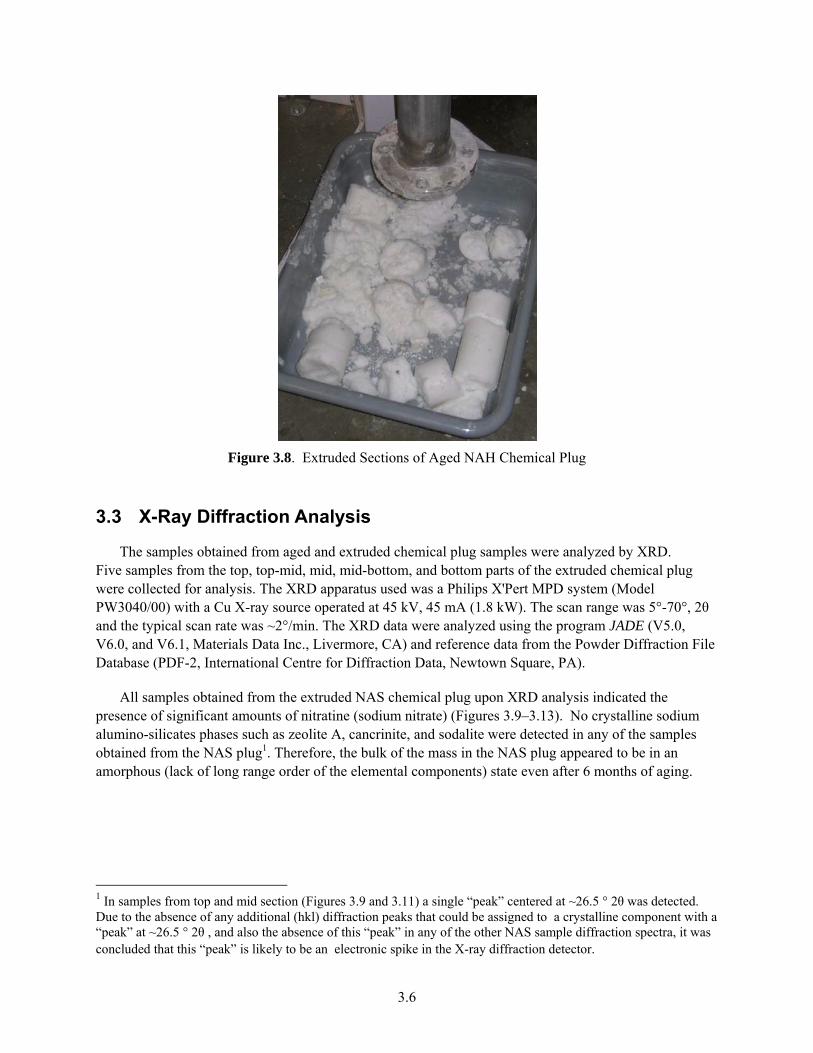
Figure 3.8. Extruded Sections of Aged NAH Chemical Plug
3.3 X-Ray Diffraction Analysis
The samples obtained from aged and extruded chemical plug samples were analyzed by XRD. Five samples from the top, top-mid, mid, mid-bottom, and bottom parts of the extruded chemical plug were collected for analysis. The XRD apparatus used was a Philips X'Pert MPD system (Model PW3040/00) with a Cu X-ray source operated at 45 kV, 45 mA (1.8 kW). The scan range was 5°-70°, 2θ and the typical scan rate was ~2°/min. The XRD data were analyzed using the program JADE (V5.0, V6.0, and V6.1, Materials Data Inc., Livermore, CA) and reference data from the Powder Diffraction File Database (PDF-2, International Centre for Diffraction Data, Newtown Square, PA).
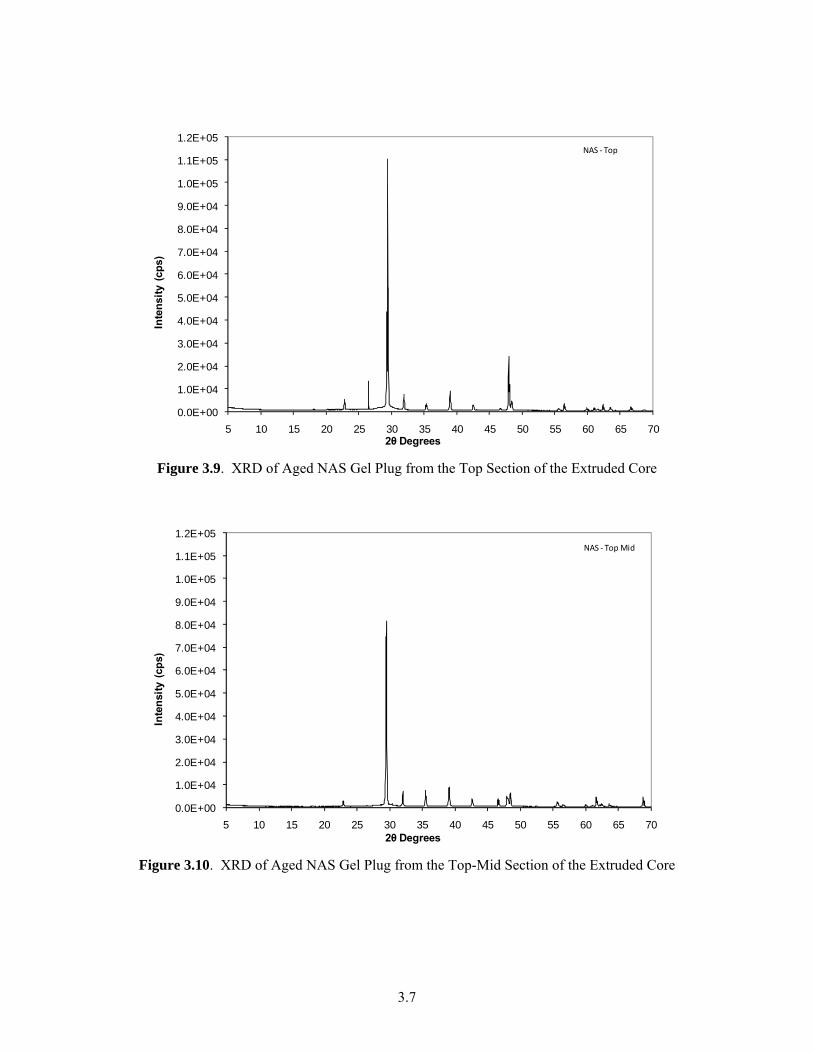
All samples obtained from the extruded NAS chemical plug upon XRD analysis indicated the presence of significant amounts of nitratine (sodium nitrate) (Figures 3.9–3.13). No crystalline sodium alumino-silicates phases such as zeolite A, cancrinite, and sodalite were detected in any of the samples obtained from the NAS plug1. Therefore, the bulk of the mass in the NAS plug appeared to be in an amorphous (lack of long range order of the elemental components) state even after 6 months of aging.
1 In samples from top and mid section (Figures 3.9 and 3.11) a single “peak” centered at ~26.5 ° 2θ was detected. Due to the absence of any additional (hkl) diffraction peaks that could be assigned to a crystalline component with a “peak” at ~26.5 ° 2θ , and also the absence of this “peak” in any of the other NAS sample diffraction spectra, it was concluded that this “peak” is likely to be an electronic spike in the X-ray diffraction detector.
3.7
0.0E+00
1.0E+04
2.0E+04
3.0E+04
4.0E+04
5.0E+04
6.0E+04
7.0E+04
8.0E+04
9.0E+04
1.0E+05
1.1E+05
1.2E+05
5 10 15 20 25 30 35 40 45 50 55 60 65 70
Inte
nsity
(cps
)
2θ Degrees
NAS ‐ Top
Figure 3.9. XRD of Aged NAS Gel Plug from the Top Section of the Extruded Core
0.0E+00
1.0E+04
2.0E+04
3.0E+04
4.0E+04
5.0E+04
6.0E+04
7.0E+04
8.0E+04
9.0E+04
1.0E+05
1.1E+05
1.2E+05
5 10 15 20 25 30 35 40 45 50 55 60 65 70
Inte
nsity
(cps
)
2θ Degrees
NAS ‐ Top Mid
Figure 3.10. XRD of Aged NAS Gel Plug from the Top-Mid Section of the Extruded Core

3.8
0.0E+00
1.0E+04
2.0E+04
3.0E+04
4.0E+04
5.0E+04
6.0E+04
7.0E+04
8.0E+04
9.0E+04
1.0E+05
1.1E+05
1.2E+05
5 10 15 20 25 30 35 40 45 50 55 60 65 70
Inte
nsity
(cps
)
2θ Degrees
NAS ‐Mid
Figure 3.11. XRD of Aged NAS Gel Plug from the Mid-Section of the Extruded Core
0.0E+00
1.0E+04
2.0E+04
3.0E+04
4.0E+04
5.0E+04
6.0E+04
7.0E+04
8.0E+04
9.0E+04
1.0E+05
1.1E+05
1.2E+05
5 10 15 20 25 30 35 40 45 50 55 60 65 70
Inte
nsity
(cps
)
2θ Degrees
NAS ‐Mid Bottom
Figure 3.12. XRD of Aged NAS Gel Plug from the Mid-Bottom Section of the Extruded Core

3.9
0.0E+00
1.0E+04
2.0E+04
3.0E+04
4.0E+04
5.0E+04
6.0E+04
7.0E+04
8.0E+04
9.0E+04
1.0E+05
1.1E+05
1.2E+05
5 10 15 20 25 30 35 40 45 50 55 60 65 70
Inte
nsity
(cps
)
2θ Degrees
NAS ‐Bottom
Figure 3.13. XRD of Aged NAS Gel Plug from the Bottom Section of the Extruded Core.
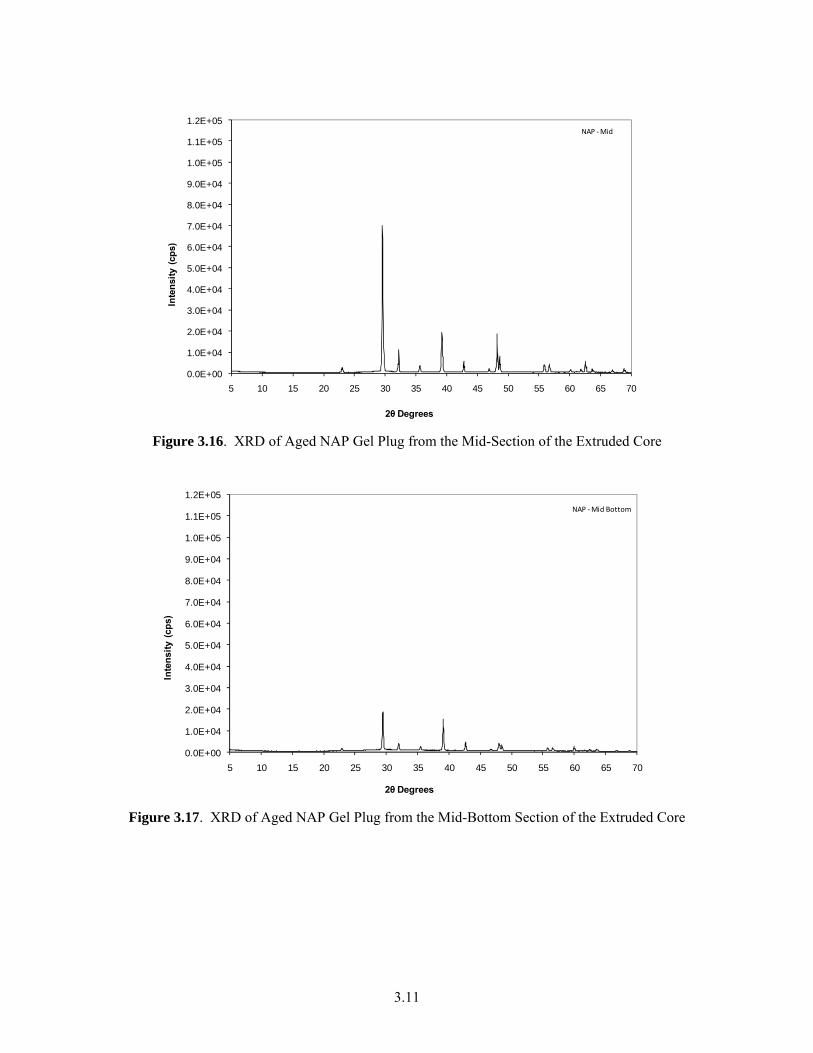
The XRD analysis of the NAP plug sections indicated trace amounts of nitratine in top and top mid sections whereas, the mid and bottom sections contained moderate amounts of crystalline nitratine (Figures 3.14–3.18). No other crystalline phases were present in detectable quantities thus suggesting that the bulk of the gel mass was still in an amorphous state.
The results of the XRD analysis of the NAH plug samples showed that nitratine was present in trace amounts (Figures 3.19–3.23). No crystalline aluminum hydroxide polymorphic phases were detected in any of the samples indicating that even after aging for approximately 6 months, the bulk of the gel mass had remained mainly in an amorphous state.
The XRD data for extruded sections of each chemical plug indicated variations in the relative amounts of nitratine present in the samples (Figures 3.9 –3.23). To assess qualitatively the relative distribution of nitratine, the intensities of the strongest diffraction peak located at ~29.5 ± 0.1° 2θ that corresponds to the d-spacing of ~3.03 ± 0.01 Ǻ (represented by the first order diffraction from (104) set of crystallographic planes of nitratine) was graphed (Figure 3.24).
The relative intensity data indicated that among the three gels, the NAS gel had the highest nitratine content. Also, the nitratine was unevenly distributed in various sample sections with top and mid sections containing ~40% more crystalline mass than the samples from the other three NAS sections. These XRD data showing relative enrichment of nitratine in the top section of the gel sample (Figure 3.24) is supported by the visual observations that showed extensive growth of nitratine crystals on the top surface of the gel (Figure 3.3).

3.10
0.0E+00
1.0E+04
2.0E+04
3.0E+04
4.0E+04
5.0E+04
6.0E+04
7.0E+04
8.0E+04
9.0E+04
1.0E+05
1.1E+05
1.2E+05
5 10 15 20 25 30 35 40 45 50 55 60 65 70
Inte
nsity
(cps
)
2θ Degrees
NAP ‐Top
Figure 3.14. XRD of Aged NAP Gel Plug from the Top Section of the Extruded Core.
0.0E+00
1.0E+04
2.0E+04
3.0E+04
4.0E+04
5.0E+04
6.0E+04
7.0E+04
8.0E+04
9.0E+04
1.0E+05
1.1E+05
1.2E+05
5 10 15 20 25 30 35 40 45 50 55 60 65 70
Inte
nsity
(cp
s)
2θ Degrees
NAP ‐ TopMid
Figure 3.15. XRD of Aged NAP Gel Plug from the Top-Mid Section of the Extruded Core
3.11
0.0E+00
1.0E+04
2.0E+04
3.0E+04
4.0E+04
5.0E+04
6.0E+04
7.0E+04
8.0E+04
9.0E+04
1.0E+05
1.1E+05
1.2E+05
5 10 15 20 25 30 35 40 45 50 55 60 65 70
Inte
nsity
(cps
)
2θ Degrees
NAP ‐Mid
Figure 3.16. XRD of Aged NAP Gel Plug from the Mid-Section of the Extruded Core
0.0E+00
1.0E+04
2.0E+04
3.0E+04
4.0E+04
5.0E+04
6.0E+04
7.0E+04
8.0E+04
9.0E+04
1.0E+05
1.1E+05
1.2E+05
5 10 15 20 25 30 35 40 45 50 55 60 65 70
Inte
nsity
(cp
s)
2θ Degrees
NAP ‐Mid Bottom
Figure 3.17. XRD of Aged NAP Gel Plug from the Mid-Bottom Section of the Extruded Core

3.12
0.0E+00
1.0E+04
2.0E+04
3.0E+04
4.0E+04
5.0E+04
6.0E+04
7.0E+04
8.0E+04
9.0E+04
1.0E+05
1.1E+05
1.2E+05
5 10 15 20 25 30 35 40 45 50 55 60 65 70
Inte
nsity
(cp
s)
2θ Degrees
NAP ‐ Bottom
Figure 3.18. XRD of Aged NAP Gel Plug from the Bottom Section of the Extruded Core
0.0E+00
1.0E+04
2.0E+04
3.0E+04
4.0E+04
5.0E+04
6.0E+04
7.0E+04
8.0E+04
9.0E+04
1.0E+05
1.1E+05
1.2E+05
5 10 15 20 25 30 35 40 45 50 55 60 65 70
Inte
nsity
(cp
s)
2θ Degrees
NAH ‐ Top
Figure 3.19. XRD of Aged NAH Gel Plug from the Top-Section of the Extruded Core

3.13
0.0E+00
1.0E+04
2.0E+04
3.0E+04
4.0E+04
5.0E+04
6.0E+04
7.0E+04
8.0E+04
9.0E+04
1.0E+05
1.1E+05
1.2E+05
5 10 15 20 25 30 35 40 45 50 55 60 65 70
Inte
nsity
(cps
)
2θ Degrees
NAH ‐ Top Mid
Figure 3.20. XRD of Aged NAH Gel Plug from the Top-Mid Section of the Extruded Core
0.0E+00
1.0E+04
2.0E+04
3.0E+04
4.0E+04
5.0E+04
6.0E+04
7.0E+04
8.0E+04
9.0E+04
1.0E+05
1.1E+05
1.2E+05
5 10 15 20 25 30 35 40 45 50 55 60 65 70
Inte
nsity
(cp
s)
2θ Degrees
NAH‐Mid
Figure 3.21. XRD of Aged NAH Gel Plug from the Mid-Section of the Extruded Core

3.14
0.0E+00
1.0E+04
2.0E+04
3.0E+04
4.0E+04
5.0E+04
6.0E+04
7.0E+04
8.0E+04
9.0E+04
1.0E+05
1.1E+05
1.2E+05
5 10 15 20 25 30 35 40 45 50 55 60 65 70
Inte
nsity
(cp
s)
2θ Degrees
NAH ‐Mid Bottom
Figure 3.22. XRD of Aged NAH Gel Plug from the Mid-Bottom Section of the Extruded Core
0.0E+00
1.0E+04
2.0E+04
3.0E+04
4.0E+04
5.0E+04
6.0E+04
7.0E+04
8.0E+04
9.0E+04
1.0E+05
1.1E+05
1.2E+05
5 10 15 20 25 30 35 40 45 50 55 60 65 70
Inte
nsity
(cp
s)
2θ Degrees
NAH ‐Bottom
Figure 3.23. XRD of Aged NAH Gel Plug from the Bottom Section of the Extruded Core

3.15
NASNAP
NAH
0.0E+00
4.0E+04
8.0E+04
1.2E+05
CP Types
(ntesnsity (CP
S)
CP Sections
4.0E+04
8.0E+04
0.0E+00
1.2E+05
Figure 3.24. Relative Distribution of Nitratine in Extruded Chemical Plug Samples
Comparatively, NAP gel on average contained noticeably less nitratine than the NAS gel (Figure 3.24). Significant differences were also noted in nitratine distribution among samples from different sections of the extruded gel. Top two sections of the gel NAP gel core contained relatively trace amounts of nitratine whereas, the other three sections appeared to be significantly enriched with this crystalline component. As compared to the top two sections, the middle-bottom section contained about 6 times more crystalline material whereas, the middle and bottom sections contained on average, ~20 – 25 times more nitratine than the in the top two sections. The relatively significant enrichment of nitratine in the bottom sections of the NAP core seemed to be the result of excess sodium nitrate rich-electrolyte draining through the relatively porous gel mass, accumulating, and later crystallizing during the 6 month long storage1. The porous nature of the NAP gel mass was apparent during the extrusion process in which the material was compressed ~15% by volume when the gel core began to extrude (See Section 3.2).
The NAH gel core sections contained only trace amounts of nitratine crystals as compared to the other two chemical plugs (Figure 3.24). Among the NAH core sections, the top-mid section had the most accumulation of nitratine with relative amounts gradually tapering off in the three bottom sections. The relative concentration profile of nitratine in the NAH core sections indicated perhaps because of the relative compactness of the gel material (See Section 3.2), the percolation of the sodium nitrate bearing electrolyte may have been comparatively slower in NAH gel core than in more porous NAP material.
3.4 Conclusions • For aged (~ 6 months) NAP and NAH plugs, no significant differences in either color or surface
morphology were detected between the fresh and aged gels. Compared to the fresh gel, the aged NAS gel surface was entirely covered with small transparent glistening crystals likely to be nitratine.
1 The gel filled pipe sections were stored in vertical position under ambient conditions (Figure 3.1)

3.16
• The aged NAS and NAP gel plugs required <150 psi pressure to initiate the extrusion from the pipe sections, whereas, the NAH plug required a minimal pressure to start the extrusion process.
• The shear strengths of NAS plug sections extruded from the bottom of the pipe were greater than about 15 kPa, whereas the shear strengths of plug sections in the upper and middle part of the pipe ranged from approximately 9 to 13 kPa. The NAH plug sections had relatively lower shear strength values that ranged from ~2 to ~6 kPa, and the NAP plug sections were too pliable for UCS measurements with a pocket penetrometer.
• X-ray diffraction data indicated that the sections of the aged NAS plug contained nitratine as the only crystalline component. The bulk of the aged gel mass consisted of amorphous material.
• The bulk of the aged NAP plug consisted of amorphous material with nitratine as the only crystalline component.
• No crystalline aluminum hydroxide polymorphic phases were detected in any of the samples from the aged NAH plug; therefore, the bulk of the gel mass consisted of mainly amorphous material admixed with nitratine as the crystalline component.
• The data generated from the three types of aged chemical plugs are based on selected Hanford tank waste stimulant compositions. Therefore, these data will be useful only if these stimulant compositions are similar to the expected WTP process stream compositions (which are blends from multiple tanks).

4.1
4.0 References
24590-WTP-TSP-RT-07-005, Rev 0. 2007. Evaluation of Waste Slurry Critical Velocity and Line Flush Capabilities in WTP Process Piping. Bechtel National Inc., Richland, Washington.
24590-QL-HC9-WA49-00001-02-00001 Rev A. 2007. M1/M6 Flow Loop Chemical Plugging/Unplugging. Bechtel National Inc., Richland, Washington.
24590-WTP-TEF-RT-08-00005, Rev 0. Test Exception to 24590-WTP-TSP-RT-07-005, Rev 0, Evaluation of Waste Slurry Critical Velocity and Line Flush Capabilities in WTP Process Piping, and 24580-QL-HC(-WA49-00001-02-00001, Rev 00A, M1/M6 Flow Loop Chemical Plugging and Unplugging. Bechtel National Inc., Richland, Washington.
TP-RPP-WTP-495, Rev. 0. M1/M6 Flow Loop Chemical Plugging/Unplugging. Pacific Northwest National Laborator, richland, Washing 99352.
Holtz RD, and WD Kovacs. 1981. An Introduction to Geotechnical Engineering, Table 11-6, pp. 572-573, Prentice-Hall, Inc., Englewood Cliffs, New Jersey.
Hunt RD, EC Beahm, CW Chase, JL Collins, TA Dillow and CF Weber. 1999. Prevention of Solids formation: ORNL/TM-1999/263. Oak Ridge National Laboratory, Oak Ridge, Tennessee.
Hunt RD, TA Dillow, JR Parrott Jr, JC Schryver, CF Weber and TD Welch. 2000. Waste Preparation and Transport Chemistry: Results of the FY 2000 Studies. ORNL/TM-2000/298. Oak Ridge National Laboratory, Oak Ridge, Tennessee.
Kaplan DI, RE Eibling, and DJ McCabe. 2000. Milestone M4900: Simulant Mixing Analytical Results. WSRC-TR-2000-00319. Westinghouse Savannah River Company, Aiken, South Carolina.

PNNL-17758 WTP-RPT-180 Rev 0
Distribution
Distr.1
No. of Copies OFFSITE 1 Bechtel National, Inc.
K. J. Knight Bechtel National, Inc. 5275 Westview Dr. Frederick, MD 21703
No. of Copies ONSITE 21 Pacific Northwest National Laboratory
J. A. Bamberger K7-15 C. A. Burns K3-61 R. C. Daniel P7-22 C. W. Enderlin K7-15 J. A. Fort K7-15 P. A. Gauglitz (5) K9-75 D. E. Kurath K3-52 L. A. Mahoney K7-15 P. A. Meyer K7-15 A. P. Poloski P7-25 S. D. Rassat K6-28 D. R. Rector K7-15 P. A. Scott K7-15 G. L. Smith K6-24 J. M. Tingey P7-25 B. E. Wells (5) K7-15 Project Office (2) K3-52
8 Bechtel National, Inc.
V. Guynes (2) H4-02 P. Kuehlen (5) H4-02 S. L. Thomson H4-02