Embed Size (px)
Citation preview

1
Preliminary results for the year ended 30 June 2010
Stronger second half performance drives full year growth.
Strong second half performance; net sales up 6% driving 2% organic net sales growth for the year
Organic operating profit growth for the year was 2%; cost reduction programmes offset a 14% organic increase in marketing spend in the second half
eps pre-exceptionals 72.0p, up 13%
£2 billion free cash flow; tight working capital management was the biggest driver of the £820 million increase
Recommended 6% increase in final dividend to 23.5 pence per share
Results at a glance
2010
20091 Organic
movement Reported
movement
Volume in millions of equivalent units 143.4 140.8 2% 2% Net sales £ million 9,780 9,311 2% 5% Marketing spend £ million 1,419 1,327 3% 7% Operating profit before exceptional items Operating profit
£ million £ million
2,751 2,574
2,588 2,418
2% 6% 6%
Profit attributable to parent company‟s equity shareholders2 Free cash flow
£ million £ million
1,629 2,024
1,605 1,204
1%
£820m
Basic eps2 eps pre-exceptionals3 Recommended full year dividend
pence pence pence
65.5 72.0 38.1
64.6 63.6 36.1
1% 13%
1
Restated – see Note 1 on page 32 and additional information on page 44
2 For year ended 30 June 2010 reported tax rate 21.3%. For year ended 30 June 2009 reported tax rate 14.4%
3 eps pre-exceptionals excludes exceptional items in discontinued operations
Paul Walsh, Chief Executive of Diageo, said: “As expected this has been a year of challenges and opportunities. Our performance was much stronger in the second half than in the first: our performance in the developing markets drove overall growth while markets in North America and Europe remained weak. However, even though markets and categories have been affected in different ways and to differing degrees, we have been consistent in our focus to deliver growth and build a stronger business for the future. We increased marketing in growing categories, delivering 5% organic net sales growth in scotch and 5% organic net sales growth in beer, and in growing markets with organic marketing spend up 13% in International, and behind our leading brands especially Johnnie Walker, Smirnoff and Captain Morgan. As a result we have outperformed and delivered share gains across most of our biggest markets. We launched innovations to meet the opportunities which changing consumer and customer trends offer. We have invested to strengthen our routes to market especially in Asia and we are building industry leading customer marketing skills in the on and off trade with our key customers. We have delivered very strong cash flow and return on invested capital increased to 14.8%. “The impact of the global economic crisis varied by market and the strength of the recovery appears to be equally variable. However, as we demonstrated this year, the global diversity of our business, together with the strength and range of our brands and the agility we have demonstrated gives us confidence that in fiscal 2011 we will be able to improve on the organic operating profit growth we have delivered this year. We are recommending a 6% increase in the final dividend and expect to at least maintain this rate of dividend growth in fiscal 2011.”

2
Definitions Unless otherwise stated in this announcement: volume is in millions of equivalent units; net sales are sales after deducting excise duties; percentage movements are organic movements; commentary refers to organic movements and share refers to value share. See page 41 for additional information for shareholders and an explanation of non-GAAP measures including the reconciliation of basic eps to eps pre-exceptionals and to underlying eps. Regional performance North America – Overhead savings and improved mix held operating profit flat while marketing increased
Volume down 2%
Net sales down 3%
Marketing spend up 6%
Operating profit flat Although there were some signs of recovery in North America, the economy and consumer confidence remained weak. Volume in North America was down 2% driven mainly by lower volume in US spirits brands where shipments were down 3% and depletion volume was down 1%. The difference in the year on year movement on shipments and depletions reflects the increase in stock levels which was reported in fiscal 2009. In fiscal 2010 shipments and depletions were in line and stock levels were maintained year on year. Diageo estimates that sales in the US spirits industry grew 1% and across NABCA and IRI combined Diageo broadly held share of consumer purchases, growing share 5 basis points. Stronger share gains by Diageo‟s key brands, including Johnnie Walker, Crown Royal and Captain Morgan drove the overall share performance. Reserve brands performed strongly led by Cîroc and Ketel One vodka as innovation and an improvement in the on trade delivered a return to growth in the super premium segment. Diageo‟s beer brands, especially Guinness, outperformed other imported beers and gained 10 basis points of share. The wine category was challenging and while volume grew due to a strong performance from Sterling Vineyards, net sales declined as a result of increased promotional activity and innovation was focused on price points at $10 and below. The wine division was reorganised in the second half to reduce the cost base and improve returns. Weakness in ready to drink continued and constant innovation, such as Smirnoff mixed drinks, is needed to maintain the segment. Marketing spend was significantly up weighted in the second half, up 20% behind proven growth drivers on key brands and innovation. Gross margins increased as a result of production savings and lower raw material costs, which together with overhead savings led to higher operating margins despite the significant increase in marketing spend. Europe – Robust performance as the economic and consumer environment continued to be challenging
Volume up 1%
Net sales down 2%
Marketing spend down 6%
Operating profit down 1% Europe remained a challenging region, impacted by weak consumer confidence and economic uncertainty. Within this difficult context, Diageo delivered a robust performance led by the continued focus on customer relationships and innovation. Strong results were delivered in Great Britain. Volume and net sales were up 9% and 5% respectively and share gains were achieved across spirits in the off trade, following successful implementation of a customer focused strategy. Diageo also delivered a strong performance in Russia with double-digit growth in both volume and net sales. This led to a significant increase in share in scotch as Diageo extended its leadership position. Net sales declined 8% in Ireland but Diageo gained share and the rate of decline in the beverage alcohol market slowed. Trading in southern European markets remained particularly difficult. The on trade continued to decline in Spain and increased excise taxes and reduced consumer spending led to a sharp slowdown in Greece in the fourth quarter. The trend towards at home consumption across many markets led to increased promotional activity in the off trade and some mix
3
dilution. The weaker trade conditions in Southern Europe and Ireland impacted overall marketing spend as campaigns were reduced in line with consumer trends. Marketing spend was allocated to proven campaigns on key brands such as Captain Morgan in Northern Europe and Smirnoff in Great Britain. A small reduction in gross margin but lower marketing spend led to an operating profit decline of 1%. International – Double-digit net sales growth and positive price/mix in all three hubs
Volume up 8%
Net sales up 13%
Marketing spend up 13%
Operating profit up 25%
The growth trajectory of International continued to strengthen as recovery in Global Travel and Middle East added to the overall strength of Diageo‟s International business. In Latin America and the Caribbean the growth of scotch, led by Johnnie Walker, and the rum category, led by Cacique, resulted in 15% net sales growth. In Africa net sales grew 10% driven by the strong performance of lager, in particular Harp in Nigeria and Tusker in Kenya. Increased marketing spend and the strong performance of premium and super premium brands led to net sales growth of 19% in Global Travel and Middle East. Marketing spend in the region grew in line with net sales and was focused behind Diageo‟s major brands in their largest markets: Johnnie Walker in GTME and Latin America, Guinness in Nigeria and Buchanan‟s in Latin America. Improved gross margins contributed to operating profit growth of 25%. Asia Pacific – Asia Pacific returned to growth in the second half
Volume up 2%
Net sales up 1%
Marketing spend up 3%
Operating profit up 6% Asia Pacific returned to net sales growth in the second half, driven mainly by the strong performance of Johnnie Walker but with improved performance across all global priority brands. Double-digit growth in South East Asia and strong growth in Taiwan and Thailand offset destocking in India, further weakness of the premium spirits segment in Japan and a decline in scotch in Korea. In the second half, performance improved in both India and China, whilst Australia weakened. The increase in marketing spend was focused on: the Guinness “250th Celebration”, and Guinness grew share in Indonesia; on Johnnie Walker Grand Prix and “Keep Walking” campaigns which led to share gains in China, Australia, Korea and Thailand; on Smirnoff in South East Asia with share gains in Thailand and the Philippines; and on Windsor in Korea which also grew share. During the year Diageo enhanced the route to market in both Japan, driving improved margin, and in Vietnam, a key growth market. Gross margins improved and a reduction in overheads offset an increase in marketing spend driving operating profit growth of 6%. Category performance
Volume
movement* %
Organic net sales
movement %
Reported net sales
movement %
Spirits 2 1 5 Beer 3 5 5 Wine 8 3 6 Ready to drink (5) (3) 4 Total 2 2 5
* Volume movement is both reported and organic
Spirits: Stronger performance in scotch in the second half, led by strong growth in developing markets and by the recovery in Global Travel and Middle East, resulted in full year net sales growth of 5%. Vodka remained a competitive category and strong net sales growth of the higher priced Ketel One vodka and Cîroc brands only partially offset the net sales decline on Smirnoff. Volume and net sales of Diageo‟s vodka
4
brands declined 1%. Captain Morgan, Zacapa and other Diageo rum brands continued to expand geographically and net sales growth outside North America contributed significantly to overall rum category growth of 3%. Positive category mix from the faster growth of scotch was offset by some negative pricing and higher levels of promotional activity, in particular in the vodka and liqueurs categories. Beer: The strong performance of Diageo‟s beer brands continued in the second half and net sales again grew 5%. The main contributors to this growth were the local lager brands in Africa, in particular Harp in Nigeria and Tusker in East Africa. Guinness net sales were flat. Although the brand grew share in its largest markets of Ireland and Great Britain, net sales in Europe declined 2% as a result of the weak beer market. In Nigeria, consumer weakness led to a 1% net sales decline in Guinness. In contrast, Guinness grew net sales 13% in Asia Pacific. Positive price/mix on beer came from price increases outweighing the negative mix from faster growing, but lower margin, lager brands in Africa. Wine: Nearly 85% of Diageo‟s wine net sales are in North America and Great Britain. The wine category in North America continued to be characterised by consumers trading down and discounting leading to net sales decline of 6%. Diageo Chateau & Estates held share by focusing on the $10 to $15 price range and innovation priced at $10 and below. There was a very strong performance in Great Britain where Diageo increased share and grew wine net sales 20% led by Blossom Hill and innovation launches, particularly in the grocery channel. Ready to drink: In the two largest markets of North America and Australia, competition in the segment intensified and net sales declined 7% and 5% respectively. However, ready to drink grew in International and the developing markets of Asia where these products offer consumers access to international spirits brands. This trend has been evident especially in Brazil, Thailand and Nigeria where net sales of ready to drink grew double-digits. Key brand performance
Volume
movement* %
Organic net sales
movement %
Reported net sales
movement %
Global priority brands - (1) 3 Other brands 4 5 8 Total 2 2 5 Global priority brands** Johnnie Walker 11 7 12 Smirnoff (1) (4) - Baileys (1) (4) - Captain Morgan 3 2 6 Jose Cuervo (13) (14) (12)
JεB (7) (8) (3)
Tanqueray 1 (1) 2 Guinness (3) - -
* Volume movement is both reported and organic ** Spirits brands excluding ready to drink
Johnnie Walker: Strong second half growth led by developing markets was the key driver of the full year performance of the Johnnie Walker brand. Johnnie Walker Black Label was the fastest growing variant with double-digit net sales growth driven by GTME, Latin America and South East Asia. Marketing spend increased globally behind the “Walk with Giants” campaign and visibility of the brand was increased in GTME. Four percentage points of negative price/mix resulted from the slower volume growth of super deluxe variants and an increase in price promotional activity. Smirnoff: In developed markets, which account for over 80% of Smirnoff‟s net sales, the vodka category was intensely competitive. In North America, Smirnoff net sales declined 7% mainly due to lapping the increase in stock levels of the prior year. Effective marketing campaigns continued to build the brand‟s

5
equity and strong consumer offers during key selling periods led to volume share gains in the United States. There was a similar trend in promotional activity in Great Britain where volume grew ahead of net sales. In the brand‟s largest developing markets of Brazil and South Africa, net sales grew solidly reflecting Diageo‟s confidence in the future growth of the vodka category in these key markets. Globally, marketing spend was increased, accelerating in the second half behind flavour launches and activation of the global marketing programme “Be There”. Baileys: After a difficult first half, the brand grew volume and net sales in the second half as markets increased visibility on shelf through the “Baileys Bows” activation and flavours were launched into new markets. An increase in promotional activity, particularly in Europe over the Christmas period, led to 3 percentage points of negative price/mix. Captain Morgan: Very strong growth of Captain Morgan in Europe and International offset 3% net sales decline in North America. In the United States, growth of the rum category slowed during the year but Captain Morgan benefited from a range of successful innovations and grew volume and value share. The brand grew strongly in Canada with net sales up 7%. Marketing spend increased 25% in North America and 36% globally. This spend was weighted to the second half and drove net sales up 7% in that period. Jose Cuervo: The ongoing weakness of the North American on trade and aggressive pricing from competitors led to a sharp decline in Jose Cuervo. The new variant, Especial Silver continued to perform well and is now the fastest growing silver tequila in the US off trade. However, Jose Cuervo‟s super and ultra premium variants, Tradicional and Platino, were significantly impacted as consumers traded down to less expensive 100% agave tequilas.
JεB: The majority of the brand‟s net sales decline stemmed from Iberia as the spirits market in that region
continued to decline, particularly in the on trade. JεB grew share in the on trade in Spain but lost share in the off trade as consumers traded down to less expensive brands in that channel. There was improvement in the second half led by growth in developing markets and a reduction in the rate of decline in Spain. Tanqueray: Double-digit net sales growth in Spain and Great Britain only partially offset 4% net sales decline in North America. Weakness of the higher priced Rangpur and Tanqueray 10 variants led to negative price/mix of 2 percentage points. Guinness: Guinness, comprising a little over half of total beer net sales, posted flat net sales with strong double-digit growth in South East Asia broadly offsetting a 2% decline in Europe and flat net sales in Africa. In Great Britain and Ireland, Guinness once again gained share but net sales declined as a result of the continued decline of beer in those markets. In Africa, where the brand typically sells at a significant price premium to local lagers, performance slowed as some consumers chose to trade down to less expensive lagers. Performance by market, however, was varied. Strong net sales growth in East Africa was offset by declines in Ghana, due to utility shortages and higher taxes, and in Nigeria where some consumers traded down to less expensive lager brands. Marketing spend Marketing spend was up 3% driven by major increases in proven campaigns behind Diageo‟s most important brands and categories in the second half. This resulted in double-digit increases in full year spend behind the vodka and rum categories. Spend on vodka was up 13% mainly behind Smirnoff in North America and International. Marketing spend was also up on Cîroc in the United States and on Ketel One vodka worldwide. Investment behind Captain Morgan grew 36% in the year, up 25% in North America, up over 60% in International and almost doubled in Europe. Marketing spend on scotch represents Diageo‟s biggest category spend and while the percentage increase was in single digits the absolute increase was similar to that in vodka and rum. Over half of the increase in spend on scotch was behind Johnnie Walker in International. Baileys marketing spend reduced in absolute terms and as a percentage of net sales as the brand team reviewed the marketing campaign. Reduction in marketing spend behind Guinness in Europe was driven by media deflation and comparison against the prior year when spend was up behind innovation. This was broadly offset by increased marketing spend in beer in the other regions. Spend was down 2% on ready to drink and up 7% on wine.

6
Customer marketing Diageo continued to invest to enhance the capabilities of its customer marketing function which now consists of about 500 people in over 30 countries covering over 80% of Diageo‟s net sales. This had a tangible impact, creating demand for Diageo‟s brands at the point of purchase, where on average 40% of final purchase decisions are made. Diageo made it easier for shoppers to find, choose and buy products in the spirits category forming partnerships with customers which helped them offer the right range of products, the appropriate amount of shelf space and providing enhanced navigation through signage. Diageo also delivered a large number of cross brand and category focused campaigns such as the “Summer Spirits” campaign in Great Britain, the multi-brand Christmas campaign in Latin America and the “Whiskey Festival” which was executed in multiple markets. Corporate revenue and costs Net sales were £70 million in the year ended 30 June 2010, down £5 million from £75 million in the prior year. Net operating costs before exceptional items, increased by £14 million in the year ended 30 June 2010 to £225 million. Diageo undertakes the majority of its currency transaction hedging centrally and therefore £104 million of positive year on year transaction impact was taken to corporate. In addition there was a negative year on year translation impact of £2 million in corporate. The geographical regions are reported using forecast transaction exchange rates with the difference between forecast and achieved rates being included in corporate. This amounted to an incremental £82 million cost this year. There was a £34 million increase in underlying corporate net costs mainly due to higher systems investment and business development charges together with the legal and accounting costs associated with ongoing regulatory matters. Exchange rate movements and IAS 21 and IAS 39 impact Foreign exchange movements arising from the retranslation of prior year results increased net sales by £267 million, increased operating profit by £170 million, increased profit from associates by £4 million and reduced net finance charges by £2 million. The impact of IAS 21 and 39 was to reduce operating profit by £44 million and reduce net finance charges by £54 million. For the year ending 30 June 2011, at current exchange rates (£1 = $1.56 : £1 = €1.21), foreign exchange movements (excluding the impacts of IAS 21 and 39 and excluding any impact in respect of currency movements of the Venezuelan bolivar fuerte) are estimated to increase operating profit by £80 million and decrease net finance charges by £5 million. The current situation in Venezuela with respect to currency controls and the official exchange rate is uncertain. In the year ended 30 June 2010 the Venezuelan denominated operating profit amounted to VEF485 million which was translated at the official exchange rate, $1 = VEF2.15 in the six months ended 31 December 2009 and $1 = VEF4.3 in the six months ended 30 June 2010. If the translation exchange rate is changed in fiscal 2011 this would most likely give rise to an adverse currency movement.
Taxation For the year ended 30 June 2009 the reported tax rate was 14.4% and the underlying tax rate was 22.1%. For the year ended 30 June 2010 the reported tax rate was 21.3% and the underlying tax rate was 21.6%. For the year ending 30 June 2011 the underlying tax rate is expected to remain at approximately 22%. The ongoing underlying cash tax rate is approximately 20%. Exceptional operating costs Exceptional operating costs before tax of £177 million for the year ended 30 June 2010 (2009 - £170 million) comprised:
£85 million charge in respect of the global restructuring programme (2009 - £166 million)
£93 million charge in respect of the restructuring of Global Supply operations (2009 - £nil)
£12 million charge in respect of the restructuring of the Irish brewing operations (2009 - £4 million)
£48 million net credit in respect of the restructuring of US wines operations (2009 - £nil)
£35 million charge in respect of impairment of the Ursus brand (2009 - £nil)

7
Post employment liabilities The deficit before taxation in respect of post employment plans decreased by £178 million from £1,383 million at 30 June 2009 to £1,205 million at 30 June 2010. The reduction in the deficit included £147 million transferred into the UK Diageo Pension Scheme (the UK Scheme) from escrow being cash paid by the company in prior years under the deficit funding arrangements. Deficit funding contributions to the group‟s UK and Irish pension schemes in the year ended 30 June 2010, other than the transfer to the UK Scheme of amounts paid into escrow in prior years, were £55 million and are expected to be approximately £50 million for the year ending 30 June 2011. Management reports The Annual Report for the year ended 30 June 2010 will be published on 14 September 2010. Diageo will issue the first interim management statement for the year ending 30 June 2011 at the time of the Annual General Meeting on 14 October 2010.

8
BUSINESS REVIEW For the year ended 30 June 2010
OPERATING REVIEW Comparative financial information for the year ended 30 June 2009 has been restated as a result of changes in accounting standards and a change in the group‟s accounting policy for returnables (see Note 1 on page 32 and additional information on page 44). The following table summarises the impact of the restatement on marketing spend and operating profit before exceptional items by region for the year ended 30 June 2009. Marketing spend Operating profit
As previously reported
Restated
As previously reported
Restated
£ million £ million £ million £ million North America 429 431 1,156 1,138 Europe 419 429 856 853 International 256 259 645 649 Asia Pacific Corporate
208 - 1,312
208 - 1,327
164 (208) 2,613
159 (211) 2,588
North America Summary:
Diageo‟s key spirits brands gained share, outperforming most major competitors
Shipments and depletions were in line and therefore comparison against fiscal 2009, when shipments exceeded depletions, contributed to the volume decline against the prior year
Strong performance by reserve brands improved mix in the second half as the super premium segment returned to growth
Diageo‟s brands continued to sell at a price premium
Diageo‟s beer brands outperformed other imported beers and gained share
Innovation in the year added significantly to net sales as Diageo addressed changing consumer trends
Ready to drink declined overall but innovation in the year improved the performance of Smirnoff ready to drink in the United States
Marketing spend increased by 20% in the second half with investment behind innovation launches and key brands
Margins benefited from production and overhead cost savings and lower raw material costs
Key measures: 2010 2009
(restated) Organic
movement Reported
movement £ million £ million % % Volume (millions of equivalent units) 51.8 53.0 (2) (2) Net sales 3,306 3,290 (3) - Marketing spend 472 431 6 10 Operating profit before exceptional items 1,170 1,138 - 3 Operating profit 1,132 1,115 2
9
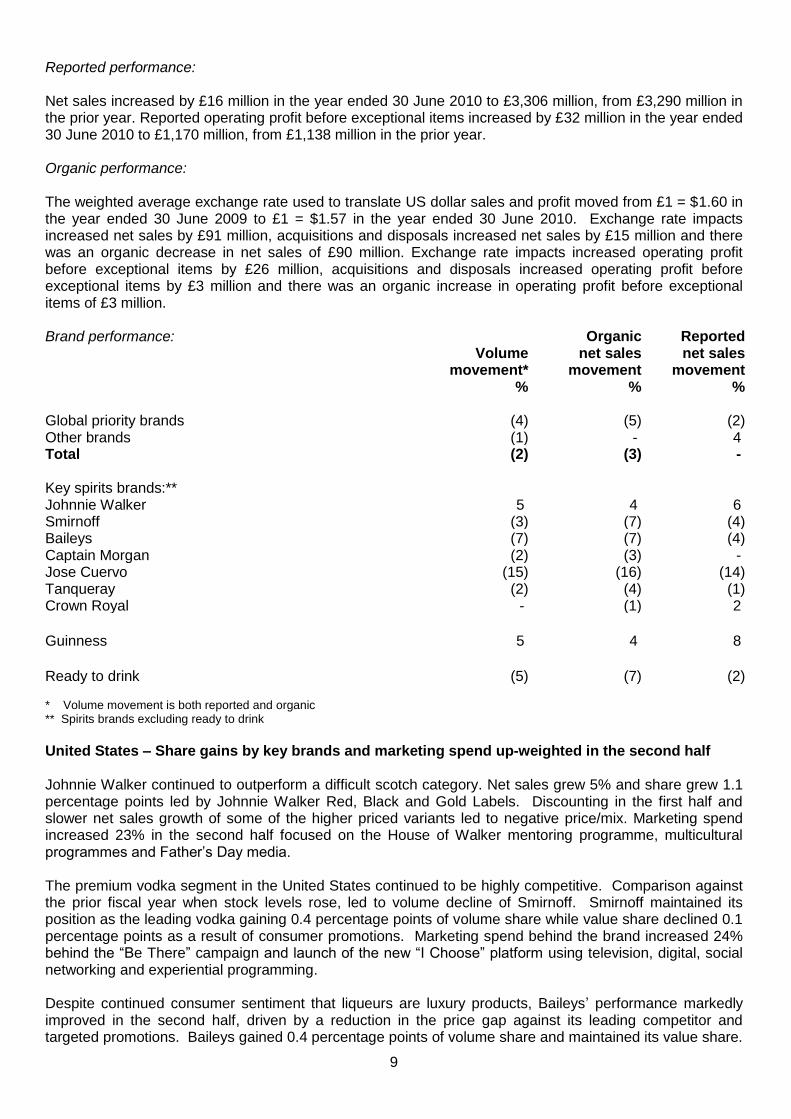
Reported performance: Net sales increased by £16 million in the year ended 30 June 2010 to £3,306 million, from £3,290 million in the prior year. Reported operating profit before exceptional items increased by £32 million in the year ended 30 June 2010 to £1,170 million, from £1,138 million in the prior year. Organic performance: The weighted average exchange rate used to translate US dollar sales and profit moved from £1 = $1.60 in the year ended 30 June 2009 to £1 = $1.57 in the year ended 30 June 2010. Exchange rate impacts increased net sales by £91 million, acquisitions and disposals increased net sales by £15 million and there was an organic decrease in net sales of £90 million. Exchange rate impacts increased operating profit before exceptional items by £26 million, acquisitions and disposals increased operating profit before exceptional items by £3 million and there was an organic increase in operating profit before exceptional items of £3 million. Brand performance:
Volume movement*
Organic net sales
movement
Reported net sales
movement % % %
Global priority brands (4) (5) (2) Other brands (1) - 4 Total (2) (3) - Key spirits brands:** Johnnie Walker 5 4 6 Smirnoff (3) (7) (4) Baileys (7) (7) (4) Captain Morgan (2) (3) - Jose Cuervo (15) (16) (14) Tanqueray (2) (4) (1) Crown Royal - (1) 2 Guinness 5 4 8 Ready to drink (5) (7) (2) * Volume movement is both reported and organic ** Spirits brands excluding ready to drink
United States – Share gains by key brands and marketing spend up-weighted in the second half Johnnie Walker continued to outperform a difficult scotch category. Net sales grew 5% and share grew 1.1 percentage points led by Johnnie Walker Red, Black and Gold Labels. Discounting in the first half and slower net sales growth of some of the higher priced variants led to negative price/mix. Marketing spend increased 23% in the second half focused on the House of Walker mentoring programme, multicultural programmes and Father‟s Day media. The premium vodka segment in the United States continued to be highly competitive. Comparison against the prior fiscal year when stock levels rose, led to volume decline of Smirnoff. Smirnoff maintained its position as the leading vodka gaining 0.4 percentage points of volume share while value share declined 0.1 percentage points as a result of consumer promotions. Marketing spend behind the brand increased 24% behind the “Be There” campaign and launch of the new “I Choose” platform using television, digital, social networking and experiential programming. Despite continued consumer sentiment that liqueurs are luxury products, Baileys‟ performance markedly improved in the second half, driven by a reduction in the price gap against its leading competitor and targeted promotions. Baileys gained 0.4 percentage points of volume share and maintained its value share.
10
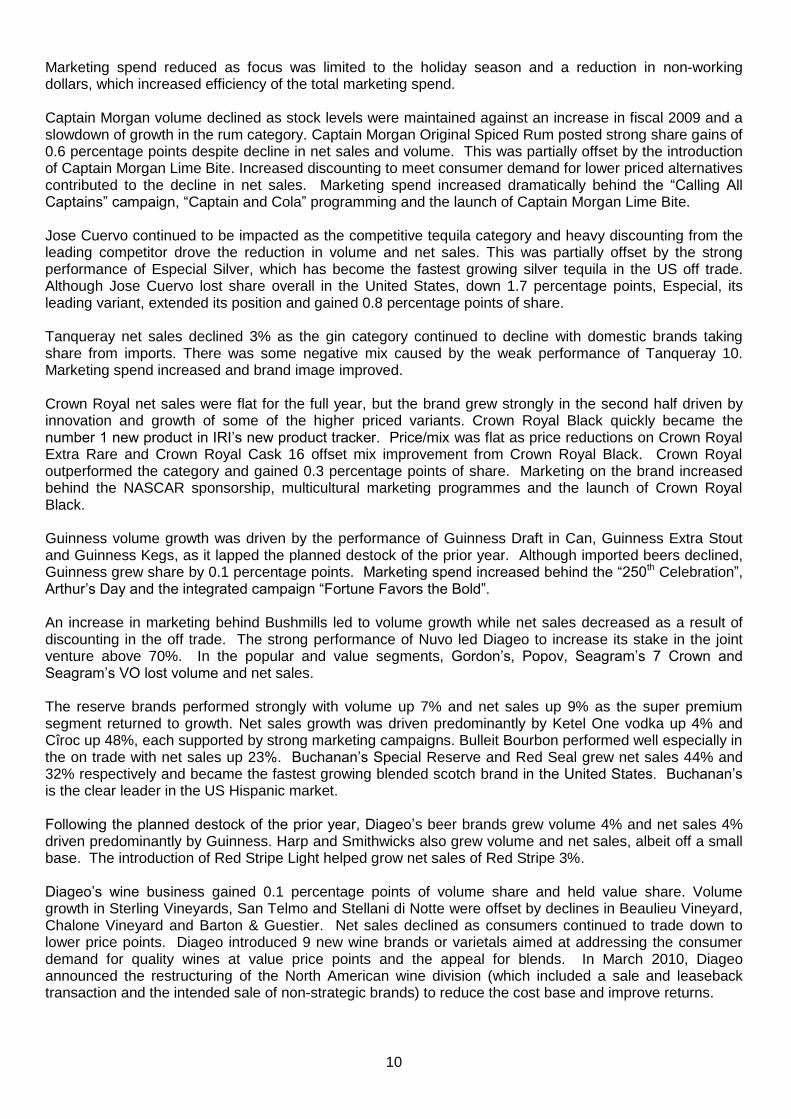
Marketing spend reduced as focus was limited to the holiday season and a reduction in non-working dollars, which increased efficiency of the total marketing spend. Captain Morgan volume declined as stock levels were maintained against an increase in fiscal 2009 and a slowdown of growth in the rum category. Captain Morgan Original Spiced Rum posted strong share gains of 0.6 percentage points despite decline in net sales and volume. This was partially offset by the introduction of Captain Morgan Lime Bite. Increased discounting to meet consumer demand for lower priced alternatives contributed to the decline in net sales. Marketing spend increased dramatically behind the “Calling All Captains” campaign, “Captain and Cola” programming and the launch of Captain Morgan Lime Bite. Jose Cuervo continued to be impacted as the competitive tequila category and heavy discounting from the leading competitor drove the reduction in volume and net sales. This was partially offset by the strong performance of Especial Silver, which has become the fastest growing silver tequila in the US off trade. Although Jose Cuervo lost share overall in the United States, down 1.7 percentage points, Especial, its leading variant, extended its position and gained 0.8 percentage points of share. Tanqueray net sales declined 3% as the gin category continued to decline with domestic brands taking share from imports. There was some negative mix caused by the weak performance of Tanqueray 10. Marketing spend increased and brand image improved. Crown Royal net sales were flat for the full year, but the brand grew strongly in the second half driven by innovation and growth of some of the higher priced variants. Crown Royal Black quickly became the number 1 new product in IRI‟s new product tracker. Price/mix was flat as price reductions on Crown Royal Extra Rare and Crown Royal Cask 16 offset mix improvement from Crown Royal Black. Crown Royal outperformed the category and gained 0.3 percentage points of share. Marketing on the brand increased behind the NASCAR sponsorship, multicultural marketing programmes and the launch of Crown Royal Black. Guinness volume growth was driven by the performance of Guinness Draft in Can, Guinness Extra Stout and Guinness Kegs, as it lapped the planned destock of the prior year. Although imported beers declined, Guinness grew share by 0.1 percentage points. Marketing spend increased behind the “250th Celebration”, Arthur‟s Day and the integrated campaign “Fortune Favors the Bold”. An increase in marketing behind Bushmills led to volume growth while net sales decreased as a result of discounting in the off trade. The strong performance of Nuvo led Diageo to increase its stake in the joint venture above 70%. In the popular and value segments, Gordon‟s, Popov, Seagram‟s 7 Crown and Seagram‟s VO lost volume and net sales. The reserve brands performed strongly with volume up 7% and net sales up 9% as the super premium segment returned to growth. Net sales growth was driven predominantly by Ketel One vodka up 4% and Cîroc up 48%, each supported by strong marketing campaigns. Bulleit Bourbon performed well especially in the on trade with net sales up 23%. Buchanan‟s Special Reserve and Red Seal grew net sales 44% and 32% respectively and became the fastest growing blended scotch brand in the United States. Buchanan‟s is the clear leader in the US Hispanic market. Following the planned destock of the prior year, Diageo‟s beer brands grew volume 4% and net sales 4% driven predominantly by Guinness. Harp and Smithwicks also grew volume and net sales, albeit off a small base. The introduction of Red Stripe Light helped grow net sales of Red Stripe 3%. Diageo‟s wine business gained 0.1 percentage points of volume share and held value share. Volume growth in Sterling Vineyards, San Telmo and Stellani di Notte were offset by declines in Beaulieu Vineyard, Chalone Vineyard and Barton & Guestier. Net sales declined as consumers continued to trade down to lower price points. Diageo introduced 9 new wine brands or varietals aimed at addressing the consumer demand for quality wines at value price points and the appeal for blends. In March 2010, Diageo announced the restructuring of the North American wine division (which included a sale and leaseback transaction and the intended sale of non-strategic brands) to reduce the cost base and improve returns.

11
Ready to drink remains challenging for Diageo. Net sales were down 5% and Diageo lost share. Smirnoff malt-based products grew net sales 6% as the strong performance of Smirnoff Ice Mango, Smirnoff Ice Multipack and the introduction of Smirnoff Mixed Drinks, offset the decline of established products. Similarly in the ready to serve segment innovation offset a decline in existing products. In the second half innovation behind Jose Cuervo Margaritas drove improved performance with the introduction of pomegranate and mango flavored margaritas but the segment remains highly competitive. Diageo launched over 30 innovations during the year spanning spirits, beer, wine and ready to drink and through the fiscal year averaged 5 of the top 10 new items in IRI. Innovation included extensions which enhanced core brands, such as Captain Morgan Lime Bite, Smirnoff Dark Roasted Espresso, Cîroc Coconut and Ketel One Oranje, as well as new brands such as Wily Jack wine and Moon Mountain vodka. Performance of innovation was led by Crown Royal Black, Cîroc Red Berry and Smirnoff mixed drinks. Marketing spend increased by 7%. In the second half spend was up 23%, focused behind innovation and up-weighted investment on key spirits brands, such as Captain Morgan, Johnnie Walker, Smirnoff, Crown Royal and Cîroc. Diageo has worked with key accounts at national, regional and local levels to bring shopper and category insights to optimise sales of beverage alcohol in their stores. In addition, Diageo has developed and rolled out shopper-insight driven programmes behind Diageo‟s brands. These programmes capture the shoppers‟ attention in off trade stores and on trade restaurants, bars and clubs, meeting shoppers‟ needs at the point of purchase. Focus on the customer marketing agenda resulted in improved visibility for Diageo‟s brands in thousands of on and off trade accounts. Canada – Net sales decline but share gains in a difficult market Performance in Canada declined with volume down 1% and net sales down 4%. Spirits volume was
impacted by destocking in the first half but Captain Morgan and JεB grew in the full year. Net sales declined as consumers continued to trade down and there was a shift from spirits to beer and ready to drink. Beer volume increased 17% and net sales grew 15%. Wine grew volume 27% and net sales 31% on the strong growth of Sterling Vineyards. Ready to drink volume declined 15% and net sales declined 18% due to competition in the ready to serve segment. Europe Summary:
Volume increase was led by the strong performance in Great Britain, up 9%, where successful customer focus increased visibility of Diageo‟s brands in the off trade during key selling periods
Continued consumer weakness in Spain and Ireland led to a decline in net sales in those markets
Russia delivered a very strong performance with significant share gains and double-digit growth following the launch of new brands to capture opportunities in the scotch category as consumers traded down
Marketing spend reduced in line with consumer trends in difficult markets and was focused behind key brands, Smirnoff and Captain Morgan, and innovation
Guinness grew share in Great Britain and Ireland but volume was down in a tough beer market
Key measures: 2010 2009 (restated)
Organic movement
Reported movement
£ million £ million % % Volume (millions of equivalent units) 39.2 39.0 1 1 Net sales 2,759 2,750 (2) - Marketing spend 412 429 (6) (4) Operating profit before exceptional items 859 853 (1) 1 Operating profit 806 801 1

12
Reported performance: Net sales increased by £9 million in the year ended 30 June 2010 to £2,759 million, from £2,750 million in the prior year. Reported operating profit before exceptional items increased by £6 million in the year ended 30 June 2010 to £859 million, from £853 million in the prior year. Organic performance: The weighted average exchange rate used to translate euro net sales and profit moved from £1 = €1.17 in the year ended 30 June 2009 to £1 = €1.13 in the year ended 30 June 2010. Exchange rate impacts increased net sales by £53 million, acquisitions and disposals increased net sales by £10 million and there was an organic decrease in net sales of £54 million. Exchange rate impacts increased operating profit before exceptional items by £11 million, acquisitions and disposals increased operating profit before exceptional items by £1 million and there was an organic decrease in operating profit before exceptional items of £6 million. Brand performance:
Volume movement*
Organic net sales
movement
Reported net sales
movement % % % Global priority brands (1) (3) (2) Other brands 5 - 3 Total 1 (2) -
Key spirits brands:** Johnnie Walker (6) (4) (2) Smirnoff - (6) (5) Baileys 3 (3) (1)
JεB (8) (10) (6)
Guinness (4) (2) (1) Ready to drink (6) (2) (1) * Volume movement is both reported and organic ** Spirits brands excluding ready to drink
Great Britain – Growth in volume and net sales, strong spirits performance in the off trade A strong performance was delivered in Great Britain with volume up 9% and net sales up 5%, driven by double-digit volume growth from spirits and wine. Solid share gains were achieved in spirits in the key off trade channel through a continued promotional strategy although key Diageo brands continued to sell at a price premium relative to their category. The on trade, in contrast, continued to decline in the low single-digits although the rate of pub closures slowed. In this context, Guinness outperformed the beer category with broadly flat net sales through the success of the “Bring It to Life” and “250th Celebration” campaigns. Baileys and Pimm‟s both performed well with good volume, net sales and share growth driven by the continued strength of Baileys Flavours and distribution gains of Pimm‟s supported by a national television campaign. Smirnoff Flavours continued to grow strongly and have been particularly successful in the off trade, where it is now the best selling flavoured vodka range. The negative price/mix of 4 percentage points in Great Britain was driven by the faster growth of the grocery channel with its competitive promotional environment. Ireland – Diageo grew share in a declining market although rate of decline slowed Diageo‟s volume and net sales declined 6% and 8% respectively in Ireland, primarily driven by the weakness of the key on trade channel, but with share gains in beer and spirits. Guinness net sales decreased 5% but grew share, especially in the key Republic of Ireland on trade channel, where it has shown over 30 months of consecutive share growth, driven partly by the success of the “250th Celebration”

13
campaign. Harp and Smithwicks also grew share following the successful launch of Harp Ice Cold and the repositioning of Smithwicks brand. Carlsberg performed broadly in line with the market while Budweiser lost share. Iberia – While the market rate of decline slowed, consumers traded down and on trade weakness continued Difficult economic conditions continued to impact Iberia, with consumer driven sectors still experiencing weakness. The rate of decline of spirits slowed but the category remained adversely affected by consumers trading down to less expensive brands and categories and the shift towards at home consumption. The off trade continued to grow and is now approaching 40% of the total market, although the majority of this growth is being driven by own label brands at lower price points. Diageo‟s volume and net sales were down
5% and 7% respectively. Aggressive pricing and on trade decline led to negative price/mix. JεB was impacted by the fall in scotch consumption in the on trade channel in Spain and volume decreased 12%. In contrast, Johnnie Walker continued to capitalise on its great brand momentum and increased volume, net sales and share. Similarly, cocktail innovation including Cacique Mojito performed well in the off trade. Eastern Europe – Russia returned to growth in the second half Double-digit volume and net sales growth were delivered in Russia, reflecting the successful introduction of lower priced scotch brands into the market to appeal to value conscious consumers and maintain category participation. White Horse and Bell‟s captured this momentum, delivering strong volume and net sales growth. Captain Morgan also achieved good growth following the introduction of smaller sized bottles. In Eastern Europe, net sales declined as distributors and wholesalers continued to reduce their inventories and consumer demand remained weak. However, growth was achieved in certain countries on key brands, such as the double-digit net sales increase on Johnnie Walker Red Label in Poland and Bushmills in Bulgaria. Other European markets – Difficult macro economic conditions in Greece had limited impact on full year performance In Greece, net sales declined 4% for the year. Growth in the first half and the resilience of Diageo‟s scotch brands partly offset the decline in the second half as the government introduced tough austerity measures and excise taxes on alcohol were increased 87%. In Northern Europe, net sales and volume declined 1%, driven by the competitive pricing environment in Germany. Captain Morgan grew volume and net sales strongly following the recent focus on the brand. Brands and activities Johnnie Walker volume and net sales declined 6% and 4% respectively, driven by a weak performance in the first half in Eastern Europe and Russia. Price increases in Greece and the growth of Johnnie Walker Black Label in Spain, Greece and Turkey, led to 2 percentage points of positive price/mix. Similarly, Johnnie Walker Red Label showed a very strong performance in Spain and in Poland, gaining share and significantly growing volume and net sales. Smirnoff volume was flat and net sales were down 6%. This performance was driven by the sharp decline of the vodka category in Ireland and heightened competition in Poland, where local vodka brands returned to popularity during the economic downturn. Despite the difficult context, Smirnoff grew share in Ireland, driven by the on trade and extending its market leading position. In Great Britain, Smirnoff‟s largest European market, the brand lost share in the on trade but remained the best selling vodka and made strong share gains in the growing off trade. Baileys increased volume 3% with net sales down 3%. A strong performance in Great Britain, its largest European market, with volume and net sales up 17% and 5% respectively, was driven by the double-digit growth in the off trade and the rapid growth of Baileys Flavours. The marketing strategy focused on in-store activity to improve visibility during key selling periods, such as the joint display of Baileys Original and Baileys Flavours. This performance was offset by weak results in Germany and the decline of the liqueurs category in Eastern Europe.

14
JεB remained in decline with volume and net sales down 8% and 10% respectively, following the continued weakness of the scotch category in Spain and the increased competition by local and own label whisky brands in this market. Guinness volume and net sales declined across the region by 4% and 2% respectively, mainly caused by the decline of the on trade. In Great Britain, Guinness outperformed the beer category with broadly flat net sales and achieved its highest ever share of the on trade at 8% through the success of the “Bring it to Life” and “250th Celebration” campaigns. Share gains were also achieved in Ireland, led by the performance in the key Republic of Ireland on trade channel. Price/mix was positive mainly because of a price increase on Guinness Draught in Great Britain. The ready to drink segment remained weak with volume and net sales down 6% and 2% respectively, reflecting the continued decline of the segment across the region and more particularly in the on trade. Smirnoff Ice remained in decline in larger markets, where investment in the brand was focused on improving visibility in the off trade. Premix cans delivered strong growth in Great Britain with volume and net sales up 23% and 28% respectively, making spirits more accessible to the at home consumer. The successful launch of Smirnoff & Cola in February 2010, supported by television and in-store activity, expanded the range of premix variants to eight. Cacique Mojito in Spain had a strong start and the introduction of Smirnoff Cocktails in Great Britain strengthened Diageo‟s offering in the growing ready to serve segment. As consumer behaviours evolved in Europe, innovation remained a crucial performance driver with particular success in Great Britain, Spain and Russia. In Great Britain performance was driven by a full rollout on Baileys with a hint of Coffee, premix cans and Smirnoff flavoured vodka. The launch of Cacique Mojito ready to serve cocktails in Spain addressed the at home consumption trend. In Russia the launch of Bell‟s in the scotch value segment provided a lower priced alternative as consumers traded down from higher priced scotch brands.
The reserve brands grew in Europe focused on Diageo‟s single malt scotch brands and good growth was achieved on the Classic Malts range in France, Italy and Great Britain. Talisker and The Singleton of Dufftown also performed well, however Cardhu was impacted by the decline of the brand‟s principal on trade channel in Spain. Zacapa benefited from distribution gains across the region and grew net sales 19%. Marketing spend was down 6% in response to the challenging trading conditions across the region and more particularly in Ireland, Iberia and Eastern Europe. It was increased selectively behind proven campaigns on key brands such as Captain Morgan in Northern Europe, the launch of new flavours of Smirnoff in Great Britain and Johnnie Walker in Russia. Media rate deflation in the largest markets led to the realisation of savings on Guinness and Baileys. Customer marketing initiatives were designed to ensure the right products are supplied, available and merchandised in the most effective manner in order to win at the point of purchase. The successful collaboration with key grocery customers continued, with seasonal campaigns to increase sales at these key occasions. International
Latin America and the Caribbean delivered 15% net sales growth, driven by scotch brands Johnnie Walker, Buchanan‟s and Old Parr
Growth of lager brands led to 10% net sales growth in Africa
Global Travel and Middle East returned to growth, led by the strong growth of premium and super premium brands
Marketing spend increased ahead of net sales behind the key categories of scotch, beer and vodka

15
Key measures: 2010 2009 (restated)
Organic movement
Reported movement
£ million £ million % % Volume (millions of equivalent units) 40.3 37.0 8 9 Net sales 2,627 2,286 13 15 Marketing spend 302 259 13 17 Operating profit before exceptional items 771 649 25 19 Operating profit 766 627 22 Reported performance: Net sales increased by £341 million in the year ended 30 June 2010 to £2,627 million, from £2,286 million in the prior year. Reported operating profit before exceptional items increased by £122 million in the year ended 30 June 2010 to £771 million, from £649 million in the prior year. Organic performance: Exchange rate impacts increased net sales by £21 million, acquisitions and disposals increased net sales by £9 million and there was an organic increase in net sales of £311 million. Exchange rate impacts decreased operating profit before exceptional items by £27 million, acquisitions and disposals decreased operating profit before exceptional items by £6 million and there was an organic increase in operating profit before exceptional items of £155 million.
Brand performance: Organic
volume movement*
Organic net sales
movement
Reported net sales
movement % % % Global priority brands 7 9 11 Other brands 9 19 19 Total 8 13 15 Key spirits brands:** Johnnie Walker 22 17 26 Smirnoff 7 7 18 Baileys 1 2 8 Buchanan‟s 11 15 13 Guinness (6) (1) (8) Ready to drink (7) 7 10 * Reported volume movements for Other brands and Total were 10% and 9% respectively, primarily due to Windhoek ** Spirits brands excluding ready to drink Latin America and the Caribbean – Volume growth in Mexico and Brazil together with price increases in Venezuela drove performance Net sales grew 17% in Venezuela driven by price increases taken to reflect inflation and the weaker Bolivar/US dollar exchange rate. However, volume decreased 4% as the slowdown of the economy resulted in category declines within international spirits. This was especially true of the higher priced scotch segments where many consumers either switched into lower priced categories such as rum or locally produced vodka, or traded down within the category to standard variants. Within this environment, Diageo maintained its clear leadership position of both the scotch and rum categories. Volume grew 22% and net sales 15% in the Brazil hub, led by Johnnie Walker and Smirnoff which both grew share and extended their category leadership positions. Negative price/mix was a result of price reductions made in the second half of fiscal 2009. Marketing spend increased behind global brand

16
campaigns such as Johnnie Walker “Walk with Giants”, category marketing programmes such as the Whiskey Festival and activation behind Smirnoff, Cîroc and Ketel One vodka during the 2010 football World Cup. In Mexico, the strong performance of Johnnie Walker Red Label and Buchanan‟s Deluxe extended Diageo‟s position as the clear leader in scotch and led to volume growth of 25% and net sales growth of 31%. Price increases across the scotch range and the faster growth of deluxe variants resulted in 6 percentage points of positive price/mix. Marketing spend was significantly increased behind Johnnie Walker “Keep Walking” and the “Buchanan‟s Forever” platform. Africa – Beer net sales grew strongly led by lager brands. Strong share gains in the largest markets Despite a challenging economic environment in South Africa, volume and net sales grew 1%. The scotch category was most affected by the reduction in consumer confidence, however Bell‟s remained the best selling scotch in the market and Diageo‟s scotch brands grew share. Smirnoff delivered a strong performance, with net sales up 8%. Trading has generally improved in the second half, with signs of trading up starting to appear, particularly in scotch. Sales of beer through the brandhouse joint venture performed very well and grew share. The strong performance in Nigeria continued with net sales up 23% and Diageo gained share of the beer category. Harp, in particular, performed strongly as distribution gains and increased media activity led to excellent net sales growth for the brand. Guinness net sales declined 1% as a weaker economy led many consumers to trade down to lower priced beers. Marketing activity on Guinness was stepped up significantly, primarily behind television advertising of “The Scout” and activation around the sponsorship of the Nigerian football team, the “Super Eagles”, during the 2010 football World Cup. In the East Africa hub, comprising Kenya, Uganda and Tanzania, trading conditions significantly improved in the second half as the domestic economies showed signs of recovery. Diageo‟s performance steadily improved and the hub delivered flat volume and net sales growth of 10% for the full year. The positive price/mix was due to price increases coupled with the faster growth of the higher margin Guinness brand, which grew net sales 21%. Tusker in Kenya was another highlight, growing net sales 26%. Elsewhere in Africa, net sales grew 1% in both Cameroon and Ghana. In Cameroon, growth of Malta Guinness and the introduction of Pilsner lager in November 2009 drove performance. Ghana faced a difficult year as water shortages and power outages reduced production volume while a significant increase in excise duties in January negatively impacted consumer demand. Marketing spend behind Guinness in both Cameroon and Ghana increased significantly. Global Travel and Middle East – Net sales recovered after a difficult fiscal 2009 led by premium and super premium brands GTME recovered well from the travel reduction in 2009, with volume growth of 15% and net sales growth of 19%. Marketing spend was increased significantly reflecting the important role of GTME as a brand and category building channel. A greater focus on priority customers, increased resources behind shopper understanding and a step-up in programmes to encourage consumers into stores all contributed to the success. The stand out brand performance was from Johnnie Walker, particularly Black Label where net sales grew 38%. The largest non-scotch brands, Baileys, Smirnoff, Captain Morgan and Tanqueray, also grew net sales. Innovation played a significant role in driving growth, especially the launch of Johnnie Walker Double Black and the sustained momentum of Johnnie Walker King George V and The Singleton single malt scotch. Brands and activities Johnnie Walker volume grew 22% and net sales 17% with the rebound in performance from last year evident across Red, Black and Blue Labels. Negative price/mix reflected the re-instatement of promotional activity on scotch in Global Travel and price reductions on Johnnie Walker Red Label in Brazil. Johnnie Walker Red Label responded well to the “Adventure in a Glass” global marketing programme activated across Latin America while improved trading with customers supplying the duty free outlets on the United States/Mexico border also contributed to the improved growth levels. The majority of growth of Johnnie

17
Walker Black and Blue Labels was driven by GTME where the “Walking with Giants” campaign was activated in 30 airports in the second half. Volume and net sales of Smirnoff grew 7%, with the three largest markets of Brazil, South Africa and GTME all posting single-digit increases. In Brazil, a price increase partially offset the reduction taken in fiscal 2009, while strong marketing spend behind the Smirnoff “Be There” campaign contributed to the brand returning to growth. Baileys net sales were up 2% across the region as good growth in the largest markets of GTME and Mexico of 7% and 10% respectively were partly offset by a slowdown in the Caribbean and Central America and an initial adverse impact due to a change of route to market for spirits in Nigeria. Buchanan‟s volume and net sales grew 11% and 15% respectively and marketing spend was increased ahead of net sales supporting the “Buchanan‟s Forever” programme, which, in its third year, featured sold out concerts in Caracas, Bogota and Mexico City. Father‟s Day and Whiskey Festival promotions across Latin America contributed to improved net sales momentum in the second half. Guinness volume declined 6% and net sales 1% as some consumers in Africa traded down to lower priced beers. In the largest markets of Nigeria, Cameroon and Ghana, the brand commands a price premium of upwards of 75% compared to mainstream lager brands. To support brand equity and this strong pricing position, marketing spend was significantly increased behind the “250th Celebration” in the first half and in strengthening the brand‟s association with football in the second half. Ready to drink net sales grew 7% led by the strong performance of Smirnoff Ice in Nigeria and Brazil. In South Africa, Smirnoff ready to drink volume declined as consumers traded into less expensive mainstream
beer but the launch of premix versions of Captain Morgan and JεB helped grow ready to drink net sales 8% in that market. Marketing spend increased in line with net sales at 13% and was focused behind the largest categories and proven campaigns. By category, the majority of the additional spend was behind scotch as the “Walk with Giants” marketing programme on Johnnie Walker was activated at scale in both Latin America and GTME. Guinness also received significantly more support in fiscal 2010. Marketing spend increased between 30% and 70% in the largest markets of Nigeria, Cameroon and East Africa. International was the largest contributor to Diageo‟s innovation net sales growth mainly due to new beer formats in Nigeria and Kenya and the introduction of super deluxe variants of scotch brands in the domestic markets of Latin America. The launch of premix cans in South Africa and Johnnie Walker Double Black in GTME both showed encouraging early results. Reserve brands recovered from a difficult year in fiscal 2009 to deliver 9% net sales growth. GTME performed strongly as increased visibility of Johnnie Walker Blue Label, especially in Asian airports, led to strong growth. Higher up the price range, successful launch events for The John Walker gave the brand visibility in some of the most sought after top tier outlets across the region and most importantly attracted high net worth consumers to the brand. In Mexico, a focused strategy of expanding reserve brand distribution into high-end bars and increasing distribution in department stores led to a 44% increase in net sales. Reflecting the region‟s focus on improving customer collaboration and shopper understanding, a dedicated customer marketing function was established in all three hubs. In Latin America and the Caribbean, the “Ease of Shop” programme was rolled out across 3,500 stores. The Whiskey Festival, activated in many markets across the region, was a great example of activating a category platform at scale. In South Africa, strategic partnerships were developed with key customers and Diageo now holds category captaincy positions in its top ten national accounts. Elsewhere in Africa the sales focus was on developing the capabilities of distributor partners. In Global Travel, Diageo has shown leadership in bringing together suppliers, airport authorities and retailers to deliver exciting category events to consumers, both in and out of store.

18
Asia Pacific Summary:
Double-digit growth in South East Asia was driven by strong growth in Johnnie Walker and Guinness
Australia volume and net sales declined slightly driven by weakness of Bundaberg ready to drink in an increasingly competitive segment
Good depletions of Johnnie Walker and Windsor drove share growth in China as the scotch category returned to growth, although overall performance was held back by destock of Dimple
The scotch category was weak in Korea, however share gains extended Diageo‟s leadership position
A strong performance from The Singleton led to 10% net sales growth in Taiwan
India was impacted by a destock in the first half but the business performed more strongly in the second half
Marketing spend increased 3% with focused investment on Windsor, Guinness, Johnnie Walker and Smirnoff
Key measures: 2010 2009 (restated)
Organic movement
Reported movement
£ million £ million % % Volume (millions of equivalent units) 12.1 11.8 2 2 Net sales 1,018 910 1 12 Marketing spend 233 208 3 12 Operating profit before exceptional items 176 159 6 11 Operating profit 146 124 18 Reported performance: Net sales increased by £108 million in the year ended 30 June 2010 to £1,018 million, from £910 million in the prior year. Reported operating profit before exceptional items increased by £17 million in the year ended 30 June 2010 to £176 million, from £159 million in the prior year. Organic performance: Exchange rate impacts increased net sales by £101 million and there was an organic increase in net sales of £7 million. Exchange rate impacts increased operating profit before exceptional items by £14 million, acquisitions and disposals decreased operating profit before exceptional items by £7 million and there was an organic increase in operating profit before exceptional items of £10 million. Brand performance:
Volume movement*
Organic net sales
movement
Reported net sales
movement % % % Global priority brands 5 3 14 Other brands (2) (2) 10 Total 2 1 12 Key spirits brands:** Johnnie Walker 14 2 10 Smirnoff (5) (1) 11 Bundaberg (8) - 22 Windsor - - 9

19
Guinness 2 13 27 Ready to drink - (4) 15 * Volume movement is both reported and organic ** Spirits brands excluding ready to drink
Australia - Net sales growth on spirits but increased competition in ready to drink In Australia net sales declined 1% as a result of a 5% decline in ready to drink net sales. In spirits the performance was stronger. The “Strides” marketing campaign drove share gains and the strong performance of Johnnie Walker Red Label, with net sales growth of 19%, offset weakness in Baileys which was impacted by imports of the brand from outside Australia. Smirnoff volume was down 4%, however moderate price increases delivered flat net sales in a category that has seen increased competition from own label. Bundaberg volume declined 8% as growth slowed in dark spirits and a price increase held net sales flat. Marketing spend increased 2% and investment focused on the Smirnoff range. Korea - Increased investment on Windsor and good share gains in scotch The contraction of scotch in Korea during the global economic downturn combined with consumers trading down, led to a decline in volume and net sales of 8% and 3% respectively. A double-digit increase in marketing spend was focused on Windsor and Johnnie Walker Black Label and delivered 4 percentage points of volume share gain in the scotch category. Price increases on both Windsor 12 year old and Windsor 17 year old delivered price/mix improvement. South East Asia – Double-digit growth on Johnnie Walker and Guinness South East Asia, which includes Vietnam, Malaysia and Indonesia, performed well, delivering double-digit volume and net sales growth. Negative price/mix was driven by the increase in the level of business done through third party distributors, which led to a reduction in net sales per case and some destocking of super deluxe brands. Johnnie Walker performed well as a result of a 15% increase in marketing spend which focused on the “Keep Walking” campaign and Grand Prix sponsorship, and drove both share gains and increased brand equity. Guinness posted strong performance and the brand‟s price premium drove strong price/mix backed by a significant increase in marketing spend behind the “250th Celebration” and sponsorship of World Series Pool in Indonesia. Thailand - Net sales growth but adverse mix as consumers traded down In Thailand volume grew 9% as Johnnie Walker Black Label and Smirnoff both delivered good growth. However, the key growth driver in the market was Benmore, which delivered double-digit volume and net sales growth, and as a result of improved brand health grew share in a declining category as the uncertain political and economic environment led to trading down. The strong growth of Benmore at a lower price point to Johnnie Walker drove negative price/mix and net sales grew 4% in Thailand. China - Strong second half growth and share gains on Johnnie Walker The second half performance in China was very strong although the destocking of Dimple in the first half of the year impacted overall performance, with volume down 1% and net sales down 2% for the full year. Global priority brands grew in China and the strong performance of Johnnie Walker Black Label, delivered over 2 percentage points of share in a scotch category which had returned to growth. Smirnoff and Baileys also performed well, albeit from a smaller base, as brand equity improved. Both brands increased share in their respective categories and trade investment efficiencies delivered positive price/mix. Increased focus behind Windsor delivered strong growth in volume and net sales. A double-digit increase in marketing spend focused on Johnnie Walker and Windsor increased Diageo‟s share of voice in the scotch category by 4 percentage points.
20
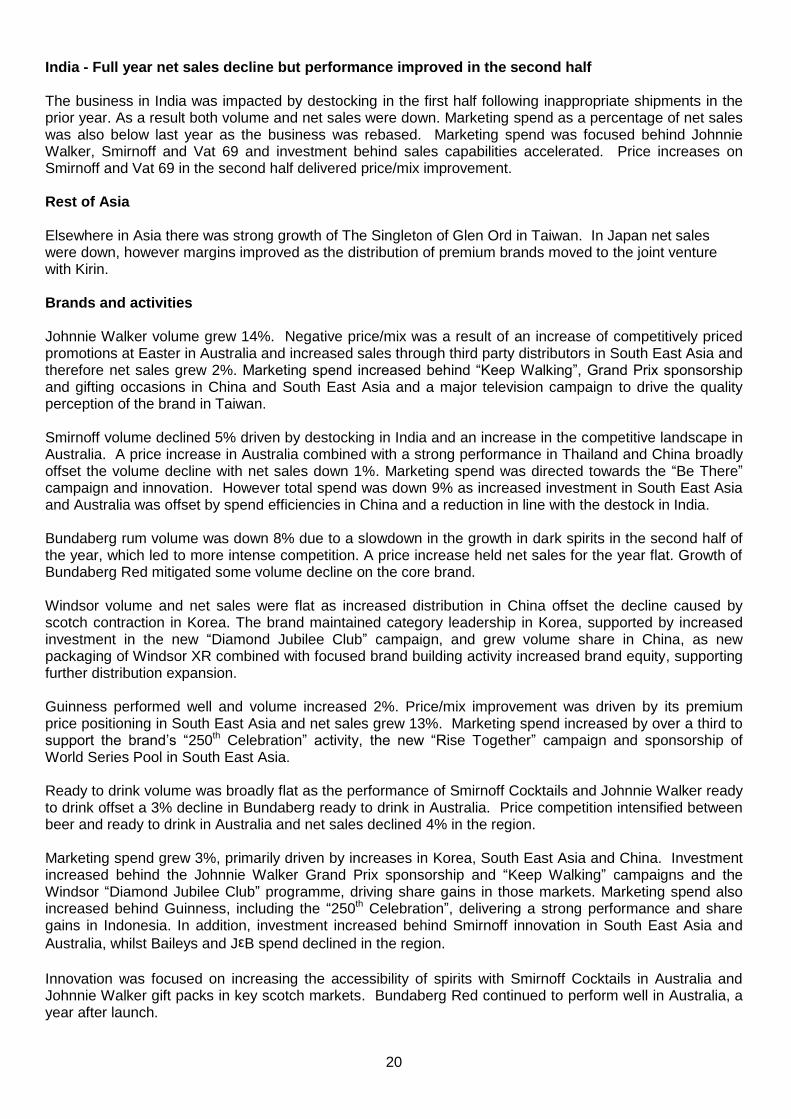
India - Full year net sales decline but performance improved in the second half The business in India was impacted by destocking in the first half following inappropriate shipments in the prior year. As a result both volume and net sales were down. Marketing spend as a percentage of net sales was also below last year as the business was rebased. Marketing spend was focused behind Johnnie Walker, Smirnoff and Vat 69 and investment behind sales capabilities accelerated. Price increases on Smirnoff and Vat 69 in the second half delivered price/mix improvement. Rest of Asia Elsewhere in Asia there was strong growth of The Singleton of Glen Ord in Taiwan. In Japan net sales were down, however margins improved as the distribution of premium brands moved to the joint venture with Kirin. Brands and activities Johnnie Walker volume grew 14%. Negative price/mix was a result of an increase of competitively priced promotions at Easter in Australia and increased sales through third party distributors in South East Asia and therefore net sales grew 2%. Marketing spend increased behind “Keep Walking”, Grand Prix sponsorship and gifting occasions in China and South East Asia and a major television campaign to drive the quality perception of the brand in Taiwan. Smirnoff volume declined 5% driven by destocking in India and an increase in the competitive landscape in Australia. A price increase in Australia combined with a strong performance in Thailand and China broadly offset the volume decline with net sales down 1%. Marketing spend was directed towards the “Be There” campaign and innovation. However total spend was down 9% as increased investment in South East Asia and Australia was offset by spend efficiencies in China and a reduction in line with the destock in India. Bundaberg rum volume was down 8% due to a slowdown in the growth in dark spirits in the second half of the year, which led to more intense competition. A price increase held net sales for the year flat. Growth of Bundaberg Red mitigated some volume decline on the core brand. Windsor volume and net sales were flat as increased distribution in China offset the decline caused by scotch contraction in Korea. The brand maintained category leadership in Korea, supported by increased investment in the new “Diamond Jubilee Club” campaign, and grew volume share in China, as new packaging of Windsor XR combined with focused brand building activity increased brand equity, supporting further distribution expansion. Guinness performed well and volume increased 2%. Price/mix improvement was driven by its premium price positioning in South East Asia and net sales grew 13%. Marketing spend increased by over a third to support the brand‟s “250th Celebration” activity, the new “Rise Together” campaign and sponsorship of World Series Pool in South East Asia. Ready to drink volume was broadly flat as the performance of Smirnoff Cocktails and Johnnie Walker ready to drink offset a 3% decline in Bundaberg ready to drink in Australia. Price competition intensified between beer and ready to drink in Australia and net sales declined 4% in the region. Marketing spend grew 3%, primarily driven by increases in Korea, South East Asia and China. Investment increased behind the Johnnie Walker Grand Prix sponsorship and “Keep Walking” campaigns and the Windsor “Diamond Jubilee Club” programme, driving share gains in those markets. Marketing spend also increased behind Guinness, including the “250th Celebration”, delivering a strong performance and share gains in Indonesia. In addition, investment increased behind Smirnoff innovation in South East Asia and
Australia, whilst Baileys and JεB spend declined in the region.
Innovation was focused on increasing the accessibility of spirits with Smirnoff Cocktails in Australia and Johnnie Walker gift packs in key scotch markets. Bundaberg Red continued to perform well in Australia, a year after launch.

21
The performance of reserve brands in the region was mixed. The Singleton of Glen Ord in Taiwan delivered double-digit growth supported by television advertising, but this was more than offset by the destocking of super deluxe scotch in South East Asia and India. Fiscal 2010 was the inaugural year for customer marketing in Asia Pacific and a dedicated team was established across the region. The strong on trade bias in the region was the focus of this customer marketing activity with investments behind bar staff training across the region, an on trade solutions website in Australia which was used by about 75% of Diageo‟s on trade accounts, and a Smirnoff versatility tool, “Smirnoff Tower” in China and India. In the Thai off trade, “Ease of Shop” was introduced and delivered increased spend per basket for customers and brand uplift for Diageo in the accounts where the programme was implemented.
22
2. FINANCIAL REVIEW Summary consolidated income statement
Year ended 30 June 2010
Year ended
30 June 2009
£ million (restated)
£ million Sales 12,958 12,283 Excise duties (3,178) (2,972) Net sales 9,780 9,311 Operating costs before exceptional items (7,029) (6,723) Operating profit before exceptional items 2,751 2,588 Exceptional operating items (177) (170) Operating profit 2,574 2,418 Sale of businesses (15) - Net finance charges (462) (592) Share of associates‟ profits after tax 142 164 Profit before taxation 2,239 1,990 Taxation (477) (286) Profit from continuing operations 1,762 1,704 Discontinued operations (19) 2 Profit for the year 1,743 1,706 Attributable to:
Equity shareholders of the parent company 1,629 1,605 Non-controlling interests 114 101 1,743 1,706
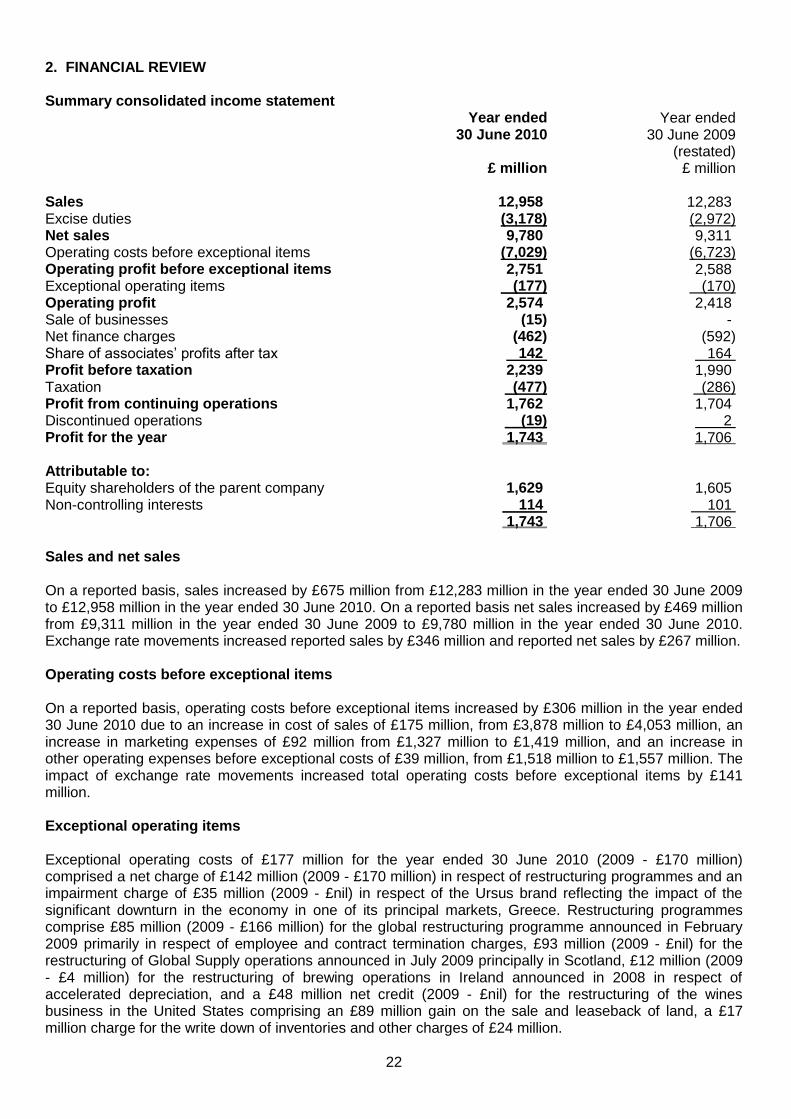
Sales and net sales On a reported basis, sales increased by £675 million from £12,283 million in the year ended 30 June 2009 to £12,958 million in the year ended 30 June 2010. On a reported basis net sales increased by £469 million from £9,311 million in the year ended 30 June 2009 to £9,780 million in the year ended 30 June 2010. Exchange rate movements increased reported sales by £346 million and reported net sales by £267 million. Operating costs before exceptional items On a reported basis, operating costs before exceptional items increased by £306 million in the year ended 30 June 2010 due to an increase in cost of sales of £175 million, from £3,878 million to £4,053 million, an increase in marketing expenses of £92 million from £1,327 million to £1,419 million, and an increase in other operating expenses before exceptional costs of £39 million, from £1,518 million to £1,557 million. The impact of exchange rate movements increased total operating costs before exceptional items by £141 million. Exceptional operating items Exceptional operating costs of £177 million for the year ended 30 June 2010 (2009 - £170 million) comprised a net charge of £142 million (2009 - £170 million) in respect of restructuring programmes and an impairment charge of £35 million (2009 - £nil) in respect of the Ursus brand reflecting the impact of the significant downturn in the economy in one of its principal markets, Greece. Restructuring programmes comprise £85 million (2009 - £166 million) for the global restructuring programme announced in February 2009 primarily in respect of employee and contract termination charges, £93 million (2009 - £nil) for the restructuring of Global Supply operations announced in July 2009 principally in Scotland, £12 million (2009 - £4 million) for the restructuring of brewing operations in Ireland announced in 2008 in respect of accelerated depreciation, and a £48 million net credit (2009 - £nil) for the restructuring of the wines business in the United States comprising an £89 million gain on the sale and leaseback of land, a £17 million charge for the write down of inventories and other charges of £24 million.
23
The total restructuring cash expenditure in the year ended 30 June 2010 is £145 million (2009 - £53 million) of which £122 million relates to the global restructuring programme. A charge of approximately £30 million is expected to be incurred in the year ending 30 June 2011 primarily in respect of the restructuring of Global Supply operations, while cash expenditure is expected to be approximately £150 million. Post employment plans Post employment net costs for the year ended 30 June 2010 were a charge of £133 million (2009 - £63 million) comprising £92 million (2009 - £98 million) included in operating costs before exceptional items, pension curtailment gains of £6 million (2009 - £33 million) in exceptional operating items and a charge of £47 million (2009 - gain of £2 million) in net finance charges. In the year ending 30 June 2011, the finance charge under IAS 19 is expected to be £5 million. The deficit before taxation in respect of post employment plans decreased by £178 million from £1,383 million at 30 June 2009 to £1,205 million at 30 June 2010. The reduction in the deficit included £147 million transferred into the UK Diageo Pension Scheme (the UK Scheme) from escrow under the deficit funding arrangements paid by the company in prior years. Deficit funding contributions to the group‟s UK and Irish pension schemes in the year ended 30 June 2010, other than the transfer to the UK Scheme of amounts paid into escrow in prior years, were £55 million and are expected to be approximately £50 million for the year ending 30 June 2011.
Operating profit Reported operating profit for the year ended 30 June 2010 increased by £156 million to £2,574 million from £2,418 million in the prior year. Exchange rate movements increased operating profit for the year ended 30 June 2010 by £122 million. Before exceptional operating items, operating profit for year ended 30 June 2010 increased by £163 million to £2,751 million from £2,588 million in the prior year. Exchange rate movements increased operating profit before exceptional items for the year ended 30 June 2010 by £126 million. Exceptional non-operating items A loss of £15 million on sale of businesses comprises a charge of £26 million in respect of the anticipated loss on the disposal of certain non-strategic wine brands in the United States in the year ending 30 June 2011 and a gain of £11 million arising on the revaluation of the current equity holding in the London Group, the owner of the Nuvo brand, to revalue Diageo‟s stake to fair value, following the acquisition of a majority equity stake in the London Group. Net finance charges Net finance charges comprising net interest charge and net other finance charges decreased from £592 million in the year ended 30 June 2009 to £462 million in the year ended 30 June 2010. The net interest charge decreased by £141 million from £516 million in the prior year to £375 million in the year ended 30 June 2010. The reduction in the interest charge arose principally from a decrease in average floating interest rates which resulted in a reduction in interest charges of £90 million, from a decrease in average net borrowings in the year driven by strong cash flow generation and from a positive movement on the revaluation to year end market rates of interest swaps under IAS 39 of £20 million. The income statement interest cover was 7.7 times and cash interest cover was 10.3 times. Net other finance charges for the year ended 30 June 2010 were £87 million (2009 - £76 million). There was an increase of £49 million in finance charges in respect of post employment plans from £2 million finance income in the year ended 30 June 2009 to a £47 million charge in the year ended 30 June 2010. Other finance charges also include £18 million (2009 - £21 million) on unwinding of discounts on liabilities, a hyperinflation adjustment of £16 million (2009 - £nil) in respect of the Venezuela operations, £10 million (2009 - £33 million) in respect of exchange rate translation differences on inter-company funding arrangements where hedge accounting was not applicable and £4 million income (2009 - £13 million

24
charge) in respect of other finance charges. In the year ended 30 June 2009 £11 million was recognised in respect of exchange movements on net borrowings not in a hedge relationship. Associates The group‟s share of associates‟ profits after interest and tax was £142 million for the year ended 30 June 2010 compared to £164 million in the prior year. Diageo‟s 34% equity interest in Moët Hennessy contributed £134 million (2009 - £151 million) to share of associates‟ profits after interest and tax. Profit before taxation Profit before taxation increased by £249 million from £1,990 million in the prior year to £2,239 million in the year ended 30 June 2010. Taxation The reported tax rate for the year ended 30 June 2010 was 21.3% compared with 14.4% for the year ended 30 June 2009. Factors that reduced the reported tax rate in the prior year included settlements agreed with tax authorities that gave rise to changes in the value of deferred tax assets and tax provisions. The underlying tax rate for the year ended 30 June 2010 was 21.6% and for the year ended 30 June 2009 was 22.1%. The underlying tax rate for the year ending 30 June 2011 is expected to remain at approximately 22%. Discontinued operations Discontinued operations in the year ended 30 June 2010 represent a charge after taxation of £19 million in respect of anticipated future payments to new thalidomide claimants. The credit of £2 million in the year ended 30 June 2009 relates to the Pillsbury disposal.
Exchange rate and other movements Exchange rate movements are calculated by retranslating the prior year results as if they had been generated at the current year exchange rates. The difference is excluded from organic growth. The estimated effect of exchange rate and other movements on profit before exceptional items and taxation for the year ended 30 June 2010 was as follows: Gains/(losses)
£ million Operating profit before exceptional items
Translation impact 37 Transaction impact 133 Impact of IAS 21 on operating profit (44)
Total exchange effect on operating profit before exceptional items 126 Interest and other finance charges
Net finance charges – translation impact 2 Mark to market impact of IAS 39 on interest expense 20 Impact of IAS 21 and IAS 39 on other finance charges 34
Associates – translation impact 4 Total effect on profit before exceptional items and taxation 186 Year ended
30 June 2010 Year ended
30 June 2009 Exchange rates Translation £1 = $1.57 $1.60 Transaction £1 = $1.67 $2.29 Translation £1 = €1.13 €1.17 Transaction £1 = €1.30 €1.40
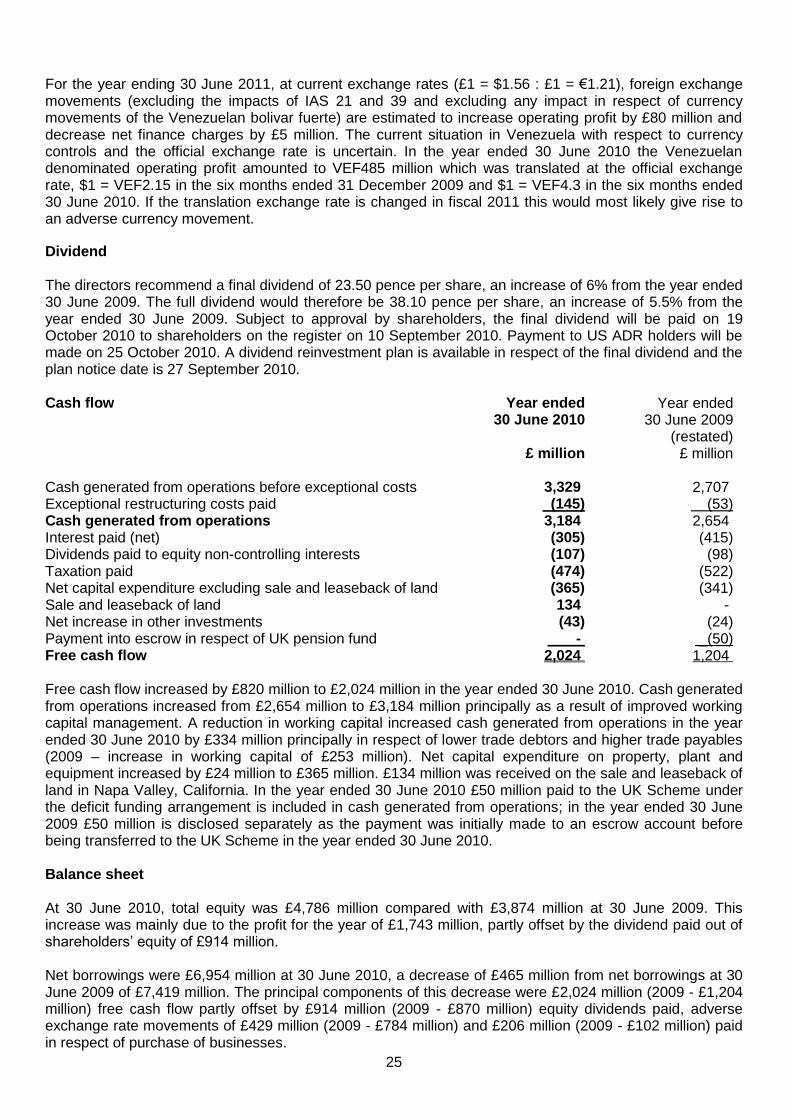
25
For the year ending 30 June 2011, at current exchange rates (£1 = $1.56 : £1 = €1.21), foreign exchange movements (excluding the impacts of IAS 21 and 39 and excluding any impact in respect of currency movements of the Venezuelan bolivar fuerte) are estimated to increase operating profit by £80 million and decrease net finance charges by £5 million. The current situation in Venezuela with respect to currency controls and the official exchange rate is uncertain. In the year ended 30 June 2010 the Venezuelan denominated operating profit amounted to VEF485 million which was translated at the official exchange rate, $1 = VEF2.15 in the six months ended 31 December 2009 and $1 = VEF4.3 in the six months ended 30 June 2010. If the translation exchange rate is changed in fiscal 2011 this would most likely give rise to an adverse currency movement.
Dividend The directors recommend a final dividend of 23.50 pence per share, an increase of 6% from the year ended 30 June 2009. The full dividend would therefore be 38.10 pence per share, an increase of 5.5% from the year ended 30 June 2009. Subject to approval by shareholders, the final dividend will be paid on 19 October 2010 to shareholders on the register on 10 September 2010. Payment to US ADR holders will be made on 25 October 2010. A dividend reinvestment plan is available in respect of the final dividend and the plan notice date is 27 September 2010. Cash flow Year ended
30 June 2010 Year ended
30 June 2009
£ million (restated)
£ million Cash generated from operations before exceptional costs 3,329 2,707 Exceptional restructuring costs paid (145) (53) Cash generated from operations 3,184 2,654 Interest paid (net) (305) (415) Dividends paid to equity non-controlling interests (107) (98) Taxation paid (474) (522) Net capital expenditure excluding sale and leaseback of land (365) (341) Sale and leaseback of land 134 - Net increase in other investments (43) (24) Payment into escrow in respect of UK pension fund - _(50) Free cash flow 2,024 1,204 Free cash flow increased by £820 million to £2,024 million in the year ended 30 June 2010. Cash generated from operations increased from £2,654 million to £3,184 million principally as a result of improved working capital management. A reduction in working capital increased cash generated from operations in the year ended 30 June 2010 by £334 million principally in respect of lower trade debtors and higher trade payables (2009 – increase in working capital of £253 million). Net capital expenditure on property, plant and equipment increased by £24 million to £365 million. £134 million was received on the sale and leaseback of land in Napa Valley, California. In the year ended 30 June 2010 £50 million paid to the UK Scheme under the deficit funding arrangement is included in cash generated from operations; in the year ended 30 June 2009 £50 million is disclosed separately as the payment was initially made to an escrow account before being transferred to the UK Scheme in the year ended 30 June 2010. Balance sheet At 30 June 2010, total equity was £4,786 million compared with £3,874 million at 30 June 2009. This increase was mainly due to the profit for the year of £1,743 million, partly offset by the dividend paid out of shareholders‟ equity of £914 million. Net borrowings were £6,954 million at 30 June 2010, a decrease of £465 million from net borrowings at 30 June 2009 of £7,419 million. The principal components of this decrease were £2,024 million (2009 - £1,204 million) free cash flow partly offset by £914 million (2009 - £870 million) equity dividends paid, adverse exchange rate movements of £429 million (2009 - £784 million) and £206 million (2009 - £102 million) paid in respect of purchase of businesses.
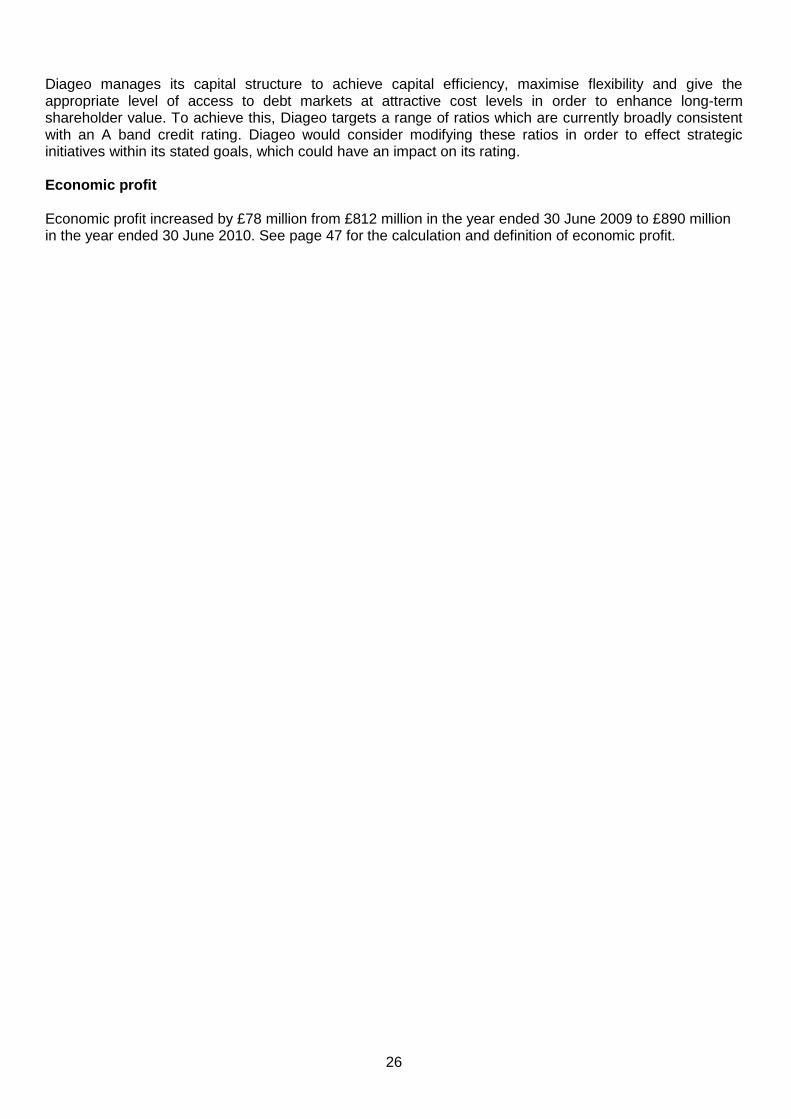
26
Diageo manages its capital structure to achieve capital efficiency, maximise flexibility and give the appropriate level of access to debt markets at attractive cost levels in order to enhance long-term shareholder value. To achieve this, Diageo targets a range of ratios which are currently broadly consistent with an A band credit rating. Diageo would consider modifying these ratios in order to effect strategic initiatives within its stated goals, which could have an impact on its rating. Economic profit Economic profit increased by £78 million from £812 million in the year ended 30 June 2009 to £890 million in the year ended 30 June 2010. See page 47 for the calculation and definition of economic profit.

27
DIAGEO CONDENSED CONSOLIDATED INCOME STATEMENT
Year ended
30 June 2010
Year ended
30 June 2009
Notes
£ million (restated)
£ million
Sales 2 12,958 12,283 Excise duties (3,178) (2,972) Net sales 2 9,780 9,311 Cost of sales (4,099) (3,893) Gross profit 5,681 5,418
Marketing expenses (1,419) (1,327) Other operating expenses (1,688) (1,673) Operating profit 2 2,574 2,418 Sale of businesses 3 (15) - Net interest payable 4 (375) (516) Net other finance charges 4 (87) (76) Share of associates' profits after tax 142 164 Profit before taxation 2,239 1,990 Taxation 5 (477) (286) Profit from continuing operations 1,762 1,704 Discontinued operations 6 (19) 2
Profit for the year 1,743 1,706
Attributable to: Equity shareholders of the parent company 1,629 1,605 Non-controlling interests 114 101 1,743 1,706 Pence per share Continuing operations 66.3p 64.5p Discontinued operations (0.8)p 0.1p Basic earnings 65.5p 64.6p Continuing operations
66.2p
64.3p
Discontinued operations (0.8)p 0.1p Diluted earnings 65.4p 64.4p Average shares
2,486m
2,485m

28
DIAGEO CONDENSED CONSOLIDATED STATEMENT OF COMPREHENSIVE INCOME
Year ended 30 June 2010
Year ended 30 June 2009
£ million
(restated) £ million
Other comprehensive income Exchange differences on translation of foreign operations excluding borrowings
531
930
Exchange differences on borrowings and derivative net investment hedges
(429)
(773)
Effective portion of changes in fair value of cash flow hedges
- net (losses)/gains taken to other comprehensive income (27) 90 - transferred to income statement (26) (71) Fair value movement on available-for-sale investments - 4 Hyperinflation adjustment 25 - Net actuarial gain/(loss) on post employment plans 8 (1,007) Tax on other comprehensive income (16) 254 Other comprehensive income for the year, net of income tax 66 (573)
Profit for the year 1,743 1,706 Total comprehensive income for the year 1,809 1,133 Attributable to: Equity shareholders of the parent company 1,628 940 Non-controlling interests 181 193 1,809 1,133

29
DIAGEO CONDENSED CONSOLIDATED BALANCE SHEET
30 June 2010
30 June 2009
(restated)
Notes £ million £ million £ million £ million Non-current assets Intangible assets 6,726 6,215 Property, plant and equipment 2,404 2,326 Biological assets 30 37 Investments in associates 2,060 2,041 Other investments 117 231 Other receivables 115 18 Other financial assets 472 364 Deferred tax assets 529 678
Post employment benefit assets 49 41 12,502 11,951 Current assets Inventories 7 3,281 3,078 Trade and other receivables 2,008 1,977 Assets held for sale 10 112 - Other financial assets 98 98 Cash and cash equivalents 8 1,453 914 6,952 6,067 Total assets 19,454 18,018 Current liabilities Borrowings and bank overdrafts 8 (587) (890) Other financial liabilities (186) (220) Trade and other payables (2,615) (2,172) Liabilities held for sale 10 (10) - Corporate tax payable (391) (532) Provisions (155) (172) (3,944) (3,986) Non-current liabilities Borrowings 8 (8,177) (7,685) Other financial liabilities (155) (99) Other payables (76) (30) Provisions (318) (314) Deferred tax liabilities (744) (606) Post employment benefit liabilities (1,254) (1,424) (10,724) (10,158) Total liabilities (14,668) (14,144) Net assets 4,786 3,874 Equity Called up share capital 797 797
Share premium 1,342 1,342 Other reserves 3,245 3,279 Retained deficit (1,377) (2,249) Equity attributable to equity
shareholders of the parent company
4,007
3,169
Non-controlling interests 779 705 Total equity 4,786 3,874
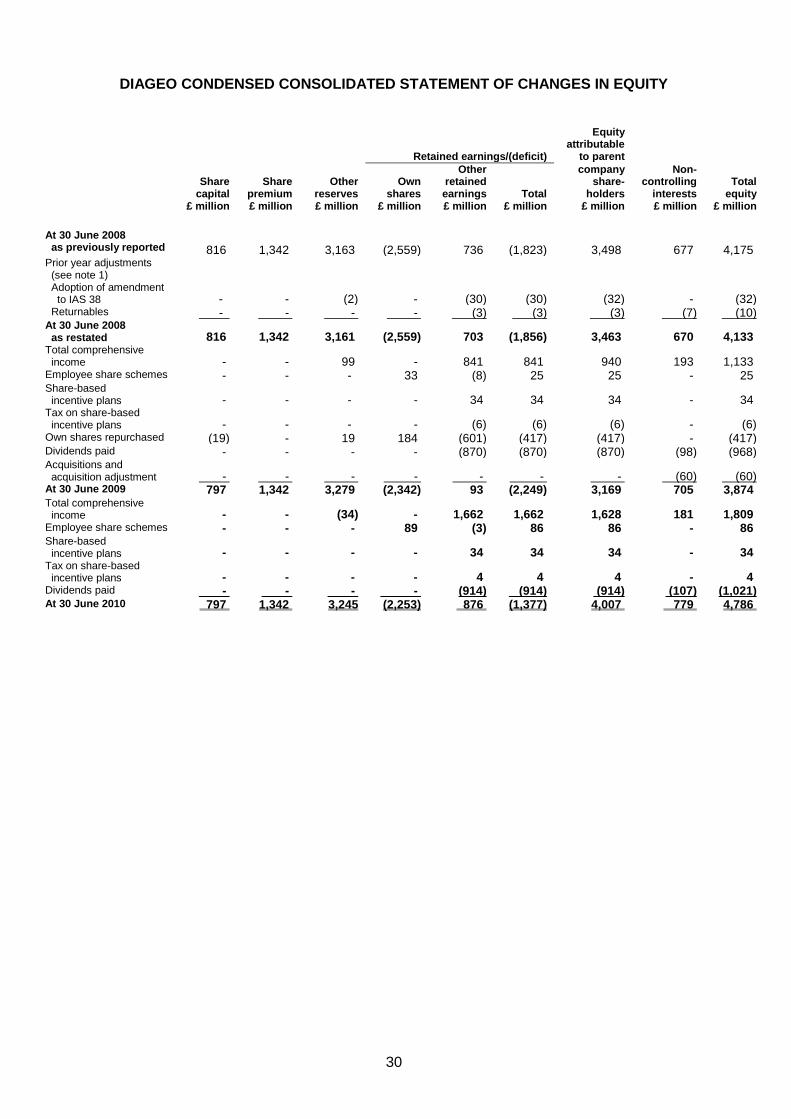
30
DIAGEO CONDENSED CONSOLIDATED STATEMENT OF CHANGES IN EQUITY
Retained earnings/(deficit)
Equity attributable
to parent
Share capital
£ million
Share premium £ million
Other reserves £ million
Own shares
£ million
Other retained earnings £ million
Total £ million
company share-
holders £ million
Non-controlling
interests £ million
Total equity
£ million
At 30 June 2008 as previously reported 816 1,342 3,163
(2,559)
736 (1,823) 3,498 677 4,175
Prior year adjustments (see note 1) Adoption of amendment to IAS 38 - - (2) - (30) (30) (32) - (32) Returnables - - - - (3) (3) (3) ___(7) __(10) At 30 June 2008 as restated 816 1,342 3,161 (2,559) 703 (1,856) 3,463 670 4,133 Total comprehensive income - - 99 - 841 841 940 193 1,133 Employee share schemes - - - 33 (8) 25 25 - 25 Share-based incentive plans - - - - 34 34 34 - 34 Tax on share-based incentive plans - - - - (6) (6) (6) - (6) Own shares repurchased (19) - 19 184 (601) (417) (417) - (417) Dividends paid - - - - (870) (870) (870) (98) (968) Acquisitions and acquisition adjustment - - - - - - - (60) (60) At 30 June 2009 797 1,342 3,279 (2,342) 93 (2,249) 3,169 705 3,874 Total comprehensive income - - (34) - 1,662 1,662 1,628 181 1,809 Employee share schemes - - - 89 (3) 86 86 - 86 Share-based incentive plans - - - - 34 34 34 - 34 Tax on share-based incentive plans - - - - 4 4 4 - 4 Dividends paid - - - - (914) (914) (914) (107) (1,021) At 30 June 2010 797 1,342 3,245 (2,253) 876 (1,377) 4,007 779 4,786

31
DIAGEO CONDENSED CONSOLIDATED STATEMENT OF CASH FLOWS
Year ended 30 June 2010
Year ended 30 June 2009
(restated) £ million £ million £ million £ million
Cash flows from operating activities Cash generated from operations (see note 12) 3,184 2,654 Interest received 307 63 Interest paid (612) (478) Dividends paid to equity non-controlling interests (107) (98) Taxation paid (474) (522) Net cash from operating activities 2,298 1,619 Cash flows from investing activities Disposal of property, plant and equipment and
computer software 143 14 Purchase of property, plant and equipment and
computer software (374) (355) Net increase in other investments (43) (24) Payment into escrow in respect of the UK Pension
Scheme
-
(50)
Disposal of businesses 1 1 Purchase of businesses (206) (102) Net cash outflow from investing activities (479) (516) Cash flows from financing activities Net sale/(purchase) of own shares for share schemes 85 (38) Own shares repurchased - (354) Net (decrease)/increase in loans (422) 256 Equity dividends paid (914) (870) Net cash outflow from financing activities (1,251) (1,006) Net increase in net cash and cash equivalents 568 97 Exchange differences (16) 66 Net cash and cash equivalents at beginning of the year 846 683 Net cash and cash equivalents at end of the year 1,398 846 Net cash and cash equivalents consist of: Cash and cash equivalents 1,453 914 Bank overdrafts (55) (68) 1,398 846

32
NOTES 1. Basis of preparation The condensed consolidated financial information has been extracted from the consolidated financial statements of Diageo plc for the year ended 30 June 2010. These consolidated financial statements were prepared in accordance with International Financial Reporting Standards (IFRS) as issued by the International Accounting Standards Board (IASB) and as endorsed and adopted for use in the European Union (EU). This consolidated financial information has been prepared on the basis of accounting policies consistent with those applied in the consolidated financial statements for the year ended 30 June 2009 except as noted below. IFRS is subject to ongoing review and endorsement by the EU or possible amendment by interpretative guidance from the IASB. (a) Adopted by the group The following accounting standards and interpretations, issued by the International Accounting Standards Board (IASB) or International Financial Reporting Interpretations Committee (IFRIC), are effective for the first time in the current financial year and have been adopted by the group: Amendment to IFRS 7 - Improving disclosures about financial instruments. This amendment resulted in enhanced disclosures about fair value measurements of financial instruments by using a three-level fair value hierarchy that prioritises the valuation techniques used in fair value calculations. The amended standard also extended disclosures in respect of liquidity risk. IFRS 8 - Operating segments. IFRS 8 requires that an entity's operating segments are reported on the same basis as the internally reported information that is provided to the chief operating decision maker. The chief operating decision maker has been identified as the executive committee. Following the adoption of IFRS 8, the group has revised its reported operating segments and provided further information in respect of these segments as well as additional disclosures. Details are provided in note 2 to this financial information. IAS 1 (Revised) - Presentation of financial statements. IAS 1 (Revised) has resulted in the group presenting both a consolidated statement of comprehensive income and a consolidated statement of changes in equity as primary statements. The group has chosen to disclose other comprehensive income as a separate statement from the income statement. The application of this standard has not affected the measurement of the group‟s consolidated results or financial position. Amendment to IAS 38 - Intangible assets. This amendment to IAS 38 clarifies the accounting for advertising expenditure. The group charges advertising expenditure to the income statement when it has a right of access to the goods or services acquired, as opposed to charging such costs to the income statement when the advertisement is first shown to the public. Advertisements, non-depreciable point of sale material, costs in respect of events and some sponsorship payments previously recorded in the income statement when delivered to the final customer are now expensed when delivered to the company. The impact of this change in accounting policy for the year ended 30 June 2009 reduced operating profit by £15 million, reduced the taxation charge by £3 million and reduced basic and diluted earnings per share by 0.5 pence. In addition, the adoption of the amendment decreased inventories by £3 million, decreased trade and other receivables included in current assets by £54 million, increased deferred tax assets by £6 million, reduced investment in associates by £4 million and reduced deferred tax liabilities by £9 million at 30 June 2009. IFRS 3 (Revised) - Business combinations. The group has adopted IFRS 3 (Revised) for acquisitions completed after 1 July 2009. The revised standard has resulted in a number of changes, notably that directly attributable acquisition costs are to be expensed rather than included as part of the purchase price, contingent consideration is to be accounted for at fair value at the acquisition date with subsequent changes in the fair value being recognised in the income statement. In addition, where a group gains control of a subsidiary undertaking through a step acquisition, the standard requires the existing interest owned to be remeasured at fair value with the difference between fair value and book value being recognised in the income statement. During the year ended 30 June 2010, Diageo incurred directly attributable transaction costs of £12 million which have been included in other external charges and made a gain of £11 million, included in sale of businesses, when an associate became a subsidiary undertaking following the purchase of additional equity.

33
In addition, the group has changed its accounting policy in respect of returnable bottles and crates („returnables‟) as the change more appropriately reflects the usage of these assets. These are now held within property, plant and equipment and depreciated on a straight-line basis to estimated residual values over their expected useful lives. Formerly a number of returnable bottles and crates were held within inventories and written down on purchase to their net realisable value. The impact of the adoption of this accounting policy for the year ended 30 June 2009 has reduced operating profit by £10 million, reduced the taxation charge by £3 million and reduced basic and diluted earnings per share by 0.1 pence. Of the charge for the year ended 30 June 2009, £3 million was in respect of non-controlling interests. On the consolidated balance sheet at 30 June 2009 inventories reduced by £81 million, property plant and equipment has increased by £58 million, trade and other payables reduced by £1 million, deferred tax liabilities reduced by £6 million and non-controlling interests reduced by £10 million. Where appropriate, comparatives in the financial information have been restated in accordance with the above changes in accounting policies. The following accounting standards and interpretations, issued by the IASB or International Financial Reporting Interpretations Committee (IFRIC), have been adopted by the group with no significant impact on its consolidated results or financial position: IFRIC 13 - Customer loyalty programmes IFRIC 15 - Agreements for the construction of real estate IFRIC 16 - Hedges of a net investment in a foreign operation IFRIC 17 - Distribution of non-cash assets to owners IFRIC 18 - Transfers of assets from customers Amendment to IAS 27 - Consolidated and separate financial statements Amendment to IAS 32 - Financial instruments Amendment to IAS 38 – Intangible assets, fair value of intangible asset acquired in a business combination Amendment to IAS 39 – Financial instruments: recognition and measurement - Eligible hedged items Amendment to IFRS 2 – Share-based payment: vesting conditions and cancellations Amendment to IFRIC 9 – Reassessment of embedded derivatives (b) Not adopted by the group The following standards and amendments, issued by the IASB or IFRIC, and endorsed by the EU, unless otherwise stated, have not yet been adopted by the group. The group does not currently believe the adoption of these standards or interpretations would have a material impact on the consolidated results or financial position of the group. Amendment to IFRS 5 – Noncurrent assets held for sale and discontinued operations (effective for annual periods beginning on or after 1 January 2010) IFRS 9 – Financial instruments (effective for annual periods beginning on or after 1 January 2013, not yet endorsed by the EU) Amendment to IAS 7 – Classification of expenditures on unrecognised assets (effective for annual periods beginning on or after 1 January 2010) Amendment to IAS 17 – Classification of leases of land and buildings (effective for annual periods beginning on or after 1 January 2010)
The information in this preliminary announcement does not constitute the statutory accounts of the group within the meaning of Section 434 of the Companies Act 2006. The statutory accounts of Diageo plc for the year ended 30 June 2009 have been delivered to the registrar of companies. KPMG Audit Plc has reported on those accounts and on the statutory accounts for the year ended 30 June 2010. Both audit reports were (i) unqualified, (ii) did not include a reference to any matters to which the auditors drew attention by way of emphasis without qualifying their report and (iii) did not contain a statement under section 498 (2) or (3) of the Companies Act 2006. 2. Segmental information The executive committee considers the business principally from a geographical perspective and the business analysis is presented under the operating segments of North America, Europe, International and Asia Pacific. In addition to these geographical selling segments, a further segment reviewed by the executive committee is Global Supply which manufactures and distributes premium drinks within the group.

34
Continuing operations also include the corporate function. In view of the focus on the geographical segments in explaining the group‟s performance in the business review, the results of the Global Supply segment have, in order to provide additional reconciling information, been allocated to the geographical segments. This gives an additional basis of presenting the group‟s performance and results on the basis of the location of third party customers. Corporate revenues and costs are in respect of central costs, including finance, human resources and legal, as well as certain information systems, facilities and employee costs that do not relate to the geographical segments or to Global Supply and hence are not allocated. They also include rents receivable in respect of properties not used by Diageo in the manufacture, sale or distribution of premium drinks and the results of Gleneagles Hotel. The group also owns a 34% interest in Moët Hennessy which is based in France and accounted for as an associate. The segmental information for net sales and operating profit is reported at budgeted exchange rates in line with internal reporting. For management reporting purposes Diageo measures the current year at, and restates the prior year net sales and operating profit to, the current year‟s budgeted exchange rates. These exchange rates are set prior to the financial year as part of the financial planning process and provide a consistent exchange rate to measure the performance of the business throughout the year. The adjustments required to retranslate the segmental information to actual exchange rates and to reconcile it to Diageo‟s reported results are shown in the tables below. The comparative segmental information, prior to re-translation, has not been restated at the current year‟s budgeted exchange rates but is presented at the budgeted rates for the year ended 30 June 2009. In addition, for management reporting purposes Diageo excludes the impact on net sales and operating profit of acquisitions and disposals completed in the current and prior year from the results of the geographical segments in order to provide comparable results. The impact of acquisitions and disposals has been allocated to the appropriate geographical segments in the tables below. These acquisitions and disposals are the same as those disclosed in the organic growth reconciliations but for management reporting purposes they are excluded from the current year altogether and are disclosed here at budgeted exchange rates.
North America £million
Europe £million
Inter- national £million
Asia Pacific
£million
Global Supply
£million
Eliminate inter-
segment sales
£million
Total
operating segments
£million
Corporate
and other
£million
Total £million
2010 Sales 3,853 4,371 3,222 1,442 2,627 (2,627) 12,888 70 12,958 Net sales
At budgeted exchange rates* 2,980 2,510 2,551 923 2,561 (2,460) 9,065 68 9,133
Acquisitions and disposals 47 9 7 - - - 63 - 63
Global Supply allocation 18 55 16 12 (101) - - - -
Retranslation to actual exchange rates
261
185
53
83
167
(167)
582
2
584
Net sales 3,306 2,759 2,627 1,018 2,627 (2,627) 9,710 70 9,780 Operating profit/(loss)
At budgeted exchange rates* 1,039 756 800 170 114 - 2,879 (180) 2,699
Acquisitions and disposals (3) 1 (5) (7) - - (14) - (14)
Global Supply allocation 56 55 5 (2) (114) - - - -
Retranslation to actual exchange rates
78
47
(29)
15
-
-
111
(45)
66
Operating profit/(loss) before exceptional items 1,170 859 771 176 - - 2,976 (225) 2,751
Exceptional items (38) (53) (5) (30) (39) - (165) (12) (177) Operating profit/(loss) 1,132 806 766 146 (39) - 2,811 (237) 2,574
Sale of businesses (15)
Net finance charges (462)
Share of associates‟ profits after tax
- Moët Hennessy 134
- Other associates 8 Profit before taxation 2,239
* These items represent the IFRS 8 performance measures for the geographical and Global Supply segments.

35
North America £million
Europe £million
Inter- national £million
Asia Pacific
£million
Global Supply
£million
Eliminate inter-
segment sales
£million
Total
operating segments
£million
Corporate
and other
£million
Total £million
2009 (restated) Sales 3,858 4,279 2,803 1,268 2,353 (2,353) 12,208 75 12,283 Net sales At budgeted exchange rates* 2,535 2,406 1,964 821 2,175 (2,067) 7,834 72 7,906 Acquisitions and disposals 129 5 3 1 - - 138 - 138 Global Supply allocation 22 57 15 14 (108) - - - - Retranslation to actual exchange rates 604 282 304 74 286 (286) 1,264 3 1,267 Net sales 3,290 2,750 2,286 910 2,353 (2,353) 9,236 75 9,311 Operating profit/(loss) At budgeted exchange rates* 885 780 598 170 13 - 2,446 (139) 2,307 Acquisitions and disposals 46 (2) - - - - 44 (2) 42 Global Supply allocation 22 3 (3) (9) (13) - - - - Retranslation to actual exchange rates
185
72
54
(2)
-
-
309
(70)
239
Operating profit/(loss) before exceptional items 1,138 853 649 159 - - 2,799 (211) 2,588 Exceptional items (23) (52) (22) (35) (17) - (149) (21) (170) Operating profit/(loss) 1,115 801 627 124 (17) - 2,650 (232) 2,418 Net finance charges (592) Share of associates‟ profits after tax - Moët Hennessy 151 - Other associates 13 Profit before taxation 1,990
* These items represent the IFRS 8 performance measures for the geographical and Global Supply segments.
The group‟s net finance charges are managed centrally and are not attributable to individual operating segments. Apart from sales by the Global Supply segment, inter-segmental sales are not material. The festive holiday season provides the peak period for sales. Approximately 40% of annual net sales occur in the last four months of each calendar year. Weighted average exchange rates used in the translation of income statements were US dollar - £1 = $1.57 (2009 - £1 = $1.60) and euro - £1 = €1.13 (2009 - £1 = €1.17). Exchange rates used to translate assets and liabilities at the balance sheet date were US dollar - £1 = $1.50 (2009 - £1 = $1.65) and euro - £1 = €1.22 (2009 - £1 = €1.17). The group uses foreign exchange transaction hedges to mitigate the effect of exchange rate movements.
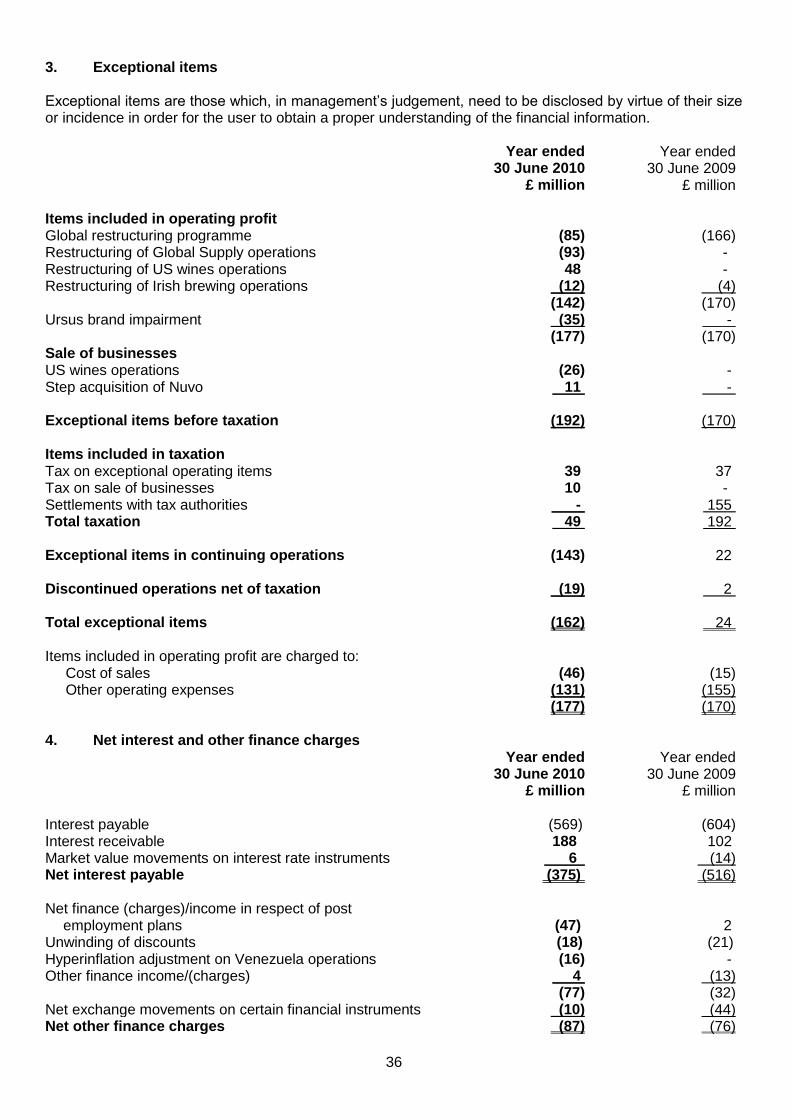
36
3. Exceptional items Exceptional items are those which, in management‟s judgement, need to be disclosed by virtue of their size or incidence in order for the user to obtain a proper understanding of the financial information. Year ended
30 June 2010 Year ended
30 June 2009 £ million £ million
Items included in operating profit Global restructuring programme (85) (166) Restructuring of Global Supply operations (93) - Restructuring of US wines operations 48 - Restructuring of Irish brewing operations (12) (4) (142) (170) Ursus brand impairment (35) - (177) (170) Sale of businesses US wines operations (26) - Step acquisition of Nuvo 11 - Exceptional items before taxation (192) (170) Items included in taxation
Tax on exceptional operating items 39 37 Tax on sale of businesses 10 - Settlements with tax authorities - 155 Total taxation 49 192 Exceptional items in continuing operations (143) 22 Discontinued operations net of taxation
(19)
2
Total exceptional items
(162) 24
Items included in operating profit are charged to: Cost of sales Other operating expenses
(46)
(131) (177)
(15)
(155) (170)
4. Net interest and other finance charges Year ended
30 June 2010 Year ended
30 June 2009 £ million £ million
Interest payable (569) (604) Interest receivable 188 102 Market value movements on interest rate instruments 6 (14) Net interest payable (375) (516) Net finance (charges)/income in respect of post
employment plans
(47)
2 Unwinding of discounts (18) (21) Hyperinflation adjustment on Venezuela operations (16) - Other finance income/(charges) 4 (13) (77) (32) Net exchange movements on certain financial instruments (10) (44) Net other finance charges (87) (76)

37
5. Taxation For the year ended 30 June 2010, the £477 million taxation charge (2009 - £286 million) comprises a UK tax credit of £28 million (2009 - £145 million) and a foreign tax charge of £505 million (2009 - £431 million). Included within the tax charge is a credit of £49 million (2009 - £192 million) in respect of the exceptional items identified in note 3. 6. Discontinued operations Discontinued operations in the year ended 30 June 2010 represent a charge after taxation of £19 million in respect of anticipated future payments to new thalidomide claimants. The credit of £2 million in the year ended 30 June 2009 relates to the Pillsbury disposal. 7. Inventories
30 June 2010 30 June 2009 (restated)
£ million £ million Raw materials and consumables 297 270 Work in progress 21 25 Maturing inventories 2,506 2,274 Finished goods and goods for resale 457 509 3,281 3,078 8. Net borrowings
30 June 2010 30 June 2009 £ million £ million
Borrowings due within one year and bank overdrafts (587) (890) Borrowings due after one year (8,177) (7,685) Fair value of interest rate hedging instruments 191 93
Fair value of foreign currency swaps and forwards 227 170 Finance lease liabilities (61) (21) (8,407) (8,333) Cash and cash equivalents 1,453 914 (6,954) (7,419) In the year ended 30 June 2010, the group issued a $500 million (£305 million) global bond repayable in January 2015 with a coupon of 3.25%. A $300 million (£184 million) medium term note and a $750 million (£493 million) global bond were repaid. In addition, $696 million (£466 million) of the outstanding 7.375% notes due in January 2014 were exchanged in May 2010 for $696 million (£466 million) of 4.828% notes due in July 2020 plus an aggregate cash payment to holders of $125 million (£84 million), pursuant to the terms of an exchange offer announced in April 2010. 9. Reconciliation of movement in net borrowings Year ended
30 June 2010 Year ended
30 June 2009 £ million £ million
Increase in net cash and cash equivalents before exchange 568 97 Decrease/(increase) in loans 422 (256) Decrease/(increase) in net borrowings from cash flows 990 (159) Exchange differences (429) (784) Other non-cash items (96) (29) Net borrowings at beginning of the year (7,419) (6,447) Net borrowings at end of the year (6,954) (7,419)
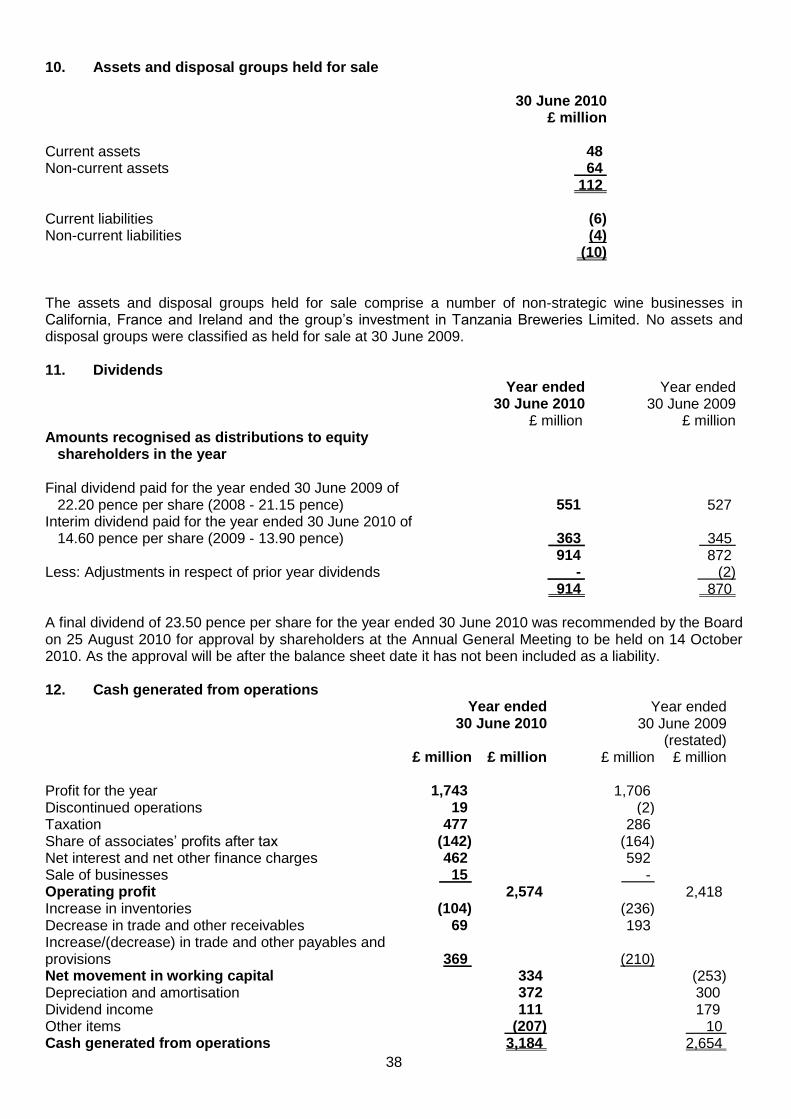
38
10. Assets and disposal groups held for sale
30 June 2010 £ million
Current assets 48 Non-current assets 64 112
Current liabilities (6) Non-current liabilities (4) (10)
The assets and disposal groups held for sale comprise a number of non-strategic wine businesses in California, France and Ireland and the group‟s investment in Tanzania Breweries Limited. No assets and disposal groups were classified as held for sale at 30 June 2009. 11. Dividends
Year ended 30 June 2010
£ million
Year ended 30 June 2009
£ million Amounts recognised as distributions to equity shareholders in the year
Final dividend paid for the year ended 30 June 2009 of 22.20 pence per share (2008 - 21.15 pence) Interim dividend paid for the year ended 30 June 2010 of 14.60 pence per share (2009 - 13.90 pence) Less: Adjustments in respect of prior year dividends
551
363 914
- 914
527
345 872
(2) 870
A final dividend of 23.50 pence per share for the year ended 30 June 2010 was recommended by the Board on 25 August 2010 for approval by shareholders at the Annual General Meeting to be held on 14 October 2010. As the approval will be after the balance sheet date it has not been included as a liability. 12. Cash generated from operations
Year ended 30 June 2010
Year ended 30 June 2009
(restated) £ million £ million £ million £ million
Profit for the year 1,743 1,706 Discontinued operations 19 (2) Taxation 477 286 Share of associates‟ profits after tax (142) (164) Net interest and net other finance charges 462 592 Sale of businesses 15 - Operating profit 2,574 2,418 Increase in inventories (104) (236) Decrease in trade and other receivables 69 193 Increase/(decrease) in trade and other payables and provisions
369
(210)
Net movement in working capital 334 (253) Depreciation and amortisation 372 300 Dividend income 111 179 Other items (207) 10 Cash generated from operations 3,184 2,654

39
In the consolidated statement of cash flows, cash generated from operations is stated after £145 million (2009 - £53 million) of cash outflows in respect of exceptional operating items. In the calculation of cash generated from operations, other items include £114 million of cash contributions to post employment schemes in excess of the income statement charge (2009 - £68 million) and gains on sale of property of £89 million (2009 - £6 million) partly offset by the fair value charge in respect of share-based incentive plans of £31 million (2009 - £31 million). 13. Contingent liabilities and legal proceedings (a) Guarantees As of 30 June 2010 the group has no material performance guarantees or indemnities to third parties. (b) Colombian litigation An action was filed on 8 October 2004 in the United States District Court for the Eastern District of New York by the Republic of Colombia and a number of its local government entities against Diageo and other spirits companies. The complaint alleges several causes of action. Included among the causes of action is a claim that the defendants allegedly violated the Federal RICO Act by facilitating money laundering in Colombia through their supposed involvement in the contraband trade to the detriment of government owned spirits production and distribution businesses. Diageo is unable to quantify meaningfully the possible loss or range of loss to which the lawsuit may give rise. Diageo intends to defend itself vigorously against this lawsuit.
(c) Turkish customs litigation In common with other beverage alcohol importers, litigation is ongoing against Diageo‟s Turkish subsidiary (Diageo Turkey) in the Turkish Civil Courts in connection with the methodology used by the Turkish customs authorities in assessing the importation value of and ad valorem import duty payable on the beverage alcohol products sold in the domestic channel in Turkey between 2001 and April 2009. The matter involves multiple cases against Diageo Turkey at various stages of litigation, including a group of cases under correction appeal following an adverse finding at the Turkish Supreme Court, and a group of cases decided on corrections appeal against Diageo Turkey that are now under further appeal. Diageo Turkey is unable to quantify meaningfully the possible loss or range of loss to which these cases may give rise. If all of these cases were finally to be decided against Diageo Turkey, the aggregate theoretical loss could exceed £100 million. Diageo Turkey has been using available opportunities to indicate to the Turkish authorities that, if suitable enabling legislation were in place, Diageo Turkey would be amenable to agreeing a settlement at a level that is proportionate to the scale of Diageo Turkey‟s business, which earns operating profit of less than £10 million a year. In this context, Diageo believes that any eventual liability is unlikely to be material to the Diageo group as a whole. Diageo recognises that, in absence of settlement, the ongoing situation creates potential uncertainty regarding Diageo Turkey‟s continuing operations in Turkey. Diageo Turkey intends to defend its position vigorously.
(d) SEC investigation As previously reported, Diageo Korea and several of its current and former employees have been subject to investigations by Korean authorities regarding various regulatory and control matters. Convictions for improper payments to a Korean customs official have been handed down against two former Diageo Korea employees, and a former and two current Diageo Korea employees have been convicted on various counts of tax evasion. Diageo had previously voluntarily reported the allegations relating to the convictions for improper payments to the US Department of Justice and the US Securities and Exchange Commission (SEC). The SEC has commenced an investigation into these and other matters, and Diageo is in the process of responding to the regulators‟ enquiries regarding activities in Korea, Thailand, India and elsewhere. Diageo‟s own internal investigation in Korea, Thailand, India and elsewhere remains ongoing. The US Foreign Corrupt Practices Act (FCPA) and related statutes and regulations provide for potential monetary penalties, criminal sanctions and may result in some cases in debarment from doing business with governmental entities in connection with FCPA violations. Diageo is unable to quantify meaningfully the possible loss or range of loss to which these matters may give rise. (e) Korean customs litigation Litigation is ongoing at the Korean National Tax Tribunal in connection with the application of the methodology used in transfer pricing on spirits imports since 2004. On 24 December 2009, Diageo Korea received a final customs audit assessment notice from the Korean customs authorities, covering the period from 1 February 2004 to 30 June 2007, for Korean won 194 billion or approximately

40
£105 million (including £13 million of value added tax). In order to preserve its right to appeal, Diageo Korea is required to pay the full amount of the assessment. Diageo Korea paid £4 million to the Korean customs authorities in the year ended 30 June 2009, £57 million in the year ended 30 June 2010, and expects to pay an additional £44 million in the year ending 30 June 2011, in respect of the period prior to 30 June 2007. On 22 January 2010, Diageo Korea appealed this customs audit assessment to the Korean National Tax Tribunal. No assessments have been received for any period subsequent to 30 June 2007. Diageo Korea is unable to quantify meaningfully the possible loss or range of loss to which these claims may give rise. Diageo Korea intends to defend its position vigorously. (f) Potential Chinese acquisition On 1 March 2010, Diageo entered into an equity transfer agreement to acquire an additional 4% equity stake in Sichuan Chengdu Quanxing Group Company Ltd. (Quanxing) from Chengdu Yingsheng Investment Holding Co., Ltd. The consideration for the additional 4% equity stake is RMB 140 million (£14 million). The acquisition of the 4% equity stake, which is subject to a number of regulatory approvals, would bring Diageo‟s shareholding in Quanxing to 53%. Quanxing is a holding company controlling a 39.7% stake in Sichuan ShuiJingFang Co., Ltd. (ShuiJingFang), a super premium Chinese white spirits company listed on the Shanghai Stock Exchange. If the acquisition of the 4% equity stake is approved, Diageo would become the indirect controlling shareholder of ShuiJingFang and, in accordance with Chinese takeover regulations, would be required to make a mandatory tender offer to all the other shareholders of ShuiJingFang. Were all other ShuiJingFang shareholders to accept the tender offer, the amount payable would be RMB 6.3 billion (approximately £615 million). As required by Chinese law, 20% of the maximum consideration payable under the tender offer (£123 million) was deposited with China‟s securities depositary and clearing agency, Shanghai branch. (g) Other The group has extensive international operations and is defendant in a number of legal proceedings incidental to these operations. There are a number of legal claims against the group, the outcome of which cannot at present be foreseen. Save as disclosed above, neither Diageo, nor any member of the Diageo group, is or has been engaged in, nor (so far as Diageo is aware) is there pending or threatened by or against it, any legal or arbitration proceedings which may have a significant effect on the financial position of the Diageo group. 14. Related party transactions The group‟s significant related parties are its associates, joint ventures, key management personnel and pension plans, as will be disclosed in the Annual Report for the year ended 30 June 2010. There have been no transactions with these related parties during the year ended 30 June 2010 that have materially affected the financial position or performance of the group during this period. 15. Post balance sheet events On 1 July 2010, Diageo announced that agreement has been reached with the trustee of the UK Diageo Pension Scheme (the UK Scheme) with respect to a 10 year funding plan. A pension funding partnership has been formed (the PFP), which as at 31 July 2010 held £487 million of maturing whisky spirit assets, and provides the trustee with collateral against Diageo‟s funding obligations to the UK Scheme. The PFP will be consolidated by Diageo and therefore the creation of the structure will not impact the group‟s consolidated balance sheet. The structure is expected to generate annual income, commencing in the year ending 30 June 2011, to the UK Scheme of approximately £25 million over the term of the PFP. The PFP is expected to be in place for 15 years after which time the trustee will be able to sell its PFP interests to Diageo for an amount expected to be no greater than the deficit on the UK Scheme at that time, up to a maximum of £430 million.
Diageo has also agreed to underwrite the reduction of the UK Scheme deficit through an agreement to make conditional cash contributions into an escrow account of up to £338 million if an equivalent reduction in the deficit is not achieved over a period of 10 years. If asset performance targets are not achieved contributions to an escrow account would commence, following the finalisation of the actuarial valuation of the UK Scheme at 31 March 2012, and payments from the escrow to the UK Scheme could commence in the year ending 30 June 2015.
41
In addition, on 1 July 2010, Diageo announced that it had provisionally agreed a deficit funding arrangement with the trustee in respect of the Guinness Ireland Group Pension Scheme (the Irish Scheme). This deficit funding arrangement is expected to result in additional annual contributions to the Irish Scheme of approximately €21 million (£17 million) over a period of 18 years, provision for additional cash contributions if the anticipated reduction in the deficit is not achieved and the Irish Scheme having access to a contingent asset. ADDITIONAL INFORMATION FOR SHAREHOLDERS
EXPLANATORY NOTES
Definitions Comparisons are to the year ended 30 June 2009 (2009) unless otherwise stated. Unless otherwise stated, percentage movements given throughout this announcement for volume, sales, net sales, marketing spend and operating profit are organic movements after retranslating prior year reported numbers at current year exchange rates and after adjusting for the effect of exceptional items and acquisitions and disposals. For an explanation of organic movements please refer to „Reconciliation to GAAP measures‟ in this announcement. Volume has been measured on an equivalent units basis to nine litre cases of spirits. An equivalent unit represents one nine litre case of spirits, which is approximately 272 servings. A serving comprises 33ml of spirits, 165ml of wine, or 330ml of ready to drink or beer. Therefore, to convert volume of products, other than spirits, to equivalent units, the following guide has been used: beer in hectolitres divide by 0.9, wine in nine litre cases divide by five, ready to drink in nine litre cases divide by 10 and certain pre-mixed products that are classified as ready to drink in nine litre cases divide by five. Net sales are sales after deducting excise duties. Price/mix is the number of percentage points by which the movement in net sales exceeds the movement in volume. The difference arises because of changes in the composition of sales between higher and lower priced variants or as price changes are implemented. Exceptional items are those which, in management‟s judgement, need to be disclosed by virtue of their size or incidence in order for the user to obtain a proper understanding of the financial information. Such items are included within the income statement caption to which they relate. References to ready to drink include progressive adult beverages in the United States and certain markets supplied by the United States. References to beer include Guinness Malta, a non alcoholic malt based product. References to reserve brands include Johnnie Walker Green Label, Johnnie Walker Gold Label, Johnnie Walker Blue Label, Johnnie Walker Blue Label King George V, Classic Malts, The Singleton of Glen Ord, The Singleton of Glendullan, The Singleton of Dufftown, Buchanan‟s Special Reserve, Buchanan‟s Red Seal, Dimple 18 Year Old, Bulleit Bourbon, Tanqueray Ten, Cîroc, Ketel One vodka, Don Julio, Zacapa and Godiva. Volume share is a brand‟s volume when compared to the volume of all brands in its segment. Value share is a brand‟s retail sales when compared to the retail sales of all brands in its segment. Unless otherwise stated, share refers to value share. Share of voice is the media spend on a particular brand when compared to all brands in its segment. The share data, competitive set classifications and share of voice data contained in this announcement are taken from independent industry sources in the markets in which Diageo operates. IRI refers to Information Resources, Inc. NABCA refers to the US National Alcohol Beverage Control Association. This announcement contains forward-looking statements that involve risk and uncertainty. There are a number of factors that could cause actual results and developments to differ materially from those expressed or implied by these forward-looking statements, including factors beyond Diageo‟s control. Please refer to page 54 – „Cautionary statement concerning forward-looking statements‟ for more details.
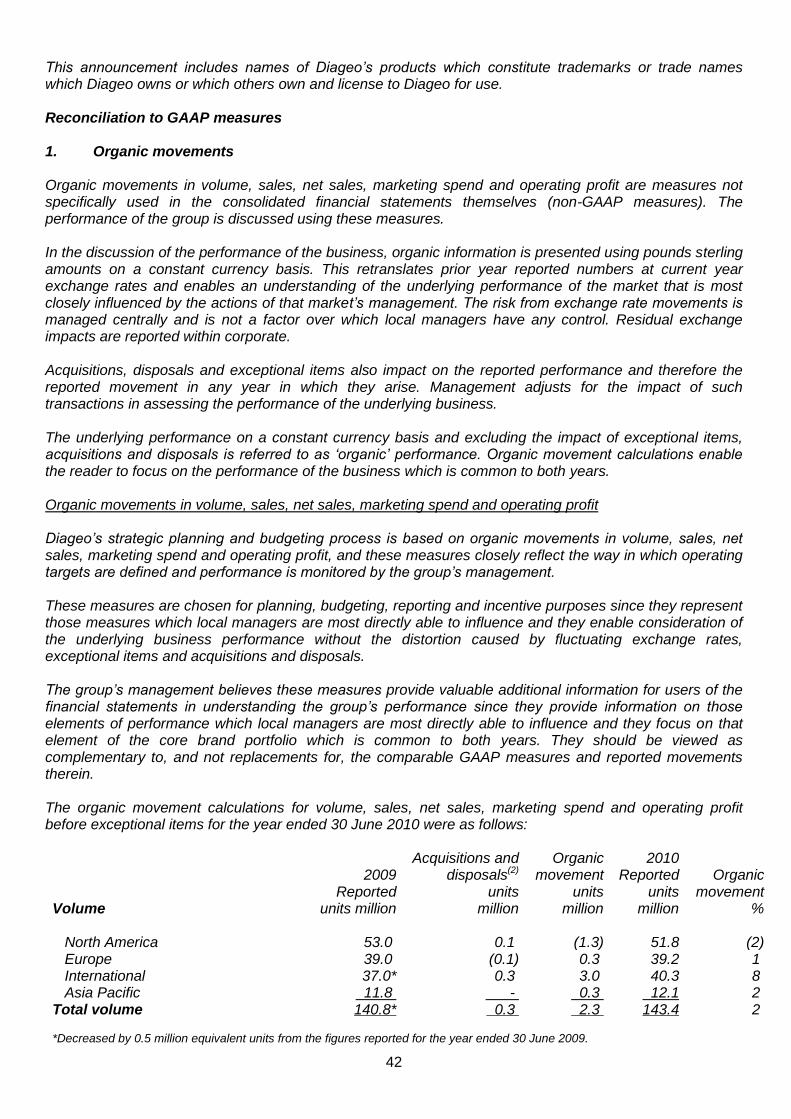
42
This announcement includes names of Diageo‟s products which constitute trademarks or trade names which Diageo owns or which others own and license to Diageo for use. Reconciliation to GAAP measures
1. Organic movements Organic movements in volume, sales, net sales, marketing spend and operating profit are measures not specifically used in the consolidated financial statements themselves (non-GAAP measures). The performance of the group is discussed using these measures. In the discussion of the performance of the business, organic information is presented using pounds sterling amounts on a constant currency basis. This retranslates prior year reported numbers at current year exchange rates and enables an understanding of the underlying performance of the market that is most closely influenced by the actions of that market‟s management. The risk from exchange rate movements is managed centrally and is not a factor over which local managers have any control. Residual exchange impacts are reported within corporate. Acquisitions, disposals and exceptional items also impact on the reported performance and therefore the reported movement in any year in which they arise. Management adjusts for the impact of such transactions in assessing the performance of the underlying business. The underlying performance on a constant currency basis and excluding the impact of exceptional items, acquisitions and disposals is referred to as „organic‟ performance. Organic movement calculations enable the reader to focus on the performance of the business which is common to both years. Organic movements in volume, sales, net sales, marketing spend and operating profit Diageo‟s strategic planning and budgeting process is based on organic movements in volume, sales, net sales, marketing spend and operating profit, and these measures closely reflect the way in which operating targets are defined and performance is monitored by the group‟s management. These measures are chosen for planning, budgeting, reporting and incentive purposes since they represent those measures which local managers are most directly able to influence and they enable consideration of the underlying business performance without the distortion caused by fluctuating exchange rates, exceptional items and acquisitions and disposals. The group‟s management believes these measures provide valuable additional information for users of the financial statements in understanding the group‟s performance since they provide information on those elements of performance which local managers are most directly able to influence and they focus on that element of the core brand portfolio which is common to both years. They should be viewed as complementary to, and not replacements for, the comparable GAAP measures and reported movements therein. The organic movement calculations for volume, sales, net sales, marketing spend and operating profit before exceptional items for the year ended 30 June 2010 were as follows:
Volume
2009
Reported units million
Acquisitions and disposals(2)
units million
Organic movement
units million
2010 Reported
units million
Organic
movement %
North America 53.0 0.1 (1.3) 51.8 (2) Europe 39.0 (0.1) 0.3 39.2 1 International 37.0* 0.3 3.0 40.3 8 Asia Pacific 11.8 - 0.3 12.1 2 Total volume 140.8* 0.3 2.3 143.4 2 *Decreased by 0.5 million equivalent units from the figures reported for the year ended 30 June 2009.

43
Sales
2009
Reported £ million
Exchange(1) £ million
Acquisitions and
disposals(2) £ million
Organic
movement £ million
2010
Reported £ million
Organic
movement %
North America 3,858 103 15 (123) 3,853 (3) Europe 4,279 78 13 1 4,371 0 International 2,803 18 10 391 3,222 14 Asia Pacific 1,268 146 - 28 1,442 2 Corporate 75 1 - (6) 70 Total sales 12,283 346 38 291 12,958 2
Net sales
2009
Reported £ million
Exchange(1)
£ million
Acquisitions and
disposals(2) £ million
Organic
movement £ million
2010
Reported £ million
Organic
movement %
North America 3,290 91 15 (90) 3,306 (3) Europe 2,750 53 10 (54) 2,759 (2) International 2,286 21 9 311 2,627 13 Asia Pacific 910 101 - 7 1,018 1 Corporate 75 1 - (6) 70 Total net sales 9,311 267 34 168 9,780 2 Excise duties 2,972 3,178 Total sales 12,283 12,958
Marketing spend
2009
Reported* £ million
Exchange(1) £ million
Acquisitions and
disposals(2) £ million
Organic
movement £ million
2010
Reported £ million
Organic
movement %
North America 431 12 1 28 472 6 Europe 429 9 - (26) 412 (6) International 259 7 1 35 302 13 Asia Pacific 208 18 - 7 233 3 Total marketing spend 1,327 46 2 44 1,419 3
Operating profit
2009
Reported* £ million
Exchange(1) £ million
Acquisitions and
disposals(2) £ million
Organic
movement £ million
2010
Reported £ million
Organic
movement %
North America 1,138 26 3 3 1,170 0 Europe 853 11 1 (6) 859 (1) International 649 (27) (6) 155 771 25 Asia Pacific 159 14 (7) 10 176 6 Corporate (211) 102 - (116) (225) Total operating profit before exceptional items 2,588 126 (9) 46 2,751 2 Exceptional items(3) (170) (177) Total operating profit
2,418 2,574
* The figures for the year ended 30 June 2009 have been restated following the adoption of the amendment to IAS 38 – Intangible
assets and IFRS 8 – Operating segments and the change to the accounting treatment of returnables. See note 1 to the financial information and page 44 for an explanation of the effect of the restatements.

44
Notes: Information relating to the organic movement calculations (1) The exchange adjustments for sales, net sales and operating profit are primarily the retranslation of
prior year reported results at current year exchange rates and are principally in respect of the strengthening of the euro and the US dollar partially offset by the weakening of the Nigerian naira.
(2) The impacts of acquisitions and disposals are excluded from the organic movement percentages. In the
year ended 30 June 2010 there were no acquisitions or disposals impacting organic growth but adjustment is made to exclude the impact of the disposal of the Bordeaux wine agency business in the United States and the acquisitions of Stirrings LLC and the distribution rights of Grand Marnier and Windhoek completed in the year ended 30 June 2009. Adjustment is also made to exclude directly attributable transaction costs incurred in the year ended 30 June 2010 of £12 million primarily in respect of the potential acquisitions of an additional equity stake in Quanxing and of Serengeti Breweries.
(3) Analysis by operating segment of exceptional items is disclosed in note 2 on page 33. Notes: Organic movement calculations methodology a) The organic movement percentage is the amount in the column headed Organic movement in the
tables above expressed as a percentage of the aggregate of the amount in the column headed 2009 Reported, the amount in the column headed Exchange and the amount, if any, in respect of disposals included in the column headed Acquisitions and disposals. The inclusion of the column headed Exchange in the organic movement calculation reflects the adjustment to recalculate the prior year results as if they had been generated at the current year‟s exchange rates.
b) Where a business, brand, brand distribution right or agency agreement was disposed of, or
terminated, in the current year, the group, in organic movement calculations, adjusts the results for the comparable prior year to exclude the amount the group earned in that year that it could not have earned in the current year (i.e. the period between the date in the prior year, equivalent to the date of the announcement of the disposal in the current year, and the end of the prior year). As a result, the organic movement numbers reflect only comparable performance. Similarly, if a business was disposed of part way through the prior year then its contribution would be completely excluded from that prior year‟s performance in the organic movement calculation, since the group recognised no contribution from that business in the current year. In the calculation of operating profit, the overheads included in disposals are only those directly attributable to the businesses disposed of, and do not result from subjective judgements of management. For acquisitions, a similar adjustment is made in the organic movement calculations. For acquisitions subsequent to the end of the prior year, the post acquisition results in the current year are excluded from the organic movement calculations. For acquisitions in the prior year, post acquisition results are included in full in the prior year but are only included from the anniversary of the acquisition date in the current year. The acquisition adjustment also eliminates the impact of transaction costs directly attributable to acquisitions that have been publicly announced and charged to operating profit in either year.
Restatement of prior year operating profit As reported in note 1 on page 32, Diageo adopted the amendment to IAS 38 – Intangible assets and IFRS 8 – Operating segments from 1 July 2009. In addition, Diageo changed its accounting policy in respect of the accounting for returnables from 1 July 2009. The segmental figures for operating profit before exceptional items for the year ended 30 June 2009 have been restated as follows:
As previously reported £ million
Amendment to IAS 38 £ million
IFRS 8
£ million
Returnables
£ million
Restated £ million
Restated organic growth
% North America 1,156 (2) (16) - 1,138 (1) Europe 856 (10) 7 - 853 (1) International 645 (3) 17 (10) 649 11 Asia Pacific 164 - (5) - 159 3 Corporate (208) _ _- (3) - (211)
2,613 (15) - (10) 2,588 4

45
For further information and the impact on the consolidated balance sheet see note 1 to the financial information. All amounts shown in the tables above under „Amendment to IAS 38‟ are in respect of marketing spend on which the other restatements have no impact. Movement in earnings per share before exceptional items and underlying movement in earnings per share The group‟s management believes movement in earnings per share before exceptional items and earnings per share on an underlying movement basis provides valuable additional information for users of the financial statements in understanding the group‟s overall performance. The group‟s management believes that the comparison of movements on these bases provides information as to the individual components of the movement in basic earnings per share, being the impact of retranslating prior year reported results at current year exchange rates, the impact of exceptional items, acquisitions and disposals, the impacts of IAS 19, 21 and 39 on net finance charges and the application of an underlying tax rate for each year. These measures should be viewed as complementary to, and not a replacement for, the comparable GAAP measures such as basic earnings per share and reported movements therein. The calculation of movements in earnings per share for the year ended 30 June 2010 was as follows: Year ended Year ended 30 June 2010 30 June 2009 (restated) Growth Pence per share(7) Pence per share(7) %
Basic eps 65.5 64.6 1 Exceptional items(1) 6.5 (1.0) Eps before exceptional items 72.0 63.6 13
Tax equalisation(2) - - Exchange(3) - 4.3 IAS 19(4) 1.6 (0.1) IAS 21 and IAS 39(5) 0.1 1.8 Acquisitions and disposals(6) 0.5 0.1 Adjusted basic eps – underlying 74.2 69.7 6
Notes: Information relating to the current year 1) In the year ended 30 June 2010, there were exceptional charges after tax of £112 million (2009 -
£133 million) for restructuring, £26 million for the impairment of the Ursus brand (2009 - £nil), £5 million on sales of businesses (2009 - £nil) and a £19 million charge for discontinued operations (2009 - a credit of £2 million). In the year ended 30 June 2009, there was an exceptional tax credit of £155 million.
2) Tax equalisation - the impact of adjusting the reported tax rate for each year to the underlying tax rate
for each year (see 5 - Underlying tax rate). No adjustment from the reported tax rate to the underlying tax rate is required in respect of the years ended 30 June 2010 and 2009 other than the adjustments made in respect of exceptional items.
3) Exchange - the exchange adjustments for operating profit and net finance charges are principally in
respect of the strengthening of the euro and the US dollar partially offset by the weakening of the Nigerian naira and the Venezuelan bolivar fuerte. Exchange adjustments are taxed at the underlying tax rate for the year.
4) Amounts under IAS 19 reported in net finance charges after tax at the underlying tax rate for each
year are excluded from adjusted basic earnings per share. 5) Amounts under IAS 21 and IAS 39 reported in net finance charges after tax at the underlying tax rate
for each year are excluded from adjusted basic earnings per share.

46
6) In the year ended 30 June 2010 there were no acquisitions or disposals impacting the calculation of underlying eps but adjustment is made to exclude the impact of the disposal of the Bordeaux wine agency business in the United States and the acquisitions of Stirrings LLC and the distribution rights of Grand Marnier and Windhoek completed in the year ended 30 June 2009. Adjustment is also made to exclude directly attributable transaction costs incurred in the year ended 30 June 2010 of £12 million primarily in respect of the potential acquisitions of an additional equity stake in Quanxing and of Serengeti Breweries.
7) All amounts are derived from amounts in £ million divided by the weighted average number of shares
in issue for the year ended 30 June 2010 of 2,486 million (2009 - 2,485 million). Notes: Underlying movement calculations methodology
a) Where a business, brand, brand distribution right, agency agreement or investment was disposed of,
or terminated, in the current year, the group, in the underlying movement calculations, adjusts the profit for the year attributable to equity shareholders for the comparable prior year to exclude the following: (i) the amount the group earned in that year that it could not have earned in the current year (i.e. the period between the date in the prior year, equivalent to the date of the announcement of the disposal in the current year, and the end of the prior year); (ii) a capital return in respect of the reduction in interest charge had the disposal proceeds been used entirely to reduce borrowings; and (iii) taxation at the underlying tax rate. As a result, the underlying movement numbers reflect only comparable performance. Similarly, if a business or investment asset was disposed of part way through the prior year, then its impact on the profit for the year attributable to equity shareholders (i.e. after adjustment for a capital return from use of the proceeds of the disposal to reduce borrowings and tax at the underlying tax rate) would be excluded from that prior year‟s performance in the underlying movement calculation, since the group recognised no contribution from that business in the current year.
b) Where a business, brand, brand distribution right or agency agreement or investment was acquired
subsequent to the end of the prior year, the group, in the underlying movement calculations, adjusts the profit for the current year attributable to equity shareholders to exclude the following: (i) the amount the group earned in the current year that it could not have earned in the prior year; (ii) a capital charge in respect of the increase in interest charge had the acquisition been funded entirely by an increase in borrowings; and (iii) taxation at the underlying tax rate. As a result, the underlying movement numbers reflect only comparable performance. Similarly, if a business or investment asset was acquired part way through the prior year, then its impact on the profit for the year attributable to equity shareholders (i.e. after adjustment for a capital charge for the funding of the acquisition and tax at the underlying tax rate) would be adjusted only to include the results from the anniversary of the acquisition in the current year‟s performance in the underlying movement calculation.
c) The effects of IAS 19 in respect of post employment plans, IAS 21 in respect of short term inter-
company funding balances and IAS 39 in respect of market value movements as recognised in net finance charges, net of tax at the underlying tax rate, are removed from both the current and prior year as part of the underlying movement calculation.
d) Underlying movement percentages for basic earnings per share are calculated as the underlying
movement amount in pence, expressed as the percentage of the prior year results at current year exchange rates, and after making an adjustment in each year for exceptional items, the impacts of IAS 19, IAS 21 and IAS 39 on net finance charges, tax equalisation and acquisitions and disposals.
2. Free cash flow Free cash flow is a non-GAAP measure that comprises the net cash flow from operating activities as well as the net purchase and disposal of investments, property, plant and equipment and computer software that form part of net cash flow from investing activities. The group‟s management believes the measure assists users of the financial statements in understanding the group‟s cash generating performance as it comprises items which arise from the running of the ongoing business.

47
The remaining components of net cash flow from investing activities that do not form part of free cash flow, as defined by the group‟s management, are in respect of the purchase and disposal of subsidiaries, associates and businesses. The group‟s management regards the purchase and disposal of property, plant and equipment and computer software as ultimately non-discretionary since ongoing investment in plant, machinery and technology is required to support the day-to-day operations, whereas acquisitions and disposals of businesses are discretionary. However, free cash flow does not necessarily reflect all amounts which the group has either a constructive or legal obligation to incur. Where appropriate, separate discussion is given for the impacts of acquisitions and disposals of businesses, equity dividends paid and the purchase of own shares, each of which arises from decisions that are independent from the running of the ongoing underlying business. The free cash flow measure is also used by management for their own planning, budgeting, reporting and incentive purposes since it provides information on those elements of performance which local managers are most directly able to influence. 3. Return on average total invested capital Return on average total invested capital is a non-GAAP measure that is used by management to assess the return obtained from the group‟s asset base. This measure is not specifically used in the consolidated financial statements, but is calculated to aid comparison of the performance of the business. The profit used in assessing the return on total invested capital reflects the operating performance of the business after applying the underlying tax rate for the year stated before exceptional items and interest. Average total invested capital is calculated using the average derived from the consolidated balance sheets at the beginning, middle and end of the year. Capital employed comprises net assets, excluding post employment benefit net liabilities (net of deferred tax) and net borrowings. This average capital employed is then aggregated with the average restructuring and integration costs net of tax, and goodwill written off to reserves at 1 July 2004, the date of transition to IFRS, to obtain the average total invested capital. Calculations for the return on average total invested capital for the years ended 30 June 2010 and 30 June 2009 were as follows:
2010 2009 (restated) £ million £ million
Operating profit 2,574 2,418 Exceptional items 177 170 Associates‟ profits after interest and tax 142 164 Tax at the underlying tax rate of 21.6% (2009 - 22.1%) (625) (608) 2,268 2,144 Average net assets (excluding net post employment liabilities) 5,329 4,758 Average net borrowings 7,226 7,427 Average integration and restructuring costs (net of tax) 1,195 1,049 Goodwill at 1 July 2004 1,562 1,562 Average total invested capital 15,312 14,796 Annualised return on average total invested capital 14.8% 14.5%
4. Economic profit Economic profit is a non-GAAP measure that is used by management to assess the group‟s return from its asset base compared to a standard cost of capital charge. The measure is not specifically used in the consolidated financial statements, but is calculated to aid comparison of the performance of the business. The profit used in assessing the return from the group‟s asset base and the asset base itself are the same as those used in the calculation for the return on average total invested capital (see 3 above). The standard
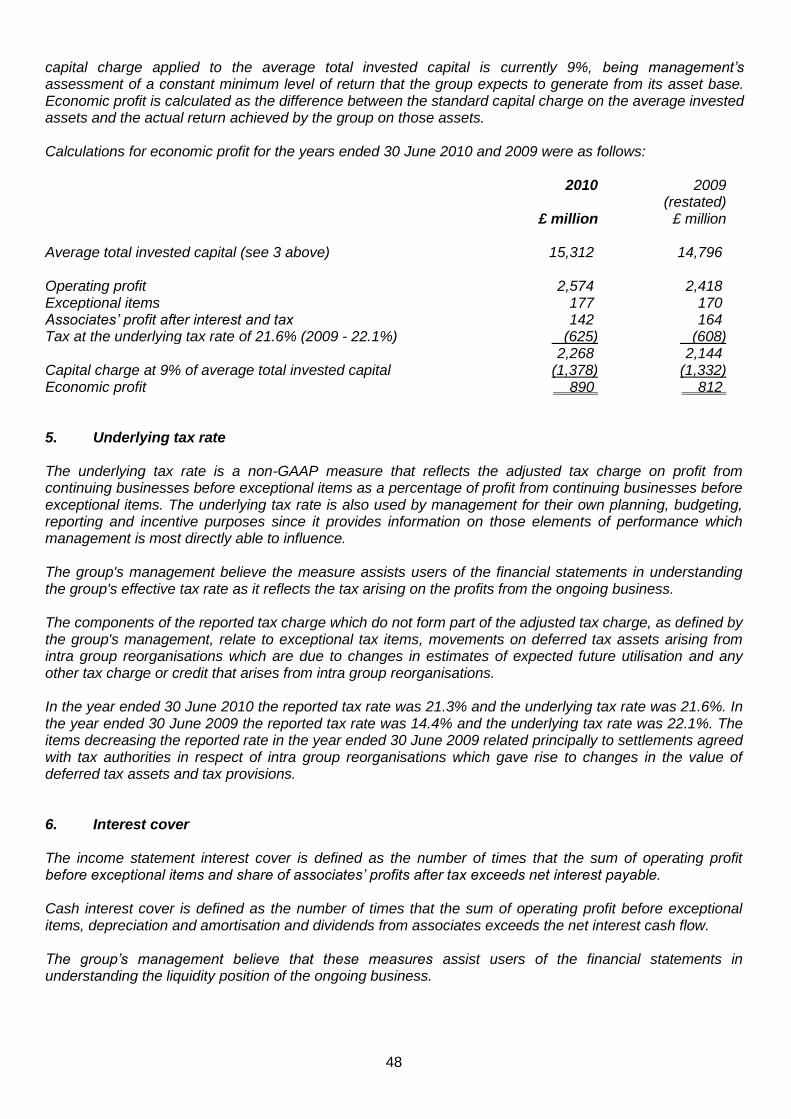
48
capital charge applied to the average total invested capital is currently 9%, being management‟s assessment of a constant minimum level of return that the group expects to generate from its asset base. Economic profit is calculated as the difference between the standard capital charge on the average invested assets and the actual return achieved by the group on those assets. Calculations for economic profit for the years ended 30 June 2010 and 2009 were as follows: 2010 2009
(restated) £ million £ million Average total invested capital (see 3 above) 15,312 14,796 Operating profit 2,574 2,418 Exceptional items 177 170 Associates‟ profit after interest and tax 142 164 Tax at the underlying tax rate of 21.6% (2009 - 22.1%) (625) (608) 2,268 2,144 Capital charge at 9% of average total invested capital (1,378) (1,332) Economic profit 890 812 5. Underlying tax rate The underlying tax rate is a non-GAAP measure that reflects the adjusted tax charge on profit from continuing businesses before exceptional items as a percentage of profit from continuing businesses before exceptional items. The underlying tax rate is also used by management for their own planning, budgeting, reporting and incentive purposes since it provides information on those elements of performance which management is most directly able to influence. The group's management believe the measure assists users of the financial statements in understanding the group's effective tax rate as it reflects the tax arising on the profits from the ongoing business. The components of the reported tax charge which do not form part of the adjusted tax charge, as defined by the group's management, relate to exceptional tax items, movements on deferred tax assets arising from intra group reorganisations which are due to changes in estimates of expected future utilisation and any other tax charge or credit that arises from intra group reorganisations. In the year ended 30 June 2010 the reported tax rate was 21.3% and the underlying tax rate was 21.6%. In the year ended 30 June 2009 the reported tax rate was 14.4% and the underlying tax rate was 22.1%. The items decreasing the reported rate in the year ended 30 June 2009 related principally to settlements agreed with tax authorities in respect of intra group reorganisations which gave rise to changes in the value of deferred tax assets and tax provisions. 6. Interest cover The income statement interest cover is defined as the number of times that the sum of operating profit before exceptional items and share of associates‟ profits after tax exceeds net interest payable. Cash interest cover is defined as the number of times that the sum of operating profit before exceptional items, depreciation and amortisation and dividends from associates exceeds the net interest cash flow. The group‟s management believe that these measures assist users of the financial statements in understanding the liquidity position of the ongoing business.

49
RISK FACTORS
Diageo believes the following to be the principal risks and uncertainties facing the group. If any of these risks occur, Diageo‟s business, financial condition and results of operations could suffer and the trading price and liquidity of securities could decline. In the on-going uncertain economic environment, certain risks may gain more prominence either individually or when taken together. The following are examples of ways that any of the risks below may become exacerbated. Demand for beverage alcohol products, in particular luxury or super premium products, may decrease with a reduction in consumer spending levels. Costs of operations may increase if inflation were to become prevalent in the economic environment, or upon an increase in the costs of raw materials. These factors may also lead to intensified competition for market share, with consequential potential adverse effects on volumes and prices. The financial and economic situation may have a negative impact on third parties with whom Diageo does, or may do, business. Any of these factors may affect the group‟s results of operations, financial condition and liquidity. Diageo has taken steps to manage its business through this challenging economic environment and position its business to benefit from economic recovery as and when it may occur in the various markets in which Diageo operates, but there can be no assurance that the steps taken will have the intended results. If there is an extended period of constraint in the capital markets, with debt markets in particular experiencing a lack of liquidity, at a time when cash flows from Diageo‟s business may be under pressure, this may have an impact on Diageo‟s ability to maintain current long term strategies, with a consequent effect on the group‟s growth rate. Such developments may adversely affect shareholder returns or share price. Additionally, continued volatility in exchange rates used to translate foreign currencies into pounds sterling may have a significant impact on Diageo‟s reported results. Decreases in the trustees‟ valuations of Diageo‟s pension plans may also increase pension funding requirements. Diageo faces competition that may reduce its market share and margins Diageo faces substantial competition from several international companies as well as local and regional companies in the countries in which it operates. Diageo competes with drinks companies across a wide range of consumer drinking occasions. Within a number of categories, consolidation or realignment is still possible. Consolidation is also taking place amongst Diageo‟s customers in many countries. Increased competition and unanticipated actions by competitors or customers could lead to downward pressure on prices and/or a decline in Diageo‟s market share in any of these categories, which would adversely affect Diageo‟s results and hinder its growth potential. Diageo may not be able to derive the expected benefits from its strategy to focus on premium drinks or its cost-saving and restructuring programmes designed to enhance earnings Diageo‟s strategy is to focus on premium drinks to grow its business through organic sales, operating profit growth and the acquisition of premium drinks brands that add value for shareholders. There can be no assurance that Diageo‟s strategic focus on premium drinks will result in opportunities for growth and improved margins. It is possible that the pursuit of this strategic focus on premium drinks could give rise to further business combinations, acquisitions, disposals, joint ventures and/or partnerships (including any associated financing or the assumption of actual or potential liabilities, depending on the transaction contemplated). There can be no assurance that any transaction will be completed. The success of any transaction will depend in part on Diageo‟s ability to successfully integrate new businesses with Diageo‟s existing operations and realise the anticipated benefits, cost savings or synergies. There can be no guarantee that any such business combination, acquisition, disposal, joint venture or partnership would deliver the benefits, cost savings or synergies anticipated, if any. Similarly, there can be no assurance that the cost-saving or restructuring programmes implemented by Diageo in order to improve efficiencies and deliver cost-savings will deliver the expected benefits. Regulatory decisions and changes in the legal and regulatory environment could increase Diageo’s costs and liabilities or limit its business activities Diageo‟s operations are subject to extensive regulatory requirements which include those in respect of production, product liability, distribution, importation, marketing, promotion, labelling, advertising, labour, pensions, compliance and control systems, and environmental issues. Changes in laws, regulations or governmental or regulatory policies and/or

50
practices could cause Diageo to incur material additional costs or liabilities that could adversely affect its business. In particular, governmental bodies in countries where Diageo operates may impose new labelling, product or production requirements, limitations on the advertising and/or promotion activities used to market beverage alcohol, restrictions on retail outlets, other restrictions on marketing, promotion and distribution or other restrictions on the locations or occasions where beverage alcohol is sold which directly or indirectly limit the sales of Diageo products. Regulatory authorities under whose laws Diageo operates may also have enforcement power that can subject the group to actions such as product recall, seizure of products or other sanctions, which could have an adverse effect on its sales or damage its reputation. An increase in the stringency of the regulatory environment could cause Diageo to incur material additional costs or liabilities that could adversely affect its business. In addition, beverage alcohol products are the subject of national excise and other duties in most countries around the world. An increase in excise or other duties could have a significant adverse effect on Diageo‟s sales revenue or margin, both through reducing overall consumption and by encouraging consumers to switch to lower-taxed categories of beverage alcohol. Diageo‟s reported after tax income is calculated based on extensive tax and accounting requirements in each of its relevant jurisdictions of operation. Changes in tax law (including tax rates), accounting policies and accounting standards could materially reduce Diageo‟s reported after tax income. Diageo is subject to litigation directed at the beverage alcohol industry and other litigation Companies in the beverage alcohol industry are, from time to time, exposed to class action or other litigation relating to alcohol advertising, product liability, alcohol abuse problems or health consequences from the misuse of alcohol, Diageo may be subject to litigation with tax, customs and other regulatory authorities, including with respect to the methodology for assessing importation value, transfer pricing and compliance matters, and Diageo is routinely subject to litigation in the ordinary course of its operations. Such litigation may result in damages, penalties or fines as well as reputational damage to Diageo or its brands, and as a result, Diageo‟s business could be materially adversely affected. For additional information with respect to legal proceedings, see note 13 „Contingent liabilities and legal proceedings‟. Contamination, counterfeiting or other circumstances could harm the integrity of customer support for Diageo’s brands and adversely affect the sales of those brands The success of Diageo‟s brands depends upon the positive image that consumers have of those brands, and contamination, whether arising accidentally, or through deliberate third-party action, or other events that harm the integrity or consumer support for those brands, could adversely affect their sales. Diageo purchases most of the raw materials for the production and packaging of its products from third-party producers or on the open market. Diageo may be subject to liability if contaminants in those raw materials or defects in the distillation, fermentation or bottling process lead to low beverage quality or illness among, or injury to, Diageo‟s consumers. In addition, Diageo may voluntarily recall products in the event of contamination or damage. A significant product liability judgement or a widespread product recall may negatively impact on sales and profitability of the affected brand or all Diageo brands for a period of time depending on product availability, competitive reaction and consumer attitudes. Even if a product liability claim is unsuccessful or is not fully pursued, resulting negative publicity could adversely affect Diageo‟s reputation with existing and potential customers and its corporate and brand image. In addition, to the extent that third parties sell products which are either counterfeit versions of Diageo brands or inferior brands that look like Diageo brands, consumers of Diageo brands could confuse Diageo products with them. This could cause them to refrain from purchasing Diageo brands in the future and in turn could impair brand equity and adversely affect Diageo‟s business. Demand for Diageo’s products may be adversely affected by many factors, including changes in consumer preferences and tastes and adverse impacts of a declining economy Diageo‟s collection of brands includes some of the world‟s leading beverage alcohol brands as well as brands of local prominence. Maintaining Diageo‟s competitive position depends on its continued ability to offer products that have a strong appeal to consumers. Consumer preferences may shift due to a variety of factors including changes in demographic and social trends, public health regulations, changes in travel, vacation or leisure activity patterns, weather effects and a downturn in economic conditions, which may reduce consumers‟ willingness to purchase premium branded products. In addition, concerns about health effects due to negative publicity regarding alcohol consumption, negative dietary effects, regulatory action or any
51
litigation or customer complaints against companies in the industry may have an adverse effect on Diageo‟s profitability. The competitive position of Diageo‟s brands could also be affected adversely by any failure to achieve consistent, reliable quality in the product or service levels to customers. In addition, both the launch and ongoing success of new products is inherently uncertain especially as to their appeal to consumers. The failure to launch a new product successfully can give rise to inventory write offs and other costs and can affect consumer perception of an existing brand. Growth in Diageo‟s business has been based on both the launch of new products and the growth of existing products. Product innovation remains a significant aspect of Diageo‟s plans for growth. There can be no assurance as to Diageo‟s continuing ability to develop and launch successful new products or variants of existing products or as to the profitable lifespan of newly or recently developed products. Any significant changes in consumer preferences and failure to anticipate and react to such changes could result in reduced demand for Diageo‟s products and erosion of its competitive and financial position. Continued economic pressures could lead to consumer selection of products at lower price points, whether Diageo‟s or those of competitors, which may have an adverse effect on Diageo‟s profitability. If the social acceptability of Diageo’s products declines, Diageo’s sales volume could decrease and the business could be materially adversely affected In recent years, there has been increased social and political attention directed to the beverage alcohol industry. Diageo believes that this attention is the result of public concern over problems related to alcohol abuse, including drink driving, underage drinking and health consequences from the misuse of alcohol. If, as a result, the general social acceptability of beverage alcohol were to decline significantly, sales of Diageo‟s products could materially decrease. Diageo’s business may be adversely impacted by unfavourable economic conditions or political or other developments and risks in the countries in which it operates Diageo may be adversely affected by political and economic developments or industrial action in any of the countries where Diageo has distribution networks, production facilities or marketing companies. Diageo‟s business is dependent on general economic conditions in the United States, Great Britain and other important markets. A significant deterioration in these conditions, including a reduction in consumer spending levels, customer destocking, the failure of customer, supplier or financial counterparties or a reduction in the availability of, or an increase in the cost of financing to, Diageo, could have a material adverse effect on Diageo‟s business and results of operations. Moreover, a substantial portion of Diageo‟s operations, representing approximately one third of Diageo‟s net sales for the year ended 30 June 2010, are carried out in developing markets, including Brazil, Venezuela, Mexico, Russia and developing markets in Africa and Asia. Diageo‟s operations are also subject to a variety of other risks and uncertainties related to trading in numerous foreign countries, including political or economic upheaval and the imposition of any import, investment or currency restrictions, including tariffs and import quotas or any restrictions on the repatriation of earnings and capital. Political and/or social unrest, potential health issues (including pandemic issues) and terrorist threats and/or acts may also occur in various places around the world, which will have an impact on trade, tourism and travel. Many of these risks are heightened, or occur more frequently, in developing markets. These disruptions can affect Diageo‟s ability to import or export products and to repatriate funds, as well as affecting the levels of consumer demand (for example in duty free outlets at airports or in on trade premises in affected regions) and therefore Diageo‟s levels of sales or profitability. Developing markets are also generally exposed to relatively higher risk of liquidity, inflation, devaluation, price volatility, currency convertibility and country default. Due to Diageo‟s specific exposures, any or all of the foregoing factors may affect Diageo disproportionately or in a different manner as compared to its competitors. Part of Diageo‟s growth strategy includes expanding its business in certain countries where consumer spending in general, and spending on Diageo‟s products in particular, has not historically been as great but where there are prospects for growth. There is no guarantee that this strategy will be successful and some of the markets represent a higher risk in terms of their changing regulatory environments and higher degree of uncertainty over levels of consumer spending.

52
Diageo’s operating results may be adversely affected by increased costs or shortages of labour Diageo‟s operating results could be adversely affected by labour or skill shortages or increased labour costs due to increased competition for employees, higher employee turnover or increased employee benefit costs. Diageo‟s success is dependent on the capability of its employees. There is no guarantee that Diageo will continue to be able to recruit, retain and develop the capabilities that it requires to deliver its strategy, for example in relation to sales, marketing and innovation capability within markets or in its senior management. The loss of senior management or other key personnel or the inability to identify, attract and retain qualified personnel in the future could make it difficult to manage the business and could adversely affect operations and financial results. An increase in the cost of raw materials or energy could affect Diageo’s profitability The components that Diageo uses for the production of its beverage products are largely commodities that are subject to price volatility caused by changes in global supply and demand, weather conditions, agricultural uncertainty and/or governmental controls. Commodity price changes may result in unexpected increases in the cost of raw materials, glass bottles and other packaging materials and Diageo‟s beverage products. Diageo may also be adversely affected by shortages of raw materials or packaging materials. In addition, energy cost increases result in higher transportation, freight and other operating costs. Diageo may not be able to increase its prices to offset these increased costs without suffering reduced volume, sales and operating profit. Diageo may experience significant increases in commodity costs and energy costs. Diageo’s operating results may be adversely affected by disruption to production facilities or business service centres Diageo would be affected if there were a catastrophic failure of its major production facilities or business service centres. Diageo operates production facilities around the world. If there were a technical integrity failure, fire or explosion at one of Diageo‟s production facilities, it could result in damage to the facilities, plant or equipment, their surroundings or the environment, could lead to a loss in production capacity, or could result in regulatory action, legal liability or damage to Diageo‟s reputation. In addition, the maintenance and development of information systems may result in systems failures which may adversely affect business operations. Diageo has a substantial inventory of aged product categories, principally scotch whisky and Canadian whisky, which may mature over periods of up to 30 years or more. The maturing inventory is stored primarily in Scotland, and the loss through contamination, fire or other natural disaster of all or a portion of the stock of any one of those aged product categories could result in a significant reduction in supply of those products, and consequently, Diageo would not be able to meet consumer demand for those products as it arises. There can be no assurance that insurance proceeds would cover the replacement value of Diageo‟s maturing inventory or other assets, were such assets to be lost due to contamination, fire or natural disasters or destruction resulting from negligence or the acts of third parties. In addition, there is an inherent risk of forecasting error in determining the quantity of maturing stock to lay down in a given year for future consumption. This could lead to an inability to supply future demand or lead to a future surplus of inventory and consequent write down in value of maturing stocks. Systems failures could lead to business disruption and systems change programmes may not deliver the benefits intended Any failure of information systems could adversely impact Diageo‟s ability to operate. As with all large systems, Diageo‟s information systems could be penetrated by outside parties intent on extracting information, corrupting information or disrupting business processes. Such unauthorised access could disrupt Diageo‟s business and/or lead to loss of assets. The concentration of processes in business service centres also means that any disruption arising from system failure or physical plant issues could impact a large portion of Diageo‟s global business. Certain change programmes designed to improve the effectiveness and efficiency of end-to-end operating, administrative and financial systems and processes continue to be undertaken. This includes moving transaction processing from a number of markets to business service centres. There can be no certainty that these programmes will deliver the expected operational benefits. There may be disruption caused to production processes and possibly to administrative and financial systems as further changes to such processes are effected. They could also lead to adverse customer or consumer reaction. Climate change, or legal, regulatory or market measures to address climate change, may negatively affect Diageo’s business or operations, and water scarcity or poor quality could negatively impact Diageo’s production costs and capacity There is a growing concern that carbon dioxide and other greenhouse gases in the atmosphere may have an adverse impact on global temperatures, weather

53
patterns and the frequency and severity of extreme weather and natural disasters. In the event that such climate change has a negative effect on agricultural productivity, Diageo may be subject to decreased availability or less favourable pricing for certain raw materials that are necessary for Diageo‟s products, such as sugar, cereals, hops, agave and grapes. Water is the main ingredient in substantially all of Diageo‟s products. It is also a limited resource in many parts of the world, facing unprecedented challenges from climate change, overexploitation, increasing pollution, and poor management. As demand for water continues to increase around the world, and as water becomes scarcer and the quality of available water deteriorates, Diageo may be affected by increasing production costs or capacity constraints, which could adversely affect Diageo‟s results of operations and profitability. Diageo’s operations and financial results may be adversely affected by movements in the value of its pension funds, fluctuations in exchange rates and fluctuations in interest rates Diageo has significant pension funds. These funds may be affected by, among other things, the performance of assets owned by these plans, the underlying actuarial assumptions used to calculate the surplus or deficit in the plans, in particular the discount rate and long term inflation rates used to calculate the liabilities of the pension funds, and any changes in applicable laws and regulations. If there are significant declines in financial markets and/or a deterioration in the value of fund assets or changes in discount rates or inflation rates, Diageo may need to make significant contributions to the pension funds in the future. Furthermore, if the market values of the assets held by Diageo‟s pension funds decline, or if the valuations of those assets by the pension trustees decline, pension expenses may increase and, as a result, could materially adversely affect Diageo‟s financial position. There is no assurance that interest rates or inflation rates will remain constant or that pension fund assets can earn the assumed rate of return annually, and Diageo‟s actual experience may be significantly more negative. Diageo may be adversely affected by fluctuations in exchange rates. The results of operations of Diageo are accounted for in pounds sterling. Approximately 36% of net sales in the year ended 30 June 2010 were in US dollars, approximately 17% were in euros and approximately 12% were in sterling. Movements in exchange rates used to translate foreign currencies into pounds sterling may have a significant impact on Diageo‟s reported results of operations from year to year. Diageo may also be adversely impacted by fluctuations in interest rates, mainly through an increased interest expense. To partly delay any adverse impact from interest rate movements, the group‟s policy is to maintain fixed rate borrowings within a band of 40% to 60% of projected net borrowings, and the overall net borrowings portfolio is managed according to a duration measure. Diageo’s operations may be adversely affected by failure to maintain or renegotiate distribution, supply, manufacturing or licence agreements on favourable terms Diageo‟s business has a number of distribution, supply, manufacturing and licence agreements for brands owned by it or by other companies. These agreements vary depending on the particular brand, but tend to be for a fixed number of years. There can be no assurance that Diageo will be able to renegotiate its rights on favourable terms when they expire or that agreements will not be terminated. Failure to renew these agreements on favourable terms could have an adverse impact on Diageo‟s sales and operating profit. In addition, Diageo‟s sales and operating profit may be adversely affected by any disputes with distributors of its products or with suppliers of raw materials, or a failure to renew distribution, supply, manufacturing or licence agreements on favourable terms. Diageo may not be able to protect its intellectual property rights Given the importance of brand recognition to its business, Diageo has invested considerable effort in protecting its intellectual property rights, including trademark registration and domain names. Diageo‟s patents cover some of its process technology, including some aspects of its bottle marking technology. Diageo also uses security measures and agreements to protect its confidential information and trade secrets. However, Diageo cannot be certain that the steps it has taken will be sufficient or that third parties will not infringe on or misappropriate its intellectual property rights in its brands or products. Moreover, some of the countries in which Diageo operates offer less intellectual property protection than Europe or North America. Given the attractiveness of Diageo‟s brands to consumers, it is not uncommon for counterfeit products to be manufactured. Diageo cannot be certain that the steps it takes to assist the authorities to prevent, detect and eliminate counterfeit products will be effective in preventing material loss of profits or erosion of brand equity resulting from lower quality or even dangerous counterfeit product reaching the market. If Diageo is unable to protect its intellectual property rights against infringement or misappropriation, this could materially harm its future financial results and ability to develop its business.

54
It may be difficult to effect service of US process and enforce US legal process against the directors of Diageo Diageo is a public limited company incorporated under the laws of England and Wales. The majority of Diageo‟s directors and officers, and some of the experts named in this document, reside outside of the United States, principally in the United Kingdom. A substantial portion of Diageo‟s assets, and the assets of such persons, are located outside of the United States. Therefore, it may not be possible to effect service of process within the United States upon Diageo or these persons in order to enforce judgements of US courts against Diageo or these persons based on the civil liability provisions of the US federal securities laws. There is doubt as to the enforceability in England and Wales, in original actions or in actions for enforcement of judgements of US courts, of civil liabilities solely based on the US federal securities laws. Cautionary statement concerning forward-looking statements
This announcement contains „forward-looking statements‟. These statements can be identified by the fact that they do not relate only to historical or current facts. In particular, forward-looking statements include all statements that express forecasts, expectations, plans, outlook and projections with respect to future matters, including trends in results of operations, margins, growth rates, overall market trends, the impact of interest or exchange rates, the availability or cost of financing to Diageo, anticipated cost savings or synergies, the completion of Diageo‟s strategic transactions and restructuring programmes, anticipated tax rates, expected cash payments, outcomes of litigation and general economic conditions. By their nature, forward-looking statements involve risk and uncertainty because they relate to events and depend on circumstances that will occur in the future. There are a number of factors that could cause actual results and developments to differ materially from those expressed or implied by these forward-looking statements, including factors that are outside Diageo‟s control. These factors include, but are not limited to:
global and regional economic downturns;
increased competitive product and pricing pressures and unanticipated actions by competitors that could impact on Diageo‟s market share, increase expenses and hinder growth potential;
the effects of Diageo‟s strategic focus on premium drinks, the effects of business combinations, partnerships, joint ventures, acquisitions or disposals, existing or future, and the ability to realise expected synergies and/or cost savings;
Diageo‟s ability to complete existing or future business combinations, restructuring programmes, acquisitions and disposals;
legal and regulatory developments, including changes in regulations regarding consumption of, or advertising for, beverage alcohol, changes in tax law (including tax rates) or accounting standards, changes in taxation requirements, such as the impact of excise tax increases with respect to the business, and changes in environmental laws, health regulations and laws governing labour and pensions;
developments in any litigation or other similar proceedings directed at the drinks and spirits industry generally or at Diageo in particular, or the impact of a product recall or product liability claim on Diageo‟s profitability or reputation;
developments in the Colombian litigation, Turkish customs litigation, SEC investigation, Korean customs litigation or any similar proceedings;
changes in consumer preferences and tastes, demographic trends or perceptions about health related issues; or contamination, counterfeiting or other circumstances which could harm the integrity of sales of Diageo‟s brands;
changes in the cost or supply of raw materials, labour and/or energy;

55
changes in political or economic conditions in countries and markets in which Diageo operates, including changes in levels of consumer spending, failure of customer, supplier and financial counterparties or imposition of import, investment or currency restrictions;
levels of marketing, promotional and innovation expenditure by Diageo and its competitors;
renewal of supply, distribution, manufacturing or licence agreements and distribution or licence manufacturing rights on favourable terms when they expire;
termination of existing distribution or licence manufacturing rights on its brands and agency brands;
disruption to production facilities or business service centres, and systems change programmes, existing or future, and the ability to derive expected benefits from such programmes;
technological developments that may affect the distribution of products or impede Diageo‟s ability to protect its intellectual property rights; and
changes in financial and equity markets, including significant interest rate and foreign currency exchange rate fluctuations and changes in the cost of capital, which may reduce or eliminate Diageo‟s access to or increase the cost of financing or which may affect Diageo‟s financial results.
All oral and written forward-looking statements made on or after the date of this announcement and attributable to Diageo are expressly qualified in their entirety by the above factors and those listed under „Risk factors‟ above. Any forward-looking statements made by or on behalf of Diageo speak only as of the date they are made. Diageo does not undertake to update forward-looking statements to reflect any changes in Diageo‟s expectations with regard thereto or any changes in events, conditions or circumstances on which any such statement is based. The reader should, however, consult any additional disclosures that Diageo may make in any documents which it publishes and/or files with the US Securities and Exchange Commission. All readers, wherever located, should take note of these disclosures. The content of the company‟s website (www.diageo.com) should not be considered to form a part of or be incorporated into this announcement. The information in this announcement does not constitute an offer to sell or an invitation to buy shares in Diageo plc or an invitation or inducement to engage in any other investment activities. This announcement includes information about Diageo‟s debt rating. A security rating is not a recommendation to buy, sell or hold securities and may be subject to revision or withdrawal at any time by the assigning rating organisation. Each rating should be evaluated independently of any other rating. Past performance cannot be relied upon as a guide to future performance. Responsibility statements The responsibility statement set out below has been prepared in connection with (and will be set out in) the Annual Report for the year ended 30 June 2010, which will be published on 14 September 2010 (and which can be found thereafter at www.diageo.com). “To the best of the knowledge of each of the directors of Diageo plc: the consolidated financial statements contained in the Annual Report for the year ended 30 June 2010, which have been prepared in accordance with IFRS as issued by the IASB and endorsed and adopted for use in the EU, give a true and fair view of the assets, liabilities, financial position and profit of the group; and the management report represented by the directors‟ report contained in the Annual Report for the year ended 30 June 2010 includes a fair review of the development and performance of the business and the position of the group, together with a description of the principal risks and uncertainties that the group faces.”

56
For further information Preliminary Results Webcast At 09.30 (UK time) on Thursday 26 August, Paul Walsh, CEO and Nick Rose, CFO will present Diageo‟s preliminary results as a webcast. This will be available to view at www.diageo.com. The presentation slides will be available from 08.45 (UK time). The transcript will be available after 11.00 (UK time) and both will be available for download at www.diageo.com. An archived video and podcast of the presentation and Q&A session will also be made available later that day. If you would like to ask a question during the live Q&A session, please use the following dial-in numbers: UK Toll free – 0800 279 9640 North America Toll free – 1866 850 2201 France Toll free – 0805 770 155 Germany Toll free – 0800 673 8355 Ireland Toll free – 1800 944 322 Italy Toll free – 800 976 303 Netherlands Toll free – 0800 265 9174 Spain Toll free – 800 099 797 Switzerland Toll free – 0800 000 287 International – +44 (0)20 3140 0866 Please quote confirmation code: 7412409 A transcript of the Q&A session will be available for download at www.diageo.com on Tuesday 31 August. Results Conference Call Nick Rose, CFO and Deirdre Mahlan, CFO designate will host a conference call for US analysts and investors at 15.00 (UK time) on Thursday 26 August. To participate, please use the following dial-in numbers: UK Toll free – 0800 279 9640 North America Toll free – 1866 850 2201 France Toll free – 0805 770 152 Germany Toll free – 0800 673 8354 Ireland Toll free – 1800 944 322 Italy Toll free – 800 088 737 Netherlands Toll free – 0800 265 9175 Spain Toll free – 800 099 797 Switzerland Toll free – 0800 000 287 International – +44 (0)20 7138 0828 Please quote confirmation code: 6724492 A transcript of the Conference Call will be available for download at www.diageo.com on Tuesday 31 August.

57
Conference Call Replay The conference call will also be available on instant replay from 17.00 (UK time) and will be available until Thursday 9 September 2010. Please use the following dial-in numbers: UK Toll free – 0800 358 7735 North America Toll free – 1866 932 5017 France Toll free – 0800 989 597 Germany Toll free – 0800 673 8348 Ireland Toll free – 1800 932 637 Italy Toll free – 800 088 741 Netherlands Toll free – 0800 265 9180 Switzerland Toll free – 0800 650 003 International – +44 (0)20 7111 1244 Please quote confirmation code: 6724492# Investor enquiries to: Nick Temperley +44 (0) 20 8978 4223
Sarah Paul +44 (0) 20 8978 4326
Kelly Padgett +1 202 715 1110
Media enquiries to: James Crampton +44 (0) 20 8978 4613
Cecilia Coonan +44 (0) 20 8978 2749