Embed Size (px)
Citation preview


ERRATA NOTICE This document is being made available in .PDF format for the convenience of users; however, the accuracy and correctness of the document can only be certified as was presented in the original hard copy format. Inaccuracies in the OCR scanning process may influence text searches of the .PDF file. Light or faded ink in the original document may also affect the quality of the scanned document.

PREIJI}TINARY REPORT O¡¡ GENETIC DIVERSITY OF SOUTHERN
SOUTEEASE ALASKÀ¡Í PIIIK 8AL¡tlON POPUIJATIONS
by
À. J. Gharrett, R. B. l,iliIson, B. I'f. Baker,
C. M. Guthrie III, C. Itl. Kondzela, and H. R. Carlson
Auke Bay Laboratory
Alaska Fisheries Science Center
National Marine Fisheries Service
National Oceanic and At¡nospheric Administration
P.O. Box 210155, Àuke Bay, Alaska 99821
March 1990


iiiABSTRACT
Using protein electrophoresis, genet,ic data $tere
obtained from pink salmon (Oncorhvnchus qorbuscha) collected
from 19 streams in southern Southeast Àlaska in 1987.
Genetic relationships among the collections !'tere examined
from dendrograms and trees constructed from genetic distances
between col-lections, fro¡n principal component analysis of
allelic frequencies, and from log-Iikelihood ratio analysis.
These techniques showed that the populations srere geneticallyquite si¡nilar, but that there was a geographic component
underlying the genetic differences. In particular, western
Prince of !{ales collections tended to cluster together, and
as a group were statistically distinct from collections from
inside waters. Comparisons of these findings to results from
a previous study of British Columbia and Puget Sound pink
salmon showed that although there are many genetic differ-ences between pink salmon stocks from the northern and
southern ends of this range, stocks near the Alaska/BritishColunbia border are quit,e si¡nilar. Genetic data presently
available will be useful for separating northern and southern
pink salmon stocks,' however, more information is needed todetemine whether or not it is possible to distinguish anong
stocks near the border.


v
COtTTENTS
Introduction 1
Mat,erials and Methods. . . . . . . 3
Sanples......3ÀnaIysis. . . .11
Results. . . .L2
Discussion . .23
References....25Àppendix . . .31

ITÛINODUCTION
Pink salmon (oncorhynchus qorbuscha) fisheries in
southeast,ern A1aska and northern British Colu¡rbia intercept
complex mixtures of fish populations which originate in
different countries. Separating the stocks of these fish-
eries is inportant both for managenent and for allocation
under the terms of the Pacific Sahuon Treaty beÈween the
United States and Canada.
If genetic dÍfferences occur among populations (defined
here as an interbreeding group of fish), those differences
often can be used Èo separate or identify populations of
Pacific salmon, and to esti¡nate the contribution of each
population to a nixture (Pella and Milner 1987). In order
to use genetic information for separating or identifyingstocks, each population that is to be identified must possess
distinct genetic characteristics. Either baseline genetic
information must be available for all populations thatpotentially contribute to the mixturer or there must be a
geographic basis for the genetic variation.The first step in applying genetic information to stock
separation is to obtain and analyze baseline infor¡nation frorn
pertinent poputations. À sufficient number nust be sanpled
to verify that, the pattern of genet,ic variation among popula-
tions is related to their geographic distribution.Little genetic work has been done on Southeast Alaskan
pink salnon. Aspinwall (L974) examined only two loci and

2
McGregor (1982) focused primarily on northern Southeast
Àlaskan populations. Both obsen¡ed large differences between
even-year spawning and odd-year spawning populations. In
fact, the genetic differences between pink sal¡non spawning in
consecutive years in the same stream are far more pronounced
than differences between spatialty separaÈed populations
spawning in the same year. This has also been reported by
Johnson (Lg7g) and Beachan et al. (1988). Genetic differ-ences between even- and odd-year fish are a result of the
rigid two-year life cycle (Gilbert 1913i Davidson L934i Roun-
sefell 1958i Anas 1959; Bilton and Ricker 1965i Turner and
Bitton 1968) which reproductively isolates tbe Èwo groups.
The genetic differences between even- and odd-year pink
salmon necessitate developurent of tr,ro separate baselines.
Using starch gel protein electrophoresis, we have con-
ducted a prelirninary investigation of the genetic composition
of southern Southeast Alaskan pink salmon. We inproved upon
and added to techniques originally reported by McGregor
(1982) and Lane (1984) and incorporated suggestions nade by
J. Shaklee of the Washington Department of Fisheries. In
this paper we report prelininary results from a genetic study
of subsamples of collections fro¡n 19 populations of odd-year
pink salnon. our primary objective is to detemine whether
or not the genetic structure of pink salnon populations can
be used for stock separation and identification and, if so,
on nhat geographicaL scale this can be applied.

3
I,ÍATERIÀI.8 I¡TD UETSODS
SampIes
In August and September L987, wê collected tissue sam-
ples of approximately 1OO adult salmon returning to streams
on Prince of Wales Island and Revillagigedo Island and from
streams on the rnainland that drain into Portland Canal, Boca
de Quadra, Beh¡n Canal, Ernest Sound, and East Frederick Sound
(Fig. 1; Table 1). Letters preceding stream names are used
throughout this report for ease of reference to Figure 1.
An eye, the heart, and samples of skeletal muscle and
Iiver from each fish srere packaged in l{hirl-pak1 bags and put
on ice or gel-ice irn¡nediately. They !Íere subsequently frozen
at -2OoC, and shipped to the Àuke Bay Laboratory where they
vrere stored at -85oC until analyzed.
Protein electrophoresis was conducted as described by
Aebersold et al. (1987). As of the writing of this paper,
50-100 of the samples collected for each populat,ion have been
analyzed (Table 1). Buffer systems that rrere used are listed
in Table 2. Specific enzlme activíties (Table 3) were
stained according to Harris and Hopkinson (1976) and by
Aebersold et al. (1.987). Loci for which data were routinely
obtained are listed in Table 4.
lReferenc"National Marine
to trade names does not inplyFisheries Serrrice, NOAA.
endorsement by the

50r------J-------
O Mlles
aO4
km
BehmCanal
\r\
ti\
tfl
ìl
lt
104
-t'.J114
113t
ê,1-,\\
\
\
Boca de OuadraJ t
øl.
oc'clr(úl@ )
)(\l
10g
o(U
C)
7',/'
s
it q\ï6\Jw
101
P
G
Figgre 1.--Sanpling sites for pink salmon in Southeast Alaska- îor- 198i. Letters òorrespond to streans listed inTable 1 and Figures 2, 3' 4 and 5. Alaska Depart-uent of Fish and Gane statistical areas are desig-nated by three-dÍgit codes.

Table 1.--Group designatíon (letters correspond to streamsIisted in Figs. 1-5), location, date of collection,and sizes of pink salmon samples used for electro-phoretic analysis. Districts are Alaska Departmentof Fish and Game Statistical Areas. N = sarnPlesize.
Groupdesign. Location Date
DÍstrict 101--Behn Canal-Port1and Canal-Boca de ouadra
Fish c. 8/26/87lombstone R. 8/L3/87Hidden In1et C. 8/L5/87Hugh Snith R. e/o6/87I{ilson R. 8/L4/87Naha R. 8/L4/87Carroll R. 8/L6/87Herman C. 8/L7/87
50100100
51100
50100100
100100100100
50100
100100
100
District 102--East Prince of !{ales fsland
I. Karta R. 8/L4/87 100
District 103--f{est Prince of Wales fsland-western islands
J.K.L.l-1.N.o.
D
a.
District l07--Ernest Sound-Bradfield Canal
Keete InletCoco HarborBreezy BayPort DoloresPort CalderaTokeen C.
Black Bear C.Anan C.
e /n/ e7e/24/87e/22/87e/25/87e/24/87e/27 /87
8/28/878/LL/87
R.
District 108--Stikine River
North Arm C. 8/Lo/87
District 110--East Frederick Sound
Þ. Sandborn C. 8/oe/87 100

6
Table 2.--Buffer syste¡ns used for electrophoresis ofSoutheast Alaskan pink salmon sanples.
R
TC-1
cA6. 1andc46.8
CAlrlE7.2
TC-4
electrode buffer PH 7.0O. 135 M tris(hydroxymethyl) anino methaneO.o4O l{ citric acid
Gel buffer is a L/zO dilution of electrodebuffer. (Shaw and Prasad 1970) -
gel buffer stock pH 8.5O. 03 M tris(hydroxlanethyl) amino nethaneo.oo5 M citric acid
electrode buffer pH 8.1O.06 M lithiun hYdroxide0.3 M boric acid
GeI buffer is 99t gel buffer stock and 13electrode buffer. (Ridg$¡ay et aI. L97O) -
electrode buffer PH 6.1 or 6.8O.O4 M citric acid
pH is adjust,ed with N-(3-aninopropyl) -norpholineGel buffer is a L/zO dilution of electrode buffer-(Ctayton and Tretiak 1972).
electrode buffer pH 7.2 (rnodified from CA buffers)o.o4 M citric acidO.01 M disodiun ethylenedia¡ninetetraacetate
pH is adjusted with N-(3-aninopropyl) -norpholineGeI buffer is a L/2O diluÈion of electrode buffer.(Aebersold et aI. 1987).
stock solution pH 8.70. 9 M tris (hydroxymethyl) amino methane0.5 M boric acidO.02 M disodiuur ethylenedianinetetraacetate
GeI buffer is a l/2O dilution of stock.Electrode buffer is a 1/5 dilution of stock.(lifarkert and Faulhaber 1965) .
electrode buffer pH 5.8O.223 M tris (hydroxynethyl) anino methane0.086 M citric acid
titrate with 10 l.f sodiu¡n hydroxideGel buffer is a L/27.5 dilution of electrodebuffer. (buffer rr¿rr of Schaal and Anderson L974) -
ge1 and electrode buffer pH 8.5 (used undiluted)O.248 M tris (hydroxyrnethyl) amino methaneO.L92 M glycÍne
(Holmes and Masters 1970).
l.fF
TG

7
Table 3.--Enzymes initialty screened,(8.C. ) numbers (IUBNC 1984) ,Peptidases are designated by
their Enzyrne Conmissionand abbreviations.substrate.
EnzlnneE. C.Nunber Abbreviation
b-N-AcetyI ga I acto s eamin idas eN-Acetyl -b -glucosaminidas eAcid phosphataseAconitate hydrataseAdenosine deaminaseAdenylate kinaseAlanine aminotransferaseÀspartate aninotransferaseCreatine kinaseCytachrome B, reductaseEsterase, Esterase-DFrrrctose-biphosphate aldolaseFu¡narate hydrataseGalactose-l-phosphate uridyl
transferaseGlucosephosphate isomeraseb-GlucuronidaseGlyceraldehyde- 3 -phosphate
dehydrogenaseGlycerol-3 -phosphate dehydrogenaseGlutathione reductaseGuanine deaminaseHexokinaseHydroxyacylglutathione hydrolaseIsocitrate dehydrogenaseLactate dehydrogenaseLactoyl-glutathione lyasellalate dehydrogenaseMalic enzymea-MannosidaseMannose-6-phosphate isomerasePepÈidase
glycyt-leucine activityleucyl-gtycyl-glycine activityleucyl-leucine activityphenylalanyl-prol ine activity
Phosphogluconutase6-Phosphogluconate dehydrogenasePhosphoglycerate kinasePurine nucleoside phosphorylaseþznrvate kinaseSorbitol dehydrogenaseSuperoxíde disrnutaseTriose phosphate isomerase
3.2.1.533 .2.1. 303.L.3.24.2.t.33.5.4.42.7 .4.32.6.L.22.6.L.L2.7 .3.2L.6.2 .23.1.1.*4.1.1.134.2.L.2
2.7 .7 .L25.3.1.93.2.1.31
r.2.L.L21. 1. 1.8L.6 .4 .23.5.4 . 32.7 .L.L3.1.2.61. 1 . L.42L.L.L.274.4.1.51. 1. 1. 371. 1. 1.403.2.L.245.3.1.83.4. *. *
5.4.2.21. 1. L.442.7 .2.32.4 .2.L2.7 .1.401. 1. 1. 141. 15. 1. 15.3.1.1
bGÀI,ÀbGAACPAHÀDAAKÂ,I,ÀTAÀTCKCYBRE!, EST-pFBALDFH
GALTGPIbGUS
GÀPG3PGRGDÀHEXHÀGHIDHLDHIÆLMDHMEMÀNMPI
PEP (GL)PEP (TGG)PEP (LLIPEP (PP)PGMPGDHPGKPNPPKSDHsoDTPI

Table 4.--protein coding loci (May t-g8o) for enzymes resolved in this study and thetissues and buffers in úni"n tney were resolved. Peptidase loci are desig-nated according to their substrat,e specificity. The buffers are designatedby the acronymé given in fable 2. L = liverr H = heartr M = muscler E = eye.
Enzlme Locus Tissue BufferLevel of
variabilityg
Àconitate hydratase
Àdenosine deaminase
Alanine aminotransferase
Aspartate aminotransferase
Creatine kinase
Cytachrome B reductase
Fumarate hydratase
Glucosephosphate isomerase
LH,MH,M
l¡frErHÌ!Í, ErH
u
M,HLH,MEL,H
E
H,M
M, EH,M, EM,H
M,H
cÀ6.8, TC4TCTTC4TCTTC4
cÀ6. 1cA6.1
MF
TC, CAI{87.2TC, CAI{87.2TCRcN{87 .2,TC
RRR
TCA ,TC, CAIrlE7.2
TC4
33rr4
34
Àf-a'E' 4
33344
332
MME
RRR
233
Glycerol-3 -phosphate dehydrogenase cA6.1,CAME?.2,MF

Table 4.--Continued
Enz¡me focus Tissue BufferLevel of
variabitityâGlutathione reductase
Guanine deaminase
Hydroxyacylglutathione hydrol ase
Isocitrate dehydrogenase
Lactate dehydrogenase
l,talate dehydrogenase
Malic enzlme
l,lannose-6-phosphate isomerase
Peptidases
Grc E,H
L
LrMrE
H,MH,ML
t{MHrErUL,EE
LrHrEM,H,E
M,H
H
uM,H, EM,EM,HM,H
M,H
R, TC4 , TC
TG, CÀ6.8
cÀl,tE7 .2,TG
TC,TC4TCTTC4cAI.tET .2,CA6.8,TC4
RRRRR
CAME7.2,CA6.1,TC4cA6.lrMF
cÀ6.1rTC
UF
MFR, MFTCrMFMF, RMF,CN,!E7.2,RrTC
R
3
Lr4
4
324
32332
34
3
3
23434
4
Gda"d
Pep IGIì
Pep lPo-1Pep lPp-2 )
Phosphoglucomutase Pcm-2bd
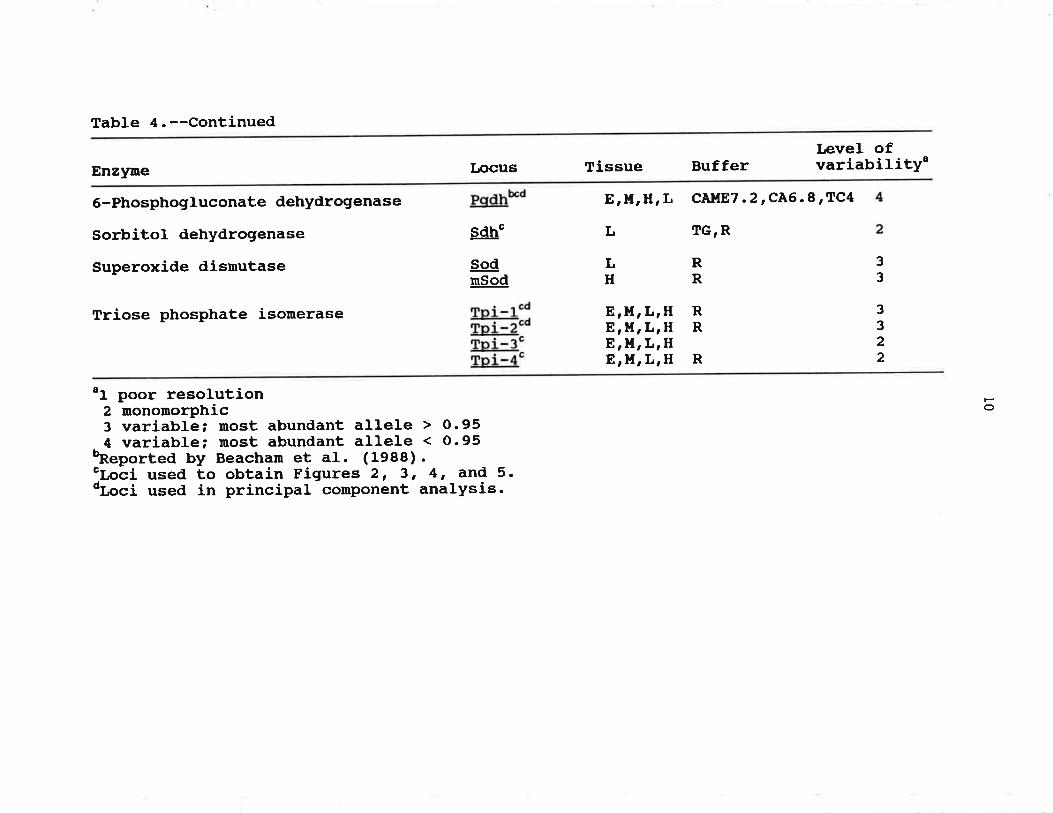
Table 4.--Continued
Enz¡me Locus Tissue BufferLevel ofvariabilitya
6-Phosphogluconate dehydrogenase
Sorbitol dehydrogenase
Superoxide dis¡nutase
Triose phosphate isomerase
Erl.lrH,L CAt{87 .2 tCA6.8rTC4
gêÞ"
SodmSod
L
LH
TG, R
RR
RR
R
33
Erl,f , LrHE,M, L,HErUrLrHErlf , LrH
3322
"1 poor resolution2 mononorphic3 variable; most abundant allele4 variable; most abundant allele
heported by Beacha¡n et aI. (1988)lr,oci used to obtain Figures 2, 3,dr..ci used in principat component
4, and 5.analysis.
Fo

11
Analysis
Departure from Hardy-I{einberg expectations was examined
r¡ith chi-square goodness-of-fit tests. Homogeneity of
altelic frequencies among collections vtas examined using 1og-
likelihood ratio analysis (G-test, Soka1 and Rohlf 198L).
Pooling of genotypic or allelic frequencies eliminated
classes with expected values less than four.
Variation at co-nigrating duplicated loci (terned
isoloci by ÀIlendorf and Thorgaard L984) was treated as if
all the variability appeared at one locus and the other was
nonomorphic (Gharrett and Thomason 1987).
Relationships among collections were examined in three
ways: 1) unweight,ed pair-group arithnetic average clustering(UPGMA, Sneath and Sokal L973) of Rogersr unmodified (L972)
and nodified (Wright 1978) genetic distances and of Nei's
(1972, L978) genetic distance, 2) principal component
analysis of the arcsine-square root transformed frequencies
of the alleles that were nost co¡nmon at each locus (Wilkinson
1986), and 3) maxinum-Iikelihood evolutionary trees
(Felsenstein L973, 1984). ReLationships based on geograph-
ical proximity erere also examined using hierarchical log-likelihood ratio analysis (Sokal and Rohlf 1981).

T2
RESULTS
rnitially, stains for 41 different enzynat'ic activities
were tested (Table 3). fnterpretable banding patterns were
resolved, with 26 of the stains and 52 putative biochemical
Ioci and isoloci (Allendorf and Thorgaard 1984) identified(Table 4). Data were routinely obtained f,or 42 loci and
three pairs of isoloci (Àppendix Table À). of these loci, I
were monomorphic in atl populations examined. Rare variants
at seventeen other loci and two pair of isoloci ttere seen in
only a few of the collections. Thirteen loci and one pair of
isoloci had substantial variability with the common allelepresent at a frequency of less than 0.95. The four rernaining
Iocir ¡nA}:!]!.r Gpí-2, Pep(l,qcl-1ì, and Me-l had relatively Iow
levels of variability (frequency of conmon allele generally
played some regionality in the variation. Tests forconformity of phenotypic frequencies to Hardy-Weinberg
expectations did not fail in 64 possible tests.
Guanine deaninase (Gda) was variable in all collections
and had 5 or more alleles. Unfortunately, it was quite
diffi-culÈ to reliably distinguish arnong the relativelyinfrequent, fast alleles. Therefore, analyses presented
herein use only the three most common alleles: Gda100, @"',and gdê12ó; the faster alleles were pooled with cda12ó.

13
Allelic frequency data for 48 loci Ìtere used to examine
genetic relationships among the collections. UPGMA cluster-
ing of Neirs unbiased genetic distances (L978) shows that
nany of the collections are essentially indistinguishable
(Fig. 2) . Some of the genetic differences observed, however,
seem t,o have a geographic basis. with the exception of the
collection from Breezy Bay, the collections from western
PrÍnce of I{ales Island (District 103) cluster together. the
collections from Her¡nan Creek on Behm Cana1 and from Hidden
Inlet on Portland Canal cluster with Prince of llales Island
collections rather than with other inland waters ones. How-
ever, divergences among most of these collections are small.
T"r¡o collections, Black Bear Creek in Ernest Sound and
Anan Creek in Bradfield Canal (District J-O7), differed some-
what fron all other collections. The difference in the
collection from Black Bear Creek is attributable primarily to
high variation at !g!þ!. Greater variaÈÍon at Àda-2 and Gpi-
f account for much of the difference in the Anan Creek
collection.
Dendrograms produced frorn UPGMA clustering of Rogersl
genetic distance (L972) and Wrightrs (1978) nodification of
RogersI distance erere sinilar to the one constructed from
Neirs distances (Fig. 3). The sinilarity among western
Prince of l{ales Island collections and the apparent
difference between the Anan Creek and Black Bear Creek
collections and the others are shown. It is ínt,erestÍng

14
Anan Creek
Black Bear Creek
Tokeen Creek
Herman Creek
Coco Harbor
Keete lnlet
Port Dolores
Port Caldera
Karta River
Hidden lnlet
Sandborn Creek
Naha River
North Arm Creek
Wilson River
Tombstone River
Carroll River
Hugh Smith River
Fish Creek
Breezy Bay
o.oo 1o 0.0008 0.0006 0.0004 0.0002 0.0000
Nei's genetic distance
Figure 2.--Dendrcgram constructed fron Neits (1972, 1978)unbiased genetic distances for data fron 48 loci.The UPGl,lA algorithm (Sneath and Soka1 L973) wasused to obtain the dendrogram. Heterogeneitybetween two branches joined at a node.;wasdetermined by log-likelihood ratios (-- P > 0.01).
o
P
o
H
K
J
M
N
I
c
S
F
R
E
B
G
D
A
L

Anan Creek O
Black Bear Creek P
Tokeen Creek O
Herman Creek H
Coco Harbor K
Port Dolores M
Port Caldera N
Keete lnlet J
Karta Rlver I
Hldden lnlet C
Sandborn Creek S
Wllson Rlver E
North Arm Creek R
Naha Rlver F
Tombstone Rlver B
Carroll Rlver G
Hugh Smlth Rlver D
Flsh Creek A
Breezy Bay L
**
Anan Creel< O
Black Bear Creek P
Tokeen Creek O
Herman Creek H
Coco Harbor K
Keete lnlet J
Port Dolores M
Port Caldera N
Karta Rlver I
Hldden lnlet C
Naha Rlver F
North Arm Creek R
Sandborn Creek S
Tombstone Rlver BCarroll Rlver G
Hugh Smlth Rlver D
Flsh Creel< A
Breezy Bay L
Wllson Rlver E
I
o.o20
I
o.o 10
I
o.ooo
Rogers' genet¡c distanceo.o5 0.o4 0.o3 0.o2 0.o 1 0.oo
Rogers' modified genet¡c distance
Figure 3.--Dendrograms constructed from Rogerst (1-972l- genetic distance (feft) andfrom nodified (Wright 1978) Rogersr distances (right) for data from 48Ioci. The UPGMÀ algorithm (Sneath and Sokal 1973) was used to obtainthe dendrogram. Heterogeneity between two branches joined at a node wasdetermined by log-likelihood ratios ( P < O.o1 and P < 0.001).

16
that the dendrograms produced fro¡n the different genetic
distances differ in detail, but are generally sinilar. It
should be reiterated that the overall differences amongl
collectíons is small.
The uraximum-Iikelihood tree (Felsenstein t973, 1984)
produced from Cavalli-sforza and Edvardsr (1967) chord
distances shows Some of the clustering of western Prince of
Ilales fsland populations, but it does not clearly show
genetic relationships that indicate a geographic basis
(fig. 4). Àlternative topologies produced by Felsensteinrs
atgorithn differed in minor rearrangements of branches or
linbs, but were quite sÍnrilar to the one shown.
Principal component analysis was also used to examine
the genetic variability among collections. only loci at
which variability exists are useful for this analysis i 37 of
the 48 loci studied were used. The proportions of the total
variability accounted for by the first six principal compo-
nents were 0.135, O.I24, O.L02' 0.095, 0.083, and o.O'76,
respectively. These results indicaÈe that the variability is
not attributable to only one or a few loci, but that many of
the loci contribute. of these first six principal comPo-
nents, only the first and the fourth separated the collec-
tions according to geographic relationships (Fig. 5). The
fourth principal component had the strongest relationship to
geographic distribution. The loci contributing most strongly
to the fourth principal component were Gpi-3, Gpi-2 and

T7
Pcrnr- 2. None of these loci has a large amount of genetic
variability, but little of the variability obsen¡ed in the
GPI loci was seen in the western Prince of I{ales Island
collections. In addition, the Pgnr-2 variabilíty is somewhat
lower in the western Prince of Wales Island populations.
The first principal component does not have as strong a
geographic relationship as the fourth. The loci weighted
most heavily in the first principal component were (in
descending order) nAh-3, Àat-1.2, Àa.t,-{, Pep(Ll-lì , and
9È,8L. The first two of these loci have little variability,and that appears equally distribut,ed among the geographic
areas. AaÈ-4 appears to be somewhat less variable in Prince
of l{ales Is}and populations, and the variation of the other
loci is not remarkably different between coastal and inside
water stream systems.
The snall geographic component that appears to underlie
the genetic variability was further examined using log-
likelihood ratio analysis (Table 5). Because Alaska Depart-
ment of Fish and Game statistical areas (Fishing Districts)have a geographic basis, heterogeneity within and among
Fishing Districts nas analyzed. Onty the collections from
District LO7 (Ànan and Black Bear Creeks) showed heterogen-
eity (P < 0.01) within an area. This heterogeneíty was due
largely to Gda, PeplLI-lì, and Ada-2.
Karta River on the east side of Prince of t{ales Island
(Dlstrict 102) could be included with collections from either

18
Black Bear Cr.
Anan Cr.
Sandborn Cr.Wilson R.
Karta R.Hugh
Smith R.Carroll R. Fish Cr.
Coco Harbor
Breezy BayKeete lnlet
North Arm Cr.
Port CalderaPort Dolores
Herman Cr.Tombstone R.
Hidden lnlet
rrTr[,lrlrl.l.l0 0.001 0.002 0.003
Genetic distance
Figure 4.--Maxinr¡m-Iikelihood tree (Felsenstein L973' 1984)estinated from genetic distances (Cavalli-sforzaand Edwards 1967).
Tokeen Cr.

otPrince
of Wales
S
villagi
B
A
c
R
o
Re
0
\t+tÊ,ocoCL
Eoo-ñ.goc
t-l-À
-1 \o
-1 0Principal component 1
Figure 5.--Principal component analysis of Southeast Alaskan pink salmon allelic- frequeñcy datá. Letters correspond to streams in Table I and Fig. 1.Circled letters within aggregations indicate collections not geograph-icatty associated with the aggregation.

20
Table 5.--Log-likelihood analysis of electrophoretic datafrom SoutheaèÈ Alaskan pink salmon populations.Cotlections within fishing 4istricts are in Fig. 1
and Table 1. ('P < o.o5 aría bg < o.o1).
Fishing Districts Sumnary 9-statistics
101-LO2
108-110 t{ithin Among TotalLocus
Àat-4
Gda
rdh-3
Aat-3
Cvbr-1
Pqdh
G3pdh-1
Peo lLl-l)
Pep lPp-2'|
Pcm-2
Ada-2
Mdh-3 .4
Total
103 107
11.518
20.66L6
13.28168.17I
10.01I
10.78I
9.20I
13 .80I
13.56165. 01I
8.40I
3 .93I
3 .465
9.9410
14.31103.36
53.64
53 .90
59.55
58.49
56.89105.34
53.81
52.L5
5
2.48 0.0311
8.774 1.4022
2.LL 3.7722
0.04 0.8811
1. 08 2.3411
L.7 4 0. 4611
1. 19 0.2311
6.604 0.2111
0.91 2.L622
o.92 0.7611
6.95e O.6711
0.28 0.0711
17.9015
39.3730
33.7230
14.1115
L7.9415
L6.7815
18.7015
2g .64e15
22.OO30
L4.5215
19.18157.3015
2.603
LO.796
7.L56
2.023
5.483
3.183
7.373
2.753
8. 386
3.013
10.8143
1. 073
20.5LL8
50. 1736
40 .8736
16. 1418
23 .4218
L9.9618
26. 0718
31.39418
30.3836
L7 .5218
29.ggat88.3618
L28.29 74.85L20 75
32.g7b L2.9615 15
64.63a3 L4.77445 270
250.L4225

2t
$testern Prince of Wales (District 103) or southern inside
waters (District L0l-) without producing het,erogeneity.
However, District 103 collections were significantlydifferent from District 101 collections [G = 36.61 (18 df);p = 0.0061. Since Karta River is geographically closest Èo
District 101, they vrere pooled together for subsequent
analysis. Heterogeneity among geographical areas (Fishing
Districts) was primarily due to Ada-2, but the heÈerogeneity
was not strong (e < 0.05).
The genetic composition of collections from inland
waters of southern Southeast A1aska (Districts 101 and 102)
and from western PrÍnce of l{ales IsIand (District 103) were
compared to compositions of aggregations of pink salmon
populations fron British Colu¡nbia and Puget Sound (Beacharn et
aI. 1988) . Felsensteinrs (L973, 1984) naxinum-likelihood
tree was constructed usÍng the L7 loci for which data was
reported in all Canadian and Washington regions3 Me-.!, Mdh-
L,2, Mdh-3,4, Pqdh, Gpi-l, Gpi-2, Gpi-3, Idh-5, Idh-l, Aat-3,
G3pdh-1, &.2., PeplPp-2ì, Pep(Log-l), and Pcnn-2 (Fiq. 6).
the tree indicates that genetic similarities among the
different regions examined are strongly influenced by the
geographic distributions of the regions. Aggregations of
pink salmon collections from the northern boundary areas
(southern Southeast ÀIaska, Skeena River, and northern and
central British Columbia) cluster together closely, as do
Fraser River and Puget Sound aggregations fro¡n the southern

22
W. Prince of Wales lsland
lnside watersS. SE Alaska
North/centralBritish Columbia
Skeena River
S. British Columbia
Puget Sound
Fraser River
f-frl'
0 0.001l'l'l'l
0.002 0.003
Genetic distance
FÍgure 6.--Maxinum-Iikelihood tree (Felsenstein L973, 1984)estimated from genetic distances (Cavalli-Sforzaand Edwards L967) using summar'lz data for BritishColunbia and Rrget Sound pink salmon (Beacham etal. 1988) and from southern Southeast Alaska pinksalmon.

23
end of the range. The northern and southern ends are quiÈe
distinct from each other. The aggregation of collections
from southern British Colunbia falls between the two, but issonewhat closer to the Fraser River and Puget Sound aggrega-
tions. Differences among northern aggregations are not large
but are statistícally significant.
DIsCI'88ION
Clearly, extreme northern and southern pink salmon
stocks can be distinguished by their genetic differences
(Fig. 6). This concept was applied by the Pacific Salmon
Commission in 1989. The Conmission used our data reported
here along with data obtained from a parallel, unpublished
study of southern stocks by the Washington Department of
Fisheries to esti¡nate interception of Fraser River pink
salmon in northern and southern fisheries.On a finer scale, a means for discrininating between
stocks near the northern British Colunbia and southern
Southeast Alaska border is still needed. Although statisti-cally significant differences rdere observed among geographi-
cal areas near the border, the actual genetic differences
were small. Three explanations could account for the
si¡rilarities amonçt stocks in that area: 1) the populations
nere established relatively recently from common ancestors,
2) substantial gene flow (straying) occurs among pink saLmon
populations, or 3) convergent selection has occurred.

24
I{e are presently trying Èo achieve additional resolution
of pink salmon stocks near the border by: obtaining data
from additional locii increasing the nunber of populations
sanpledi completing analysis of samples already collected;
and collecting even-year stocks. I{e now routinely obtain
data fron 6 additÍonal loci (Àat-4, cvbr-l, Hacrh, Idh-3'
pep(Ll-lì, and Gda) which are quite variable. (AaÈ-4 and
Cvbr-l are both heavily weighted in the first principal
component, which was one of the two components that indicated
a geographic basis for genetic differences among southern
Southeast Alaska collections. ) Additional populations were
sa¡npled in 1989 to extend the geographical range for which we
have genetic information to central Southeast Alaska and
Northern British Colu¡nbia, and to increase the number of loci
for which we have data in Canadian stocks. Analysis of the
renaning samples in each collection will increase the power
of statistical analysis. Also, analysis of even-year (1988)
samples of pink salmon stocks collected near the Alaskan/
Canadian border wiLl aLlow us to examine possible genet'ic
differences between the reproductively isolated even- and
odd-year pink salmon.

25
REFERENCES
Àebersold, P. 8., c. A. I{inans, D. J. Teel, G. B. Milner, and
F. l{. Utter. L987. Manual for starch gel electro-
phoresis: a method for the detection of genetic
variation. U.S. Dep. Commer., NOAA Tech. Rep. lf!'tFs 6L.
Àllendorf, F. I,il., and G. H. Thorgaard. 1984. Tetraploidy
and the evolution of salmonid fishes. In B. J. Turner
(editor), Evolutionary genetics of fishes, p. 1-53.
Plenum Press, Nerú York.
Anas, R. E. 1959. Three-year-old pink sal¡non. J. Fish.
Res. Board Can. 16:9L-92.
Aspinwall, N. L974. Genet,ic analysis of North American
populations of the pink salnon, Q¡çggtrynchus, grorbuscha,
possible evidence for the neutral nutation-random drift
hlpothesis. Evolution 28:295-305.
Beacham, T. D., R. E. I{ithler, C. B. Murray, and L. W.
Barner. 1988. Variation in body size, morphology, egg
size, and biochernical genetics of pink salmon in British
Coluubia. lrans. An. Fish. Soc. LI7:109-126.
Bilton, H. T., and I{. E. Ricker. 1965. Supplenentary checks
on the scales of pink salmon (oncorhynchus gorbuscha)
and chum salmon (O. keta). J. Fish. Res. Board can.
222L477-1489.

26
Cavalli-Sforza, L. L., and A. W. F. Edwards. L967. Phylo-
genetic analysis: models and estimation procedures.
Evolution 21:550-570.
Clayton, J. W., and D. N. Tretiak. L972. A¡rino citrate
buffer for pH control of starch gel electrophoresis. J.
Fish. Res. Board Can. 29:1169-LI72.
Davidson, F. À. 1934. The honing instinct and age at
naturity of pink salnon (oncorhvnchus cforbuscha). u.s.
Natl. Mar. Fish. Sen/., Fish BulI. 48227-39.
Felsenstein, J. 1973. lfaximu¡u-Iikelihood estirnation of
evolutionary trees from continuous data. Àn- J. Hum.
Genet. 25247L-492.
Felsenstein, J. 1984. The statisticat approach to inferring
evolutionary Èrees and what it tells us about, parsimony
and compatibility. In T. Duncan and T. F. Sturssy
(editors), Cladistics: Perspectives in the reconstruc-
tion of evolutionary history, p. 169-191. Colunbia
Univ. Press, New York.
Gharrett, À. J., and M. À. Thomason. L987. Genetic changes
in pink salmon (Oncorhvnchus gorbuscha) fotlowing their
introduction into the Great Lakes. Can. .J. Fish. Aquat.
sci. 442787-792.
27
Gilbert, C. H. 1913. Age at rnaturity of the Pacific coast
salrnon of the genus Oncorhynchus. U.S. Nat1. Mar. Fish.
Senr., Fish. BulI. 32zL-22.
Harris, H., and D. A. Hopkinson. L976. Handbook of enzyme
electrophoresis in human genetics. Ànerican Elsevier
Pubt. Co., New York.
Holmes, R. S., and C. J. Masters. 1970. Epigeneticinter-
conversion of the multiple for¡¡s of mouse Iiver
catalase. FEBS Letters 11:45-48.
IUBNC (International Uníon of Biochenistry, Nomenclature
Couunittee). 1984. Enzlnne nomenclature 1984. Academic
Press, Orlando, Florida. 646 p.
Johnson, K. R. L979. Genetic variation in populations of
pink salmon (Oncorhvnchus qorbuscha) from Kodiak Is1and,
Alaska. Masterrs Thesis, Univ. t{ashington, Seattle,
94 p.
Lane, S. 1984. The irnplernentation and evaluation of a
genetic ¡nark in a hatchery stock of pink salmon
(Oncorhvnchus gorbuscha) in SouÈheast Alaska. Masterrs
Thesis, Univ. Àlaska Juneau, Juneau. 107 p.
Markert. C. L., and I. Faulhaber. 1965. Lactate
dehydrogenase isozyme patterns of fish. J. Exp. ZooI.
159:319-332.

28
May, B. 1980. The salmonid genome: evolutionary restruc-
turing following a tetraploid event. Ph.D. Thesis,
Pennsylvania State Univ., University Park, 2:.6 p.
McGregor, À. J. L982. A biochenical genetic analysis of
pink salmon (oncorhvnchus cforbuscha) fro¡n selected
streams in northern SoutheasÈ Àlaska. Masterrs Thesis,
Univ. Alaska Juneau, Juneau, 94 P.
Nei, I'f. L972. Genetic distances between populat,ions. Arner.
Nat. 106:283-292.
Nei, M. 1978. Estimation of average heterozygosity and
genetic distance from a small nu¡nber of individuals.
Genetics 89:583-590.
Pella, J. J., and G. B. Milner. 1987. Use of genetic marks
in stock cornposition analysis. In N. Ryman and F. UtÈer
(editors), Population genetics and fishery management,
p. 247-276. Univ. Washington Press, Seattle.
Ridgrway, G. J., S. w. Sherburne, and R. D. Lewis. 1970.
Potymorphísms in the serum esterases of AÈlantic
herring. Trans. À¡û. Fish. Soc. 99:147-151.
Rogers, J. L972. Measures of genetic si¡nilarity and genetic
distance. Studies in Genetics VfI. Univ. Texas Publ.
72L3:145-153.

29
Rounsefell, G. À. 1958. Ànadrony in North American Salmon-
idae. U.S. Fish l{ildl. Senr., Fish. 8u11. 58:t-7L-185.
Schaal, B. 4., and I{. W. Anderson. L974. An outlj-ne of
techniques for starch gel electrophoresis of enzymes
from the A¡¡erican oyster Crassostrea virginica Gme1in.
Georgia Marine Science Center Tech. Rep. 74-3.
Shaw, C. R. , and R. Prasad. L97O. Starch ge1 electro-phoresis of enzymes - a compilaÈion of recipes.
Biochem. Genet . 42297-32O.
Sneath,
I{.
El
H.
S., and R. R. Sokal . L973. Numerical taxonorny.
Freenan and ConpâDy, San Francisco. 57 3 p.
Sokal, R. R., and F. J. Rohlf. 1981. Biometry, 2nd edition.W. H. Freeman and Cornpêhy, New York, 859 p.
lurner, C. 8., and H. T. Bilton. 1968. Another pink salmon
(Oncorhvnchus qorbuscha) in its third year. J. Fish.
Res. Board Can. 25:1993-1996.
I{ilkinson, L. 1986. SYSTAT: the systern for statistics.SYSTAT, Inc., 1800 Sherman Ave., Evanston, IL 6020l_.
I{right, s. L978. Evolution and the genetics of popurations,
vol. 4, Variability within and among naturalpopulations. Univ. Chicago press, Chicago, S7g p.


APPENDIX


33
Table À.--Biochenical genetic variation in collections ofpink salmon sanpled from drainages in SoutheastÀlaska in 1987. ÀIlelic frequencies and collectionsizes (N) for biochemical genetic loci. Allelesare designated by their nobiliÈy relatíve to themost conmon allele (100).
Drainage
Aat-l,2
N 100 89
Àat-3
N 100 85
District 101--Behm Canal-Port1and Canal-Boca de ouadra
A. Fish C.B. Torubstone R.C. Hidden InletD. Hugh SnithE. Wilson RF. Naha R.G. Carroll R.H. Herman Cr.
J. Keete InletK. Coco HarborL. Breezy Bay!1. Port DoloresN. Port CalderaO. Tokeen C.
P. Black Bear C.a. Anan C.
R. North Àrm C.
0.99 0.011.00 01.00 00.99 0.011.00 00.99 0.010.99 0.011.00 0
0.81 0.19o.7 4 0.260.71 0.29o.7 6 0.24o.82 0.18o.7 6 0.240.70 0.300.84 0.16
5040405140514039
4938405040514040
District 102--East Prince of Wales Island
I. Karta R. 40 1.00 0 40 0.74 0.26
District 103--West Prince of Vlales fsland-western islands
District 1O7--Ernest Sound-Bradfield Cana1
37 1.00 038 1.00 048 0.99 0.0139 1.00 048 0.99 0.0t40 1.00 0
36 1.00 040 1.00 0
36 0.78 0.2238 0.83 0. 1758 0.84 0.1639 0.81 0.1949 0.82 0.1840 0.7s o.25
39 0.78 0.2239 0.79 0.21
District lO8--Stikine River
39 1.00 0 40 0.80 0.20
District 110--East Frederick Sound
S. Sandborn C. 40 1.00 40 0.7 4 0.26

34
Table A. --Cont,inued
Drainage
Aat-4
N 10O slow
District 101--Behm Canal-Portland Canal-Boca de Ouadra
A.B.c.D.E.F.(t.
H.
00000000
49 0.56 0.4440 0.65 0.3539 0.59 0.4149 0.52 0.4840 0.58 0.4248 0.49 0.5140 0.51 0.4940 0.69 0.31
50 1.0040 1.0040 1.0052 1.0040 1.0051 1.0040 1.0040 1.00
50 0.99 0.0140 0.99 0.0140 0.98 0.o252 1.00 040 1.00 051 1.00 040 1.00 040 1.00 0
District 102--East Prince of l{ales Island
I. 38 0.57 0.43 40 1.00 40 1.00 0
District 103--f{est Prince of !{ales Island-western islands
J.K.L.M.N.o.
P.Q.
404054404740
0.60 0.400.66 0.340.54 0.46o.62 0.380.61 0.39o.62 0.38
40 1.0040 1.0059 1.0040 1.0048 1.0040 1.00
40 1.0040 1.00
40 0.99 0.0140 1.00 060 1.00 040 0.99 0.0150 1.00 040 0.99 0.01
40 1.00 040 1.00 0
000000
District l07--Ernest Sound-Bradfield Canal
38 0.57 0.4340 0.69 0.31
0o
R.
s.
District lO8--Stikine River
40 0.56 0.44 40 0.99 0.01 40 0.98 0.02
District 110--East Frederick Sound
40 0.58 0.42 40 0.99 0.01 40 1.00 0

35
Table A.--Continued
Ada-1
Drainage N 100 slow
Afi-1
100 115 87 75
District 101--Behm Canal-Portland Canal-Boca de ouadra
A.B.c.D.E.F.lJ.
H.
50 1.0040 0.9940 1.0052 1.0040 1.0047 1.0040 1.0040 1.00
00
0. 0100000
00. 01
000000
50 1.0039 0.9939 0.9952 0.9940 1.0051 1.0040 1.0040 1.00
00.01
00. 01
0000
50 1.00 040 0.99 0.0140 1.00 052 0.99 0.0140 1.00 049 0.99 0.0140 1.00 040 1.00 0
District 102--East Prince of Wales Is1and
I. 40 1.00 0
District 1O3--t{est
40 1.00 0 0 40 1.00 0
Þri nca of !ùa'l es Tsl and-western i sl ands
J.K.L.l.t.N.o.
D
Q.
40 1.00 040 0.99 0.0160 1.00 040 1.00 050 1.00 040 1.00 0
40 1.00 040 1.00 0
40 1.00 0 040 1.00 0 0
40 1.00 040 1.00 0
40 1.00 0 0 40 1.00 040 1.00 0 0 40 1.00 058 1.00 0 0 57 0.99 0.0139 1.00 0 0 40 0.99 0.0150 1.00 0 0 50 0.99 0.0140 1.00 0 0 40 0.99 0.01
District l07--Ernest Sound-Bradfield Cana1
R.
DÍstrict lO8--Stikine River
40 1.00 0 40 0.98 0.01 0.01 39 0.96 0.04
District 110--East Frederick Sound
S. 40 1.00 40 1.00 40 0.98 0.02

36
Tab1e A.--Continued
Drainage N
Ada-2
100 87 113
G3pdh-1
100 200 L75 L20
A.B.c.D.E.F.l.t .
H.
50 0.83 0.1739 0.97 0.1340 0.94 0.0649 0.92 0.0840 0.86 0.1449 0.87 0.1340 0.88 0.1139 0.91 0.09
50 0.83 0.1740 0.88 0.L240 0.94 0.0652 0.88 0.L240 0.88 0.L251 0.91 0.0940 0.84 0. 1640 0.89 0.11
000000
0. 010
00000000
00000000
District 102--East Prince of l{ales Island
I. 40 0.91 0.09 40 0.92 0.08
J.K.L.M.N.o.
D
Q.
40 0.91 0.09 040 0.92 0.08 060 0.88 0.L2 040 0.91 0.09 050 0.90 0.10 040 0.95 0.05 0
39 0.90 0.10 040 0.74 0.26 0
40 0.88 0.L2 0 040 0.81 0.19 0 0
40 0.8840 0.8960 0.8840 0.9250 0.9340 0.98
o.L2 0 00.10 0.01 0o.L2 0.01 00.08 0 00.07 0 00.02 0 0
District l07--Ernest Sound-Bradfield Canal
District 108--Stikine River
R. 40 0.89 0.11 0 40 0.86 0.10 0.01 0.02
District 110--East Frederick Sound
s. 40 0.92 0.08 40 0.89 0.11

37
Table À.--Continued
Drainage N
nÀh-4
100 115 85
Alat
100 LL279 87
DistrÍct 101--Behm Canal-Portland Canal-Bqca de ouadra
À.B.
D.E.F.ls.H.
J.K.L.M.N.o.
P.a.
4840405140514040
0.91 0 0.030.98 0.02 00.98 0.01 00.93 0 0.020.96 0.01 0.020.96 0.02 0.010.98 0.01 0.011.00 0 0
0. 060
0.010.05
00.01
00
5040395140514040
0.91 0.060.99 0.010.92 0.01o.92 0.01o.92 0.01o.97 0.020.98 0.020.99 0.01
0. 030
0.070. 070. 060. 01
0o
I.
District 102--East Prince of Wales Island
40 1.00 0 0 40 0.94 0.02 0.04
District 103--I{est Prince of Wales Island-western islands
40 0.98 0 0.o2 039 0.95 0.01 0.04 056 0.95 0.01 0.02 0.0340 0.99 0.01 0 050 0.98 0 0 0.0240 0.98 0.02 0 0
40 0.92 0. 04 0. 0440 0.99 0.01 060 0.92 0.04 0.0440 1.00 0 050 0.97 0 0.0340 0.96 0.01 0.02
40 0.99 0.01 040 0.95 0.04 0.01
District lO7--Ernest Sound-Bradfield Canal
4038
0.960.99
0 0.01 0.020 0.01 0
R.
s.
District 108--stikine River
40 0.98 0 0.01 0.01 40 0.99 0.01 0
District 110--East Frederick Sound
40 0.99 0 0.01 0 40 0.99 0.01 0

38
Table A.--Continued
Drainage N
ck-2
N 100 L20
Gr-1
N 100 fastck-1
100 80
District 101--Behm Canal-Portland Canal-Boca de Ouadra
A.B.
D.E.F.tJ.H.
00000000
49 1.00 040 0.99 0.0140 1.00 050 0.99 0.0140 1.00 050 1.00 040 1.00 040 1.00 0
49 1.0040 1.0039 1.0051 1.0040 1.0050 1.0040 1.0040 1.00
50 1.00 040 1.00 040 1.00 050 1.00 040 1.00 047 1.00 040 1.00 040 1.00 0
District 102--East Prince of Wales Island
I. 40 0.99 0.01 40 1.00 0 30 1.00 0
District 1O3--West Prince of f{ales fsland-western islands
J.K.L.M.N.o.
D
Q.
40 1.00 040 1.00 060 1.00 040 1.00 043 0.99 0.0140 1.00 0
40 1.00 040 0.99 0.01
40 1.0040 1.0060 0.9940 1.0043 1.0040 1.00
40 1.0040 1.00
40 1.00 038 1.00 054 1.00 039 1.00 050 0.99 0.0140 1.00 0
39 1.00 040 1.00 0
00
0.01000
District 1O7--Ernest Sound-Bradfield Canal
00
R.
District 1O8--Stikíne River
40 0.99 0.01 40 1.00 40 1.00 0
District 110--East Frederick Sound
s. 40 1.00 40 1.00 40 1.00

39
Table A.--Continued
Drainage N
Cybr-1
100 L20 80
Haoh
100 r27 136L42
District 101--Behm Canal-Portland Cana1-Boca de Ouadra
District 102--East Prince of Wales Island
r. 40 0.91 0.16 0.02 40 0.98 0.o2 0
District 103--l{est Prínce of Wales fsland-western islands
A.B.c.D.E.F.(r.H.
J.K.L.M.N.o.
P.Q.
50 0.85 0.14 0.01 040 0.85 0.11 0.04 040 0.88 0.12 0.00 050 0.74 0.18 0.07 0.0139 0.77 0.22 0.01 051 0.78 0.15 0.06 0.0140 0.84 0.14 0.02 039 0.86 0.11 0.01 0.01
40 0.86 0.10 0.0440 0.86 0.11 0.0240 0.79 0. 16 0.0540 0.85 0.14 0.0150 0.87 0.10 0.0240 0.89 0.05 0.06
38 0.79 0.18 0.03 038 0.86 0.11 0.04 0
50 0.96 0.04 040 0.96 0.04 039 1.00 0 052 0.95 0.05 040 0.98 0.02 051 0.99 0.01 040 0.96 0.04 040 0.99 0.01 0
40 0.92 0.06 0.0140 0.95 0.05 054 0.96 0.04 040 1.00 0 049 0.99 0.01 040 0.99 0.01 0
40 0.98 0.0240 1.00 0
0000
0. 010
District 1O7--Ernest Sound-Bradfield Canal
00
R.
District lO8--Stikine River
39 0.82 0.15 0.03 0 40 0.96 0.04
District 110--East Frederick Sound
s. 37 0.72 0.22 0.07 40 0.95 0.05

40
Table À.--Continued
Drainage N
Gda
100 rL7 L26 136 L42
rdh-1
N 100 35
District 101--Behm Canal-Portland Canal-Boca de ouadra
District 102--East PrÍnce of l{ales Island
40 0.38 0.40 0.19 0.02 0.01 40 1.00 0
District 103--I{est Prince of I{ales fsland-western islands
r.
A.B.
D.E.F.tJ.H.
J.K.L.l,f.N.o.
P.a.
49 0.41 0.47 0.12 0 039 0.36 0.49 0.05 0.05 0.0540 0.38 0.51 0.05 0.05 0.0152 0.35 0.43 0.2r 0.01 039 0.47 0.32 0.06 0.L2 0.0351 0.45 0.40 0.11 0.04 040 0.38 0.48 0.15 0 040 0.28 0.49 0.14 0.10 0
39 0.37 0.41 0.15 0.05 0.0140 0.36 0.40 0.16 0.06 0.0152 0.43 0.42 0.11 0.03 0.0140 0.44 0.39 0.08 0.02 0.0850 0.45 0.36 0.19 0 040 0.31 0.39 0.19 0.10 0.01
0.37 0.35 0.15 0.10 0.030.46 0.44 0.08 0.02 0
50 1.O0 040 1.O0 036 0.99 0.0152 0.99 0.0140 1.00 051 1.00 040 1.00 040 1.00 0
40 0.99 0. 0l-39 1.00 058 0.99 0.0139 1.00 048 1.00 040 1.00 0
40 1.0040 1.00
District 1O7--Ernest Sound-Bradfield Canal
0o
3940
40R.
District 108--Stikine River
0.46 0.40 0.11 0 0.o2 39 1.00
DisÈrict 110--East Frederick Sound
s. 40 0.41 0.49 0.09 0.01 0 40 1.00

4L
Table A.--Continued
Drainage N
epi-z
100 130 33 -33
Gpi-3
100 90 110
District 101--Behn Canal-Portland CanaL-Boca de ouadra
District 102--East Prince of l{ales fsland
I. 40 0.98 0 0.02 40 0.98 0.02 0
District 103--West Prince of Wales IsI@
A.B.
D.E.F.G.H.
J.K.L.u.N.o.
D
Q.
49 0.99 0.01 0 0400.98000.0240 1.00 0 0 052 0.99 0 0 0.0140 0.98 0 0.01 0.0151 0.99 0 0.01 040 0.99 0 0.01 0401.00000
50 0.98 0.01 0.0140 0.99 0 0.0140 0.98 0.01 0.0152 0.99 0 0.0140 1.00 0 051 0.98 0 0.0240 0.99 0.01 040 1.00 0 0
40 1.0040 0.99 0.60 1.0040 1.0050 0.9940 1.00
40 0.9940 1.0060 1.0040 1.0050 1.0040 1.00
39 0.9940 0.95
000000000000
0 0.010 0.05
40 1.0040 0.98
000 0.02
0001 000000 0.0100
0.0100000
District lO7--Ernest Sound-Bradfield Cana1
00
40R.
District 108--Stikine River
1.00 0 0 0 400.990.01District 110--East Frederick Sound
s. 40 0.99 0 0.01 40 1.00 0

42
Table À.--Continued
Drainage N
rdh-3
1OO LzO 130 150 slow
Pep (Log-l)
N 100 L25 140
District 101--Behm Canal-Portland Canal-Boca de Ouadra
A.B.c.D.E.F.ls.H.
J.K.L.l.f.N.o.
P.o.
404058404840
50 0.63 0.30 0.0740 0.65 0.29 0.0640 0.68 0.24 0.0950 0.67 0.25 0.0840 0.64 0.25 0.0951 0.77 0. 16 0.0740 0.68 0.20 0.L240 0.66 0.28 0.06
40 0.71 0.26 0.02 0 039 0.63 0.31 0.05 0.01 0
50 0.97 0.03 040 0.98 0.02 040 1.00 0 051 0.99 0.01 040 1.00 0 051 1.00 0 040 0.98 0.01 0.0140 0.99 0.01 0
40 0.99 0.01 040 0.99 0.01 060 0.98 0.02 040 0.98 0.02 050 0.99 0.01 040 1.00 0 0
40 0.99 0.0140 1.00 0
0000
0.02000
00000000
District 102--East Prince of f{ales Island
40 0.69 0.26 0.05 40 1.00 0 0
0.55 0.31o. 64 0.220.68 0.230.60 0.320.70 0.270.69 0.25
0. 120. 110.090.080.030.06
0 0.010.01 0
00000000
District lO7--Ernest Sound-Bradfield Canal
00
District 108--Stikine River
R. 40 0.79 0.18 0.04 0 0 40 0.99 0.01
District 110--East Frederick Sound
S. 40 0. 65 0.29 0.06 0 0 40 0.99 0.01

43
Table A.--Continued
rdh-1
Drainage N 100 fastrdh-3
100 160
rdh-4
100 L20
District 101--Behm Canal-Portland Canal-Boca de ouadra
À.B.
D.E.F.(t.
H.
J.K.L.llf.N.o.
t)
o.
50 1.0040 1.0040 1.0052 1.0040 1.0011 1.0040 1.0040 1.00
40 1.00 040 0.99 060 1.00 040 1.00 050 1.00 040 1.00 0
40 0.84 0.1640 1.00 0
40 1.0040 1.0039 1.0040 1.0050 1.0040 1.00
40 1.0039 1.00
50 1.0040 0.9940 1.0052 1.0040 1.0051 1.0040 1.0040 1.00
40 1.00 040 1.00 039 1.00 040 1.00 050 1.00 040 1.00 0
40 0.99 0. 0r_40 0.99 0.01
00000000
50 1.0040 1.0040 1.0052 1.0040 0.9951 1.0040 1.0040 1.00
00. 01
000000
0000
0.01000
District 102--East Prince of !{ales Island
I. 40 0.99 0.01 40 1.00 40 1.00 0
District 103--West Prince of I{ales Island-western islands
000000
District 107--Ernest Sound-Bradfield Cana1
00
R.
s.
District 108--Stikine River
40 1.00 0 40 1.00 0 40 1.00
District 110--East Frederick Sound
38 1.00 40 1.00 40 1.00
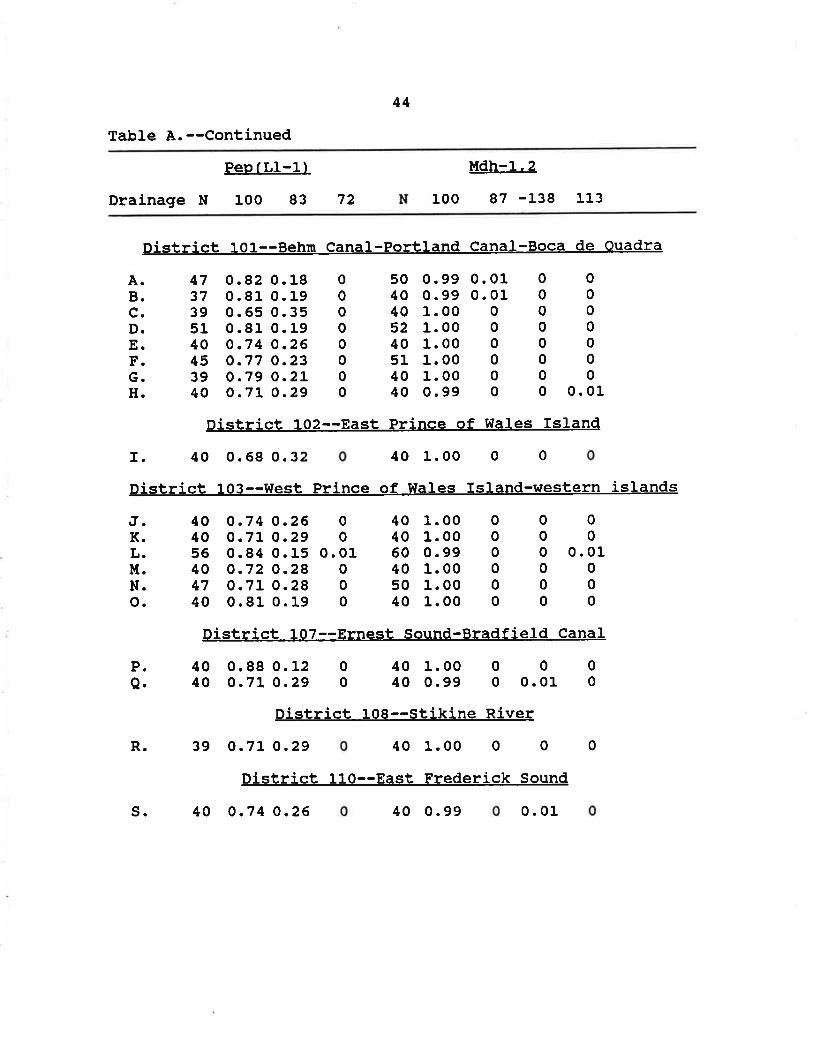
44
Table A.--Continued
PeP lLl-lì
Drainage N 100 83
Mdh-l.2
100 87 -138 11372
District 101--Behm Canal-Port1and Canal-Boca de Ouadra
A.B.
D.E.F.tr.H.
J.K.L.¡{.N.o.
P.Q.
47 0.82 0.1837 0.81 0.1939 0.65 0.3551 0.81 0.1940 0.74 0.2645 0.77 0.2339 0.79 0.2L40 0.71 0.29
40 0.74 0.2640 0.71 0.2956 0.84 0.1540 0.72 0.2847 0.71 0.2840 0.81 0.19
50 0.99 0.0140 0.99 0.0140 1.00 052 1.00 040 1.00 051 1.00 040 1.00 040 0.99 0
00000000
00000000
0000000
0. 01
District 102--East Prince of t{ales IsLand
I. 40 0.68 0.32 40 1.00 0 0
District 103--West Prince of l{ales Island-western islands
40 0.88 0.L240 0.71 0.29
401.0000040 1.00 0 0 0600.99000.01401.00000501.00000401.00000
40 1.0040 0.99
00
0.01000
District l07--Ernest Sound-Bradfield Canal
00
0000 0.01 0
R.
s.
District 108--stíkine River
39 0.71 0.29 401.00000
District 1lO--East, Frederick Sound
40 0.7 4 0.26 40 0.99 0. 01

45
Table À.--ConÈinued
Mdh-3 .4
67 vfastFh
100 fastDrainage N 100 130 8068
District 101--Behm Canal-Portland Canal-Boca de ouadra
A.B.c.D.E.F.tr.H.
J.K.L.M.N.o.
P.a.
50 0.8940 0.9240 0.9152 0.8940 0.9151 0.9240 0.9540 0.94
0.08 0.020.05 0.020.06 0.020.06 0.050.04 0.050.03 0.050.02 0.020. 02 0. 02
0.01 0000000000000o o.01
00000000
49 1.00 040 1.00 040 1.00 052 1.00 040 1.00 051 0.99 0. 0r.40 1.00 040 1.00 0
40 1.00 038 1.00 060 1.00 039 1.00 050 1.00 040 1.00 0
District 102--East Prince of Wales fsland
I. 40 0.94 0.01 0.05 30 1.00 0
District 103--West Prince of ffales Island-western islands
40 0.89 0.05 0.06 0 040 0.92 0.01 0.05 0.01 060 0.88 0.08 0.04 0 040 0.90 0.05 0.02 0 0.0150 0.90 0.04 0.05 0 0.0140 0.94 0.04 0.o2 0 0
40 0.89 0.02 0.0840 0.91 0.06 0.02
40 0.89 0.05
District
000
0. 0100
Distríct 1O7--Ernest Sound-Bradfield Canal
19 ':90 -:District lO8--Stikine River
0.06 0 0 0 40 1.00 0
1l0--East Frederick Sound
0 0.01 0000
R.
S. 40 0.90 0.02 0.06 0.01

46
Table A.--Continued
Drainage N
nltfe-1
100 130 70
Pcrm-2
N -100 -50
Dístrict 101--Behm Canal-Portland Canal-Boca de Ouadra
A.B.
D.E.F.|J.
tt.
J.K.L.
47
Table À.--Continued
Drainage N
Mpi
100 115
Pgdh
10085 95 90 104
District 101--Behm Canal-Portland Canal-Boca de ouadra
À.B.
D.E.F
(t.
H.
J.K.L.l.t.N.o.
P.a.
50 0.99 0.01 0 50401.000038401.00003952 1.00 0 0 5040 0.99 0.01 0 4051 0.99 0.01 0 51401.00004040 0.99 0.01 0 40
0.93 0.06 0.01 0o.92 0.08 0 00.86 0.12 0.03 00.94 0.06 0 00.84 0.15 0.01 0o.88 0.11 0.01 00.89 0.10 0.01 00.86 0.11 0.O2 0
District 102--East Prince of $lales Island
r. 40 0.98 0.02 0 40 0.94 0.06 0 0
District 103--I{est Prince of l{ales Island-western islands
40 1.00 0 0 40 0.85 0.10 0.04 0.0138 0.99 0 0.01 40 0.88 0.08 0.05 060 0.99 0.01 0 58 0.91 0.06 0.03 039 1.00 0 0 40 0.89 0.10 0.01 048 1.00 0 0 50 0.93 0.05 0.o2 039 1.00 0 0 39 0.89 0.08 0.04 0
DisÈrict 1O7--Ernest Sound-Bradfíeld Canal
40 1.00 0 040 0.99 0.01 0
37 0.95 0.05 0 040 0.89 0.10 0.01 0
40R.
District l08--Stikine River
1.00 0 0 40 0.84 0.11 0.05
District 110--East Frederick Sound
40 0.99 0.01 40 0.88 0.12a

48
Table A.--Continued
Sod-1
Drainage N 100 276
District 101--Behm Canal-Portland Canal-Boca de ouadra
A.B.
D.E.Fl.t .
H.
J.K.L.¡1l .N.o.
D
Q.
49 1.00 0 50 1.0040 0.98 0.o2 40 0.9940 1.00 0 40 1.0052 1.00 0 50 1.0040 0.99 0.01 40 1.0051 1.00 0 51 1.0040 1.00 0 40 1.0040 1.00 0 40 1.00
50 1.00 01 40 1.00 0
40 1.00 050 0.99 0.0140 0.99 0.0151 1.00 040 0.99 0.0140 1.00 0
00.0
000000
District 102--East Prince of l{ales Is1and
I. 40 1.00 0 39 1.00 0 40 1.00
District 103--l{est Prince of Wales fsland-western islands
40 1.0040 1.0060 1.0040 1.0049 1.0040 1.00
40 1.00 040 1.00 0
0 40 1.000 40 1.000 60 1.000 40 1.000 50 1.000 40 1.00
40 1.0040 1.00
0 40 1.000 40 1.000 60 1.000 40 1.000 50 1.000 40 1.00
40 1.0040 1.00
000000
District 1O7--Ernest Sound-Bradfield Canal
00
00
R.
District 108--Stikine Ríver
40 1.00 0 40 1.00
District 110--East Frederick Sound
s. 40 1.00 0 40 1.00 0 40 1.00

49
Table A.--Continued
PeP (PE¡-l)
Drainage N 100 110
Pep lPp-2 ì
100 109 93
nSod
100 L7
District 101--Behn Canal-Portland Canal-Boca de ouadra
A.B.c.D.E.F.G.H.
J.K.L.M.N.o.
50 0.9940 1.0039 1.0052 1.0040 1.0051 1.0040 1.0040 1.00
0.010000000
50 0.66 0.19 0.1540 0.68 0.18 0. L540 0.70 0.16 0.1452 0.64 0.17 0.1840 0.51 0.2L 0.2850 0.65 0.19 0.1640 0.72 0.L2 0.1540 0.65 0.20 0.15
o.72 0. 16 0. 110.75 0.18 0.080.68 0.18 0.140.64 0.18 0.170.69 0.16 0.150. 66 0.24 0. 10
s0 0.99 0.01
l: '_30 _:
??':90 -951 1.00 039 1.00 039 L.00 0
1.00 01.00 01.00 0t:30
-:
District 102--East Prince of Wales Island
I. 40 1.00 39 0.68 0.2L 0. 1.5
District 103--West Prince of l{ales fsland-western islands
40 1.0040 1.0060 1.0040 1.0050 1.0040 1.OO
000000
404060385040
386037
:'_
District 1O7--Ernest Sound-Bradfield Canal
P.Q.
4040
1.00 01.00 0
40 0.70 0.16 0.1440 0.76 0.L2 0.11 39 1.00 0
R.
District lO8--stikine River
40 1.00 0 40 0. 61 0.2t 0. 18
District lLo--East Frederick Sound
s. 40 1.00 0 40 0.70 0.20 0.10 10 0.95 0.0s

50
Table A.--Continued
Sample sizes of monomorPhic loci
DrainageSdhck-sGpi-l ldh-2 ldh-2 ldh-s Tpi-3 tpi-¿ PeplGl-1)
District 101--Behm Canal-Portland Canal-Boca de Ouadra
40I.
District 102--East Prince of l'la1es Island
40 40 40 40 40 40 40 40
District 103--West Prince of !{ales Island-western islands
A.B.
D.E.F.tJ.H.
J.K.L.llf.N.o.
P.a.
5038394638514039
403959404739
4038
5040365240514040
403958394840
5040405240114040
404060405040
5040405040514040
404059404940
5040405040514040
403860405040
5040405040514040
403860405040
5040405240514040
403955404940
4040
5040405040504040
5040405240514040
39 4039 4059 6040 4047 5031 40
District lO7--Ernest Sound-Bradfield Cana1
40 3940 40
40 40 40 40 4040 40 39 40 40
R.
40e
District 108--Stikine River
37 40 40 40 40 40 40 40 40
District 110--East Frederick Sound
39 40 40 40 40 40 40 40