Embed Size (px)
Citation preview

Preliminary Evaluation Results
SIGNIFICANT FINDINGS AND EVENTS (from their October, 2007 semi-annual report)
Findings are presented by workshop type. Tools for both types of workshops—Working with Drug-Abusing Families and Cognitive Behavioral Therapy with Substance-Abusing Families— are designed to collect data immediately prior to workshop commencement (pre-test of knowledge), immediately following each workshop presentation (post-test of knowledge and the workshop satisfaction survey), and about 90 days post-workshop (follow-up postcard surveys).
WORKING WITH DRUG-ABUSING FAMILIES
Background: David Love presented 8 RURAL workshops entitled Working with Drug-Abusing Families (WWDAF) in the following locations during the 2006-07 project year: Crescent City, Bakersfield, Visalia, Susanville, Kings Beach, Auburn, Fairfield, and Napa. Participation levels in the workshops and completion of evaluation instruments is presented in Table 6.
Table 6: Completion of Evaluation Instruments at WWDAF Workshops Offered 2006-07
Workshop
Location
Type of Work-shop
Total
# Who Attended
Workshop
# Who Completed
Satisfaction Survey
% Who Completed Satisfaction
Survey
# Who
Completed Pre-test AND
Post-test
% Who
Completed Pre-test AND
Post-test
CrescentCity WWDAF 63 51 81% 48 76%
Bakersfield WWDAF 55 52 95% 53 96%
Visalia WWDAF 70 55 79% 48 69%
Susanville WWDAF 47 41 87% 39 83%
KingsBeach WWDAF 43 41 95% 38 88%
Auburn WWDAF 61 56 92% 58 95%
Fairfield WWDAF 55 45 82% 36 65%
Napa WWDAF 39 35 90% 30 77%
TOTAL WWDAF 433 376 87% 350 81%
When completing evaluation instruments, participants are asked to indicate their professional field. Responses are optional, and those participants from each workshop who provided
CA Sonoma CWT Rural report 2-12-08 1

responses to this question are noted in Table 7, as are aggregate findings (final column) reflecting responses from all workshop participants.
Table 7: Professional Fields of WWDAF Workshop Participants, 2006-07
Professional
Field
Crescent City
(n=45)
Bakers-field
(n=50) Visalia
(n=44)
Susan-
ville
(n=36)
Kings
Beach
(n=37)
Auburn
(n=55)
Fair-
field
(n=34)
Napa
(n=30)
ALL
Sites
(n=331)
Non-profit / CBO 20% 22% 34% 25% 11% 13% 47% 43% 25%
Social worker / MSW / SW intern
29% 52% 39% 19% 27% 20% 12% 30% 29%
Substance abuse specialist
4% 6% 2% 17% 5% 4% 21% 3% 7%
Family support / Outreach
7% 4% 9% 14% 16% 18% 6% 10% 11%
DV advocates / DV shelters
-- -- 5% 3% 16% 4% -- -- 3%
Educators 11% -- -- 3% 3% 15% -- 7% 5%
Mental health 7% 4% 2% -- 14% 4% 6% 7% 5%
Health care 2% 12% 7% 3% 3% 20% -- -- 7%
Law enforcement -- -- -- 6% 3% -- 9% -- 2%
Other 20% -- 2% 11% 3% 4% -- -- 5%
Presenter/s at These Workshops: David Love
Evaluation Methodology—Satisfaction Surveys: Participants were surveyed following each workshop and asked to assess the quality and applicability of the workshop, the effectiveness and responsiveness of presenters, the value of the materials provided, and the quality of the facility in 8 questions based on a 5-point Likert scale in which a rating of "1" indicates poor and "5"
CA Sonoma CWT Rural report 2-12-08 2

excellent. Table 8 presents a summary of the mean, or average, scores to each of the survey questions, with 5.0 being the highest possible score and 1.00 the lowest.
Table 8: Satisfaction Survey Mean Scores
Survey Question
Crescent
City
10/18/06
(n=51)
Bakers-
field
11/6/06
(n=52)
Visalia
11/13/06
(n=55)
Susan-
ville
4/23/07
(n=41)
Kings
Beach
4/24/07
(n=41)
Auburn
4/25/07
(n=56)
Fair-
field
6/5/07
(n=45)
Napa
6/6/07
(n=35)
All Work-shops
(n=376)
1. Overall workshop rating
4.61 4.77 4.65 4.46 4.83 4.75 4.78 4.89 4.73
2. Organization / flow of process
4.63 4.71 4.49 4.54 4.88 4.71 4.80 4.83 4.69
3. Extent info met my professional nds
4.86 4.71 4.62 4.40 4.80 4.64 4.82 4.82 4.68
4. Overall facilitator/
presenter rating
4.90 4.83 4.75 4.78 4.95 4.93 4.89 4.94 4.86
5. Presenter effectiveness in conveying ideas
4.84 4.85 4.84 4.76 4.95 4.95 4.87 4.83 4.87
6. Presenter responsiveness to participants
4.36 4.75 4.67 4.73 4.88 4.85 4.87 4.89 4.80
7. Value and usefulness of written materials
4.12 4.73 4.62 4.43 4.68 4.55 4.80 4.86 4.62
8. Overall facility rating
4.61 4.47 4.75 4.08 4.59 2.96 4.11 4.60 4.18
Rating scale: 1=poor, 2=fair, 3=good, 4=very good, 5=excellent
Mean scores regarding every one of the survey questions 1 through 7 at all eight workshop sites easily exceeded the goal of 4.0, ranging from 4.12 to 4.95—scores that are very high and correlate with ratings approaching excellence. Survey question 8 asks participants to rate the facility where the workshop was held. At all but one event, mean scores exceeded 4.0. The facility in Auburn drew a lower mean score of 2.96. This is a very rural area with limited choices
CA Sonoma CWT Rural report 2-12-08 3

in training spaces. All aggregate mean scores for the 8 events exceeded the goal of 4.0, ranging from 4.18 to 4.86, as illustrated below in Graph 1.
Graph 1
Questi
on 1
Questi
on 2
Questi
on 3
Questi
on4
Questi
on 5
Questi
on 6
Questi
on 7
Questi
on 8
Aggregate Mean Scores to 8 Post-Workshop Satisfaction Survey Questions, 2006-07
4. 7 3 4. 6 9 4. 6 8 4. 8 6 4. 8 7 4. 8
4. 6 2
4. 1 8
3. 8 4
4. 2 4. 4 4. 6 4. 8
5
5-po
int L
iker
t sca
le(G
oal:
4.0
or b
ette
r)
Aggregate M ean Scores
Pre- and Post-Test Results
Prior to the start of each workshop and again at the end, participants are asked to complete brief assessments of knowledge. A 13-question pre- and post-assessment is used in the WWDAF workshops. The percentage of correct responses at pre-testing is compared to the percentage at post-testing for each survey question in the following tables regarding each of the 8 WWDAF workshops offered in 2006-07 (Tables 9 through 16). Findings for individual workshops are followed by aggregate findings for all WWDAF workshops (Tables 17, 18, and 19).
Table 9: CRESCENT CITY Pre- and Post-Test Responses
Survey Question
Crescent City / WWDAF
% Correct *Chg
% Pt Pre
Post
1. All of the following are depressants except…nicotine. 52% 67% +15
2. Which of the following statements is true…many activities change brain chemistry including exercise, meditation, alcohol use, and watching a scary movie.
4% 23% +19
3. Which words best describe the key concepts of drug addiction…craving 65% 77% +12
CA Sonoma CWT Rural report 2-12-08 4

and tolerance
4. Which of the following statements is true…alcohol causes more prenatal problems than other drugs.
73% 90% +17
5. The amount of toxic waste created in producing 1 lb. of methamphetamine…5-6 lbs.
8% 23% +15
6. Which of the following statements regarding prenatal exposure is true…behavioral problems are strongly related to prenatal stimulant drug exposure.
2% 65% +63
7. Constant stress affects the early brain development of children in all of the following aspects except…slowing development of all parts of the brain.
17% 13% +4
8. Which of the following is not a potential problem area measured by the Addiction Severity Index (ASI)…educational status.
46% 73% +27
9. The Trauma Symptom Checklist is suitable for children of what age…8 to 16.
19% 65% +46
10. The critical components of cognitive-behavioral therapy (CBT) are: all of the above.
46% 54% +8
11. Symptoms of methamphetamine use does not include…nausea, dyspepsia.
48% 63% +15
12. The concept of harm reduction involves all of the following except…abstinence from drug and alcohol use.
42% 56% +14
13. Prevention, intervention, and counseling community resources available to caretakers of traumatized children include…all of the above.
73% 94% +21
*Change in percentage points when comparing percentage of correct responses at pre-assessment to percentage of correct responses at post-assessment.
At the Crescent City WWDAF workshop (Table 9), increases in knowledge ranging between 12 and 63 percentage points were seen in response to 10 of the 13 survey questions at post-testing in.
Table 10: BAKERSFIELD Pre- and Post-Test Responses
Bakersfield / WWDAF
Survey Question % Correct *Chg
% Pt Post Pre
CA Sonoma CWT Rural report 2-12-08 5

1. All of the following are depressants except…nicotine. 64% 85% +21
2. Which of the following statements is true…many activities change brain chemistry including exercise, meditation, alcohol use, and watching a scary movie.
6% 53% +47
3. Which words best describe the key concepts of drug addiction…craving and tolerance
64% 93% +29
4. Which of the following statements is true…alcohol causes more prenatal problems than other drugs.
72% 98% +26
5. The amount of toxic waste created in producing 1 lb. of methamphetamine…5-6 lbs.
25% 93% +68
6. Which of the following statements regarding prenatal exposure is true…behavioral problems are strongly related to prenatal stimulant drug exposure.
2% 55% +53
7. Constant stress affects the early brain development of children in all of the following aspects except…slowing development of all parts of the brain.
8% 19% +11
8. Which of the following is not a potential problem area measured by the Addiction Severity Index (ASI)…educational status.
40% 91% +51
9. The Trauma Symptom Checklist is suitable for children of what age…8 to 16.
19% 83% +64
10. The critical components of cognitive-behavioral therapy (CBT) are: all of the above.
45% 68% +23
11. Symptoms of methamphetamine use does not include…nausea, dyspepsia.
57% 94% +37
12. The concept of harm reduction involves all of the following except…abstinence from drug and alcohol use.
25% 47% +22
13. Prevention, intervention, and counseling community resources available to caretakers of traumatized children include…all of the above.
62% 79% +17
*Change in percentage points when comparing percentage of correct responses at pre-assessment to percentage of correct responses at post-assessment.
At the Bakersfield WWDAF workshop (Table 10), increases in knowledge ranging between 11 and 68 percentage points were seen in response to each of the 13 survey questions at post-testing.
Table 11: VISALIA Pre- and Post-Test Responses
CA Sonoma CWT Rural report 2-12-08 6

Survey Question
Visalia / WWDAF
% Correct *Chg
% Pt Pre
Post
1. All of the following are depressants except…nicotine. 40% 81% +41
2. Which of the following statements is true…many activities change brain chemistry including exercise, meditation, alcohol use, and watching a scary movie.
2% 33% +31
3. Which words best describe the key concepts of drug addiction…craving and tolerance
56% 88% +32
4. Which of the following statements is true…alcohol causes more prenatal problems than other drugs.
79% 98% +19
5. The amount of toxic waste created in producing 1 lb. of methamphetamine…5-6 lbs.
42% 94% +52
6. Which of the following statements regarding prenatal exposure is true…behavioral problems are strongly related to prenatal stimulant drug exposure.
2% 35% +33
7. Constant stress affects the early brain development of children in all of the following aspects except…slowing development of all parts of the brain.
23% 17% (6)
8. Which of the following is not a potential problem area measured by the Addiction Severity Index (ASI)…educational status.
56% 81% +25
9. The Trauma Symptom Checklist is suitable for children of what age…8 to 16.
10% 79% +69
10. The critical components of cognitive-behavioral therapy (CBT) are: all of the above.
52% 56% +4
11. Symptoms of methamphetamine use does not include…nausea, dyspepsia.
52% 92% +40
12. The concept of harm reduction involves all of the following except…abstinence from drug and alcohol use.
31% 54% +23
13. Prevention, intervention, and counseling community resources available to caretakers of traumatized children include…all of the above.
75% 88% +13
*Change in percentage points when comparing percentage of correct responses at pre-assessment to percentage of correct responses at post-assessment.
CA Sonoma CWT Rural report 2-12-08 7

At the Visalia WWDAF workshop (Table 11), increases in knowledge ranging between 4 and 69 percentage points were seen in response to 12 of the 13 survey questions at post-testing. A decrease of 6 percentage points was seen in response to 1 survey question (question 7).
Table 12: SUSANVILLE Pre- and Post-Test Responses
Susanville / WWDAF
Survey Question % Correct *Chg
% Pt Pre
Post
1. All of the following are depressants except…nicotine. 67% 82% +15
2. Which of the following statements is true…many activities change brain chemistry including exercise, meditation, alcohol use, and watching a scary movie.
0% 33% +33
3. Which words best describe the key concepts of drug addiction…craving and tolerance
62% 85% +23
4. Which of the following statements is true…alcohol causes more prenatal problems than other drugs.
90% 97% +7
5. The amount of toxic waste created in producing 1 lb. of methamphetamine…5-6 lbs.
31% 87% +56
6. Which of the following statements regarding prenatal exposure is true…behavioral problems are strongly related to prenatal stimulant drug
exposure.
8% 46% +38
7. Constant stress affects the early brain development of children in all of the following aspects except…slowing development of all parts of the brain.
18% 15% (3)
8. Which of the following is not a potential problem area measured by the Addiction Severity Index (ASI)…educational status.
54% 87% +33
9. The Trauma Symptom Checklist is suitable for children of what age…8 to 16.
21% 80% +59
10. The critical components of cognitive-behavioral therapy (CBT) are: all of the above.
49% 80% +31
11. Symptoms of methamphetamine use does not include…nausea, dyspepsia.
62% 95% +33
12. The concept of harm reduction involves all of the following except…abstinence from drug and alcohol use.
31% 59% +28
13. Prevention, intervention, and counseling community resources available to caretakers of traumatized children include…all of the above.
77% 87% +10
CA Sonoma CWT Rural report 2-12-08 8

*Change in percentage points when comparing percentage of correct responses at pre-assessment to percentage of correct responses at post-assessment.
At the Susanville WWDAF workshop (Table 12), increases in knowledge ranging between 7 and 59 percentage points were seen in response to 12 of the 13 survey questions at post-testing. A decrease of 3 percentage points was seen in response to 1 survey question (question 7).
Table 13: KINGS BEACH Pre- and Post-Test Responses
Kings Beach / WWDAF
Survey Question % Correct *Chg
% Pt Pre
Post
1. All of the following are depressants except…nicotine. 55% 79% +24
2. Which of the following statements is true…many activities change brain chemistry including exercise, meditation, alcohol use, and watching a scary movie.
3% 50% +47
3. Which words best describe the key concepts of drug addiction…craving and tolerance
50% 97% +47
4. Which of the following statements is true…alcohol causes more prenatal problems than other drugs.
84% 95% +11
5. The amount of toxic waste created in producing 1 lb. of methamphetamine…5-6 lbs.
47% 100% +53
6. Which of the following statements regarding prenatal exposure is true…behavioral problems are strongly related to prenatal stimulant drug
exposure.
5% 68% +63
7. Constant stress affects the early brain development of children in all of the following aspects except…slowing development of all parts of the brain.
26% 29% +3
8. Which of the following is not a potential problem area measured by the Addiction Severity Index (ASI)…educational status.
50% 84% +34
9. The Trauma Symptom Checklist is suitable for children of what age…8 to 16.
18% 82% +64
10. The critical components of cognitive-behavioral therapy (CBT) are: all of the above.
68% 87% +19
11. Symptoms of methamphetamine use does not include…nausea, dyspepsia.
40% 79% +39
12. The concept of harm reduction involves all of the following except…abstinence from drug and alcohol use.
40% 74% +34
CA Sonoma CWT Rural report 2-12-08 9

13. Prevention, intervention, and counseling community resources 84% 97% +13 available to caretakers of traumatized children include…all of the above.
*Change in percentage points when comparing percentage of correct responses at pre-assessment to percentage of correct responses at post-assessment.
At the Kings Beach WWDAF workshop (Table 13), increases in knowledge ranging between 3 and 64 percentage points were seen in response to each of the 13 survey questions at post-testing.
Table 14: AUBURN Pre- and Post-Test Responses
Survey Question
Auburn / WWDAF
% Correct *Chg
% Pt Pre
Post
1. All of the following are depressants except…nicotine. 38% 69% +31
2. Which of the following statements is true…many activities change brain chemistry including exercise, meditation, alcohol use, and watching a scary movie.
5% 48% +43
3. Which words best describe the key concepts of drug addiction…craving and tolerance
48% 90% +42
4. Which of the following statements is true…alcohol causes more prenatal problems than other drugs.
74% 95% +21
5. The amount of toxic waste created in producing 1 lb. of methamphetamine…5-6 lbs.
35% 91% +56
6. Which of the following statements regarding prenatal exposure is true…behavioral problems are strongly related to prenatal stimulant drug exposure.
3% 64% +61
7. Constant stress affects the early brain development of children in all of the following aspects except…slowing development of all parts of the brain.
17% 38% +21
8. Which of the following is not a potential problem area measured by the Addiction Severity Index (ASI)…educational status.
53% 79% +26
9. The Trauma Symptom Checklist is suitable for children of what age…8 to 16.
19% 69% +50
10. The critical components of cognitive-behavioral therapy (CBT) are: all of the above.
64% 71% +7
11. Symptoms of methamphetamine use does not include…nausea, dyspepsia.
45% 71% +26
CA Sonoma CWT Rural report 2-12-08 10

12. The concept of harm reduction involves all of the following except…abstinence from drug and alcohol use.
29% 59% +30
13. Prevention, intervention, and counseling community resources available to caretakers of traumatized children include…all of the above.
76% 93% +17
*Change in percentage points when comparing percentage of correct responses at pre-assessment to percentage of correct responses at post-assessment.
At the Auburn WWDAF workshop (Table 14), increases in knowledge ranging between 7 and 61 percentage points were seen in response to each of the 13 survey questions at post-testing.
Table 15: FAIRFIELD Pre- and Post-Test Responses
Survey Question
Fairfield / WWDAF
% Correct *Chg
% Pt Pre
Post
1. All of the following are depressants except…nicotine. 47% 78% +31
2. Which of the following statements is true…many activities change brain chemistry including exercise, meditation, alcohol use, and watching a scary movie.
3% 31% +28
3. Which words best describe the key concepts of drug addiction…craving and tolerance
53% 89% +36
4. Which of the following statements is true…alcohol causes more prenatal problems than other drugs.
58% 92% +34
5. The amount of toxic waste created in producing 1 lb. of methamphetamine…5-6 lbs.
39% 61% +22
6. Which of the following statements regarding prenatal exposure is true…behavioral problems are strongly related to prenatal stimulant drug exposure.
0% 42% +42
7. Constant stress affects the early brain development of children in all of the following aspects except…slowing development of all parts of the brain.
14% 17% +3
8. Which of the following is not a potential problem area measured by the Addiction Severity Index (ASI)…educational status.
36% 86% +50
9. The Trauma Symptom Checklist is suitable for children of what age…8 to 16.
28% 97% +69
10. The critical components of cognitive-behavioral therapy (CBT) are: all of the above.
61% 75% +14
CA Sonoma CWT Rural report 2-12-08 11

11. Symptoms of methamphetamine use does not include…nausea, dyspepsia.
56% 94% +38
12. The concept of harm reduction involves all of the following except…abstinence from drug and alcohol use.
28% 61% +33
13. Prevention, intervention, and counseling community resources available to caretakers of traumatized children include…all of the above.
64% 97% +33
*Change in percentage points when comparing percentage of correct responses at pre-assessment to percentage of correct responses at post-assessment.
At the Fairfield WWDAF workshop (Table 15), increases in knowledge ranging between 3 and 69 percentage points were seen in response to each of the 13 survey questions at post-testing.
Table 16: NAPA Pre- and Post-Test Responses
Survey Question
Napa / WWDAF
% Correct *Chg
% Pt Pre
Post
1. All of the following are depressants except…nicotine. 57% 77% +20
2. Which of the following statements is true…many activities change brain chemistry including exercise, meditation, alcohol use, and watching a scary movie.
3% 73% +70
3. Which words best describe the key concepts of drug addiction…craving and tolerance
53% 93% +40
4. Which of the following statements is true…alcohol causes more prenatal problems than other drugs.
60% 93% +33
5. The amount of toxic waste created in producing 1 lb. of methamphetamine…5-6 lbs.
23% 50% +27
6. Which of the following statements regarding prenatal exposure is true…behavioral problems are strongly related to prenatal stimulant drug exposure.
3% 67% +64
7. Constant stress affects the early brain development of children in all of the following aspects except…slowing development of all parts of the brain.
17% 10% (7)
8. Which of the following is not a potential problem area measured by the Addiction Severity Index (ASI)…educational status.
57% 70% +13
9. The Trauma Symptom Checklist is suitable for children of what age…8 to 16.
13% 73% +60
CA Sonoma CWT Rural report 2-12-08 12

10. The critical components of cognitive-behavioral therapy (CBT) are: all of the above.
50% 53% +3
11. Symptoms of methamphetamine use does not include…nausea, dyspepsia.
30% 93% +63
12. The concept of harm reduction involves all of the following except…abstinence from drug and alcohol use.
30% 50% +20
13. Prevention, intervention, and counseling community resources available to caretakers of traumatized children include…all of the above.
77% 93% +16
*Change in percentage points when comparing percentage of correct responses at pre-assessment to percentage of correct responses at post-assessment.
At the Napa WWDAF workshop (Table 16), increases in knowledge ranging between 3 and 70 percentage points were seen in response to 12 of the 13 survey questions at post-testing. A decrease of 7 percentage points was seen in response to 1 survey question (question 7).
Table 17: Pre- and Post-Test Responses from ALL 8 WWDAF Workshops, 2006-07
Survey Question
ALL 8 Workshops / WWDAF
% Correct *Chg
% Pt Pre
Post
1. All of the following are depressants except…nicotine. 52% 77% +25
2. Which of the following statements is true…many activities change brain chemistry including exercise, meditation, alcohol use, and watching a scary movie.
3% 42% +39
3. Which words best describe the key concepts of drug addiction…craving and tolerance
57% 89% +32
4. Which of the following statements is true…alcohol causes more prenatal problems than other drugs.
74% 95% +21
5. The amount of toxic waste created in producing 1 lb. of methamphetamine…5-6 lbs.
33% 74% +41
6. Which of the following statements regarding prenatal exposure is true…behavioral problems are strongly related to prenatal stimulant drug exposure.
3% 55% +52
7. Constant stress affects the early brain development of children in all of the following aspects except…slowing development of all parts of the brain.
17% 21% +4
8. Which of the following is not a potential problem area measured by the Addiction Severity Index (ASI)…educational status.
49% 82% +33
CA Sonoma CWT Rural report 2-12-08 13

9. The Trauma Symptom Checklist is suitable for children of what age…8 to 16.
18% 78% +60
10. The critical components of cognitive-behavioral therapy (CBT) are: all of the above.
55% 67% +12
11. Symptoms of methamphetamine use does not include…nausea, dyspepsia.
49% 84% +35
12. The concept of harm reduction involves all of the following except…abstinence from drug and alcohol use.
32% 57% +25
13. Prevention, intervention, and counseling community resources available to caretakers of traumatized children include…all of the above.
73% 91% +18
*Change in percentage points when comparing percentage of correct responses at pre-assessment to percentage of correct responses at post-assessment.
Table 17 illustrates changes in percentage points at post-testing as compared to pre-test responses for all 8 workshops offered during the 2006-07 project year (n=350). Examination of aggregate findings reveal increases in the percentage points of correct responses in response to each of the 13 pre- and post-test questions. The increases range from 4 percentage points (Question 7) to 60 percentage points (Question 9). At pre-testing, none of the questions elicited correct response rates of 75% and above; however, at post-testing, 7 of the 13 questions (54%) drew correct response rates that ranged between 77% and 95%.
Table 18: Comparison of Post-Test Changes in Percentage Points
as Compared to Pre-Test Responses
Survey Questions
Changes in Percentage Points at Post-Testing
Cres-cent City
Bakers-
field
Visa-lia
Susan-ville
Kings Beach
Au-burn
Fair-field
Na-pa
All
8 Events
1. All of the following are depressants except…nicotine.
+15 +21 +41 +15 +24 +31 +31 +20 +25
2. Which of the following statements is true…many activities change brain chemistry including exercise, meditation, alcohol use, and watching a scary movie.
+19 +47 +31 +33 +47 +43 +28 +70 +39
3. Which words best describe the key concepts of drug addiction…craving and tolerance
+12 +29 +32 +23 +47 +42 +36 +40 +32
4. Which of the following statements is true…alcohol causes more prenatal
+17 +26 +19 +7 +11 +21 +34 +33 +21
CA Sonoma CWT Rural report 2-12-08 14

problems than other drugs.
5. The amount of toxic waste created in producing 1 lb. of methamphetamine…5-6 lbs.
15 +68 +52 +56 +53 +56 +22 +27 +41
6. Which of the following statements regarding prenatal exposure is true…behavioral problems are strongly related to prenatal stimulant drug exposure.
+63 +53 +33 +38 +63 +61 +42 +64 +56
7. Constant stress affects the early brain development of children in all of the following aspects except…slowing development of all parts of the brain.
4 +11 (6) (3) +3 +21 +3 (7) +8
8. Which of the following is not a potential problem area measured by the Addiction Severity Index (ASI)…educational status.
+27 +51 +25 +33 +34 +26 +50 +13 +33
9. The Trauma Symptom Checklist is suitable for children of what age…8 to 16.
+46 +64 +69 +59 +64 +50 +69 +60 +60
10. The critical components of cognitive-behavioral therapy (CBT) are: all of the above.
8 +23 +4 +31 +19 +7 +14 +3 +20
11. Symptoms of methamphetamine use does not include…nausea, dyspepsia.
+15 +37 +40 +33 +39 +26 +38 +63 +35
12. The concept of harm reduction involves all of the following except…abstinence from drug and alcohol use.
+14 +22 +23 +28 +34 +30 +33 +20 +25
13. Prevention, intervention, and counseling community resources available to caretakers of traumatized children include…all of the above.
+21 +17 +13 +10 +13 +17 +33 +16 +18
*Change in percentage points when comparing percentage of correct responses at pre-assessment to percentage of correct responses at post-assessment.
Four of the eight workshops drew post-test increases in response to each of the 13 survey questions. At the remaining 4 workshops, 3 drew increases in response to 12 of the 13 survey questions, with question 7 being the single question that showed a reverse pattern. At the first workshop of the 2006-07 program year (Crescent City), decreases in the percentage of correct responses were seen in regard to 3 of the 13 pre- and post-test questions. Decreases in the percentage points of correct responses ranged from 3 to 15 points. Increases in the percentage points of correct responses ranged from 3 to 70 percentage points.
CA Sonoma CWT Rural report 2-12-08 15

Wide variations are frequently seen when comparing gains regarding the same test question across sites. For example, Question 2 drew gains of 19 percentage points at post-testing in Crescent City as compared to 70 points in Napa. Question 8 drew a gain of 13 points in Napa as compared to 51 points in Bakersfield. Question 11 drew a gain of 15 points in Crescent City as compared to 63 points in Napa. Notably, the lowest gains were seen in Crescent City in regard to 8 of the 13 test questions.
Table 19:
Workshop
Location
Total number
pre-AND post-tested
Number with
higher post-test scores
Number with no change in post-
test scores
Number with
lower post-test scores
Average number
correct pre-test
responses
Average number
correct post-test
responses
Rise in
number of correct post-test
responses
Rise in percentage of correct post-test
responses*
CrescentCity 48 39 5 4 5.27 7.44 2.17 17%
Bakersfield 53 51 2 0 4.91 9.58 4.67 35.9%
Visalia 48 40 5 3 5.35 8.96 3.61 27.8%
Susanville 39 37 1 1 5.79 9.38 3.59 27.6%
KingsBeach 38 35 1 2 5.82 10.29 4.47 34.4%
Auburn 58 53 1 4 5.21 9.43 4.22 32.5%
Fairfield 36 30 2 4 5.58 9.31 3.73 28.7%
Napa 30 27 2 1 4.80 9.13 4.33 33.3%
TOTALS 350 312 19 19 5.33 9.17 3.84 29.5%
Percentage 100% 89.1% 5.4% 5.4%
*The difference between the number of correct post-test responses as compared to pre-test responses divided by the total number of test questions. There are 13 WWDAF test questions and 10 CBT test questions.
It is possible to evaluate ‘apples and apples’ by comparing the mean scores of those who completed both the pre- and post test only. Among the 350 workshop participants who completed both the pre- and post-tests, 312 (89.1%) posted higher test scores at post-testing, 19 (5.4%) showed no change when comparing pre- and post-test correct response rates, and 19 (5.4%) showed decreases in the number of correct post-test responses. Among all 350 participants, the average number of correct responses was 5.33 at pre-testing and 9.17 at post-testing, reflecting a gain of 3.84 or 29.5% (3.84 divided by 13, the highest possible number of correct responses).
CA Sonoma CWT Rural report 2-12-08 16

As illustrated in Graph 2, the average numbers of correct pre- and post-test responses varies relatively little between sites. In other words, training effect has been steady and predictable during the past year.
Graph 2
Cresce
nt City
Bakersf
ield
Visalia
Susanv
i lle
KingsB
each
Auburn
Fairfie
ld
Napa
Comparison of Average Number of Correct PRE- and POST-Test Responses, 2006-07
0 2 4 6 8
10 12
13 T
est Q
uest
ions
Responses est Responses
Average # Correct PRE-TestAverage # Correct POST-T
Follow-up Postcard Results: Follow-up postcard surveys are distributed once approximately 90 days post-workshop to assess training impact. The postcards are brief, consisting of 4 questions that employ a 5-point Likert scale in which 1 is the lowest and 5 the highest possible score.
Table 20: Postcard Survey Mean Scores from
Working with Drug-Abusing Families Workshops
Location Date n
As a result of your attendance at the training, rate the extent to which:
Question 1 Question 2 Question 3 Question 4
CrescentCity 10/18/06 36 4.33 4.50 4.11 4.42
Bakersfield 11/6/06 20 4.30 4.55 4.15 4.45
Visalia 11/13/06 15 4.53 4.40 3.87 4.40
Susanville 4/23/07 22 4.18 4.27 3.82 4.41
Kings Beach 4/24/07 21 4.67 4.81 4.19 4.67
Auburn 4/25/07 29 4.17 4.31 3.79 4.21
CA Sonoma CWT Rural report 2-12-08 17

Fairfield 6/5/07 27 4.44 4.67 4.33 4.63
Napa 6/6/07 16 4.44 4.50 3.80 4.31
All Trainings This Period Year 4 186 4.38 4.50 4.01 4.44
Scale: 1=not at all, 5=totally Question 1: You have a greater understanding of the physical and mental effects of substance abuse Question 2: You found the information and materials from the training helpful Question 3: You have been able to use the tools presented to you in the training with your clients Question 4: You have increased knowledge of the effects of substance abuse on children who live in substance-abusing households
Table 20 contains postcard survey results from the Working with Drug-Abusing Families workshops as collected and analyzed in year 4. The response rate to the postcard survey was 43% (186 returned postcard divided by 433 workshop participants). Follow-up findings from the 8 WWDAF workshops reported upon during this report period indicate participants believe they have a very high level of understanding of the physical and mental effects of substance abuse (question 1: 4.38), they found the information and materials disseminated via the training very helpful (question 2: 4.50), they have substantially increased knowledge of the effects of substance abuse on children who live in substance-abusing households (question 4: 4.44), and they have been able to use the tools presented with their clients (question 3: 4.01). Our goal is to meet or exceed an aggregate mean score of 4.0 in response to each follow-up postcard question. In every instance, this goal was met and exceeded, with mean scores ranging from 4.01 to 4.50. These scores are very strongly positive and are illustrated graphically below (Graph 3).
Graph 3
Aggregate Mean Scores to 90-Day Follow-up Postcard Questions 10/1/06-9/30/07
4.38 4.50
4.01
4.44
3.70 3.80 3.90 4.00 4.10 4.20 4.30 4.40 4.50 4.60
Q1 Q2 Q3 Q4
5-po
int L
iker
t sca
le
(Goa
l: 4.
0 or
bet
ter)
Aggregate Mean Scores
CA Sonoma CWT Rural report 2-12-08 18
COGNITIVE BEHAVIORAL THERAPY WITH SUBSTANCE-ABUSING FAMILIES
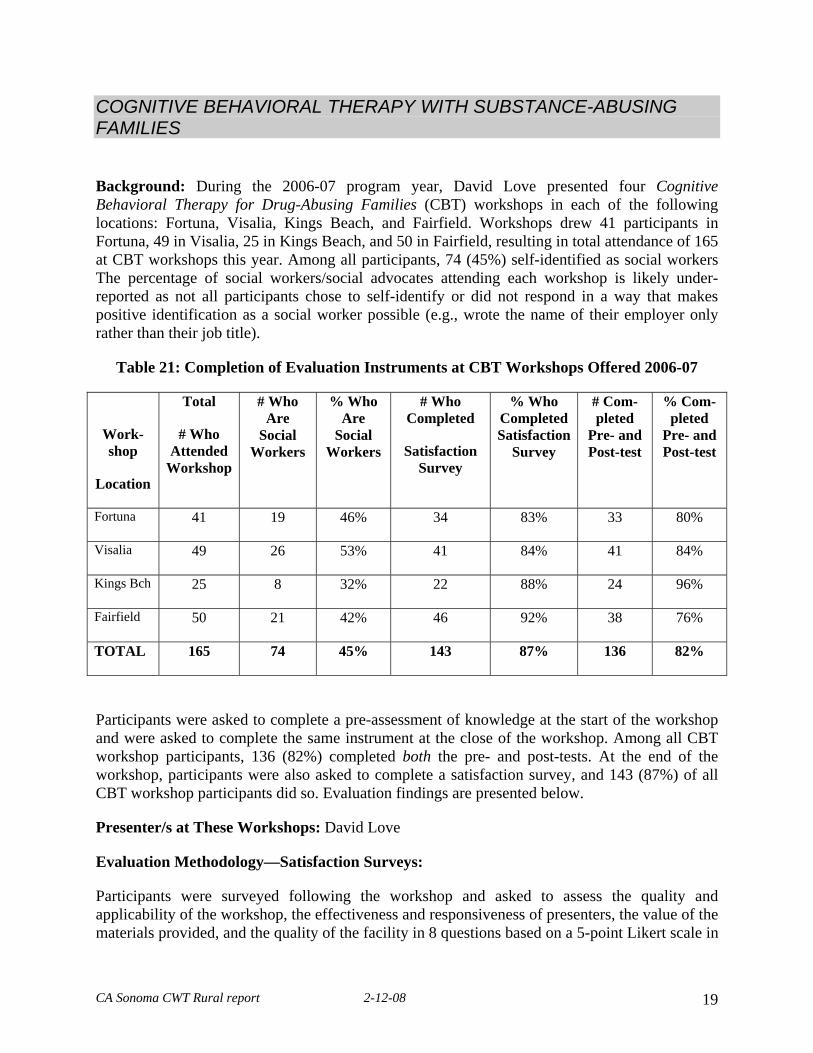
Background: During the 2006-07 program year, David Love presented four Cognitive Behavioral Therapy for Drug-Abusing Families (CBT) workshops in each of the following locations: Fortuna, Visalia, Kings Beach, and Fairfield. Workshops drew 41 participants in Fortuna, 49 in Visalia, 25 in Kings Beach, and 50 in Fairfield, resulting in total attendance of 165 at CBT workshops this year. Among all participants, 74 (45%) self-identified as social workers The percentage of social workers/social advocates attending each workshop is likely under-reported as not all participants chose to self-identify or did not respond in a way that makes positive identification as a social worker possible (e.g., wrote the name of their employer only rather than their job title).
Table 21: Completion of Evaluation Instruments at CBT Workshops Offered 2006-07
Work-shop
Location
Total
# Who Attended
Workshop
# Who Are
Social Workers
% Who Are
Social Workers
# Who Completed
Satisfaction Survey
% Who Completed Satisfaction
Survey
# Com-pleted
Pre- and Post-test
% Com-pleted
Pre- and Post-test
Fortuna 41 19 46% 34 83% 33 80%
Visalia 49 26 53% 41 84% 41 84%
Kings Bch 25 8 32% 22 88% 24 96%
Fairfield 50 21 42% 46 92% 38 76%
TOTAL 165 74 45% 143 87% 136 82%
Participants were asked to complete a pre-assessment of knowledge at the start of the workshop and were asked to complete the same instrument at the close of the workshop. Among all CBT workshop participants, 136 (82%) completed both the pre- and post-tests. At the end of the workshop, participants were also asked to complete a satisfaction survey, and 143 (87%) of all CBT workshop participants did so. Evaluation findings are presented below.
Presenter/s at These Workshops: David Love
Evaluation Methodology—Satisfaction Surveys:
Participants were surveyed following the workshop and asked to assess the quality and applicability of the workshop, the effectiveness and responsiveness of presenters, the value of the materials provided, and the quality of the facility in 8 questions based on a 5-point Likert scale in
CA Sonoma CWT Rural report 2-12-08 19

which a rating of "1" indicates poor and "5" excellent. Following is a summary of the mean, or average, scores to each of the survey questions, with 5.0 being the highest possible score and 1.00 the lowest. Mean scores to each of the survey questions regarding individual workshops handily exceeded the goal of 4.0, ranging from 4.29 to 4.91, as illustrated in Table 22.
Table 22: CBT Satisfaction Survey Mean Scores, 2006-07
Survey Question
Mean Score,
Fortuna
10/19/06
(n=34)
Mean Score,
Visalia
12/4/06
(n=41)
Mean
Score,
6/1/07
(n=22)
Mean Score,
6/15/07
(n=46)
Aggregate Mean
Scores,
All 4 Sites (n=143)
Overall workshop rating 4.56 4.58 4.91 4.83 4.70
Organization and flow of process 4.53 4.49 4.82 4.78 4.64
Extent info met my professional needs
4.50 4.54 4.77 4.80 4.65
Overall facilitator/presenter rating 4.74 4.66 4.91 4.84 4.77
Presenter effectiveness in conveying ideas
4.85 4.76 4.91 4.82 4.82
Presenter responsiveness to the participants
4.74 4.68 4.86 4.83 4.77
Value and useful-ness of written materials/info
4.29 4.39 4.68 4.80 4.55
Overall facility rating 4.62 4.65 4.75 4.55 4.63
Rating scale: 1=poor, 2=fair, 3=good, 4=very good, 5=excellent
Aggregate mean scores, as illustrated in Graph 4, ranged between 4.55 and 4.82—all very high scores that approach excellence and that handily surpassed the goal of achieving mean scores of at least 4.0.
Graph 4
CA Sonoma CWT Rural report 2-12-08 20

Aggregate Mean Scores to Post-Workshop Satisfaction Survey, 2006-07
1 2 3 4 5 6 7 8 on
sti
on
tiue
stion
no on
on
on
on
ue ues
uesti
Questi i
Quest sti sti
ue ueQ Q Q Q Q Q
) e rl ea t 4. 9c t 4. 8 2
4. 7 7 4. 7 7 str be 4. 8 4. 7
e 4. 6 4 4. 6 5
k or 4. 7 4. 6 3
Li 0. 4. 5 5 4. 6
4nt : 5
-poi oa
l 4.
G 4. 4
5 (
Aggregate Mean Scores
Pre- and Post-Test Results
Prior to the start of each workshop and again at the end, participants are asked to complete brief assessments of knowledge. Assessments are necessarily crafted to reflect key points raised in this particular workshop, Cognitive Behavioral Therapy (CBT) for Drug-Abusing Families. The percentage of correct responses at pre-testing is compared to the percentage at post-testing. Results reported below in Tables 23 through 27 reflect responses from participants who completed both the pre- and post-tests.
Table 23: FORTUNA Pre- and Post-Test Responses
Survey Question
Fortuna, 10/19/06
% Correct *Chg
% Pt Pre Post
1.Child maltreatment is the leading cause of trauma-related deaths for children under five. What percent occurs at the hands of parents under the influence of drugs or alcohol? 67%
58% 91% +33
2.Children of substance-abusing parents are ___% more likely to be physically or sexually abused. 270%
33% 70% +37
3.Children living in substance-abusing homes are at high risk of: all of the above 100% 100% NC
4.The first step of substance abuse treatment is: detox 24% 97% +73
5.A critical component of CBT is: skills training 58% 97% +39
CA Sonoma CWT Rural report 2-12-08 21

6.Which of the following is not a strength of CBT? Long term 58% 97% +39
7.Evaluating thoughts that precede use: cognitive 82% 97% +15
8.Evaluating who they spent most of their time with: social 82% 91% +9
9.Evaluating positive and negative affective states that precede use: emotional 70% 91% +21
10.Which is not a CBT treatment tool? meditation 36% 97% +61
*Change in percentage points when comparing percentage of correct responses at pre-assessment to percentage of correct responses at post-assessment.
Fortuna: At the Fortuna CBT workshop (Table 23), increases in knowledge ranging between 9 and 73 percentage points were seen in response to 9 of the 10 survey questions at post-testing. No change occurred and no change was possible in response to question 3 as all respondents answered correctly at pre- and at post-testing. Perhaps the most striking aspect of the CBT findings is the consistently very high percentage of correct responses at post-testing (91%-100% in 9 of 10 questions).
Table 24: VISALIA Pre- and Post-Test Responses
Survey Question
Visalia, 12/4/06
% Correct *Chg
% Pt Pre Post
1.Child maltreatment is the leading cause of trauma-related deaths for children under five. What percent occurs at the hands of parents under the influence of drugs or alcohol? 67%
46% 68% +22
2.Children of substance-abusing parents are ___% more likely to be physically or sexually abused. 270%
32% 78% +46
3.Children living in substance-abusing homes are at high risk of: all of the above 98% 100% +2
4.The first step of substance abuse treatment is: detox 27% 63% +36
5.A critical component of CBT is: skills training 42% 81% +39
6.Which of the following is not a strength of CBT? Long term 51% 88% +37
7.Evaluating thoughts that precede use: cognitive 73% 85% +12
8.Evaluating who they spent most of their time with: social 73% 85% +12
9.Evaluating positive and negative affective states that precede use: emotional 61% 66% +5
CA Sonoma CWT Rural report 2-12-08 22

10.Which is not a CBT treatment tool? meditation 32% 95% +63
*Change in percentage points when comparing percentage of correct responses at pre-assessment to percentage of correct responses at post-assessment.
Visalia: Increases in knowledge that ranged between 2 and 63 percentage points were seen in response to all questions at post-testing. At pre-testing in Visalia (Table 24), the average number of correct responses was 5.3 as compared to 8.1 at post-testing, reflecting an average gain of 2.8 more correct responses at post-testing. This represents a gain in knowledge of 28% (2.8 divided by 10 questions). In terms of percentages, at pre-testing, participants averaged 53% correct responses as compared to 81% correct responses at post-testing.
Table 25: KINGS BEACH Pre- and Post-Test Responses
Survey Question
Kings Beach, 6/1/07
% Correct *Chg
% Pt Pre Post
1.Child maltreatment is the leading cause of trauma-related deaths for children under five. What percent occurs at the hands of parents under the influence of drugs or alcohol? 67%
58% 46% (12)
2.Children of substance-abusing parents are ___% more likely to be physically or sexually abused. 270%
42% 42% NC
3.Children living in substance-abusing homes are at high risk of: all of the above 100% 100% NC
4.The first step of substance abuse treatment is: detox 13% 67% +54
5.A critical component of CBT is: skills training 63% 75% +12
6.Which of the following is not a strength of CBT? Long term 50% 92% +42
7.Evaluating thoughts that precede use: cognitive 83% 88% +5
8.Evaluating who they spent most of their time with: social 58% 75% +17
9.Evaluating positive and negative affective states that precede use: emotional 50% 67% +17
10.Which is not a CBT treatment tool? meditation 46% 100% +54
*Change in percentage points when comparing percentage of correct responses at pre-assessment to percentage of correct responses at post-assessment.
Kings Beach: Increases in knowledge that ranged between 5 and 54 percentage points were seen in response 7 of 10 questions at post-testing (Table 25). A decrease of 12 percentage points was seen in response to question #1, and no change occurred in response to question 2 and 3. At pre-testing, the average number of correct responses was 5.6 as compared to 7.6 at post-testing, reflecting an average gain of 2.0 correct responses following the workshop. This represents a
CA Sonoma CWT Rural report 2-12-08 23

gain in knowledge of 20% (2.0 divided by 10 questions). At pre-testing, participants averaged 56% correct responses as compared to 76% correct responses at post-testing.
Table 26: FAIRFIELD Pre- and Post-Test Responses
Survey Question
Fairfield, 6/15/07
% Correct *Chg
% Pt Pre Post
1.Child maltreatment is the leading cause of trauma-related deaths for children under five. What percent occurs at the hands of parents under the influence of drugs or alcohol? 67%
16% 3% (13)
2.Children of substance-abusing parents are ___% more likely to be physically or sexually abused. 270%
34% 71% +37
3.Children living in substance-abusing homes are at high risk of: all of the above 100% 100% NC
4.The first step of substance abuse treatment is: detox 53% 79% +26
5.A critical component of CBT is: skills training 40% 76% +36
6.Which of the following is not a strength of CBT? Long term 58% 79% +21
7.Evaluating thoughts that precede use: cognitive 79% 79% NC
8.Evaluating who they spent most of their time with: social 68% 74% +6
9.Evaluating positive and negative affective states that precede use: emotional 63% 68% +5
10.Which is not a CBT treatment tool? meditation 32% 84% +52
*Change in percentage points when comparing percentage of correct responses at pre-assessment to percentage of correct responses at post-assessment.
Fairfield: Increases in knowledge that ranged between 5 and 52 percentage points were seen in response 7 of 10 questions at post-testing (Table 26). No change occurred (or could occur) in response to question #3, a question that drew 100% correct responses at pre- and again at post-testing. A loss of 13 percentage points was seen in response to question 1, and no change occurred in response to question 7, a question that drew 79% correct response rate at pre- and post-testing. At pre-testing, the average number of correct responses was 5.4 as compared to 7.2 at post-testing, reflecting an average gain of 1.8 correct responses following the workshop. This represents a gain in knowledge of 18% (1.8 divided by 10 questions). At pre-testing, participants averaged 54% correct responses as compared to 72% correct responses at post-testing.
Table 27: ALL CBT Pre- and Post-Test Responses, 2006-07
CA Sonoma CWT Rural report 2-12-08 24
ALL CBT Workshops

Survey Question % Correct *Chg
% Pt Pre Post
1.Child maltreatment is the leading cause of trauma-related deaths for children under five. What percent occurs at the hands of parents under the influence of drugs or alcohol? 67%
43% 52% +9
2.Children of substance-abusing parents are ___% more likely to be physically or sexually abused. 270%
35% 68% +33
3.Children living in substance-abusing homes are at high risk of: all of the above 99% 100% +1
4.The first step of substance abuse treatment is: detox 31% 77% +46
5.A critical component of CBT is: skills training 49% 82% +33
6.Which of the following is not a strength of CBT? Long term 54% 88% +34
7.Evaluating thoughts that precede use: cognitive 79% 87% +8
8.Evaluating who they spent most of their time with: social 71% 82% +11
9.Evaluating positive and negative affective states that precede use: emotional 62% 73% +11
10.Which is not a CBT treatment tool? meditation 35% 93% +58
*Change in percentage points when comparing percentage of correct responses at pre-assessment to percentage of correct responses at post-assessment.
All 4 CBT Workshops in 2006-07: Responses reported in aggregate across all 4 CBT workshops (Table 27) demonstrate gains in knowledge in response to each of the 10 test questions. These gains range from 1 to 58 percentage points. The average number of correct pre-test responses among 136 CBT participants was 5.57 as compared to 8.01 at post-testing, yielding a gain of 2.4 correct responses or a 24% gain in knowledge (2.4 divided by 10, the highest possible number of correct responses). On average, CBT workshop participants averaged 56% correct pre-test responses and 80.1% correct post-test responses.
Comparison of Correct Post-Test with Correct Pre-Test Responses Across CBT Training Locations: As was true in 2005-06, relatively little congruence is seen, indicating wide variations in local conditions and/or in trainee attributes in regard to several survey questions (Table 8). For example, in response to question 4, increases in the percentage of correct responses at post-testing ranged from 26 percentage points in Fairfield and 73 percentage points in Fortuna—a spread of 47 percentage points. Similarly, in response to question 5, post-testing increases ranged from 12 in Kings Beach to 39 in Fortuna and in Visalia, a spread of 27 percentage points. Congruence is highest across sites in response to questions 2, 3, 8, 9, and 10.
Table 28: Changes in Percentage Points When Comparing Correct Post-Test to Correct Pre-Test Responses
CA Sonoma CWT Rural report 2-12-08 25

Survey Question Fortuna Visalia
Kings Beach
Fair-field
All 4 Sites
1.Child maltreatment is the leading cause of trauma-related deaths for children under five. What percent occurs at the hands of parents under the influence of drugs or alcohol? 67%
+33 +22 (12) (13) +9
2.Children of substance-abusing parents are ___% more likely to be physically or sexually abused. 270%
+37 +46 NC +37 +33
3.Children living in substance-abusing homes are at high risk of: all of the above NC +2 NC NC +1
4.The first step of substance abuse treatment is: detox +73 +36 +54 +26 +46
5.A critical component of CBT is: skills training +39 +39 +12 +36 +33
6.Which of the following is not a strength of CBT? Long term
+39 +37 +42 +21 +34
7.Evaluating thoughts that precede use: cognitive +15 +12 +5 NC +8
8.Evaluating who they spent most time with: social +9 +12 +17 +6 +11
9.Evaluating positive and negative affective states that precede use: emotional
+21 +5 +17 +5 +11
10.Which is not a CBT treatment tool? meditation +61 +63 +54 +52 +58
*Change in percentage points when comparing percentage of correct responses at pre-assessment to percentage of correct responses at post-assessment.
Table 29: Pre- and Post-Assessment of Knowledge Results
from Cognitive Behavioral Therapy Workshops
Location Date
#
Pre- and
post-tested
Rise in percent-
age of correct
post-test responses
*
Among those who completed pre- AND post-tests:
#
Improved post-
test
scores
#
Un-
changed post-
test scores
#
Decreased
post-
test
scores
Mean PRE-
test
score
Mean POST-
test
score
Fortuna 10/19/06 33 31% 31 1 1 6.03 9.15
CA Sonoma CWT Rural report 2-12-08 26

Visalia 12/4/06 41 28% 34 5 2 5.32 8.12
Kings Bch 6/1/07 24 20% 21 1 2 5.63 7.63
Fairfield 6/15/07 38 18% 26 9 3 5.42 7.16
TOTALS 136 24% 112 16 8 5.57 8.01
*The difference between the number of correct post-test responses as compared to pre-test responses divided by the total number of test questions. There are 10 CBT test questions. It is possible to evaluate ‘apples and apples’ by comparing the mean scores of those who completed both the pre- and post test only. Among the 136 CBT workshop participants who completed both the pre- and post-tests, 112 (82.4%) posted higher test scores at post-testing, 16 (11.8%) showed no change when comparing pre- and post-test correct response rates, and 8 (5.9%) showed decreases in the number of correct post-test responses.
As illustrated in Graph 5, the average numbers of correct pre- and post-test responses varies somewhat between sites, with the highest gains seen in the most remote location (Fortuna).
Graph 5
Comparison of Average Number of Correct PRE-and POST-Test Responses, 2006-07
t 10
es 9.15 8 8.12
t-Ton
s 7.63 7.16
so it 6 6.03 5.63
P s 5.32 5.42
/-e ue 4
r Q P 2
10 0 Fortuna Visalia Kings Bch Fairfield
Average # Correct PRE-Test Responses Average # Correct POST-Test Responses
Follow-up Postcard Results:
Table 30: Postcard Survey Mean Scores from Cognitive Behavioral Therapy Workshops
As a result of your attendance at the training, rate the extent to which:
Location
Date
n Question 1 Question 2 Question 3 Question 4
CA Sonoma CWT Rural report 2-12-08 27

Fortuna 10/19/06 20 3.11 4.11 3.75 4.00
Visalia 12/4/06 20 2.95 4.25 3.90 4.15
Kings Beach 6/1/07 14 2.93 4.07 3.86 4.07
Fairfield 6/15/07 24 3.50 4.25 3.92 4.22
All Trainings This Period Year 4 78 3.12 4.17 3.86 4.11
Scale: 1=not at all, 5=totally *Follow-up data currently being collected for these workshops Question 1: My level of understanding of cognitive behavioral therapy before the seminar Question 2: My level of understanding of CBT now Question 3: I have used the information and materials from the seminar Question 4: I have found the CBT training helpful in improving my ability to provide services to the families I serve
Similar to the follow-up procedure used to assess impact of the Working with Drug-Abusing Families workshops, follow-up postcard surveys are distributed once approximately 90 days following each Cognitive Behavioral Therapy workshops to assess training impact. The postcards are brief, consisting of 4 questions that employ a 5-point Likert scale in which 1 is the lowest and 5 the highest possible score. Question #1 asks participants to indicate their level of understanding of cognitive behavioral therapy before attending the workshop. Aggregate responses indicated attendees had a middling understanding (3.12) of this type of therapy. Question #2 asks participants to assess their level of knowledge after the workshop and, clearly, people believe they have increased understanding (4.17). Moreover, participants have, to a large degree, used the information and materials disseminated in their work (3.86) and they found the training helpful in providing services to families (4.11).
CA Sonoma CWT Rural report 2-12-08 28