Embed Size (px)
Citation preview

Final Report
2005 Urban Water Management Plan—Bay
Point
Region I Headquarters3035 Prospect Park, Suite 60
Rancho Cordova, CA 95670
December 2005

2005 URBAN WATER MANAGEMENT PLAN—BAY POINT
325 E. Hillcrest Drive Suite 125Thousand Oaks, CA
91360-5828
2 BAO/051720012/JMS SJC/W062005009

Final Report
2005 Urban Water Management Plan—Bay
Point

CONTENTS
Contents
Chapter Page
NOTICE OF ADOPTION.....................................................................................................................................IX
ABBREVIATIONS.............................................................................................................................................XI
DEFINITIONS...................................................................................................................................................XV
CHAPTER 1. INTRODUCTION AND OVERVIEW....................................................................................1-1
Background......................................................................................................................................................1-1System Overview.............................................................................................................................................1-2California Urban Water Conservation Council................................................................................................1-4Public Utility Commission Policy Changes.....................................................................................................1-4Agency Coordination.......................................................................................................................................1-5Public Participation and Plan Adoption...........................................................................................................1-6UWMP Preparation..........................................................................................................................................1-7UWMP Implementation...................................................................................................................................1-7Content of the UWMP.....................................................................................................................................1-8Resource Optimization.....................................................................................................................................1-9
CHAPTER 2. SERVICE AREA.......................................................................................................................2-1
Area..................................................................................................................................................................2-1Demographics..................................................................................................................................................2-1Population, Housing and Employment............................................................................................................2-3
ABAG Population Projection Development Methodology..........................................................................2-3Bay Point CSA Population Projections.......................................................................................................2-4
Climate.............................................................................................................................................................2-6
CHAPTER 3. WATER SUPPLY......................................................................................................................3-1
Water Sources..................................................................................................................................................3-2Groundwater....................................................................................................................................................3-3
Pittsburg Plain Basin...................................................................................................................................3-3Basin Adjudication......................................................................................................................................3-4
Reliability of Supply........................................................................................................................................3-5CCWD’s Water Supply Reliability..............................................................................................................3-5
Long-term Water Transfers.......................................................................................................................................3-5Short-term Water Transfers.......................................................................................................................................3-6
GSWC’s Groundwater Supply Reliability...................................................................................................3-7Bay Point System’s Water Supply Reliability..............................................................................................3-7Factors Resulting in Inconsistency of Supply..............................................................................................3-9
Transfers and Exchanges.................................................................................................................................3-9Planned Water Supply Projects and Programs.................................................................................................3-9Wholesale Agency Supply Data....................................................................................................................3-10
CHAPTER 4. WATER USE..............................................................................................................................4-1
Historical and Projected Water Use.................................................................................................................4-2Sales to Other Agencies...................................................................................................................................4-7Other Water Uses and Unaccounted-for Water...............................................................................................4-7Total Water Demand........................................................................................................................................4-8Data Provided to Wholesale Agency...............................................................................................................4-8
BAO/051720004 JMS SJC/W062005001 III

CHAPTER 5. DEMAND MANAGEMENT MEASURES.............................................................................5-1
BMP Implementation Status............................................................................................................................5-3Cost Benefit Analysis......................................................................................................................................5-6Recommended Conservation Program............................................................................................................5-7
Economic Considerations..........................................................................................................................................5-8Legal Considerations.................................................................................................................................................5-8Cost Share Partners....................................................................................................................................................5-8
CHAPTER 6. DESALINATION.......................................................................................................................6-1
CHAPTER 7. WATER SHORTAGE CONTINGENCY PLAN...................................................................7-1
Action Stages...................................................................................................................................................7-2Minimum Supply.............................................................................................................................................7-3Catastrophic Supply Interruption Plan.............................................................................................................7-4Prohibitions, Penalties, and Consumption Reduction Methods.......................................................................7-6Revenue Impacts of Reduced Sales.................................................................................................................7-8Water-Use Monitoring Procedures..................................................................................................................7-9
CHAPTER 8. RECYCLED WATER PLAN...................................................................................................8-1
Coordination....................................................................................................................................................8-1Wastewater Quantity, Quality, and Current Uses............................................................................................8-2Potential and Projected Use.............................................................................................................................8-4Optimization and Incentives for Recycled Water Use.....................................................................................8-5
CHAPTER 9. WATER QUALITY...................................................................................................................9-1
GSWC Measures for Water Quality Regulation Compliance.........................................................................9-1Safe Drinking Water Act (SDWA)...............................................................................................................9-1
Current and Proposed Water Quality Regulations...........................................................................................9-2Safe Drinking Water Act (SDWA)...............................................................................................................9-3Primacy........................................................................................................................................................9-4Total Coliform Rule (TCR)..........................................................................................................................9-8
TCR Potential Revisions and Distribution System Requirements............................................................................9-9Surface Water Treatment Rules.................................................................................................................9-10
The Surface Water Treatment Rule (SWTR)..........................................................................................................9-10Cryptosporidium Action Plan..................................................................................................................................9-11Interim Enhanced Surface Water Treatment Rule...................................................................................................9-12Long Term 1 Enhanced Surface Water Treatment Rule.........................................................................................9-13Long Term 2 Enhanced Surface Water Treatment Rule.........................................................................................9-13
Disinfectant/Disinfection By-Product Rules..............................................................................................9-14Total Trihalomethanes (TTHM) Rule.....................................................................................................................9-14Disinfectant/Disinfection By-Product (D/DBP) Rule Stage 1.................................................................................9-16D/DBP Rule Stage 2................................................................................................................................................9-18
Volatile Organic, Synthetic Organic and Inorganic Chemical Rules.......................................................9-18Volatile Organic Chemicals Rule............................................................................................................................9-18Phase II Synthetic Organic Chemicals and Inorganic Chemicals Rule...................................................................9-19Phase V Synthetic Organic Chemicals and Inorganic Chemicals Rule...................................................................9-19
Groundwater Rule.....................................................................................................................................9-19Filter Backwash Rule.................................................................................................................................9-20Lead and Copper Rule...............................................................................................................................9-21Arsenic Rule...............................................................................................................................................9-22Radionuclide Rule......................................................................................................................................9-22Radon Rule................................................................................................................................................9-24Drinking Water Contaminant Candidate List...........................................................................................9-24
Water Quality Issues......................................................................................................................................9-27Surface Water Quality...............................................................................................................................9-27Groundwater Quality.................................................................................................................................9-28
BAO/051720004 JMS SJC/W062005001 IV

CONTENTS
Projected Impact of Water Quality................................................................................................................9-29Distribution System Water Quality................................................................................................................9-30Emerging Water Quality Issues.....................................................................................................................9-30
CHAPTER 10. WATER SERVICE RELIABILITY....................................................................................10-1
Normal Water Year Analysis.........................................................................................................................10-3Single Dry-Year Analysis..............................................................................................................................10-4Multiple Dry-Year Analysis..........................................................................................................................10-5
Chapter 11. References.......................................................................................................................................11-1
TablesTable 1-1 Coordination with Agencies....................................................1-6Table 1-2 Summary of UWMP Chapters and Corresponding Provisions of
the California Water Code...........................................................1-8Table 2-1. Bay Point CSA Historical and Projected Population................2-5Table 2-2 Monthly Average Climate Data Summary for Bay Point CSA. .2-6Table 3-1 Current and Planned Water Supplies for the Bay Point System
in ac-ft/yr....................................................................................3-3Table 3-2 Wells and Well Capacity in the Bay Point System in ac-ft/yr. .3-4Table 3-3 Groundwater Pumping History by Bay Point System (2000 to
2004) in ac-ft..............................................................................3-4Table 3-4 Projected Groundwater Pumping Amounts by Bay Point System
to 2030 in ac/ft...........................................................................3-5Table 3-5 Supply Reliability for the Bay Point System for Year 2030 in ac-
ft/yr.............................................................................................3-7Table 3-6 Basis of Water Year Data........................................................3-8Table 3-7 Factors Resulting in Inconsistency of Supply..........................3-9Table 3-8 Transfer and Exchange Opportunities....................................3-9Table 3-9 Future Water Supply Projects in ac-ft...................................3-10Table 3-10 Existing and Planned Water Sources Available to the Bay
Point System as Identified by CCWD in ac-ft/yr........................3-10Table 3-11 Reliability of Wholesale Supply for Year 2030 in ac-ft/yr....3-10Table 3-12 Factors Affecting Wholesale Supply...................................3-11Table 4-1 Population-Based and Historical-Trend Projections of the
Number of Metered Service Connections for the Bay Point System4-5Table 4-2 Population-Based and Historical-Trend Projections of Water
Deliveries for Service Connections for the Bay Point System in ac-ft/yr.............................................................................................4-6
Table 4-3 Sales to Other Agencies in ac-ft/yr.........................................4-7Table 4-4 Additional Water Uses and Losses in ac-ft/yr..........................4-7Table 4-5 Projected Water Sales, Unaccounted-for System Losses, and
Total Water Demand in ac-ft/yr..................................................4-8Table 4-6 Summary of Bay Point System Data Provided to CCWD in ac-
ft/yr.............................................................................................4-8Table 5-1 Water Conservation Best Management Practices...................5-3Table 5-2 Summary of Past Water Conservation Activities(1)..................5-4Table 5-3 Summary of Best Management Practice Implementation.......5-5Table 5-4 Results of Economic Analysis for BMPs Currently Not Meeting
Coverage Requirements.............................................................5-7
BAO/051720004 JMS SJC/W062005001 V

2005 URBAN WATER MANAGEMENT PLAN—BAY POINT
Table 5-5 Summary of Required Interventions, Implementation Cost and Estimated Water Saved for BMPs Not Meeting Coverage Requirements...........................................................................5-10
Table 6-1 Summary of Opportunities for Water Desalination.................6-2Table 7-1 Water Supply Shortage Stages and Conditions......................7-2Table 7-2 Three-Year Estimated Minimum Water Supply in ac-ft/yr.......7-4Table 7-3 Summary of Actions for Catastrophic Events.........................7-5Table 7-4 Summary of Mandatory Prohibitions.......................................7-6Table 7-5 Summary of Penalties and Charges for Excessive Use...........7-7Table 7-6 Summary of Consumption Reduction Methods.......................7-7Table 7-7 Summary of Actions and Conditions that Impact Revenue.....7-8Table 7-8 Summary of Actions and Conditions that Impact Expenditures7-9Table 7-9 Proposed Measures to Overcome Revenue Impacts...............7-9Table 7-10 Proposed Measures to Overcome Expenditure Impacts.......7-9Table 7-11 Water-Use Monitoring Mechanisms....................................7-10Table 8-1 Role of Participating Agencies in the Development of the
Recycled Water Plan...................................................................8-2Table 8-2 Estimates of Existing and Projected Wastewater Collection and
Treatment in ac-ft/yr (mgd) for the Bay Point System................8-3Table 8-3 Estimates of Existing and Projected Disposal of Wastewater In
ac-ft/yr (mgd) for the Bay Point System.....................................8-3Table 8-4 Existing Recycled Water Use in the Bay Point System...........8-4Table 8-5 Potential Future Recycled Water Uses in ac-ft/yr...................8-4Table 8-6 Projected Future Recycled Water Use in Service Area in ac-ft/yr8-5Table 8-7 Comparison of Recycled Water Uses—Year 2000 Projections
versus 2005 Actual.....................................................................8-5Table 8-8 Methods to Encourage Recycled Water Use and the Resulting
Projected Use in ac-ft/yr.............................................................8-5Table 9-1 Status of Drinking Water Regulations.....................................9-4Table 9-2 Current Federal Drinking Water Standards.............................9-5Table 9-3 Current State Secondary Drinking Water Regulations............9-8Table 9-4 Bin Requirements Table (from Microbial/Disinfection
Byproducts [M/DBP] Federal Advisory Committee Stage 2 M-DBP Agreement in Principle)............................................................9-14
Table 9-5 Microbial Toolbox Components (from Microbial/Disinfection Byproducts [M/DBP] Federal Advisory Committee Stage 2 M-DBP Agreement in Principle)............................................................9-15
Table 9-6 Disinfection By-Product MCLs from Stage 1 of the D/DBP Rule9-16Table 9-7 Disinfectant MRDLs from Stage 1 of the D/DBP Rule............9-16Table 9-8 Required Removal of TOC by Enhanced Coagulation, Step 19-17Table 9-9 Target pH Values for Enhanced Coagulation, Step 2 Bench
Testing......................................................................................9-17Table 9-10 Existing and Revised MCLs for Radionuclides.....................9-24Table 9-11 Contaminant Candidate List (CCL).....................................9-25Table 9-12 Contra Costa Canal Water Quality Parameter Variations
(January 2000 to Present).........................................................9-27Table 9-13 Bay Point System – Range for Secondary MCL Constituents9-29Table 9-14 Summary of Assessment....................................................9-29Table 9-15 Summary of Projected Water Supply Changes Due to Water
Quality Issues...........................................................................9-30
VI BAO/051720012/JMS SJC/W062005009

CONTENTS
Table 10-1 Projected Normal Water Year Supply.................................10-3Table 10-2 Summary of Projected Normal Water Year Demands.........10-3Table 10-3 Comparison of Projected Normal Year Supply and Demand10-3Table 10-4 Projected Single-Dry Year Water Supply.............................10-4Table 10-5 Summary of Projected Single-Dry Year Demands...............10-4Table 10-6 Comparison of Projected Supply and Demand for Single Dry
Year..........................................................................................10-4Table 10-7 Projected Multiple-Dry Year Water Supply and Demand
Assessment..............................................................................10-5
FiguresFigure 1-1 Bay Point System Location Map............................................1-3Figure 2-1. Bay Point Customer Service Area........................................2-2Figure 2-2. Historical and Projected Population, Household and
Employment Growth within the Bay Point CSA...........................2-5Figure 2-3. Monthly Average Precipitation in Bay Point CSA based on 30
Year Historical Data....................................................................2-7Figure 4-1. Historical and Projected Number of Metered Service
Connections................................................................................4-3Figure 4-2. Historical Water Use and Future Water Use Projections......4-3Figure 4-3. Water Use by Customer Type..............................................4-4
AppendixesAppendix A Urban Water Management Planning ActAppendix B Public Hearing Notice and Meeting MinutesAppendix C Public Comments on the Draft UWMPAppendix D Economic Analysis of Selected Demand Management MeasuresAppendix E Council Annual Reports for Demand Management MeasuresAppendix F Rule No. 14.1: Mandatory Water Conservation, Restrictions, and
Rationing ProgramAppendix G Rate ScheduleAppendix H Responses to Public CommentsAppendix I Groundwater Basin Water Rights Stipulation/JudgmentAppendix J Summary of Population Based on Census Data
BAO/051720004 JMS SJC/W062005001 VII

NOTICE OF ADOPTION
Notice of Adoption
A meeting to solicit public comments on the 2005 Urban Water Management Plan for the Golden State Water Company Bay Point System was held on November 14, 2005 at 11:00 am at the Ambrose Park and Recreation Center in Bay Point, California. Notice of this meeting was published in accordance with Section 6066 of the Government Code in the Contra Costa Times on October 28, 2005 and on November 11, 2005. Copies of the Urban Water Management Plan were made available to the public at the Golden State Water Company Bay Point Customer Service Office in Bay Point, California two weeks prior to the public hearing.Comments, oral and written, if received and responses to comments are documented in Appendix H of this document.Golden State Water Company hereby adopts the 2005 Urban Water Management Plan for the Bay Point System.
Roland S. Tanner
Vice President, Customer ServiceRegion I
Golden State Water CompanyDecember 31, 2005
BAO/051720004 JMS SJC/W062005001 IX

ABBREVIATIONS
Abbreviations
ABAG Association of Bay Area Governmentsac-ft acre-feetac-ft/yr acre-feet per yearAct Urban Water Management Planning ActAMCL alternative MCLAWWA American Water Works AssociationBMPs best management practicesCBO community-based organizationCCL contaminant candidate list CCRs consumer confidence reports CDHS California Department of Health Servicescfs cubic feet per secondCIMIS California Irrigation Management Information SystemCouncil California Urban Water Conservation Council CPE comprehensive performance evaluationCPUC California Public Utilities CommissionCSA customer service areaCT concentration timeCUWA California urban water agenciesCWSs community water systems D/DBP disinfectant/disinfection by-productDMM demand management measureDOC dissolved organic carbonDOF Department of Finance DWR Guidebook Guidebook to Assist Water Suppliers in the Preparation of a
2005 Urban Water Management PlanDWR Department of Water Resources (California)EC enhanced coagulation
BAO/051720004 JMS SJC/W062005001 XI

EPA Environmental Protection Agency ERP emergency response planETo evapotranspirationgpm U.S. gallons per minuteGSWC Golden State Water CompanyGWR Groundwater RuleHAA5 haloacetic acidsIESWTR Interim Enhanced Surface Water Treatment Rule IOCs inorganic contaminantsIRP Integrated Resource PlanLACSD Sanitation Districts of Los Angeles CountyLT1ESWTR Long Term 1 Enhanced Surface Water Treatment RuleLT2ESWTR Long Term 2 Enhanced Surface Water Treatment RuleMCLGs maximum contaminant level goalsMCLs maximum contaminant levelsMetropolitan Metropolitan Water District of Southern CaliforniaMG million gallonsMMM multimedia mitigationMOU memorandum of understanding (regarding urban water
conservation in California)MRDLs maximum residual disinfectant levels mrem milliremsMTBE methyl tertiary-butyl ether MWD Municipal Water District with reference to any of the member
agencies of the Metropolitan Water District of Southern California
N/A not availableNAICS North American Industry Classification System NDMA N-nitrosodimethylamine NPV net present valueNTNCWS non-transient non-community water systems NTU nephelometric turbidity units
BAO/051720004 JMS SJC/W062005001 XII

ABBREVIATIONS
O&M operation and maintenanceOEHHA Office of Environmental Health Hazard AssessmentpCi picoCuriesRO reverse osmosisSCAG Southern California Association of Governments SDWA Safe Drinking Water Act SMCL secondary maximum contaminant levelSOCs synthetic organic contaminants SUVA source-water-specific ultraviolet absorbanceSWP State Water ProjectSWTR Surface Water Treatment Rule TCR Total Coliform Rule TDS total dissolved solidsTOC total organic carbonTTHMs Total Trihalomethanes RuleUCM unregulated contaminants monitoring ULF ultra low flushULFT ultra-low-flush-toilet UWMP Urban Water Management PlanVOCs volatile organic compoundsWEWAC Water Education Water Awareness Committee WRCC Western Regional Climate CenterWRP water reclamation plant WSDM Plan Water Surplus and Drought Management Plan WY water year
BAO/051720004 JMS SJC/W062005001 XIII

Definitions
Chapter 2, Part 2.6, Division 6 of the California Water Code provides definitions for the construction of the Urban Water Management Plans. Appendix A contains the full text of the Urban Water Management Planning Act.CHAPTER 2. DEFINITIONS
Section 10611. Unless the context otherwise requires, the definitions of this chapter govern the construction of this part.
Section 10611.5. “Demand management” means those water conservation measures, programs, and incentives that prevent the waste of water and promote the reasonable and efficient use and reuse of available supplies.
Section 10612. “Customer” means a purchaser of water from a water supplier who uses the water for municipal purposes, including residential, commercial, governmental, and industrial uses.
Section 10613. “Efficient use” means those management measures that result in the most effective use of water so as to prevent its waste or unreasonable use or unreasonable method of use.
Section 10614. “Person” means any individual, firm, association, organization, partnership, business, trust, corporation, company, public agency, or any agency of such an entity.
Section 10615. “Plan” means an urban water management plan prepared pursuant to this part. A plan shall describe and evaluate sources of supply, reasonable and practical efficient uses, and reclamation and demand management activities. The components of the plan may vary according to an individual community or area’s characteristics and its capabilities to efficiently use and conserve water. The plan shall address measures for residential, commercial, governmental, and industrial water demand management as set forth in Article 2 (commencing with Section 10630) of Chapter 3. In addition, a strategy and time schedule for implementation shall be included in the plan.
Section 10616. “Public agency” means any board, commission, county, city and county, city, regional agency, district, or other public entity.
Section 10616.5. “Recycled water” means the reclamation and reuse of wastewater for beneficial use.
Section 10617. “Urban water supplier” means a supplier, either publicly or privately owned, providing water for municipal purposes either directly or indirectly to more than 3,000 customers or supplying more than 3,000 acre-feet of water annually. An urban water supplier includes a supplier or contractor for water, regardless of the basis of right, which distributes or sells for ultimate
BAO/051720004 JMS SJC/W062005001 XV

resale to customers. This part applies only to water supplied from public water systems subject to Chapter 4 (commencing with Section 116275) of Part 12 of Division 104 of the Health and Safety Code.
BAO/051720004 JMS SJC/W062005001 XVI

Chapter 1. Introduction and Overview
BackgroundThe Urban Water Management Plan (UWMP) for the Golden State Water Company (GSWC) Bay Point System is prepared in compliance with Division 6, Part 2.6, of the California Water Code, Sections 10610 through 10657 as last amended by Senate Bill (SB) 318, the Urban Water Management Planning Act (Act). The original bill, requiring a UWMP, was initially enacted in 1983. SB 318, which became law in 2004, is the eighteenth amendment to the bill. Increased emphasis on drought contingency planning, water demand management, reclamation, and groundwater resources has been provided through the updates to the original bill.Under the current law, urban water suppliers with more than 3,000 service connections or water use of more than 3,000 acre-feet per year (ac-ft/yr) are required to submit a UWMP every five years to the California Department of Water Resources (DWR). The reports must be submitted by December 31 of years ending in zero and five. Under the name Southern California Water Company, GSWC prepared an UWMP for the Bay Point System in 1985, 1990, 1995, and 2000. The 2005 UWMP is an update to the 2000 plan. The law, as it is now, states and declares the following:
Section 10610.2(a) The Legislature finds and declares all of the following:
(1) The waters of the state are a limited and renewable resource subject to ever-increasing demands.
(2) The conservation and efficient use of urban water supplies are of statewide concern; however, the planning for that use and the implementation of those plans can best be accomplished at the local level.
(3) A long-term, reliable supply of water is essential to protect the productivity of California’s businesses and economic climate.
(4) As part of its long-range planning activities, every urban water supplier should make every effort to ensure the appropriate level of reliability in its water service sufficient to meet the needs of its various categories of customers during normal, dry, and multiple dry water years.
(5) Public health issues have been raised over a number of contaminants that have been identified in certain local and imported water supplies.
(6) Implementing effective water management strategies, including groundwater storage projects and recycled water projects, may require specific water quality and salinity targets for meeting groundwater basins water quality objectives and promoting beneficial use of recycled water.
BAO/051720004 JMS SJC/W062005001 1

(7) Water quality regulations are becoming an increasingly important factor in water agencies’ selection of raw water sources, treatment alternatives, and modifications to existing treatment facilities.
(8) Changes in drinking water quality standards may also impact the usefulness of water supplies and may ultimately impact supply reliability.
(9) The quality of source supplies can have a significant impact on water management strategies and supply reliability.
(b) This part is intended to provide assistance to water agencies in carrying out their long-term resource planning responsibilities to ensure adequate water supplies to meet existing and future demands for water.
Section 10610.4. The Legislature finds and declares that it is the policy of the state as follows: (a) The management of urban water demands and efficient use of water shall
be actively pursued to protect both the people of the state and their water resources.
(b) The management of urban water demands and efficient use of urban water supplies shall be a guiding criterion in public decisions.
(c) Urban water suppliers shall be required to develop water management plans to actively pursue the efficient use of available supplies.
System OverviewGSWC owns and operates the Bay Point System. GSWC is an investor-owned public utility company regulated by the California Public Utilities Commission (CPUC).Located in Contra Costa County, the Bay Point System serves the unincorporated community of Bay Point. The service area is primarily characterized by a mixture of residential and commercial land use. Figure 1-1 illustrates the location of the Bay Point System.
BAO/051720004 JMS SJC/W062005001 2

CHAPTER 1. INTRODUCTION AND OVERVIEW
Figure 1-1Bay Point System Location Map
Replace with 8.5 by 11 showing the location of the system in California.
BAO/051720004 JMS SJC/W062005001 3

2005 URBAN WATER MANAGEMENT PLAN—BAY POINT
California Urban Water Conservation CouncilGSWC is a signatory to the Memorandum of Understanding Regarding Urban Water Conservation in California (MOU) administered by the California Urban Water Conservation Council (Council). The Council had its beginnings as an independent entity housed under California Urban Water Agencies (CUWA). Currently, the Council is a fully independent nonprofit organization. The objective of the Council is to implement the MOU. The MOU was signed into existence in 1991 by nearly 100 urban water agencies and environmental groups. Current membership of the Council is over 300 members from various groups such as water suppliers, public advocacy organizations, and other interested groups (Council, 2004). The MOU is a document by which the signatories obligate themselves to implement the urban water conservation practices identified in the MOU. The goal of the practices in the MOU is to reduce long-term urban water demands and to provide practices that may be implemented during occasional water supply shortages (Council, 2004). The urban water conservation practices identified in the MOU are called the Best Management Practices (BMPs) and range from water audits to toilet replacements. There are 14 practices that also coincide with the 14 demand management measures (DMMs) identified in the Act.Each agency that is a signatory to the MOU is required to file reports on the implementation of the BMPs identified in the MOU. For the purposes of the UWMP, the reports filed with the Council on the BMPs that are implemented or under implementation can be substituted for the reporting requirements of Section 10631 (f) (1). The UWMP uses the reports filed with the Council in addition to any necessary analysis as described in Section 10631.
Public Utility Commission Policy ChangesConcurrent with the finalization of this document, the CPUC is considering the adoption of policy changes and objectives that would be applicable to GSWC and all other regulated water utilities. The CPUC’s draft “Water Action Plan” (WAP) has established the following objectives:1. Maintain highest standards of water quality;2. Strengthen water conservation programs to a level comparable to those of
energy utilities;3. Promote water infrastructure investment;4. Assist low income ratepayers;5. Streamline CPUC regulatory decision-making; and6. Set rates that balance investment, conservation, and affordability. The WAP is a general policy document. Specific implementation policies and programs, along with necessary modifications to CPUC ratemaking policies, will
4 BAO/051720012/JMS SJC/W062005009

CHAPTER 1. INTRODUCTION AND OVERVIEW
be developed based on the final WAP and other programs including conservation, long term planning, water quality and drought management programs developed in conjunction with the CPUC.GSWC has been actively involved with the CPUC in suggesting optimal approaches to the WAP. In particular, the GSWC has suggested specific implementation measures and modifications to certain CPUC ratesetting practices so that regulated utilities are able as a practical matter to achieve the policy objectives of the WAP. The exact implementation details have not yet been determined, but if successful, are expected to have a significant impact on GSWC approaches to the planning and management of resources. These efforts may include further investment in local resource optimization, reduced reliance on imported supplies, enhanced conservation and intensification of company-wide efforts to optimize water resource mix, including planned water supply projects and programs to meet the long term water supply needs of GSWC’s customers.In another example, the Urban Water Management Planning Act requires public water suppliers to have in place predetermined actions to be undertaken during water shortage conditions. GSWC has developed actions to be undertaken in response to water supply shortages, including up to a 50 percent reduction in water supply. However, implementation of the actions is dependent upon CPUC approval, particularly where mandatory water use restrictions may be required. As an element of the WAP and related policy improvements, GSWC has requested the CPUC adopt water shortage allocation policies that will facilitate appropriate drought response activities and associated cost recovery mechanisms.Finally, as part of the Water Action Plan process and otherwise, GSWC is seeking parity with public water agencies in key areas that will impact its long term supply planning and reliability, namely, 1) access to state bond money on behalf of its customers, and 2) full participation in integrated regional water planning mechanisms to ensure that utility customers have a voice in planning outcomes, and, equal access to available funding to implement agreed planning objectives on behalf of their customers. This UWMP presents an assessment of GSWC’s demand projections and water supply availability and reliability under currently established CPUC regulations and conditions. While GSWC has detailed approaches to providing its customers with a reliable supply of water in accordance with UWMP criteria, adoption and implementation of the WAP and other policy objectives mentioned above will likely result in changes in the resource mix described in this UWMP which will likely further improve water supply reliability.
Agency CoordinationWater Code Section 10620 details the coordination requirements of the Act and provides guidance on how the UWMP can be prepared. The text of this section states:
Section 10620
BAO/051720004 JMS SJC/W062005001 5

2005 URBAN WATER MANAGEMENT PLAN—BAY POINT
(a) Every urban water supplier shall prepare and adopt an urban water management plan in the manner set forth in Article 3 (commencing with Section 10640).
(b) Every person that becomes an urban water supplier shall adopt an urban water management plan within one year after it has become an urban water supplier.
(c) An urban water supplier indirectly providing water shall not include planning elements in its water management plan as provided in Article 2 (commencing with Section 10630) that would be applicable to urban water suppliers or public agencies directly providing water, or to their customers, without the consent of those suppliers or public agencies.
(d)(1) An urban water supplier may satisfy the requirements of this part by
participation in areawide, regional, watershed, or basinwide urban water management planning where those plans will reduce preparation costs and contribute to the achievement of conservation and efficient water use.
(2) Each urban water supplier shall coordinate the preparation of its plan with other appropriate agencies in the area, including other water suppliers that share a common source, water management agencies, and relevant public agencies, to the extent practicable.
GSWC initiated agency coordination with a mailing of letters to cities and counties within its service area, as well as to wholesale agencies, wastewater agencies, and agencies with which GSWC has emergency connections. The initial letters notified the agencies of GSWC intent and requested data for the preparation of the UWMPs. All identified agencies received a follow-up telephone call. Notices of public meeting and intent to adopt were mailed to each agency and a copy of the draft report was sent to Contra Costa Water District. Table 1-1 lists the agencies contacted during the preparation of this UWMP.
6 BAO/051720012/JMS SJC/W062005009

CHAPTER 1. INTRODUCTION AND OVERVIEW
Table 1-1Coordination with Agencies
Agency Part
icip
ated
in
UW
MP
Dev
elop
men
t
Com
men
ted
on th
e D
raft
Atte
nded
Pub
lic
Mee
tings
Con
tact
ed fo
r A
ssis
tanc
e
Rec
eive
d C
opy
of
the
Dra
ft
Sent
Not
ice
of In
tent
to
Ado
pt
Not
Invo
lved
/ N
o In
form
atio
n
Association of Bay Area Governments
City of Pittsburg
Contra Costa County
Contra Costa Water District
Delta Diablo Sanitation District
Notes1. This table is based on DWR’s Guidebook to Assist Water Suppliers in the Preparation of a 2005 Urban Water Management
Plan (DWR Guidebook) Table 1.
Public Participation and Plan AdoptionPublic participation and plan adoption requirements are detailed in the following section of the Act:
Section 10642. Each urban water supplier shall encourage the active involvement of diverse social, cultural, and economic elements of the population within the service area prior to and during the preparation of the plan. Prior to adopting a plan, the urban water supplier shall make the plan available for public inspection and shall hold a public hearing thereon. Prior to the hearing, notice of the time and place of hearing shall be published within the jurisdiction of the publicly owned water supplier pursuant to Section 6066 of the Government Code. The urban water supplier shall provide notice of the time and place of hearing to any city or county within which the supplier provides water supplies. A privately owned water supplier shall provide an equivalent notice within its service area. After the hearing, the plan shall be adopted as prepared or as modified after the hearing.For this update of the Bay Point System UWMP, a public hearing was held on November 14, 2005 at the Ambrose Park and Recreation Center in Bay Point, California. This public session was held for review and comment on the draft plan before approval by GSWC. Legal public notices for the public hearing were published in the local newspapers in accordance with Government Code Section 6066. Copies of the draft plan were available to the public at GSWC’s Bay Point office. Appendix B contains a copy of the hearing notice from a local newspaper and the meeting minutes from the public pertaining to the UWMP. Appendix C
BAO/051720004 JMS SJC/W062005001 7

2005 URBAN WATER MANAGEMENT PLAN—BAY POINT
contains comments received, if any, and Appendix H contains responses to public comments.The final UWMP, as adopted by GSWC, will be submitted to the DWR within 30 days of adoption. This plan includes all information necessary to meet the requirements of California Water Code Division 6, Part 2.6 (Urban Water Management Planning). Adopted copies of this plan are available to the public at GSWC’s Bay Point Customer Service Office.
UWMP PreparationGSWC prepared this UWMP with the assistance of its consultant, CH2M HILL, as permitted by the following section of the Act.
Section 10620(e) The urban water supplier may prepare the plan with its own staff, by
contract, or in cooperation with other governmental agencies.
During the preparation of the UWMP, documents that have been prepared over the years by GSWC and other entities were reviewed and results of those documents incorporated, as applicable, into this UWMP. The list of the documents is provided in Chapter 11.The adopted plans are available for public review at GSWC’s Bay Point Office. Copies of the plan were submitted to DWR, cities and counties within the service area, the State Library, and other applicable institutions within 30 days of adoption as required by Section 10644 and 10645.
UWMP ImplementationGSWC is committed to the implementation of this UWMP as required by Section 10643 of the Act. Each region of GSWC has a conservation coordinator that oversees the implementation of DMM via GSWC participation in the Council’s MOU.
Content of the UWMPThis UWMP addresses all subjects required by Section 10631 of the Act as defined by Section 10630, which permits “levels of water management planning commensurate with the numbers of customers served and the volume of water supplied.” All applicable sections of the Act are discussed in this UWMP, with chapters of the UWMP cross-referenced against the corresponding provision of the Act in Table 1-2.
8 BAO/051720012/JMS SJC/W062005009

CHAPTER 1. INTRODUCTION AND OVERVIEW
Table 1-2Summary of UWMP Chapters and Corresponding Provisions of the California Water Code
Chapter Corresponding Provisions of the Water Code
Chapter 1. Introduction and Overview 10642 Public participation
10643 Plan implementation
10644 Plan filing
10645 Public review availability
10620 (a)–(e) Coordination with other agencies; document preparation
10621 (a)–(c) City and county notification; due date; review
10620 (f) Resource optimization
10630 Level of planning
10641 Coordination
Chapter 2. Service Area 10631 (a) Demographics and climate
Chapter 3. Water Supply 10631 (b)–(d), (h), (k)
Water sources, reliability of supply, transfers and exchanges, supply projects, data sharing
Chapter 4. Water Use 10631 (e), (k) Water use, data sharing
Chapter 5. Demand Management Measures
10631 (f)–(g), (j) DMM
10631.5 DMM implementation status
Chapter 6. Desalination 10631 (i) Desalination
Chapter 7. Water Shortage Contingency Plan
10632 Water shortage contingency plan
Chapter 8. Recycled Water Plan 10633 Recycled water
Chapter 9. Water Quality 10634 Water quality impacts on reliability
Chapter 10. Water Service Reliability 10635 Water service reliability
Resource OptimizationSection 10620 (f) of the Act asks urban water suppliers to evaluate water management tools and options to maximize water resources and minimize the need for imported water from other regions.GSWC is committed to optimizing its available water resources and implements water conservation programs for each of its districts or customer service areas. In an effort to expand the breadth of offered programs, GSWC partners with wholesale suppliers, energy utilities, and other agencies that support water conservation programs
BAO/051720004 JMS SJC/W062005001 9

Chapter 2. Service Area
Service area requirements are detailed in the following section of the Act:
Section 10631(a) Describe the service area of the supplier, including current and projected
population, climate, and other demographic factors affecting the supplier’s water management planning. The projected population estimates shall be based upon data from the state, regional, or local service agency population projections within the service area of the urban water supplier and shall be in five-year increments to 20 years or as far as data is available.
Chapter Two summarizes the Bay Point System’s Customer Service Area (CSA) and presents an analysis of available demographics, population growth projections, and climate data to provide the basis for estimating future water requirements.
AreaThe Bay Point CSA is located in Contra Costa County. The CSA is bounded by Nichols Avenue in the west, Route 4 Freeway in the south, Driftwood Drive in the east, and Southern Pacific Railroad in the north. Figure 2-2 illustrates the customer service area of the Bay Point System. The CSA used for the current population analysis includes proposed service area annexations on the east and western boundaries of Bay Point. The service area is primarily characterized by a mixture of residential and commercial land use.
DemographicsThe Bay Point Census Designated Place (CDP) was chosen as demographically representative of the Bay Point CSA. According to 2000 U.S. census data, the median age of Bay Point’s residents is 29.8 years. Bay Point has average household size of 3.25 and a median household income of approximately $44,951.The General Plan for Bay Point CDP was not available at the time of this study. The Bay Point CSA service map indicates that there is potential land area available for new development. The preliminary general plan information provided by the Contra Costa County Planning Department staff indicated that in the future, new development projects and redevelopment projects, including affordable multi-family housing units, may potentially be implemented within Bay Point’s existing service area.
BAO/051720004 JMS SJC/W062005001 1

Figure 2-2. Bay Point Customer Service Area
(Figure 2-1 is inserted on a separate page (8.5x11))
BAO/051720004 JMS SJC/W062005001 2

CHAPTER 2. SERVICE AREA
Population, Housing and EmploymentPopulation, housing, and employment projections were developed for the Bay Point System using the Association of Bay Area Governments (ABAG) population, housing and employment data. ABAG recently updated its projections for population, household, and employment growth through the year 2030 using 2000 U.S. Census data. ABAG’s methodology is described below, followed by the derivation of population projections for the Bay Point System. The current population projections differ from previous projections developed in 2000 primarily by the use of 2000 U.S. Census data. Previous projections utilized 1990 U.S. Census data.
ABAG Population Projection Development MethodologyThe Association of Bay Area Governments (ABAG) is a regional planning agency that provides demographic and economic data analysis for Contra Costa County. ABAG’s population projections are driven by economic and demographic mathematical models and constrained by examining local government’s plans, policies, and regulations affecting land development. The forecasts and projections are grouped into many geographical categories, including regional, county, city, and census tract. To evaluate the Bay Point System, ABAG data was used in census tract form, the smallest geographic division of data that ABAG provides. Population, household and employment projections are based on the data collected on availability of vacant land, timing of expected future development, type of future development, density of development, transportation availability, land use policy constraints on development, and other land use-related factors that could affect development. ABAG applies a statistical cohort-survival model and the household size to the 2000 U.S. Census data for regional, county, and household demographic projections. The cohort model projects population by adding increases in population (births and relocation into the region) and subtracting decreases in population (deaths and relocation out of the region). The cohort model uses a group quartered population, meaning it is broken down by sex, age, and ethnicity. Projected household size is calculated for each city and county based upon observed trends as well as on assumptions about household formation, housing costs, the cost of travel for work and other activities, education, which is highly correlated with income, changing ethnic composition, and births. ABAG uses household size to project regional and county households by dividing the projected resident population by projected household size.Employment is predicted using data from several governmental agencies, including the U. S. Census Bureau and two State of California departments: the Employment Development Department and the Franchise Tax Board. The U. S. Census Bureau data are taken from the Census Transportation Planning Package and the County Business Patterns database. Population and income data are derived from the State of California Department of Finance.
BAO/051720004 JMS SJC/W062005001 3

2005 URBAN WATER MANAGEMENT PLAN—BAY POINT
The detailed explanation of the population, household and employment projection process employed by ABAG is provided in the report: Forecasts for San Francisco Bay Area to the Year 2030 (ABAG Projections, 2005).
Bay Point CSA Population ProjectionsABAG-derived census-tract projections were used to determine population from 2000 to 2030. The Bay Point System service area boundary contains multiple census tracts, many of which have boundaries that do not coincide exactly with the service area boundaries. The population projection analysis consisted of superimposing the service area boundary over census tract boundaries, identifying the applicable overlapping census tracts, and developing a percentage estimate for each overlapping area. For a census tract 100 percent within the service area boundary, it was assumed that 100 percent of the associated census tract population data was applicable to the Bay Point System. For areas where the overlap was not exact, the area of overlap as a percentage was applied to the data to develop an estimate of applicable population. Appendix J, Table J-1 lists the census tracts with a corresponding estimate of what percent of each tract lies within the Bay Point System. It was typically assumed that the various types of housing and employment distributed within a census tract are distributed uniformly within all parts of that census tract, unless maps indicated non-uniform concentrations. In these cases, population estimates were either increased or decreased as applicable to match the existing land use. Appendix J, Table J-2 contains all of ABAG’s historic and projected demographic data for each census tract from 2000 through 2030. Figure 2-2 details the census tracts within the Bay Point CSA. As concluded from analysis of ABAG demographic data, the Bay Point System has an estimated population of 23,923 people in 2005. This population is expected to reach 33,184 by 2030. A summary of historic and projected population, households, and employment within the Bay Point System (based on ABAG data) is presented in Table 2-3 and illustrated in Figure 2-3.In summary, from 2000 to 2005 the Bay Point population increased 7 percent, which is a growth rate1 of approximately 1.3 percent per year. By 2030, the population is expected to increase by a total of 39 percent, from 23,923 in 2005 to 33,184 in 2030, which is a 1.3 percent growth rate per year. The number of households is expected to grow 42 percent during the same period, which equates to an annual household growth rate of 1.4 percent. Employment is expected to grow 128 percent during the same period, which equates to an annual employment growth rate of 3.35 percent. Areas with the highest projected growth increases are also the areas that will see the largest increase in water use. ABAG’s demographic analysis does not project “build-out” year, i.e. the year at which the planning area has reached its maximum population. As discussed in the demographic section, land area is available for future potential growth.
1 Growth rate: The number of persons added to (or subtracted from) a population in a year due to natural increase or net migration; expressed as percentage of population at the beginning of the time period. (Source: http://www.prb.org)
4 BAO/051720012/JMS SJC/W062005009

CHAPTER 2. SERVICE AREA
Table 2-3.Bay Point CSA Historical and Projected Population
Year Service Area Population
Service Area Household
Service Area Employment
20002 22,394 6,791 601
2005 23,923 7,233 646
2010 25,142 7,632 680
2015 28,087 8,556 746
2020 30,069 9,212 900
2025 31,502 9,745 1,156
2030 33,184 10,271 1,473
Notes1. This table is based on the DWR Guidebook Table 2.2. Based on fiscal year.3. Dashed line represents division between historic and projected data
0
5,000
10,000
15,000
20,000
25,000
30,000
35,000
2000 2005 2010 2015 2020 2025 2030Year
Pop
ulat
ion\
Hou
seho
lds\
Em
ploy
ees
Population
Household
Employment
Figure 2-3. Historical and Projected Population, Household and Employment Growth within the Bay Point CSA.
BAO/051720004 JMS SJC/W062005001 5

2005 URBAN WATER MANAGEMENT PLAN—BAY POINT
ClimateBay Point CSA has cool, humid winters and hot, dry summers. The Western Regional Climate Center (WRCC) has maintained 30 years of historic climate data for select cities only. WRCC does not have a station at Bay Point and therefore the Antioch station, 8 miles from Bay Point, is utilized for the climate data analysis. The Western Regional Climate Center web site (www.wrcc.dri.edu) has maintained historical climate records for the past 30 years for Antioch. Table 2-4 presents the monthly average climate summary based on 30 year historical data for the Bay Point System. In winter, the lowest average monthly temperature is approximately 37 degrees Fahrenheit, while the highest average monthly temperature reaches approximately 91 degrees Fahrenheit in the summer. Figure 2-4 presents the monthly average precipitation based on 30 year historical data. The rainy season is from November to March. Monthly precipitation during the winter months ranges from 2 to 3 inches. Low humidity occurs in the summer months from May to September. The combination of hot and dry weather during the summer months typically results in moderately high water demand. Similar to the Western Regional Climate Center, the California Irrigation Management Information System (CIMIS) web site (http://www.cimis.water.ca.gov) tracks and maintains records of evapotranspiration (ETo) for select cities only. ETo statistics used for this system come from the Concord station, which is 10 miles from the Bay Point CSA. ETo is a standard measurement of environmental parameters that affect the water use of plants. ETo is given in inches per day, month, or year and is an estimate of the evapotranspiration of a large field of well-watered, cool-season grass that is four- to seven-inches tall. The monthly average ETo is presented in inches in Table 2-4. As the table indicates, a greater quantity of water evaporated during July and August in correlation to high temperatures and low humidity, which may result in high water demand.
Table 2-4Monthly Average Climate Data Summary for Bay Point CSA
MonthStandard Monthly
Average ETo(2) (inches)Average Total Rainfall
(inches)
Average Temperature (degrees Fahrenheit)
Max Min
January 1.1 2.8 53.6 37.0
February 1.4 2.43 60.2 40.9
March 2.4 1.93 65.4 43.4
April 4.0 0.88 71.4 46.2
May 5.5 0.38 78.5 51.2
June 5.9 0.1 86.1 56.0
July 7.0 0.02 91.0 57.2
August 6.0 0.05 90.0 56.7
6 BAO/051720012/JMS SJC/W062005009

CHAPTER 2. SERVICE AREA
Table 2-4Monthly Average Climate Data Summary for Bay Point CSA
MonthStandard Monthly
Average ETo(2) (inches)Average Total Rainfall
(inches)
Average Temperature (degrees Fahrenheit)
Max Min
September 4.8 0.21 86.3 55.1
October 3.2 0.7 77.6 50.1
November 1.3 1.66 64.2 42.7
December 0.7 2.12 54.6 37.2
Notes1. This table is based on the DWR Guidebook Table 3.2. Evapotranspiration (ETo) from http://www.cimis.water.ca.gov/cimis/welcom.jsp
0
0.5
1
1.5
2
2.5
3
Jan Feb Mar Apr May Jun Jul Aug Sep Oct Nov Dec
Month
Mon
thly
Ave
rage
Pre
cipi
tatio
n (in
ches
)
Monthly Average Precipitation
Figure 2-4. Monthly Average Precipitation in Bay Point CSA based on 30 Year Historical Data
BAO/051720004 JMS SJC/W062005001 7

Chapter 3. Water Supply
A detailed evaluation of water supplies is requested by the Act. Sections 10631 (a) through (d) and (h) require the following:(b) Identify and quantify, to the extent practicable, the existing and planned
sources of water available to the supplier over the same five-year increments described in subdivision (a). If groundwater is identified as an existing or planned source of water available to the supplier, all of the following information shall be included in the plan: (1) A copy of any groundwater management plan adopted by the urban
water supplier, including plans adopted pursuant to Part 2.75 (commencing with Section 10750), or any other specific authorization for groundwater management.
(2) A description of any groundwater basin or basins from which the urban water supplier pumps groundwater. For those basins for which a court or the board has adjudicated the rights to pump groundwater, a copy of the order or decree adopted by the court or the board and a description of the amount of groundwater the urban water supplier has the legal right to pump under the order or decree. For basins that have not been adjudicated, information as to whether the department has identified the basin or basins as overdrafted or has projected that the basin will become overdrafted if present management conditions continue, in the most current official departmental bulletin that characterizes the condition of the groundwater basin, and a detailed description of the efforts being undertaken by the urban water supplier to eliminate the long-term overdraft condition.
(3) A detailed description and analysis of the location, amount, and sufficiency of groundwater pumped by the urban water supplier for the past five years. The description and analysis shall be based on information that is reasonably available, including, but not limited to, historic use records.
(4) A detailed description and analysis of the amount and location of groundwater that is projected to be pumped by the urban water supplier. The description and analysis shall be based on information that is reasonably available, including, but not limited to, historic use records.
(c) Describe the reliability of the water supply and vulnerability to seasonal or climatic shortage, to the extent practicable, and provide data for each of the following: (1) An average water year. (2) A single dry water year. (3) Multiple dry water years. For any water source that may not be available at a consistent level of use, given specific legal, environmental, water quality, or climatic factors,
BAO/051720004 JMS SJC/W062005001 1

describe plans to supplement or replace that source with alternative sources or water demand management measures, to the extent practicable.
(d) Describe the opportunities for exchanges or transfers of water on a short-term or long-term basis.
(h) Include a description of all water supply projects and water supply programs that may be undertaken by the urban water supplier to meet the total projected water use as established pursuant to subdivision (a) of Section 10635. The urban water supplier shall include a detailed description of expected future projects and programs, other than the demand management programs identified pursuant to paragraph (1) of subdivision (f), that the urban water supplier may implement to increase the amount of the water supply available to the urban water supplier in average, single dry, and multiple dry water years. The description shall identify specific projects and include a description of the increase in water supply that is expected to be available from each project. The description shall include an estimate with regard to the implementation timeline for each project or program.
This chapter addresses the water supply sources of the Bay Point System. The following sections provide details in response to those requirements of this portion of the Act.
Water SourcesThe Golden State Water Company (GSWC) currently obtains its water supply for the Bay Point System from local groundwater and purchased water from the Contra Costa Water District (CCWD). CCWD obtains its water supply for the Bay Point System from the Contra Costa Canal. The Contra Costa Canal is owned by the U. S. Bureau of Reclamation (USBR) and is operated by CCWD. CCWD’s primary source is the USBR’s Central Valley Project (CVP). Other sources of water for the CCWD include the San Joaquin River, Mallard Slough, recycled water, a minor amount of local well water, and water transfers.Groundwater currently is pumped from a total of three wells in the Pittsburg Plain Groundwater Basin. These wells have a total active capacity of 190 gallons per minute (gpm) (306 ac-ft/yr) and between 2000 and 2004, the actual production averaged 238 ac-ft/yr. GSWC is entitled to purchase both raw and treated water from CCWD. The Bay Point System has the following two delivery points from CCWD: Contra Costa Canal, a raw water connection Port Chicago, a treated water connection.Water delivered to GSWC by CCWD through the Contra Costa Canal is treated by GSWC at GSWC’s Hill Street Water Treatment Plant, which has a capacity of up to 2,880 gpm (4,648 ac-ft/yr). The Port Chicago treated water connection has an ultimate capacity of 1,980 gpm (3,195 ac-ft/yr). In addition, the Bay Point System has an emergency connection with the City of Pittsburg.
BAO/051720004 JMS SJC/W062005001 2

CHAPTER 3. WATER SUPPLY
Table 3-5 summarizes the current and planned water supplies available to GSWC for the Bay Point System that will meet their projected water demands under normal years. This water supply summary is based on groundwater analysis and data provided by CCWD. Purchased water from CCWD makes up between 92 and 94 percent of the available supply, whereas the remainder is supplied by groundwater. There is no recycled water supply for the Bay Point System (see Chapter 8 for details).
Table 3-5Current and Planned Water Supplies for the Bay Point System in ac-ft/yr
Source 2005 2010 2015 2020 2025 2030
Purchased water from CCWD 2,688 2,846 3,215 3,474 3,679 3,889
Groundwater(1) 230 230 230 230 230 230
Recycled water 0 0 0 0 0 0
Total 2,918 3,076 3,445 3,704 3,909 4,119
Notes1. Based on projected use in the Pittsburg Plain Groundwater Basin 2. Table format based on DWR Guidance Document Table 4
GSWC’s water supply is projected to increase by about 41 percent from 2005 to 2030 to meet the associated projected water demands, with most of this demand being met by purchased water from CCWD. Water demand projections are documented in Chapter 4. Details of the groundwater supply are presented in the following section followed by a discussion of the reliability of both sources of water supply.
GroundwaterThe Bay Point System is supplied by three wells located in the Pittsburg Plain Groundwater Basin.
Pittsburg Plain BasinThe Pittsburg Plain Groundwater Basin has a surface area of approximately 11,600 ac (18 square miles). It is bounded by Suisun Bay on the north, the Tracy Basin on the east, the Clayton Basin on the west, and the Los Medanos Hills on the south. Kirker Creek and Willow Creek overlay the basin, and drain from the Los Medanos Hills northward into Suisun Bay (DWR, 2003). The water-bearing units in the basin are Pleistocene to Recent age alluvium deposits consisting of highly lenticular beds of gray and brown sand, sand and gravel, and blue and yellow clay. The Pleistocene deposits consist of consolidated and unconsolidated sediments that occur throughout the basin. The modern alluvial sediments consist of soft, water saturated mud, peat, and loose sands that occur along the Suisun Bay shoreline (DWR, 2003). The amount of groundwater storage within the basin is unknown. Seawater intrusion has been found to occur within the basin, as it is adjacent to Suisun
BAO/051720004 JMS SJC/W062005001 3

2005 URBAN WATER MANAGEMENT PLAN—BAY POINT
Bay. Historically groundwater levels have remained stable except during the two drought periods for the basin, which were 1976 - 1977 and 1987 – 1992 (DWR, 2003).
Basin AdjudicationThe Pittsburg Plain Groundwater Basin is not managed or adjudicated. GSWC generally pumps between 8 and 10 percent of its total water supply from the Pittsburg Plain Groundwater Basin. Historically, GSWC has pumped an annual maximum of 550 ac-ft. Table 3-6 lists the wells along with the well capacity for the Bay Point System. The total current active well capacity for GSWC’s Bay Point System is 190 gpm (306 ac-ft/yr).
Table 3-6Wells and Well Capacity in the Bay Point System in ac-ft/yr
Well Name Design WellCapacity
(gpm)
Design WellCapacity(ac-ft/yr)
Normal YearWell Capacity
(gpm)
Normal YearWell Capacity
(ac-ft/yr)
Status
Hill Street No. 1 310 500 100 161 Active
Hill Street No. 2 88 142 60 97 Active
Chadwick No. 3 45 73 30 48 Active
Total Capacity 443 715 190 306
Active Capacity 443 715 190 306
Notes1 Active well status indicates the well is available for the current water supply
The pumping history for the Bay Point System is shown in Table 3-7 for calendar years (January 1 – December 31) 2000 to 2004. Pumping amounts have generally been consistent over the last 5 years, providing 8 percent to 10 percent of the water supply for the Bay Point System.
Table 3-7Groundwater Pumping History by Bay Point System (2000 to 2004) in ac-ft
Basin Name 2000 2001 2002 2003 2004
Pittsburg Plain 268 245 227 233 218
Percent of Total Water Supply
10 9 8 8 8
Notes1. Table format based on DWR Guidance Document Table 62. Years are reported in calendar years (January 1 – December 31)
Table 3-8 shows the projected groundwater pumping amounts by the Bay Point System. The pumping amounts are based on recent historical groundwater pumping amounts. Groundwater comprises a small portion of the total water
4 BAO/051720012/JMS SJC/W062005009

CHAPTER 3. WATER SUPPLY
supply for the Bay Point System. In addition, there is generally little pumping from other users within the basin. As a result, the projected pumping for the Bay Point System (230 ac-ft/yr) should not create any negative impacts on the basin.
Table 3-8Projected Groundwater Pumping Amounts by Bay Point System to 2030 in ac/ft
Basin Name 2005 2010 2015 2020 2025 2030
Pittsburg Plain 230 230 230 230 230 230
Percent of Total Water Supply
8 7 7 6 6 6
Notes1. Table format based on DWR Guidance Document Table 72. Years are reported in calendar years (January 1 – December 31)
Reliability of SupplyThe Bay Point System gets its water supply from two sources, purchased water from CCWD and groundwater. Therefore, conditions in local and distant areas can impact the reliability of supplies. In general, GSWC’s supply is expected to be 100 percent reliable through 2030 in normal years. This reliability is a result of, 1) the projected reliability of CCWD, which expects to be 100 percent reliable, and, 2) reliable groundwater supply from the Pittsburg Plain Groundwater Basin. The following is a summary of the basis of this reliability.
CCWD’s Water Supply Reliability The CCWD has taken steps to identify improvements that will support the reliability of their water source. These efforts are described in the Future Water Supply Study (FWSS) as adopted by the CCWD Board of Directors. The FWSS was updated in 2002. The FWSS includes a Preferred Alternative that provides drought reliability and operational flexibility in the short-term while maintaining long-term supply targets to meet projected demands. This preferred alternative includes, a) Re-negotiation of the CCWD’s existing Central Valley Project (CVP) Amendatory contract (I75r-3401), b) implementation of expanded District wide conservation program, which would achieve a target of at least 5 percent District-wide savings by the year 2040, and c) potentially two or more water transfers that would strengthen the reliability of supplies and provide drought protection for existing customers and bridge the gap between water supplies and projected demands. The water supply reliability goal adopted as part of the FWSS under CVP is to provide 100 percent of demand in normal years and minimum of 85 percent of demand in the second and third years of a multiple dry-year period. Up to 15 percent of demand during an extended drought may be met with short-term water transfers and demand management (CCWD 2005).Water transfers are identified in the FWSS as a preferred means of strengthening drought protection for existing customers and meeting supply shortfalls. The purchase of water transfers would follow an incrementally stepped approach, triggered by increases in demand as a result of approved growth within the
BAO/051720004 JMS SJC/W062005001 5

2005 URBAN WATER MANAGEMENT PLAN—BAY POINT
Contra Costa County and cities within CCWD. Long and short-term transfers and exchange opportunities are available to CCWD.
Long-term Water TransfersThe February 2000 Agreement with East Contra Costa Irrigation District (ECCID) to transfer surplus irrigation water was the first long-term water transfer for CCWD. Currently, up to 9,700 ac-ft/yr (5,700 ac-ft in normal years and 9,700 ac-ft in CVP shortage years) is available under the agreement. In the future, this agreement will provide up to 12,200 ac-ft/yr (8,200 ac-ft in normal years and up to 12,200 ac-ft in CVP shortage years). The following water transfer opportunities are being evaluated by CCWD: Conjunctive use with long-term contract: CCWD would partner with an agricultural district holding pre-1914 surface water rights and co-invest in conjunctive use facilities, such as new groundwater wells. The new wells would allow the agricultural district to shift use from surface water to groundwater supplies in dry years and exchange its surface water supplies to the CCWD to meet dry-year demand.Groundwater banking: CCWD would extend the reliability of its existing CVP supplies by banking, through groundwater storage, surplus CVP entitlement or other available wet year supplies such as CVP Section 215 water. CCWD would draw upon the banked water supplies to meet demand when needed.Lease/purchase water rights and remarket surplus supplies: CCWD would enter into a long-term water supply lease or purchase an existing water right. The lease or sale would be for a fixed amount of annual supplies. All surplus water supplies would be remarketed through a long-term contract with a third-party buyer or the spot market.Co-investment in agricultural conservation: This option would involve forming a long-term relationship with agricultural partner holding pre-1914 water rights. CCWD would invest in agricultural conservation infrastructure, such as canal lining and weed abatement projects. A fixed amount of conserved supplies would be made available to CCWD annually and any surplus supplies could be banked through groundwater storage or remarketed.Fallowing or crop shifting option contract: This option includes a long-term option contract with an agricultural district. When called upon by CCWD through exercise of the option, the agricultural district would fallow or shift crops to make water supplies available.
Short-term Water TransfersCCWD also has experience in implementing short-term water transfers. CCWD purchased water from various agencies in 2000, 2003 and 2004. The goal of the short-term transfer program was to establish relationships with sellers, work through the various institutional issues associated with transfers before a serious water shortage occurs, and to develop water transfer agreements that would allow CCWD to purchase water in shortage years. In addition, if required CCWD would pursue additional short-term water transfers directly from agricultural districts (in Northern California), who participate in the spot market each year.
6 BAO/051720012/JMS SJC/W062005009

CHAPTER 3. WATER SUPPLY
In addition to the water transfers and purchases, water recycling is a component of CCWD’s long-term sustainable water supply strategy. The recycled water would be used for various purposes including urban landscaping and golf course irrigation and for industrial uses. CCWD will continue to work with local wastewater agencies to implement recycled water projects that are financially viable, provide beneficial use and are consistent with appropriate legal, public health and environmental requirements (CCWD, 2005).
GSWC’s Groundwater Supply ReliabilityThe California Department of Water Resources has reported that no data relating to groundwater storage capacity or groundwater in storage in the Pittsburg Plain Basin has been published (DWR, 2005). Historically, GSWC’s Bay Point System has reliably produced approximately 220 ac-ft/yr to 550 ac-ft/yr. Based on the Basin’s reliability, GSWC’s groundwater supply for the Bay Point System is expected to continue to be 100 percent reliable
Bay Point System’s Water Supply ReliabilitySupply reliability for the Bay Point System depends on the reliability of purchased water from CCWD and local groundwater supplies, as discussed above. Table 3-9 presents water supply projections for purchased water and groundwater sources during a normal year, a single-dry year, and multiple-dry years for the Bay Point System for the year 2030. The normal-year supply represents the expected supply under average hydrologic conditions, the dry-year supply represents the expected supply under the single driest hydrologic year, and the multiple-dry year supply represents the expected supply during a period of three consecutive dry years. CCWD expects to be 100 percent reliable during normal years for the next twenty-five years. However, CCWD anticipates shortages in supply during multiple-dry years. CCWD estimates that at least 85 percent of demand will be met by CVP and other sources in a second or third dry year during multiple dry-years. The remaining 15 percent would be met by short-term water purchases and a voluntary short-term conservation program.
Table 3-9Supply Reliability for the Bay Point System for Year 2030 in ac-ft/yr
SourceNormal Water
Year Single-Dry Water Year
Multiple-Dry Water Years
Year 1 Year 2 Year 3
Purchased water from CCWD 3,889 3,889 3,889 3,306 3,306
Groundwater 230 230 230 230 230
Total 4,119 4,119 4,119 3,536 3,536
Percent of Normal 100 100 86 86
Notes1. Table format based on DWR Guidance Document Table 8
BAO/051720004 JMS SJC/W062005001 7

2005 URBAN WATER MANAGEMENT PLAN—BAY POINT
Table 3-10 lists single-dry year and multiple-dry year periods for both groundwater and purchased water supplies. For purchased water supplies, the CVP conditions (those were used in the CCWD’s UWMP for supply projections) are as follows: (i) a normal year is adjusted historical use; (ii) a single dry-year is 85 percent of historical use, and (iii) a multiple dry-year is 85 percent, 75 percent and 65 percent of historical use for year 1, 2 and 3, respectively. The water supply reliability goal adopted by the CCWD is to meet at least 85 percent of demand in a second or third dry year and 100 percent of demand in other years. As it has been stated earlier, a short-term water purchases along with voluntary short term conservation (with a request for up to 5 and 15 percent in the second and third years of a multiple dry-year period, respectively) would be considered to meet demands during the second and third years of a multiple dry-year periods (CCWD, 2005).The reliability of groundwater is dependent on local hydrologic conditions and availability of other water for augmented recharge. For the groundwater reliability analysis, precipitation data from 1949 through 2004 were reviewed. Western Regional Climate Center (WRCC) obtained the water year basis data at Port Chicago, CA. Precipitation data was evaluated from Water Year (WY) 1948-49 through WY 2003-04. WY 1971-72 (October 1, 1971 - September 30, 1972) was the single driest year with 7.89 inches of precipitation. The normal water year was based on DWR’s description of the median water year over the period of record. The median annual precipitation between WY 1949 and WY 2004 at Port Chicago was 13.56 inches. Based on the median precipitation, the normal water year was 1978. The multiple dry year period of WY 1988 through WY 1990 recorded the lowest 3-year total of precipitation. Through the period of record for the precipitation data, the groundwater supply in the Pittsburg Plain Groundwater Basin has been reliable. Based on historic conditions in the Basin, the groundwater supply in the Basin should be reliable in the future, including during drought conditions.In the past, GSWC’s groundwater supply for the Bay Point System has been 100 percent reliable. Based on projected water demands and water use through 2030, the groundwater supply for the Bay Point System is expected to be 100 percent reliable in the future. The Bay Point System has historically pumped 218 ac-ft/yr to 268 ac-ft/yr for the past five years. It is projected the Bay Point System will pump annual amounts of approximately 230 ac-ft/yr between 2005 and 2030.
Table 3-10Basis of Water Year Data
Water Year Type Base Year(s) Historical Sequence
-Purchased Water(1)
Normal Water Year N/A
Single-Dry Water Year N/A
Multiple-Dry Water Years N/A
8 BAO/051720012/JMS SJC/W062005009

CHAPTER 3. WATER SUPPLY
Table 3-10Basis of Water Year Data
Water Year Type Base Year(s) Historical Sequence
Groundwater(2)
Normal Water Year(3) 1978 1949 – 2004
Single-Dry Water Year 1972 1949 – 2004
Multiple-Dry Water Years 1988 – 1990 1949 – 2004 Notes1. The CVP conditions used for supply projections are as follows: (i) a normal year is adjusted historical use; (ii) a single
dry-year is 85 percent of historical use, and (iii) a multiple dry-year is 85 percent, 75 percent and 65 percent of historical use for year 1, 2 and 3, respectively.
2. Data used was from Western Regional Climate Center record of precipitation at Port Chicago on water year basis3. Normal Water Year calculated from median precipitation from WY 1949 – WY 2004 4. Table format based on DWR Guidance Document Table 9
Factors Resulting in Inconsistency of SupplyTable 3-11 presents factors that could potentially result in inconsistency of supply for the Bay Point System.The Pittsburgh Plain Groundwater Basin is not currently adjudicated. There is little groundwater production within the basin and there are no anticipated future legal restrictions on the basin.
Table 3-11Factors Resulting in Inconsistency of Supply
Name of Supply Legal Environmental Water Quality Climatic
CCWD N/A N/A N/A N/A
Groundwater, Pittsburg Plain Groundwater Basin
N/A N/A N/A N/A
Notes1. Table format based on DWR Guidance Document Table 102. N/A – Not Applicable
Regulatory restrictions could occur as a result of hydrology or environmental requirements. The environmental requirements could result in diversion restrictions due to water releases for fish and wildlife uses. CCWD reserves the right to allocate the water supply to its customers in the event of water shortages.
Transfers and ExchangesThere are no planned transfer and/or exchange opportunities in the Bay Point System at this time; therefore, Table 3-12 has been left blank.
BAO/051720004 JMS SJC/W062005001 9

2005 URBAN WATER MANAGEMENT PLAN—BAY POINT
Table 3-12Transfer and Exchange Opportunities
Source Transfer Agency
Transfer or Exchange Short Term
Proposed Quantities Long term
Proposed Quantities
GSWC N/A N/A N/A N/A N/A
Notes1. Table format based on DWR Guidance Document Table 11
Planned Water Supply Projects and ProgramsAs part of its normal maintenance and operations, GSWC will construct new wells, pipelines, and treatment systems as needed as a part of its ongoing Capital Improvement Program to maintain its supply and meet distribution system requirements. CCWD’s planned projects include renewal of water service contract for CVP water, implementation of an expanded conservation program, additional recycled water supplies, future desalination water supplies, groundwater and water transfers. The Preferred Alternative identified in the FWSS included renewal of CCWD’s water service contract for CVP water, which has been completed; implementation of an expanded conservation program; and water transfers to bridge the gap between projected demand and supplies (CCWD, 2005).There are no planned water supply projects and programs in the Bay Point System at this time therefore, Table 3-13 was left blank.
Table 3-13Future Water Supply Projects in ac-ft
Project Name Normal Year Single Dry YearMultiple Dry Years
Year 1 Year 2 Year 3
N/A N/A N/A N/A N/A N/A
Notes1. This table is based on the DWR Guidebook Table 17
Wholesale Agency Supply DataTable 3-14 provides CCWD’s existing and planned water sources available to the Bay Point System under normal years. These supplies are expected to meet the projected imported water demands. The primary source of CCWD’s water supply is CVP water. Other sources include the San Joaquin River, Mallard Slough, recycled water, a minor amount of local well water, and water transfers.
10 BAO/051720012/JMS SJC/W062005009

CHAPTER 3. WATER SUPPLY
Table 3-14Existing and Planned Water Sources Available to the Bay Point System as Identified by CCWD in ac-ft/yr
Wholesaler
Sources
2010 2015 2020 2025 2030
Existing
Planned
Existing
Planned
Existing
Planned
Existing
Planned
Existing
Planned
CCWD 2,846 N/A 3,215 N/A 3,474 N/A 3,679 N/A 3,889 N/A
Notes1. Table format based on DWR Guidance Document Table 20
Table 3-15 demonstrates the reliability of wholesale water supply to meet annual water demand of the Bay Point System. The table includes a single-dry year and multiple-dry year supplies for the year 2030. CCWD does not anticipate any supply deficits in normal years due to CCWD’s long-term conservation program and the use of purchases from ECCID under the current agreement. CCWD estimates that at least 85 percent of demand will be met in a second or third dry year during multiple dry-years. The remaining 15 percent would be met by short-term water purchases and a voluntary short-term conservation program.
Table 3-15Reliability of Wholesale Supply for Year 2030 in ac-ft/yr
Multiple-Dry Water Years
Wholesaler Single Dry Year 1 Year 2 Year 3
CCWD 3,889 3,889 3,306 3,306
Percent Normal 100 100 85 85
Notes1. Table format based on DWR Guidance Document Table 21
Table 3-16 lists factors affecting wholesale supply for the Bay Point System. CCWD is implementing a comprehensive water quality strategy to protect and improve source and treated water quality for its customers. CCWD’s multi-pronged approach includes seeking improved water quality sources, reducing impacts of the Sacramento-San Joaquin Delta (Delta) agricultural drainage on source water quality, participating in collaborative research on advanced water treatment of Delta water, and supporting regulatory and legislative initiatives for improving drinking water quality and source water protection (CCWD 2005).
Table 3-16Factors Affecting Wholesale Supply
Name of Supply Legal Environmental Water Quality Climatic
CCWD N/A N/A N/A N/A
Notes1. Table format based on DWR Guidance Document Table 22
BAO/051720004 JMS SJC/W062005001 11

2005 URBAN WATER MANAGEMENT PLAN—BAY POINT
12 BAO/051720012/JMS SJC/W062005009

Chapter 4. Water Use
Section 10631 (e) of the Act requires that an evaluation of water use be performed for the Bay Point System. The Act states the following:
Section 10631 (e)
(1) Quantify, to the extent records are available, past and current water use, over the same five-year increments described in subdivision (a), and projected water use, identifying the uses among water- use sectors including, but not necessarily limited to, all of the following uses: (A) Single-family residential (B) Multifamily(C) Commercial(D) Industrial(E) Institutional and governmental(F) Landscape(G) Sales to other agencies(H) Saline water intrusion barriers, groundwater recharge, or
conjunctive use, or any combination thereof(I) Agricultural.
(2) The water-use projections shall be in the same five-year increments described in subdivision (a).
In addition, Section 10631 (k) directs urban water suppliers to provide existing and projected water-use information to wholesale agencies from which water deliveries are obtained. The Act states the following:Section 10631
(k) Urban water suppliers that rely upon a wholesale agency for a source of water, shall provide the wholesale agency with water-use projections from that agency for that source of water in five-year increments to 20 years or as far as data is available. The wholesale agency shall provide information to the urban water supplier for inclusion in the urban water supplier’s plan that identifies and quantifies, to the extent practicable, the existing and planned sources of water as required by subdivision (b), available from the wholesale agency to the urban water supplier over the same five-year increments, and during various water-year types in accordance with subdivision (c). An urban water supplier may rely upon water supply information provided by the wholesale agency in fulfilling the plan informational requirements of subdivisions (b) and (c), including, but not limited to, ocean water, brackish water, and groundwater, as a long-term supply.
As part of the Urban Water Management Plans, California regulation requires water suppliers to quantify past and current water use and to project the total water demand for the water system. Projections of future water demand allow a
BAO/051720004 JMS SJC/W062005001 1

water supplier to analyze if future water supplies are adequate, as well as help the agency when sizing and staging future water facilities. Water use and production records, combined with population and employment projections, provide the basis for estimating future water requirements. This chapter presents an analysis of water use data and the resulting projections for future water needs in the Bay Point System.
Historical and Projected Water UseHistorical water use data from 1980 to 2004 was analyzed in order to estimate the future water demands for the Bay Point System. Projections for the number of service connections and future water use were calculated for the year 2005 through 2030 in five-year increments. Future water demands were estimated using two different methods, a population-based approach and a historical-trend approach, in order to present a projection range. Detailed descriptions of how the population-based and historical-trend projections were calculated are provided below.The population-based projections resulted in estimated future water demands in excess of those calculated using historical-trend projections. This is due to the fact that ABAG’s projected growth rates exceed the actual growth rates experienced within the Bay Point System’s service area over the past twenty years. GSWC has opted to use the population-based projections for future water demand estimates even though it is considered unlikely that actual demand increases will reach the levels predicted. Using these more conservative numbers will ensure that a reliable water supply is available should future water demands within the Bay Point System exceed the levels anticipated based on historic water use.The range established between these two approaches is intended as supplemental information; all recommendations are based on the population-based projections. The historical-trend projections are provided as ancillary information only. Figure 4-5 shows the historical and projected number of metered service connections for the Bay Point System from 1980 through 2030. Figure 4-6 shows the historical and projected water use for the Bay Point System from 1985 until 2030.
BAO/051720004 JMS SJC/W062005001 2

CHAPTER 5. DEMAND MANAGEMENT MEASURES
0
1000
2000
3000
4000
5000
6000
7000
8000
1980 1985 1990 1995 2000 2005 2010 2015 2020 2025 2030
Year
Num
ber o
f Act
ive
Con
nect
ions
Population-Based Projections
Historical-Trend Projections
Historical Number of Connections
Figure 4-5. Historical and Projected Number of Metered Service Connections
0
500
1000
1500
2000
2500
3000
3500
4000
4500
1980 1985 1990 1995 2000 2005 2010 2015 2020 2025 2030
Year
Wat
er U
se (a
c-ft
/yr)
Population-Based Projections
Historical-Trend Projections
Historical Water Use
Figure 4-6. Historical Water Use and Future Water Use Projections
In order to generate estimates of future water demands, historical water use records from 1985 through 2004 were analyzed. The customer billing data for the system consists of annual water sales data. The water sales data was sorted by customer type using the assigned North American Industry Classification System (NAICS) codes. Then the sorted water sales data was further grouped into the following 8 categories: single family, multi-family, industrial, commercial, institutional/government, landscape, agriculture, and others. For each category, a water use factor was calculated in order to quantify the average water used per metered connection. For a given customer type, the unit water use factor is calculated as the total water sales for the category divided by
BAO/051720004 JMS SJC/W062005001 3
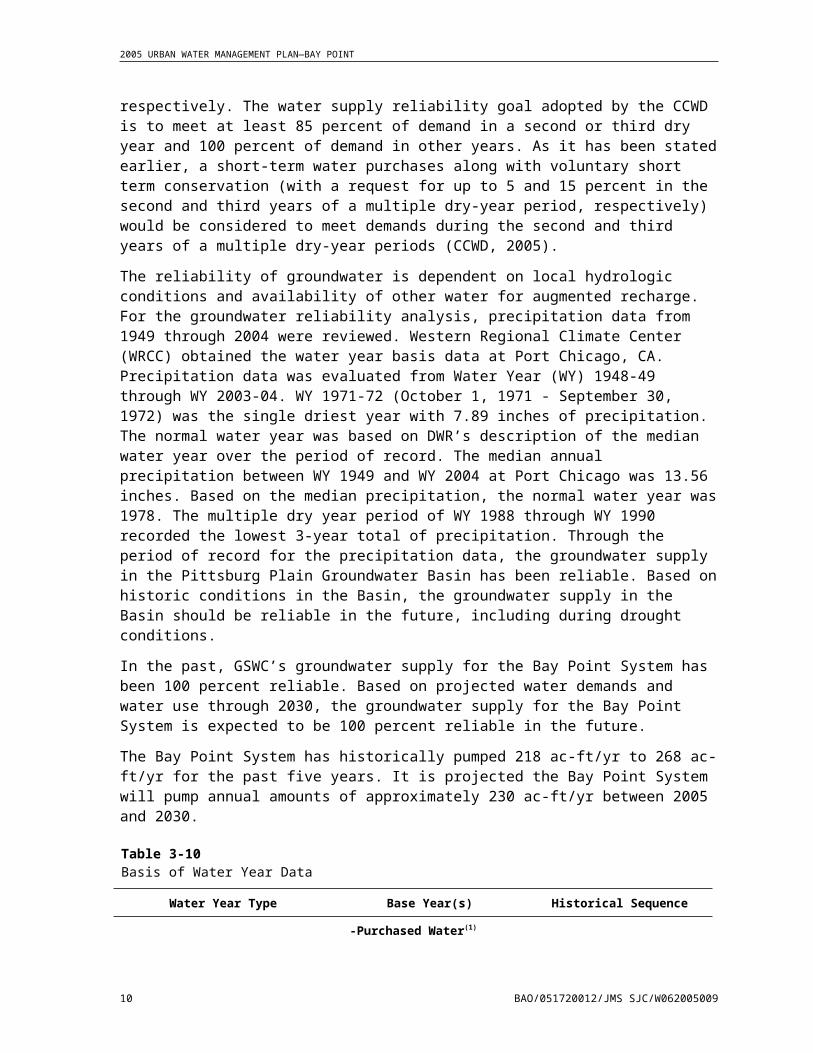
2005 URBAN WATER MANAGEMENT PLAN—BAY POINT
the number of active service connections for that category. The unit water use factors for each customer type were averaged over the data range from 1999 through 2004 in order to obtain a representative water use factor that can be used for water demand projections by customer type.The population-based water use projections are based on the population and housing projections developed for the Bay Point System using the Association of Bay Area Governments (ABAG) data. ABAG recently updated its projections for population, household, and employment growth through the year 2030 using 2000 U.S. Census data. ABAG’s methodology and the derivation of population projections for the Bay Point System are discussed in more detail in Chapter 2.ABAG household projections were used to determine the growth in single-family and multi-family service connections for the years 2005, 2010, 2015, 2020, 2025, and 2030. For example, the ratio between the household projections for the year 2015 and the year 2000 was multiplied by the number of service connections in 2000 to obtain a projection of the number of connections in the year 2015. Similarly, total population growth projections were used to determine the growth for commercial, industrial, institutional/government, landscape, and agriculture service connections. The population-based projected water use was then calculated by multiplying the number of projected active service connections for each customer category with the corresponding customer average water use factor calculated above.The historical-trend water use projections are not based on ABAG projections but are instead based on a linear projection of the historical number of metered service connections. To establish the historical trend, the data from 1989 through 2004 was used because the growth rate in the number of connections decreased significantly after 1989 (refer to Figure 4-5). The average growth rate established by this historical trend was applied to the number of connections in each customer category to project the future number of service connections. The historical-trend projected water use was then calculated by multiplying the number of projected active service connections for each customer category with the corresponding customer average water use factor calculated above. Figure 4-7 shows the average of the population-based and historical-trend water use projections by customer type, as well as the total water demand. The error bars provide the range of the total water demand projections for that year. The population-based and historical-trend projections of the number of service connections, and the resulting water demand, are provided in Table 4-17 and Table 4-18, respectively.
4 BAO/051720012/JMS SJC/W062005009

CHAPTER 5. DEMAND MANAGEMENT MEASURES
0
500
1000
1500
2000
2500
3000
3500
4000
4500
2000 2005 2010 2015 2020 2025 2030
Year
Wat
er U
se (a
c-ft
/yr)
Unaccounted-forWater
Others
Agriculture
Landscape
Institutional/GovernmentIndustrial
Commercial
Multi-Family
Single Family
Projection Range
Figure 4-7. Water Use by Customer Type
Table 4-17Population-Based and Historical-Trend Projections of the Number of Metered Service Connections for the Bay Point System
YearProjection
Type
Accounts by Type
Sing
le
Fam
ily
Mul
tifam
ily
Com
mer
cial
Indu
stria
l
Inst
itutio
nal/
Gov
ernm
ent
Land
scap
e
Agr
icul
ture
Oth
er(3
)
Tota
l
2000(2) N/A 4,621 114 52 20 37 41 1 3 4,889
2005 Population-Based 4,922 121 56 21 40 44 1 3 5,208
Historical-Trend 4,800 118 54 21 38 43 1 3 5,079
2010 Population-Based 5,193 128 58 22 42 46 1 3 5,494
Historical-Trend 5,016 124 56 22 40 45 1 3 5,307
2015 Population-Based 5,822 144 65 25 46 51 1 4 6,159
Historical-Trend 5,231 129 59 23 42 46 1 3 5,535
BAO/051720004 JMS SJC/W062005001 5

2005 URBAN WATER MANAGEMENT PLAN—BAY POINT
Table 4-17Population-Based and Historical-Trend Projections of the Number of Metered Service Connections for the Bay Point System
YearProjection
Type
Accounts by Type
Sing
le
Fam
ily
Mul
tifam
ily
Com
mer
cial
Indu
stria
l
Inst
itutio
nal/
Gov
ernm
ent
Land
scap
e
Agr
icul
ture
Oth
er(3
)
Tota
l
2020 Population-Based 6,268 155 70 27 50 55 1 4 6,630
Historical-Trend 5,447 134 61 24 44 48 1 4 5,763
2025 Population-Based 6,631 164 73 28 52 58 1 4 7,011
Historical-Trend 5,663 140 64 25 45 50 1 4 5,991
2030 Population-Based 6,989 172 77 30 55 61 1 4 7,389
Historical-Trend 5,878 145 66 25 47 52 1 4 6,219
Notes1. This table is based on the DWR Guidebook Table 12.2. Based on calendar year.3. Other accounts for any service connections not included in any other category, including idle or inactive connections.
6 BAO/051720012/JMS SJC/W062005009

CHAPTER 5. DEMAND MANAGEMENT MEASURES
Table 4-18Population-Based and Historical-Trend Projections of Water Deliveries for Service Connections for the Bay Point System in ac-ft/yr
YearProjection
Type
Accounts by Type
Sing
le
Fam
ily
Mul
tifam
ily
Com
mer
cial
Indu
stria
l
Inst
itutio
nal/
Gov
ernm
ent
Land
scap
e
Agr
icul
ture
Oth
er(3
)
Tota
l
2000(2) N/A 1,487 482 36 404 99 135 0 0 2,643
2005 Population-Based 1,582 492 41 412 100 147 0 3 2,777
Historical-Trend 1,542 480 40 401 97 143 0 3 2,707
2010 Population-Based 1,669 520 43 433 105 154 0 3 2,927
Historical-Trend 1,612 502 42 419 102 149 0 3 2,828
2015 Population-Based 1,871 582 48 484 117 172 0 4 3,279
Historical-Trend 1,681 523 43 437 106 156 0 3 2,950
2020 Population-Based 2,014 627 51 518 126 185 0 4 3,525
Historical-Trend 1,750 545 45 455 110 162 0 4 3,071
2025 Population-Based 2,131 663 54 543 132 193 0 4 3,720
Historical-Trend 1,819 566 47 473 115 168 0 4 3,193
2030 Population-Based 2,246 699 57 572 139 204 0 4 3,920
Historical-Trend 1,889 588 49 491 119 175 0 4 3,314
Notes1. This table is based on the DWR Guidebook Table 12.2. Based on calendar year.3. Other accounts for any service connections not included in any other category, including idle or inactive connections.
BAO/051720004 JMS SJC/W062005001 7

2005 URBAN WATER MANAGEMENT PLAN—BAY POINT
Sales to Other AgenciesThere are no sales to other agencies for the Bay Point System; therefore, Table 4-19 has intentionally been left blank.
Table 4-19Sales to Other Agencies in ac-ft/yr
Water Distributed
2000 (2) 2005 2010 2015 2020 2025 2030
N/A N/A N/A N/A N/A N/A N/A N/A
Notes1. This table is based on the DWR Guidebook Table 13.2. Based on calendar year.
Other Water Uses and Unaccounted-for WaterIn order to accurately predict total water demand, other water uses, as well as any water lost during conveyance, must be added to the customer demand. California regulation requires water suppliers to quantify any additional water uses not included as a part of water use by customer type (Table 4-20). There are no other water uses in addition to those already reported in the Bay Point System. Unaccounted-for water must be incorporated when projecting total water demand. Unaccounted-for water is defined as the difference between annual production and supply and annual sales. Included in the unaccounted-for water are system losses (due to leaks, reservoir overflows, or inaccurate meters), and water used in operations. In the Bay Point System, from 1999 through 2004, unaccounted-for water has averaged 4.83 percent of the total production. Table 4-20 provides a summary of unaccounted-for water in the Bay Point System.
Table 4-20Additional Water Uses and Losses in ac-ft/yr
Water-Use Type 2000 (2) 2005 2010 2015 2020 2025 2030
Other Water Uses N/A N/A N/A N/A N/A N/A N/A
Unaccounted-for System Losses(3) 134 141 148 166 179 189 199
Total 134 141 148 166 179 189 199
Notes1. This table is based on the DWR Guidebook Table 14.2. Based on calendar year.3. Unaccounted-for water includes system losses due to leaks, reservoir overflows, and inaccurate meters, as well as water
used in operations.
8 BAO/051720012/JMS SJC/W062005009

CHAPTER 5. DEMAND MANAGEMENT MEASURES
Total Water DemandAs mentioned above, other water uses, as well as any water lost during conveyance, must be added to the customer demand in order to project water demand for the Bay Point System. Although there are no other water uses contributing to the total water demand in the Bay Point System, unaccounted-for water must be incorporated into the total water demand (refer to the previous section for a definition of unaccounted-for water). Table 4-21 summarizes the projections of water sales, unaccounted-for water, and total water demand through the year 2030. The projected water sales in the remainder of the analysis, including Table 4-21, are calculated using the population-based projections for water use. The water demand projections below do not include any reduction due to future implementation of Demand Management Measures (DMM). More information regarding the status of demand reduction measures is available in Chapter 5.
Table 4-21Projected Water Sales, Unaccounted-for System Losses, and Total Water Demand in ac-ft/yr
Year Projected Water Sales Unaccounted-for System Losses
Total Water Demand
2000(2) 2,643 134 2,777
2005 2,777 141 2,918
2010 2,927 148 3,076
2015 3,279 166 3,445
2020 3,525 179 3,704
2025 3,720 189 3,909
2030 3,920 199 4,119
Notes1. This table is based on the DWR Guidebook Table 15.2. Based on calendar year.
Data Provided to Wholesale AgencyGSWC provided the following projected water use data to the Contra Costa Water District, its wholesale water supplier for the Bay Point System, as summarized in Table 4-22.
Table 4-22Summary of Bay Point System Data Provided to CCWD in ac-ft/yr
Wholesaler 2010 2015 2020 2025 2030
CCWD 2,846 3,215 3,474 3,679 3,889
Notes1. This table is based on the DWR Guidebook Table 19.
BAO/051720004 JMS SJC/W062005001 9

2005 URBAN WATER MANAGEMENT PLAN—BAY POINT
10 BAO/051720012/JMS SJC/W062005009

Chapter 5. Demand Management Measures
The evaluation of Demand Management Measures (DMMs) occupies a significant portion of the Act. The Act states as follows:
Section 10631. (f) Provide a description of the supplier’s water demand management
measures. This description shall include all of the following: (1) A description of each water demand management measure that is
currently being implemented, or scheduled for implementation, including the steps necessary to implement any proposed measures, including, but not limited to, all of the following: (A) Water survey programs for single-family residential and multifamily
residential customers. (B) Residential plumbing retrofit. (C) System water audits, leak detection, and repair. (D) Metering with commodity rates for all new connections and retrofit
of existing connections. (E) Large landscape conservation programs and incentives. (F) High-efficiency washing machine rebate programs. (G) Public information programs. (H) School education programs. (I) Conservation programs for commercial, industrial, and institutional
accounts. (J) Wholesale agency programs. (K) Conservation pricing. (L) Water conservation coordinator. (M) Water waste prohibition. (N) Residential ultra-low-flush (ULF)toilet replacement programs.
(2) A schedule of implementation for all water demand management measures proposed or described in the plan.
(3) A description of the methods, if any, that the supplier will use to evaluate the effectiveness of water demand management measures implemented or described under the plan.
(4) An estimate, if available, of existing conservation savings on water use within the supplier’s service area, and the effect of the savings on the supplier’s ability to further reduce demand.
(g) An evaluation of each water demand management measure listed in paragraph (1) of subdivision (f) that is not currently being implemented or scheduled for implementation. In the course of the evaluation, first consideration shall be given to water demand management measures, or combination of measures, that offer lower incremental costs than expanded or additional water supplies. This evaluation shall do all of the following:
BAO/051720004 JMS SJC/W062005001 1

(1) Take into account economic and noneconomic factors, including environmental, social, health, customer impact, and technological factors.
(2) Include a cost-benefit analysis, identifying total benefits and total costs. (3) Include a description of funding available to implement any planned
water supply project that would provide water at a higher unit cost. (4) Include a description of the water supplier’s legal authority to
implement the measure and efforts to work with other relevant agencies to ensure the implementation of the measure and to share the cost of implementation.
(j) Urban water suppliers that are members of the California Urban Water Conservation Council and submit annual reports to that Council in accordance with the ‘‘Memorandum of Understanding Regarding Urban Water Conservation in California,’’ dated September 1991, may submit the annual reports identifying water demand management measures currently being implemented, or scheduled for implementation, to satisfy the requirements of subdivisions (f) and (g).
Section 10631.5. The department shall take into consideration whether the urban water supplier is implementing or scheduled for implementation, the water demand management activities that the urban water supplier identified in its urban water management plan, pursuant to Section 10631, in evaluating applications for grants and loans made available pursuant to Section 79163. The urban water supplier may submit to the department copies of its annual reports and other relevant documents to assist the department in determining whether the urban water supplier is implementing or scheduling the implementation of water demand management activities.This chapter presents a summary of Golden State Water Company’s (GSWC) past, current and future water conservation activities for the Bay Point System in compliance with the above listed sections of the Act.The water conservation practices, as defined by the Act, are comprised of 14 DMMs. The DMMs are functionally equivalent to urban water conservation best management practices (BMPs) administered by the California Urban Water Conservation Council (Council). Table 5-23 lists the BMPs.The Council was formed as part of an effort by the Department of Water Resources (DWR) working jointly with water utilities, environmental organizations, and other interested groups to develop and administer urban best management practices (BMPs) for conserving water. In 1991 the Council issued a Memorandum of Understanding Regarding Urban Water Conservation in California (MOU) which formalized the agreement to implement BMPs to reduce the consumption of California’s water resources. As a signatory of the MOU, GSWC has agreed to implement the BMPs that are determined to be cost beneficial to its ratepayers and to complete such implementation in accordance with the schedule assigned to each BMP. GSWC files bi-annual reports with the Council on BMP implementation progress.
BAO/051720004 JMS SJC/W062005001 2

CHAPTER 5. DEMAND MANAGEMENT MEASURES
Table 5-23Water Conservation Best Management Practices
(1) Water Survey Programs for Single-Family Residential and Multifamily Residential Customers
(2) Residential Plumbing Retrofits
(3) System Water Audits, Leak Detection, and Repair
(4) Metering with Commodity Rates for All New Connections and Retrofit of Existing Connections
(5) Large-Landscape-Conservation Programs and Incentives
(6) High-Efficiency-Washing-Machine Rebate Programs
(7) Public Information Programs (1)
(8) School Education Programs (1)
(9) Conservation Program for Commercial, Industrial, Institutional (CII) Accounts
(10) Wholesale-Agency Assistance Programs (1)
(11) Conservation Pricing (1)
(12) Water Conservation Coordinator (1)
(13) Water Waste Prohibition (1)
(14) Residential Ultra-Low-Flush-Toilet (ULFT) Replacement ProgramsNotes1. Economic benefits of these BMPs are considered nonquantifiable.
BMP Implementation StatusThe BMP implementation status was assessed based on information provided in BMP activity reports for the years 2001 to 2004 that were filed with the Council. Historically, the BMP forms for the Bay Point System have been 100 percent complete, including the reports filed for 2001 to 2004. In addition, the BMP coverage reports were used to assess whether the target implementation schedule, as defined by the Council, for each BMP is met. The 2004 Activity Report and Coverage Report are included in Appendix E. Based on Section 10631 (j) the Council reports meet the requirements of Water Code Section 10631 (f) and (g). A summary of these reports is presented in Table 5-24 and Table 5-25.Table 5-24 presents a summary of the past water conservation activities in the Bay Point System. It should be noted GSWC takes credit for water conservation activities completed under programs jointly offered by GSWC and other agencies in its service area.Table 5-25 presents a description of the offered programs and implementation status in the Bay Point System for all BMPs. GSWC is currently not meeting coverage requirements as defined by the Council for BMPs 1, 2, 5, 8, 9, and 14. In order to determine if implementation of these BMPs for the Bay Point System should continue, a benefit-cost analysis was performed on these BMPs.
BAO/051720004 JMS SJC/W062005001 3
2005 URBAN WATER MANAGEMENT PLAN—BAY POINT
Table 5-24Summary of Past Water Conservation Activities(1)
Year BMP 1: Residential
Surveys
BMP 2: Residential
Retrofits
BMP 3: Pre-Screening
System Water Audit
BMP 5: Large
Landscape Surveys
BMP 6: High Efficiency Washing Machine Rebate
BMP 7: Public
Information Programs
BMP 8: School
Programs Students Reached
BMP 9: CII Surveys
BMP 14: Residential
ULFT
Pre 2000 240 Yes Yes 750 750
2000 Yes Yes 138
2001 Yes Yes 138
2002 Yes Yes
2003 Yes Yes
2004 Yes Yes
Meeting Coverage Requirements No No Yes No Yes Yes No No No
Notes1. BMPs 4, 11, 12, and 13 are fully implemented. BMP 10 is not applicable as this system does not provide wholesale water to other agencies.
4 BAO/051720004 JMS SJC/W062005001/

CHAPTER 5. DEMAND MANAGEMENT MEASURES
Table 5-25Summary of Best Management Practice Implementation
BMP Summary of Activities Coverage Implementation (2)
Status1 Residential Water Surveys Free residential water surveys are offered through the CCWD. GSWC encourages its customers to
participate.Coverage requirements are not met.
2 Residential Plumbing Retrofits
Water conservation devices are available through the CCWD. GSWC encourages its customers to participate.
Coverage requirements are not met.
3 System Water Audits, Leak Detection, and Repair
GSWC completed annual distribution system pre-screening system audits to assess water losses in the distribution system. Prior to 2004, the distribution system water losses were less than 10 percent.
Coverage requirements are being met.
4 Metering All accounts in the Bay Point System are metered and are billed by volume. Fully implemented.
5 Large-Landscape-Conservation Program
Free large landscape water use surveys and rebate programs are offered through the CCWD. GSWC encourages its customers to participate.
Coverage requirements are not met.
6 High-Efficiency-Washing-Machine Rebate Program
Rebates for high-efficiency washing machines are offered through the CCWD. GSWC encourages its customers to participate. The energy service provider within the CSA does not offer a rebate program.
Coverage requirements are being met.
7 Public Information Program (1) Bay Point System has a public information program through the customer service area office. Coverage requirements are being met.
8 School Education Program (1) GSWC implemented school education programs in 2000 and 2001. Coverage requirements are not met.
9 Conservation Program CII Accounts
Free commercial water use surveys and rebate programs are offered thought the CCWD. GSWC encourages its customers to participate.
Coverage requirements are not met.
10 Wholesale-Agency Program (1)
Not applicable. Not applicable
11 Conservation Pricing (1) GSWC has adopted conservation pricing, including using water rates that are developed to recover the cost of providing service and billing customers for metered water use. GSWC has uniform water rate structure (i.e. no rate increase/decrease based on the quantity of water used).
Fully implemented.
12 Water Conservation Coordinator (1)
GSWC has a part time water conservation coordinator on staff for all of Region I service areas. Coverage requirements are being met.
13 Water Waste Prohibition (1) There is a water waste prohibition ordinance in effect in the Bay Point System (PUC Tariff Rule No. 14.1).
Fully implemented.
14 Residential-Ultra-Low-Flush-Toilet-Replacement Program
Rebates for residential ULFT are offered through the CCWD. GSWC encourages its customers to participate.
Coverage requirements are not met.
Notes1. Benefits of these DMM’s are considered non-quantifiable. 2. “Implementation” means achieving and maintaining the staffing, funding, and priority levels necessary to achieve the level of activity required to satisfy the target commitment as described in the MOU.
BAO/051720004 JMS SJC/W062005001 5

2005 URBAN WATER MANAGEMENT PLAN—BAY POINT
Cost Benefit AnalysisA benefit-cost economic analysis was completed for the quantifiable BMPs that are not meeting coverage requirements (BMP 1, 2, 5, 8, 9, and 14). The benefit-cost analysis was completed with the consideration of economic factors. Noneconomic factors, including environmental, social, health, customer impacts, and new technology, are not believed to be significant and were not considered in the analysis. Therefore, a benefit-cost analysis could not be conducted for BMP 8 as it is not quantifiable. The basis and assumptions used in the economic analysis of each BMP, as well as detailed calculations are included in Appendix D. Common assumption for all BMPs is the value of conserved water. Based on information provided by GSWC, the value of water for the Bay Point System is $1297 per ac-ft. This value was estimated based on the cost of developing new water supply and the real discount rate of 6.71 percent. The analysis assumes that BMPs 1 and 2 (Residential Water Surveys and Plumbing Retrofits) would be done concurrently. Other assumptions with supporting references are described in Table D-1 (Appendix D). The economic analysis was performed using a spreadsheet program developed by the Council. A separate, customized worksheet for each BMP is presented in Table D-2 (Appendix D). Each BMP economic analysis spreadsheet projects on an annual basis the number of interventions and the dollar values of the benefits and costs that would result from fully implementing a particular BMP. The definition of terms and formulas that are common to all worksheets are presented in Table D-3 (Appendix D). Table 5-26 summarizes the results of the economic analysis. The table presents the total discounted costs and benefits, the benefit-cost ratio, the simple pay-back period, the discounted cost per ac-ft of water saved, and the net present value (NPV) per ac-ft of water saved for each BMP.The economic analysis shows that all BMPs yield benefit-cost ratios greater than one, which indicates that the conservation measures are cost effective. Based on this, GSWC should continue efforts to implement BMPs 1, 2, 5, 8, 9, and 14 which appear to be cost effective. Based on the results of the benefit-cost analysis an implementation program was developed for the cost effective BMPs.
6 BAO/051720004 JMS SJC/W062005001

CHAPTER 5. DEMAND MANAGEMENT MEASURES
Table 5-26Results of Economic Analysis for BMPs Currently Not Meeting Coverage Requirements
BMP DescriptionTotal
DiscountedCost (1)
Total Discounted Benefits (2)
Total Water Saved
(ac-ft) (3)
Benefit/ Cost
Ratio (4)
Simple Payback Analysis (years) (5)
DiscountedCost/Water
Saved ($/ac-ft) (6)
Net Present Value/ Water Saved
($/ac-ft) (7)
1 Water Survey Programs for Residential Customers
$32,523 $82,857 71 2.5 2 $461 $714
2 Residential Plumbing Retrofits
$144,907 $292,097 365 2.0 9 $397 $404
5 Large Landscape Conservation Programs and Incentives
$28,348 $233,628 212 8.2 1 $133 $966
9 Conservation Program for CII Accounts
$8,223 $55,409 47 6.7 1 $174 $1,001
14 Residential ULFT Replacement Program
$527,738 $1,852,883 2678 3.5 7 $197 $495
Notes1. Present value of the sum of financial incentives and operating expenses - using discount rate of 6.71%.2. Present value of the sum of avoided energy and purchased water costs - using discount rate of 6.71%.3. Achieved water savings for the implemented BMP.4. Total discounted benefits divided by total discounted costs.5. Time horizon in years required for benefits to pay back costs of the BMP.6. Total discounted costs divided by total water saved.7. Total of discounted benefits less discounted costs divided by total water saved.
Recommended Conservation ProgramGSWC should continue efforts to implement BMPs that are assessed to be cost beneficial (benefit-cost ratio equal to or greater than one), and to achieve the target implementation coverage by the end of the implementation period assigned to each BMP. BMPs 1, 2, 5, 9, and 14 were identified as cost beneficial in the Bay Point System; therefore, an implementation program was developed for these BMPs. The program is based on achieving the target coverage requirements, as per the MOU. Table 5-27 presents the proposed implementation program, including the number of annual interventions required for each BMP to comply with defined coverage requirements; the total annual expenditures necessary to support the interventions; and the estimated annual water savings. The expenditures for BMPs take into consideration the existing programs offered by other agencies in the service area, and reflect only the incremental cost to GSWC to implement BMPs to meet the coverage requirements. BMPs 7, 8, 10, 11, 12, and 13 were not included in the proposed implementation program because they are considered non-quantifiable. These BMPs have no
BAO/051720004 JMS SJC/W062005001 7

2005 URBAN WATER MANAGEMENT PLAN—BAY POINT
specific level of effort defined in the MOU, therefore water savings and costs associated with these BMPs were not included in the analysis. The cost for BMP 12 is contained in GSWC overhead. BMPs 4 and 11 are already implemented, and, therefore, have no additional cost associated with them. BMP 13 has no associated cost unless initiated by a water shortage condition.When implementing water conservation programs, GSWC is subject to economic and legal constraints that need to be considered as they may affect the proposed BMPs implementation schedule.
Economic ConsiderationsAs a private utility, GSWC is subject to the rules and regulations of the California Public Utilities Commission (PUC). The PUC approve GSWC’s water rate structure and the capital and operating budget, including the budget for implementation of water conservation measures. GSWC is often constrained in the funding available to implement programs. GSWC implements cost effective water conservation programs that have been approved by the PUC. The cost of water is an important economic factor that needs to be considered when implementing conservation programs. Higher cost of water increases the attractiveness of BMPs implementation. Currently there are no water projects planned in the Bay Point System that would result in higher unit cost of water, thus increasing the feasibility of implementing water conservation measures.
Legal ConsiderationsGSWC has the legal authority to implement cost beneficial BMPs that were approved by the PUC in its capital/operating budget. When developing programs that advance water conservation, GSWC can offer financial incentives, information or educational programs in its service area; however, GSWC has no legal authority to enforce urban codes or plumbing codes for new or existing connections that pertain to implementation of efficient devices, or reduction of water use. Ordinances that prohibit water waste (BMP 13) are jointly developed by PUC and GSWC. Ordinances are enacted by the PUC only during water shortage. As a water retailer, GSWC has no legal authority to enact or enforce waste water prohibition ordinances without PUC approval.
Cost Share PartnersIn an effort to expand the breadth of offered programs GSWC partners with wholesale suppliers, energy utilities, and other agencies that support conservation programs. Joint participation offers opportunity for cost sharing and development of more effective conservation strategies. Several conservation programs are available to customers within the Bay Point System through the Contra Costa Water District (CCWD). These programs include: Free residential water surveys (BMP 1) Water conservation devices such as shower and faucet heads (BMP 2) Free large landscape water use surveys and rebates (BMP 5)
8 BAO/051720004 JMS SJC/W062005001

CHAPTER 5. DEMAND MANAGEMENT MEASURES
Rebates for high efficiency washing machines (BMP 6) Free commercial water use surveys and rebates (BMP 9) Rebates for residential ULFT (BMP 14)GSWC participates in these programs by providing additional funding or resources to implement offered programs. The additional funding may include additional rebate offers, program advertising, or sharing of costs related to organizing events in its service area. GSWC is committed to continue efforts to implement cost effective BMPs that are approved by the PUC, and to achieve, to the extent possible, target implementation coverage by the end of the implementation period assigned to each BMP.
BAO/051720004 JMS SJC/W062005001 9

2005 URBAN WATER MANAGEMENT PLAN—BAY POINT
Table 5-27 Summary of Required Interventions, Implementation Cost and Estimated Water Saved for BMPs Not Meeting Coverage Requirements
BMP 1: Residential Water SurveysBMP 2: Residential Plumbing
Retrofits BMP 5: Large Landscapes
YearInterven-
tionsWater Saved
(ac-ft/yr)Cost ($/yr)
Interven-tions
Water Saved (ac-ft/yr)
Cost ($/Yr)
Interven-tions
Water Saved (ac-ft/yr)
Cost ($/Yr)
2006 480 9 $16,790 305 6 $14,638 27 26 $15,217
2007 480 18 $15,734 305 12 $13,717 27 53 $15,217
2008 0 18 $0 305 18 $12,855 2 53 $339
2009 0 18 $0 305 24 $12,046 2 53 $339
2010 0 9 $0 305 24 $11,289 1 27 $131
2011 0 0 $0 305 24 $10,579 1 0 $131
2012 0 0 $0 305 24 $9,914 0 0 $0
2013 0 0 $0 305 24 $9,290 0 0 $0
2014 0 0 $0 305 24 $8,706 0 0 $0
2015 0 0 $0 305 24 $8,159 0 0 $0
2016 0 0 $0 305 24 $7,646 0 0 $0
2017 0 0 $0 305 24 $7,165 0 0 $0
2018 0 0 $0 305 24 $6,714 0 0 $0
2019 0 0 $0 305 24 $6,292 0 0 $0
2020 0 0 $0 305 24 $5,897 0 0 $0
2021 0 0 $0 0 18 $0 0 0 $0
2022 0 0 $0 0 12 $0 0 0 $0
2023 0 0 $0 0 6 $0 0 0 $0
2024 0 0 $0 0 0 $0 0 0 $0
2025 0 0 $0 0 0 $0 0 0 $0
2026 0 0 $0 0 0 $0 0 0 $0
2027 0 0 $0 0 0 $0 0 0 $0
2028 0 0 $0 0 0 $0 0 0 $0
2029 0 0 $0 0 0 $0 0 0 $0
2030 0 0 $0 0 0 $0 0 0 $0
Total 959 71 $32,523 4574 365 $144,907 60 212 $31,374
10 BAO/051720004 JMS SJC/W062005001

CHAPTER 5. DEMAND MANAGEMENT MEASURES
Table 5-27 (continued) Summary of Required Interventions, Implementation Cost and Estimated Water Saved for BMPs Not Meeting Coverage Requirements
BMP 9: CII Conservation BMP 14: Residential ULFT Total
YearInterven-
tionsWater Saved
(ac-ft/yr)Cost ($/Yr)
Interven-tions
Water Saved (ac-ft/yr)
Cost ($/Yr)
Interven-tions
Water Saved (ac-ft/yr)
Cost ($/Yr)
2006 6 6 $4,245 1133 45 $151,755 1671 92 $202,644
2007 6 12 $4,245 1133 76 $151,755 1671 170 $200,668
2008 0 12 $0 0 106 $0 5 206 $13,194
2009 0 12 $0 0 106 $0 5 213 $12,386
2010 0 6 $0 0 106 $0 2 172 $11,419
2011 0 0 $0 0 106 $0 2 131 $10,709
2012 0 0 $0 0 106 $0 0 131 $9,914
2013 0 0 $0 0 106 $0 0 130 $9,290
2014 0 0 $0 0 106 $0 0 130 $8,706
2015 0 0 $0 0 106 $0 0 130 $8,159
2016 0 0 $0 0 106 $0 0 130 $7,646
2017 0 0 $0 0 106 $0 0 130 $7,165
2018 0 0 $0 0 106 $0 0 130 $6,714
2019 0 0 $0 0 106 $0 0 130 $6,292
2020 0 0 $0 0 106 $0 0 130 $5,897
2021 0 0 $0 0 106 $0 0 124 $0
2022 0 0 $0 0 106 $0 0 118 $0
2023 0 0 $0 0 106 $0 0 112 $0
2024 0 0 $0 0 106 $0 0 106 $0
2025 0 0 $0 0 106 $0 0 106 $0
2026 0 0 $0 0 106 $0 0 106 $0
2027 0 0 $0 0 106 $0 0 106 $0
2028 0 0 $0 0 106 $0 0 106 $0
2029 0 0 $0 0 106 $0 0 106 $0
2030 0 0 $0 0 106 $0 0 106 $0
Total 12 47 $8,490 2,265 2,557 $303,510 3,355 3,252 $520,804
BAO/051720004 JMS SJC/W062005001 11
Chapter 6. Desalination
The Act requires that desalination opportunities be discussed in the UWMP. The Act states the following:
Section 10631 (i) Describe the opportunities for development of desalinated water, including,
but not limited to, ocean water, brackish water, and groundwater, as a long-term supply.
Per requirements of California Water Code section 10631(i), this chapter presents opportunities to use desalinated water as a future water supply source for the Bay Point System. CCWD along with East Bay Municipal Utility District, San Francisco Public Utilities Commission, and Santa Clara Valley Water District are jointly exploring the development of regional desalination facilities that could augment total water supplies. The Bay Area Regional Desalination Project (RDP) may consist of one or more desalination facilities, with an ultimate total capacity of up to 80 million gallons per day. By pooling resources under the umbrella of a single project, the RDP will maximize benefits and efficiencies and minimize potential environmental impacts associated with pursuing independent desalination projects within a small geographic area along the California coastline. An RDP would serve as a new, safe, and reliable water supply source that would: 1) provide additional sources of water during extended drought periods and during emergencies such as earthquakes or levee failures, 2) provide a supplemental supply source during extended droughts, 3) allow other major facilities such as treatment plants, transmission mains, and pump stations to be taken out of service for an extended period of time for maintenance or repairs, and 4) provide a full time supplemental water supply to increase the diversity of the CCWD’s water supply portfolio, which would increase reliability (CCWD 2005).The Delta Diablo Sanitation District completed a feasibility level desalination facility cost study in 2005 that considered the viability of using brackish water typical of the water available in the lower San Joaquin River and Suisun Bay delta areas. A detailed feasibility study for the RDP will be conducted during 2005-2006 as the next step (CCWD 2005). Table 6-28 provides a summary of opportunities for water desalination. As was mentioned earlier, the future desalination projects of CCWD will increase the reliability of water supply for the region and the system. However, the exact quantity of supply that will be allotted for the GSWC’s Bay Point system is not known.
BAO/051720004 JMS SJC/W062005001 1

Table 6-28Summary of Opportunities for Water Desalination
Source of WaterYield
(ac-ft/yr) Start Date Type of Use Other
Seawater 89,600 N/A N/A N/A
Notes1. Table format based on DWR Guidance Document Table 18
BAO/051720004 JMS SJC/W062005001 2

Chapter 7. Water Shortage Contingency Plan
Section 10632 of the Act details the requirements of the water-shortage contingency analysis. The Act states the following:
Section 10632. The plan shall provide an urban water-shortage contingency analysis that includes each of the following elements that are within the authority of the urban water supplier: (a) Stages of action to be undertaken by the urban water supplier in response to
water supply shortages, including up to a 50 percent reduction in water supply, and an outline of specific water supply conditions, which are applicable to each stage.
(b) An estimate of the minimum water supply available during each of the next three water years based on the driest three-year historic sequence for the agency’s water supply.
(c) Actions to be undertaken by the urban water supplier to prepare for, and implement during, a catastrophic interruption of water supplies including, but not limited to, a regional power outage, an earthquake, or other disaster.
(d) Additional, mandatory prohibitions against specific water-use practices during water shortages, including, but not limited to, prohibiting the use of potable water for street cleaning.
(e) Consumption reduction methods in the most restrictive stages. Each urban water supplier may use any type of consumption reduction methods in its water shortage contingency analysis that would reduce water use, are appropriate for its area, and have the ability to achieve a water-use reduction consistent with up to a 50 percent reduction in water supply.
(f) Penalties or charges for excessive use, where applicable. (g) An analysis of the impacts of each of the actions and conditions described in
subdivisions (a) to (f), inclusive, on the revenues and expenditures of the urban water supplier, and proposed measures to overcome those impacts, such as the development of reserves and rate adjustments.
(h) A draft water shortage contingency resolution or ordinance. (i) A mechanism for determining actual reductions in water use pursuant to the
urban water shortage contingency analysis.
This chapter documents GSWC’s Water Shortage Contingency Plan for the Bay Point System per requirements of Section 10632 of the Act. The Water Shortage Contingency Plan is based on Rule No. 14.1 Mandatory Water Conservation, Restrictions and Ratings Program adopted by GSWC. Appendix F contains the full text of the rule. The purpose of the Water Shortage Contingency Plan is to provide a plan of action to be followed during the various stages of a water shortage. The plan includes the following elements: action stages, estimate of minimum supply
BAO/051720004 JMS SJC/W062005001 1

available, actions to be implemented during a catastrophic interruption of water supplies, prohibitions, penalties and consumption reduction methods, revenue impacts of reduced sales, and water use monitoring procedures.
Action StagesThe Act requires documentation of actions to be undertaken during a water shortage. GSWC has developed actions to be undertaken in response to water supply shortages, including up to a 50 percent reduction in water supply. Implementation of the actions is dependent upon approval of the California Public Utilities Commission (CPUC), especially for implementing mandatory water use restriction. CPUC has jurisdiction over GSWC because GSWC is an investor-owned water utility. Section 357 of the California Water Code requires that suppliers that are subject to regulation by the CPUC secure its approval before imposing water consumption regulations and restrictions required by water supply shortage emergencies. GSWC has grouped the actions to be taken during a water shortage into four stages, I through IV, that are based on the water supply conditions. Table 7-29 describes the water supply shortage stages and conditions. The stages will be implemented during water supply shortages according to shortage level, ranging from 5 percent shortage in Stage I to 50 percent shortage in Stage IV. The stage determination and declaration during a water supply shortage will be made by the Regional Vice President Customer Service.
Table 7-29Water Supply Shortage Stages and Conditions
Stage No. Water Shortage Supply Conditions Shortage Percent
I Minimum 5 -10
II Moderate 10 - 20
III Severe 20 – 35
IV Critical 35 - 50
Notes1. This table is based on the DWR Guidebook Table 23.
The actions to be undertaken during each stage include, but are not limited to, the following:Stage I (5 - 10 percent shortage) - Water alert conditions are declared and voluntary conservation is encouraged. The drought situation is explained to the public and governmental bodies. GSWC explains the possible subsequent water shortage stages in order to forecast possible future actions for the customer base. The activities performed by GSWC during this stage include, but are not limited to: Public information campaign consisting of distribution of literature, speaking
engagements, bill inserts, and conversation messages printed in local newspapers
BAO/051720004 JMS SJC/W062005001 2

CHAPTER 7. WATER SHORTAGE CONTINGENCY PLAN
Educational programs in area schools Conservation Hotline, a toll free number with trained Conservation
Representatives to answer customer questions about conservation and water use efficiency
Stage II (10 - 20 percent shortage) – Stage II will include actions undertaken in Stage I. In addition, GSWC may propose voluntary conservation allotments and/or require mandatory conservation rules. The severity of actions depends upon the percent shortage. The level of voluntary or mandatory water use reduction requested from the customers is also based on the severity. It needs to be noted that prior to implementation of any mandatory reductions, GSWC must obtain approval from CPUC. If necessary, GSWC may also support passage of drought ordinances by appropriate governmental agencies.Stage III (20 - 35 percent shortage) – Stage III is a severe shortage that entails or includes allotments and mandatory conservation rules. This phase becomes effective upon notification by the GSWC that water usage is to be reduced by a mandatory percentage. GSWC implements mandatory reductions after receiving approval from CPUC. Rate changes are implemented to penalize excess usage. Water use restrictions are put into effect, i.e. prohibited uses can include restrictions of daytime hours for watering, excessive watering resulting in gutter flooding, using a hose without a shutoff device, use of non-recycling fountains, washing down sidewalks or patios, unrepaired leaks, etc. GSWC monitors production weekly for compliance with necessary reductions. Use of flow restrictors is implemented, if abusive practices are documented.Stage IV (35 - 50 percent shortage) – This is a critical shortage that includes all steps taken in prior stages regarding allotments and mandatory conservation. All activities are intensified and production is monitored daily by GSWC for compliance with necessary reductions.
Minimum SupplyThe Act requires an estimate of the minimum water supply available during each of the next three water years based on the driest three-year historic sequence for GSWC’s water supply.Table 7-30 summarizes the minimum volume of water available from each source during the next three years based on multiple-dry water years and normal water year. The driest three-year historic sequence is provided in Chapter 3. The driest three-year historic sequence is provided in Chapter 3. It is assumed that the multiple-dry year demands are the same as the water demands projected for the normal years. The water supply quantities for 2006 to 2008 are calculated by linearly interpolating between the projected water supplies of 2005 and 2010 for normal years. The water supplies for 2005 and 2010 are presented in Chapter 3. The third year of the multiple-dry year water supply projection represents the end of each 3-year multiple-dry year period as required for the multiple-dry year analysis. The water supplies from CCWD are reduced by 15 percent from the corresponding normal year supplies in the second and third year of multiple-dry year periods. This is because CCWD anticipates that at least 85 percent of demand will be met in a second or a third
BAO/051720004 JMS SJC/W062005001 3

2005 URBAN WATER MANAGEMENT PLAN—BAY POINT
dry year during multiple dry-years from the CVP supplies and other sources. The remaining 15 percent would be met by short-term water purchases and a voluntary short-term conservation program. CCWD’s planned water supply projects and programs include water transfers as a preferred means of strengthening drought protection for existing customers and meeting water shortfalls and implementation of an expanded conservation program. CCWD does not anticipate any supply deficits in normal and single-dry years. Historically, GSWC’s Bay Point System has reliably produced approximately 220 to 550 ac-ft/yr of groundwater. Based on the Pittsburg Plain Basin’s reliability, GSWC’s groundwater supply for the Bay Point System is expected to continue to be 100 percent reliable.
Table 7-30Three-Year Estimated Minimum Water Supply in ac-ft/yr
Source 2006 2007 20082005
Average year
Purchased water from CCWD 2,720 2,338 2,365 2,688
Groundwater 230 230 230 230
Recycled water 0 0 0 0
Total 2,950 2,568 2,595 2,918
Notes1. This table is based on the DWR Guidebook Table 24.
Catastrophic Supply Interruption PlanThe Act requires documentation of actions to be undertaken by the water supplier to prepare for, and implement during a catastrophic interruption of water supplies. A catastrophic interruption constitutes a proclamation of a water shortage and could be any event (either natural or man-made) that causes a water shortage severe enough to classify as either a Stage III or Stage IV water supply shortage condition. In order to prepare for catastrophic events, GSWC has prepared an Emergency Response Plan (ERP) in accordance with other state and federal regulations. The purpose of this plan is to design actions necessary to minimize the impacts of supply interruptions due to catastrophic events. The ERP coordinates overall company response to a disaster in any and all of its districts. In addition, the ERP requires each district to have a local disaster plan that coordinates emergency responses with other agencies in the area. The ERP also provides details on actions to be undertaken during specific catastrophic events. Table 7-31 provides a summary of actions cross-referenced against specific catastrophes for three of the most common possible catastrophic events: regional power outage, earthquake, and malevolent acts.
4 BAO/051720004 JMS SJC/W062005001
CHAPTER 7. WATER SHORTAGE CONTINGENCY PLAN
In addition to specific actions to be undertaken during a catastrophic event, GSWC performs maintenance activities, such as annual inspections for earthquake safety, and budgets for spare items, such as auxiliary generators, to prepare for potential events.
BAO/051720004 JMS SJC/W062005001 5

2005 URBAN WATER MANAGEMENT PLAN—BAY POINT
Table 7-31Summary of Actions for Catastrophic Events
Possible Catastrophe Summary of Actions
Regional power outage Isolate areas that will take the longest to repair and/or present a public health threat. Arrange to provide emergency water.
Establish water distribution points and ration water if necessary.
If water service is restricted, attempt to provide potable water tankers or bottled water to the area.
Make arrangements to conduct bacteriological tests, in order to determine possible contamination.
Utilize backup power supply to operate pumps in conjunction with elevated storage.
Earthquake Assess the condition of the water supply system.
Complete the damage assessment checklist for reservoirs, water treatment plants, wells and boosters, system transmission and distribution.
Coordinate with OES utilities group or fire district to identify immediate fire fighting needs.
Isolate areas that will take the longest to repair and/or present a public health threat. Arrange to provide emergency water.
Prepare report of findings, report assessed damages, advise as to materials of immediate need and identify priorities including hospitals, schools and other emergency operation centers.
Take actions to preserve storage.
Determine any health hazard of the water supply and issue any “Boil Water Order” or “Unsafe Water Alert” notification to the customers, if necessary.
Cancel the order or alert information after completing comprehensive water quality testing.
Make arrangements to conduct bacteriological tests, in order to determine possible contamination.
Malevolent acts Assess threat or actual intentional contamination of the water system.
Notify local law enforcement to investigate the validity of the threat.
Get notification from public health officials if potential water contamination
Determine any health hazard of the water supply and issue any “Boil Water Order” or “Unsafe Water Alert” notification to the customers, if necessary.
Assess any structural damage from an intentional act.
Isolate areas that will take the longest to repair and or present a public health threat. Arrange to provide emergency water.
Notes1. This table is based on the DWR Guidebook Table 25.
Prohibitions, Penalties, and Consumption Reduction Methods
6 BAO/051720004 JMS SJC/W062005001

CHAPTER 7. WATER SHORTAGE CONTINGENCY PLAN
The Act requires an analysis of mandatory prohibitions, penalties, and consumption reduction methods against specific water use practices which may be considered excessive during water shortages. Given that GSWC is an investor owned entity, it does not have the authority to pass any ordinances enacting specific prohibitions or penalties. In order to enact or rescind any prohibitions or penalties, GSWC would seek approval from CPUC to enact or rescind Rule No. 14.1, Mandatory Conservation and Rationing, which is presented in Appendix F. When Rule No. 14.1 has expired or is not in effect, mandatory conservation and rationing measures will not be in force. Rule No. 14.1 details the various prohibitions and sets forth water use violation fines, charges for removal of flow restrictors, as well as establishes the period during which mandatory conservation and rationing measures will be in effect. The prohibitions on various wasteful water uses, include, but are not limited to, the hose washing of sidewalks and driveways using potable water, and cleaning for filling decorative fountains. Table 7-32 summarizes the various prohibitions and the stages during which the prohibition becomes mandatory.
Table 7-32Summary of Mandatory Prohibitions
Examples of ProhibitionsStage When Prohibition
Becomes Mandatory
Uncorrected plumbing leaks II, III, IV
Watering which results in flooding or run-off in gutters, waterways, patios, driveway, or streets
II, III, IV
Washing aircraft, cars, buses, boats, trailers, or other vehicles without a positive shut-off nozzle on the outlet end of the hose
II, III, IV
Washing buildings, structures, sidewalks, walkways, driveways, patios, parking lots, tennis courts, or other hard-surfaced areas in a manner which results in excessive run-off
II, III, IV
Irrigation of non-permanent agriculture II, III, IV
Use of water for street watering with trucks or for construction purposes unless no other source of water or other method can be used
II, III, IV
Use of water for decorative fountains or the filling or topping off of decorative lakes or ponds
II, III, IV
Filling or refilling of swimming pools II, III, IV
Notes1. This table is based on the DWR Guidebook Table 26.
In addition to prohibitions during water supply shortage events requiring a voluntary or mandatory program, GSWC will make available to its customers water conservation kits as required by GSWC’s Rule No. 20. GSWC will notify all customers of the availability of conservation kits. In addition to prohibitions, Rule No. 14.1 provides penalties and charges for excessive water use. The enactment of these penalties and charges is contingent on approval of Rule 14.1 implementation by the CPUC. When the rule
BAO/051720004 JMS SJC/W062005001 7

2005 URBAN WATER MANAGEMENT PLAN—BAY POINT
is in effect, violators receive one verbal and one written warning after which a flow-restricting device may be installed in the violator’s service for a reduction of up to 50 percent of normal flow or 6 ccf per month, whichever is greater. Table 7-33 summarizes the penalties and charges and the stage during which they take effect.
Table 7-33Summary of Penalties and Charges for Excessive Use
Penalties or ChargesStage When Penalty
Takes Effect
Penalties for not reducing consumption III, IV
Charges for excess use III, IV
Flat fine; Charge per unit over allotment III, IV
Flow restriction III, IV
Termination of Service III, IV
Notes1. This table is based on the DWR Guidebook Table 28.
In addition to prohibitions and penalties, GSWC can use other consumption reduction methods to reduce water use up to 50 percent. Based on the requirements of the Act, Table 7-34 summarizes the methods that can be used by GSWC in order to enforce a reduction in consumption, where necessary.
Table 7-34Summary of Consumption Reduction Methods
Consumption Reduction Method
Stage When Method Takes Effect
Projected Reduction Percentage
Demand reduction program All Stages N/A
Reduce pressure in water lines; Flow restriction
III, IV N/A
Restrict building permits; Restrict for only priority uses
II, III, IV N/A
Use prohibitions II, III, IV N/A
Water shortage pricing; Per capita allotment by customer type
II, IV N/A
Plumbing fixture replacement All Stages N/A
Voluntary rationing II N/A
Mandatory rationing III, IV N/A
8 BAO/051720004 JMS SJC/W062005001

CHAPTER 7. WATER SHORTAGE CONTINGENCY PLAN
Table 7-34Summary of Consumption Reduction Methods
Consumption Reduction Method
Stage When Method Takes Effect
Projected Reduction Percentage
Incentives to reduce water consumption; Excess use penalty
III, IV N/A
Water conservation kits All Stages N/A
Education programs All Stages N/A
Percentage reduction by customer type
III, IV N/A
Notes1. This table is based on the DWR Guidebook Table 27.
Revenue Impacts of Reduced SalesSection 10632(g) of the Act requires an analysis of the impacts of each of the actions taken for conservation and water restriction on the revenues and expenditures of the water supplier. Because GSWC is an investor owned water utility and, as such, is regulated by the CPUC, the CPUC authorizes it to establish memorandum accounts to track expenses and revenue shortfalls caused by both mandatory rationing and voluntary conservation efforts. Utilities with CPUC-approved water management plans are authorized to implement a surcharge to recover revenue shortfalls recorded in their drought memorandum accounts. Table 7-35 provides a summary of actions with associated revenue reductions; while Table 7-36 provides a summary of actions and conditions that impact expenditures. Table 7-37 summarizes the proposed measures to overcome revenue impacts. Table 7-38 provides a summary of the proposed measures to overcome expenditure impacts.
Table 7-35Summary of Actions and Conditions that Impact Revenue
Type Anticipated Revenue Reduction
Reduced sales Reduction in revenue will be based on the decline in water sales and the corresponding quantity tariff rate
Recovery of revenues with CPUC approved surcharge
Higher rates may result in further decline in water usage and further reduction in revenue
Notes1. This table is based on a DWR Guidebook table on page 59.
BAO/051720004 JMS SJC/W062005001 9

2005 URBAN WATER MANAGEMENT PLAN—BAY POINT
Table 7-36Summary of Actions and Conditions that Impact Expenditures
Category Anticipated Cost
Increased staff cost Salaries and benefits for new hires required to administer and implement water shortage program
Increased O&M(2) cost Operating and maintenance costs associated with alternative sources of water supply
Increased cost of supply and treatment Purchase and treatment costs of new water supply
Notes1. This table is based on a DWR Guidebook table on page 59.2. Operations and maintenance.
Table 7-37Proposed Measures to Overcome Revenue Impacts
Names of Measures Summary of Effects
Obtain CPUC approved surcharge Allows for recovery of revenue shortfalls brought on by water shortage program
Penalties for excessive water use Obtain CPUC approval to use penalties to offset portion of revenue shortfall
Notes1. This table is based on the DWR Guidebook Table 29.
Table 7-38Proposed Measures to Overcome Expenditure Impacts
Names of Measures Summary of Effects
Obtain CPUC approved surcharge Allows for recovery of increased expenditures brought on by water shortage program
Penalties for excessive water use Obtain CPUC approval to use penalties to offset portion of increased expenditures
Notes1. This table is based on the DWR Guidebook Table 30.
Water-Use Monitoring ProceduresThe Act asks for an analysis of mechanisms for determining actual reduction in water use when the Water Shortage Contingency Plan is in effect. Table 7-39 lists the possible mechanisms used by GSWC to monitor water use and the quality of data expected.
10 BAO/051720004 JMS SJC/W062005001

CHAPTER 7. WATER SHORTAGE CONTINGENCY PLAN
Table 7-39Water-Use Monitoring Mechanisms
Mechanisms for Determining Actual Reductions Type and Quality of Data Expected
Customer meter readings Hourly/daily/monthly water consumption data for a specific user depending on frequency of readings
Production meter readings Hourly/daily/monthly water production depending on frequency of readings; correlates to water use plus system losses
Notes1. This table is based on the DWR Guidebook Table 31.
In addition to the specific actions that GSWC can undertake to verify level of conservation, GSWC can monitor long-term water use through regular bi-monthly meter readings, which give GSWC the ability to flag exceptionally high usage for verification of water loss or abuse.
BAO/051720004 JMS SJC/W062005001 11

Chapter 8. Recycled Water Plan
Section 10633 details the requirements of the Recycled Water Plan to be included in the Act. The Act states the following:
Section 10633. The plan shall provide, to the extent available, information on recycled water and its potential for use as a water source in the service area of the urban water supplier. The preparation of the plan shall be coordinated with local water, wastewater, groundwater, and planning agencies that operate within the supplier’s service area and shall include all of the following: (a) A description of the wastewater collection and treatment systems in the
supplier’s service area, including a quantification of the amount of wastewater collected and treated and the methods of wastewater disposal.
(b) A description of the recycled water currently being used in the supplier’s service area, including, but not limited to, the type, place, and quantity of use.
(c) A description and quantification of the potential uses of recycled water, including, but not limited to, agricultural irrigation, landscape irrigation, wildlife habitat enhancement, wetlands, industrial reuse, groundwater recharge, and other appropriate uses, and a determination with regard to the technical and economic feasibility of serving those uses.
(d) The projected use of recycled water within the supplier’s service area at the end of 5, 10, 15, and 20 years, and a description of the actual use of recycled water in comparison to uses previously projected pursuant to this subdivision.
(e) A description of actions, including financial incentives, which may be taken to encourage the use of recycled water, and the projected results of these actions in terms of acre feet of, recycled water used per year.
(f) A plan for optimizing the use of recycled water in the supplier’s service area, including actions to facilitate the installation of dual distribution systems, to promote recirculating uses, to facilitate the increased use of treated wastewater that meets recycled water standards, and to overcome any obstacles to achieving that increased use.
CoordinationTable 8-40 summarizes the role of the agencies that participated in the development of recycled water plans that affect the Bay Point System of the GSWC.
BAO/051720004 JMS SJC/W062005001 1

Table 8-40Role of Participating Agencies in the Development of the Recycled Water Plan
Participating Agencies Role in Plan Development
Water agencies GSWC works closely with the Delta Diablo Sanitation District in providing data for planning a potential recycled water distribution system and identifying potential recycled water customers. The Delta Diablo Sanitation District, acting as the recycled water wholesaler, would lead the way in implementing the recycled water plan and distribution network.
Wastewater agencies The Delta Diablo Sanitation District provides a reliable supply of recycled water that meets California recycled water quality standards set forth in Title 22 of the California Code of Regulations.
Groundwater agencies Not applicable for this CSA.
Planning agencies Contra Costa County, in conjunction with the Delta Diablo Sanitation District, plays a key role in conducting data and customer assessments, as well as analyzing community and economic impacts.
Notes1. This table is based on the DWR Guidebook Table 32.
Wastewater Quantity, Quality, and Current UsesWastewater in the Bay Point System is collected by gravity through sewer mains, trunk sewers, and interceptors. Collected wastewater is transported to the Delta Diablo Wastewater Treatment Plant in Antioch, a secondary treatment plant owned and operated by the Delta Diablo Sanitation District (DDSD). The DDSD serves about 184,000 residents as well as businesses in the communities of Antioch, Bay Point, and Pittsburg. Only a portion of the DDSD customers are also within the Bay Point System. The plant treats an average of 14.2 mgd. The overall plant capacity is 16.5 mgd. The Delta Diablo Wastewater Treatment Plant has recycled water facilities capable of treating up to 12.8 mgd. At this time, about 7 mgd is treated to meet recycled water standards, with industrial uses accounting for 99 percent and irrigation accounting for one percent of water reuse. The remaining treated effluent is discharged into the New York Slough, a section of the San Joaquin River.Because the DDSD treats wastewater for a larger population than is accounted for in the Bay Point System, an estimated per capita wastewater generation factor was used to calculate the volume of wastewater generated by the customers in the Bay Point System. The wastewater generation factor is based on the population served and the average DWF for the DDSD’s treatment plant. The plant serves approximately 184,000 residents and treats an average of 14.2 mgd, making the average per capita wastewater generation factor for DDSD 77 gallons per day (gpd). This per capita wastewater generation factor was used to estimate the wastewater generation in the Bay Point System; Table 8-41 summarizes the estimates of existing and projected volumes of wastewater
BAO/051720004 JMS SJC/W062005001 2

CHAPTER 8. RECYCLED WATER PLAN
collected and treated in the Bay Point System. Of the 14.2 mgd treated, 7 mgd (49.3 percent) of it is treated to meet recycled water standards; the same percentage was used to estimate the fraction of the wastewater that is collected in the Bay Point System that is treated to meet recycled water standards. Table 8-42 lists the existing and projected wastewater disposal methods for the DDSD. Currently, 7.2 mgd (50.7 percent) of all the wastewater that is collected and treated by DDSD is discharged into the New York Slough; the same percentage was used to estimate the fraction of the wastewater that is collected in the Bay Point System that is discharged into the Slough. Table 8-43 was intentionally left blank, as there are no existing uses of recycled water by the GSWC customers of the Bay Point System.
Table 8-41Estimates of Existing and Projected Wastewater Collection and Treatment in ac-ft/yr (mgd) for the Bay Point System
2000(2) 2005 2010 2015 2020 2025 2030
Projected population in service area
22,394 23,923 25,142 28,087 30,069 31,502 33,184
Wastewater collected & treated in service area
1,936(1.7 mgd)
2,068(1.8 mgd)
2,174(1.9 mgd)
2,428(2.2 mgd)
2,600(2.3 mgd)
2,723(2.4 mgd)
2,869(2.6 mgd)
Quantity that meets recycled water standard
954(0.8 mgd)
1,020(0.9 mgd)
1,072(1.0 mgd)
1,197(1.1 mgd)
1,282(1.1 mgd)
1,343(1.2 mgd)
1,414(1.3 mgd)
Notes1. This table is based on the DWR Guidebook Table 33.2. Based on actual year. 3. Values of wastewater collected and treated are estimated. For a description of the methodology, refer to the text.
Table 8-42Estimates of Existing and Projected Disposal of Wastewater In ac-ft/yr (mgd) for the Bay Point System
Method of Disposal Treatment Level 2000(2) 2005 2010 2015 2020 2025 2030
River Discharge Secondary 982(0.9)
1,049(0.9)
1,102(0.9)
1,231(1.1)
1,318(1.2)
1,381(1.2)
1,455(1.3)
Notes1. This table is based on the DWR Guidebook Table 34.2. Based on actual year. 3. Volumes of effluent discharged are estimated. For a description of the methodology, refer to the text.
BAO/051720004 JMS SJC/W062005001 3

2005 URBAN WATER MANAGEMENT PLAN—BAY POINT
Table 8-43Existing Recycled Water Use in the Bay Point System
Type of Use Treatment Level2004 Use(ac-ft/yr)
N/A N/A N/A
Notes1. This table is based on the DWR Guidebook Table 35a.
Potential and Projected UseIn January of 2005, the DDSD finalized its Recycled Water Project Facilities Plan. This analysis evaluated potential recycled water use within the DDSD service area, looking at several alternatives. The recommended alternative would increase landscape water reuse by about 0.5 mgd. However, the additional recycled water use associated with this alternative would not occur in the Bay Point System.In the Recycled Water Project Facilities Plan, DDSD identified potential recycled water customers in the Bay Point System. DDSD identified the possibility of using up to 735 ac-ft/yr of reclaimed water within the boundaries of the Bay Point System (refer to Table 8-44) if, and when, recycled water is available to the Bay Point System. However, through the analysis in the Recycled Water Project Facilities Plan, DDSD determined that it is not economically viable at this time to provide recycled water to the Bay Point System. Therefore, because there are no plans in place to provide recycled water to the Bay Point System at this time, Table 8-45 has intentionally been left blank. In the Urban Water Management Plan for the Bay Point System (2000), there were no projections of recycled water by the year 2005. Therefore, Table 8-46 has intentionally been left blank.
Table 8-44Potential Future Recycled Water Uses in ac-ft/yr
Type of Use Treatment Level 2010(2) 2015 2020 2025 2030
Landscape Secondary 90.3 90.3 90.3 90.3 90.3
Industrial Secondary 645 645 645 645 645
Total 735.3 735.3 735.3 735.3 735.3
Notes1. This table is based on the DWR Guidebook Table.2. Based on actual year.
4 BAO/051720004 JMS SJC/W062005001

CHAPTER 8. RECYCLED WATER PLAN
Table 8-45Projected Future Recycled Water Use in Service Area in ac-ft/yr
Type of Use 2010 2015 2020 2025 2030
N/A N/A N/A N/A N/A N/A
Notes1. This table is based on the DWR Guidebook Table 36.
Table 8-46Comparison of Recycled Water Uses—Year 2000 Projections versus 2005 Actual
Type of Use 2000 Projection for 2005 2005 Actual Use
N/A N/A N/A
Notes1. This table is based on the DWR Guidebook Table 37.
Optimization and Incentives for Recycled Water UseThe DDSD is responsible for determining the technical and economic feasibility of increasing supplies of recycled water to the area as the owner and operator of the Delta Diablo Wastewater Treatment Plant. Extension of the recycled water lines within the Bay Point System is also the responsibility of the DDSD. Because there are no plans in place to provide recycled water to the Bay Point System, there are no actions in place at this time by which GSWC is encouraging the use of recycled water in the CSA. Therefore, Table 8-47 is not applicable for this system and has been intentionally left blank. However, if and when DDSD decides to extend recycled water distribution to the Bay Point System, where possible, GSWC will encourage the use the recycled water by its customers.
Table 8-47Methods to Encourage Recycled Water Use and the Resulting Projected Use in ac-ft/yr
Actions 2010 2015 2020 2025 2030
N/A N/A N/A N/A N/A N/A
Notes1. This table is based on the DWR Guidebook Table 38.
BAO/051720004 JMS SJC/W062005001 5

Chapter 9. Water Quality
Section 10634 of the Act requires an analysis of water quality issues and their impact to supply reliability. The Act states as follows:
Section 10634. The plan shall include information, to the extent practicable, relating to the quality of existing sources of water available to the supplier over the same five-year increments as described in subdivision (a) of Section 10631 and the manner in which water quality affects water management strategies and supply reliability.
GSWC Measures for Water Quality Regulation ComplianceTo facilitate full compliance with water quality laws and regulations, GSWC maintains a water quality department that has independent lines of reporting authority within the organization. The water quality department is headed by a company officer specifically assigned to oversee and manage the company’s water quality program. The Vice President of Water Quality has a staff of three managers, located in each of the company’s regional offices. Water quality managers, in turn, manage a staff of water quality engineers and technicians that are assigned to district offices. Each district office is assigned one water quality engineer and at least one water quality technician to provide direct support to the local drinking water systems within the district. The district water quality engineer is the main point of contact for the Department of Health Services as well as other regulatory agencies. The water quality engineer also is responsible for coordinating compliance measures through scheduling required sample collection, preparing water quality related plans, maintaining a water quality database, providing training to operations, implementing a cross connection control program, and preparing and submitting monitoring reports, permit applications and other regulatory related correspondence. As a whole, the water quality department monitors and participates in the development of new water quality related laws and regulations. Through routine department meetings and training, the district water quality engineers are kept up to date with changing water quality regulations and related technology. These efforts contribute towards maintaining a pool of trained water quality professionals that can be utilized throughout the company. This provides the company the ability to respond to a wide variety of water quality issues or emergencies.
Safe Drinking Water Act (SDWA)Under the federal SDWA of 1974, EPA established drinking water regulations for 23 contaminants. The SDWA Amendments of 1986 required EPA to set maximum contaminant levels (MCLs) for 83 specific constituents and to set MCLs for an additional 25 constituents every 3 years, indefinitely. The 1996 SDWA
BAO/051720004 JMS SJC/W062005001 1

amendments retained the requirement to regulate the 83 contaminants imposed by the 1986 amendments but removed the requirement for 25 additional contaminants every 3 years and established a different process for selecting contaminants for regulation. Under the 1996 SDWA amendments, EPA must: Publish a list of contaminants that may require regulation under the SDWA no
later than February 6, 1998, and every 5 years thereafter Consult with the scientific community, including the Science Advisory Board,
when preparing the list Provide notice and opportunity for public comment on the list Establish an occurrence database to be considered when EPA makes
decisions to regulate contaminants that are known or anticipated to occur in public water systems
Decide whether to regulate no fewer than five listed contaminants, no later than August 6, 2001, and every 5 years thereafter
To regulate a contaminant, EPA must find that the contaminant has an adverse effect on human health, that it occurs or is likely to occur in public water systems at a frequency and at concentrations of public health concern, and that regulation of the contaminant presents a meaningful opportunity to reduce health risks for those served by public water systems.The status of the regulations, including the final rules and those that are still being formulated, are discussed below and summarized in Table 9-48. The current national primary drinking water standards, which are those standards related to health, are shown in Table 9-49. EPA considers compliance with secondary standards, which are those standards related to the aesthetic quality of water, to be optional; but, in California, secondary standards are mandatory unless the population served consents otherwise. The California secondary drinking water standards are shown in Table 9-50
Current and Proposed Water Quality RegulationsEnvironmental Protection Agency (EPA) and the State of California have established, or will develop, the following key primary water quality regulations under the Safe Drinking Water Act (SDWA). The Current and proposed water quality regulations listed below are discussed in the following paragraphs. These regulations apply to community and non-community water systems, which includes those of Golden State Water Company (GSWC) and may affect the GSWC water treatment facilities, treatment processes used, and monitoring requirements. See Table 9-48 for the status of current and proposed water quality regulations. Total Coliform Rule (TCR) Surface Water Treatment Rules
Surface Water Treatment Rule (SWTR) Cryptosporidium Action Plan
BAO/051720004 JMS SJC/W062005001 2

CHAPTER 9. WATER QUALITY
Interim Enhanced SWTR (IESWTR) Long Term 1 Enhanced SWTR (LT1ESWTR) Long Term 2 Enhanced SWTR (LT2ESWTR)
Disinfectant/Disinfection By-Product Rules Total Trihalomethanes (TTHMs) Rule Disinfectant/Disinfection By-Product (D/DBP) Rule Stage 1 Disinfectant/Disinfection By-Product (D/DBP) Rule Stage 2
Volatile Organic, Synthetic Organic and Inorganic Chemical Rules Volatile Organic Chemicals Rule Phase IIA Fluoride Rule Phase IIA Synthetic Organic Chemicals and Inorganic Chemicals Rule Phase V Synthetic Organic Chemicals and Inorganic Chemicals Rule
Groundwater Rule Filter Backwash Rule Lead and Copper Rule Arsenic Rule Radionuclide Rule Radon Rule Drinking Water Candidate Contaminant List
Safe Drinking Water Act (SDWA)Under the federal SDWA of 1974, EPA established drinking water regulations for 23 contaminants. The SDWA Amendments of 1986 required EPA to set maximum contaminant levels (MCLs) for 83 specific constituents and to set MCLs for an additional 25 constituents every 3 years, indefinitely. The 1996 SDWA amendments retained the requirement to regulate the 83 contaminants imposed by the 1986 amendments but removed the requirement for 25 additional contaminants every 3 years and established a different process for selecting contaminants for regulation. Under the 1996 SDWA amendments, EPA must: Publish a list of contaminants that may require regulation under the SDWA no
later than February 6, 1998, and every 5 years thereafter Consult with the scientific community, including the Science Advisory Board,
when preparing the list Provide notice and opportunity for public comment on the list Establish an occurrence database to be considered when EPA makes
decisions to regulate contaminants that are known or anticipated to occur in public water systems
Decide whether to regulate no fewer than five listed contaminants, no later than August 6, 2001, and every 5 years thereafter
To regulate a contaminant, EPA must find that the contaminant has an adverse effect on human health, that it occurs or is likely to occur in public water systems at a frequency and at concentrations of public health concern, and that
BAO/051720004 JMS SJC/W062005001 3

2005 URBAN WATER MANAGEMENT PLAN—BAY POINT
regulation of the contaminant presents a meaningful opportunity to reduce health risks for those served by public water systems.The status of the regulations, including the final rules and those that are still being formulated, are discussed below and summarized in Table 9-48. The current national primary drinking water standards, which are those standards related to health, are shown in Table 9-2. EPA considers compliance with secondary standards, which are those standards related to the aesthetic quality of water, to be optional; but, in California, secondary standards are mandatory unless the population served consents otherwise. The California secondary drinking water standards are shown in Table 9-50
PrimacyEPA has delegated primary enforcement responsibility for drinking water program implementation and enforcement to the state of California. To maintain primacy (authority to enforce drinking water regulations) under the SDWA, the state must adopt drinking water regulations at least as stringent as the federal regulations and meet other relevant criteria. State drinking water regulations may be more stringent than the federal regulations, but not less stringent. In California, the California Department of Health Services (CDHS) is the primacy agency for drinking water regulations.
Table 9-48Status of Drinking Water Regulations
Regulation Contaminants StatusFinal RulesNIPDWR 18 original contaminants Rule final 1975Interim Radionuclides 4 additional radionuclides Rule final 1976Total Trihalomethanes Sum of four trihalomethanes Rule final 1979Revised Fluoride Fluoride Rule final 1986VOCs (Phase I) 8 VOCs Rule final 1987SWTR Treatment tech. (Giardia and viruses) Rule final 1989TCR Total coliforms, fecal coliforms, E. coli Rule final 1989Lead and Copper Rule Lead, copper Rule final 1991SOCs, IOCs (Phase II) 36 IOCs, SOCs, and pesticides MCLs final 1991SOCs, IOCs (Phase IV) 5 IOCs, 18 SOCs MCLs final 1992D/DBP Rule Stage 1 Disinfectants, disinfection by-products Rule final 1998IESWTR Treatment Tech. (Cryptosporidium) Rule final 1998Radionuclides Radionuclides (other than Radon) Rule final 2000Arsenic Arsenic Rule final 2001, new MCL of
10 µg/L effective January 23, 2006
LT1ESWTR Extends IESWTR to small utilities Rule final 2001Filter Backwash Rule Regulate Filter Backwash recycle Rule final 2001Methyl Tertiary Butyl Ether MTBE Rule final 2001Drinking Water Contaminant Candidate List
No less than 5 Contaminants Decision to regulate in 2001, revised DWCCL in 2003 and
every 5 years thereafter
4 BAO/051720004 JMS SJC/W062005001

CHAPTER 9. WATER QUALITY
Table 9-48Status of Drinking Water Regulations
Regulation Contaminants StatusProposed RulesLT2ESWTR Revision of IESWTR to control
CryptosporidiumProposed August 2003, missed
May 2002 SDWA deadline. Final rule expected 2005
D/DBP Rule Stage 2 Revision of D/DBP Rule Stage 1 for distribution system monitoring
Proposed August 2003, missed May 2002 SDWA deadline. Final
rule expected 2005Groundwater Rule Virus, groundwater disinfection Proposed May 2000, missed May
2002 SDWA deadline. Final rule expected 2005
Future RulesRadon Radon Proposed November 1999, EPA
has not indicated a final schedule for promulgation
TCR Revisions Distribution System Issues Potentially proposed mid-2006, final rule by 2008
Notes. Regulation with potential future impact to GSWC.
Table 9-49Current Federal Drinking Water Standards
Parameter mg/L (except as noted)Inorganic Contaminants MCLAntimony 0.006Arsenic1 0.05Asbestos 7 x 10⁶ Fibers/LBarium 2Beryllium 0.004Bromate 0.010Cadmium 0.005Chlorite 0.8Chromium 0.1Cyanide 0.2Fluoride 4Mercury 0.002Nickel 0.1Nitrate (as N) 10Nitrite (as N) 1Nitrate plus Nitrite (both as N) 10Selenium 0.05Thallium 0.002
BAO/051720004 JMS SJC/W062005001 5

2005 URBAN WATER MANAGEMENT PLAN—BAY POINT
Table 9-49Current Federal Drinking Water Standards
Parameter mg/L (except as noted)Inorganic Contaminants Treatment TechniqueCopper 1.3 (Action Level)Lead 0.015 (Action Level)Organic Contaminants MCLAlachlor 0.002Benzene 0.005Benzo (a) pyrene 0.0002Carbon Tetrachloride 0.005Carbonfuran 0.04Chlordane 0.0022,4-D 0.07Dalapon 0.2Di (2-ethylhexyl) adipate 0.4Di (2-ethylhexyl) phthalate 0.0061,2-Dibromo-3-chloropropane (DBCP) 0.0002p-Dichlorobenzene 0.075o-Dichlorobenzene 0.61,2-Dichloroethane 0.0051,1-Dichloroethylene 0.007cis-1,2-Dichloroethylene 0.07trans-1,2-Dichloroethylene 0.1Dichloromethane 0.0051,2-Dichloropropane 0.005Dinoseb 0.007Diquat 0.02Endothall 0.1Endrinh 0.002Ethylbenzene 0.7Ethylene Dibromide 0.00005Glyphosate 0.7Haloacetic Acids (sum of 5 [HAA%]) 0.060Heptachlor 0.0004Heptachlor epoxide 0.0002Hexachlorobenzene 0.001Hexachlorocyclopentadiene 0.05Lindane 0.0002Methoxychlor 0.04Monochlorobenzene 0.1Oxamyl (vydate) 0.2Pentachlorophenol 0.001Picloram 0.5
6 BAO/051720004 JMS SJC/W062005001

CHAPTER 9. WATER QUALITY
Table 9-49Current Federal Drinking Water Standards
Parameter mg/L (except as noted)Polychlorinated biphenyls (PCBs) 0.0005Simazine 0.004Styrene 0.12,3,7,8-TCDD (dioxin) 5 x 10⁻⁸
Tetrachloroethylene 0.005Toluene 1Toxaphene (revised)f 0.0032,4,5-TP (silvex) 0.051,2,4-Trichlorobenzene 0.071,1,1-Trichloroethane 0.201,1,2-Trichlororethane 0.005Trichloroethylene 0.005Trihalomethanes (sum of 4 [TTHM]) 0.080Vinyl Chloride 0.002Xylenes (total) 10Organic Contaminants Treatment TechniqueAcrylamide Restrictions in polymer useEpichlorohydrin Restrictions in material useMicroorganisms StandardCryptosporidium Treatment Tech (99% removal/inactivation)Escherichia coli Treatment Tech (0 cfu/100 mL)Fecal Coliforms Treatment Technique (0 cfu/100 mL)Giardia lamblia Treatment Tech (99.9% removal/inactivation)Heterotrophic Bacteria Treatment Tech (500 cfu/mL at end of distribution
system or measurable chlorine residual)Legionella Treatment TechTotal Coliforms 5% (presence/absence)Turbidity Performance Std (0.3 NTU, 95%)Viruses Treatment Tech (99.99% removal/inactivation)Radionuclides MCLBeta-particle and photon emitters 4 mremAlpha emitters 15 pCi/LRadium 226 + 228 5 pCi/LUranium 0.030Notes1. Arsenic has been proposed at 10 µg/L in the new rule that is currently being reviewed.
BAO/051720004 JMS SJC/W062005001 7

2005 URBAN WATER MANAGEMENT PLAN—BAY POINT
Table 9-50Current State Secondary Drinking Water Regulations
Parameter mg/L (except as noted)Contaminants SMCL or SMCL RangesAluminum 0.2Color 15 Color UnitsCopper 1.0Corrosivity NoncorrosiveFoaming Agents (MBAs) 0.5Iron 0.3Manganese 0.05Methyl tertiary butyl ether (MTBE) 0.005Odor 3 Threshold Odor NumberSilver 0.1Thiobencarb (Bolero) 0.001Turbidity 5 unitsZinc 5
Recommended Upper Short TermTotal Dissolved Solids 500 1,000 1,500Specific Conductance, micromhos 900 1,600 2,200Chloride 250 500 600Sulfate 250 500 600
Total Coliform Rule (TCR)The TCR is the latest version of one of the oldest drinking water regulations. Coliform bacteria are organisms that have one or more biochemical reactions similar to Esherichia coli (E. coli). E. coli are bacteria that are commonly found in the digestive tract of warm-blooded animals. The total coliform test, then, is a test for bacteria, with similar biochemistry to E. coli, but which are capable of growing at 35 degrees Celsius (ºC). The total coliform group includes several genera of bacteria belonging to the family Enterobacteriaciae. Some of these bacteria are not pathogenic. Total coliform testing is commonly used in drinking water treatment to determine the effectiveness of source water, treatment, and distribution system barriers to bacterial contamination.The TCR was promulgated by the EPA in 1989 and DHS enacted its companion TCR that became effective on June 30, 1992. The TCR changed the basic principle of regulating bacterial quality. Instead of having an MCL based on average concentrations, total coliforms are now regulated based on presence/absence. For systems that collect 40 or more samples per month (more than 33,000 of the population) to be in compliance, no more than 5 percent of the samples taken for coliforms in a month can be coliform positive. A sample is considered positive if 1 of the 10 tubes is positive.
8 BAO/051720004 JMS SJC/W062005001
CHAPTER 9. WATER QUALITY
Other significant provisions of the TCR are: In the event of a coliform-positive sample, the utility must resample that
location as well as the nearest upstream and downstream services for coliforms the following day and continue to analyze on consecutive days until either all three samples are negative, or the TCR is violated.
Coliform-positive samples must be further examined for the presence of fecal coliforms or E. coli.
If two consecutive samples from the same sample point are positive and one of those samples is positive for fecal coliforms, the system is out of compliance for that month.
All distribution system zones must be included in the routine sampling program, and some of the sample locations must be rotated throughout the year.
TCR Potential Revisions and Distribution System RequirementsThe 1996 amendments to the SDWA require EPA to review and revise, as appropriate, each national primary drinking water regulation at least every 6 years. EPA published as part of its National Primary Drinking Water Regulation (NPDWR) Review its decision to revise the TCR in July, 2003. EPA is in the process of reviewing available data and research on distribution system risks. These efforts will result in the review and possible revision of the TCR, as well as the potential for requirements for finished water quality in the distribution system. The potential rule revisions could be proposed in 2006 with the rule final by 2008.EPA has been working with distribution system experts to compile existing information regarding potential health risks that may be associated with distribution systems in “white papers” on the following nine distribution system issues: Intrusion Cross-connection control Aging infrastructure and corrosion Permeation and leaching Nitrification Biofilms/growth Covered storage Decay in water quality over time New or repaired watermains EPA is also involved in the development of a series of ten TCR issue papers on the following issues: Distribution system indicators of water quality The effectiveness of disinfectant residuals in the distribution system Analysis of compliance and characterization of violations of the TCR Evaluating HACCP strategies for distribution system monitoring, hazard
assessment and control Inorganic contaminant accumulation in distribution systems
BAO/051720004 JMS SJC/W062005001 9

2005 URBAN WATER MANAGEMENT PLAN—BAY POINT
Distribution system inventory and condition assessment Optimization of distribution system monitoring strategies Effect of treatment on nutrient availability Causes of Total Coliform positive samples and contamination events in
distribution systems Total Coliform sample invalidation Distribution system white papers and TCR issue papers are intended to inform EPA and stakeholders of areas of potential TCR revisions and distribution system requirements.
Surface Water Treatment RulesA series of rules has been or is currently being developed to provide control of microbial contaminants from surface water or groundwater that is under the direct influence of surface water.
The Surface Water Treatment Rule (SWTR)The SWTR is primarily a microbiological regulation and codified the use of the multiple barrier concept for control of pathogenic organisms. The SWTR became effective in June 1993, and required all but the most pristine water sources to provide filtration of their surface water (or groundwater under the direct influence of surface water). It also required all systems having a surface water source to provide some level of disinfection. In further defining the physical barrier of filtration, the SWTR reduced the MCL for finished water turbidity from 1 NTU to 0.5 NTUs (95 percent of the monthly samples, measured daily), and set a limit of 5 NTUs on the maximum finished water turbidity.For disinfection, the SWTR required 99.9 percent (3 logs) for the combination of removal and inactivation of Giardia cysts and 99.99 percent (4 logs) for the combination of removal and inactivation of enteric viruses. The SWTR gave credit for 99.7 percent (2½ logs) removal of Giardia cysts and 99 percent (2 logs) removal of viruses in a “well-operated” conventional surface water treatment plant. The SWTR, then, required an additional ½-log of inactivation of Giardia cysts and an additional 2 logs of inactivation of viruses. Credit for the inactivation (or disinfection) requirements for Giardia and viruses was given for chlorine, chloramines, ozone, and chlorine dioxide. The credit was based upon achieving the product of disinfectant concentration and contact time, known as CT. The concentration (C) used was normally the concentration exiting the reactor used for primary disinfection and the time (T) was the time it took for 10 percent of the influent flow to exit the reactor (T10). T10 was to be determined using tracer testing in the plants using different flow rates. Tables of CT required for each of the disinfectants at different temperatures, and in some cases, different pH values were published in the Guidance Manual for Compliance with the Filtration and Disinfection Requirements for Public Water Systems Using Surface Water Sources (American Water Works Association, Denver, CO, 1991).As an additional barrier to organisms, the SWTR required that a measurable disinfectant residual be present or heterotrophic plate counts be less than 500 colony-forming units at the farthest ends of the distribution system. The
10 BAO/051720004 JMS SJC/W062005001

CHAPTER 9. WATER QUALITY
measurable residual was defined as a minimum of 0.2 mg/L of free or combined chlorine.
Cryptosporidium Action PlanIn April 1995, the California DHS adopted a Cryptosporidium Action Plan that is intended to facilitate comprehensive compliance with the SWTR. The plan does not include any requirements beyond the existing regulations but, instead, clarifies the existing requirements to optimize the treatment process and reduce the risk of a waterborne illness outbreak. The plan includes six elements:1. Conduct watershed sanitary surveys2. Submission of available data to CDHS3. Review of alternative technologies4. Prepare operations plan/optimized treatment5. Prepare reliable removal treatment processes6. Inform the publicThe plan acknowledges that seasonal raw water turbidity and coliform data are a necessary part of any watershed sanitary survey. If cattle, sheep, or other livestock are allowed on a watershed, the survey must identify their location and number as well as steps that are taken to prevent contamination from the animal waste. Measures that will prevent runoff from any animal containment site reaching the water source should also be identified.As part of the plan, the DHS completed a comprehensive review of the operations by water systems that use an alternative treatment system. The review focused on compliance with the turbidity standard during normal operations and after backwashing or other interruptions in service. It also included a review of the engineering report required 60 days after the first year of operation.The Cryptosporidium Action Plan states that “DHS agrees with and endorses” the American Water Works Association’s (AWWA) goal of 0.1 NTU for effluent turbidity from all surface water treatment plants. The plan recommends that all water systems with a surface water supply “adopt a philosophy of always optimizing their surface water treatment plant operations in a manner designed to achieve the maximum turbidity removal.” CDHS believes that, by striving to meet these goals, water systems will be minimizing their customers’ risk of exposure to pathogens, including Cryptosporidium. The plan identifies the following elements that should be included in the operations plan of a system for treatment optimization: Including a statement at the beginning of the operations plan stating that it is
the goal of the water utility to optimize plant performance and maximize turbidity removal.
Monitoring all unit processes closely and responding immediately to any malfunction.
Operating unit processes at hydraulic loading rates to meet optimization goals.
BAO/051720004 JMS SJC/W062005001 11

2005 URBAN WATER MANAGEMENT PLAN—BAY POINT
Establishing procedures to optimize coagulation, flocculation, and sedimentation to enable maximum turbidity removal in the pretreatment units with a turbidity goal of 1 to 2 NTUs in the sedimentation basin effluent at all times. The proper pretreatment chemical and dose should be determined from results of jar tests or particle counters.
Expanding turbidity monitoring of individual filters on both a continuous basis and intermittent grab samples and, if possible, turbidity monitoring of all sedimentation processes.
Calibrating turbidimeters frequently. Establishing procedures for optimizing filter operations to avoid turbidity
spikes after service interruptions and attempting to achieve turbidity values of 0.3 NTU or less after backwash.
Operating the plant to avoid sudden increases in flow through a filter. Optimizing the performance of backwash water recovery systems.
Establishing a goal of less than 2.0 NTUs for the reclaimed backwash water and sludge reclamation system effluent.
The Cryptosporidium Action Plan states that all water treatment plants should install a continuous turbidity analyzer and chart recorder to monitor the plant effluent. The monitor should be inspected and standardized regularly. Additionally, all water utility systems should be capable of quickly replacing or repairing failed equipment including: Filter media and filter underdrains Backwash pumps and surface wash systems Pretreatment chemical feed and mixing facilities Turbidity monitoring unitsFinally, the CDHS suggests that water utilities should provide an informational notification to its customers if they do not have a treatment process in place that provides for physical removal of pathogens. Those plants that are hydraulically overloaded or unable to achieve the effluent turbidity goals until improvements are made may also inform the customers of the system.
Interim Enhanced Surface Water Treatment RuleThe two main purposes of the IESWTR are to improve control of microbial pathogens in drinking water, particularly for the protozoan, Cryptosporidium, and to guard against significant increases in microbial risk that might otherwise occur when systems implement the Stage 1 D/Disinfectant By-Product (DBP) Rule (discussed below). The IESWTR was finalized in December 1998, but enforcement began in 2002.Because of the resistance of Cryptosporidium oocysts to inactivation by chlorine and chloramine and a lack of data concerning other disinfectants, the IESWTR concentrated its efforts on improving the physical barrier (filtration). This was done by further reducing the MCL for finished water turbidity from 0.5 NTU to 0.3 NTU and the maximum single sample finished water turbidity limit was reduced to 1 NTU. A facility is deemed to be in compliance with the MCL if 95 percent of
12 BAO/051720004 JMS SJC/W062005001

CHAPTER 9. WATER QUALITY
the daily values per month are at or below 0.3 NTU. Since the limit is 0.3 NTU and not 0.30 NTU, the plant is in compliance as long as the values stay at or below 0.34 NTU. Additionally, individual filter monitoring was required and exception reports to the state are required for: Any individual filter with a turbidity level greater than 1.0 NTU based on two
consecutive measurements 15 minutes apart, and Any individual filter with a turbidity greater than 0.5 NTU at the end of the
first 4 hours of filter operation based on the two consecutive measurements 15 minutes apart
Also, if an individual filter turbidity level is greater than 1.0 NTU, based on two consecutive measurements 15 minutes apart at any time in each of 3 consecutive months, the system must provide an exceptions report (within 30 days of the exceedance) and conduct a self-assessment of the filter (according to the EPA guidance for Comprehensive Performance Evaluation). And, if an individual filter has turbidity greater than 2.0 NTU, based on two consecutive measurements 15 minutes apart at any time in each of 2 consecutive months, the system must provide an exceptions report (within 30 days of the exceedance) and arrange for a Comprehensive Performance Evaluation (CPE) by the state or a third party approved by the state.To guard against an increase in microbial risk due to implementation of the DBP Rule, disinfectant profiling and benchmarking are required. Systems having total trihalomethane (TTHM) concentrations exceeding 0.064 mg/L or total haloacetic acid (HAA5) concentrations exceeding 0.048 mg/L are required to produce disinfectant profiles for 3 years of existing data showing the CT that was actually achieved, divided by the CT required for inactivation of Giardia and viruses. If the data do not exist, the system was required to collect 1 year of data by March 16, 2000. The data were analyzed; and the month having the lowest ratio of CT to CT required became the “critical period,” and the average value of the ratio became the “benchmark.” Systems have to consult with the state before changing disinfection practices, which could result in a log inactivation less than the benchmark value.
Long Term 1 Enhanced Surface Water Treatment RuleThe LT1ESWTR extends the IESWTR to systems serving fewer than 10,000 people.
Long Term 2 Enhanced Surface Water Treatment RuleThe LT2ESWTR is also designed to control risk from Cryptosporidium. An Agreement in Principle was reached by the Federal Advisory Committee for this rule and the Disinfectant/Disinfection By-Product Rule Stage 2 (discussed below) in August 2003. In this Agreement, the major microbial issues were addressed as follows: Monitoring for Bin Classification. A two year monitoring program is required
for systems serving 10,000 or more people for Cryptosporidium, E. coli, and turbidity. The water system will be classified into a bin for Cryptosporidium risk based upon this monitoring.
BAO/051720004 JMS SJC/W062005001 13

2005 URBAN WATER MANAGEMENT PLAN—BAY POINT
Action Bins. Table 9-51 illustrates the bin classification system for Cryptosporidium risk.
Toolbox. A toolbox approach was recommended that would receive log-credit given in Table 9-52.
Reassessment and Future Monitoring. Systems that provide a total of 2.5 logs of treatment (99.7 percent) for Cryptosporidium in addition to conventional treatment are exempt from reassessment and future monitoring. Six years after initial bin characterization, another round of monitoring will be held.
Unfiltered Systems. Unfiltered systems must continue to meet filtration avoidance criteria, provide 4-log virus inactivation, 3-log Giardia inactivation, and 2-log Cryptosporidium inactivation.
Table 9-51Bin Requirements Table (from Microbial/Disinfection Byproducts [M/DBP] Federal Advisory CommitteeStage 2 M-DBP Agreement in Principle)
Bin Number
Average Cryptosporidium Concentration
Additional treatment requirements for systems with conventional treatment that are in full compliance with the
IESWTR1 Cryptosporidium <0.075/L No Action
2 0.075/L < Cryptosporidium< 1.0/L
1-log treatment (systems may use any technology or combination of technologies from toolbox as long as total credit is at least 1 log)
3 1.0/L < Cryptosporidium < 3.0/L
2.0-log treatment (systems must achieve at least 1-log of the required 2-log treatment using ozone, chlorine dioxide, UV, membranes, bag/cartridge filters, or in-bank filtration)
4 Cryptosporidium > 3.0/L 2.0-log treatment (systems must achieve at least 1-log of the required 2.5-log treatment using ozone, chlorine dioxide, UV, membranes, bag/cartridge filters, or in-bank filtration)
Disinfectant/Disinfection By-Product RulesTotal Trihalomethanes (TTHM) Rule The TTHM Rule was the first rule to recognize that a risk of cancer may be connected to the use of chlorine to inactivate pathogenic organisms. The TTHM Rule was effective in 1981. Chlorine reacts with naturally occurring organic matter (NOM) present in water to form chlorinated organic compounds. Four of these—chloroform, dichlorobromo-methane, dibromochloromethane, and bromoform—were selected to serve as indicators for the cancer risk due to chlorinated disinfection by-products. The MCL for the total of these four compounds was set at 0.1 mg/L. This historic rule changed the manner in which many water plants in the U.S. performed disinfection. Prior to the rule, chlorine was added liberally to raw water to improve plant operations which maximized contact time available through the treatment plant. After this rule took effect, many utilities changed to applying chlorine after much of the NOM had been removed through coagulation, flocculation, and sedimentation. Also, the use of chloramines, which
14 BAO/051720004 JMS SJC/W062005001

CHAPTER 9. WATER QUALITY
limit the formation of trihalomethanes, was increased as a disinfectant for the distribution system.
BAO/051720004 JMS SJC/W062005001 15

2005 URBAN WATER MANAGEMENT PLAN—BAY POINT
Table 9-52Microbial Toolbox Components (from Microbial/Disinfection Byproducts [M/DBP] Federal Advisory CommitteeStage 2 M-DBP Agreement in Principle)
APPROACHPotential Log Credit
0.5 1 2 >2.5Watershed ControlWatershed Control Program (1) XReduction in oocyst concentration (3) As MeasuredReduction in viable oocyst concentration (3) As MeasuredAlternative SourceIntake Relocation (3) As MeasuredChange to Alternative Source of Supply (3) As MeasuredMgmt. of Intake to Reduce Capture of Oocysts in Source Water (3) As MeasuredManaging Timing of Withdrawal (3) As MeasuredManaging Timing of Withdrawal in Water Column (3) As MeasuredPretreatmentOff-Stream Raw Water Storage w/Detention ~ X days (1) XOff-Stream Raw Water Storage w/Detention ~ Y weeks (1) XPresettling Basin w/Coagulant (1) X --▶Lime Softening (1) ----------▶In-Bank Filtration (1) X ---------▶Improved TreatmentLower Finished Water Turbidity (0.15 NTU 95%tile Combined Filter Effluent )
X
Slow Sand Filters (1) XRoughing Filters (1) X -----------------▶Membranes (MF, UF, NF, RO) (1) XBag Filters (1) X ---------▶Cartridge Filters (1) XImproved DisinfectionChlorine Dioxide (2) X XOzone (2) X X XUV (2) XPeer Review/Other Demo./Validation or System PerformancePeer Review Program (ex. Partnership Phase IV) XPerformance Studies demonstrating reliable specific log removals for technologies not listed above. This provision does not supersede other inactivation requirements.
As demonstrated
NotesX indicates potential log credit based on proper design and implementation in accordance with EPA guidance. Arrow indicates
estimation of potential log credit based on site-specific or technology-specific demonstration of performance.1. Criteria to be specified in guidance to determine allowed credit2. Inactivation dependent on dose and source water characteristics3. Additional monitoring for Cryptosporidium after this action would determine new bin classification and whether additional
treatment is required.
16 BAO/051720004 JMS SJC/W062005001

CHAPTER 9. WATER QUALITY
Disinfectant/Disinfection By-Product (D/DBP) Rule Stage 1Stage 1 of the D/DBP Rule was enacted to reduce the health risk due to disinfection practice. To accomplish this, the Rule reduced the MCL for TTHM, enacted MCLs for haloacetic acids (HAA5) (Table 9-53), bromate (an ozone by-product), and chlorite (a chlorine dioxide by-product), enacted maximum residual disinfectant levels (MRDLs) for chlorine, chloramines, and chlorine dioxide (Table 9-54), and enacted a treatment technique called “enhanced coagulation” (EC) to limit the amount of unknown by-products that may be formed during chlorination.
Table 9-53Disinfection By-Product MCLs from Stage 1 of the D/DBP Rule
Compound or Group MCL, mg/L
Trihalomethanes (TTHM) 0.08
Haloacetic Acids (HAA5) 0.06
Bromate 0.01
Chlorite 1.0
Table 9-54Disinfectant MRDLs from Stage 1 of the D/DBP Rule
Compound or Group MCL, mg/L
Chlorine 4.0
Chloramines 4.0
Chlorine Dioxide 0.8
EC defines a requirement for removal of total organic carbon (TOC) in the coagulation, flocculation, sedimentation portion of the conventional treatment plant. A system does not have to implement enhanced coagulation if any of the following are true:1. Source water TOC is less than 2.0 mg/L.2. Treated water TOC is less than 2.0 mg/L.3. Source water TOC < 4.0 mg/L, raw water alkalinity > 60 mg/L as CaCO3,
distribution system TTHM and HAA5 concentrations are less than or equal to 40 mg/L and 30 mg/L, respectively.
4. Distribution system TTHM and HAA5 concentrations are less than or equal to 40 mg/L and 30 mg/L, respectively, and the system uses only free chlorine for disinfection.
5. Source-water-specific ultraviolet absorbance (SUVA) is less than 2.0 L/mg-m. SUVA is calculated by dividing UV absorbance (m-1) at 254 nm by the concentration (mg/L) of dissolved organic carbon (DOC).
BAO/051720004 JMS SJC/W062005001 17

2005 URBAN WATER MANAGEMENT PLAN—BAY POINT
6. Treated water SUVA is less than 2.0 L/mg-m.If none of these conditions are met, Step 1 of EC takes effect. Step 1 establishes targets for additional precursor removals to be achieved based on raw water TOC and alkalinity. These targets are shown in Table 9-55. If a utility can satisfy the TOC percent removals specified in Step 1, the EC criterion for Stage 1 is satisfied.
Table 9-55Required Removal of TOC by Enhanced Coagulation, Step 1
Source Water TOC mg/L Source Water Alkalinity , mg/L as CaCO3
0 to 60 >60 to 120 >120
>2.0 to 4.0 35 25 15
>4.0 to 8.0 45 35 25
>8.0 50 40 30
If a system is unable to meet the Step 1 TOC removal requirements, an alternative percent TOC removal requirement may be selected by Step 2 procedures as follows:1. Bench or pilot tests are performed in which alum or an equivalent dose of
ferric coagulant is added in 10 mg/L increments until the pH is lowered to the target pH value. The target pH values are given in Table 9-9 for varying source water alkalinity.
2. Once the bench or pilot test is complete, the TOC removal (mg/L) is then plotted versus coagulant dose (mg/L).
3. The alternative TOC removal percentage is set at the point on the TOC versus coagulant dose plot where the slope changes from greater than 0.3 mg TOC/L / 10 mg alum/L to less than 0.3/10 and remains less than 0.3/10.
If the TOC removal versus coagulant dose plot does not reach this point of diminishing returns, the water is considered not amenable to enhanced coagulation; and a waiver from the enhanced coagulation requirements must be obtained from the state.
Table 9-56Target pH Values for Enhanced Coagulation, Step 2 Bench Testing
Raw Water Alkalinity, mg/L as CaCO3 Target pH
0 to <60 5.5
60 to <120 6.3
120 to <240 7.0
240 7.5
18 BAO/051720004 JMS SJC/W062005001

CHAPTER 9. WATER QUALITY
D/DBP Rule Stage 2Stage 2 of the D/DBP Rule is designed to reduce DBP occurrence peaks in the distribution system. An Agreement in Principle was reached by the Federal Advisory Committee for this rule and the Long Term 2 Enhanced Surface Water Treatment Rule (discussed above) in August 2003. This rule is expected to be finalized in 2005. In this Agreement, the major DBP issues were addressed as follows: Compliance monitoring will be preceded by an initial distribution system
monitoring study to select optimal sampling points for capturing peaks. Compliance with each MCL (TTHM and HAA5) will be determined based upon
a Locational Running Annual Average (a running annual average calculated at each sample location).
Systems will comply with the Stage 2 D/DBP Rule in two phases—3 years after promulgation all systems must comply with a 120-g/L TTHM / 100-g/L HAA5 locational running annual average based on Stage 1 monitoring sites and continue to comply with the 80-g/L TTHM / 60-g/L HAA5 system running annual average from Stage 1.
Six years after rule promulgation (with an additional 2-year extension available for systems requiring capital improvements) large and medium systems must comply with an 80-g/L TTHM / 60-g/L HAA5 based upon the new sample sites identified in the initial distribution system monitoring described above.
Small systems must comply with the 80-g/L TTHM / 60-g/L HAA5 locational running annual average in either 7.5 or 8.5 years (with an additional 2-year extension available for systems requiring capital improvements) depending upon whether the system is required to do Cryptosporidium monitoring as part of the LT2ESWTR.
The bromate MCL will remain at 0.010 mg/L. EPA commits to review the bromate MCL as part of the 6-year review to determine whether the bromate MCL should be reduced to 0.005-mg/L or a lower concentration.
Volatile Organic, Synthetic Organic and Inorganic Chemical RulesVolatile Organic Chemicals RuleThe Phase I Volatile Organic Chemicals (VOCs) Rule established MCLGs and MCLs for eight VOCs. The rule was promulgated in July 1987 and became effective in January 1989. All public water systems (PWS) were required to complete initial VOC monitoring by December 1991. Monitoring requirements include sampling at each entry point to the distribution system. If no VOCs were detected during the initial monitoring, repeat monitoring is required every three to five years, depending on the vulnerability of the source. If VOCs are detected, quarterly samples must be analyzed. Compliance requires that VOC levels be lower than the MCLs, based on the annual average of quarterly samples.The Phase I VOC Rule also required monitoring of 51 additional unregulated VOCs. All systems were required to complete the initial monitoring for these
BAO/051720004 JMS SJC/W062005001 19

2005 URBAN WATER MANAGEMENT PLAN—BAY POINT
contaminants by December 1991. Repeat monitoring is required every five years; however, USEPA revises the list of unregulated contaminants thereby changing the constituents to be monitored. Monitoring requirements for Phase I contaminants were revised in the Phase II Synthetic Organic Chemicals and Inorganic Chemicals Rule (Phase II SOC/IOC Rule) to conform with the standardized monitoring.The Phase IIA Fluoride Rule applies to all public water systems. The rule was finalized in April 1986 and became effective in October 1987. The primary purpose of the Phase IIA Fluoride Rule was to protect the public from crippling skeletal fluorosis. The rule established an MCLG and MCL for fluoride at 4 mg/L. A secondary contaminant level (SMCL) of 2 mg/L was established to protect against dental fluorosis. Monitoring of fluoride concentration is required yearly for surface water sources and every three years for groundwater sources. For systems practicing fluoridation, daily monitoring of fluoride at the entrance to the distribution system is recommended.
Phase II Synthetic Organic Chemicals and Inorganic Chemicals RuleThe Phase II SOC/IOC Rule applies to all public water systems. The rule was promulgated in June 1991 (33 contaminants) and July 1991 (5 contaminants). This rule established MCLs and treatment techniques for 38 contaminants. Monitoring for the Phase II contaminants occurs in a standardized 3 year cycle, which began in January 1993. Compliance with the Phase II MCLs is based on the average of quarterly samples.
Phase V Synthetic Organic Chemicals and Inorganic Chemicals RuleThe Phase V Rule was promulgated in July 1992 and set MCLGs and MCLs for 23 contaminants. Compliance monitoring for these contaminants follows the same standardized monitoring framework introduced with the Phase II rule. Some of the Phase V contaminants were previously on the unregulated contaminants monitoring (UCM) lists under other rules. To eliminate duplication, these contaminants were withdrawn from the UCM lists.
Groundwater RuleThe EPA is currently in the process of developing the Groundwater Rule (GWR), formerly known as the Groundwater Disinfection Rule. The rule name was changed to reflect a more holistic regulatory approach to addressing ground water issues. The rule applies to public ground water systems and to systems that mix surface water and ground water if the ground water is added directly to the distribution system and provided to consumers without treatment. This includes untreated stand-alone ground water wells and untreated ground water plants that have their own entry points to the distribution system as well as untreated groundwater blended with treated surface water prior to the entry point to the distribution system. Treatment in this case is defined as 4-log inactivation/removal of viruses.The proposed Groundwater Rule was published in the Federal Register on May 10, 2000. The final rule is expected in late 2005. Specific requirements proposed in the rule include:
20 BAO/051720004 JMS SJC/W062005001

CHAPTER 9. WATER QUALITY
1. System sanitary surveys conducted by the state and identification of significant deficiencies.
2. Hydrogeologic sensitivity assessments for undisinfected systems. 3. Source water microbial monitoring by systems that do not disinfect and draw
from hydrogeologically sensitive aquifers or have detected fecal indicators within the system’s distribution system.
4. Corrective action by any system with significant deficiencies or positive microbial samples indicating fecal contamination.
5. Compliance monitoring for systems which disinfect to ensure that they reliably achieve 4-log inactivation or removal of viruses.
EPA missed the May 2002 deadline to promulgate, and the final rule was expected in early 2005, but was withdrawn for further review. The schedule for the release of the final GWR is uncertain at this time.
Filter Backwash RuleThe Filter Backwash Rule is a regulation for filtered surface water supplies that recycle some or all of filter backwash into the plant. The purpose of the rule is to require systems to review their recycle practices and, where appropriate, work with the State to make any necessary changes to current practices that may compromise microbial control. The proposed rule was published in April 2000, with the final rule promulgated in April 2001. It will apply to all systems that use filter recycle streams. The final rule contained the following key provisions: Return of all recycle-flows prior to the point of the primary coagulant
addition. Direct filtration plants to provide information to the state on their current
recycle practice. A requirement for systems meeting criteria to perform a one-time self
assessment of their recycle practice and consult with their primacy agency to address and correct high risk recycle operations.
The first element would require that all systems using surface water or groundwater under the direct influence of surface water return all recycle flows to the process prior to the point of the primary coagulant addition. Waivers to this requirement would be available from state primacy agencies for unique treatment conditions.The second element would require all direct filtration plants to report to the state primacy agency whether flow equalization or treatment is provided for recycle flow prior to its return to the treatment process. The state would use that information to determine the plants that need to change their current recycle practice in order to provide additional public health protection.The third element would require that all plants using 20 or fewer filters and directly recycling flows to the treatment process without any form of treatment on the recycle flow complete a self-assessment. The self-assessment would be used to determine the effect of untreated recycle flows to the plant process. The
BAO/051720004 JMS SJC/W062005001 21

2005 URBAN WATER MANAGEMENT PLAN—BAY POINT
State primacy agency would use the results of the self-assessment to determine the appropriate level of treatment of recycle flows.Systems were to notify the State of their recycle practices by October 2003, modify their recycle return location as required by June 2004, and complete the necessary capital improvements to comply with all rule requirements by June 2006.
Lead and Copper RuleThe Lead and Copper Rule was promulgated in June 1991 and went into effect in December 1992, with minor revisions released in April 2000. The rule applies to all community and non-transient non-community water systems. The rule developed MCLGs and action levels for both lead and copper in drinking water. The major difference between this regulation and most others is that the water is to be monitored at the customer’s tap, not the treatment plant discharge point. Lead and copper must be monitored at the customer’s taps every 6 months and twice each calendar year at the highest risk locations. The highest risk locations are defined as: Piping with lead solder installed after 1982, Lead water service lines, Lead interior piping.
For compliance, the samples at the customer’s tap must not exceed the following action levels: Lead concentration of 0.015 mg/L detected in the 90th percentile of all
samples. Copper concentration of 1.3 mg/L detected in the 90th percentile of all
samples.If action levels are exceeded, water systems must collect source water samples and submit all data to the state with a treatment recommendation to reduce concentrations below the action level. In addition, the water system must also provide a public education program to its customers within 60 days of the action level exceedance. The education program must be continued until the samples are found to be below the lead action levels.All water systems that exceed the lead or copper action levels are also required to conduct a corrosion control study. Corrosion control studies must compare the effectiveness of pH and alkalinity adjustment, calcium adjustment, and addition of a phosphate or silica-based corrosion inhibitor. Large and medium systems are also required to monitor many other water quality parameters at the plant discharge and customer’s tap.After a corrosion control study is completed, a water system must develop a corrosion control program and submit it for approval to the primacy agency. Once approval of the plans is received, water systems have 24 months to install and implement the treatment methods for corrosion control and 12 additional months to collect follow-up samples. After this time, the water system must comply with the action levels for both lead and copper.
22 BAO/051720004 JMS SJC/W062005001

CHAPTER 9. WATER QUALITY
In 2000, minor revisions to the lead and copper rule were promulgated to streamline requirements and reduce some burdens on water systems. No changes to the MCLs or the MCLGs were made. Small changes were made to reduce the frequency of monitoring for systems with low lead and copper tap levels and to update the analytical methods used for compliance. Further revisions to the lead and copper rule are expected to be proposed in late 2005, but no information as to what will be included in the potential revisions to the rule has been released.
Arsenic RuleThe original arsenic MCL of 50µg/L was set by the EPA in 1975 based on Public Health Service Standard originally published in 1942. A new proposed Arsenic Rule was released in June 2000. The EPA was originally under a court-imposed deadline to promulgate this rule by November 1992. However, the EPA has received extensions to examine health effects and occurrence data. EPA succeeded in finalizing the Arsenic Rule on January 16, 2001, during the final days of the Clinton administration. The final rule was published in the Federal Register on January 22, 2001 and became effective on February 22, 2002. The following is a summary of the major provisions and requirements of the rule: A MCLG for arsenic in drinking water is set at zero. The MCL for arsenic is revised from 50 µg/L down to 10 µg/L by January 23,
2006. Beginning with Consumer Confidence Reports (CCRs) due by July 1, 2002, all
community water systems (CWSs) will begin providing health information and arsenic concentrations in the annual reports for water that exceeds 5 µg/L (one half of the MCL).
Both CWSs and non-transient non-community water systems (NTNCWSs) are required to meet the revised arsenic standard.
Two compliance requirements for inorganic contaminants (IOCs), volatile organic contaminants (VOCs), and synthetic organic contaminants (SOCs). Specifically, when a system fails to collect the required number of samples, compliance averages will be based on the actual number of samples collected. Also, new public water systems and systems using new sources of water must demonstrate compliance within state-specified time and sampling frequencies. These provisions apply to arsenic.
All CWSs and NTNCWSs that exceed the MCL of 10µg/L are required to come into compliance 5 years after the publication of the final rule.
Radionuclide RuleThe original Radionuclide Rule was proposed in July 1991, but court action delayed its final promulgation. The final Radionuclides Rule was published in the Federal Register on December 7, 2000. The rule became effective in December 2003. New monitoring requirements have been phased-in the publication date of the final rule and the beginning of the next Standardized Monitoring Framework period on December 31, 2007. “Phased-in monitoring” refers to the fact that
BAO/051720004 JMS SJC/W062005001 23

2005 URBAN WATER MANAGEMENT PLAN—BAY POINT
States will require some fraction of water systems to complete their initial monitoring requirements each year of the period between the effective date (December 8, 2003) and the beginning of the new cycle (December 31, 2007). Water systems will determine initial compliance under the new monitoring requirements using the average of four quarterly samples or, at state discretion, using appropriate grandfathered data. Compliance will be determined immediately based on the annual average of the quarterly samples for that fraction of systems required by the state to monitor in any given year or based on the results from the grandfathered data. Water systems with existing radionuclides monitoring data demonstrating that the system is out of compliance with new provisions will be out of compliance on the effective date of December 8, 2003. In the final rule, EPA set the MCL for uranium at 30µg/L, using its authority under the SDWA for the first time to set a standard at a higher than the feasible level based on cost-benefit considerations. The standard for combined radium-226/228 remains at 5 picoCuries per liter (pCi/L). However, the rule requires improved monitoring for radium. The final rule retains the interim standards for gross alpha particles at 15 pCi/L and for beta and photon emitters at 4 millirems (mrem). A summary of the final Radionuclides Rule is provided below. Table 9-57 also lists the existing (1979) and the revised MCLs of the final Radionuclide Rule.
Affected Systems: Community Water Systems (CWSs); non-CWSs, including transient and non-transient, are exempt.
MCL Goals (MCLGs) for radionuclides: MCLGs of zero; includes combined radium-226/228; gross alpha, beta particle and photon radioactivity, and uranium
Radium MCL: Combined Ra-226 and Ra-228 MCL of 5 pCi/L; based on new risk levels.
Beta/Photon Radioactivity MCL: ≤ 4 mrem/yr to the total body or any given internal organ except for H-3
and Sr-90 H-3 = 20,000 pCi/L; Sr-90 = 8 pCi/L Total dose from co-occurring beta/photon emitters must be ≤ 4 mrem/yr
to the total body of any internal organ; This MCL will be reviewed within 2 to 3 years based on a need for further
re-evaluation of the risk management issues. Gross alpha MCL: 15 pCi/L excluding uranium and radon, but including Ra-
226; maintain current MCL. Uranium MCL: 30 µg/L; new MCL. Polonium-210: Part of gross alpha; monitoring required under the UCMR rule;
further action may be proposed at a later date.
24 BAO/051720004 JMS SJC/W062005001

CHAPTER 9. WATER QUALITY
Lead-210: Not regulated; monitoring required under the UCMR rule; further action may be proposed at a later date.
BAO/051720004 JMS SJC/W062005001 25

2005 URBAN WATER MANAGEMENT PLAN—BAY POINT
Table 9-57Existing and Revised MCLs for Radionuclides
Contaminant 1979 MCLs 2000 Radionuclide Rule MCLs
Radium 226/228 5 piC/L 5 piC/L
Uranium N/A 30 piC/L
Gross Alpha 15piC/L 15 piC/L
Beta Particles and Photon Emitters 4 mrems 4 mrem
Radon Rule Radon is a naturally occurring, carcinogenic, radioactive gas. Radon in drinking water increases risk to public health, primarily from inhalation of radon discharged through normal household use, such as showering, but also from ingestion of water. The proposed Radon Rule applies to all community water systems that use groundwater or mixed groundwater and surface water supply sources.On November 2, 1999, the long anticipated and heavily debated Radon Rule was formally proposed, but EPA missed the SWDA deadline of August 2000 promulgation. EPA has not indicated a final schedule for the promulgation of the Radon Rule at this time.The rule includes a two-option approach that allows states and water suppliers to reduce radon risks in indoor air while protecting public health from the highest levels of radon in drinking water. The proposed rule includes the following provisions: MCLG zero MCL 300 pCi/L Alternative MCL (AMCL) 4,000 pCi/LThe AMCL provision of the rule applies to water systems that adopt and comply with a multimedia mitigation (MMM) program aimed at reducing household indoor/air health risks from the soil as well as the tap water. The AMCL of 4,000 pCi/L is based on the National Research Council recommended estimate of 10,000 to 1 as the transfer factor from water to air and the national average outdoor radon concentration of 0.4 pCi/L in air. Thus, an estimate of 0.4 pCi/L in air would be equivalent to 4,000 pCi/L in water. If a state develops an MMM program that is approved by the EPA, public water systems in that state will be able to comply with the AMCL rather than the MCL. Alternatively, if a state chooses not to adopt its own MMM program or a state’s MMM program does not meet EPA approval, an individual public water supplier can submit an MMM program for approval. The 1996 SDWA Amendments require that the EPA evaluate MMM programs every 5 years.
26 BAO/051720004 JMS SJC/W062005001

CHAPTER 9. WATER QUALITY
Drinking Water Contaminant Candidate List As amended in 1996, the SWDA requires the EPA to establish a list of contaminants that are known or anticipated to occur in public water systems and may require regulation under the SWDA. The first Contaminant Candidate List (CCL) was published in the Federal Register in March 1998 and included 60 contaminants under consideration for regulation. A second version of the CCL was published in February 2005. The second version of the CCL carries forward 51 of the original 60 unregulated contaminants from the first version of the CCL. The CCL includes both microbiological and chemical contaminants. The CCL published in February 2005 includes 42 chemical contaminants and 9 microbiological contaminants/contaminant groups. Table 9-58 lists the contaminants published in the CCL in February 2005.Contaminants included in the CCL are studied to develop analytical methods for detecting the contaminants, determine whether they occur in drinking water, and evaluate treatment technologies to remove them from drinking water. In addition, the health effects of the contaminants are studied to help determine if actions such as drinking water guidance, health advisories, or regulation need to be developed. The CCL alone does not impose any requirements on public water system.
Table 9-58Contaminant Candidate List (CCL)
Microbiological Contaminants
Adenoviruses
Aeromonas hydrophila
Caliciviruses
Coxsackieviruses
Cyanobacteria (blue-green algae), other freshwater algae, and their toxins
Echoviruses
Helicobacter pylori
Microsporidia (Enterocytozoon & Septata)
Mycobacterium avium intracellulare (MAC)
Chemical Contaminants
1,2,2,2-tetrachloroethane
1,2,4-trimethylbenzene
1,1-dichloroethane
1,1-dichloropropene
1,2-diphenylhydrazine
1,3-dichloropropane
1,3-dichloropropene
BAO/051720004 JMS SJC/W062005001 27

2005 URBAN WATER MANAGEMENT PLAN—BAY POINT
Table 9-58Contaminant Candidate List (CCL)
2,4,6-trichlorophenol
2,2-dichloropropane
2,4-dichlorophenol
2,4-dinitrophenol
2,4-dinitrotoluene
2,6-dinitrotoluene
2-methyl-Phenol (o-cresol)
Acetochlor
Alachlor ESA & other acetanilide pesticide degradation products
Aluminum
Boron
Bromobenzene
DCPA mono-acid degradate
DCPA di-acid degradate
DDE
Diazinon
Disulfoton
Diuron
EPTC (s-ethyl-dipropylthiocarbamate)
Fonofos
p-Isopropyltoluene (p-cymene)
Linuron
Methyl bromide
Methyl-t-butyl ether (MTBE)
Metolachlor
Molinate
Nitrobenzene
Organotins
Perchlorate
Prometon
RDX
Terbacil
Terbufos
28 BAO/051720004 JMS SJC/W062005001

CHAPTER 9. WATER QUALITY
Table 9-58Contaminant Candidate List (CCL)
Triazines and degradation products of triazines (including, but not limited to Cyanazine, and atrazine-desethyl)
Vanadium
Water Quality IssuesSurface Water QualitySurface water is supplied to the water system from the Contra Costa Canal, owned and operated by the Contra Costa Water District (CCWD). The canal is supplied water from the Sacramento/San Joaquin Delta through three intake locations; from Rock Slough near Oakley, Old River near Discovery Bay, and Mallard Slough near Pittsburg. Water can also be stored from the Old River intake in the off-stream Los Vaqueros Reservoir. Water quality fluctuates throughout the year and from year to year at each of the three intake locations and Los Vaqueros Reservoir. The variation in water quality of the canal water is partially compensated for by selecting or changing the flow rates of these four water sources into the canal. A partial list of constituents and their variation since January 2000 in the raw surface water supply affecting treatment operations for the water system are provided in Table9-59.
Table 9-59Contra Costa Canal Water Quality Parameter Variations (January 2000 to Present)
Constituent Units Range
Alkalinity mg/L 61 - 120
Turbidity NTU 2.0 – 18.5
TOC mg/L 2.6 – 4.5
TDS mg/L 120 – 450
EC umhos/cm 180 – 600
Chlorides mg/L 12 - 88
CCWD has an extensive monitoring program covering various aspects of the canal operation. The program helps assure early detection of possible water quality issues and constituents of concern. These constituents include pathogens and disinfection byproducts. According to the May 2002 CCWD Watershed Sanitary Survey, potential contamination sources to the canal water supplies included the following: Agricultural drainage near the Old River and Rock Slough intakes, Industrial NPDES permit holder discharges, Landfills and hazardous waste sites in the watershed study area,
BAO/051720004 JMS SJC/W062005001 29

2005 URBAN WATER MANAGEMENT PLAN—BAY POINT
Grazing activity near Rock Slough, Influences of the Ironhouse Sanitation District near Pumping Plant #1, Urban runoff into the canalHistorical data has not identified any chronic problems with contamination to date. However, increased development is expected within the watershed and may lead to increased urban runoff. CCWD continues to monitor the canal water supplies and evaluates for potential problems. This includes working with the Ironhouse SD to determine potential corrective measures of impacts to the canal, review of CEQA and NPDES documents to identify potential new sources of watershed contaminants, explore possible relocation of agricultural drain outfalls to mitigate their impacts on the Old River and Rock Slough intakes, mitigate storm water and urban runoff away from the canal, limit grazing in District controlled watershed lands, and limit body contact recreation in all water supply reservoirs. Conventional treatment methods are used by the water system’s Hill Street Water Treatment Plant to treat the raw water supply from the Contra Costa Canal. These methods consist of coagulation, flocculation, sedimentation, filtration, and disinfection unit processes. Water produced by the plant consistently meets drinking water standards under the current regulations. This could change with the lowering of the future TTHM limits set in the Stage 2 D-DBP Rule., or with adoption of limits set for constituents listed on the Contaminant Candidate List. Treatment modifications are being planned for the filtered water at the Hill Street Treatment Plant to reduce the precursors which form TTHMs prior to the implementation of the Stage 2 D-DBP Rule. Other future chemical contaminant regulations for disinfection by-products, endocrine disrupters, and pharmaceutical chemicals entering the surface water supply, have been discussed but are unknown at this time. The water system is also served treated surface water through an inter-tie with the CCWD. This water also originates from the Contra Costa Canal and is treated by the CCWD using similar treatment unit processes, with the addition of ozone for disinfection. The surface water source is supplied to the water system at a constant rate of 40 gpm, and can be increased to 1,400 gpm during short emergency periods.
Groundwater QualityIn addition to a surface water supply, the water system is supplied ground water from three wells. All three well water supplies meet primary drinking water standards. However, one of the wells has elevated nitrate levels and occasionally exceeds the recommended secondary drinking water standards. Nitrate level for this well water is above the trigger level of 22.5 mg/L but below the primary drinking waters standard of 45 mg/L. Water from this well is discharged directly into the distribution system without treatment, other than disinfection with free chlorine. The remaining two well water supplies are blended with the filtered surface water supply at a ratio of at least 10:1. The blending action reduces the concentration of secondary drinking water constituents to below the secondary drinking water standards. The raw groundwater supply from these wells occasionally exceeds the secondary drinking water levels as follows:
30 BAO/051720004 JMS SJC/W062005001

CHAPTER 9. WATER QUALITY
Well #1 raw groundwater occasionally exceeds the recommended secondary MCL for sulfate, total dissolved solids (TDS), and specific conductance (EC) prior to blending.
Well #2 occasionally exceeds the secondary MCL for Aluminum and the recommended secondary MCL for sulfate, TDS, and EC prior to blending.
Well #3 occasionally exceeds the recommended secondary MCL for TDS and EC.
The ranges for these constituents since 2000 are listed in Table 9-60 below.
Table 9-60Bay Point System – Range for Secondary MCL Constituents
Constituent SMCL Units Well #1 Well #2 Well #3
Aluminum
Sulfate
TDS
EC
Cl
200
250
500
900
250
µg/l
mg/L
mg/L
umhos/cm
mg/L
< 50
350
930-1000
1400-1600
150
< 50
440
1000-1200
1600-1800
150
< 50
73
680
1000-1100
110
Although unregulated, boron is a contaminant being monitored in the three wells and has been found to exceed the CDHS Notification Level of 1.0 mg/L in Well #1 and #2. Due to the blending of these water sources with the filtered surface water supply, boron levels in the blended water supply remain below the Notification Level.Table 9-61 summarizes water quality issues and recommendations for the wells within the water system.
Table 9-61Summary of Assessment
Well Capacity (gpm)
Status Water Quality Issue/Concern
Existing Treatment
Recommendations
Well #1 100 Active Sulfate, TDS, EC, Boron
Blended with Filtered Surface Water
Continue to Monitor
Well #2 60 Active Sulfate, TDS, EC, Boron
Blended with Filtered Surface Water
Continue to Monitor
Well #3 30 Active Nitrate, TDS, EC, Boron
None Develop a controlled blend plan
BAO/051720004 JMS SJC/W062005001 31

2005 URBAN WATER MANAGEMENT PLAN—BAY POINT
Projected Impact of Water QualityImpacts to the water supplies of the water system due to water quality issues may be insignificant relative to the known and proposed drinking water regulations. Of the proposed rules, only the Stage 2 D-DBP rule will have an impact on the unit processes used currently to treat the surface water supply from the Contra Costa Canal. With the lowering of the DBP levels at site specific locations throughout the water system’s treated distribution system brought about by the ruling, additional treatment of the filtered water at the Hill Street Treatment Plant will be necessary to remove the precursors which develop into THMs. Treatment options to provide the precursor removals are being planned by the water system at this time. No change in the quantity of delivered surface water is projected due to water quality issues. Groundwater sources do not appear to be impacted by known or proposed drinking water regulations as they relate to water quality issues. The Groundwater Rule is not expected to impact the groundwater supply to the water system.The limited sources of water supply to the water system are not viewed to change in either quality or supply in the projected future. This is summarized in Table 9-62 below:
Table 9-62Summary of Projected Water Supply Changes Due to Water Quality Issues
Water Source 2005 2010 2015 2020 2025 2030
Surface Water – Contra Costa Canal Projected Change (percent)
0 0 0 0 0 0
Surface Water – Treated CCWD Projected Change (percent)
0 0 0 0 0 0
Groundwater – (total of 3 wells) Projected Change (percent)
0 0 0 0 0 0
Notes1. Table format based on DWR Guidance Document Table 39
Distribution System Water QualityDistribution system water quality monitoring is performed for several water quality parameters in the Bay Point System, including general physical parameters, presence of coliform bacteria, disinfectants and disinfection by-product levels, and corrosivity of the water by monitoring lead and copper levels at customers’ water taps. All monitoring parameters and levels currently meet drinking water standards. The ability to continue to meet these standards is not expected to change in the foreseeable future, with the exception of disinfection byproducts. Drinking water standard levels for disinfection by-products will be lowering in the future in accordance with the Stage 2 D-DBP Rule. A treatment process is being planned by the water system as previously discussed, and will
32 BAO/051720004 JMS SJC/W062005001

CHAPTER 9. WATER QUALITY
be added to the filtered surface water supply to reduce the precursors which eventually develop into disinfection byproducts in the distribution system.
Emerging Water Quality IssuesThe California Legislature required the CDHS to adopt a new drinking water standard for arsenic by June 30, 2004. In advance of the requirement, the Office of Environmental Health Hazard Assessment (OEHHA) set a public health goal for arsenic at 0.004 µg/L. This is based on lung and urinary bladder cancer risk. Monitoring results from drinking water sources throughout the state reflect its natural occurrence. They also show that considerably more sources have arsenic detections above the federal 10µg/L MCL compared to the current MCL of 50 µg/L. Arsenic levels in the water system’s water sources range from less than 2.0 to 4.7µg/L. The CDHS continue to assess where they will set the new state MCL for arsenic MCL.In 2000, there was significant interest in the detection and possible health effects of chromium +6 in drinking water supplies throughout the state. In 2001, the OEHHA withdrew their previously established Public Health Goal (risk assessment level) of 2.5µg/L for total chromium. The current MCL enforced by the CDHS is 50µg/L for total chromium, and OEEHA is in the process of establishing a specific Public Health Goal for chromium +6. The water system initiated sampling of all its water sources for total chromium and chromium +6 in 2001. Total Chromium and chromium +6 ranged from less than 10 to 11µg/L and from less than 1 to 7.9µg/L, respectively. Total chromium and chromium +6 were non-detectable in the raw surface water source.Source water protection is important for all of California. The CDHS requires large water systems supplying surface water to complete a watershed Sanitary Survey every five years to examine possible sources of drinking water contamination. The last Survey, performed by CCWD in May 2002 did not identify any persistent constituents requiring additional treatment processes at the time. Since the surface water supply for the water system is taken from the lowest end of the San Joaquin Valley’s natural drainage system, prior to the water entering the San Francisco Bay, the surface water has the potential to be exposed to numerous activities within the broad area of the watershed, including the direct and indirect effects from urban and industrial development, recreational activities, and changes in agricultural practices. Stewardship projects in the watershed are being formulated and implemented to reduce these potential concerns to the water system’s surface water supply.A similar requirement from the USEPA called for all utilities to complete a Source Water Assessment for all water sources. The water system completed the Assessments in August 2000. The ground water sources are considered most vulnerable to possible contaminating activities associated with dry cleaners, storm drain discharge points, transportation corridors, high density housing, other water supply wells, and drinking water treatment plants. Contaminants associated with these activities have not been detected in the water supply. Until recently, MTBE was the primary oxygenate in virtually all gasoline used in California. It was introduced to surface water bodies from motor exhaust of
BAO/051720004 JMS SJC/W062005001 33

2005 URBAN WATER MANAGEMENT PLAN—BAY POINT
recreational watercraft, and into groundwater supplies by leaking underground storage tanks. The CDHS adopted a primary MCL of 13µg/L for MTBE based on carcinogenicity studies in animals. They also established a secondary MCL for MTBE at 5µg/L, based upon taste and odor concerns. MTBE has been non-detectable in all water sources serving the water system to date. However, this could change in time as known leaking storage tanks and other MTBE plumes find there way into the water system’s well water supply. According to the 2000 Drinking Water Source Assessment for the water system, all three well water sources were not within the sphere of influence of known leaky underground storage tanks, gasoline service stations, auto repair shops, or petroleum pipelines.The change in the national and international security situation has led to an increased concern about the ability to protect the nation’s water supply. In coordination with its parent company, the water system added new security measures in 2001 and continues to upgrade and refine procedures. Changes have included added surveillance equipment, increases in water quality tests, as well as developing contingency plans that coordinate with the Homeland Security Office’s multicolored tiered risk alert system.
34 BAO/051720004 JMS SJC/W062005001

Chapter 10. Water Service Reliability
Section 10635 of the Act requires that an assessment of water service reliability for various climatic conditions be undertaken. The Act states:
Section 10635 (a) Every urban water supplier shall include, as part of its urban water
management plan, an assessment of the reliability of its water service to its customers during normal, dry, and multiple dry water years. This water supply and demand assessment shall compare the total water supply sources available to the water supplier with the total projected water use over the next 20 years, in five-year increments, for a normal water year, a single dry water year, and multiple dry water years. The water service reliability assessment shall be based upon the information compiled pursuant to Section 10631, including available data from state, regional, or local agency population projections within the service area of the urban water supplier.
(b) The urban water supplier shall provide that portion of its urban water management plan prepared pursuant to this article to any city or county within which it provides water supplies no later than 60 days after the submission of its urban water management plan.
(c) Nothing in this article is intended to create a right or entitlement to water service or any specific level of water service.
(d) Nothing in this article is intended to change existing law concerning an urban water supplier’s obligation to provide water service to its existing customers or to any potential future customers.
This chapter provides a water supply and demand assessment for the Bay Point System for a normal year, a single-dry year, and multiple-dry years. The following is a summary of the water supply sources and reliability of those sources for the Bay Point System. The details of water supply sources and the reliability of these supplies are provided in Chapter 3. Water demand projections are documented in Chapter 4.The Bay Point System gets its water supply from local groundwater and imported water from CCWD. Purchased water from CCWD makes up between 92 and 94 percent of the available supply, whereas the remainder is ground water supplies. Due to these different sources of supplies, conditions in local and distant areas can impact the reliability of supplies. CCWD expects to be 100 percent reliable during normal years for the next twenty-five years. However, CCWD anticipates shortages in supply during multiple-dry years. CCWD estimates that at least 85 percent of demand will be met in a second or third dry year during multiple dry-years. The remaining 15 percent would be met by short-term water purchases and a voluntary short-term conservation program.
BAO/051720004 JMS SJC/W062005001 1

CCWD has taken steps to identify improvements that will support the reliability of their water source. These efforts are described in the Future Water Supply Study (FWSS) as adopted by the CCWD Board of Directors. The FWSS was updated in 2002. The FWSS includes a Preferred Alternative that provides drought reliability and operational flexibility in the short-term while maintaining long-term supply targets to meet projected demands. This preferred alternative includes, a) Re-negotiation of the CCWD’s existing Central Valley Project (CVP) Amendatory contract (I75r-3401), b) implementation of expanded District wide conservation program, which would achieve a target of at least 5 percent District-wide savings by the year 2040, and c) potentially two or more water transfers that would strengthen the reliability of supplies and provide drought protection for existing customers and bridge the gap between water supplies and projected demands. The water supply reliability goal adopted as part of the FWSS under CVP is to provide 100 percent of demand in normal years and minimum of 85 percent of demand in the second and third years of a multiple dry-year period. Up to 15 percent of demand during an extended drought may be met with short-term water transfers or demand management (CCWD 2005).Water transfers are identified in the FWSS as a preferred means of strengthening drought protection for existing customers and meeting supply shortfalls. The purchase of water transfers would follow an incrementally stepped approach, triggered by increases in demand as a result of approved growth within the Contra Costa County and cities within CCWD. Long and short-term transfers and exchange opportunities are available to CCWD. The February 2000 Agreement with East Contra Costa Irrigation District (ECCID) to transfer surplus irrigation water was the first long-term water transfer for CCWD. Currently, up to 9,700ac-ft/yr (5,700 ac-ft in normal years and 9,700 ac-ft in CVP shortage years) is available under the agreement. In the future, this agreement will provide up to 12,200ac-ft/yr (8,200 ac-ft in normal years and up to 12,200 ac-ft in CVP shortage years). The water transfer opportunities evaluated by CCWD include: conjunctive use, groundwater banking, lease/purchase water rights and remarket surplus supplies, co-invest in agricultural conservation, and fallowing or crop shifting option contract. CCWD also has experience in implementing short-term water transfers. The goal of the short-term transfer program was to establish relationships with sellers, work through the various institutional issues associated with transfers before a serious water shortage occurs, and to develop water transfer agreements that would allow CCWD to purchase water in shortage years. In addition, if required CCWD would pursue additional short-term water transfers directly from agricultural districts (in Northern California), who participate in the spot market each year.In addition to the water transfers and purchases, water recycling is a component of CCWD’s long-term sustainable water supply strategy. The recycled water would be used for various purposes including urban landscaping and golf course irrigation and for industrial uses. CCWD will continue to work with local wastewater agencies to implement recycled water projects that are financially viable, provide beneficial use and are consistent with appropriate legal, public health and environmental requirements (CCWD, 2005).
BAO/051720004 JMS SJC/W062005001 2

CHAPTER 10. WATER SERVICE RELIABILITY
Historically, GSWC’s Bay Point System has reliably produced approximately 220ac-ft/yr to 550 ac-ft/yr of groundwater. Based on the Basin’s reliability, GSWC’s groundwater supply for the Bay Point System is expected to continue to be 100 percent reliable.The following sections present the normal water year, single-dry year, multiple-dry year water supply and demand assessments.
Normal Water Year AnalysisTable 10-63 provides the projected water supply from groundwater and imported water in normal water years (see Chapter 3 for details).
Table 10-63Projected Normal Water Year Supply
2010 2015 2020 2025 2030
Total Water Supply 3,076 3,445 3,704 3,909 4,119
Percent of Year 2005 105 118 127 134 141Notes1. Table format based on DWR Guidance Document Table 40
Table 10-64 provides water demand projections in normal water years (see Chapter 4 for details).
Table 10-64Summary of Projected Normal Water Year Demands
2010 2015 2020 2025 2030
Total Water Demand 3,076 3,445 3,704 3,909 4,119
Percent of Year 2005 105 118 127 134 141Notes1. Table format based on DWR Guidance Document Table 41
Table 10-65 summarizes the service reliability assessment for a normal water year based on water supply and water demand projections. As described in Chapter 3, imported water provided by CCWD, and local groundwater from the Pittsburg Plain Groundwater Basin are expected to be 100 percent reliable to meet the projected demands during normal water year conditions through 2030.
Table 10-65Comparison of Projected Normal Year Supply and Demand
2010 2015 2020 2025 2030
Water Supply Total (ac-ft/yr) 3,076 3,445 3,704 3,909 4,119
Water Demand Total (ac-ft/yr) 3,076 3,445 3,704 3,909 4,119
BAO/051720004 JMS SJC/W062005001 3

2005 URBAN WATER MANAGEMENT PLAN—BAY POINT
Table 10-65Comparison of Projected Normal Year Supply and Demand
2010 2015 2020 2025 2030
Difference (supply minus demand) 0 0 0 0 0
Difference as Percent of Supply 0 0 0 0 0
Difference as Percent of Demand 0 0 0 0 0
Notes1. Table format based on DWR Guidance Document Table 42
Single Dry-Year Analysis Table 10-66 presents projected single-dry year water supplies to meet the projected demands.
Table 10-66Projected Single-Dry Year Water Supply
Supply (ac-ft/yr)2010 2015 2020 2025 2030
Water Supply 3,076 3,445 3,704 3,909 4,119
Percent of Year 2005 105 118 127 134 141Notes
1. Table format based on DWR Guidance Document Table 43
Table 10-67 provides projected single-dry year water demand. It is assumed that the single-dry year demands are the same as those water demands projected for the normal years.
Table 10-67Summary of Projected Single-Dry Year Demands
Demand (ac-ft/yr)
2010 2015 2020 2025 2030
Water Demand 3,076 3,445 3,704 3,909 4,119
Percent of Year 2005 105 118 127 134 141Notes1. Table format based on DWR Guidance Document Table 44
Table 10-68 demonstrates the reliability of water supplies to meet projected annual water demands for the Bay Point System in a single-dry year. As described in Chapter 3, imported water provided by CCWD, and local groundwater from the Pittsburg Plain Groundwater Basin are expected to be 100 percent reliable to meet the projected demands in a single dry-year through 2030.
4 BAO/051720004 JMS SJC/W062005001

CHAPTER 10. WATER SERVICE RELIABILITY
Table 10-68Comparison of Projected Supply and Demand for Single Dry Year
2010 2015 2020 2025 2030
Supply Total (ac-ft/yr) 3,076 3,445 3,704 3,909 4,119
Demand Total (ac-ft/yr) 3,076 3,445 3,704 3,909 4,119
Difference (supply minus demand) 0 0 0 0 0
Difference as Percent of Supply 0 0 0 0 0
Difference as Percent of Demand 0 0 0 0 0
Notes1. Table format based on DWR Guidance Document Table 45
Multiple Dry-Year AnalysisCCWD does not anticipate any water supply deficits in normal year, single-dry year, and the first year of the 3-year multiple-dry year period. CCWD estimates that at least 85 percent of demand will be met in a second or third dry year during multiple dry-years. The remaining 15 percent would be met by short-term water purchases and a voluntary short-term conservation program (with a request for up to 5 and 15 percent in the second and third years of a multiple dry-year period, respectively).
Table 10-69 presents the projected multiple-dry year water supply and demand assessment. The third year of the multiple-dry year water supply projection represents the end of each 3-year multiple-dry year period as required for the multiple-dry year analysis. For calculating the water supplies from CCWD for the multiple-dry years through 2030, the following procedure is applied: 1) The water supplies in the multiple-dry years are assumed to be the same as the water demand in normal years 2) The water supplies from CCWD are reduced by 15 percent from the corresponding normal year supplies in the second and third year of multiple-dry year periods. For example, the water supply from CCWD for 2009 and 2010 has been reduced by 15 percent from the water supply in 2010 in normal years 3) No reduction has been made to the CCWD’s water supply in the first year of the multiple-dry year period (i.e., the projected water supply in 2008 in this example). The groundwater supply is expected to continue to be 100 percent reliable under all hydrologic conditions.In summary, CCWD has implemented and will implement programs and projects to ensure the imported water demands can be met under various hydrologic conditions. CCWD’s UWMP indicates that the CVP supplies in conjunction with short-term water purchases and a request for voluntary short-term conservation will be considered to meet demands during the severe water shortage periods.
BAO/051720004 JMS SJC/W062005001 5

2005 URBAN WATER MANAGEMENT PLAN—BAY POINT
Table 10-69Projected Multiple-Dry Year Water Supply and Demand Assessment
YearSupply (ac-ft/yr)
Demand(ac-ft/yr) Difference
Difference as Percent of
Supply
Difference as Percent of Demand
2006
2007
2008 3,076 3,076 0 0 0
2009 2,649 3,076 427 16 142010 2,649 3,076 427 16 142011
2012
2013 3,445 3,445 0 0 02014 2,963 3,445 482 16 142015 2,963 3,445 482 16 142016
2017
2018 3,704 3,704 0 0 02019 3,183 3,704 521 16 142020 3,183 3,704 521 16 142021
2022
2023 3,909 3,909 0 0 02024 3,357 3,357 552 16 142025 3,357 3,357 552 16 142026
2027
2028 4,119 4,119 0 0 02029 3,536 4,119 583 16 142030 3,536 4,119 583 16 14
Notes1. This assessment is based on the 3-year multiple-dry year period ending in 2010, 2015, 2020, 2025, and 20302. Table format based on DWR Guidance Document Tables 47 through 57
6 BAO/051720004 JMS SJC/W062005001
Chapter 11. References
Association of Bay Area Governments (ABAG) Projections. 2005. Forecasts for San Francisco Bay Area to the Year 2030. December 2004, <http://store.abag. ca.gov/projections.asp#26ab>.
California Department of Water Resources (DWR). 2005. Guidebook to Assist Water Suppliers in the Preparation of a 2005 Urban Water Management Plan. January 18.
_______________. California’s Groundwater: Bulletin 118-2003.California Urban Water Management Council (Council). 2004. Memorandum of
Understanding Regarding Urban Water Conservation in California. As Amended March 10.
Contra Costa County Community Development Department. 2005. Contra Costa County General Plan 2005-2020. January.
Contra Costa Water District. 2005. Draft 2005 Urban Water Management Plan. October.
_______________. 2002. Future Water Supply Study. _______________. 2002. Watershed Sanitary Survey. May.Delta Diablo Sanitation District. 2005. Recycled Water Project Facilities Plan.
January.Western Regional Climate Center (WRCC). 2005. Period of Record Monthly
Climate Summary. <http://www.wrcc.dri.edu/cgi-bin/cliMAIN.pl?captch+sfo>.
BAO/051720004 JMS SJC/W062005001 1

Appendix AUrban Water Management Planning Act

Appendix BPublic Hearing Notice and Meeting Minutes

Appendix CPublic Comments on the Draft UWMP

Appendix DEconomic Analysis of Selected
Demand Management Measures

Appendix ECouncil Annual Reports for
Demand Management Measures

Appendix FRule No. 14.1: Mandatory Water Conservation,
Restrictions, and Rationing Program

Appendix GRate Schedule

Appendix HResponses to Public Comments

Appendix IGroundwater Basin Water Rights
Stipulation/Judgment

Appendix JSummary of Population Based on Census Data