Embed Size (px)
Citation preview

ÇÖPLER GOLD PROJECT EAST CENTRAL TURKEY
PRELIMINARY ASSESMENT SULFIDE ORE PROCESSING
Prepared for:
Anatolia Minerals Development Limited 405 Urban Street, Suite 150 Lakewood, Colorado 80228
Prepared by:
Easton Process Consulting, Inc. and
Pennstrom Consulting
Authors:
Christopher L. Easton Easton Process Consulting, Inc.
William J. Pennstrom, Jr.
Pennstrom Consulting
Deepak Malhotra Resource Development Inc.
Richard C. Moores
Anatolia Minerals Development Limited
John M. Marek Independent Mining Consultants Inc.
February 4, 2008

Pennstrom Consulting Easton Process Consulting, Inc.
ii
TABLE OF CONTENTS (Page 1 of 4) SECTIONS
1.0 SUMMARY......................................................................................................................................6
Introduction ......................................................................................................................................6 Sulfide Process Description ..............................................................................................................7 Design Criteria .................................................................................................................................7 Modification and Additions to the Oxide Process.............................................................................8 Gold Recovery, Capital and Operating Costs ...................................................................................9 Upside Potential ............................................................................................................................. 13
2.0 INTRODUCTION .......................................................................................................................... 16 2.1 Location.................................................................................................................................... 16 2.2 Site Criteria .............................................................................................................................. 17 2.3 Mineralization .......................................................................................................................... 17 2.4 Mineral Resources .................................................................................................................... 18 2.5 Sulfide Mill Facility Feed Tons and Grade Assumptions.......................................................... 20 2.6 Oxide Ore Facilities.................................................................................................................. 20 2.7 Terms of Reference .................................................................................................................. 21
3.0 RELIANCE ON OTHER EXPERTS, DISCLAIMER..................................................................... 23 4.0 PROPERTY DESCRIPTION AND LOCATION ........................................................................... 24 5.0 ACCESSIBILITY, CLIMATE, LOCAL RESOURCES, INFRASTRUCTURE, PHYSIOGRAPHY
................................................................................................................................................. 25 6.0 HISTORY....................................................................................................................................... 26 7.0 GEOLOGIC SETTING................................................................................................................... 27 8.0 DEPOSIT TYPES........................................................................................................................... 28 9.0 MINERALIZATION ...................................................................................................................... 29 10.0 EXPLORATION........................................................................................................................... 30 11.0 DRILLING ................................................................................................................................... 31 12.0 SAMPLING METHODS AND APPROACH ............................................................................... 33 13.0 SAMPLE PREPARATION ANALYSIS AND SECURITY ......................................................... 35 14.0 DATA VERIFICATION............................................................................................................... 38 15.0 ADJACENT PROPERTIES.......................................................................................................... 52 16.0 MINERAL PROCESSING AND METALLURGICAL TESTING............................................... 53
16.1 Background ............................................................................................................................ 53 16.2 Comminution.......................................................................................................................... 53 16.3 Agitated Cyanide Leaching..................................................................................................... 54 16.3 Pre-Concentration Methods .................................................................................................... 55 16.4 Column Leaching ................................................................................................................... 55 16.5 Cyanide Soluble Copper ......................................................................................................... 56 16.6 Copper Carbon Loading and Stripping ................................................................................... 56 16.7 Amenability of Ores to Cyanide Leaching .............................................................................. 56 16.8 Cyanide Destruction ............................................................................................................... 59 16.9 Leach Tailings Thickening ..................................................................................................... 59 16.10 High Density Thickening...................................................................................................... 60 16.11 Sulfide Metallurgy ................................................................................................................ 60 16.12 Rio Tinto Mining and Exploration Conceptual Study1, 2 ....................................................... 60 16.13 AMDL Sulfide Ore Preliminary Testing in 20063 ................................................................. 65

Pennstrom Consulting Easton Process Consulting, Inc.
iii
16.14 AMDL Sulfide Ore Additional Metallurgical Testing, 20074................................................ 71 16.15 Conceptual Process Flowsheet .............................................................................................. 78 16.16 Additional Metallurgical Test Work ..................................................................................... 79 16.17 Mass balance and Process Flow Diagrams............................................................................ 79
16.17.1 Introduction ................................................................................................................. 79 16.17.2 Design Criteria And Model Limitations And Exclusions............................................. 80 16.17.3 Major Design Criteria .................................................................................................. 80 16.17.4 Process Flow Diagrams (PFD’s).................................................................................. 81
17.0 MINERAL RESOURCES AND MINERAL RESERVES ESTIMATES ...................................... 85 17.1 Block Model ........................................................................................................................... 85 17.2 Block Grade Estimation.......................................................................................................... 86 17.3 Specific Gravity Data ............................................................................................................. 89 17.4 Resource Classification Code ................................................................................................. 91 17.5 Floating Cones........................................................................................................................ 91 17.6 Mine Plan and Production Schedule ..................................................................................... 101 17.7 Mineral Reserves and Mineral Resources ............................................................................. 106
18.0 OTHER RELEVANT DATA...................................................................................................... 108 19.0 INTERPRETATION AND CONCLUSIONS ............................................................................. 109 20.0 RECOMMENDATIONS ............................................................................................................ 110 21.0 REFERENCES ........................................................................................................................... 112 22.0 CERTIFICATES OF AUTHORS................................................................................................ 113 23.0 ADDITIONAL REQUIREMENTS............................................................................................. 125
23.1 Capital Cost Estimate ........................................................................................................... 125 23.1.1 Inclusions: ................................................................................................................... 125 23.1.2 Exclusions: .................................................................................................................. 126 23.1.3 Contingency ................................................................................................................ 126
23.2 Process Operating Cost Estimate .......................................................................................... 127 23.2.1 Process Operating Cost Development.......................................................................... 127 23.2.2 Process Operating Cost Summary................................................................................ 128
23.3 Project Economics and Sensitivity Analysis ......................................................................... 130 23.3.1 Project Costs................................................................................................................ 130 23.3.2 Project Economics ....................................................................................................... 131 23.3.3 Sensitivity Analysis ..................................................................................................... 131
ATTACHMENTS A: Process Model Design Criteria B: Material and Energy Balance C: Process Flow Diagrams D: Capital Cost Estimate Detail E: Process Operating Cost Estimate Detail F: Simplified Cash Flow Analysis

Pennstrom Consulting Easton Process Consulting, Inc.
iv
TABLE OF CONTENTS
(Page 3 of 4) TABLES
Table 1.1 Sulfide Facility Capital and Operating Costs and Assumptions............................................ 10 Table 1.2 Results of Simplified Cash Flow Analysis (un-leveraged, pre-tax) ...................................... 11 Table 1.3 Summary of Products and Consumables .............................................................................. 12 Table 2.1 Mineral Reserves and Mineral Resource Estimates from April 2007 NI 43-101 .................. 19 Table 2.2 Mineral Reserves with Breakout of Oxide and Sulfide Materials ......................................... 19 Table 2.3 Sulfide Facility Feed Tons and Grade .................................................................................. 20 Table 14.1 Assays of Çöpler Samples Collected by IMC..................................................................... 50 Table 16.1 Major Ore Type Percentages .............................................................................................. 53 Table 16.2 Preliminary Ore Types versus Estimated Process Recovery............................................... 58 Table 16.3 Head Analyses of Composite Samples ............................................................................... 61 Table 16.4 X-Ray Fluorescence Analyses of Composite Samples ....................................................... 62 Table 16.5 X-Ray Diffraction Analyses of Composite Samples........................................................... 63 Table 16.6 Summary of Flotation Test Results .................................................................................... 64 Table 16.7 Head Analyses of Composite Sulfide Sample .................................................................... 66 Table 16.8 X-ray Fluorescence Analyses of Composite Sulfide Sample .............................................. 67 Table 16.9 X-ray Diffraction Analyses of Composite Sulfide Sample ................................................. 68 Table 16.10 Summary of Scoping Flotation Test Results (Grind: P80=200 Mesh) ............................... 69 Table 16.11 Summary of Effect of Grind on Flotation......................................................................... 70 Table 16.12 Head Analyses of Composite Samples ............................................................................. 72 Table 16.13 XRF Analyses of Composite Samples.............................................................................. 73 Table 16.14 Results of Scoping Flotation Study for Composite No. 1 (MTS)...................................... 74 Table 16.15 Results of Scoping Flotation Study for Composite No. 2 (DIORITE) .............................. 75 Table 16.16 Cyanide Leach Test Results for Whole Ore Samples ....................................................... 76 Table 16.17 Summary of Results for Leaching Following Reducing Roast @ 425 ̊C (P80=200 Mesh)76 Table 16.18 Summary of Results for Leaching Following 2 Stage Roast............................................. 77 Table 16.19 Summary of Results for Pressure Oxidation followed by Cyanidation ............................. 77 Table 17.1 Kriging Parameters for Indicator Grade Breaks ................................................................. 87 Table 17.2 Kriging Parameters for Block Grade Estimation ................................................................ 88 Table 17.3 Model Density Assignment ................................................................................................ 90 Table 17.4 Floating Cone Input Parameters, for Reserves.................................................................... 93 Table 17.5 Floating Cone Input Parameters Resource Pit with Sulfide Treatment ............................... 98 Table 17.6 Çöpler Mine Production Schedule Based on Measured and Indicated Category
Mineralization....................................................................................................... 104 Table 17.7 Mineral Reserves and Mineral Resources Based on $475/oz Gold and $8.00/Oz Silver... 106 Table 17.8 Mineral Reserves with Breakout of Oxide and Sulfide Materials ..................................... 107 Table 23.1 Capital Cost Estimate....................................................................................................... 127 Table 23.2 Çöpler Process Operating Costs Summary ....................................................................... 129 Table 23.3 Sulfide Facility Capital and Operating Costs and Assumptions........................................ 130 Table 23.4 Simplified Project Economic Analysis ............................................................................. 131 Table 23.5 IRR Sensitivity to Process Facility Variables ................................................................... 132 Table 23.6 IRR Sensitivity to Gold Recovery .................................................................................... 132

Pennstrom Consulting Easton Process Consulting, Inc.
v
TABLE OF CONTENTS (Page 4 of 4) FIGURES
Figure 2.1 Project Location.................................................................................................................. 17 Figure 11.1 Hole Location Map .......................................................................................................... 32 Figure 13.1 Current Sample Preparation and Analysis Reverse Circulation "RC" Drill ...................... 36 Figure 13.2 Current Sample Preparation and Analysis Drill Core....................................................... 37 Figure 14.1 Standard Results OMAC Labs ......................................................................................... 41 Figure 14.2 Gold Standard Results ASL-Chemex Labs ...................................................................... 43 Figure 14.3 Silver Standard Results ASL-Chemex Labs..................................................................... 44 Figure 14.4 Nearest Neighbor Comparison DD to RC Drilling for Gold ............................................. 47 Figure 14.5 Nearest Neighbor Comparison DD to RC Drilling for Silver ............................................ 48 Figure 14.6 Activation Lab Check Assays on Samples Selected by IMC............................................. 51 Figure 16.1 Simplified Process Flow Sheet......................................................................................... 78 Figure 17.1 Final Mine and Dump Plan ............................................................................................ 105 Figure 23.1 Power Costs versus Processing Costs ............................................................................ 133 Figure 23.2 Power Cost versus IRR .................................................................................................. 133 Figure 23.3 Gold Price versus IRR ................................................................................................... 134 Figure 23.4 Capital Cost versus IRR .................................................................................................. 134 Figure 23.5 Operating Cost versus IRR ............................................................................................ 135 Figure 23.6 Gold Recovery versus IRR ............................................................................................ 135 Figure 23.7 Parameter versus IRR .................................................................................................... 136

Pennstrom Consulting Easton Process Consulting, Inc.
6
1.0 SUMMARY
Introduction
This technical report summarizes a recent evaluation for the handling of sulfide ore types at the Çöpler Gold Project in east-central Turkey. Anatolia Minerals Development Ltd. (AMDL) is currently in the process of developing the Çöpler Gold Project for commercial production. The Çöpler Gold Project under development is planned as a conventional open pit gold and silver mine with both oxide mill and heap leach treatment of ores. AMDL has been engaged in mineral exploration in Turkey since 1996. The Çöpler deposit, located in east-central Turkey, was first discovered in 2000 as part of a joint venture agreement between AMDL and Rio Tinto Mining and Exploration Limited (Rio Tinto). In January 2004, AMDL acquired 100 percent ownership of the Çöpler Gold Project. In November of 2005, AMDL retained Samuel Engineering (SE) to provide a definitive feasibility study. A Technical Report, dated May 30, 2006, was developed by SE which reported the results of the Çöpler feasibility study. Subsequently, Independent Mining Consultants (IMC) prepared a Technical Report, dated March 2, 2007 and amended April 30, 2007, for the latest information on reserves, resources, and the mining plan at Çöpler. Based on the results from these reports, AMDL engaged SNC-Lavlin in Montreal in September 2006 to complete detailed engineering for the processing facilities for the oxide ores. In March 2007 AMDL engaged Pennstrom Consulting to complete a preliminary assessment for processing the sulfide ores at Çöpler. This document is the technical report of the preliminary assessment study, prepared in accordance with the Standards of Disclosure for Mineral Projects as defined by Canadian National Instrument 43-101. This study utilizes much of the information from the SE and IMC technical reports and from detail engineering work currently being prepared by SNC-Lavalin. The mine reserves and mining techniques developed in the previous studies remain unchanged in this report. AMDL is continuing exploration work at the Çöpler site to more fully delineate the oxide and sulfide ore bodies. Only the modifications required to enhance the gold recovery in the process facility have been considered for this study.
This preliminary assessment is preliminary in nature, in that it includes inferred mineral resources that are considered too speculative geologically to have the economic considerations applied to them that would enable them to be categorized as mineral reserves, and there is no certainty that the preliminary assessment will be realized.
The Çöpler deposit is a porphyry-related epithermal gold complex with known gold mineralization focused in three closely spaced zones. Metallurgical test work shows that gold recoveries greater than 80 percent may be expected from the oxides, while the sulfides are generally refractory, with recoveries expected below 20 percent if processed through the oxide-processing facilities currently under development. Recently completed sulfide metallurgical test work suggests 95 per cent gold dissolution with cyanide after sulfide ore oxidation. This finding forms the preliminary basis for this report. This report was developed to investigate the operating parameters for a sulfide process facility at Çöpler, and to provide an estimate of the capital and operating costs associated with treatment of the sulfide ores.

Pennstrom Consulting Easton Process Consulting, Inc.
7
Sulfide Process Description
The existing oxide ore process facilities will be modified to process two grades of sulfide ore. Flotation feed ore will contain 1.81 grams per ton (gpt) gold and 2.2 weight percent (wt%) total sulfur. Direct feed ore will contain 3.11 gpt gold and 4.6 wt% total sulfur. Direct feed ore will be treated in a new 3,000 tpd milling circuit. Flotation feed ore will contain 1.81 gpt gold and 2.2 wt% total sulfur and will be processed in the planned 5,000 ton per day (tpd) milling circuit with the addition of a new rougher and cleaner flotation circuit. Concentrate from the flotation circuit will contain 14.32 gpt gold and 16.1 wt% total sulfur. Drawing number PFD-F-001 in Attachment C provides a flow diagram of this circuit. Flotation concentrate from a concentrate thickener and whole ore from a direct feed grinding thickener are processed in agitated pre-acidification tanks and a pre-acidification thickener prior to slurry storage in pressure oxidation feed tanks. The combined streams result in a feed to the pre-acidification circuit of 8,000 tpd that contains 4.82 gpt gold and 6.3 wt% total sulfur. Pre-acidification thickener overflow is treated with limestone followed by lime in a two stage precipitation circuit and is pumped to a tailings facility to settle solids. Reclaim solution returns to the counter-current decantation thickening circuit (CCD). Ground slurry, stored in pressure oxidation feed tanks, is pumped with high pressure positive displacement pumps into a single horizontal, six compartment autoclave. Oxygen purchased from an oxygen plant is injected into the slurry within the autoclave to oxidize sulfide minerals. The autoclave is agitated and the exiting slurry is flashed to atmospheric pressure in a single flash vessel. Slurry from the flash vessel flows into an agitated CCD feed tank. Entrained solids and sulfuric acid are scrubbed from vent gases and steam in a brick lined quench vessel followed by a venturi scrubber. Acidic solutions from the pre-acidification and CCD circuit are neutralized with limestone and lime prior to storage in a tailings facility. Solid slurry streams from the CCD circuit and limestone neutralization are further neutralized with lime prior to cyanide leaching. Gold is recovered from the slurry with existing leach, CIP, and carbon recovery systems. Reagents and Utilities Oxygen is purchased under the terms of a supply contract.from an oxygen plant (built by others). Limestone and lime are ground to slurries and stored in new grinding and slaking systems. Reagents systems for flotation reagents, flocculant, and water treatment are added to the planned reagent systems. Utility systems for cooling water, demineralized water, and high pressure steam are added. Design Criteria
Design criteria assumptions for the sulfide process are detailed in Attachment A with key parameters shown below:

Pennstrom Consulting Easton Process Consulting, Inc.
8
Flotation Feed Ore rate, tpd 5,000 Operating hours, hpa 7,884 Percent Utilization, % 90 Ore feed rate, tph 231.5 Ore Grade Au, gpt 1.81 Total Sulfur Content, wt% 2.2 Sulfide Sulfur Content, wt% 1.9 Carbonate Content, wt% as CO2 2.0 Flotation Mass Pull, % 10.8 Flotation Gold Recovery, % 85 Flotation Sulfide Recovery, % 90 Direct Feed Ore rate, tpd 3,000 Operating hours, hpa 7,884 Percent Utilization, % 90 Ore feed rate, tph 138.9 Ore Grade Au, gpt 3.11 Total Sulfur Content, wt% 4.6 Sulfide Sulfur Content, wt% 4.0 Carbonate Content, wt% as CO2 2.0 Sulfide Oxidation, % 90 Gold Dissolution, % 95 Overall Gold Recovery, % 87.9 Modification and Additions to the Oxide Process
The existing (currently in detail engineering) oxide equipment utilized and the additional process equipment required to be added to the oxide process facility for sulfide processing are outlined below:
• Existing electrical infrastructure. • Existing crushing facilities. • Flotation feed ore processed in existing milling facilities with the addition of a mill solution
tank and a rougher and cleaner sulfide flotation circuit. • New 3,000 tpd direct ore milling facility, designed for closed circuit milling with a grinding
thickener and mill solution tank. • New pre-acidification circuit consisting of agitated tanks and pre-acidification thickener. • New pressure oxidation circuit consisting of a feed tank, pressure leach autoclave, flash vessel,
vent scrubber, CCD feed tank, and associated gland seal water, steam, and oxygen systems. • New CCD circuit consisting of three CCD thickeners with associated pumps and tanks. • New limestone solution neutralization circuit with limestone grinding circuit (outlined below)
and agitated neutralization tanks. • New lime solution neutralization circuit consisting of agitated tanks. • New slurry neutralization tank. • Existing cyanide leach, gold recovery, cyanide neutralization, and tailings thickener. • New oxygen plant (built by others) for supplying oxygen, which is purchased under the terms
of a supply contract. • New limestone grinding and lime slaking facilities.
Pennstrom Consulting Easton Process Consulting, Inc.
9
• New de-mineralized water plant, high pressure steam boiler, cooling water system, and flocculent system.
Gold Recovery, Capital and Operating Costs
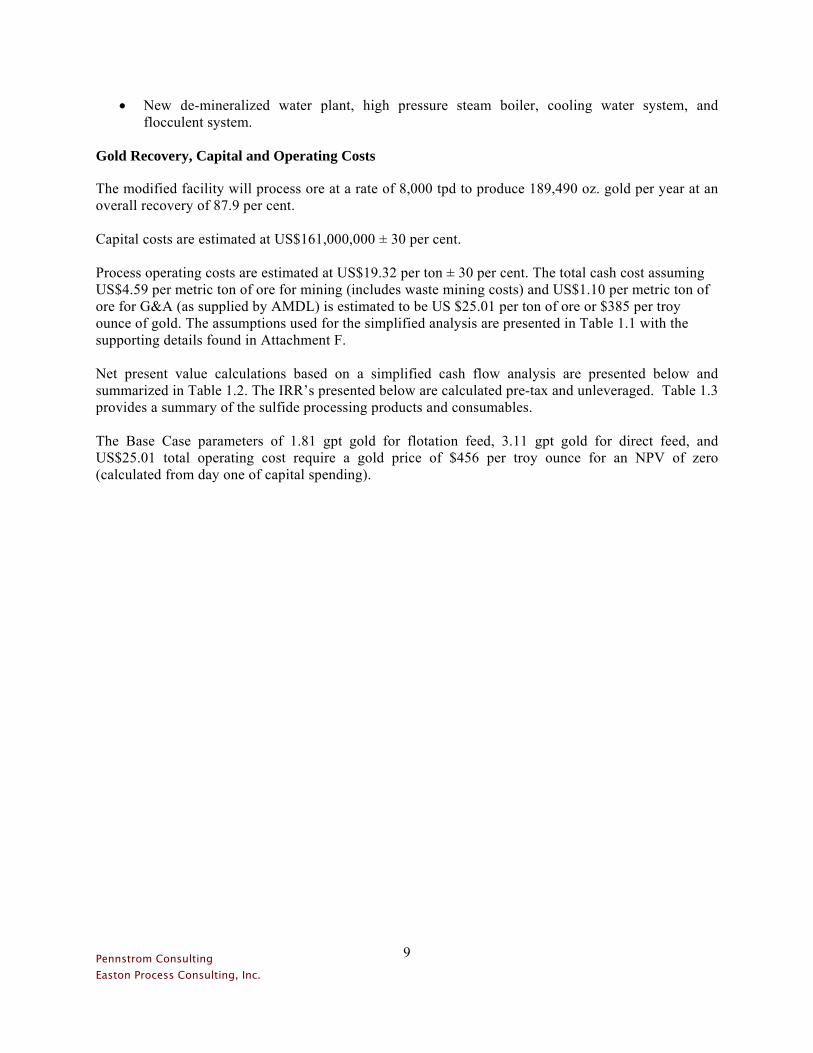
The modified facility will process ore at a rate of 8,000 tpd to produce 189,490 oz. gold per year at an overall recovery of 87.9 per cent. Capital costs are estimated at US$161,000,000 ± 30 per cent. Process operating costs are estimated at US$19.32 per ton ± 30 per cent. The total cash cost assuming US$4.59 per metric ton of ore for mining (includes waste mining costs) and US$1.10 per metric ton of ore for G&A (as supplied by AMDL) is estimated to be US $25.01 per ton of ore or $385 per troy ounce of gold. The assumptions used for the simplified analysis are presented in Table 1.1 with the supporting details found in Attachment F. Net present value calculations based on a simplified cash flow analysis are presented below and summarized in Table 1.2. The IRR’s presented below are calculated pre-tax and unleveraged. Table 1.3 provides a summary of the sulfide processing products and consumables. The Base Case parameters of 1.81 gpt gold for flotation feed, 3.11 gpt gold for direct feed, and US$25.01 total operating cost require a gold price of $456 per troy ounce for an NPV of zero (calculated from day one of capital spending).
Pennstrom Consulting Easton Process Consulting, Inc.
10
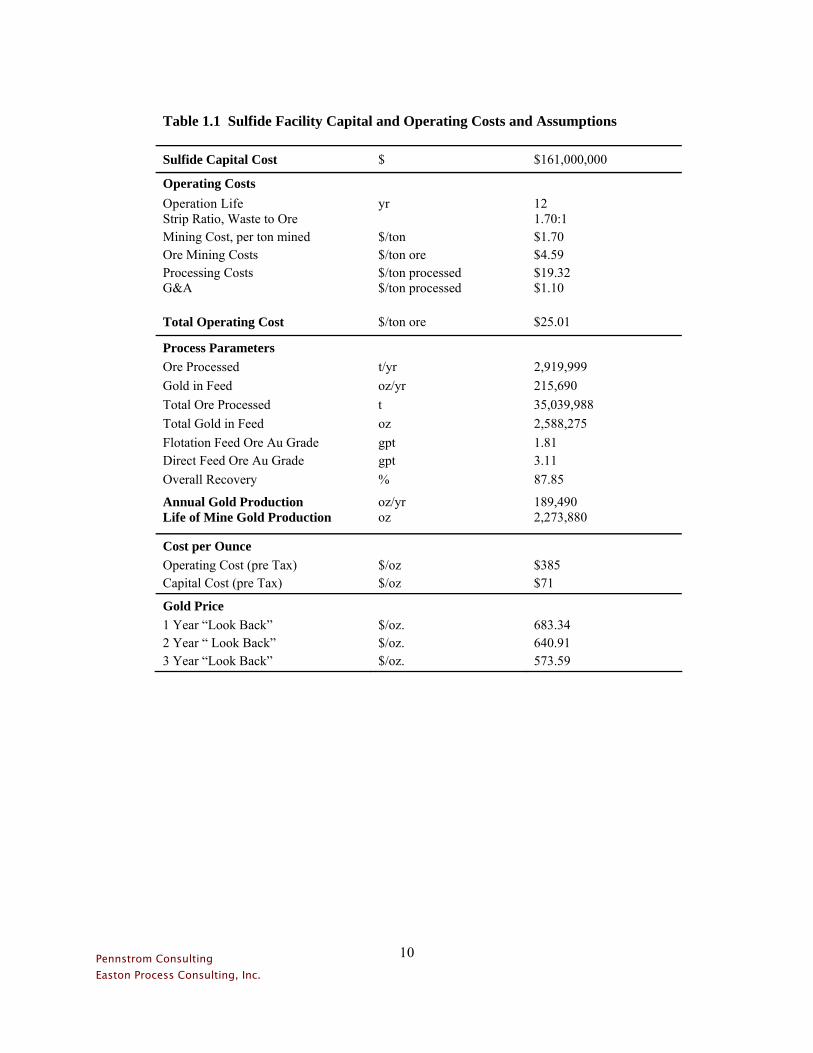
Table 1.1 Sulfide Facility Capital and Operating Costs and Assumptions
Sulfide Capital Cost $ $161,000,000
Operating Costs
Operation Life yr 12 Strip Ratio, Waste to Ore 1.70:1 Mining Cost, per ton mined $/ton $1.70 Ore Mining Costs $/ton ore $4.59 Processing Costs $/ton processed $19.32 G&A $/ton processed $1.10
Total Operating Cost $/ton ore $25.01
Process Parameters
Ore Processed t/yr 2,919,999 Gold in Feed oz/yr 215,690 Total Ore Processed t 35,039,988 Total Gold in Feed oz 2,588,275 Flotation Feed Ore Au Grade gpt 1.81 Direct Feed Ore Au Grade gpt 3.11 Overall Recovery % 87.85
Annual Gold Production oz/yr 189,490 Life of Mine Gold Production oz 2,273,880
Cost per Ounce
Operating Cost (pre Tax) $/oz $385 Capital Cost (pre Tax) $/oz $71
Gold Price
1 Year “Look Back” $/oz. 683.34 2 Year “ Look Back” $/oz. 640.91 3 Year “Look Back” $/oz. 573.59
Pennstrom Consulting Easton Process Consulting, Inc.
11
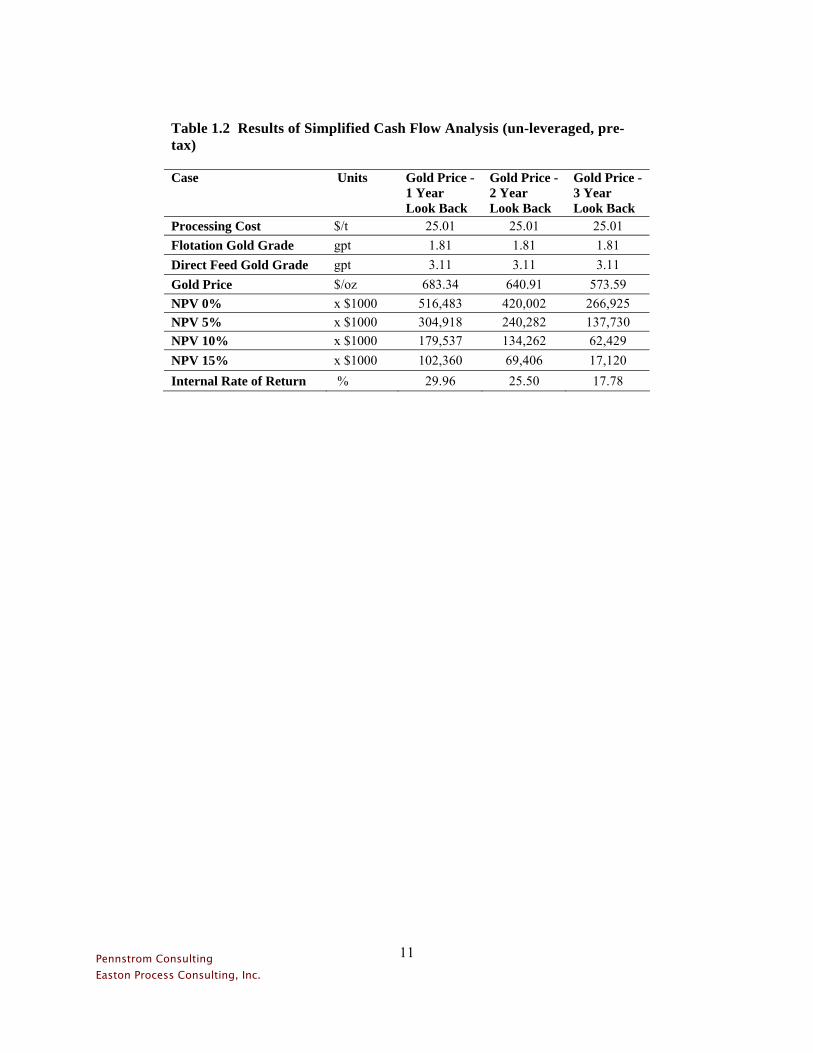
Table 1.2 Results of Simplified Cash Flow Analysis (un-leveraged, pre-tax)
Case Units Gold Price - 1 Year Look Back
Gold Price - 2 Year Look Back
Gold Price - 3 Year Look Back
Processing Cost $/t 25.01 25.01 25.01 Flotation Gold Grade gpt 1.81 1.81 1.81 Direct Feed Gold Grade gpt 3.11 3.11 3.11 Gold Price $/oz 683.34 640.91 573.59 NPV 0% x $1000 516,483 420,002 266,925 NPV 5% x $1000 304,918 240,282 137,730 NPV 10% x $1000 179,537 134,262 62,429 NPV 15% x $1000 102,360 69,406 17,120 Internal Rate of Return % 29.96 25.50 17.78

Pennstrom Consulting Easton Process Consulting, Inc.
12
Table 1.3 Summary of Products and Consumables
Description Units PFD Reference
METSIM Stream
METSIM Stream Rate
Operating Time, hr/yr
Annual
. Ore Feed t/hr PFD-F-010 1 231.481 7,884 1,824,996 Au g/t 1.810 3,303 Au oz./t 0.058 106,202 Total Sulfur wt% 2.200
Flotation Ore Rate
Total Sulfur tph 5.093 7,884 40,150
Mass Pull wt% 10.770 Mass Pull t/hr 24.937 Au Recovery % 85.000 Concentrate Au Grade gpt PFD-F-010 56 14.320 S Recovery % 90.000 Concentrate Total S wt% 16.089
Flotation
Ore Feed t/hr PFD-F-012 2004 138.889 7,884 1,095,001 Au g/t 3.110 3,405 Au oz./t 0.100 109,488 Total Sulfur wt% 4.600
Direct Feed Ore Rate
Total Sulfur tph 6.389 7,884 50,371
Combined POX Feed Solids Feed t/hr PFD-F-020 2002 163.828 7,884 1,291,620 Au g/t 4.820 6,226 Au oz./t 0.155 200,158 Total Sulfur wt% 6.349 Total Sulfur tph 10.401
CIL Feed Solids Feed t/hr 554 242.200 7,884 1,909,505 Au g/t 3.260 6,225 Au oz./t 0.105 200,138 Au Dissolution % 95.000 Au Recovery gr/hr PFD-F-020 660 749.100 7,884 5,905,904 Au oz./hr 24.084 189,879.2 Tailings Flotation Tailings t/hr 642 206.600 7,884 1,628,834 CIL Tailings t/hr 610 242.300 7,884 1,910,293 Total Tailings t/hr 448.900 7,884 3,539,128 Reagents Oxygen (100% Basis) t/hr PFD-F-040 680 24.800 7,884 195,523 Limestone t/hr PFD-F-040 410 66.217 7,884 522,055
Lime (CaO) t/hr 720 4.600 7,884 90,310
NaOH t/hr 1.304 7,884 10,279 Sodium Cyanide t/hr 0.003 7,884 22 Activated Carbon t/hr 8.620 7,884 67,996 Flotation Reagents t/hr Flocculant t/hr PFD-F-040 733 0.040 7,884 67,996
Consumables Grinding Liners kg/t 0.082 Grinding Media kg/t 0.527 Diesel Fuel- Boiler t/hr PFD-F-040 2.000 100 200 Water Demineralised Water m3/hr PFD-F-040 910 86 7,884 680,389 Cooling Water m3/hr PFD-F-040 713 1,168 7,884 9,208,512 Process Water m3/hr PFD-F-040 912 246 7,884 1,936,310
Electrical (Excluding Oxygen Plant) Electrical kWh/t 48.87 7,884 142,848,345
Electrical ( Including Oxygen Plant) Electrical kWh/t 78.42 7,884 229,214,334

Pennstrom Consulting Easton Process Consulting, Inc.
13
Upside Potential
The following items have been identified as having the potential to improve the overall economics of the sulfide project. Power Costs The current understanding with the local power supplier includes an incentive reduction of up to 40 per cent of the base rate of $.089 per kWh once the number of employees on-site reaches 80, thus lowering the power rate to $0.0536 per kWh, and lowering the processing cost by $2.65 per metric ton of ore. The anticipated manpower required to run the process facility exceeds 95 employees. Additionally, a line usage reduction is available depending on the amount of power consumed, and the cost of the power line built by the customer and conveyed to the power supplier. AMDL believes the resulting cost for power will be as low as $.042 per kWh. Continued Heap Leach Production The potential incremental recovery from the planned utilization of heap leach residue limestone for acid neutralization has not been evaluated and is therefore not included. Silver Recovery Recovery of silver has not been included in this evaluation. The total silver estimated within the sulfide ores contained in Measured and Indicated reserves is 6.1 million ounces and an additional 2.4 million in Inferred sulfide resources. Historical treatment methods convert silver jarosites to soluble silver species in boiling lime slurries after pressure oxidation. New processes have been developed to neutralize sulfuric acid within the pressure leach vessel to improve silver recovery by preventing the initial formation of silver jarosites. These processes intentionally add limestone or lime to the pressure leach vessel to neutralize sulfuric acid by precipitating anhydrite (gypsum) in the pressure leach vessel. The downside potential of these technologies should be carefully evaluated as the volume capacity and subsequent ore capacity in a single autoclave vessel could be reduced by gypsum scale. Additionally, reagent grade lime, low in carbonate, should be considered, as carbonates added into the pressure leach vessel will increase oxygen consumption if the same oxygen partial pressure is maintained. Copper Recovery Copper recovery from process solutions has not been evaluated in this study pending further resource development. Selection of the most suitable copper recovery process is highly dependent upon the resource copper grade. Copper recovery processes include SX-EW, precipitation, crystallization, and cementation. The downside potential of copper SX-EW technology should be carefully evaluated:
• A simple SX circuit will require a very robust design on the raffinate stream to prevent hydrocarbons from contaminating activated carbon in the gold CIP circuit. The raffinate stream is recycled to the CCD circuit for washing the pressure oxidation residue and will carry entrained hydrocarbons into the CIP circuit if not treated properly.

Pennstrom Consulting Easton Process Consulting, Inc.
14
• Power cost may make other alternatives more attractive than SX-EW. • Sulfuric acid transferred in the SX circuit will need to be neutralized. • Copper bleed streams from an electrowinning circuit will require treatment.
Manganese Recovery Manganese recovery from process solutions has not been evaluated in this study pending further resource definition. The potential to recovery manganese as manganese carbonate, manganese sulfate or other products exists. Conclusions and Recommendations The following conclusions and recommendations are offered based on the results of this report. Major conclusions are as follows: 1) At a break even gold price of US$456 per ounce and with the level of information available to date, indications are that gold recovery from sulfide ores can be performed economically at Çöpler. 2) Additional drilling and delineation of the Çöpler ore bodies will further enhance the reliability of the assumptions used for the ore characteristics in developing the plant facilities in this report. 3) Process costs and recoveries are at preliminary assessment levels. Additional test work and more detailed studies are required to evaluate more precisely the treatment of the sulfide ores at Çöpler. 4) Confirmation of the costs associated with electrical power will occur when the contract for electric power is executed. The contract power costs will significantly enhance the level of accuracy of the operating costs developed and used for the economic evaluation in this report. 5) Permitting and regulatory risks are considered moderate with some delays possible. 6) Currency risks are considered moderate. 7) The risk of securing qualified personnel for the various phases of the project is manageable with a blending of non-Turkish and Turkish personnel. 8) Project upside potential exists due to the following conditions:
• Gold price levels are currently higher than those used for mine design. • Mineral resources may convert to additional mineral reserves. • Other metal values such as copper and silver have not been considered in this report and
additional revenues will likely be available from the production of these metals. • Reduction of contract mine operating cost by self performance of mining operations.
The following are the recommendations of the authors of this assessment.

Pennstrom Consulting Easton Process Consulting, Inc.
15
Preliminary scoping metallurgical studies have resulted in the development of a conceptual process flow sheet for the sulfide ore from Cöpler deposit in Turkey. Due to limited process design data, assumptions had to be made based on test work for other similar properties in order to determine order-of-magnitude capital and operating costs for the project. Additional sulfide deposit sampling and test work should be performed to increase the knowledge of the deposit and the required processing parameters for the Cöpler sulfide ores. Copper and silver recovery from the process solution has not been evaluated in this study pending further resource development. The sulfide ore is projected to assay an average 0.09 per cent Cu and 4.39 gm/t silver. Future testing should incorporate copper and silver recovery from the sulfide oxidation products. The following additional test work should be undertaken for the sulfide deposit: • Obtain representative high-grade sulfide ore from the various mineralized zones and lithologies
for testing to develop and confirm process design criteria for the pressure oxidation and cyanidation processing unit operations.
• Obtain representative low-grade sulfide ore from the various mining zones and lithologies for
testing to develop and confirm process design criteria for the flotation process. • Optimize the flotation parameters and process flow sheet for the sulfide ores. • Following optimization of the flotation process, concentrate should be generated and the mixture
of high-grade ore and concentrate should be tested to develop and confirm process design criteria for the pressure oxidation and cyanidation processing unit operations.
As part of the ongoing development of the Çöpler Gold Project, funds should be allocated to pay for further sampling and test work, and a more detailed study of the sulfide portions of the Çöpler deposits. Additional drilling and delineation of the deposits should continue until the deposits and ore characteristics are understood sufficiently.

Pennstrom Consulting Easton Process Consulting, Inc.
16
2.0 INTRODUCTION
Anatolia Minerals Development Ltd. (AMDL) has been engaged in mineral exploration in Turkey since 1996. The Çöpler deposit, located in east-central Turkey, was first discovered in 2000 as part of a joint venture agreement between AMDL and Rio Tinto. In January of 2004, AMDL acquired 100 percent ownership of the Çöpler Gold Project. In November of 2005, AMDL retained Samuel Engineering (SE) to provide a definitive feasibility study, and engaged SNC-Lavlin in Montreal in September 2006 to complete detailed engineering, procurement and construction management services. In March 2007 AMDL engaged Pennstrom Consulting to complete a preliminary assessment for processing sulfide ore. This document is the technical report of the preliminary assessment study, prepared in accordance with the Standards of Disclosure for Mineral Projects as defined by Canadian National Instrument 43-101. The Çöpler deposit is a porphyry-related epithermal gold complex with known gold mineralization focused in three closely spaced zones. Metallurgical test work shows that gold recoveries greater than 80 per cent may be expected from the oxides, while the sulfides are generally refractory, with recoveries expected below 20 percent if no pre-oxidation of the ore is performed. Recently completed sulfide metallurgical test work suggests 95 per cent gold dissolution using cyanide is anticipated after sulfide ore oxidation. This finding forms the preliminary basis for this report. This study focuses on processing sulfide ore by high pressure oxidation followed by cyanidation. AMDL is continuing exploration work at the Çöpler site to advance the development of the sulfide ore body. 2.1 Location
The Project is located in the east-central part of eastern Turkey, 120 km west of the city of Erzincan in Erzincan Province (2-1/2 hours drive), 40 km east of the iron-mining city of Divriği (one hours drive), and 550 km east of Turkey’s capital city, Ankara. The nearest urban center, Iliç, (approximate population 2,500), is about six kilometers east of the proposed site. Figure 2.1 illustrates the location of the project within the country of Turkey.

Pennstrom Consulting Easton Process Consulting, Inc.
17
Figure 2.1 Project Location 2.2 Site Criteria
The following are the Site Criteria for the Project:
Latitude 39o 25’ North Longitude 38o 32’ East Elevation 1150 m Frost Depth 500 mm Snow Load 145 kg/m2 Wind Load 40 m/sec, Exposure C Earthquake Zone 2nd Order, Ao = 0.20 Atmospheric Pressure (average) 880.5 millibar Maximum Design Temperature (plus) 40o C Minimum Design Temperature (minus) 25o C Annual Rainfall 367 mm Maximum Snowfall Depth 500 mm (Estimated) Design Maximum Rainfall, 24 hours 76 mm 2.3 Mineralization
The known gold and silver mineralization at Çöpler occurs in three deposits in both oxide and non-oxide (sulfide) forms. The three deposits and their individual mineralization are summarized as follows:
Main Zone
The Main Zone occupies the west portion of the project area and is about 700 m north-south by 800 m east-west. Typical depths of mineralization range from a meter to about 150 m below grade. Epithermal

Pennstrom Consulting Easton Process Consulting, Inc.
18
veinlets of disseminated quartz - pyrite -arsenopyrite are primarily hosted in diorite and metasediments with some marble mineralization on the eastern end of the zone. Supergene oxidation has occurred and leachable oxide mineralization occurs from near surface to depths of about 35 m.
Minor volumes of sulfide pyrite mineralization occur within the Main Zone.
Manganese Zone
The Manganese Zone occupies the eastern end of the Çöpler mineralized area. The zone is about 450 m wide in the north-south direction and about 700 m in the east-west direction. The surface is predominately covered with marble. A limb of the diorite intrusive is sub-surface, and a major component of the Manganese Zone mineralization is associated with the contact between the diorite and the marble. Disseminated mineralization also occurs outside of the contact zone. Mineralization ranges from the surface to about 300 m deep.
Free gold mineralization occurs in the marble with minimum associated sulfides. Disseminated quartz-sulfide mineralization occurs in altered clay and brecciated diorites, as well as locally altered carbonate diorite. Minor volumes of sulfide pyrite mineralization occur within the Manganese Mine zone.
There has been supergene oxidation in this deposit, but cyanide amenable mineralization is a combination of free gold in marble and supergene oxidized mineralization in both marble and diorite. Some cyanide amenable mineralization occurs at depths over 200 m.
Marble Contact Zone
The Marble Contact Zone is in the southeastern portion of the district, and is associated with a northeast striking fault contact between marble on the east and metasediments and intrusives on the west. The width is almost 250 m and the strike length is about 400 m northeasterly. Depth of mineralization ranges from the surface to about 150 m.
Mineralization occurs as both disseminated sulfides in veinlets and massive sulfides along the marble contact. Supergene oxidation has occurred along the northeast structure resulting in greater depths of oxidized mineralization than in the Main Zone. The Marble Contact Zone hosts more copper and other base metals than the other two deposits. 2.4 Mineral Resources
Table 2.1 provides the estimated mineral reserves and mineral resources for the Çöpler Gold Project.

Pennstrom Consulting Easton Process Consulting, Inc.
19
Table 2.1 Mineral Reserves and Mineral Resource Estimates from April 2007 NI 43-101
Mineral Reserves
Proven Probable Proven+Probable Gold Silver Gold Silver Gold Silver Contained Process
Category Ktonnes gm/t gm/t Ktonnes gm/t gm/t Ktonnes gm/t gm/t Au KOzs Total Mill
Ore 12,557 2.762 8.65 5,565 2.261 1.45 18,122 2.608 6.44 1,519 Total
Leach Ore 19,871 1.093 2.97 14,308 1.255 3.76 34,179 1.161 3.30 1,275 Total
Mineral Reserves 32,428 1.739 5.17 19,873 1.536 3.12 52,301 1.662 4.39 2,794
Mineral Resources in Addition to Reserves, Assumes the Presence of a Sulfide Process Facility
Measured Indicated Measured + Indicated Inferred Gold Silver Gold Silver Gold Silver Contained Gold Silver Contained Material
Type Ktonnes gm/t gm/t Ktonnes gm/t gm/t Ktonnes gm/t gm/t Au KOzs Ktonnes gm/t gm/t Au KOzs Remaining
Oxide Resource
8,819 0.493 1.23 10,484 0.854 1.10 19,303 0.689 1.16 428 29,331 1.336 2.07 1,260
Remaining Sulfide
Resource 3,087 1.622 6.13 9,769 1.716 7.17 12,856 1.694 6.92 700 14,272 2.493 5.31 1,144
Total Mineral
Resources 11,906 0.785 2.50 20,253 1.27 4.03 32,159 1.09 3.46 1,128 43,603 1.715 3.13 2,404
A significant amount of sulfide ore exists within the Proven and Probable reserves identified in the previous table. Table 2.2 shows the sulfide material contained within these reserves.
Table 2.2 Mineral Reserves with Breakout of Oxide and Sulfide Materials
Mineral Reserves Proven Probable Proven+Probable
Gold Silver Gold Silver Gold Silver Contained Process Category Ktonnes gm/t gm/t Ktonnes gm/t gm/t Ktonnes gm/t gm/t Au KOzs Mill Ore -
Oxide 11,935 2.682 7.62 5,017 2.070 1.37 16,952 2.501 5.77 1,363 Mill Ore -
Sulfide 622 3.923 23.60 548 4.416 7.63 1,170 4.154 16.12 156 Total Mill
Ore 12,557 2.762 8.65 5,565 2.261 1.45 18,122 2.608 6.44 1,519 Leach Ore -
Oxide 15,485 0.674 0.58 9,163 0.940 2.17 24,648 0.773 1.17 612 Leach Ore -
Sulfide 4,386 2.176 9.17 5,145 2.154 8.51 9,531 2.164 8.81 663 Total
Leach Ore 19,871 1.093 2.97 14,308 1.255 3.76 34,179 1.161 3.30 1,275 Total
Mineral Reserves 32,428 1.739 5.17 19,873 1.536 3.12 52,301 1.662 4.39 2,794
Sulfide reserves plus resources estimated in early 2007 total approximately 37.8 million tons at an average 2.19 gpt gold. Some of this material contains less than 1.0 gpt gold and is probably not economic in the plant described in this report. For the purposes of this report, it is assumed about 2.75

Pennstrom Consulting Easton Process Consulting, Inc.
20
million tonnes at an average grade of 0.8 gpt gold is uneconomic. This material is considered waste, increasing the overall strip ratio of remaining, potentially economic material, by 13.3 per cent, to 1.7 (from 1.5), and the grade of remaining ore by 5.0 per cent, to 2.3 gpt gold. This preliminary assessment is preliminary in nature, in that it includes inferred mineral resources that are considered too speculative geologically to have the economic considerations applied to them that would enable them to be categorized as mineral reserves, and there is no certainty that the preliminary assessment will be realized. 2.5 Sulfide Mill Facility Feed Tons and Grade Assumptions
The sulfide mill feed grades and tons for this study were supplied by AMDL. Table 2.3 provides the breakdown of the two ore classifications used for the sulfide facility design development and project economic calculations:
Table 2.3 Sulfide Facility Feed Tons and Grade
Ore Classification Ore Tons (x 106),
t
Avg. Gold Grade,
gm/t
Sulfur Content,
% S
Sulfide Content,
% S=
Carbonate Content,
Wt % CO2 Flotation Feed Ore
21.9 1.81 2.2 1.94 2.0
Direct Feed Ore
13.2 3.11 4.6 4.06 2.0
2.6 Oxide Ore Facilities
The Çöpler deposit will be mined by conventional open-pit methods of drilling and blasting, loading, and hauling. The ore will be hauled by trucks from the pits to the crushing area and fed directly to the primary crusher, or stockpiled. The process facilities for the Oxide project are being designed for 15,500 tpd of ore through the primary, secondary and tertiary crushing circuits, directing 5,000 tpd of higher grade ore to the milling circuit, with up to 10,500 tpd of lower grade ore conveyed and loaded onto the heap leach pad (HLP) with portable stacking conveyors. The higher grade ore will be wet-ground in a mill and pumped for mixing in a series of Carbon-in-Pulp (CIP) tanks. Loaded carbon from the CIP tanks will be pumped to the carbon handling facility. Tailings from the CIP tanks will be detoxified, pumped, and placed in a tailings storage facility. Pregnant solutions from the HLP will report to Carbon-in-Column (CIC) tanks. The loaded carbon from the CIC tanks will be treated in a common carbon handling facility with the CIP carbon for gold recovery. Barren solution from the CIC tanks will be pumped back to the HLP solution distribution system. The stripped carbon will be reactivated in a kiln and returned to the CIC and CIL processes, while the copper, silver, and gold are recovered from the solutions by electrowinning. The electrowon gold and silver will be dried, mixed with flux and smelted in a small furnace producing doré metal that will be sold to a commercial refinery. The small number of copper cathodes produced will be sold locally, in Turkey. Ancillary facilities to support the oxide gold project

Pennstrom Consulting Easton Process Consulting, Inc.
21
will include an analytical and metallurgical laboratory, an administration building, warehouses, maintenance shops, water and sewage treatment, a 40 km power line, water wells with 3 km of pipeline. 2.7 Terms of Reference
Anatolia Minerals Development Limited (AMDL) retained Pennstrom Consulting to provide a preliminary sulfide process assessment to determine the feasibility for a sulfide process plant at the Çöpler Gold Project. The preliminary study included a process design criteria, process flow diagrams (PFD’s), new equipment list, capital cost estimate, and operating cost estimate. This document presents the Technical Report of that work as outlined in Canadian National Instrument 43-101 for Standards of Disclosure for Mineral Projects. This Report presents a summary of the detail information contained in the Preliminary Assessment. Three previous Technical Reports have been filed on SEDAR for the Çöpler Gold Project:
1. October 19, 2005: Çöpler Gold Project Resource Estimate Technical Report, by Independent Mining Consultants, Inc. (the “2005 IMC Report”).
2. May 30, 2006: Technical Report for Çöpler Gold Project Feasibility Study, by Samuel Engineering, Inc. (the “2006 SE Report”).
3. March 2, 2007 as Amended April 30, 2007: Technical Report for Çöpler Gold Project, by Independent Mining Consultants, Inc. (the “2007 IMC Report”).
This Technical Report includes information from work that was completed by Independent Mining Consultants and Samuel Engineering in earlier studies and provides a description of the required modifications to the process facilities for the processing of future sulfide ores. Ore Reserves and Resources, and mining designs and cost calculations that were completed by Independent Mining Consultants, Inc. and Anatolia Minerals have not been modified and those results are used within this study. A number of chapters to follow were initially written by others as part of the March 2007 Technical Report. Those chapters will be quoted with appropriate reference to the source. The qualified persons for this report are; William J. Pennstrom, Jr., MA, Pennstrom Consulting, was responsible for process operating costs and project economics. Mr. Pennstrom inspected the site location in November of 2005. Christopher L. Easton, Easton Process Consulting, Inc., was responsible for process designs and capital costs development. Mr. Easton has not yet had an opportunity to visit the site. Dr. Deepak Malhotra, Resource Development Inc., (RDi), was responsible for metallurgical test work and metallurgical operating parameters used in the process designs. Mr Malhotra visited the site in March 2005. John Marek, PE, Independent Mining Consultants, Inc., was responsible for the mineral reserves and mineral resource calculations. Mr. Marek visited the site in July of 2005. Richard C. Moores, Anatolia Minerals Development Ltd., is responsible for the geology and site specific details concerning power contracts, mining costs, and ore to waste strip ratios. Mr. Moores has visited the site on numerous occasions between November of 1998 and January of 2008.

Pennstrom Consulting Easton Process Consulting, Inc.
22
This report is in metric units. A tonne means metric ton, and k tonnes means 1,000 metric tons, and tph means metric tonnes per hour. All metal grades are in grams per metric tonne for precious metals and percent weight for associated base metals.

Pennstrom Consulting Easton Process Consulting, Inc.
23
3.0 RELIANCE ON OTHER EXPERTS, DISCLAIMER
The Technical Report for the Çöpler Gold Project (the Project) summarizes the findings of a preliminary assessment study performed by Pennstrom Consulting and submitted to Anatolia Minerals Development Limited (AMDL) on December 20, 2007. The preliminary assessment evaluated preliminary sulfide metallurgy, sulfide ore processing, and additional reagent and utility infrastructure that would be required in addition to an existing 5,000 tpd oxide ore processing facility. The study estimates the costs to construct and operate the facility based on preliminary data that must be validated in further pre-feasibility, feasibility and pilot plant work. Exclusions from this report and Pennstrom Consulting are the following:
1. permitting requirements and logistics, 2. a detailed economic analysis of the project, 3. property ownership documents for the appropriate mining license required for the deposit,
along with the surface holdings for the plant, 4. tailings storage facility, 5. infrastructure, and support requirements.
Due diligence of a legal or environmental nature was not included in the Terms of Reference for the Technical Report. William J. Pennstrom, Jr. of Pennstrom Consulting and Christopher L. Easton of Easton Process Consulting, Inc. as a metallurgical sub-consultant, were responsible for the ore processing, estimating, and process infrastructure aspects of the study and consolidation of the final report. Dr. Deepak Malhotra, RDi, was responsible for the metallurgical testwork and gold recovery predictions and flotation information. Other consultants provided the following components of the study: Research Development Inc. was contracted by AMDL for metallurgical test work. Independent Mining Consultants, Inc. was contracted by AMDL to review the mineral reserves, resource estimation and used in this report from previous Independent Mining Consultant, Inc. reports. This Technical Report relies on the 2007 IMC Report previously published by Independent Mining Consultants, Inc. and therefore by reference relies on the work of the following contractors.
1. Samuel Engineering was contracted by Anatolia as the author of the oxide process facility feasibility study.
2. Research Development Inc. was contracted by Anatolia for metallurgical test work. 3. Allan Watson Associates was contracted by Anatolia for the tailings storage facility design. 4. Vector Colorado, LLC was contracted by Anatolia for the heap leach pad and storage ponds
design. 5. Water Management Consultants was contracted by Anatolia for the mine water supply report. 6. SIAL, Ankara, Turkey was contracted by Anatolia for the subsurface soil and geotechnical
investigation report. 7. Ausenco, Ltd. was contracted by Anatolia to provide the metallurgy test work review. 8. Anatolia geologist İlhan Poyraz provided the geology report for the Project.

Pennstrom Consulting Easton Process Consulting, Inc.
24
4.0 PROPERTY DESCRIPTION AND LOCATION
The Çöpler project property description and location information can be obtained from SEDAR (www.sedar.com) in the report titled “Technical Report for Çöpler Gold Project”, by Independent Mining Consultants, Inc.; March 2, 2007 as Amended 30 April, 2007. The information contained within the above referenced report in section “4.0 Property Description and Location” has not changed and remains current at the time of the writing of this report.

Pennstrom Consulting Easton Process Consulting, Inc.
25
5.0 ACCESSIBILITY, CLIMATE, LOCAL RESOURCES, INFRASTRUCTURE,
PHYSIOGRAPHY
The Çöpler project accessibility, climate, local resources, infrastructure, and physiography information can be obtained from SEDAR (www.sedar.com) in the report titled “Technical Report for Çöpler Gold Project”, by Independent Mining Consultants, Inc.; March 2, 2007 as Amended 30 April, 2007. The information contained within the above referenced report in section “5.0 Accessibility, Climate, Local Resources, Infrastructure, Physiography” has not changed and remains current at the time of the writing of this report.

Pennstrom Consulting Easton Process Consulting, Inc.
26
6.0 HISTORY
The Çöpler area has seen significant gold-silver mining that dates at least to Roman times and possibly earlier with historic bullion production of about 50,000 ounces of gold. A copper rich slag pile of approximately 25,000 tonnes is located at the western edge of the district and was apparently a byproduct of ancient bullion production. Although the district contains copper mineralization, there appears to have been little production targeting copper and the copper-rich slag was a byproduct of gold and silver smelting. There are other minor slag piles scattered around the property from old small-scale workings that are thought to be from ancient gold and byproduct copper production. The Turkish ‘Geological Survey’ (MTA) carried out regional exploration work in the early 1960’s that was predominately confined to mapping. During 1964, a Turkish local company started a manganese mine that produced about 73,000 tonnes of manganese ore up through 1973. Unimangan acquired the property in January 1979 and restarted production the same year and produced about 1,000 to 5,000 tonnes of ore per year until 1992. Total production from the Manganese Mine Zone is estimated to have been 15,000 tonnes of ore at a grade of between 43 per cent and 51 per cent manganese. In early 1999, Anatolia discovered several porphyry style gold-copper prospects in east-central Turkey. It applied for an exploration license totaling over 100,000 hectares covering these prospects. This work was a follow up on the earlier work by MTA in the 1960’s. During this effort, Anatolia delineated another nearby prospect in a basin formed by an altered and mineralized granodiorite intruding limestone. This prospect and the supporting work was the basis for a joint venture agreement for exploration with Rio Tinto. During the joint venture, Anatolia and Rio Tinto explored and drilled the Çöpler deposits and developed resources in the three mineralized zones: the Main, Manganese Mine, and Marble Contact Zones. In January of 2004, Anatolia acquired the property from Rio Tinto and Unimangan and the property has been under their sole control since that time.

Pennstrom Consulting Easton Process Consulting, Inc.
27
7.0 GEOLOGIC SETTING
The Çöpler project geologic setting information can be obtained from SEDAR (www.sedar.com) in the report titled “Technical Report for Çöpler Gold Project”, by Independent Mining Consultants, Inc.; March 2, 2007 as Amended 30 April, 2007. The information contained within the above referenced report in section “7.0 Geologic Setting” has not changed and remains current at the time of the writing of this report.

Pennstrom Consulting Easton Process Consulting, Inc.
28
8.0 DEPOSIT TYPES
The Çöpler project deposit information can be obtained from SEDAR (www.sedar.com) in the report titled “Technical Report for Çöpler Gold Project”, by Independent Mining Consultants, Inc.; March 2, 2007 as Amended 30 April, 2007. The information contained within the above referenced report in section “8.0 Deposit Types” has not changed and remains current at the time of the writing of this report.

Pennstrom Consulting Easton Process Consulting, Inc.
29
9.0 MINERALIZATION
The Çöpler project mineralization information can be obtained from SEDAR (www.sedar.com) in the report titled “Technical Report for Çöpler Gold Project”, by Independent Mining Consultants, Inc.; March 2, 2007 as Amended 30 April, 2007. The information contained within the above referenced report in section “9.0 Mineralization” has not changed and remains current at the time of the writing of this report.

Pennstrom Consulting Easton Process Consulting, Inc.
30
10.0 EXPLORATION
This section of the report has been copied from the 2007 IMC Report and has been reviewed by the initial author for completeness and accuracy. The 2007 IMC Report, including the Çöpler project exploration information, can be obtained from SEDAR (www.sedar.com) in the report titled “Technical Report for Çöpler Gold Project”, by Independent Mining Consultants, Inc.; March 2, 2007 as Amended 30 April, 2007. The information contained within the above referenced report in section “10.0 Exploration” has not changed and is provided in the following text. The primary exploration effort at Çöpler was completed by:
1) a joint venture between Anatolia and Rio Tinto prior to 2004, and 2) Anatolia independently during 2004 and 2005.
As outlined within the project history section, the initial reconnaissance exploration was completed in the early 1960’s by MTA, a Turkish government entity. Exploration by Anatolia commenced in 1999 and resulted in the discovery of several porphyry style gold-copper deposits in east-central Turkey. Shortly after that time, a joint venture with Rio Tinto resulted in an extensive drill hole exploration program at Çöpler. During early 2004, Anatolia acquired Rio Tinto’s interest in the property and since that time all continued exploration and development has been by Anatolia. Exploration drilling at Çöpler has defined some of the lateral boundaries of mineralization. There will be additional development drilling, condemnation drilling of areas planned for facilities, and drilling for geotechnical site investigations. At some point in the future, ore control and short range mine planning will likely require additional drilling prior to production commitments. Regional exploration is planned by Anatolia in areas adjacent to the three zones currently under development at Çöpler and beyond. However IMC is not familiar with those plans and at this time IMC understands that they have no direct impact on the Çöpler project.

Pennstrom Consulting Easton Process Consulting, Inc.
31
11.0 DRILLING
This section of the report has been copied from the 2007 IMC Report and has been reviewed by the initial author for completeness and accuracy. The 2007 IMC Report, including the the Çöpler project drilling information can be obtained from SEDAR (www.sedar.com) in the report titled “Technical Report for Çöpler Gold Project”, by Independent Mining Consultants, Inc.; March 2, 2007 as Amended 30 April, 2007. The information contained within the above referenced report in section “11.0 Drilling” has not changed and is provided in the following text. As of September 2006, the drill data used for this determination of resources, reserves and the mining plan is summarized below. The total number of drill holes and the components of reverse circulation (RC) and diamond drilling (DD) as recorded in the data base are summarized below.
Diamond Drilling 111 Drill Holes 15,881.0 meters of drilling 13,373 sample intervals
Reverse Circulation Only 470 Drill Holes 50164.6 meters of drilling 42,305 sample intervals
Combined Holes RC Start, DD Finish 18 Holes RC Component
2,460.1 meters of drilling 1,928 sample intervals
DDH Component 1,486.3 meters of drilling 1,215 sample intervals
Water Well Holes 4 Holes 739.7 meters of drilling 130 sample intervals
Total Drilling 603 Drill Holes 70,731.7 meters of drilling 58,951 sample intervals
Drill hole locations are shown on Figure 11.1 and color coded by drill type. Typical drill spacings in the deposits are:
Main Zone : 50m Manganese Zone : 25 to 40m Marble Contact Zone : 25 to 50m

Pennstrom Consulting Easton Process Consulting, Inc.
32
Manganese Mine Zone
Main Zone
Marble Contact Zone
Figure 11.1 Hole Location Map

Pennstrom Consulting Easton Process Consulting, Inc.
33
12.0 SAMPLING METHODS AND APPROACH
This section of the report has been copied from the 2007 IMC Report and has been reviewed by the initial author for completeness and accuracy. The 2007 IMC Report, including the Çöpler project sampling methods and approach information can be obtained from SEDAR (www.sedar.com) in the report titled “Technical Report for Çöpler Gold Project”, by Independent Mining Consultants, Inc.; March 2, 2007 as Amended 30 April, 2007. The information contained within the above referenced report in section “12.0 Sampling Methods and Approach” has not changed and is provided in the following text. The sampling methods at site have been relatively constant during the drilling programs. This section will discuss the sample collection procedures at the drill rigs and preparation for shipment to the laboratories. Section 13.0 will discuss the off site sample preparation and assay procedures. IMC personnel observed sample collection practices during July of 2005 and obtained sound documentation regarding the sample collection methods currently in use at Çöpler. Sample collection procedures prior to 2005 as practiced by the joint venture have been documented in earlier NI-43-101 Technical Reports by Watts, Griffis, and McQuat, Limited (WGM) in 2003. Where there are differences between current practice and pre-2005 practice, IMC has relied on the documentation of the pre-2005 drill campaigns by WGM. IMC holds the opinion that the current sample collection and preparation methods described in this section are adequate for the determination of mineral resources and mineral reserves. As a result of the due diligence verifications by IMC, IMC found no indication of inappropriate tampering of samples or the sampling protocol. RC Sample Collection RC drilling is completed with a 4.5 to 4.75 inch (114mm to 120 mm) diameter down-hole hammer. RC cuttings are passed through a cyclone with a 10 inch (25.4cm) port for sample collection. RC drill intervals are 1m in length and the entire 1m of cuttings is collected from the cyclone under flow in large reinforced plastic bags. Each bag of sample weighs between 25 and 30kg. At each 1m interval, the driller halts the drilling process while the sampler (an Anatolia employee) collects the sample bag, and replaces it with a fresh sample bag. Drilling is then continued. Drill holes are not “blown” or cleaned other than roughly every 10m or when additional drill pipe segments are required. IMC observed a good seal between the sample bag and the cyclone port. Some dust did escape the cyclone overflow during the drill process. However, the amount did not appear excessive compared with observations at other projects. IMC observations occurred while RC rigs were drilling marble in the Manganese Mine Zone. RC cuttings were made up of fine grained particles indicating that a fair component of down-hole regrind may have occurred. The Çöpler drilling is generally above the water table so that wet holes are not a particular problem for RC drilling. WGM reports that minor water was added to holes when in clay zones to assist in sample collection. The sampler sieves a small sample from the bag to generate a chip log at the rig. Sample bags are numbered and labeled at the rig with the drill interval.

Pennstrom Consulting Easton Process Consulting, Inc.
34
RC sample bags are transferred to the sample storage and sample spitting and core sawing facility located immediately north of the Manganese Zone at site. RC Sample preparation procedures at site are:
1) Sample numbers are assigned 2) The entire 25 – 30kg sample is weighed 3) The sample is passed through a 1 in 4 Jones splitter between 1 and 2 times until a 5 kg sample
is obtained. 4) The 5 kg sample is then passed through a smaller 1 in 2 Jones splitter unit about 500 gm of
material are obtained. All coarse rejects are returned to the original sample bag. 5) Both the sample and the coarse reject are weighed for comparison with the original weight.
IMC observed that many of the 500 gm target samples actually weigh between 500 and 1,000 gm.
6) The 500 – 1,000 gm bags receive a sample tag in the bag and a label outside of the bag. These bags are shipped offsite for additional preparation and assay.
7) In some holes, two samples are combined into one to represent 2m of drilling. This generally seem to occur in areas of low grade
8) Coarse rejects are stored on site under shelter. During 2005, old coarse reject samples that were less than 0.25 gm/t gold were being discarded.
9) Chip boards are made from the sieved chip samples and stored in the core storage shed on site.
10) Çöpler standards are inserted on a 1 in 15 basis. Duplicate samples are inserted on a 1 in 15 to 20 basis. Duplicates are prepared by pouring the coarse rejects through the splitter process again to establish a second 0.5 to 1 kg sample.
Diamond Core Sample Collection Diamond drilling has generally utilized both “NQ” and “HQ” diameter cores. Some holes are started with HQ and are reduced in size to NQ later in the hole. Drill core is boxed at the rig by the driller and moved to the sample preparation facility for logging. All core is digitally photographed, and logged at the core shed. Minor geotechnical data such as RQD and the percentage of solid core is recorded along with core recovery. The drill core is sawn in half longitudinally with a diamond saw at site. Half the core is placed in a sample bag and half is returned to the core tray. Sample numbers are assigned and sample tags are placed in the sample bags and recorded in the master sample list by down-hole interval. Sample intervals are typically one meter down-hole. Half core is shipped off site for crushing, preparation, and assay. Standards are inserted about 1 in 15 and blank samples are inserted about every 3rd or 4th standard prior to shipment for assay. Duplicates are not prepared or inserted in the diamond core sampling.
Pennstrom Consulting Easton Process Consulting, Inc.
35
13.0 SAMPLE PREPARATION ANALYSIS AND SECURITY
This section of the report has been copied from the 2007 IMC Report and has been reviewed by the initial author for completeness and accuracy. The 2007 IMC Report, including the Çöpler project sample preparation analysis and security information can be obtained from SEDAR (www.sedar.com) in the report titled “Technical Report for Çöpler Gold Project”, by Independent Mining Consultants, Inc.; March 2, 2007 as Amended 30 April, 2007. The information contained within the above referenced report in section “13.0 Sample Preparation Analysis and Security” has not changed and is provided in the following text. This section summarizes the off-site sample preparation and assay procedures applied to the Çöpler drill-hole samples. Current sample preparation practices for both RC and diamond drilling are summarized on Figures 13.1 and 13.2. Sample preparation is completed at the ALS-Chemex preparation facilities in Izmir, Turkey. Pulps are sent to ALS-Chemex in Vancouver for gold fire assay and ICP multi-element analysis. During the joint venture period from 2000 to 2003, the sample preparation was completed off site by Alex Stewart Assayers, Ltd. (ASA) in Izmit, Turkey. Once the samples were prepared, pulps were sent to OMAC Laboratories Ltd. (OMAC) in Galway, Ireland for gold fire assay and ICP multi-element. Historic ASA preparation procedures differed from current practice in that a larger pulp was prepared (1.5 kg) and sized to minus 100 mesh rather than the current practice of 200 mesh. Gold fire assays by OMAC were 50gm aliquots with AA finish. Current practice at ALS Chemex is to use a 30 gm aliquot. All other elements including silver have been assayed by ICP analysis. The ICP digestion procedures of the two labs are:
• OMAC digests 0.2 gm of pulp in 66% Aqua Regia for 1 hour at 120 deg C. • Chemex digests 0.25 gm of pulp in Aqua Regia to dryness. The residue is then digested in 10% HCL prior to ICP – Atomic Emission Spectroscopy.
Sample bags are shipped from Çöpler to the preparation facility in Izmir, where they are logged into the system and retained under the control of the third-party outside lab until assay reports are issued. Excess pulps and coarse rejects from the assay and preparation process are stored at the lab. Density data is measured on site by weighing core samples in air and in water. Two slightly different procedures have been applied. The current practice is:
1) weigh the sample in air, 2) dry it for 24 hours at 104 degrees C, 3) coat with wax and weigh in air again, and 4) immerse in water and weigh in water. The density of wax at 0.86 gm/cc is removed from the calculation of sample density.
The other method weighed the sample in air, dried it and weighed again, then weighed it immersed. This process is acceptable for solid core, but had drawbacks with clay altered samples. Both sets of information have been used to develop estimated material density for the block model.

Pennstrom Consulting Easton Process Consulting, Inc.
36
25 - 30 kg of weight taken RC cuttings
25 - 30 kg samples are separated 500 grams in splitter with half finishing process
Keep RC rejects > 0.25 Au ppm
at the site
Çöpler standards and blanks inserted 1 in 15,
Duplicate samples inserted1 in 15-20.
500 grams samples dispatched to ALS CHEMEX in İzmir
Off Site
Sample dried at 90°C for 8 hourso
Entire sample Rhino jaw crushed to 70% - 2mm
Coarse rejects retained
500 grams riffle split
Entire split pulverised to -75μm (200 mesh) or finer
Fine rejects retained
150 grams of pulp dispatched to ALS CHEMEX CANADA
Au AA25: 30 grams splits fire assay with flame AAS finish. Other Elements MEICP 61: 47
elements by HF-HNO3-HCl04 acid digestion, HCl leach and combination of ICPMS and ICPAES.
Excess pulp retained
Results reported including laboratory standards, duplicates and blanks.
Figure 13.1 Çöpler Project
Current Sample Preparation And Analysis Reverse Circulation "RC" Drill

Pennstrom Consulting Easton Process Consulting, Inc.
37
Çöpler standards and blanks inserted, 1 in 15.
No duplicate.
1/2 core 2 - 4 kg dispatched to ALS CHEMEX in İzmir. No quarter core duplicates.
Sample dried at 90 o C for 8 hours.
Entire sample Rhino jaw crushed to 70% - 2mm
Coarse rejects retained
1.0 kg riffle split
Entire split pulverised to -75 µm (200 mesh) or finer
Fine rejectsretained
150 grams of pulp dispatched to ALS CHEMEX CANADA
Excess pulp retained
Results reported including laboratory Standards and blanks.
Figure 13.2 Çöpler Project
Current Sample Preparation And Analysis Drill Core
Au AA25: 30 grams splits fire assay with flame AAS finish. Other Elements MEICP 61: 47
elements by HF-HNO3-HCl04 acid digestion, HCl leach and combination of ICPMS and ICPAES.

Pennstrom Consulting Easton Process Consulting, Inc.
38
14.0 DATA VERIFICATION
This section of the report has been copied from the 2007 IMC Report and has been reviewed by the initial author for completeness and accuracy. The 2007 IMC Report, including the Çöpler project data verification information can be obtained from SEDAR (www.sedar.com) in the report titled “Technical Report for Çöpler Gold Project”, by Independent Mining Consultants, Inc.; March 2, 2007 as Amended 30 April, 2007. The information contained within the above referenced report in section “14.0 Data Verification” has not changed and is provided in the following text. This section summarizes the results of IMC due diligence verification of the Çöpler data base. The verification analysis was updated during November and December of 2006 to reflect the total data set available during September of 2006. Some of the work described in this section was part of the original September 2005 resource update.
1) Review of Rio Tinto QAQC analyses. 2) Checks of the data base compared to the electronic certificate of assay. 3) Analysis of inserted duplicates 4) Analysis of inserted standards versus certified standard value. 5) Verification of blank results 6) Comparison of diamond drill (DD) results with twined RC drilling. 7) Check of diamond drill core recovery vs grade. 8) IMC selected 30 samples of coarse reject and half core for independent assay.
Drill hole and assay data collected from September 2005 to September of 2006 was verified by incremental analysis of the duplicate assays and the inserted standards. The comparison of diamond drilling versus RC drilling was updated during 2006 to take advantage of more closely spaced pairs of diamond and RC drilling. Rio Tinto QAQC Analysis IMC reviewed the QAQC appendices that were published by Rio Tinto during the preparation of their Conceptual Study. IMC did not repeat the analysis, but did study the QAQC documentation provided in text by Rio Tinto. Rio completed duplicate assays, outside lab duplicates (check assays) and inserted standards and blanks into the sample stream. Reported duplicate results and standards’ results for OMAC assayed gold appear sound. However duplicate assays and standsrds for OMAC assayed silver appear to run high compared with the outside lab checks and standards. There are indications of a high lab silver bias at OMAC in other analysis to follow. Certificates Check The data base provided to IMC for resource estimation during 2006 was an Access data base prepared and maintained by Anatolia. The assay results for the 2005 and 2006 drilling are a direct input of electronic certificates of assay from the assay lab. Trace assay was stored as one-half the trace value within the data set for block grade estimation.

Pennstrom Consulting Easton Process Consulting, Inc.
39
Within the pre-2004 data set, IMC checks of the available paper certificates against the Access data base did not identify any discrepancies IMC was able to check 3.2% OMAC lab assays and found no discrepancies for gold or silver in the intervals with available certificates. The total data base as of September 2005 contained 34,308 gold assay intervals from the ALS-Chemex lab. IMC checked 33,088 of those certificates (96%) and found 8 intervals within the entire data base where the gold results did not match certificates resulting in a 0.02% error rate. There were 6 intervals for silver out of 34,275 availble certificates for an error rate of 0.02%. IMC finds the modest error rate acceptable for determination of mineral resources and mineral reserves. Duplicates Duplicates of RC drill samples are prepared by Anatolia personnel and submitted on a 1 in 15 to 25 basis. Statistical counts indicate an average insertion rate of 1 in 22.2 for samples sent to ALS-Chemex. IMC could identify 24 duplicates that had been assayed by OMAC during their tenure as an assay lab. Consequently, this discussion wil focus on the duplicates assayed at Chemex. ALS-Chemex assay procedures used two slightly different assay procedures for gold: 1) “aa23” with 0.005 to 10 ppm reporting range, and 2) “aa25” with 0.005 to 100ppm reporting range. Both methods utilized a 30gm aliquot. During the use of the aa23 method, values greater than 10ppm were rerun with gravimetric finish (152 intervals). IMC was able to check that assignment during the certificates check. In comparing the duplicates during this period, the proper original assay was identified for the check. IMC completed statistical hypothesis tests for gold and silver for the available submitted duplicates. The 2005work was updated with an incremental check of the new data drilled since that date. The results are summarized below:
RC Duplicates as Inserted by Anatolia
Duplicate Original Values Hypothesis Test Results at 95% Confidence
Metal Assay
Method Number of Pairs Mean gm/t Variance Mean gm/t Variance T Stat Paired T Binomial KS
Data Available in Sept 2005
Gold aa23 350 0.767 2.038 0.733 1.891 Pass Pass Pass Pass
Gold aa25 1084 0.804 7.981 0.796 7.547 Pass Pass Pass Pass
Incremental Data Available in Sept 2006
Gold aa25 290 0.208 0.266 0.208 0.229 Pass Pass Pass Pass
All Gold Duplicate Data Available in Sept 2006
Gold All
Types 1989 0.809 9.15 0.785 7.927 Pass Pass Pass Pass
Data Available in Sept 2005
Silver ICP 1502 1.868 54.085 1.859 54.762 Pass Pass Pass Pass
Incremental Data Available in Sept 2006
Silver ICP 290 0.834 8.899 0.833 8.651 Pass Pass Pass Pass
All Silver Duplicate Data Available in Sept 2006
Silver ICP 1979 1.645 55.673 1.642 54.564 Pass Pass Pass Pass

Pennstrom Consulting Easton Process Consulting, Inc.
40
The duplicates results are proper and indicate that the sample preparation and assay procedures applied at the Chemx lab are repeatable with good precision. Standards and Blanks Standards and blank samples have been used as the primary verification of the assay methods throughout the project life. During the Rio Tinto exploration program, blind standards were submitted to the OMAC lab. IMC was able to find the Rio Tinto standards files as separate spreadsheets as well as the analysis of that data within the Rio Tinto conceptual study. Figure 14-1 summarizes the results of the few OMAC standards that were within the Çöpler data base. The horizontal axis presents the agreed certified value of the standards, and the vertical access reports the values actually reported by the OMAC lab during the normal assay process. Gold results on the graphs are appropriate. Silver indicates a minor high bias in the high grade range that is also apparent in the Chemex lab results. Rio Tinto analysis of standards also indicates a high bias of OMAC vs standards for two of the three silver standards of ore grade interest. Rio Tinto duplicate assays checks on coarse rejects and pulps indicate a high bias of OMAC silver when compared with Chemex lab silver.

Pennstrom Consulting Easton Process Consulting, Inc.
41
OMAC Gold Standards
OMAC Silver Standards
Figure 14.1 Standard Results
OMAC Labs Reported vs Certified Values

Pennstrom Consulting Easton Process Consulting, Inc.
42
During the previous verification work reported in October 2005, IMC separated the aa23 method from the aa25 method for separate checking of inserted standards. No problematic issues were noted between the aa23 and aa25 methods during that work. Consequently, the updated analysis of standards insertion has combined both assay methods. Altogether there are 1921 inserted standards samples for gold and 365 for silver within the September 2006 drill hole data base. There are 487 values assayed by the as23 method included within the total count for gold standards. Figure 14-2 presents the results of the inserted gold standards for all data to date and the 2006 drilling separated from the total data set. The obvious issue is the swapping of standards in the data base for 2005 and earlier. For example, inserted standards recorded as Standard # 4 have assay values report back typical values for Standard #2. The indication is that the crew inserting the standards values were inserting the wrong samples, or recording the wrong samples in the standard insertion logs. This issue was discussed in the previous Technical Reports by IMC and it appears that improvements have been made based on the 2006 results at the bottom of the page. The swap rate on Figure 14-2 averages about 2% for the data prior to 2006. IMC has observed that there is no correlation to the value of the previous assay in the run, meaning that the results do not appear to be lab errors or sloppy lab work, but simply mislabeling or miss-insertion of standards prior to lab submittal in the pre 2006 data. During 2006, the sample swap rate appears to be zero. When the swapped standards are removed from the pre-2006 data, there is a tendency for the high grade gold samples to report back with somewhat lower values than the certified value. This result is not atypical and will result in conservative assay results. Within the 2006 data there does not appear to be a similar trend. Figure 14-3 shows the results of 365 available silver standards as assayed at ALS-Chemex by the ICP method. The same sample swap issues are obvious with about 5.7% of the inserted standards mislabeled or miss-inserted within the pre 2006 drilling. Within the 2006 drilling, there does not appear to be an issue with sample swapping. When the swapped values are removed, there appears to be a tendency for ASL-Chemex to report values somewhat higher than the established standard value for silver. This difference is between 4 to 7% and is similar to the results reported regarding OMAC by Rio Tinto. The indication is that the standard is actually low valued or the ICP method applied by both labs is over estimating. It should be noted that the economic impact of silver on the project is minor (about $0.30/tonne of ore on average) and overestimation of 7% would amount to about $0.02/tonne ore.
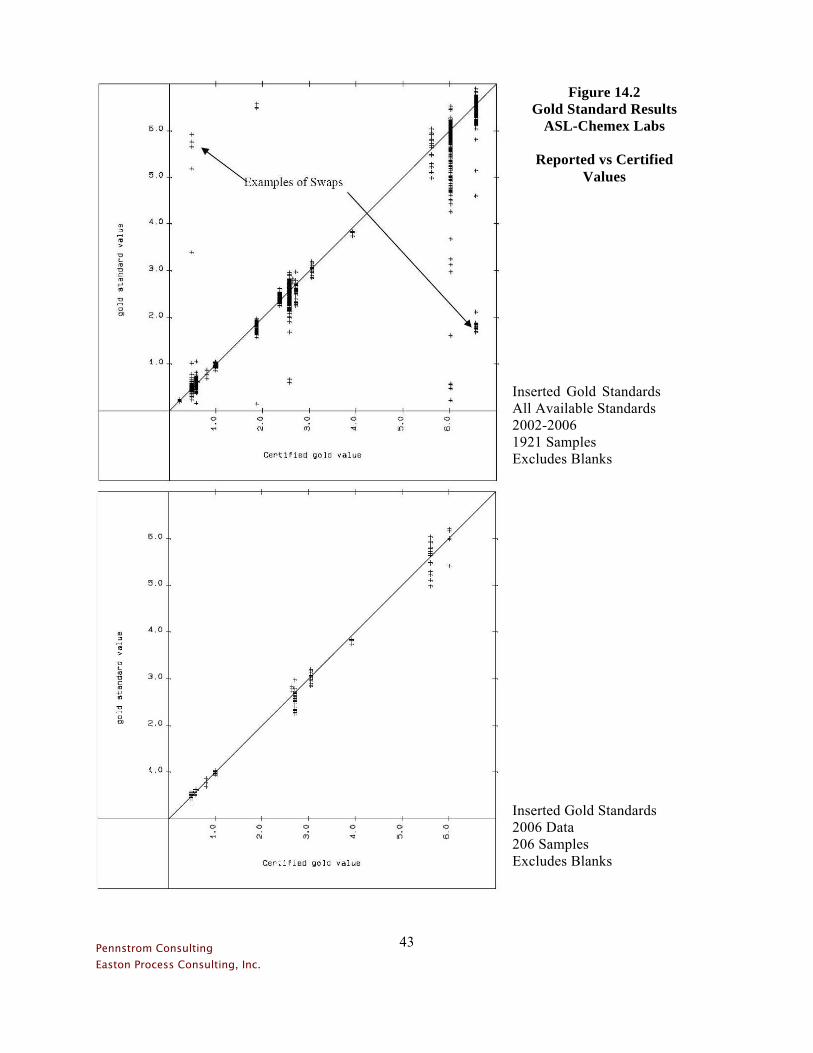
Pennstrom Consulting Easton Process Consulting, Inc.
43
Inserted Gold Standards 2006 Data 206 Samples Excludes Blanks
Inserted Gold Standards All Available Standards 2002-2006 1921 Samples Excludes Blanks
Figure 14.2 Gold Standard Results
ASL-Chemex Labs
Reported vs Certified Values

Pennstrom Consulting Easton Process Consulting, Inc.
44
Figure 14.3 Silver Standard Results
ASL-Chemex Labs
Inserted Silver Standards All Available Standards 356 Samples Excludes Blanks
Inserted Silver Standards 2006 Data 9 Samples Excludes Blanks

Pennstrom Consulting Easton Process Consulting, Inc.
45
Blanks Blanks are inserted during the sample insertion process in the same manner as standards. The results of the inserted blank samples for gold and silver are as follows:
565 inserted blanks for gold All but 6 results are below 0.05 gm/t (less than detection) Of the 6, three are likely swaps of other standards
Std1 = 6.04, Std234 = 4.99, Std3 = 0.47 The other three values are 0.06, 0.08, and 0.15gm/t that have no impact on ore values
During 2006, the only submitted blank out of range was the above value of
Std3 at 0.47 gm/t.
504 inserted blanks for silver All but 4 are below the 0.25 gm/t detection limit Those 4 are reported at 1.1, 1.9, 2.0, and 2.2 gm/t and are likely swaps of Std7.
During 2006, the only submitted blank out of range was the above value of
Std7 at 1.90 gm/t IMC has checked the values in the assay sequence prior to insertion of the blanks. There is no correlation between the reported values for the blanks and the prior assay meaning that there is not an issue with sloppy lab practices. IMC holds the opinion that the few out-of-limit blanks of between 0.5 and 1% are acceptable for determination of mineral resources and mineral reserves. Diamond Drilling Versus RC Drilling IMC composited the drill hole data into 5m bench interval composites for statistical work and for eventual block model grade estimation. Each drill hole interval was tagged with the drill type: 1 = DD, 2 = RC, and 4 = Water well drilling. A set of DD to RC paired composites were identified where the spacings between the 5m composites was less than 5m, 10m and 15m progressively. Particular emphasis was placed on those composites that were separated by 5m or less. The comparison was completed for both gold and silver. In both cases, high grade assay data was cut prior to compositing for the Main, Manganese, and Marble zones at: Gold at 25gm, 30gm, and 40gm, and Silver at 100gm, 350gm, and 100gm. During the comparison of RC to DD gold, 3 values above 25 gm/t gold and 3 values above 70 gm/t silver were removed as they were outliers to the distributions. The hypothesis tests would still indicate that the two sample methods could be commingled, even if the outliers were not

Pennstrom Consulting Easton Process Consulting, Inc.
46
removed. The comparison of DD to RC sampling methods at data spacings of 5m and 10m are summarized on the following table.
Nearest Neighbor Comparison DD to RC Drilling
DD Drilling RC Drilling Hypothesis Test Results at 95% Confidence
Metal Spacing
Less Than Number of Pairs Mean gm/t Variance Mean gm/t Variance T Stat Paired T Binomial KS
Gold 5m 164 1.916 6.973 2.239 7.651 Pass Pass Pass Pass
Gold 10m 270 1.448 5.782 1.701 5.812 Pass Pass Pass Pass
Silver 5m 164 4.954 79.157 5.253 78.924 Pass Pass Pass Pass
Silver 10m 270 3.884 62.221 4.134 66.8 Pass Pass Pass Pass
Figures 14.4 and 14.5 summarize the above data on cumulative frequency plots for the 5m paired data for gold and silver respectively. The plots and the table above indicate some degree of high bias of RC data relative to the nearest diamond core sample. However, the bias is not sufficient to be statistically significant relative to the population variances of both the RC and Diamond populations.

Pennstrom Consulting Easton Process Consulting, Inc.
47
Figure 14.4 Nearest Neighbor Comparison DD to RC Drilling for Gold
DD Gold = Orange, RC Gold = Purple

Pennstrom Consulting Easton Process Consulting, Inc.
48
Figure 14.5 Nearest Neighbor Comparison DD to RC Drilling for Silver
DD Silver = Orange, RC Silver = Purple

Pennstrom Consulting Easton Process Consulting, Inc.
49
Core Recovery vs Grade IMC completed a comparison of grade versus core recovery within the diamond drill holes during 2005. The results indicated that at the highest core recoveries, the values of gold and silver were somewhat lower than the deposit mean. A more thorough review indicates that the best core recovery occurs in the low grade zones peripheral to the deposit. The IMC test results do not indicate a data sampling bias, but rather the trend for the best core recovery to occur where there is little metal and consequently little alteration. No further analysis of core recovery was deemed necessary. IMC Independent Check Assay IMC personnel selected 30 samples from drill core and RC coarse rejects for independent assay. The sample list was prepared by IMC to cover the range of deposit grades, locations, and rock types. Çöpler personnel had no prior knowledge of the sample list. The purpose of this type of independent assay is to confirm the presence of metal in the base or to confirm the samples. A 30 sample suite is not of sufficient size to confirm the data base or to confirm the deposit grades. However, it is sufficient to verify the presence of ore grade mineralization as a blind test program. The 12 samples that were from diamond core used the remaining half core as the requested sample. The 18 RC samples were developed by pouring the coarse rejects through the splitters in the same process as applied to RC sampling described earlier in text. The collected samples were shipped by air freight to IMC offices in Tucson, Arizona. IMC personnel delivered the 30 samples to the Skyline – Activation Labs offices in Tucson for preparation and fire assay. Requested preparation procedures were to crush to 10 mesh, split 250 gm, and pulverize to 95% minus 150 mesh. Activation chose to ship pulps to their lab in Toronto for AA analysis of 30 gm aliquots. Activation utilized a gravimetric finish when the AA result indicated a grade above 4.0 gm/t. Activation results for AA gold were not ideal in that their inserted standards indicate a 23% low bias in the AA gold results within the Activation results. Table 14.1 illustrates the raw data from Activation versus the data base information from Çöpler. Figure 14.6 summarizes the comparison of the check assays versus the original data base values. A correction factor has been applied to the Activation Lab gold results for the AA range on the graph based on the Activation standards results. Despite the issues with Activation check assay, the process has confirmed the presence of ore grade mineralization at Çöpler by blind independent sample collection and assay. It should be noted that the Activation assay issues discussed above do not apply to the Çöpler data base or assay methods.

Pennstrom Consulting Easton Process Consulting, Inc.
50
Table 14.1 Assays of Çöpler Samples Collected by IMC
Sample Location from Çöpler Drilling
Hole Sample No. From To Interval Lith
Original Gold PPM
Act Labs Gold
PPM**
Original Silver PPM
Act Labs Silver PPM
CDD_001 39970 16.00 17.00 1.00 MTS 0.23 0.16 0.25 0.10 39971 22.00 23.00 1.00 MTS 1.43 1.35 5.40 7.50 CDD_008 39972 126.00 127.00 1.00 INT 0.19 0.13 0.25 0.10 39973 183.00 184.00 1.00 INT 0.99 0.79 10.40 10.40 CDD_045 39974 42.00 43.00 1.00 MTS 0.80 0.64 1.01 0.70 CDD_053 39975 98.00 98.90 0.90 MTS 0.35 0.23 0.25 0.30 39976 5.70 6.90 1.20 OVB 0.32 0.22 0.60 0.10 39977 13.65 15.15 1.50 DIO 0.13 0.12 0.25 0.10 39978 24.00 25.00 1.00 BRC 4.83 4.84 3.70 3.50 39979 29.00 30.00 1.00 CLA 0.48 0.30 0.90 0.50 39980 51.00 52.00 1.00 BRC 54.90 59.91 35.10 7.60 CRD_248 39981 21.00 22.00 1.00 MRB 0.14 0.14 0.25 0.10 39982 6.00 7.00 1.00 DIO 2.44 2.29 8.00 7.40 39983 11.00 12.00 1.00 DIO 3.51 3.20 25.00 21.20 39984 34.00 35.00 1.00 DIO 0.54 0.62 8.10 15.00 39985 6.00 7.00 1.00 JSP 1.30 1.03 3.30 2.20 39986 17.00 18.00 1.00 JSP 1.63 1.16 3.50 2.60 39987 26.00 27.00 1.00 MPY 1.19 0.95 0.60 0.90 CRC_078 39988 6.00 7.00 1.00 MTS 0.12 0.10 0.25 0.30 CRC_119 39989 6.00 7.00 1.00 DIO 3.01 2.19 0.25 0.20 39990 5.00 6.00 1.00 CLA 0.11 0.08 0.25 0.10 39991 36.00 37.00 1.00 MRB 4.01 5.82 1.70 2.00 CRC_196 39992 62.00 64.00 2.00 BRC 0.64 0.55 0.25 0.10 CRC_263 39993 160.00 161.00 1.00 MTS 0.70 0.46 0.25 0.10 39994 34.00 35.00 1.00 JSP 18.85 22.66 26.30 22.90 39995 42.00 43.00 1.00 DIO 1.94 1.42 1.50 1.50 39996 51.00 52.00 1.00 MTS 6.64 7.22 1.20 1.20 39997 55.00 56.00 1.00 JSP 10.45 10.24 10.10 4.40 39998 84.00 85.00 1.00 JSP 5.57 6.39 3.60 2.80 39999 97.00 98.00 1.00 JSP 0.89 0.16 2.30 2.00 Means= 4.28 4.51 5.16 3.93
** Values greater than 4.00 gm/t gold were reported by gravimetric finish Gold Standards submitted in the AA assay stream average low and require a 1.23 factor to correct

Pennstrom Consulting Easton Process Consulting, Inc.
51
Figure 14.6 Activation Lab Check Assays on Samples Selected by IMC

Pennstrom Consulting Easton Process Consulting, Inc.
52
15.0 ADJACENT PROPERTIES
This section of the report has been copied from the 2006 SE Report. and has been reviewed by the initial author for completeness and accuracy. The 2006 SE Report, including the Çöpler project adjacent property information can be obtained from SEDAR (www.sedar.com) in the report titled “Technical Report, Çöpler Gold Project Feasibility Study”, 30 May 2006 prepared by Samuel Engineering, Inc. The information contained within the above referenced report in section “15.0 Adjacent Properties” has not changed with the exception of format and section number and is provided in the following text. The following properties are in the area near the Çöpler deposit, and are licensed for exploration by AMDL: Kabatas This is a copper-gold porphyry deposit located about 15 km southeast of Çöpler. Kabatas is an exploration target where some drilling was done early in the Rio Tinto/AMDL joint venture during 2003. Demirmagara Demirmagara is a copper-gold mineralization system located 5 km southwest of the Project Site. It is an exploration target, and mapping, surface sampling, and geophysics have been completed at the area. AMDL recently started RC drilling at Demirmagara. Zanga Dere This is a gold and copper mineralization system similar to the one at Çöpler. It is located about 2 km south of the Project. Sabirli This is a gold and copper system located 4 km east of Çöpler. Surface sampling has been completed on this exploration target. Bayram Dere Bayram Dere is a copper-gold exploration target located 6 km southeast of Çöpler. Surface sampling, geophysics and mapping have been completed. Findikli Dere This is a copper-gold porphyry style target located 8 km southeast of Çöpler. Mapping and some surface sampling have been completed. Bache Bache is a Çöpler style mineralization target located 2 km north of the Project. Mapping, surface sampling and trenching have been completed.

Pennstrom Consulting Easton Process Consulting, Inc.
53
16.0 MINERAL PROCESSING AND METALLURGICAL TESTING
Sections 16.1 through 16.10 of the report have been copied from the 2007 IMC Report and have been reviewed by the initial author for completeness and accuracy. The 2007 IMC Report can be obtained from SEDAR (www.sedar.com) in the report titled “Technical Report for Çöpler Gold Project”, by Independent Mining Consultants, Inc.; March 2, 2007 as Amended 30 April, 2007. The information contained within the above referenced report can be found in section “16.0 Mineral Processing and Metallurical Testing.” 16.1 Background
Metallurgical tests were carried out as part of the Project development work on reverse circulation and diamond drill cores from the three zones identified in the Çöpler deposit: the Manganese, Marble Contact and Main Ore Zones. Bulk surface samples have also been obtained from the Manganese Zone and tested.
The Çöpler deposit is a porphyry related, bulk mineable, epithermal gold complex with most of the gold mineralization located in three closely spaced deposits. Metallurgical tests reveal that better than 80 per cent gold recoveries are expected from the oxide ores, while the sulfides are generally refractory. The report focuses on the metallurgical testwork and project feasibility of the oxide ores.
Table 16.1 lists the major ore types and their contributions to the overall oxide ore body:
Table 16.1 Major Ore Type Percentages
Oxide Ores % of Total
Marble (MRB) 66.64 Diorite (DIO) 23.93 Metasediments (MTS) 7.18 Jasperoid (JSP) 1.63 Manganese Oxide (MNX) 0.62
Total Ore Types 100.0
Metallurgical test-work commenced in September of 2004 and has been managed by RDi, with oversight from Ausenco Limited of Brisbane, Australia, and Pennstrom Consulting of Highlands Ranch, Colorado. RDi carried out the majority of the metallurgical testing in their laboratory at Wheat Ridge, Colorado. Specialized tests and analytical services, such as comminution, mineralogy, and rheology were contracted out to others.
16.2 Comminution
The ore competency is low for all ore types in the deposits. This is consistent with the indicators measured: high drop weight A*b value of 83 to 91, along with very low UCS values (all less than 60 MPa).

Pennstrom Consulting Easton Process Consulting, Inc.
54
The impact crushing work index (ICWI) values are low at 4 to 9 kWh/mt for Manganese Zone ores and 2 to 6 kWh/t for the Main Zone ores.
The rod mill work index to ball mill work index ratio (RWI:BWI) for the Manganese and Marble ores is generally 1.0 to 1.1, and 0.8 to 0.9 for the Main ores. This indicates a low potential for critical size pebble build up in SAG mill circuits and in single stage ball mill circuits.
The BWI values are variable and generally are in the soft to medium hardness range: 7 to 13 kWh/mt for Manganese Zone ores and 8-16 kWh/mt for Marble Contact Zone ores. BWI for the Main Zone ores are generally harder at 12 to 19 kWh/mt.
Hardness of the ore as measured by the Bond ball mill work index, generally increases with silica content and decreases with assayed lime for ores in the three deposits.
The abrasion index values (Ai) are uniformly low at less than 0.1 for all ore types.
16.3 Agitated Cyanide Leaching
A moderate dependency residue grade and recovery with grind size was observed for the Main and Manganese samples tested and a lesser dependency for the Marble sample. A grind size of 80 per cent passing 150 µm (100 mesh) was selected following an assessment of economic and operating criteria over the particle size range of P80 75 µm to 180 µm.
The ores did not demonstrate any influence of pregnant solution “robbing”.
All ores exhibited rapid initial gold recovery in the first six hours, followed by a slow leaching fraction up to 18 to 24 hours.
In the Manganese Zone, marble lithology is the major ore type. Identified Gold recovery trends are described as follows:
• Gold recovery for marble lithology varies from 70 to 90 per cent. A strong correlation of recovery with head grade for marble ores was observed.
• Gold recovery for “non-marble” ore types is in the range of 75 to 80 per cent. Poor correlation of recovery with head grade is noted for these other ore types. Good correlation of recovery with residue grade was observed.
• The range of cyanide consumption is expected to be low in operation, typically 0.1 to 0.5 kg/t NaCN from scale-up of laboratory data to operating conditions. Excursions will occur when proportions of other “non-marble” ore types in plant feed increases. Depending on the run-of-mine blend this may result in cyanide consumption increasing by two to three times that normally encountered with the Marble ore.
Recovery characteristics for Marble Contact Zone Ores are:
• Gold recovery is 80 per cent for marble lithology and around 60 per cent for other non-marble ore types.
• The average cyanide consumption for non-marble ore types is about 1.5 kg/t NaCN.

Pennstrom Consulting Easton Process Consulting, Inc.
55
Metallurgical outcomes from tests for the Main Zone ores are:
• Recovery for oxide diorite is good at around 75 per cent, with low cyanide consumption.
• Gold recovery for oxide metasediment is good at about 75 per cent, with average cyanide consumption at 1.5 kg/t NaCN.
16.3 Pre-Concentration Methods
A series of flotation tests were carried out for a number of conditions: strong xanthate, sulfidizer, and speciality reagents (by vendor). Outcomes from the float tests on the oxide ores were poor, as would be expected. Tests on sulfide ores will be discussed in future studies.
A manganese rich section, adjacent to the existing pit of the former manganese mine was identified. Gravity upgrade tests for two sizes simulating leach tails and cyclone underflow feed material were carried out to assess the potential to produce a saleable manganese product with minimal gold losses. The findings were:
• Primary gravity recovery of manganese was poor, with less than 50 per cent of the manganese recovered in 30 per cent by weight from the feed.
• Secondary gravity recovery of manganese was poor, with no further upgrading of manganese achieved.
• Gold recovery to a gravity product is low with less than 2 per cent gold reporting to the manganese gravity concentrate.
• These products are unlikely to receive gold credits and will possibly incur downstream penalties for deleterious elements such as Ba, As, Hg, Zn, Pb, and Cu.
• The potential to make a saleable manganese product from this material for a metallurgical grade (> 48 per cent Mn) or a battery grade (> 45 per cent) is low.
Note that direct leaching of this sample achieves 81 per cent extraction of gold with a cyanide consumption of 1.0 kg/t.
16.4 Column Leaching
Recovery rates for all column tests were generally fast with rapid leaching (by column standards) occurring in the first six days followed by a slow leaching component for the remainder of the time allowed. Slowest initial leaching rate is observed in the diorite ore from the Main Zone.
Column leach tests were carried out at two crush sizes: 80 per cent passing 50 mm and 80 per cent passing 13 mm. Marble ores from the Manganese Zone showed a relatively small decrease, 0.05 g/t Au, in residue grade at the finer crush size. Crush size has only a minor impact on recovery for this sample. Both “bucket tests” and column leach tests showed a very sharp improvement in gold recoveries for marble/limestone feed as particle size decreased.
Good correlation is found in the plot of recovery against head grade for marble ore in the Manganese Zone.
Recoveries of 60-75 per cent for marble and diorite ore are indicated from the tests at a low average cyanide consumption of about 0.5 kg/t NaCN.

Pennstrom Consulting Easton Process Consulting, Inc.
56
16.5 Cyanide Soluble Copper
Cyanide soluble copper trends from analytical tests, carried out on drill core composite samples prepared from nominally 7-10 m interval of core are:
• Marble lithology has the lowest total copper and cyanide soluble copper. Average soluble copper is 6 to 14 per cent of the total copper for all three deposits when leached at high temperature and with high cyanide strength solutions. Total range of averages for marble lithology in the three deposits is approximately 300 – 700 g/t Cu.
• Cyanide soluble copper in other non-marble lithologies is significantly higher with extraction averages in the range of 10 to 50 per cent. Total copper range of averages for non-marble lithologies is approximately 500 – 7000 g/t Cu (0.05 – 0.7 per cent).
• Extreme variability in copper to solution is evident, ranging from 1 to 40 per cent in marble lithology and 1 to 70 per cent in non-marble lithologies.
There is a relatively strong correlation of cyanide soluble copper with total copper for all ore types. The relationship can be described by an algorithm using regression analysis, where there is sufficient data.
16.6 Copper Carbon Loading and Stripping
Tests were carried out to determine the anticipated copper carbon loading and the ability to remove copper from the carbon using a cold cyanide strip method. Results indicated:
• Copper carbon loading could be minimized by increasing the cyanide concentration of the solutions.
• Copper loading on carbon was less than 3 percent with an initial copper feed grade of 8,450 g/t.
• Stripping of copper from carbon was highly successful at ambient temperatures with a 5 percent cyanide solution removing over 90 per cent of the copper from the carbon, and less than 0.6 percent of the gold. Copper stripping was essentially complete in six hours.
16.7 Amenability of Ores to Cyanide Leaching
Gold extraction and cyanide leach amenability trends from the same composite samples and cyanide solubility tests show that:
• Gold in marble lithology is highly amenable to extraction by cyanide leaching, with extraction percentages in the low 90s (on pulverised samples) for marble lithology in all ore zones.
• Gold is highly amenable to extraction by cyanide leaching from manganese oxide (Manganese Zone), with extraction percentages in the mid 90s.
• Gold amenability to cyanide leaching is favourable for oxidised ore types: diorite, metasediment, jarosite, with average percent extractions in the range mid 70s to mid 80s for all deposits.
• Gold amenability to leach extraction is poor (< 40 per cent) to very poor (< 20 per cent) for non-oxidized or fresh lithologies: diorite, metasediment, and gossan lithology.

Pennstrom Consulting Easton Process Consulting, Inc.
57
• Depending on the head grade and lithology, the equivalent gold recovery at a nominal grind size at a P80 of 150 µm may be less by 3 per cent, or more, to correct for the fine nature of the pulverised sample (> 85 per cent minus 75 µm).
Table 16.2, below, provides the projected gold recovery by ore types for both the mill and heap leaching process circuits, and it demonstrates the difference between oxidized and unoxidized (sulfide) ores with respect to gold recovery. This report is based primarily on the oxide portion of the ore body. However, some of the economic, unoxidized material was included in the mine plan, with the result that the overall average gold recovery was lowered.

Pennstrom Consulting Easton Process Consulting, Inc.
58
Table 16.2 Preliminary Ore Types versus Estimated Process Recovery
Anatolia Minerals Development Ltd. Çöpler Gold Project
Manganese Mine Zone
Ore Type Mill Avg. Heap Leach Avg.
Ore Type File
Code Au Recovery Au Recovery Marble MRB 88.0% 74.8% Oxidized Diorite OX DIO 80.0% 68.0% Unoxidized Diorite DIO 35.0% 29.8% Jasperoid JSP 73.0% 62.1% Manganese Oxide MNX 81.0% 68.9% Main Zone
Ore Type Mill Avg. Heap Leach Avg.
Ore Type File
Code Au Recovery Au Recovery Overburden OVB 77.0% 65.5% Marble MRB 77.0% 65.5% Oxide Metasediments OX MTS 75.0% 63.8% Unox.Metasediments MTS 26.0% 22.1% Oxidized Diorite OX DIO 80.0% 68.0% Unoxidized Diorite DIO 10.0% 8.5% Jasperoid JSP 77.0% 65.5% Marble Contact Zone
Ore Type Mill Avg. Heap Leach Avg.
Ore Type File
Code Au Recovery Au Recovery Marble MRB 85.0% 72.3% Oxide Metasediments OX MTS 75.0% 63.8% Unox. Metasediments MTS 10.0% 8.5% Oxidized Diorite OX DIO 70.0% 59.5% Unoxidized Diorite DIO 40.0% 34.0% Clay (usually altered Dio) CLY 81.0% 68.9% Jasperoid JSP 73.0% 62.1%

Pennstrom Consulting Easton Process Consulting, Inc.
59
16.8 Cyanide Destruction
Cyanide destruction tests were performed using both sodium metabisulfite and ferrous sulfate methodologies. The results show:
• Both methods effectively eliminate free cyanide from tails slurries.
• Weak Acid Dissociable (WAD) cyanide concentrations varied greatly and were dependent on the amount of copper present in the tails slurry.
• Lower WAD and total cyanide concentrations were achieved using the sodium metabisulfite method.
Following the initial round of tests, a second series of cyanide destruction tests focused on utilizing sodium metabisulfite only. The results indicate:
• Total and WAD cyanide concentrations varied greatly and were dependent on the ore being treated.
• Total cyanide concentrations below 5 ppm and WAD cyanide concentrations below 1 ppm were consistently achieved.
• Some ores required only 2 times the stoichiometric amount of sodium metabisulfite to cyanide, while the more difficult ores required 5 times the stoichiometric amount.
• Slurry densities of 55 per cent solids and 65 per cent solids were tested, with both slurry densities achieving concentrations below 5 ppm total cyanides and WAD cyanide concentration below 1 ppm.
16.9 Leach Tailings Thickening
An initial test program was undertaken by RDi to examine flocculent additions, settling area requirements and underflow densities obtainable from leach tails. The tests indicated the following:
• The material settles rapidly when a high anionic, moderate molecular weight acrylamide/acryate copolymer flocculent was added to a slurry ground to 80 per cent passing 134 microns, diluted to 20 per cent solids at a pH of ~10.0.
• The underflow densities exceeded 70 per cent solids after 18-hours of settling with a moving picket.
• When allowed to settle undisturbed for 60 days without flocculent, the material reached a final density of 71 per cent solids.
• The overflow water in each of the tests with flocculent was clear, with turbidity measurements of less than 40 NTUs. At a flocculent addition of 15 g/t, the overflow had a turbidity of less than 15 NTUs.
• Settling of un-flocculated pulp resulted in slow settling, but clear water in the supernatant.

Pennstrom Consulting Easton Process Consulting, Inc.
60
The results indicate that additional water may be recovered from the Tailings Storage Facility as the pulp density increases with time from 55 per cent to over 70 per cent.
16.10 High Density Thickening
A second series of thickening tests were performed by Dorr-Oliver-Eimco to determine if high density or paste thickening was possible. The results indicate:
• The material settles rapidly when a high anionic, moderate molecular weight flocculent was added at 10 to 30 g/t to a leach tail slurry ground to 80 per cent passing 134 microns, diluted to 15 per cent solids.
• Densities exceeding 75 per cent solids may be achieved and a paste may be produced.
16.11 Sulfide Metallurgy
RDi has performed several preliminary sulfide scoping studies and tests since 2002. The metallurgical tests have been performed on analytical sample rejects from various drilling programs. Since the sulfide deposit lies underneath the oxide deposit, limited drilling has been undertaken to delineate the sulfide deposit and obtain samples for sulfide testing. Therefore, it is reasonable to assume that the samples used for the testwork will not necessarily be representative of the sulfide deposit. However, they do provide an indication that the gold contained in the majority of the sulfide ore will be refractory and would require a process flowsheet different from that for the free milling ore. The objective of these studies and the results obtained are briefly discussed in the following sections. 16.12 Rio Tinto Mining and Exploration Conceptual Study1, 2
The first study for the sulfide ore was undertaken for Rio Tinto Mining and Exploration. The primary objectives of the study were to determine the deportation of gold in various minerals and to upgrade gold in a product by flotation or gravity while maintaining at least 70 per cent gold recovery and a 3:1 ratio of concentration. RDi received several boxes of coarse drill core rejects for the study. The samples were blended into two composites based on mining zones, namely “Main Zone” (Composite No. 1) and “Marble Zone” (Composite No. 2). Composite No. 1 was made up from samples in holes CCD1 and CCD2 drilled in the “Main Zone”. Composite 2 was made up of samples in hole CCD8 drilled in the “Mn Mine” zone which is geochemically distinct from the main zone. A representative sample of each composite was pulverized and submitted for head analyses. The results are summarized in Tables 16.3 to 16.5 and indicate the following:
• Composite No. 1 assayed 2.67 g/t Au, 13.1 g/t Ag, 620 ppm Cu, 1895 ppm As, 4.05 per cent STotal and 0.56 per cent MnO. XRD analyses indicate that the host rock predominantly consists of quartz, feldspars and mica/illite. A small amount of pyrtie was present in the sample (3%).
1Preliminary Metallurgical Testing of Sulfide Ore Samples from Cöpler Prospect, Turkey. RDi Report Dated September 22, 2002. 2Cöpler Prospect, Turkey: Leaching of Flotation Concentrates, RDi Report dated December 1, 2002.

Pennstrom Consulting Easton Process Consulting, Inc.
61
• Composite No. 2 assayed 5.07 g/t Au, 19.8 g/t Ag, 3285 ppm Cu, 1854 ppm As, 10.63 per cent STotal and 3.56 per cent MnO. XRF analyses indicate that the sample contains sufficient quantities of zinc (2027 ppm) and lead (1098 ppm) besides copper and arsenic. XRD analyses indicate that the host rock consists of kaolinite and quartz. The composite also contains ± 10 per cent pyrite and ± 6 per cent rhodochrosite.
• The deportation of gold in various minerals in the two composites was distinctly different.
Gold is present in Composite No. 1 as free milling (15.3%), encapsulated in dolomite/calcite (15.1%) and associated with arsenopyrite (39.7%), pyrite (17.4%) and quartz (12.5%). On the other hand, free milling gold accounts for 54.2 per cent in Composite No. 2. The remaining gold is associated with rhodochrosite (19.9%), arsenopyrite (14.9%) and quartz (7.1%).
Flotation tests were performed using a standard flotation reagent suite consisting of potassium amyl xanthate and methyl isobutyl carbonal. The flotation concentrate recovered 61 per cent to 69 per cent of gold at the natural pH from Composites 1 and 2, respectively. The concentrate grade was 12 to 14 g/t Au. The gold recovery improved to 80 per cent to 83 per cent when 4.6 kg/t of sulfuric acid was added to adjust the flotation pulp pH. The upgrading ratio remained the same as standard tests. The test results are summarized in Table 16.6.
These results indicate that ores from different mining zones will respond differently to flotation.
Table 16.3 Head Analyses of Composite Samples
Composite No. 1 Composite No. 2 Element
Assay Calculated from Drill Core
Assay Calculated from Drill Core
Au, g/T 2.67 2.55 5.07 5.29
Ag g/T 13.1 14.4 19.8 16.4
Cu, ppm 620 684 3,285 2,894
Fe, % 3.87 3.97 7.84 7.94
STotal % 4.05 3.3 10.63 8.9
As, ppm 1,895 1,952 1,854 2,653

Pennstrom Consulting Easton Process Consulting, Inc.
62
Table 16.4 X-Ray Fluorescence Analyses of Composite Samples
Composite Composite Element, %
No. 1 No. 2
Element, ppm
No. 1 No. 2
Na2O 0.3 <0.05 V 151 168
MgO 2.03 0.55 Cr 86 29
Al2O3 17.4 20.9 Co <10 <10
SiO2 57.4 50.2 Ni 20 21
P2O5 0.17 0.25 W 29 19
S 1.70 5.64 Cu 711 2,977
Cl <0.02 <0.02 Zn 127 2,027
K2O 3.75 1.85 As 1,874 2,134
CaO 5.51 1.45 Sn 82 105
TiO2 0.74 0.60 Pb 36 1098
MnO 0.56 3.56 Mo 11 27
Fe2O3 4.63 9.34 Sr 147 82
BaO 0.06 0.45 U <10 41
Th <10 32
Nb <10 <10
Zr 112 86
Rb 92 68
Y 50 29

Pennstrom Consulting Easton Process Consulting, Inc.
63
Table 16.5 X-Ray Diffraction Analyses of Composite Samples
Approximate Wt. % Mineral
Composite No. 1 Composite No. 2
Quartz 35 22
Plagioclase Feldspar 15 <3?
K-feldspar 15 <3
Mica/Illite 12 <5?
Kaolinite <5? 50
Chlorite <5 —
Dolomite 5 —
Calcite <3 —
Rhodochrosite — 6
Pyrite 3 10
Marcasite — <3?
Chalcopyrite — <1?
Unidentified <5 <5

Pennstrom Consulting Easton Process Consulting, Inc.
64
Table 16.6 Summary of Flotation Test Results
Rougher Concentrate
Recovery % Grade
Test No.
Composite No.
Process Conditions
Wt. Au Ag As Cu S Au, g/T
Ag, g/T
ppm As
ppm Cu
% S
1. 1 Natural pH=6
12.8 61.4 88.6 56.8 80.8 73.0 12.7 89.0 7539 4712 20.58
2. 1 4.6 Kg/T H2SO4, pH=5.2
18.7 79.6 82.1 75.7 87.5 87.8 11.3 66.9 7356 3719 17.65
3. 2 Natural pH=5.5
26.6 68.9 92.5 70.0 94.5 85.2 13.4 59.8 4114 11,842 27.85
4. 2 4.6 Kg/T H2SO4, pH=3.2
29.5 83.0 97.0 76.7 97.0 92.8 15.0 59.8 4529 10,511 25.97

Pennstrom Consulting Easton Process Consulting, Inc.
65
16.13 AMDL Sulfide Ore Preliminary Testing in 20063
RDi undertook a preliminary metallurgical testing program in 2006 with the objective of determining the best processing option to recover gold from the sulfide composite sample. RDi received drill core rejects from three drill holes, namely STH-001, STH-002 A and STH-002 B. The core was packaged in plastic bags with each bag containing one meter interval of core. All the sample bags were emptied and blended thoroughly to prepare a composite sample for the study. The sample was crushed to nominal 6 mesh, thoroughly blended and split into 1-kg charges. A 1-kg charge was pulverized to 150 mesh and representative samples were split out for duplicate analyses of gold and silver using a 1-assay-ton fire assay procedure, and assays for arsenic, copper, mercury, and forms of carbon and sulfur. The sample was also analyzed by x-ray fluorescence for different elements and x-ray diffraction for major minerals. The data is summarized in Tables 16.7 to 16.9 and indicate the following:
• The sample assayed 1.27 g/t Au, 6.42 g/t Ag, 1330 ppm As, 782 ppm Cu and 2.42 per cent STotal.
• Approximately 75 per cent of the total sulfur was present as sulfide sulfur and the remaining 25 per cent as sulfate sulfur.
• The organic carbon in the composite sample accounted for 25 per cent of the total carbon in the
sample.
• The major minerals in the composite samples were quartz, feldspar, mica and calcite. The mineralogical study indicated that the major sulfide minerals in the ore were pyrite, arsenian pyrite, arsenopyrite, and chalcopyrite. Native gold and silver were not detected in the sample. Gold is most likely associated with arsenopyrite and arsenian pyrite, and silver is associated with chalcopyrite. The composite sample had an average hardness with Bond’s ball mill work index of 13.66. Diagnostic leach tests indicated that approximately 30 per cent of the gold is free milling and 56 per cent of the gold is tied up in arsenian pyrite, arsenopyrite, and pyrite. A series of flotation tests were performed to evaluate the effect of reagents and process parameters on gold recovery in the flotation concentrate. The test data are given in Tables 16.10 and 16.11. The test results indicate that a simple reagent suite consisting of potassium amyl xanthate (PAX) and methyl isobutyl carbonal (MIBC) recovered 75 per cent to 86 per cent of the gold in a concentrate at a grind of P80 of 200 mesh and natural pH. The weight recovery ranged from 17 per cent to 58 per cent.
3Preliminary Metallurgical Testing of Sulfide Samples from Cöpler Prospect, Turkey, RDi Report dated October 16, 2006.

Pennstrom Consulting Easton Process Consulting, Inc.
66
Table 16.7 Head Analyses of Composite Sulfide Sample
Element Assay #1 Assay #2 Assay #3
Au, g/t 1.27 1.27 1.27
Ag, g/t 6.95 5.53 6.24
As, ppm 1347 1313 1330
Hg. ppm 0.09 0.16 0.12
Cu, ppm 898 666 782
CTotal 1.16 1.17 1.16
Corg 0.30 0.26 0.28
Cinorg 0.86 0.92 0.89
STotal 2.43 2.42 2.42
Ssulfide 1.80 1.76 1.78
Ssulfate 0.64 0.66 0.65
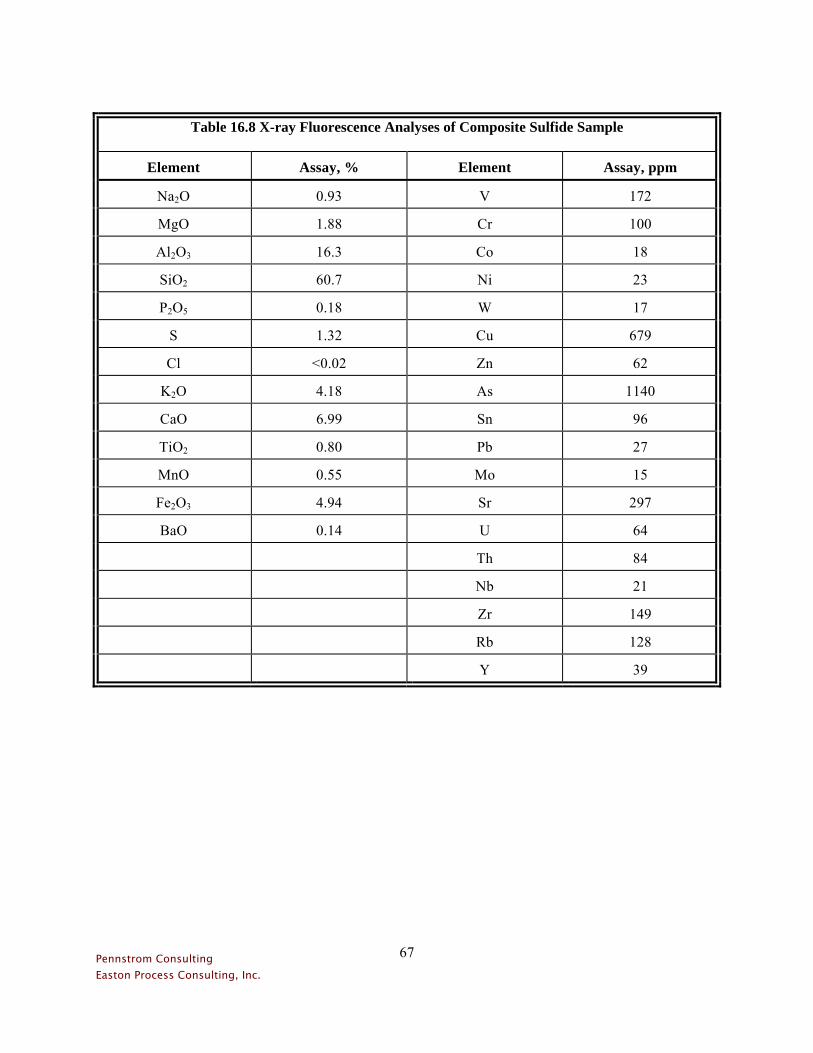
Pennstrom Consulting Easton Process Consulting, Inc.
67
Table 16.8 X-ray Fluorescence Analyses of Composite Sulfide Sample
Element Assay, % Element Assay, ppm
Na2O 0.93 V 172
MgO 1.88 Cr 100
Al2O3 16.3 Co 18
SiO2 60.7 Ni 23
P2O5 0.18 W 17
S 1.32 Cu 679
Cl <0.02 Zn 62
K2O 4.18 As 1140
CaO 6.99 Sn 96
TiO2 0.80 Pb 27
MnO 0.55 Mo 15
Fe2O3 4.94 Sr 297
BaO 0.14 U 64
Th 84
Nb 21
Zr 149
Rb 128
Y 39

Pennstrom Consulting Easton Process Consulting, Inc.
68
Table 16.9 X-ray Diffraction Analyses of Composite Sulfide Sample
Mineral Approximate Weight, %
Quartz 26
Pagioclase Feldspar 20
K-feldspar 13
Mica/Illite 20
Chlorite 8
Calcite 8
Jarosite <3
Pyrite <3
Arsenopyrite <1
Unidentified <5

Pennstrom Consulting Easton Process Consulting, Inc.
69
Table 16.10 Summary of Scoping Flotation Test Results (Grind: P80=200 Mesh)
Concentrate Cal. Head, g/T
5 Minutes 15 Minutes Recovery % Grade, g/t Recovery % Grade, g/t
Test No.
Reagents g/T
Wt. Au Ag Au Ag Wt. Au Ag S Au Ag
Au
Ag
1 100 g/t PAX 131 g/t MIBC
12.4 52.7 45.7 5.94 51.17 23.7 73.9 57.6 85.5 4.36 33.8 1.40 13.94
2 500 g/t NaHS 100 g/t PAX 82 g/t MIBC
8.8 56.0 81.2 8.71 84.41 19.8 76.1 92.5 84.8 5.26 42.7 1.37 9.16
3 75 g/t AP3477
75 g/t PAX 131 g/t MIBC
19.2 57.3 71.7 4.22 39.29 58.3 86.7 96.6 – 2.10 17.4 1.41 10.51
4 75 g/t AP407 75 g/t PAX
131 g/t MIBC
13.2 55.4 74.1 5.83 42.90 26.5 76.3 91.9 – 4.0 26.5 1.39 7.66
5 100 g/t PAX 140 g/t AF65
14.0 52.2 56.5 5.08 48.67 29.9 75.4 66.7 – 3.43 26.9 1.36 12.07
9 870 g/t lime 100 g/t PAX
148 g/t MIBC
10.2 55.6 80.8 7.82 66.65 17.8 72.4 91.6 – 5.82 43.3 1.43 8.38
10 1.36 kg/t H2SO4
100 g/t PAX 82 g/t MIBC
9.6 53.7 77.9 7.61 83.41 19.1 73.1 86.6 – 5.20 46.6 1.35 10.24

Pennstrom Consulting Easton Process Consulting, Inc.
70
Table 16.11 Summary of Effect of Grind on Flotation
Concentrate Cal. Head, g/T
5 Minutes 15 Minutes Recovery % Grade, g/t Recovery % Grade, g/t
Test No.
Grind P80, mesh
Wt. Au Ag Au Ag Wt. Au Ag Au Ag
Au
Ag
6 100 7.8 43.0 80.9 8.16 86.41 14.8 60.1 91.3 6.02 51.4 1.48 8.337 150 8.6 47.1 62.2 7.61 79.17 14.8 66.3 75.0 6.20 55.3 1.39 10.971 200 12.4 52.7 45.7 5.94 51.17 23.7 73.9 57.6 4.36 33.8 1.40 13.948 270 10.3 42.1 68.4 6.31 62.08 22.4 63.9 80.0 4.41 33.5 1.55 9.39
Pennstrom Consulting Easton Process Consulting, Inc.
71
16.14 AMDL Sulfide Ore Additional Metallurgical Testing, 20074
The third metallurgical testing program was undertaken with the same objectives as the earlier study, to determine the best processing option to recover gold from sulfide composite samples. RDi received drill core rejects from three holes, namely CCD 103, CCD 106 and CCD 107. The samples were sorted out by lithology into two main types: Composite 1-Metasediments and Composite 2-Diorites. The samples were crushed to nominal 6 mesh, blended, and split into 1-kg charges. A 1-kg charge of each composite was pulverized to 150 mesh and representative samples were split out for analyses of gold and silver using 1-assay-ton fire assay procedure, and for assays for arsenic, copper, and total sulfur. The samples were also analyzed by x-ray fluorescence for different elements. The results are reported in Tables 16.12 and 16.13. The results indicate the following:
• The metasediment composite (Composite No. 1) assayed 2.95 g/t Au, 0.3046 per cent As, 512 ppm Cu and 4.27 per cent total sulfur.
• The diorite composite (Composite No. 2) assayed 5.76 g/t Au, 6.38 g/t Ag, 0.579 per cent As,
5220 ppm Cu and 11.62 per cent total sulfur. The two composite samples were submitted for mineralogical study to characterize the sulfide minerals. The study indicated that the predominant sulfide minerals in the panned metasediments sample were pyrite (80%), marcasite (15%), arsenic pyrite (5%), and trace amounts of arsenopyrite, chalcopyrite, digenite, and gold. The predominant sulfide minerals in the panned diorite samples were pyrite (90%), chalcopyrite (6%), sooty chalcocite (2%), sphalerite (1%), arsenopyrite (1%), and trace amounts of molybdenite. Native gold was not detected. The composite samples had an average hardness based on Bond’s ball mill work indices of 12.92 and 12.04 for Composite 1 and 2, respectively. Diagnostic leaching studies indicated that the gold ore was refractory to direct cyanide leaching. Approximately 11 per cent of the gold was free milling and 72 per cent to 80 per cent was associated with sulfides. A series of scoping flotation tests were designed to evaluate the effect of reagents and process parameters on gold recovery in the flotation concentrate. The test results, summarized in Tables 16.14 and 16.15, indicate that 74.8 per cent to 92.3 per cent of the gold can be recovered in a rougher concentrate with a weight recovery of 32 per cent to 44 per cent. The flotation process employed a simple reagent suite consisting of potassium amyl xanthate (PAX) and methyl isobutyl carbonal (MIBC) and a primary grind of P80 of 100 mesh. Direct cyanidation of ore ground to fine sizes indicated that the gold ore was refractory and needed to be oxidized prior to cyanide leaching (Table 16.16). Hence, it was reasonable to conclude that the flotation concentrate would also have to be oxidized prior to cyanide leaching. 4Metallurgical Testing of Sulfide Ore Samples from Cöpler Prospect, Turkey: RDi Report dated February 12, 2007.

Pennstrom Consulting Easton Process Consulting, Inc.
72
The composite ore samples were ground to P80 of 200 mesh and subjected to reducing roast at 425 ̊C or reducing roast followed by oxidizing roast at 625 ̊C. The products were cyanide leached. The gold extraction ranged from 57 per cent to 71 per cent (Tables 16.17 and 16.18) despite the fact that over 90 per cent of the sulfur was oxidized. The ground ore at P80 of 200 mesh was pressure oxidized at 200 ̊C and 400 psi for varying times. The oxidized ore was washed and then cyanide leached for 48 hours. The test results given in Table 16.19 yielded ± 90 per cent of gold extraction with over 80 per cent sulfur oxidization. Majority of the gold was extracted in 6 hours of cyanide leaching. It is reasonable to conclude based on these results that the best technical process for recovering gold from these refractory ores is pressure oxidation followed by cyanidation of the whole ore.
Table 16.12 Head Analyses of Composite Samples
Assay Elements Composite 1
(MTS) Composite 2 (DIORITE)
Au, g/t 2.95 5.76 Ag, g/t <1.71 6.38 As, % 0.3046 0.5792
Cu, ppm 512 5220 STotal, % 4.27 11.62
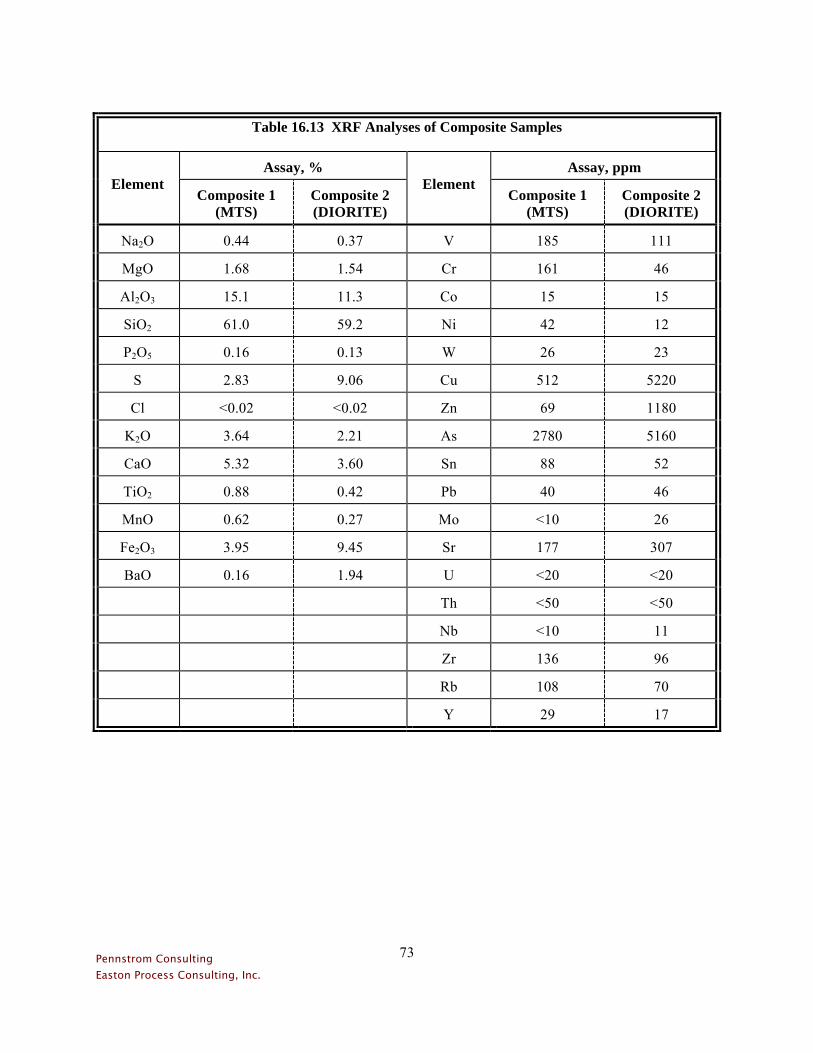
Pennstrom Consulting Easton Process Consulting, Inc.
73
Table 16.13 XRF Analyses of Composite Samples
Assay, % Assay, ppm Element
Composite 1 (MTS)
Composite 2 (DIORITE)
Element
Composite 1 (MTS)
Composite 2 (DIORITE)
Na2O 0.44 0.37 V 185 111
MgO 1.68 1.54 Cr 161 46
Al2O3 15.1 11.3 Co 15 15
SiO2 61.0 59.2 Ni 42 12
P2O5 0.16 0.13 W 26 23
S 2.83 9.06 Cu 512 5220
Cl <0.02 <0.02 Zn 69 1180
K2O 3.64 2.21 As 2780 5160
CaO 5.32 3.60 Sn 88 52
TiO2 0.88 0.42 Pb 40 46
MnO 0.62 0.27 Mo <10 26
Fe2O3 3.95 9.45 Sr 177 307
BaO 0.16 1.94 U <20 <20
Th <50 <50
Nb <10 11
Zr 136 96
Rb 108 70
Y 29 17

Pennstrom Consulting Easton Process Consulting, Inc.
74
Table 16.14 Results of Scoping Flotation Study for Composite No. 1 (MTS)
5 Minutes 10 Minutes 15 Minutes
Recovery % Grade Recovery % Grade Recovery % Grade
Test No.
Process Conditions
Wt. Au g/t Au Wt. Au g/t Au Wt. Au g/t Au
Cal. Head g/t Au
1. P80=100 mesh PAX: 100 g/t MIBC: 66 g/t
18.1 64.2 8.37 26.0 82.7 7.49 33.1 92.3 6.58 2.36
2. P80=100 mesh AP3477: 55 g/t
PAX: 75 g/t MIBC: 57 g/t
12.0 19.0 4.66 32.9 71.7 6.41 41.8 80.9 5.68 2.93
3. P80=200 mesh PAX: 100 g/t MIBC: 66 g/t
18.3 54.0 8.44 26.7 67.5 7.23 32.1 74.8 6.68 2.87
4. P80=200 mesh AP3477: 55 g/t
PAX: 75 g/t MIBC: 57 g/t
21.1 50.5 7.27 33.8 68.7 6.16 45.9 80.4 5.31 3.03

Pennstrom Consulting Easton Process Consulting, Inc.
75
Table 16.15 Results of Scoping Flotation Study for Composite No. 2 (DIORITE)
5 Minutes 10 Minutes 15 Minutes
Recovery % Grade Recovery % Grade Recovery % Grade
Test No.
Process Conditions
Wt. Au g/t Au Wt. Au g/t Au Wt. Au g/t Au
Cal. Head g/t Au
5. P80=100 mesh PAX: 100 g/t MIBC: 66 g/t
26.3 62.8 16.05 31.2 73.8 15.9 35.2 80.8 15.43 6.72
6. P80=100 mesh AP3477: 55 g/t
PAX: 75 g/t MIBC: 57 g/t
29.0 63.1 13.99 34.5 75.7 14.1 41.1 85.5 13.35 6.42
7. P80=200 mesh PAX: 100 g/t MIBC: 90 g/t
27.0 58.0 13.99 33.1 73.6 14.5 37.9 80.4 13.81 6.52
8. P80=200 mesh AP3477: 55 g/t PAX: 100 g/t MIBC: 57 g/t
26.4 54.3 13.44 36.7 77.3 13.8 44.4 86.0 12.65 6.54

Pennstrom Consulting Easton Process Consulting, Inc.
76
Table 16.16 Cyanide Leach Test Results for Whole Ore Samples
Reagent Consumption,
kg/t
Test No.
Grind P80, Mesh
Leach Time,
hrs
Extraction % Au
Residue g/t Au
Cal. Head g/t Au
NaCN Lime
Composite No. 1 (MTS)
1 100 48 7.7 2.54 2.75 2.912 2.225
2 200 48 6.7 2.67 2.86 3.060 2.229
3 400 48 7.0 2.61 2.81 4.126 2.205
4 15 microns 48 14.6 2.33 2.73 18.738 1.688
Composite No. 2 (DIORITE)
5 100 48 9.0 5.90 6.48 3.547 2.205
6 200 48 10.3 5.90 6.57 5.178 2.172
7 400 48 12.6 5.76 6.59 11.334 2.177
8 15 microns 48 11.2 5.90 6.65 18.105 1.687
Table 16.17 Summary of Results for Leaching Following Reducing Roast @ 425 ̊C (P80=200
Mesh)
Test No.
Reducing Roast, hrs
Extraction Au (48 hrs)
Residue g/t Au
Calculated Head g/t Au
% Oxidation
Composite No. 1 (MTS)
11 1 17.4 2.66 3.22 25.3
12 2 51.5 1.65 3.40 62.1
13 4 71.3 1.03 2.29 94.1
Composite No. 2 (DIORITE)
17 1 28.3 4.80 6.70 16.9
18 2 46.7 3.70 6.94 27.1
19 4 57.8 2.85 6.76 60.3

Pennstrom Consulting Easton Process Consulting, Inc.
77
Table 16.18 Summary of Results for Leaching Following 2 Stage Roast
Test No.
Oxidizing Roast, hrs
Extraction Au (48 hrs)
Residue g/t Au
Calculated Head g/t Au
% Oxidation
Composite No. 1 (MTS) 14 1 72.9 0.93 3.43 99.1 15 2 71.1 0.96 3.32 97.2 16 4 68.3 1.03 3.25 98.9
Composite No. 2 (DIORITE) 20 1 60.1 2.85 7.15 81.8 21 2 66.4 2.43 7.24 95.5 22 4 67.4 2.30 7.05 99.8
Note: Reducing Roast 2 hrs @ 425 ̊C Oxidizing Roast @ 625 ̊C.
Table 16.19 Summary of Results for Pressure Oxidation followed by Cyanidation
Test No.
Pressure Oxidation,
hrs
Extraction % Au
(48 hrs)
Residue g/t Au
Calculated Head g/t Au
% Oxidation
Composite No. 1 (MTS)
23 0.5 75.1 0.93 3.72 64.6
24 1.0 90.1 0.34 3.44 83.4
25 2.0 89.6 0.34 3.26 83.0
Composite No. 2 (DIORITE)
26 0.5 74.1 2.06 7.95 19.4
27 1.0 90.0 0.89 8.86 80.6
28 2.0 89.9 0.75 7.40 95.2
Note: P. Oxidation at 200 ̊C and 400 psi Primary Grind P80=200 mesh.

Pennstrom Consulting Easton Process Consulting, Inc.
78
16.15 Conceptual Process Flowsheet
Based on the scoping metallurgical test work, a conceptual process flowsheet has been proposed for the recovery of gold from the sulfide ore. The process flowsheet is given in Figure 16.1. The high grade gold ore assaying over 3.1 g/t Ag and 4.6 per cent total sulfur would be direct feed to pressure oxidation autoclaves following grinding. The low-grade ore assaying 1.81 g/t Au and 2.2 per cent total sulfur which is uneconomical as feed to pressure oxidation would be ground and floated to increase the sulfide sulfur content and the gold content of the concentrate. The flotation concentrate will be significantly higher in sulfide sulfur than high grade material and will increase the sulfide sulfur content of the feed to autoclaves. The rougher or cleaner concentrate would be blended with the high-grade feed material and fed to the pressure oxidation autoclaves. Pressure oxidized material would be treated in a counter-current decantation (CCD) thickener circuit, washed and subjected to cyanidation for gold extraction. The following assumptions have been made regarding the recoveries and grades of concentrates:
• The flotation process will recover ± 85 per cent of the gold and ± 90 per cent of the sulfur in approximately 10.77 per cent of the weight.
• Cyanidation following pressure oxidation will extract 95 per cent of the gold in the feed.
The assumptions are based on limited test work and experience with extensive test work completed on similar ores from other properties. However, additional studies need to be undertaken to confirm if these assumptions are valid or not.
HIGH-GRADEGOLD ORE
GRINDING
PREACIDIFICATION
PRESSUREOXIDATION
CCDCIRCUIT
CYANIDATION
CYANIDEDESTRUCTION
TAILINGS
NEUTRALIZATION TAILINGS
LOW-GRADEORE
GRINDING
FLOTATIONCONC
TAILINGS
Au RECOVERY
Figure 16.1 Simplified Process Flow Sheet

Pennstrom Consulting Easton Process Consulting, Inc.
79
16.16 Additional Metallurgical Test Work
Preliminary scoping metallurgical studies have resulted in the development of a conceptual process flow sheet for the sulfide ore from Cöpler deposit in Turkey. Due to limited process design data, assumptions had to be made based on test work for other similar properties in order to determine order-of-magnitude capital and operating costs for the project. RDi recommends the following additional test work be undertaken for the deposit: • Obtain representative high-grade sulfide ore from the various mining zones and lithologies for
testing to develop and confirm process design criteria for the pressure oxidation and cyanidation processing unit operations.
• Obtain representative low-grade sulfide ore from the various mining zones and lithologies for
testing to develop and confirm process design criteria for the flotation process. • Following optimization of the flotation process, concentrate should be generated and the mixture
of high-grade ore and concentrate should be tested to develop and confirm process design criteria for the pressure oxidation and cyanidation processing unit operations.
Copper Recovery Copper recovery from the process solution has not been evaluated in this study pending further resource development. The sulfide ore is projected to assay an average 0.09 per cent Cu. Future testing should incorporate copper recovery from the sulfide oxidation products. Due to the low grade of the ore, SX-EW technology is not warranted for copper recovery due to high capital and operating costs. There are several alternative processes including cementation, hydrogen sulfide precipitation, copper sulfate crystallization and copper hydroxide precipitation. The iron cementation process is one alternative that is simple and relatively cheap to build and operate. An order-of-magnitude capital cost for an iron cementation process would be $5 million. The operating cost will be dependent on the cost of iron scrap in Turkey. The upside potential for recovering copper exists. However, test work should be undertaken during the next phase of study to generate process data which can be used to determine the upside potential of recovering copper. 16.17 Mass balance and Process Flow Diagrams
16.17.1 Introduction
Process design parameters from the oxide plant were modified for the addition of a mixed whole ore and flotation concentrate sulfide pressure oxidation circuit. The revised design criteria are presented in Attachment A. The design parameters form the basis for a process material and energy balance model developed with the METSIM™ process simulation package. Pertinent stream flow rates and stream components are found in the Material and Energy Balance (M&EB) table in Attachment B. A brief

Pennstrom Consulting Easton Process Consulting, Inc.
80
description of the process flow diagrams (PFD’s) is provided below and may be found in Attachment C. PFD’s show major process streams while the material and energy balance table show all process streams and some process components, sulfuric acid, water, gold, etc. A stream by stream check of the M&EB table with the PFDs will indicate more streams in the table than on the drawings. The METSIM model contains the full complement of streams, chemical species, and model parameters. 16.17.2 Design Criteria And Model Limitations And Exclusions
The appended design criteria and material balance produced from modeling the process have been developed for this preliminary assessment. Process design and equipment sizing assumptions have been made based on previously reported information, industry standards, information provided by third parties, and reasonable assumed values based on industry experience. Pre-feasibility and feasibility study pilot-plant validation of the process, process equipment sizing, and process chemistry is required. Other limitation or exclusions are presented below:
• Validation of information provided by third parties as input to the model is excluded from this scope of work.
• Information on diesel fuel, limestone, lime, and other reagents, compositions, and consumptions will require vendor and pilot-plant validation.
• Gland seal water has been excluded in the water balance. • Heat losses in the leach, CCD, and other areas are estimated as a percent of heat input to the
unit. A final design heat balance will be required. • Evaluation of circulating magnesium, manganese, silica, chloride, and other elements will
require pilot plant data to confirm distributions. • Evaluation of post-autoclave slurry conditioning time, temperature, and subsequent gold and
silver dissolution will require pilot-plant validation. • Potential activation of organic carbon in the pressure leach circuit and post oxidation preg-
robbing characteristics of the ore will require additional development to validate gold and silver recovery.
16.17.3 Major Design Criteria
Design criteria assumptions for the sulfide process are detailed in Attachment A with key parameters shown below: Flotation Ore rate, tpd 5,000 Operating hours , hpa 7,884 Percent Utilization, % 90 Ore feed rate, tph 231.5 Flotation Feed Ore Grade Au, gpt 1.81 Total Sulfur Content, wt.% 2.20 Sulfide Content, wt% 1.94 Carbonate Content, wt% as CO2 2.0 Flotation Mass Pull, % 10.8 Flotation Gold Recovery, % 85 Flotation Sulfide Recovery, % 90

Pennstrom Consulting Easton Process Consulting, Inc.
81
Direct Feed Ore rate, tpd 3,000 Operating hours, hpa 7,884 Percent Utilization, % 90 Ore feed rate, tph 138.9 Direct Feed Ore Grade Au, gpt 3.11 Total Sulfur Content, wt.% 4.60 Sulfide Content, wt% 4.04 Carbonate Content, wt% as CO2 2.0 Sulfide Oxidation, % 90 Gold Dissolution, % 95 Overall Gold Recovery, % 87.9 16.17.4 Process Flow Diagrams (PFD’s)
Crushing and Flotation Feed Milling Reference: PFD-F-010 The existing crushing and milling facilities will be utilized with additional equipment to facilitate closed circuit grinding, and whole ore flotation. The oxide plant cyclone overflow will report to a new sulfide rougher and cleaner flotation circuit. Rougher flotation tails are pumped to a new tailings high density thickener. Rougher flotation concentrate is further upgraded in a cleaner flotation circuit to produce a bulk sulfide concentrate. Cleaner flotation tails return to the rougher flotation circuit. Flotation concentrate enters a new concentrate thickener. Flocculent added to the thickener at a concentration of 5 gpl is added at a rate of 15 g/ton underflow solids. Concentrate thickener overflow is recycled to a new mill solution tank. Concentrate thickener underflow is pumped to a new pre-acidification agitated tank circuit. Direct Ore Milling Reference: PFD-F-012 A new milling facility will process higher grade sulfide gold ore at a rate of 3,000 tpd. The new facility will be equipped for closed circuit grinding, cyclone overflow thickening, and solution recovery in a mill solution tank. Pre-acidification, Pressure Leach and CCD Reference: PFD-F-020 (All New Equipment) Pre-acidification Direct feed grinding thickener underflow and flotation concentrate are pumped into the first of three agitated tanks and are combined with CCD No. 1 Overflow to react sulfuric acid with carbonate in the ore. Pre-acidification tank discharge is thickened. The thickener underflow is pumped to the pressure leach feed storage tanks. Thickener overflow is pumped to solution limestone neutralization tanks. Flocculent added to the thickener at a concentration of 5 gpl is added at a rate of 30 g/ton underflow solids.

Pennstrom Consulting Easton Process Consulting, Inc.
82
Pressure Oxidation The pressure oxidation circuit consists of feed tanks, high pressure positive displacement pumps, and a 6-compartment brick lined pressure leach autoclave. Autoclave agitators disperse oxygen into the slurry. The slurry is flashed from an operating temperature of 225 oC and 3200 kPa (465 psia) in a single stage flash letdown vessel. Flash steam, entrained slurry, and autoclave vent gases are further quenched in a brick lined flash vapor quench vessel. Pressure leach autoclave gases that vent to the atmosphere are scrubbed in a venturi scrubber to remove sulfuric acid mist. Oxygen for sulfide oxidation is purchased “over-the-fence”. Steam for heating the autoclave is supplied by a new boiler located in the utilities area. CCD Thickening Circuit Slurry from the flash vessel is held in CCD storage tanks that overflow into the first of three CCD thickeners. The first thickener acts as an acid decant thickener where the sulfuric acid concentration and flow rate are adjusted to meet sulfuric acid and percent solids design parameters in the pre-acidification circuit. The remaining CCD thickeners wash entrained sulfuric acid from the slurry with reclaim solution from the tailings dam. CCD overflow solution from the second thickener is split; a portion sent to the first CCD thickener as wash solution and the balance pumped to the solution limestone neutralization circuit. Slurry from the third CCD thickener underflow is pumped to the slurry lime neutralization tank prior to cyanide leaching. Flocculent added to all CCD thickeners at a concentration of 5 gpl is added at a rate of 50, 30, 30 g/ton underflow solids in each thickening stage, respectively. Solution and Slurry Neutralization, Gold Recovery Reference: PFD-F-030 Solution Limestone Neutralization Acidic solutions from the pre-acidification thickener, first CCD thickener, and second CCD thickener overflows are combined with milled limestone in three agitated tanks and thickened. Sulfuric acid is partially neutralized by reaction with limestone. Limestone neutralization thickener underflow is combined with CCD No. 3 thickener underflow for additional pH adjustment in the slurry lime neutralization circuit. Crushed limestone from the heap leach pads will be processed in a new closed circuit grinding process that will feed limestone to the neutralization tanks at a P80 of 74 microns. Solution Lime Neutralization Solution from the limestone neutralization thickener is treated with slaked lime to precipitate the remaining sulfuric acid and soluble metals as hydroxides. Treated solution with 2-3 wt% solids is pumped to the tailings facility where the solids settle and the solution is decanted for recycle to the CCD thickeners.

Pennstrom Consulting Easton Process Consulting, Inc.
83
Slurry Lime Neutralization, Gold Leach, and Recovery Combined CCD No. 3 underflow slurry and limestone neutralization slurry are treated with slaked lime to adjust the pH for cyanide leaching. The existing oxide leach plant, CIP, and gold recovery circuit will be utilized as designed to recovery gold as doré. Tailings and Reclaim Facility The tailings facility will be a conventional type facility that will permit solids settling and reclaim of the solution for use in the CCD circuit. A new flotation tailings thickener has been provided. Reagents, Utilities and Water Balance Reference: PFD-F-040 Boiler A new high pressure boiler will provide steam for starting the autoclave and oxygen plant as required. The boiler will provide 500 psig steam at a rate of 20 tph. Cooling Water Cooling water is supplied from a new cooling tower to the oxygen plant and other process areas at 25°C. Cooling water returns at 35°C. Cooling tower blowdown is pumped to the tailings facility. Demineralized Water Demineralized water will be utilized in the autoclave seal water system, autoclave quench system, and as feed to the high pressure boiler. A pretreatment/reject water ratio of 33 per cent has been assumed. Demineralized reject water returns to the tailings facility. Flocculent Flocculent is delivered to different process areas at a concentration of 5 gpl from new mixing and storage systems. Limestone Limestone reclaimed from the heap leach pads is ground to a P80 of 74 microns in a closed circuit grinding system. Limestone slurry is stored in an agitated tank for addition to the solution neutralization circuit. Lime Slaking New lime slaking facilities hydrate lime at a rate of 8.6 tph. Reagents The following assumptions were made for reagent compositions used in the model:
• Flocculant is delivered dry as a 100-wt% product. • Hydrochloric acid is delivered as a 36-wt% solution. • Lime is delivered dry as a 80-wt% active CaO. • Limestone is reclaimed from the leach pad with 20% calcium carbonate. • NaHS is delivered dry as a 72-wt% solid. • Sodium Hydroxide is delivered as a 50-wt% solution.

Pennstrom Consulting Easton Process Consulting, Inc.
84
Process Water Process water is supplied from existing well facilities at a rate of 246 m3/hr.

Pennstrom Consulting Easton Process Consulting, Inc.
85
17.0 MINERAL RESOURCES AND MINERAL RESERVES ESTIMATES
This section of the report has been copied from the 2007 IMC Report and has been reviewed by the initial author for completeness and accuracy. The 2007 IMC Report, including the Çöpler project mineral resources and mineral reserves estimates can be obtained from SEDAR (www.sedar.com) in the report titled “Technical Report for Çöpler Gold Project”, by Independent Mining Consultants, Inc.; March 2, 2007 as Amended 30 April, 2007. The information contained within the above referenced report in section “17.0 Mineral Resources and Mineral Reserve Estimates” has not changed and is provided in the following text. A new table, Table 17.2 in section 17.7, has been added to this report to further delineate the amount of sulfide material included in the mineral reserves in the previously mentioned technical report. 17.1 Block Model
The mineral resources for the Çöpler deposit were based on a block model developed by IMC during September and October of 2006. That model includes grade estimates for gold, silver, and several associated minerals. The associated mineral grades are of value in process design, but do not contribute economic benefit to the current determination of resources. All three deposits are contained within a single block model. The block model size and location within the UTM coordinate system is as follows: Minimum (m) Maximum (m) Number of
Blocks Block Size (m)
Easting 457,600 461,200 240 15
Northing 4,363,000 4,365,400 160 15 Elevation 800 1,500 140 5 Rock types were interpreted on paper section by Anatolia geologists at site. That information was transferred to paper plans by IMC technicians and verified against the drill data on plan. The plans were digitized on 5 meter bench intervals and codes were assigned to model blocks on a whole block basis. The resulting whole block interpretation of geology was checked against the drill hole log data and the interpreted sections to confirm proper assignment. The rock type codes assigned to the model were:
Code Description 7 Gossan 2001 Diorite 3007 Marble 3012 Massive Pyrite 3018 Metasediments 3020 Manganese Oxide Zone

Pennstrom Consulting Easton Process Consulting, Inc.
86
Drill hole assay intervals were cut prior to block compositing at the following levels:
Zone Gold Cut Value Silver Cut Value Main 25 gm/t 150 gm/t Manganese 30 gm/t 350 gm/t Marble 40 gm/t 100 gm/t
Drill hole assay data was composited to 5m bench intercept composites. Drill holes flatter than 30 degrees were composited to 5m down hole composites rather than bench intercept values. The composites were back assigned the same rock type as the digitized geologic shape on the bench. 17.2 Block Grade Estimation
Within each of the three zones, grades were estimated for gold, silver, sulfur, copper, arsenic, and manganese were estimated. Economic credit was given to gold and silver recovery, and sulfur was used to control process recovery. Consequently, this section will discuss the ordinary linear kriging with search parameters consistent with the gold and silver estimates. Gold estimation in all deposits used an indicator boundary to limit the extrapolation of ore grade values. A discriminator of 0.20 gm/t gold was used based on the composite values. Ordinary linear kriging was applied to the composites indicators with the 0.20 gm/t discriminator. The resulting indicator fractions were then contoured at the 50% probability level to establish a boundary between blocks with greater than 50% chance of being above 0.20 gm/t and those that were likely less than 0.20 gm/t. Within the Manganese Mine zone, a similar indicator was applied to the silver within the diorite and marble rock units based on a 0.70 gm/t silver discriminator. Table 17.1 summarizes the kriging and search parameters used to set the indicator grade boundaries within each of the rock types in each of the 3 deposits. Once the indicator limits were set, grades were estimated within each rock type and indicator zone using ordinary linear kriging. In most cases the rock type boundaries and the high grade vs low grade indicators were all treated as hard boundaries for estimation. The exception was within the Main zone where the diorite and metasediments were treated as one estimation population. Table 17.2 summarizes the grade estimation parameters for gold and silver. Oxide vs sulfide codes for process recovery assignment were established based on the review of the cyanide amenability tests completed by Anatolia. Samples with less than 2% sulfur generally showed good cyanide recovery and those with greater than 2% sulfur were nominally refractory to cyanide treatment. IMC assigned an oxde vs sulfide process code to the blocks based on a 2% sulfur discriminator and kriging of the sulfur composite indicators. Rock types were not respected in this estimate. Blocks with greater than 50% probability of being above 2% sulfur within the Metasediments and Diorite were coded as “sulfide” for process response. The following rock types were always coded as oxide or cyanide amenable:

Pennstrom Consulting Easton Process Consulting, Inc.
87
Oxide Rocks: Marble, Gossan, and Manganese Oxide The following rock types were always coded as sulfide:
Sulfide Rocks: Massive Pyrite
The indicator process described above was consequently applied to the metasediments and the diorite. Table 17.1 illustrates the kriging parameters applied to the sulfur indicator.
Table 17.1 Kriging Parameters for Indicator Grade Breaks
Major Axis Range Search Spherical Variogram Area, Metal Discriminator
Discriminator Bearing Plunge Major Inter. Minor Major Inter. Minor Nugget Total Sill
Main Zone Gold Oxide Dio+Metased 0.2 gm/t 338 10 Dn 193 159 50 110 76 15 0.100 0.245 Sulfide Dio+Metased 0.2 gm/t 338 0 193 159 50 110 76 15 0.100 0.245 Marble 0.2 gm/t 338 0 193 159 50 110 76 15 0.100 0.245 Manganese Mine Zone Gold Diorite 0.2 gm/t 338 22.5 Dn 175 120 120 175 120 15 0.103 0.265 Marble 0.2 gm/t 247.5 45 Dn 260 150 150 260 150 15 0.082 0.256 Manganese Mine Zone Silver Marble 0.7 gm/t 225 45 Dn 250 140 120 250 140 15 0.057 0.146 Diorite 0.7 gm/t 275 45 Dn 160 140 85 160 140 15 0.125 0.299 Marble Contact Zone Diorite 0.2 gm/t 45 0 170 50 50 60 30 15 0.259 0.370 Marble 0.2 gm/t 45 0 170 50 50 60 30 15 0.259 0.370 Metasediments 0.2 gm/t 45 0 170 50 50 60 30 15 0.259 0.370 Sulfur Indicator for Oxide vs Sulfide, All Deposits Main Zone 2% Sulf 0 10 Dn 250 250 20 200 200 12.5 0.100 1.000 Marble + Manganese 2% Sulf 0 0 250 250 20 200 200 12.5 0.100 1.000 Composite Count Max MininumGold and Silver 20 1Sulfur 10 1

Pennstrom Consulting Easton Process Consulting, Inc.
88
Table 17.2 Kriging Parameters for Block Grade Estimation
Major Axis Range Search Spherical Variogram Area, Metal Discriminator Bearing Plunge Major Inter. Minor Major Inter. Minor Nugget Total Sill
Main Zone Gold Oxide Dio+Metased 338 10 Dn 106 76 25 110 76 15 0.790 2.700 Sulfide Dio+Metased 338 0 106 76 25 110 76 15 0.790 2.700 Gosson 338 0 106 76 25 110 76 15 0.790 2.700 Marble 338 0 106 76 25 110 76 15 0.790 2.700 Manganese Mine Zone Gold
Diorite 338 22.5 Dn 115 100 15 115 100 15 1.523 2.410 Marble 247.5 45 Dn 200 100 75 200 100 15 1.349 2.360 Manganese Oxide 338 0 115 100 75 115 100 15 1.523 2.410 Massive Pyrite 338 0 115 100 75 115 100 15 1.523 2.410 Metasediments 338 0 115 100 75 115 100 15 1.523 2.410 Marble Contact Zone Gold
Diorite 45 0 170 50 50 60 30 15 0.259 0.370 Marble 45 0 170 50 50 60 30 15 0.259 0.370 Metasediments 45 0 170 50 50 60 30 15 0.259 0.370 Main Zone Silver
Oxide Dio+Metased 22 10 Dn 175 120 25 110 76 15 11.3 31.4 Sulfide Dio+Metased 22 0 175 120 25 110 76 15 11.3 31.4 Gosson 22 0 175 120 25 110 76 15 11.3 31.4 Marble 22 0 175 120 25 110 76 15 11.3 31.4 Manganese Mine Zone Silver
Diorite 270 45 Dn 130 55 15 130 55 15 136.6 223.0 Marble 225 45 Dn 150 100 100 150 100 15 99.0 249.0 Manganese Oxide 270 0 130 55 130 130 55 15 136.6 223.0 Massive Pyrite 270 0 130 55 130 130 55 15 136.6 223.0 Metasediments 270 0 130 55 130 130 55 15 136.6 223.0 Marble Contact Zone Silver
All Rock Types 45 0 175 12 25 60 30 15 11.3 31.4
Composite Count Max MininumGold and Silver 20 1

Pennstrom Consulting Easton Process Consulting, Inc.
89
17.3 Specific Gravity Data
IMC was provided with an Excel file that contained results for 633 specific gravity tests during 2005 that formed the base data for the block densities assigned to the model. For each test, the hole name, sample depth, lithology code, orebody code, three weight measurements, and the specific gravity were recorded. The specific gravity field did not include the calculation equation, only the specific gravity value. IMC could, however, back out the calculation methods used to obtain the recorded specific gravities. The procedure for block density assignment to the model was not changed from 2005 to 2006. Two different test methods were represented in the file:
1. The first 251 measurements were conducted by Rio Tinto personnel. Upon receipt of the sample at the lab a wet weight and a submerged weight were recorded. The sample was then dried and weighed to get the dry weight. Specific gravity was calculated as
Dry weight / (wet weight – submerged weight)
2. The remaining measurements, on 382 samples, were performed by Anatolia personnel. The
sample as received from the lab was dried and weighed to get the dry weight. The sample was coated in wax and weighed to obtain a waxed weight and then submerged in water to get the submerged weight. Specific gravity is then calculated as
Dry wgt / (waxed wgt – submerged wgt – (waxed wgt– dry wgt)/0.86)
Where 0.86 is the wax specific gravity.
IMC reviews indicate that the two different methods are giving comparable results. To analyze the specific gravity data, IMC sorted the data by ore deposit and for each deposit, plotted graphs of specific gravity versus depth by rock type. The plots will show depth versus density relationships and also show outliers in the data. IMC discarded apparent outliers and used the remaining data to calculate average specific gravities by rock type for each deposit. As was discussed above, the Main Zone orebody had apparent depth versus specific gravity relationships for diorite and metasediments that were accounted for in the density models used by IMC. There were no adjustments made between the specific gravity measurements and block densities assigned to the model. As an example, if there were known voids in the rock mass at a scale larger than is measured with the specific gravity samples, it might be appropriate to reduce measured specific gravities a few percent to obtain bulk densities. This was not done for the Çöpler deposits.

Pennstrom Consulting Easton Process Consulting, Inc.
90
Table 17.3 Model Density Assignment
Main Zone
Rock Type Dry Density Tonnes / Cubic Meter
Marble 2.577 Gossan 3.191 Diorite
Less than 10m below topo 2.065 Greater than 10m below topo 2.327
Metasediments Less than 20m below topo 2.236 Blocks 20 to 40m deep 2.313 Blocks 40 to 60m deep 2.393 Blocks 60 to 80m deep 2.506 Blocks greater than 80m deep 2.548
Manganese Mine Zone
Rock Type Dry Density Tonnes / Cubic Meter
Marble 2.608 Manganese Oxide 2.608 Diorite 2.374
Marble Contact Zone
Rock Type Dry Density Tonnes / Cubic Meter
Marble 2.565 Gossan 2.565 Metasediments 2.526 Diorite
Less than 10m below topo 2.065 Greater than 10m below topo 2.327

Pennstrom Consulting Easton Process Consulting, Inc.
91
17.4 Resource Classification Code
The resource classification was done as follows for the Çöpler orebodies. A special gold grade kriging was done, specifically for the purpose of resource classification. Note that the gold grade from this kriging was not used, but the number of samples and kriging standard deviation from it were used for the resource classification.
1. A special kriging was done as follows. The maximum search radii for the kriging were set to 67% (2/3rds) of the variogram range. The variogram model was also normalized to a sill value of 1.0 and a nugget of 0.25. A maximum of one composite per drill hole was allowed in the kriging and population boundaries were ignored. This procedure basically counts the number of holes within 2/3 of the variogram range and also calculates a kriging standard deviation with this data. These values (number of holes and kriging standard deviation) are stored in the model.
2. Probability plots of block kriging standard deviations by number of holes are plotted.
3. Initially, all blocks with kriged gold grades are set to a default of inferred resource. Note that for
blocks with the closest hole more than 2/3rd of the variogram range that is their final lassification. They will not be examined in the special kriging.
4. The plots of kriging standard deviations indicate that blocks estimated with four, five, or six plus
holes generally have standard deviations less than 0.9. Blocks kriged with four or more holes within 2/3rds of the variogam range are classified as indicated resource.
5. Blocks kriged with three holes and with a kriging standard deviation less than 0.9 are classified as
indicated resource. This is about 92% of the blocks kriged with three holes. Blocks kriged with two holes and with a kriging standard deviation less than 0.8 are also classified as indicated resource. This is about 40% of the blocks kriged with only two holes. Blocks kriged with one hole and with a kriging standard deviation less than 0.7 (5% of these blocks) are also classified as indicated resource.
6. Blocks with a kriging standard deviation less than 0.5 are then re-classified as measured resource.
Note from the graph that one hole cannot develop measured resource and blocks kriged with two and three holes will develop only minimal quantities of measured resource.
Visually the described method appears to give good results. Indicated resources are not extrapolated far outside of the drilling data and measured resources are developed only in well-drilled areas. Blocks kriged with one and two holes can only generate indicated resources when close to the holes. 17.5 Floating Cones
The floating cone algorithm was applied to the Çöpler block model as a guide to the development of the mine plan and to establish the mineral resource. Metal prices of $475/ounce gold and $8.00/ounce silver were used to establish both reserves and resources.

Pennstrom Consulting Easton Process Consulting, Inc.
92
Slope angles of 45 degrees were applied to all deposits for the floating cones. Geotechnical work by Turkish contractors indicates that interramp slopes in the range of low to mid 50 degrees are possible in the competent marble rock. The inter-ramp slopes were adjusted downward to 45 degrees to reflect the impact of haul roads on the pit design for the floating cone runs. Mining costs were estimated to be $1.50/tonne of material mined based on preliminary contractor estimates completed during the feasibility study. A general and administration charge of $1.50/tonne of mill ore was applied to mill processed tonnes to provide an estimate to cover fixed annual costs. An incremental haulage cost of $0.0033 per bench per tonne was added to each tonne of material below the 1150 elevation. A bench discount factor of 1% per bench of depth below the 1495 elevation was also applied to approximate the time between waste stripping and ore release. Table 17.4 summarizes the cone pit information used as a guide to the mine plan. The input costs and recoveries on Table 17.4 were based on the results of the feasibility study. Determination of the mine plan and reserve was based on economic value applied to measured and indicated category mineralization only. The floating cone routine was also used to establish a resource pit. The resource was based on the same metal prices as the reserve, but did allow economic benefit to be calculated for the inferred mineralization. In addition, the presence of a sulfide process facility was assumed that would result in 75% process recovery of the refractory sulfides. Table 17.5 summarizes the input data for the resource floating cone.
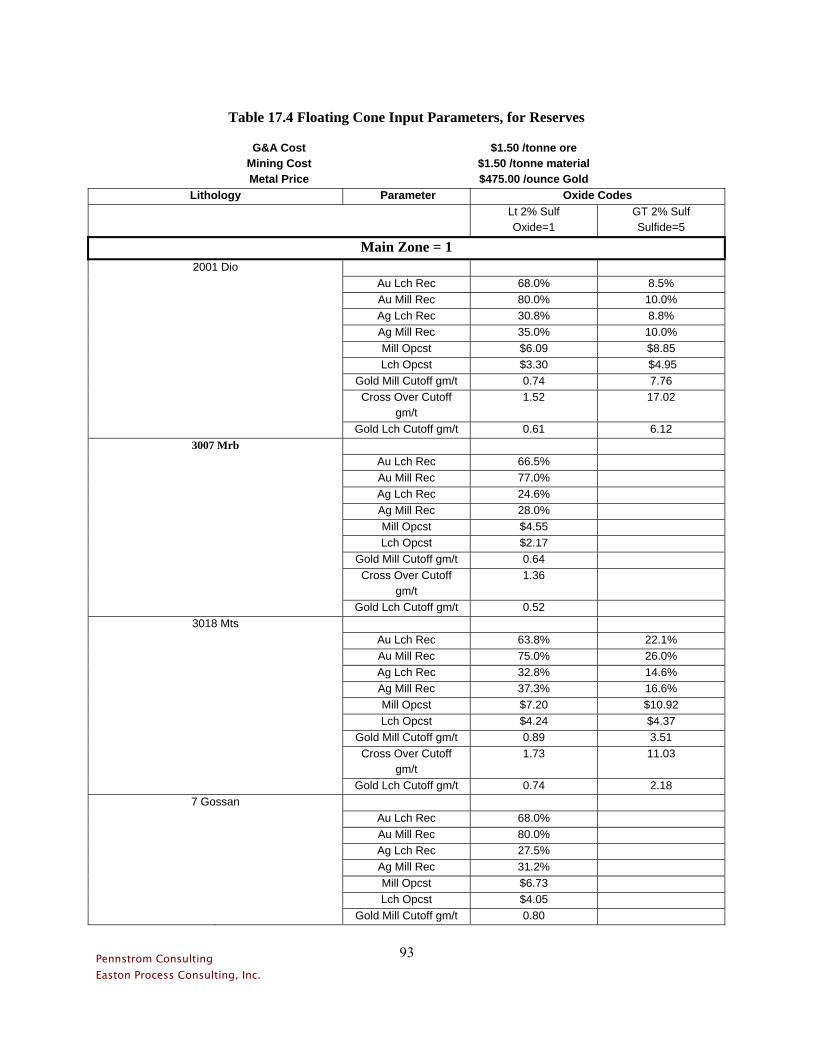
Pennstrom Consulting Easton Process Consulting, Inc.
93
Table 17.4 Floating Cone Input Parameters, for Reserves
G&A Cost $1.50 /tonne ore Mining Cost $1.50 /tonne material Metal Price $475.00 /ounce Gold
Lithology Parameter Oxide Codes Lt 2% Sulf
Oxide=1 GT 2% Sulf Sulfide=5
Main Zone = 1
2001 Dio Au Lch Rec 68.0% 8.5% Au Mill Rec 80.0% 10.0% Ag Lch Rec 30.8% 8.8% Ag Mill Rec 35.0% 10.0% Mill Opcst $6.09 $8.85 Lch Opcst $3.30 $4.95 Gold Mill Cutoff gm/t 0.74 7.76 Cross Over Cutoff
gm/t 1.52 17.02
Gold Lch Cutoff gm/t 0.61 6.12 3007 Mrb
Au Lch Rec 66.5% Au Mill Rec 77.0% Ag Lch Rec 24.6% Ag Mill Rec 28.0% Mill Opcst $4.55 Lch Opcst $2.17 Gold Mill Cutoff gm/t 0.64 Cross Over Cutoff
gm/t 1.36
Gold Lch Cutoff gm/t 0.52 3018 Mts
Au Lch Rec 63.8% 22.1% Au Mill Rec 75.0% 26.0% Ag Lch Rec 32.8% 14.6% Ag Mill Rec 37.3% 16.6% Mill Opcst $7.20 $10.92 Lch Opcst $4.24 $4.37 Gold Mill Cutoff gm/t 0.89 3.51 Cross Over Cutoff
gm/t 1.73 11.03
Gold Lch Cutoff gm/t 0.74 2.18 7 Gossan
Au Lch Rec 68.0% Au Mill Rec 80.0% Ag Lch Rec 27.5% Ag Mill Rec 31.2% Mill Opcst $6.73 Lch Opcst $4.05 Gold Mill Cutoff gm/t 0.80

Pennstrom Consulting Easton Process Consulting, Inc.
94
Table 17.4 Floating Cone Input Parameters, for Reserves
G&A Cost $1.50 /tonne ore Mining Cost $1.50 /tonne material Metal Price $475.00 /ounce Gold
Lithology Parameter Oxide Codes Lt 2% Sulf
Oxide=1 GT 2% Sulf Sulfide=5
Cross Over Cutoff gm/t
1.46
Gold Lch Cutoff gm/t 0.68 3012 Mpy
Au Lch Rec 8.5%
Au Mill Rec 10.0%
Ag Lch Rec 6.0% Ag Mill Rec 7.0% Mill Opcst $8.85 Lch Opcst $4.95 Gold Mill Cutoff gm/t 7.76
Cross Over Cutoff
gm/t 17.02
Gold Lch Cutoff gm/t 6.12
Manganese Pit Zone = 2 2001 Dio
Au Lch Rec 68.0% 29.8% Au Mill Rec 80.0% 35.0% Ag Lch Rec 37.8% 33.9% Ag Mill Rec 43.0% 38.5% Mill Opcst $6.09 $8.85 Lch Opcst $3.30 $4.95 Gold Mill Cutoff gm/t 0.74 2.22 Cross Over Cutoff
gm/t 1.52 4.92
Gold Lch Cutoff gm/t 0.61 1.75 3007 Mrb
Au Lch Rec 74.8% Au Mill Rec 88.0% Ag Lch Rec 27.3% Ag Mill Rec 31.0% Mill Opcst $4.55 Lch Opcst $2.17 Gold Mill Cutoff gm/t 0.56 Cross Over Cutoff
gm/t 1.18
Gold Lch Cutoff gm/t 0.45 3020 Mnx Gossan Au Lch Rec 68.9%

Pennstrom Consulting Easton Process Consulting, Inc.
95
Table 17.4 Floating Cone Input Parameters, for Reserves
G&A Cost $1.50 /tonne ore Mining Cost $1.50 /tonne material Metal Price $475.00 /ounce Gold
Lithology Parameter Oxide Codes Lt 2% Sulf
Oxide=1 GT 2% Sulf Sulfide=5
Included Included Au Mill Rec 81.0% in Mnx in Mnx Ag Lch Rec 6.2%
Ag Mill Rec 7.0% Mill Opcst $6.34 Lch Opcst $4.25 Gold Mill Cutoff gm/t 0.76 Cross Over Cutoff
gm/t 1.13
Gold Lch Cutoff gm/t 0.69 3018 Mts
Au Lch Rec 63.8% 22.1% Au Mill Rec 75.0% 26.0% Ag Lch Rec 32.5% 15.3% Ag Mill Rec 37.0% 17.4% Mill Opcst $7.20 $10.92 Lch Opcst $4.24 $4.37 Gold Mill Cutoff gm/t 0.89 3.51 Cross Over Cutoff
gm/t 1.73 11.03
Gold Lch Cutoff gm/t 0.74 2.18 3012 Mpy
Au Lch Rec 8.5% Au Mill Rec 10.0% Ag Lch Rec 6.0% Ag Mill Rec 7.0% Mill Opcst $8.85 Lch Opcst $4.95
Gold Mill Cutoff gm/t 7.76 Cross Over Cutoff
gm/t 17.02
Gold Lch Cutoff gm/t 6.12
Marble Contact Zone = 3
Au Lch Rec 59.5% 34.0% Au Mill Rec 70.0% 40.0% Ag Lch Rec 32.0% 16.7% Ag Mill Rec 36.3% 19.0% Mill Opcst $6.09 $8.85 Lch Opcst $3.30 $4.95
Gold Mill Cutoff gm/t 0.85 1.94 Cross Over Cutoff
gm/t 1.74 4.26
2001 Dio
Gold Lch Cutoff gm/t 0.69 1.53

Pennstrom Consulting Easton Process Consulting, Inc.
96
Table 17.4 Floating Cone Input Parameters, for Reserves
G&A Cost $1.50 /tonne ore Mining Cost $1.50 /tonne material Metal Price $475.00 /ounce Gold
Lithology Parameter Oxide Codes Lt 2% Sulf
Oxide=1 GT 2% Sulf Sulfide=5
Au Mill Rec 70.0% 40.0%
Au Lch Rec 72.3% Au Mill Rec 85.0% Ag Lch Rec 34.0% Ag Mill Rec 38.7% Mill Opcst $4.55 Lch Opcst $2.17
Gold Mill Cutoff gm/t 0.58 Cross Over Cutoff
gm/t 1.23
3007 Mrb
Gold Lch Cutoff gm/t 0.47
Au Lch Rec 63.8% 8.5% Au Mill Rec 75.0% 10.0% Ag Lch Rec 32.8% 14.6% Ag Mill Rec 37.3% 16.6% Mill Opcst $7.20 $10.92 Lch Opcst $4.24 $4.37
Gold Mill Cutoff gm/t 0.89 9.11 Cross Over Cutoff
gm/t 1.73 28.59
3018 Mts
Gold Lch Cutoff gm/t 0.74 5.68
Au Lch Rec 62.1% Au Mill Rec 73.0% Ag Lch Rec 27.5% Ag Mill Rec 31.3% Mill Opcst $6.73 Lch Opcst $4.05
Gold Mill Cutoff gm/t 0.87 Cross Over Cutoff
gm/t 1.61
7 Gossan Was Called Jasperpoid
Gold Lch Cutoff gm/t 0.74
Au Lch Rec 8.5% Au Mill Rec 10.0% Ag Lch Rec 6.0% Ag Mill Rec 7.0% Mill Opcst $8.85 Lch Opcst $4.95
Gold Mill Cutoff gm/t 7.76
3012 Mpy
Cross Over Cutoff 17.02

Pennstrom Consulting Easton Process Consulting, Inc.
97
Table 17.4 Floating Cone Input Parameters, for Reserves
G&A Cost $1.50 /tonne ore Mining Cost $1.50 /tonne material Metal Price $475.00 /ounce Gold
Lithology Parameter Oxide Codes Lt 2% Sulf
Oxide=1 GT 2% Sulf Sulfide=5
gm/t Gold Lch Cutoff gm/t 6.12

Pennstrom Consulting Easton Process Consulting, Inc.
98
Table 17.5 Floating Cone Input Parameters Resource Pit
with Sulfide Treatment
G&A Cost $1.50 /tonne ore Mining Cost $1.50 /tonne material Metal Price $475.00 /ounce Gold
Lithology Parameter Oxide Codes Lt 2% Sulf
Oxide=1 GT 2% Sulf Sulfide=5
Main Zone = 1
Au Lch Rec 68.0% 8.5% Au Mill Rec 80.0% 75.0% Ag Lch Rec 30.8% 8.8% Ag Mill Rec 35.0% 10.0% Mill Opcst $6.09 $12.47 Lch Opcst $3.30 $4.95
Gold Mill Cutoff gm/t 0.74 1.35 Cross Over Cutoff
gm/t 1.52 0.74
2001 Dio
Gold Lch Cutoff gm/t 0.61 6.12
Au Lch Rec 66.5% Au Mill Rec 77.0% Ag Lch Rec 24.6% Ag Mill Rec 28.0% Mill Opcst $4.55 Lch Opcst $2.17
Gold Mill Cutoff gm/t 0.64 Cross Over Cutoff
gm/t 1.36
3007 Mrb
Gold Lch Cutoff gm/t 0.52
Au Lch Rec 63.8% 22.1% Au Mill Rec 75.0% 75.0% Ag Lch Rec 32.8% 14.6% Ag Mill Rec 37.3% 16.6% Mill Opcst $7.20 $13.64 Lch Opcst $4.24 $4.37
Gold Mill Cutoff gm/t 0.89 1.45 Cross Over Cutoff
gm/t 1.73 1.15
3018 Mts
Gold Lch Cutoff gm/t 0.74 2.18
Au Lch Rec 68.0% Au Mill Rec 80.0% Ag Lch Rec 27.5% Ag Mill Rec 31.2%
7 Gossan
Mill Opcst $6.73

Pennstrom Consulting Easton Process Consulting, Inc.
99
Lch Opcst $4.05 Gold Mill Cutoff gm/t 0.80 Cross Over Cutoff
gm/t 1.46
Gold Lch Cutoff gm/t 0.68
Au Lch Rec 8.5% Au Mill Rec 10.0% Ag Lch Rec 6.0% Ag Mill Rec 7.0% Mill Opcst $8.85 Lch Opcst $4.95
Gold Mill Cutoff gm/t 7.76 Cross Over Cutoff
gm/t 17.02
3012 Mpy
Gold Lch Cutoff gm/t 6.12 Manganese Pit Zone
= 2
Au Lch Rec 68.0% 29.8% Au Mill Rec 80.0% 75.0% Ag Lch Rec 37.8% 33.9% Ag Mill Rec 43.0% 38.5% Mill Opcst $6.09 $12.47 Lch Opcst $3.30 $4.95
Gold Mill Cutoff gm/t 0.74 1.35 Cross Over Cutoff
gm/t 1.52 1.09
2001 Dio
Gold Lch Cutoff gm/t 0.61 1.75
Au Lch Rec 74.8% Au Mill Rec 88.0% Ag Lch Rec 27.3% Ag Mill Rec 31.0% Mill Opcst $4.55 Lch Opcst $2.17
Gold Mill Cutoff gm/t 0.56 Cross Over Cutoff
gm/t 1.18
3007 Mrb
Gold Lch Cutoff gm/t 0.45
Au Lch Rec 68.9% Included Au Mill Rec 81.0% in Mnx Ag Lch Rec 6.2%
Ag Mill Rec 7.0% Mill Opcst $6.34 Lch Opcst $4.25
Gold Mill Cutoff gm/t 0.76 Cross Over Cutoff
gm/t 1.13
3020 Mnx Gossan Included in Mnx
Gold Lch Cutoff gm/t 0.69 3018 Mts

Pennstrom Consulting Easton Process Consulting, Inc.
100
Au Lch Rec 63.8% 22.1% Au Mill Rec 75.0% 75.0% Ag Lch Rec 32.5% 15.3% Ag Mill Rec 37.0% 17.4% Mill Opcst $7.20 $13.64 Lch Opcst $4.24 $4.37
Gold Mill Cutoff gm/t 0.89 1.45 Cross Over Cutoff
gm/t 1.73 1.15
Gold Lch Cutoff gm/t 0.74 2.18
Au Lch Rec 8.5% Au Mill Rec 10.0% Ag Lch Rec 6.0% Ag Mill Rec 7.0% Mill Opcst $8.85 Lch Opcst $4.95
Gold Mill Cutoff gm/t 7.76 Cross Over Cutoff
gm/t 17.02
3012 Mpy
Gold Lch Cutoff gm/t 6.12
Marble Contact Zone = 3
Au Lch Rec 59.5% 34.0% Au Mill Rec 70.0% 75.0% Ag Lch Rec 32.0% 16.7% Ag Mill Rec 36.3% 19.0% Mill Opcst $6.09 $12.47 Lch Opcst $3.30 $4.95
Gold Mill Cutoff gm/t 0.85 1.35 Cross Over Cutoff
gm/t 1.74 1.20
2001 Dio
Gold Lch Cutoff gm/t 0.69 1.53
Au Lch Rec 72.3% Au Mill Rec 85.0% Ag Lch Rec 34.0% Ag Mill Rec 38.7% Mill Opcst $4.55 Lch Opcst $2.17
Gold Mill Cutoff gm/t 0.58 Cross Over Cutoff
gm/t 1.23
3007 Mrb
Gold Lch Cutoff gm/t 0.47
Au Lch Rec 63.8% 8.5% Au Mill Rec 75.0% 75.0% Ag Lch Rec 32.8% 14.6% Ag Mill Rec 37.3% 16.6% Mill Opcst $7.20 $13.64
3018 Mts
Lch Opcst $4.24 $4.37

Pennstrom Consulting Easton Process Consulting, Inc.
101
Gold Mill Cutoff gm/t 0.89 1.45 Cross Over Cutoff
gm/t 1.73 0.91
Gold Lch Cutoff gm/t 0.74 5.68
Au Lch Rec 62.1% Au Mill Rec 73.0% Ag Lch Rec 27.5% Ag Mill Rec 31.3% Mill Opcst $6.73 Lch Opcst $4.05
Gold Mill Cutoff gm/t 0.87 Cross Over Cutoff
gm/t 1.61
7 Gossan Was Called Jasperpoid
Gold Lch Cutoff gm/t 0.74
Au Lch Rec 8.5% Au Mill Rec 10.0% Ag Lch Rec 6.0% Ag Mill Rec 7.0% Mill Opcst $8.85 Lch Opcst $4.95
Gold Mill Cutoff gm/t 7.76 Cross Over Cutoff
gm/t 17.02
3012 Mpy
Gold Lch Cutoff gm/t 6.12
17.6 Mine Plan and Production Schedule Pushback Designs Eight mine phases, or pushbacks, were designed for all three deposits: two each in the Manganese and Marble Contact zones, and four in the Main Zone. The pushbacks were designed to provide proper access and equipment working room. Each pushback is a logical expansion of the pit. The production schedule was developed from the pushback designs. The design criteria for pushbacks are:
Manganese and Marble Contact Zones Initial Pit, or Phase 1 45 degree interramps with single bench configuration Final Pit, Marble 48 degree interramps with double bench configuration Final Pit, Diorite 42 degree interramps with single bench configuration
Main Zone Rock Slopes 38 degree interramps with single bench Near Surface Slopes 32 degree interramps with single bench

Pennstrom Consulting Easton Process Consulting, Inc.
102
The interramp slope angles above were recommended by IMC after study of the geotechnical report prepared by SIAL, Geosciences Investigation and Consulting Ltd., 12OCT04. The hard rock slope angles presented by SIAL were steeper than those listed above by IMC. However, the SIAL slopes will require custom blasting practices to achieve. In order to minimize the requirement for specialty blasting, IMC has limited the interramp slope angles for the initial pushback designs to the values presented above. The slope angles were reduced in the Manganese and Marble Contact Zones from those recommended by SIAL for the following reasons:
• Initial pit openings in the early days of the mine should not be aggressive.
• Final pit slopes in marble were set at the maximum level practical without custom smooth wall blasting techniques. Even so, some buffer blasting will be required at the 48 degree interramp slope angles.
• Diorite slopes were reduced by IMC due to the observed altered condition of the diorite ore in
the Manganese zone. Haul road geometries were based on expected truck sizes in the 35 to 50 tonne class. Road criteria are as follows:
Maximum road gradient 9 % Road width including berms and ditches 21 meters
The gradient was kept to 9 % due to the occurrence of snow in the winter months at site. Mine Production Schedule The mine production schedule was developed to deliver a combined total of 5,225,000 tonnes per year of mill and leach ore to the primary crusher (14,315 tpd). The highest grade 5000 tpd of that feed (1,825 ktonnes/yr) will be sent to the cyanidization mill and the rest to the heap leach. A tripper is provided at the crusher station to route the material to the appropriate destination, and campaign feed of the crusher will be accomplished from the mine. The mine phase designs were used as input to develop the mine production schedule. Preproduction stripping starts in phase 1 of both the Marble Contact and Manganese pit. Initial ore flow is from those two pits. A detailed monthly ramp up schedule was developed in conjunction with the process engineers that explains the lesser ore requirements in Year 1. Sufficient waste is removed in advance of ore production to assure sustained ore release. Equipment requirements and a reasonable balance of equipment between the mine working areas has been integrated into the schedule. Anatolia is currently planning to use a mining contractor, so a precise list of mine equipment is not available. However, the mine was nominally sized for 6.5 cubic meter front end loaders and 50 tonne trucks. Cutoff grades for the project were established in an effort to maximize project return on investment. The cutoff grade calculation was based on the net income after processing. Recovery functions and process costs for cutoff calculations were based on the results of the feasibility study which are summarized on

Pennstrom Consulting Easton Process Consulting, Inc.
103
Table 17-4. This information was stored in the mine plan model and utilized to calculate the net income after processing for each block in the model. Table 17-6 summarizes the mine production schedule for the cyanide treatment of oxide ores. The sum of proven and probable mineral reserves is equal to the total ore processed within the mine plan. Figure 17-1 presents the end of mine life pit and waste storage for the proven and probable mineral reserves.

Pennstrom Consulting Easton Process Consulting, Inc.
104
Table 17.6 Çöpler Mine Production Schedule Based on Measured and Indicated Category Mineralization
March 2, 2007
Mill Ore Leach Ore Waste Total Total Year Cutoff Gold Silver Mill Rec Mill Rec Cutoff Gold Silver Lch Rec Lch Rec Material Material Mill+Leach
$Net/T Ktonnes gm/t gm/t Au gm/t Ag gm/t $ Net /T Ktonnes gm/t gm/t Au gm/t Ag gm/t Ktonnes Ktonnes Ktonnes Prep $2.50 413 1.665 1.36 1.136 0.43 4,087 4,500 413
1 $24.00 1,561 5.378 9.82 4.190 2.23 $2.50 3,168 1.027 0.94 0.677 0.28 9,755 14,484 4,729 2 $19.00 1,831 3.287 13.05 2.693 2.13 $2.50 3,394 1.096 2.32 0.674 0.69 9,275 14,500 5,225 3 $17.50 1,811 3.262 16.29 2.633 2.76 $2.50 3,414 1.205 3.39 0.683 1.10 12,375 17,600 5,225 4 $13.50 1,827 3.195 5.26 2.401 1.82 $2.50 3,398 1.273 2.35 0.667 0.57 12,375 17,600 5,225 5 $3.50 1,889 1.883 3.14 1.306 0.96 $1.50 3,336 1.678 4.86 0.466 0.75 12,375 17,600 5,225 6 $3.50 1,873 2.003 2.80 1.169 0.68 $1.00 3,352 0.765 1.41 0.360 0.26 10,397 15,622 5,225 7 $6.00 1,885 1.653 1.62 1.355 0.57 $1.00 3,340 0.983 1.71 0.420 0.36 11,014 16,239 5,225 8 $8.00 1,798 2.085 4.19 1.693 1.20 $1.00 3,427 0.891 1.93 0.462 0.64 7,614 12,839 5,225 9 $6.50 1,857 1.685 3.28 1.433 2.89 $0.50 3,368 1.124 5.36 0.457 1.76 5,109 10,334 5,225
10 $6.00 1,790 2.127 5.86 1.428 2.20 $0.50 3,435 1.447 8.80 0.487 2.83 5,059 10,284 5,225 11 $0.50 134 2.331 2.72 0.739 0.88 185 319 134
Total 18,122 2.608 6.44 1.992 1.73 34,179 1.161 3.30 0.543 0.93 99,620 151,921 52,301

Pennstrom Consulting Easton Process Consulting, Inc.
105
Figure 17.1
Final Mine and Dump Plan

Pennstrom Consulting Easton Process Consulting, Inc.
106
17.7 Mineral Reserves and Mineral Resources
The production schedule presented on Table 17.6 is the basis for the Çöpler mineral reserves. Table 17.7 provides a segregation of proven and probable mineral reserves. Mineral resources are based on a larger floating cone pit geometry that assumes the presence of a sulfide process facility and the incorporation of economic credit for inferred mineralization for the determination of resources only. Table 17.7 summarizes the mineral reserves and mineral resources at Çöpler. Cutoff grades for mineral resource are equal to $0.00 income net of process per tonne of ore (internal cutoff). The table provides the estimated mineral reserves and mineral resources for the Çöpler Gold Project as reported in the 2007 IMC Report.
Table 17.7 Mineral Reserves and Mineral Resources Based on $475/oz Gold and $8.00/Oz Silver March 2, 2007
Mineral Reserves
Proven Probable Proven+Probable
Gold Silver Gold Silver Gold Silver Contained
Process Category
Ktonnes gm/t gm/t Ktonnes gm/t gm/t Ktonnes gm/t gm/t Au KOzs Total Mill
Ore 12,557 2.762 8.65 5,565 2.261 1.45 18,122 2.608 6.44 1,519
Total Leach Ore
19,871 1.093 2.97 14,308 1.255 3.76 34,179 1.161 3.30 1,275
Total Mineral Reserves
32,428 1.739 5.17 19,873 1.536 3.12 52,301 1.662 4.39 2,794
Mineral Resources in Addition to Reserves, Assumes the Presence of a Sulfide Process Facility
Measured Indicated Measured + Indicated Inferred
Gold Silver Gold Silver Gold Silver Contained Gold Silver Contained
Material Type
Ktonnes gm/t gm/t Ktonnes gm/t gm/t Ktonnes gm/t gm/t Au KOzs Ktonnes gm/t gm/t Au KOzs Remaining
Oxide Resource
8,819 0.493 1.23 10,484 0.854 1.10 19,303 0.689 1.16 428 29,331 1.336 2.07 1,260
Remaining Sulfide
Resource
3,087 1.622 6.13 9,769 1.716 7.17 12,856 1.694 6.92 700 14,272 2.493 5.31 1,144
Total Mineral
Resources
11,906 0.785 2.50 20,253 1.27 4.03 32,159 1.09 3.46 1,128 43,603 1.715 3.13 2,404
A significant amount of sulfide ore exists within the Proven and Probable reserves identified in the previous table. Table 17.8 shows the sulfide material contained within these reserves. Sulfide reserves plus resources estimated in early 2007 total approximately 37.8 million tons at an average 2.19 gpt gold. Some of this material contains less than 1.0 gpt gold and is probably not economic in the plant described in this report. For the purposes of this report, it is assumed about 2.75 million tonnes at an average grade of 0.8 gpt gold is uneconomic. This material is considered waste, increasing the overall strip ratio of remaining, potentially economic material by 13.3 per cent, to 1.7 (from 1.5), and the grade of remaining ore by 5.0 per cent, to 2.3 gpt gold.

Pennstrom Consulting Easton Process Consulting, Inc.
107
Table 17.8 Mineral Reserves with Breakout of Oxide and Sulfide Materials
Mineral Reserves Proven Probable Proven+Probable
Gold Silver Gold Silver Gold Silver Contained Process Category Ktonnes gm/t gm/t Ktonnes gm/t gm/t Ktonnes gm/t gm/t Au KOzs Mill Ore -
Oxide 11,935 2.682 7.62 5,017 2.070 1.37 16,952 2.501 5.77 1,363 Mill Ore -
Sulfide 622 3.923 23.60 548 4.416 7.63 1,170 4.154 16.12 156 Total Mill
Ore 12,557 2.762 8.65 5,565 2.261 1.45 18,122 2.608 6.44 1,519 Leach Ore -
Oxide 15,485 0.674 0.58 9,163 0.940 2.17 24,648 0.773 1.17 612 Leach Ore -
Sulfide 4,386 2.176 9.17 5,145 2.154 8.51 9,531 2.164 8.81 663 Total
Leach Ore 19,871 1.093 2.97 14,308 1.255 3.76 34,179 1.161 3.30 1,275 Total
Mineral Reserves 32,428 1.739 5.17 19,873 1.536 3.12 52,301 1.662 4.39 2,794

Pennstrom Consulting Easton Process Consulting, Inc.
108
18.0 OTHER RELEVANT DATA
All additional relevant information regarding the Çöpler Gold Project will be summarized in Section 23.0, which addresses Additional Requirements.
Pennstrom Consulting Easton Process Consulting, Inc.
109
19.0 INTERPRETATION AND CONCLUSIONS
The following conclusions are offered based on the results of this report. Major conclusions are as follows:
1. A conceptual process flowsheet consisting of pressure oxidation of combined high-grade ore and flotation concentrate from low-grade ore followed by cyanidation will recover approximately 87.8 per cent of the gold in the ore.
2. The capital cost for the sulfide ore processing is estimated to be US$161,000 000 in fourth quarter 2007 dollars.
3. The total operating cost for the sulfide project is estimated to be US$25.01 per ton of ore processed.
4. At a break even gold price of US$456 per ounce and with the level of information available to date, indications are that gold recovery from sulfide ores can be performed economically at Çöpler.
5. Additional drilling and delineation of the Çöpler ore bodies is required to further enhance the reliability of the assumptions used for the ore characteristics in developing the plant facilities in this report.
6. The current sample density and amount of test work data is not adequate for performing a more detailed study and the results of this report should be understood to be preliminary in nature only.
7. The reliability of the data available is within preliminary assessment requirements. 8. Process costs and recoveries are at preliminary assessment levels. Additional test work and more
detailed studies are required to evaluate more precisely the treatment of the sulfide ores at Çöpler. The next phase of work should be performed to meet pre-feasibility level study requirements and and accuracy of plus or minus 30 per cent. The cost for the pre-feasibility phase of work will be approximately US$750,000, exclulding the cost of drilling.
9. Confirmation of the costs associated with electrical power will occur when the contract for electric power is executed. The contract power costs will significantly enhance the level of accuracy of the operating costs developed and used for the economic evaluation in this report.
10. Permitting and regulatory risks are considered moderate with some delays possible. 11. Currency risks are considered moderate. 12. The risk of securing qualified personnel for the various phases of the project is manageable with a
blending of non-Turkish and Turkish personnel. 13. Project upside potential exists due to the following condition:
• Gold price levels are currently higher those used for mine design. • Mineral resources may convert to additional mineral reserves. • Other metal values such as copper and silber have not been considered in the report, and • The mine plan is based on contract mining and performing the mining by in-house
personnel should reduce mine operating costs.

Pennstrom Consulting Easton Process Consulting, Inc.
110
20.0 RECOMMENDATIONS
During January 2007, the AMDL board of directors made the decision to proceed with developing the Çöpler Gold Project. As a result, the company has committed to detailed engineering and has placed deposits on some items with long lead time. With the continued development of this project, many of the unknowns about the project will disappear. Preliminary scoping metallurgical studies have resulted in the development of a conceptual process flow sheet for the sulfide ore from Cöpler deposit in Turkey. Due to limited process design data, assumptions had to be made based on test work for other similar properties in order to determine order-of-magnitude capital and operating costs for the project. Additional sulfide deposit sampling and test work should be performed to increase the knowledge of the deposit and the required processing parameters for the Cöpler sulfide ores. Copper and silver recovery from the process solution has not been evaluated in this study pending further resource development. The sulfide ore is projected to assay an average 0.09 per cent copper and 4.39 gm/t silver. Future testing should incorporate copper and silver recovery from the sulfide oxidation products. The following additional test work should be undertaken for the sulfide deposit:
1. Obtain representative high-grade sulfide ore from the various mineralized zones and lithologies for testing to develop and confirm process design criteria for the pressure oxidation and cyanidation processing unit operations.
2. Obtain representative low-grade sulfide ore from the various mining zones and lithologies for
testing to develop and confirm process design criteria for the flotation process. 3. Optimize the flotation parameters and process flow sheet for the sulfide ores. 4. Following optimization of the flotation process, concentrate should be generated and the mixture
of high-grade ore and concentrate should be tested to develop and confirm process design criteria for the pressure oxidation and cyanidation processing unit operations.
5. The sulfide ore is projected to assay an average 0.09 per cent Cu. Future testing should
incorporate copper recovery from the sulfide oxidation products. As part of the ongoing development of the Çöpler Gold Project, funds should be allocated to pay for further sampling and test work, and a more detailed study of the sulfide portions of the Çöpler deposits. Additional drilling and delineation of the deposits should continue until the deposits and ore characteristics are understood sufficiently. The next phase of work should involve a delineation of the sulfide portion of the ore body with a comprehensive drilling and sampling program. Samples should be selected by location. lithology, and grade to ensure representativeness of the sulfide deposit. Samples will be subjected to a detailed metallurgical test program for identifying both flotation and oxidation operating parameters. Based on the positive results from this report, drilling of the sulfide portions of the Çöpler deposits should continue. The next drilling and test work to support a pre-feasibility level study should be

Pennstrom Consulting Easton Process Consulting, Inc.
111
incorporated into mine plans and schedules. Approximately US$750,000 shouild be made available to continue the test work and to complete a pre-feasibility level study on the sulfide ores. A positive result from the pre-feasibility study would justify another phase of sulfide mine planning, test work, and studies.

Pennstrom Consulting Easton Process Consulting, Inc.
112
21.0 REFERENCES
The following documents were referenced during the preparation of this Technical Report:
1. Technical Report, Çöpler Gold Project Feasibility Study, Prepared by Samuel Engineering, Inc., May 19, 2006
2. Technical Report, Çöpler Gold Project, Prepared by Independent Mining Consultants, Inc., March 2, 2007 as Amended 30 April 2007.
3. Preliminary Metallurgical Testing of Sulfide Samples from Çöpler Prospect, Turkey, Prepared by RDi, October 16, 2006.
4. Preliminary Metallurgical Testing of Sulfide Ore Samples from Çöpler Prospect, Turkey. Prepared by RDi, September 22, 2002.
5. Çöpler Prospect, Turkey: Leaching of Flotation Concentrates, Prepared by RDi, December 1, 2002.
6. Metallurgical Testing of Sulfide Ore Samples from Çöpler Prospect, Turkey: Prepared by RDi, February 12, 2007.

Pennstrom Consulting Easton Process Consulting, Inc.
113
22.0 CERTIFICATES OF AUTHORS
William J. Pennstrom Pennstrom Consulting 2728 Southshire Road
Highlands Ranch, CO 80126 USA Telephone: 303-683-9227
Fax: 303-638-5188 Email: [email protected]
CERTIFICATE AND CONSENT OF AUTHOR
I, William J. Pennstrom, Qualified Professional in Metallurgy, do hereby certify that: 1. I am self employed as a Consulting Process Engineer and own:
Pennstrom Consulting 2728 Southshire Road Highlands Ranch, CO 80126 USA
2. I graduated in 2001, with a Master of Arts degree in Management from Webster University, St.
Louis, Missouri. 3. I graduated in 1983 with a Bachelors of Science degree in Metallurgical Engineering from the
University of Missouri – Rolla, Rolla, Missouri. 4. I am a Founding Registered Member of the Society for Mining, Metallurgy, and Exploration
(SME). 5. I am a recognized Qualified Professional (QP) Member, with expertise in Metallurgy, of the
Mining and Metallurgical Society of America (MMSA). 6. I have worked in the Mineral Processing Industry for a total of 30 years since before, during,
and after my attending the University of Missouri. 7. I have read the definition of “qualified person” set out in National Instrument 43-101 (“NI 43-
101”) and certify that by reason of my education, affiliation with a professional association (as defined in NI 43-101) and past relevant work experience, I fulfill the requirements to be a “qualified person” for the purposes of NI 43-101.
8. I am responsible for the process and infrastructure design, and capital and operating costs
sections of the technical report titled “Çöpler Project, Preliminary Assessment Sulfide Ore Processing, dated February 4th, 2008”. I visited the Project site during November of 2005.
9. I have had prior involvement with the property that is the subject of this Preliminary
Assessment. The nature of my prior involvement is as a contributing author to prior Technical

Pennstrom Consulting Easton Process Consulting, Inc.
114
Reports developed on the Çöpler Project, while owner of Pennstrom Consulting. 10. I am independent of the issuer in accordance with section 1.5 of National Instrument 43-101. 11. I have read National Instrument 43-101 and Form 43-101F1, and the Technical Report has been
prepared in compliance with that instrument and form. 12. I also certify that as of the date of this certificate, to the best of my knowledge, information and
belief, that I am not aware of any material fact or material change with respect to the subject matter of the Technical Report that is not reflected in the Technical Report, the omission to disclose which would make the Technical Report misleading.
13. I consent to the filing of the Technical Report with any stock exchange and other regulatory
authority and any publication by them for regulatory purposes, including electronic publication in the public company files on their websites accessible by the public, of the Technical Report.
Dated this 4th Day of February, 2008 William J. Pennstrom


Pennstrom Consulting Easton Process Consulting, Inc.
121
John M. Marek P.E. Independent Mining Consultants, Inc.
2700 E. Executive Drive # 140 Tucson, Arizona, USA 85706
Telephone: 520-294-9861 Fax: 520-294-9865
Email: [email protected] CERTIFICATE OF QUALIFIED PERSON I, John M. Marek P.E. do hereby certify that: 1. I am currently employed as the President and a Senior Mining Engineer by:
Independent Mining Consultants, Inc. 2700 E. Executive Drive # 140 Tucson, Arizona, USA 85706
2. I graduated with the following degrees from the Colorado School of Mines
Bachelors of Science, Mineral Engineering – Physics 1974 Masters of Science, Mining Engineering 1976
3. I am a Registered Professional Mining Engineer in the State of Arizona USA
Registration # 12772 I am a Registered Professional Engineer in the State of Colorado USA Registration # 16191
I am a Registered Member of the American Institute of Mining and Metallurgical Engineers, Society of Mining Engineers
4. I have worked as a Mining Engineer for a total of 32 years since my graduation from university. 5. I have read the definition of “qualified person” set out in National Instrument 43-101 (“NI43-101”)
and certify that by reason of my education, affiliation with a professional association (as defined in NI43-101) and past relevant work experience, I fulfill the requirements to be a “qualified person” for the purposes of NI43-101.
6. I am responsible for sections 4 through 14, and 17 of the report titled “Copler Gold Project,
Preliminary Assessment Sulfide Ore Processing”, all of which are direct quotations from a previous Technical Report titled “Technical Report, Copler Gold Project”, dated 30 April 2007. I visited the Copler Project during July of 2005.
7. Independent Mining Consultants, Inc, and John Marek have worked on the Copler Project prior to
this Technical Report.

Pennstrom Consulting Easton Process Consulting, Inc.
122
8. I am not aware of any material fact or material change with respect to sections 4 through 14, and 17 of the Technical Report that is not reflected in sections 4 through 14, and 17 of Technical Report, the omission to disclose which makes the Technical Report misleading.
9. I am independent of the issuer applying all of the tests in Section 1.5 of NI 43-101. 10. I have read national Instrument 43-101 and Form 43-101F1, and to my knowledge, the Technical
Report has been prepared in compliance with that instrument and form. 11. I consent to the filing of the Technical Report with any stock exchange and other regulatory
authority and any publication by them, including electronic publication in the public company files on their websites accessible by the public, of the Technical Report.
Dated 4th Day of February, 2008
John M. Marek P.E.

TVRCofQP2008.doc Page 1
Thomas Reynolds, PE Samuel Engineering, Inc.
8450 E. Crescent Pkwy, Suite 200 Greenwood Village, CO 80111-2855 USA
Telephone: 303-714-4840 Fax: 303-705-9385
Email: [email protected]
CERTIFICATE AND CONSENT OF AUTHOR
I, Thomas V. Reynolds, P.E. do hereby certify that:
1. I am currently employed as a Project Manager by:
Samuel Engineering, Inc. 8450 E. Crescent Pkwy, Suite 200 Greenwood Village, CO 80111-2855
2. I graduated in 1969 with a Bachelors of Science degree in Aerospace Engineering from the University of Colorado, Boulder, Colorado.
3. I am a registered Professional Engineer in the State of Colorado, USA; Registration Number 13905.
4. I have worked in the Mineral Processing Industry for a total of 27 years since my graduation from the University of Colorado.
5. I have read the definition of “qualified person” set out in National Instrument 43-101 (“NI 43-101”) and certify that by reason of my education and past relevant work experience, I fulfill the requirements to be a “qualified person” for the purpose of NI 43-101. I visited the Çöpler Project site during November of 2005.
6. I am responsible for Section 15 of the report titled “Technical Report, Çöpler Gold Project”, dated May of 2006. This section has been copied to the “Çöpler Gold Project, Preliminary Assessment, Sulfide Ore Processing” report (the Report) dated February 4, 2008. I have reviewed this section for completeness and accuracy and confirm that it is accurate.
7. Samuel Engineering, Inc. has not worked on the Çöpler Gold Project prior to development of the April 2006 Feasibility Study and the May 2006 Technical Report.
8. I am not aware of any material fact or material change with respect to the subject matter of this Report that is not reflected in the Report, the omission to disclose which makes the Report misleading.
9. I am independent of the issuer applying all of the tests per Section 1.5 of NI 43-101.
10. I have read National Instrument 43-101 and Form 43-101F1 and, to my knowledge, the Report has been prepared in compliance with that instrument and form.
11. I consent to the filing of this Report with any stock exchange and other regulatory authority and any publication by them, including electronic publication in the public company files on their websites accessible by the public, of the Report.
Dated the 4th day of February, 2008
Thomas V. Reynolds, P.E.

Pennstrom Consulting Easton Process Consulting, Inc.
125
23.0 ADDITIONAL REQUIREMENTS
This section addresses the additional requirements for development properties as required for Technical Reports under NI43-101. Some of the sub-chapters were written by Pennstrom Consulting and others were written and presented in the previous 2007 IMC Report. The operating cost and financial analysis sub-sections were developed by Pennstrom Consulting with input from Anatolia personnel. 23.1 Capital Cost Estimate
Equipment and costs are presented in Attachment D. A brief summary of the required existing oxide equipment and new equipment is presented below:
• Existing power line was constructed to handle the oxide and sulfide process facility power requirements. No additional capital costs are anticipated for supplying the increased power requirements of the sulfide facility.
• Existing crushing and milling facilities with the addition of a rougher and cleaner flotation circuit, concentrate thickener, and mill solution tank and pumps.
• Addition of a new 3000 tpd direct feed ore milling circuit with cyclone overflow thickening and mill solution storage.
• New pre-acidification circuit consisting of agitated tanks, and pre-acidification thickener. • New pressure oxidation circuit consisting of feed tank, pressure leach autoclave, flash vessel,
vent scrubber, CCD Feed Tank, and associated gland seal water, steam, and oxygen systems. • New CCD circuit consisting of three CCD thickeners with associated pumps and tanks. • New Limestone solution neutralization circuit; limestone grinding circuit outlined below and
agitated neutralization tanks. • New Lime solution neutralization circuit consisting of agitated tanks. • New slurry neutralization tank. • Existing cyanide leach, gold recovery, cyanide neutralization, and tailings thickener. • New Oxygen plant for over the fence oxygen purchased by contract. • New limestone grinding and lime slaking facilities, and steam generation. • New demineralized water plant, high pressure steam boiler, cooling water system, and
flocculant system. • Compressor for air addition to pre-acidification, CCD Feed Tank, limestone neutralization, and
other areas as required. • New flotation tailings thickener, and new reclaim sump and pumps have been included. • Existing tailings storage facility has sufficient capacity to include sulfide facility tailings.
The basis for the capital cost estimate is presented below. The capital cost estimate is summarized in Table 23.1. 23.1.1 Inclusions:
• The sulfide project preliminary equipment capital-costs were based upon quotations from manufacturers, engineering estimates, advertised prices, cost-estimating guides, data from existing projects with similar installations, and factored from historical quotes.
• Direct costs were factored from similar projects and a September 2007 SNC-Lavalin forecast to complete the oxide project.

Pennstrom Consulting Easton Process Consulting, Inc.
126
• Indirect costs were factored from a September 2007 SNC-Lavalin forcast cost estimate for the oxide project.
• Freight is included at 5.1 per cent of direct costs. • Engineering, Procurement, and Construction management were factored at 18 per cent of direct
costs from a September 2007 SNC-Lavalin forcast cost estimate. • Vendor equipment representatives were factored at 2.3 per cent of direct costs. • Capital spare equipment was factored at 5.1 per cent of direct costs. • The oxygen plant capital cost $61,678,000 capital was factored from a March 2006 quote. As
specified by AMDL, operating costs were calculated, and a price for oxygen determined for a 10 year take-or-pay contract that gave a ~0 per cent IRR. Currently, take-or-pay options are not offered in Turkey and this option will be explored during project development.
23.1.2 Exclusions:
• Costs incurred by AMDL for exploration and other owners costs. • Estimation of mining capital costs. • Escalation. • Finance and interest charges. • Currency valuation. • Taxes, import/export duties. • Tailing facility for sulfide process. • Working capital. • Sustaining capital. • Closure costs. • Salvage value. • Reclamation and monitoring costs.
23.1.3 Contingency
Contingency reflects the potential for growth in project cost within the same scope of work. Contingency includes variations resulting from uncertainties that will be clarified during final engineering when detailed designs and specifications of equipment and materials are developed. The contingency was estimated by applying an overall contingency estimated to be 30 percent. In pre-feasibility or feasibility level work this value may drop to 15 percent as costs are further defined within the scope of work. The 30 percent contingency allowance was applied to the capital costs resulting in a contingency of $37,200,000.

Pennstrom Consulting Easton Process Consulting, Inc.
127
Table 23.1 Capital Cost Estimate
Description Area Equipment Cost
Total
Flotation Feed Grinding Area 10 $337,000 $800,000 Rougher Sulfide Flotation 12 $2,800,000 $6,700,000 Cleaner Sulfide Flotation 14 $910,000 $2,200,000 Direct Feed Grinding 16 $3,900,000 $9,400,000 Preacidification 22 $1,450,000 $3,500,000 Pressure Oxidation 24 $15,530,000 $41,300,000 CCD Thickening 26 $5,350,000 $12,100,000
Solution and Slurry Neutralization 30 $6,430,000 $14,000,000 Utilities 40 $3,070,000 $6,800,000 Sub-total $39,777,000 $96,800,000 Percent of Directs 40.858 Freight % of Directs 5.1 $5,000,000 Taxes, Import/Export Duties Excluded Engineering, Procurement, and Construction Management
% of Directs 18.1 $17,600,000
Vendor Equipment Reps % of Directs 2.3 $2,300,000 Escalation Excluded Capital Spare Parts % of Equipment 5.1 $2,100,000 Subtotal $123,800,000 Contingency % of Sub-total 30.0 $37,200,000 Owners Costs Excluded Total $161,000,000
23.2 Process Operating Cost Estimate
A process operating cost estimate for the Çöpler sulfide ores has been developed and is provided in this section. Since limited metallurgical data is available for specific sulfide ore types, all of the ore types have been grouped into one “sulfide” ore type. Additional test work on sulfide ore samples that become available with continued drilling of the sulfide deposit should be used to enhance the accuracy of the operating cost estimate. The operating costs, as based on assumptions outlined previously and in the Design Criteria in Attachment A, are plus or minus 30 percent using second quarter 2007 US dollars. 23.2.1 Process Operating Cost Development
Operating costs were developed utilizing the following information:
Pennstrom Consulting Easton Process Consulting, Inc.
128
• Design criteria values for o throughput, o ore characteristics, o metallurgical characteristics, o assumed operating parameters, and o operating philosophy.
• Revised material balances and process flow sheets for the sulfide process facility. • Revised reagent and oxygen consumptions from test work and calculated from the material
balances. • Previous study data for crushing and grinding, and leaching and refining. • Reagent unit costs obtained from previous studies and recent data obtained for operations of the
oxide plant. • Power costs for crushing and grinding and the cyanide leach circuit were derived from values
for ore characteristics developed in the previous studies and the revised equipment list power demands for the pressure oxidation circuit and associated process requirements.
• Oxygen demand was calculated and an oxygen plant was sized. From this a unit cost for oxygen over the fence was calculated based on power costs and consumption, and the capital cost amortization which would be applied to an over the fence cost by an outside oxygen plant supplier.
23.2.2 Process Operating Cost Summary
Table 23.2 provides a summary by major process area for the estimated operating costs. Complete detail of the Process Operating Costs are provided in Attachment E.

Pennstrom Consulting Easton Process Consulting, Inc.
129
Table 23.2 Çöpler Process Operating Costs Summary
All Sulfide Ore Types Power Costs 0.089 $/kWh Sulfide Sulfur Grade 2.73 % Ore Throughput Rate 8,000 mtpd Average Gold Grade 2.30 g/t Gold Percent Recovery 87.9 % Gold Produced 189,490 oz/y Percent of Ore Floated 62.5 % $/t ore milled
Crushing and Grinding Costs per Ton Milled 2.44 $/t floated Flotation Costs per Ton Floated 0.82 $/t ore milled
Flotation Costs per Ton Milled 0.51
Pressure Oxidation, Leaching, and Refining $/t POX feed Limestone Cost, $/t oxidized 0.90 Oxygen Cost, $/t oxidized 11.70 Other Power, $/t oxidized 5.45 Maintenance, $/t oxidized 4.00 POX Costs per Ton Oxidized 22.05 $/t ore milled POX Costs per Ton Milled 9.75 Leaching Costs per Ton Milled 0.33 Carbon Handling & Gold Refining 0.23
POX, Leaching, and Refining Costs per Ton Milled 13.48
Tailings Disposal Costs per Ton Milled 0.92
Labor Costs per Ton Milled 1.97
Total Processing Costs Sulfides (US$/t ore milled) 19.32

Pennstrom Consulting Easton Process Consulting, Inc.
130
23.3 Project Economics and Sensitivity Analysis
23.3.1 Project Costs
The sulfide facility will process ore at a rate of 8,000 tpd to produce 189,490 ounces of gold per year at an overall gold recovery of 87.9 per cent. Capital costs, as developed in Section 4 of this report, are estimated at $161,000,000 ± 30 per cent. The process operating costs, described in Section 5, are estimated at $19.32 per ton ± 30 per cent. The total cash cost assuming $4.59/t of ore for mining (includes waste mining costs) and $1.10/t for G&A (as supplied by AMDL) is estimated to be US $25.01 per ton of ore or US $385 per ounce of gold. The assumptions used for the simplified project analysis are presented in Table 23.3 with the supporting details found in Attachment F.
Table 23.3 Sulfide Facility Capital and Operating Costs and Assumptions
Sulfide Capital Cost $ $161,000,000
Operating Costs
Operation Life yr 12 Ore Mining Costs $/ton $4.59 Waste Mining Costs (included in the ore mining costs) Processing Costs $/ton processed $19.32 G&A $/ton processed $1.10
Total Operating Cost $/ton $25.01
Process Parameters
Ore Processed t/yr 2,919,999 Gold in Feed oz/yr 215,690 Total Ore Processed t 35,039,988 Total Gold in Feed oz 2,588,275 Flotation Feed Ore Au Grade gpt 1.81 Direct Feed Ore Au Grade gpt 3.11 Overall Recovery % 87.85
Annual Gold Production oz/yr 189,490 Life of Mine Gold Production oz 2,273,880
Cost per Ounce
Operating Cost (pre Tax) $/oz $385 Capital Cost (pre Tax) $/oz $71
Gold Price
1 Year “Look Back” $/oz. 683.34 2 Year “ Look Back” $/oz. 640.91 3 Year “Look Back” $/oz. 573.59

Pennstrom Consulting Easton Process Consulting, Inc.
131
23.3.2 Project Economics
Net present value calculations based on a simplified cash flow analysis are summarized and presented in Table 23.4. Supporting details and a project cash flow by year can be found in Attachment F. The Base Case parameters of 1.81 gpt gold for flotation feed, 3.11 gpt gold for direct feed, and $25.01 total operating cost require a gold price of $456/oz for an NPV of zero (calculated day one of capital spending).
Note: All IRR calculations are pre-tax and unleveraged. 23.3.3 Sensitivity Analysis
Tables 23.5 and 23.6 present the Project’s IRR Sensitivity to variables such as gold price, gold recovery, capital, and operating costs.
Table 23.4 Simplified Project Economic Analysis
Case Units Gold Price - 1 Year Look Back
Gold Price - 2 Year Look Back
Gold Price - 3 Year Look Back
Processing Cost $/t 25.01 25.01 25.01 Flotation Gold Grade gpt 1.81 1.81 1.81 Direct Feed Gold Grade gpt 3.11 3.11 3.11 Gold Price $/oz 683.34 640.91 573.59 NPV 0% x $1000 516,483 420,002 266,925 NPV 5% x $1000 304,918 240,282 137,730 NPV 10% x $1000 179,537 134,262 62,429 NPV 15% x $1000 102,360 69,406 17,120 Internal Rate of Return % 29.96 25.50 17.78

Pennstrom Consulting Easton Process Consulting, Inc.
132
Following are seven graphs which show how the above tabled parameters effect the costs and rate of return of the project. The point on the graphs marked with an asterisk show the base case location along the graph. Figure 23.1 illustrates the effect of power cost on the processing cost from both a cost per ton and a cost per ounce basis. The base case power cost used in this report is $0.089 per kilowatt hour (kWh). Discussions held with the local power authority have indicated that credits for the installation of a power line by the owner and turned over to the authority would be considered when the final power cost calculation and charges are developed. A second credit against the power cost is believed to occur when the number of employees at Çöpler reaches 80 persons.
Table 23.5 IRR Sensitivity to Process Facility Variables
Parameter -45% -30% -15% Base Case 15% 30% 45% Gold Price, $/oz 450 500 550 574 600 650 700 IRR, % -1.3 7.7 14.8 17.8 20.9 26.5 31.7 Power Cost, $/kWh 0.0490 0.0623 0.0757 0.0890 0.1024 0.1157 0.1291 Processing Cost, $/t 16.32 17.32 18.32 19.32 20.32 21.32 22.32 IRR, % 23.2 21.4 19.6 17.8 15.9 13.9 11.8 Operating Cost, $/t 13.76 17.51 21.26 25.01 28.76 32.51 36.26 IRR, % 36.3 30.6 24.5 17.8 10.1 0.4 Capital Cost, $ x 1,000 88,550 112,700 136,850 161,000 185,150 209,300 233,450 IRR, % 34.4 26.9 21.7 17.8 14.7 12.1 10.0
Table 23.6 IRR Sensitivity to Gold Recovery
Percent Variance -15% -10% -5% Base Case 5% 10% Gold Recovery, % 74.67 79.07 83.46 87.9 92.24 96.64 IRR, % 5.7 10.2 14.1 17.8 21.2 24.4

Pennstrom Consulting Easton Process Consulting, Inc.
133
Figure 23.1Çöpler Sulfide Processing
Power Cost versus Processing Cost
19.32
$262
15.00
16.00
17.00
18.00
19.00
20.00
21.00
22.00
23.00
0.000 0.049 0.062 0.076 0.089 0.102 0.116Power Cost, $/kWh
Proc
essi
ng C
ost,
$/t t
$200
$220
$240
$260
$280
$300
$320
Cost
per
Oun
ce, $
/oz
Processing Cost, $/t
Processing Cost, $/oz
Figure 23.2 shows the effect on the IRR for the sulfide project with varying power costs. This analysis includes the effects of power cost on the cost of oxygen, which would be passed on to the operator from the oxygen supplier.
Figure 23.2Çöpler Sulfide Processing
Power Cost versus IRR
10.0
12.0
14.0
16.0
18.0
20.0
22.0
24.0
0.040 0.060 0.080 0.100 0.120 0.140Power Cost, US$/kWh
IRR
, %

Pennstrom Consulting Easton Process Consulting, Inc.
134
Figure 23.3 shows the effect of the gold price on the rate of return of the sulfide project. A gold price of $456 per ounce provides a zero return on the capital investment.
Figure 23.3Çöpler Sulfide Processing
Gold Price versus IRR
-5.0
0.0
5.0
10.0
15.0
20.0
25.0
30.0
35.0
350 400 450 500 550 600 650 700 750
Gold Price, US$
IRR,
%
Figure 23.4 illustrates the effect of capital cost on the IRR. Note the capital cost effect on the IRR begins to flatten as the capital cost increases.
Figure 23.4Çöpler Sulfide ProcessingCapital Cost versus IRR
0.0
5.0
10.0
15.0
20.0
25.0
30.0
35.0
40.0
75,000 125,000 175,000 225,000
Capital Cost, US$ x 1,000
IRR,
%
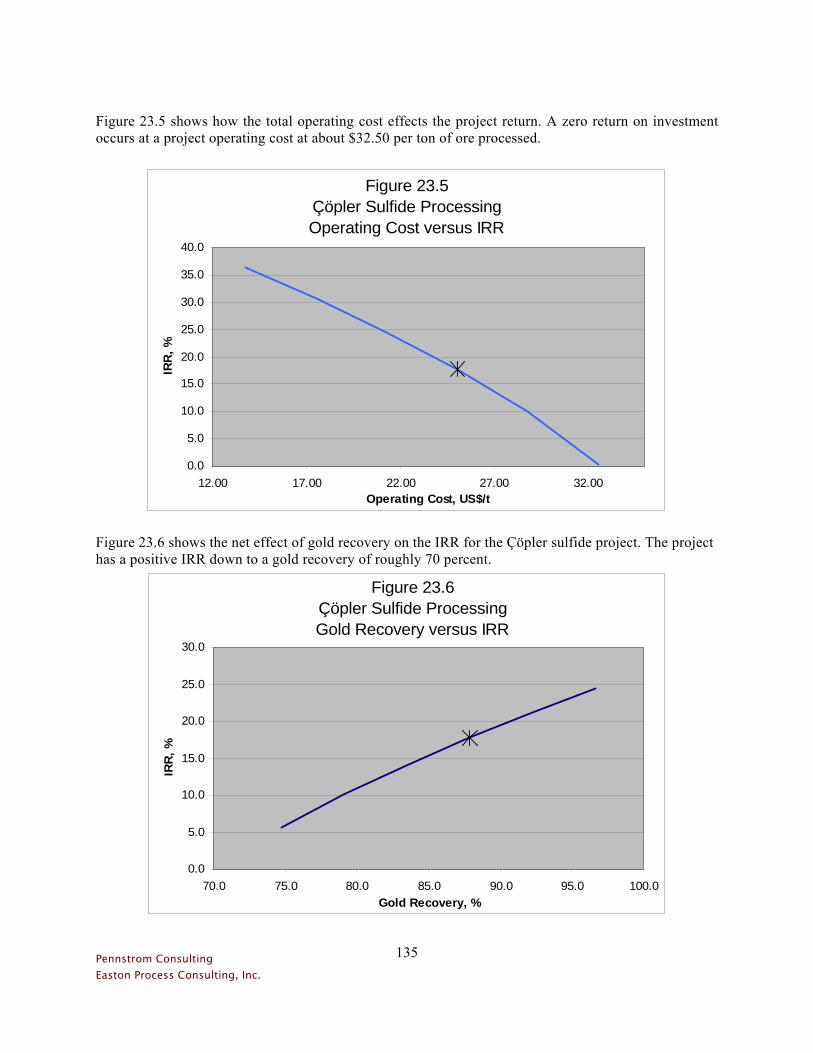
Pennstrom Consulting Easton Process Consulting, Inc.
135
Figure 23.5 shows how the total operating cost effects the project return. A zero return on investment occurs at a project operating cost at about $32.50 per ton of ore processed.
Figure 23.5Çöpler Sulfide ProcessingOperating Cost versus IRR
0.0
5.0
10.0
15.0
20.0
25.0
30.0
35.0
40.0
12.00 17.00 22.00 27.00 32.00Operating Cost, US$/t
IRR,
%
Figure 23.6 shows the net effect of gold recovery on the IRR for the Çöpler sulfide project. The project has a positive IRR down to a gold recovery of roughly 70 percent.
Figure 23.6Çöpler Sulfide ProcessingGold Recovery versus IRR
0.0
5.0
10.0
15.0
20.0
25.0
30.0
70.0 75.0 80.0 85.0 90.0 95.0 100.0Gold Recovery, %
IRR,
%

Pennstrom Consulting Easton Process Consulting, Inc.
136
Figure 23.7 shows all of the parameters reviewed previously on one graph. As the graph illustrates gold recovery and price have the largest impact on the project economics. Operating costs also have a significant impact on the project economics.
Figure 23.7Çöpler Sulfide Processing
Parameter versus IRR
0.0
5.0
10.0
15.0
20.0
25.0
30.0
35.0
40.0
40% 60% 80% 100% 120% 140% 160%Deviation from Base Case, %
IRR,
%
Gold RecoveryOperating CostPower CostGold PriceCapital Cost

ATTACHMENT A
PROCESS DESIGN CRITERIA

ANATOLIADESIGN CRITERIA
Design factors Source Codes
Crushing and Screening 1.15Fine Ore Reclaim, Grinding and Flotation 1.10 Calculated Value V
PreAcidification, Oxidation, CCD and Neutralization 1.10 Client Provided C
Carbon in Leach and Tailings 1.15 Assumed Value AHeap Leaching 0.00 RDI T
Carbon Handling and Electrowinning 1.20 Standard Industry Practice
I
REV AProduction Summary
Unit Nominal Design Code CommentOperating schedule
d/y 365 Ah/d 24 Ah/y 8,760 V
Mine life y 9.25 COverall Utiliztion Primary Crushing % 70 A Existing Design Tertiary and Secondary Crushing % 75 A Existing Design Ore Reclaim and Grinding % 90 A Existing Design Pressure Oxidation % 90 A Existing Design Carbon in Leach and Tailings % 90 A Existing Design Heap Leaching (Solution Handling) % 95 A Existing Design Carbon Handling and Electrowinning % 95 A Existing DesignOperating hours Primary Crushing h 6,132 V Existing Design Tertiary and Secondary Crushing h 6,570 V Existing Design Ore Reclaim and Grinding h 7,884 V Existing Design Pressure Oxidation h 7,884 A New Carbon in Leach and Tailings h 7,884 V Existing Design Heap Leaching h 8,322 V Existing Design Carbon Handling and Electrowinning h 8,322 V Existing DesignAnnual ore production, Direct Feed dry t 1,094,999 1,094,999 CAnnual ore production, Flotation Feed dry t 1,825,000 1,825,000Annual ore production, Heap Leach dry t 0 0 CAnnual Ore Production, Total dry t 2,919,999 2,919,999 CAssays Head Grade Au, Direct Feed g/t 3.11 3.73 C Head Grade Au, Flotation Feed g/t 1.81 2.17 C Au, Heap Leach g/t 0.00 0.00 C Average percent Total Sulfur Direct Feed % 4.60 4.60 C Average percent Sulide Sulfur Direct Feed % 4.04 4.04 Average percent Sulfate as Sulfur, Direct Feed % 0.56 0.56 Average percent Carbon Dioxide Direct Feed % 2.00 2.00 C Average percent Total Sulfur Flotation Feed % 2.20 2.20 C Average percent Sulide Sulfur Flotation Feed % 1.91 1.91 Average percent Sulfate as Sulfur, Flotation Feed % 0.29 0.29 Average percent Carbon Dioxide Flotation Feed % 2.00 2.00 C
Gold recovery, Flotation % 85.0 AGold Dissolution Oxidized Ore % 95.0 95.0 AGold recovery, CIP % 95.0 95.0 AGold Recovery, Overall % 87.9 87.9 V
Annual Gold Production, CIP tr.oz./y 189,490 227,388 VAnnual Gold Production, Heap Leach tr.oz./y VAnnual Gold Production, Combined tr.oz./y 189,490 227,388 V
Anatolia Minerals Development Ltd - Çöpler Project Sulfide Preliminary Assesment
November 13, 2007
Pennstrom Consulting Easton Process Consulting, Inc.
Page 1

ANATOLIADESIGN CRITERIA
Ore Characteristics
Direct Feed Ore Compositon (Assumed for METSIM Simulation)SiO2 wt% 65.6 AAl2O3 wt% 12.2 ACuFeS2 wt% 0.5FeS2 wt% 5.7 AFeAsS wt% 1.0CaCO3 wt% 3.2 AMgCO3 wt% 1.1 ANaCO3 wt% 0.0 ATotal S wt% 4.6 ASulfate as S wt% 0.6Sulfide wt% 4.0Au gpt 3.0Solid Specific Gravity 2.8 A
Flotation Feed Ore Compositon (Assumed for METSIM Simulation)SiO2 wt% 71.1 AAl2O3 wt% 12.2 ACuFeS2 wt% 0.5FeS2 wt% 1.4 AFeAsS wt% 1.0CaCO3 wt% 7.1 AMgCO3 wt% 3.3 ANaCO3 wt% 0.6 ATotal S wt% 2.2 ASulfate as S wt% 0.30Sulfide wt% 1.9Au gpt 1.58Solid Specific Gravity 2.8 A
Unit Nominal Design Code CommentTop size of ROM in 36 42 A Existing DesignOre specific gravity 2.65 2.65 A Existing DesignAngle of repose degrees 37 35 A Existing DesignOre moisture % 3.0 5.0 A Existing DesignImpact Work index kW/t 5.5 10.0 A Existing DesignBond Ball Mill Work index kW/t 9.0 14.0 A Existing DesignAbrasion index g 0.16 0.66 A Existing DesignBulk density crushed (-225 mm) t/m3 1.81 1.50 V Existing DesignBulk density crushed (-9.525 mm) t/m3 1.97 1.58 V Existing DesignBulk density crushed (-9") lb/ft3 115 95 A Existing DesignBulk density crushed (-3/8") lb/ft3 125 100 A Existing Design
Primary CrushingUnit Nominal Design Code Comment
Number of lines No. 1 1 A Existing DesignCrusher type Gyratory A Existing DesignCrusher feed rate t/y 2,919,999 2,919,999 C Existing Design
t/h 476 476 V Existing DesignBond Impact index kW/t 5.5 10.0 C Existing DesignCrusher product size mm 150 150 C Existing Design
Pennstrom Consulting Easton Process Consulting, Inc.
Page 2
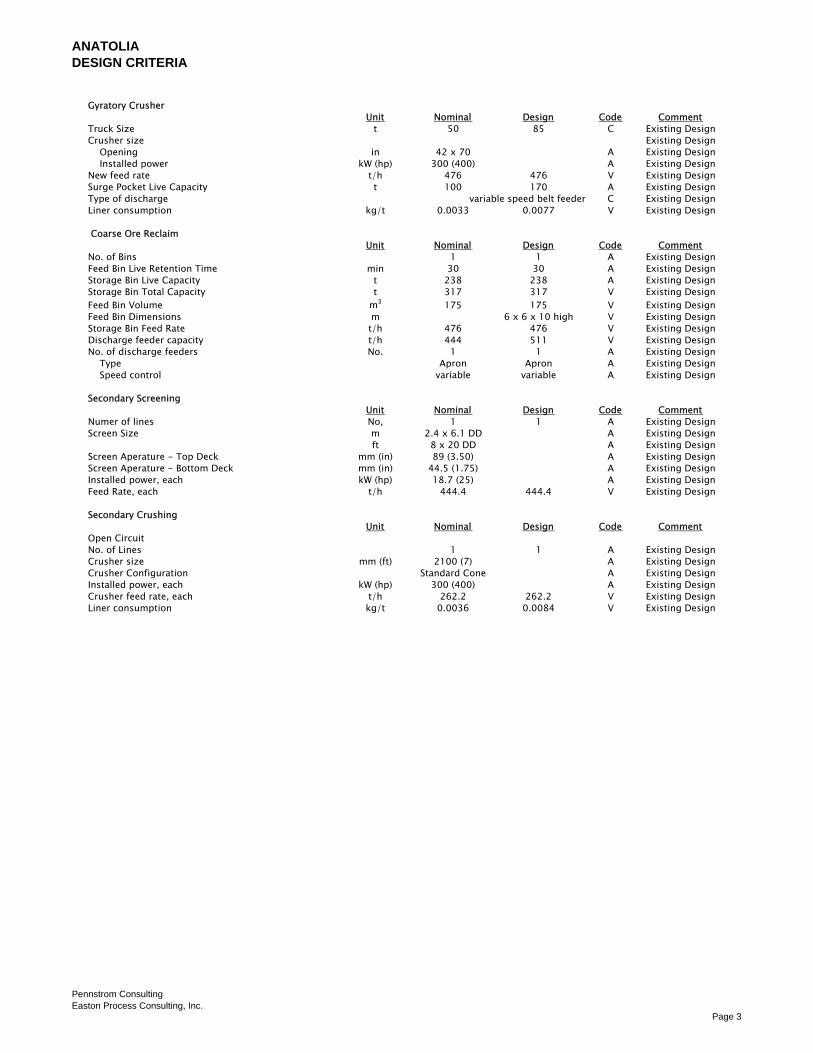
ANATOLIADESIGN CRITERIA
Gyratory CrusherUnit Nominal Design Code Comment
Truck Size t 50 85 C Existing DesignCrusher size Existing Design Opening in 42 x 70 A Existing Design Installed power kW (hp) 300 (400) A Existing DesignNew feed rate t/h 476 476 V Existing DesignSurge Pocket Live Capacity t 100 170 A Existing DesignType of discharge variable speed belt feeder C Existing DesignLiner consumption kg/t 0.0033 0.0077 V Existing Design
Coarse Ore ReclaimUnit Nominal Design Code Comment
No. of Bins 1 1 A Existing DesignFeed Bin Live Retention Time min 30 30 A Existing DesignStorage Bin Live Capacity t 238 238 A Existing DesignStorage Bin Total Capacity t 317 317 V Existing DesignFeed Bin Volume m3 175 175 V Existing DesignFeed Bin Dimensions m 6 x 6 x 10 high V Existing DesignStorage Bin Feed Rate t/h 476 476 V Existing DesignDischarge feeder capacity t/h 444 511 V Existing DesignNo. of discharge feeders No. 1 1 A Existing Design Type Apron Apron A Existing Design Speed control variable variable A Existing Design
Secondary ScreeningUnit Nominal Design Code Comment
Numer of lines No, 1 1 A Existing DesignScreen Size m 2.4 x 6.1 DD A Existing Design
ft 8 x 20 DD A Existing DesignScreen Aperature - Top Deck mm (in) 89 (3.50) A Existing DesignScreen Aperature - Bottom Deck mm (in) 44.5 (1.75) A Existing DesignInstalled power, each kW (hp) 18.7 (25) A Existing DesignFeed Rate, each t/h 444.4 444.4 V Existing Design
Secondary CrushingUnit Nominal Design Code Comment
Open CircuitNo. of Lines 1 1 A Existing DesignCrusher size mm (ft) 2100 (7) A Existing DesignCrusher Configuration Standard Cone A Existing DesignInstalled power, each kW (hp) 300 (400) A Existing DesignCrusher feed rate, each t/h 262.2 262.2 V Existing DesignLiner consumption kg/t 0.0036 0.0084 V Existing Design
Pennstrom Consulting Easton Process Consulting, Inc.
Page 3

ANATOLIADESIGN CRITERIA
Tertiary Crusher Feed BinUnit Nominal Design Code Comment
No. of Bins 1 1 A Existing DesignFeed Bin Live Retention Time min 30 30 A Existing DesignFeed Bin Live Capacity t 262 262 A Existing DesignFeed Bin Total Capacity t 350 350 V Existing DesignFeed Bin Volume m3 193 193 V Existing DesignFeed Bin Dimensions m 8 x 8 x 10.5 high V Existing DesignFeed Capacity t/h 889 889 V Existing DesignDischarge feeder capacity t/h 889 889 V Existing DesignNo. of discharge belt feeders No. 2 2 A Existing DesignSpeed control variable variable A Existing Design
Tertiary ScreeningUnit Nominal Design Code Comment
Numer of lines No, 2 2 A Existing DesignScreen Size m 2.4 x 6.1 DD A Existing Design
ft 8 x 20 DD A Existing DesignScreen Aperature - Top Deck mm (in) 25.0 (1.00) A Existing DesignScreen Aperature - Bottom Deck mm (in) 12.5 (0.50) A Existing DesignInstalled power, each kW (hp) 18.7 (25) A Existing DesignFeed Rate, each t/h 795.3 861.1 V Existing Design
Tertiary CrushingUnit Nominal Design Code Comment
Closed CircuitNo. of Lines 2 2 A Existing DesignCrusher size mm (ft) 2100 (7) A Existing DesignCrusher Configuration Shorthead A Existing DesignInstalled power, each kW (hp) 300 (400) A Existing DesignCrusher feed rate, each t/h 397.7 430.6 V Existing DesignLiner consumption kg/t 0.0122 0.0283 V Existing DesignLime Addition Point A Existing DesignLime Addition Rate kg/t 0.00 0.00 A Existing DesignLime Addition Rate t/d 0.0 0.0 V Existing DesignLime Silo Capacity t 200.0 200.0 A Existing Design
Fine Ore StockpileUnit Nominal Design Code Comment
Stockpile Live Capacity t 10,000 10,000 A Existing DesignStockpile Total Capacity t Existing DesignFeed Capacity t/h 795.3 861.1 V Existing DesignDischarge feeders capacity (reclaim capacity) t/h 226.3 237.3 V Existing DesignNo. of discharge belt feeders No. 2 2 C Existing DesignSpeed control variable variable V Existing Design
Tertiary Crusher Discharge Conveyor
Pennstrom Consulting Easton Process Consulting, Inc.
Page 4

ANATOLIADESIGN CRITERIA
Flotation Feed GrindingUnit Nominal Design Code Comment
Number of lines No. 1 1 A Existing DesignMill feed rate t/y 1,825,000 1,825,000 C Existing Design
t/d 5,000 5,000 C Existing DesignHourly Rate t/h 138.9 231.5 V Existing DesignBond Ball Mill index kW/t 9.0 14.0 C Existing DesignFinal Grind size P80 micron 74 74 C Existing Design
Flotation Feed Ball MillUnit Nominal Design Code Comment
Number of mills No. 1 1 C Existing DesignMill size, each diameter x length m 5.0 x 8.80 V Existing Design diameter x length ft 16.5 x 29 V Existing DesignInstalled power, each kW 3,375 V Existing DesignInstalled power, each hp 4,500 V Existing DesignSpeed, % of critical % 72 72 A Existing DesignBall charge by volume % 36 38 A Existing DesignNew feed rate t/h 138.9 237.8 V Existing DesignCirculating load % 300 300 A Existing DesignDischarge density % solids 70 65 A Existing DesignBall consumption kg/t 0.516 1.466 V Existing Design
t/d 2.58 7.33 V Existing DesignBall addition method Batch ball bucket and crane A Existing DesignCyclone size, diameter mm (in) 500 (20) A Existing DesignCyclone No. per line 6 8 V Existing DesignCyclone overflow density % solids 21 21 A Existing DesignCyclone overflow P80 micron 74 74 C Existing DesignLiner consumption kg/t 0.0697 0.1405 V Existing DesignLiner type Rubber or steel A Existing Design
Pennstrom Consulting Easton Process Consulting, Inc.
Page 5

ANATOLIADESIGN CRITERIA
Sulfide FlotationUnit Nominal Design Code
Flotation Percent Weight Pull % 10.8 AConcentrate production t/h 24.9 27.4 VConcentrate Sulfer Grade % 16.1 VConcentrate Gold Grade g/t 14.33 VGold Recovery % 85 85 CSulfur Recovery % 90Flotation Conditoning Tank No. 2 2 A
Rougher Flotation Conditioning TankUnit Nominal Design Code Comment
No Tanks No. 2 2Flowrate m3/hr 992 1,092 V New DesignSolids wt% 20.3 20.3 VTotal Residence Time minutes 30 30 ASolution Residence Time/Tank minutes 15 15 A New DesignRequired Volume m3 248 273 VDiameter m 7.50 7.50 AWorking HeightTank m 5.6 6.2 A New DesignFree Board + Heel m 1.5 1.5 ATotal Height m 7.1 7.7 VCalculated Volume m3 314 340 VMaterial of construction CS/RL New Design
Rougher FlotationUnit Nominal Design Code Comment
No Tanks No. 8 8Flowrate m3/hr 1,066 1,172 V New DesignVolume Expansion % 15Expanded Volume m3/hr 1,066 1,348Solids wt% 20.5 20.5 VTotal Residence Time minutes 30 30 ASolution Residence Time/Tank minutes 4 4 A New DesignRequired Volume m3 67 84 V
ft3 2,352 2,975Flotation Cell Size Selected m3 100
Cleaner Flotation Conditioning TankUnit Nominal Design Code Comment
No Tanks No. 2 2Flowrate m3/hr 158 174 V New DesignSolids wt% 24.4 24.4 VTotal Residence Time minutes 20 20 ASolution Residence Time/Tank minutes 10 10 A New DesignRequired Volume m3 26 29 VDiameter m 4.00 4.00 AWorking HeightTank m 2.1 2.3 A New DesignFree Board + Heel m 1.5 1.5 ATotal Height m 3.6 3.8 VCalculated Volume m3 45 48 VMaterial of construction CS/RL New Design
Cleaner FlotationUnit Nominal Design Code Comment
No Tanks No. 4 4Flowrate m3/hr 158 174 V New DesignVolume Expansion % 15Expanded Volume m3/hr 156 200Solids wt% 24.4 24.4 VTotal Residence Time minutes 20 20 ASolution Residence Time/Tank minutes 5 5 A New DesignRequired Volume m3 13 17 V
ft3 458 588Flotation Cell Size Selected m3 20
Concentrate ThickenerUnit Nominal Design Code Comment
Slurry Flowrate m3/hr 85 93 V New DesignOverflow Solution m3/hr 59 65 V New DesignUnderflow Slurry m3/hr 25 28Feed solids dry tph 25 27 V New DesignTemperature oC 22 22
Pennstrom Consulting Easton Process Consulting, Inc.
Page 6

ANATOLIADESIGN CRITERIA
Type High Rate A New DesignFeed slurry density wt% 24.4 As Required A New DesignUnderflow density wt% 58.0 58.0 A New DesignOverflow solids mg/l TBD A New DesignSolids Sg 3.40Solution Sg 1.00Slurry Sg (Feed/UF) 1.2/1.69Specific Area solids m2/ton/day 0.026 0.026 A New DesignThickener Area Calculated m2 16 17 V New DesignThickener Diameter Calculated m 4 4.67 V New Design
ft 15.31Material of construction CS New DesignSolution Composition Mill SolutionFlocculant Usage grams/t 15 A New Design
Concentrate Thickener Overflow TankUnit Nominal Design Code Comment
Flowrate m3/hr 59 65 V New DesignSolution Residence Time minutes 5 5 A New DesignRequired Volume m3 5 5 VDiameter m 2.0 2.0 ATank Height m 2.6 2.7 A New DesignCalculated Volume m3 8 9 VMaterial of construction Carbon steel New Design
Direct Feed GrindingUnit Nominal Design Code Comment
Number of lines No. 1 1 A New DesignMill feed rate t/y 1,094,999 1,094,999 C New Design
t/d 3,000 3,000 C New DesignHourly Rate t/h 138.9 138.9 V New DesignBond Ball Mill index kW/t 9.0 14.0 C New DesignFinal Grind size P80 micron 74 74 C New DesignDirect Feed Ball Mill
Unit Nominal Design Code CommentNumber of mills No. 1 1 C New DesignMill size, each diameter x length m 3.0 x 5.0 V New Design diameter x length ft 10 x 16 V New DesignInstalled power, each kW 2,000 V New DesignInstalled power, each hp 3,000 V New DesignSpeed, % of critical % 72 72 A New DesignBall charge by volume % 36 38 A New DesignNew feed rate t/h 138.9 V New DesignCirculating load % 300 300 A New DesignDischarge density % solids 70 65 A New DesignBall consumption kg/t 0.516 1.466 V New Design
t/d 0.01 0.03 V New DesignBall addition method Batch ball bucket and crane A New DesignCyclone size, diameter mm (in) 300 (12) A New DesignCyclone No. per line 6 8 V New DesignCyclone overflow density % solids 26 26 A New DesignCyclone overflow P80 micron 74 74 C New DesignLiner consumption kg/t 0.0697 0.1405 V New DesignLiner type Rubber or steel A New Design
Direct Feed Cyclone Overflow Trash ScreenUnit Nominal Design Code Comment
Type Horizontal BeltFeed Rate m3/hr 439 483 V New DesignType Linear A New DesignFlow rating m3/h/m2 125 A New DesignScreen Area Required m2 4 A New DesignScreen opening micron 600 A New DesignScreen Length m 2.00 A New DesignScreen Width m 3.00 A New Design
Pennstrom Consulting Easton Process Consulting, Inc.
Page 7

ANATOLIADESIGN CRITERIA
Direct Feed Grinding ThickenerUnit Nominal Design Code Comment
Slurry Flowrate m3/hr 439 483 V New DesignOverflow Solution m3/hr 290 319 V New DesignUnderflow Slurry m3/hr 150 165Feed solids dry tph 182 201 V New DesignTemperature oC 22 22Type High Rate A New DesignFeed slurry density wt% 27.3 As Required A New DesignUnderflow density wt% 58.0 58.0 A New DesignOverflow solids mg/l TBD A New DesignSolids Sg 2.80Solution Sg 1.00Slurry Sg (Feed/UF) 1.2/1.60Specific Area solids m2/ton/day 0.085 0.085 A New DesignThickener Area Calculated m2 372 409 V New DesignThickener Diameter Calculated m 22 22.82 V New Design
ft 74.87Material of construction CS New DesignSolution Composition Mill SolutionFlocculant Usage grams/t 30 A New Design
Direct Feed Thickener Overflow TankUnit Nominal Design Code Comment
Flowrate m3/hr 290 319 V New DesignSolution Residence Time minutes 5 A New DesignRequired Volume m3 0 27 VDiameter m 3.5 3.5 ATank Height m 5.0 5.0 A New DesignCalculated Volume m3 48 48 VMaterial of construction Carbon steel New Design
Direct Feed Mill Solution TankUnit Nominal Design Code Comment
Flowrate m3/hr 388 426 V New DesignSolution Residence Time minutes 30 30 A New DesignRequired Volume m3 194 213 VDiameter m 6.50 7.00 AWorking HeightTank Height m 5.8 5.5 A New DesignFree Board + Heel m 1.2 1.5Total Height m 7.0 7.0Calculated Volume m3 232 269 VMaterial of construction Carbon steel New Design
Pennstrom Consulting Easton Process Consulting, Inc.
Page 8
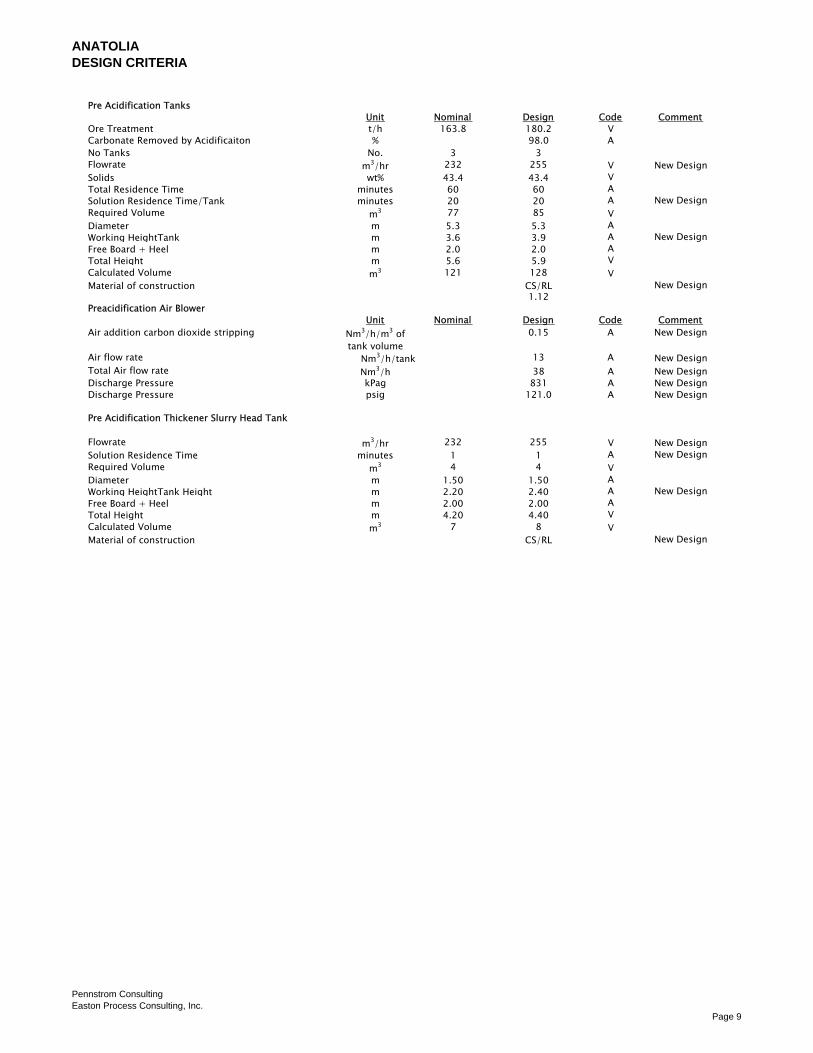
ANATOLIADESIGN CRITERIA
Pre Acidification TanksUnit Nominal Design Code Comment
Ore Treatment t/h 163.8 180.2 VCarbonate Removed by Acidificaiton % 98.0 ANo Tanks No. 3 3Flowrate m3/hr 232 255 V New DesignSolids wt% 43.4 43.4 VTotal Residence Time minutes 60 60 ASolution Residence Time/Tank minutes 20 20 A New DesignRequired Volume m3 77 85 VDiameter m 5.3 5.3 AWorking HeightTank m 3.6 3.9 A New DesignFree Board + Heel m 2.0 2.0 ATotal Height m 5.6 5.9 VCalculated Volume m3 121 128 VMaterial of construction CS/RL New Design
1.12Preacidification Air Blower
Unit Nominal Design Code CommentAir addition carbon dioxide stripping Nm3/h/m3 of
tank volume0.15 A New Design
Air flow rate Nm3/h/tank 13 A New DesignTotal Air flow rate Nm3/h 38 A New DesignDischarge Pressure kPag 831 A New DesignDischarge Pressure psig 121.0 A New Design
Pre Acidification Thickener Slurry Head Tank
Flowrate m3/hr 232 255 V New DesignSolution Residence Time minutes 1 1 A New DesignRequired Volume m3 4 4 VDiameter m 1.50 1.50 AWorking HeightTank Height m 2.20 2.40 A New DesignFree Board + Heel m 2.00 2.00 ATotal Height m 4.20 4.40 VCalculated Volume m3 7 8 VMaterial of construction CS/RL New Design
Pennstrom Consulting Easton Process Consulting, Inc.
Page 9

ANATOLIADESIGN CRITERIA
PreAcidification Thickener
Slurry Flowrate m3/hr 233 256 V New DesignOverflow Solution m3/hr 59 65 V New DesignUnderflow Solution m3/hr 189 208 VFeed solids dry tph 165 181 V New DesignTemperature oCType High Rate A New DesignFeed slurry density wt% 48.00 As Required A New DesignUnderflow density wt% 58 58 A New DesignOverflow solids mg/l TBD A New DesignSolids Sg 2.933 VSolution Sg 1.019 VSlurry Sg (Feed/UF) 1.5/1.6 VArea solids m2/ton/day 0.100 0.100 A New DesignThickener Area Calculated m2 396 435 V New DesignThickener Diameter Calculated m 22 24 V New DesignMaterial of construction CS/RL A New DesignSolution Composition 0-15 gpl H2SO4 VFlocculant Usage grams/t 30 A New Design
Pre Acidification Thickener Overflow Tank Comment
Flowrate m3/hr 59 65 V New DesignSolution Residence Time minutes 5 5 A New DesignRequired Volume m3 5 5 V New DesignDiameter m 2.5 2.5 A New DesignWorking HeightTank Height m 1.0 1.1 A New DesignFree Board + Heel m 1.5 1.5 A New DesignTotal Height m 2.5 2.6 V New DesignCalculated Volume m3 12 13 V New DesignMaterial of construction CS/RL New Design
Pennstrom Consulting Easton Process Consulting, Inc.
Page 10

ANATOLIADESIGN CRITERIA
Pressure OxidationUnit Nominal Design Code Comment
No. of Parallel Circuits No 1 1 V New DesignOre Feed Rate t/hr 164.8 181.3 V New DesignPre Acidification Thickener Underflow wt % 58 58 A New DesignTotal Slurry Flowrate m3/hr 219 241 V New DesignSlurry Flowrate per circuit m3/hr 219 241 V New Design
Pressure Leach Feed TankUnit Nominal Design Code Comment
No Tanks No. 2 2 New DesignFlowrate m3/hr 219 241 V New DesignSolids tph 165 181 V New DesignSolids wt% 55.0 55.0 V New DesignTotal Residence Time minutes 720 720 A New DesignSolution Residence Time/Tank minutes 360 360 A New DesignRequired Volume m3 3,940 4,334 V New DesignDiameter m 17.8 17.8 A New DesignWorking Height m 15.8 17.4 A New DesignFree Board + Heel m 8.2 8.2 A New DesignTotal Height m 24.0 25.6 V New DesignCalculated Volume m3 5,981 6,379 V New DesignMaterial of construction CS/RL A New Design
Oxygen RequirementsUnit Nominal Design Code Comment
Oxygen Consumption % 72 72 V New DesignSulfur Oxidation % 90.0 90.0 A New DesignOxygen Partial Pressure kPa 700 700 A New Design
psia 90-115 90-115 A New DesignOxygen Purity % 99 99 A New DesignUsage rate kg 100% O2/hr 24,800 27,007 V New DesignDelivery Pressure kPa 3,600 3,800 A New Design
psia 522 551 V New Design
Pennstrom Consulting Easton Process Consulting, Inc.
Page 11

ANATOLIADESIGN CRITERIA
Pressure Oxidation VesselUnit Nominal Design Code Comment
Type Horizontal No. Compartments No. 6Compartments Configuration
Compartment Baffles & Walls Ti Grade 2Autoclave Temperature oC 225 225 A New DesignAutoclave Pressure kPa-a 3,200 3800/full vacuum A New Design
psia 464 551 V New DesignAutoclave Retention Time min 60 60 A New DesignVolume Filled (Allowance for Vapor Phase) % 78 78 A New DesignRelief Valve Set Pressure kPa 3,600 3,600 A New DesignVessel Internal Diameter mm 4,000Vessel Length t/t mm 26,000Vessel Outside Diameter (Approximate) mm 4,800Vessel Heads 2:1 Elliptical
Pressure Vessel Nozzel Summary Location No./DiameterVessel Agitator Nozzles Top - 0o 6/1600 mmVessel Drain/Oxygen-Reagent Inlet Nozzles Bottom - 180 o 6/400 mmVessel Manway/Discharge Nozzles Offset - 5-20 o 4/1600 mmVessel Instrument Nozzles Offset 0-20 o 4/100 mm
Pressure Vessel Brick Lining Brick - (2-3) layers with Chemical membrane or lead liningBrick Lining Thickness mm 230 254 A New Design
Pressure Vessel Agitators Unit Nominal Design Code
No Agitators No. 6 New DesignType Dual Impeller axial flow upper, A New Design
radial flow lower A New DesignConfiguration 2 Primary Dual speed A New Design
4 Secondary one speed A New Design(Quoted A340-Up-Pumping) A
Pressure Vessel Slurry Composition - Compartment 6Unit Nominal Design Code Comment
Flowrate in Final Compartment - C6 m3/hr 257 283 V New DesignSolids tph 162 178 VSolution tph 180 197 VSolids wt% 47.1 47.1 V New DesignSolids Sg 2.6 VSolution Sg 0.9 VSlurry Sg 1.3 V
Pressure Vessel Slurry Composition - Compartment 6Sulfuric Acid gpl 96 VCopper Sulfate gpl 4 VFerric Sulfate gpl 0.04 VChloride ppm <500 V
6 compartments. C1 and C2 combined with partial wall baffel, C3-C4-C5-C6 overflow baffel
Pennstrom Consulting Easton Process Consulting, Inc.
Page 12

ANATOLIADESIGN CRITERIA
Flash VesselUnit Nominal Design Code
Design Pressure kPa g 101 200/ Full Vacuum A New DesignInlet Slurry Temperature oC 225 230 A New DesignOutlet Slurry Temperature oC 108 110 A New DesignGas Rise Velocity m/s 1.3 A New DesignVessel Internal Diameter mm 4,800 A New DesignVessel Length t/t mm 10,300 A New DesignVessel Heads 2:1 Elliptical A New Design
Flash Vessel Nozzel Summary Location No./DiameterVessel Slurry Inlet Nozzles Top 1/250 mm AVessel Gas Outlet Nozzles Top 1/1400 mm AVessel Drain Nozzles Bottom 1/200 mm ASlurry Discharge Nozzel Side 1/250 mm AVessel Manway Side 1/1600 mm AVessel Instrument Nozzles Side/Top 4/100 mm A
Flash Vessel Slurry CompositionSulfuric Acid gpl 158 VCopper Sulfate gpl 6 VFerric Sulfate gpl 5 VChloride ppm <500 V
Flash Vessel Lining Brick 2 layers & Chemical membrane New DesignBrick Lining Thickness mm ~150 New Design
Venturi ScrubberUnit Nominal Design Code Comment
Gas Flowrate Nm3/hr 78,913 86,804 V New DesignPressure Drop kPa 5 minimum 10 A New Design
Pennstrom Consulting Easton Process Consulting, Inc.
Page 13

ANATOLIADESIGN CRITERIA
CCD Feed TankUnit Nominal Design Code Comment
Flowrate m3/hr 182 200 V New DesignSolution Residence Time minutes 120 120 A New DesignRequired Volume m3 364 400 V New DesignDiameter m 8.0 8.0 A New DesignWorking HeightTank Height m 7.2 8.0 A New DesignFree Board + Heel m 2.7 2.7 A New DesignTotal Height m 9.9 10.7 V New DesignCalculated Volume m3 497 537 V New DesignMaterial of construction CS/Brick New Design
CCD ThickenersCCD 1 - Acid Decant Thickener
Unit Nominal Design Code CommentNo. Thickeners No 1 1 A New DesignCCD Underflow percent solids % 58.0 58.0 V New DesignCCD feed rate, solids t/h 163 179 V New DesignSulfuric Acid Concentration in Feed gpl 158.0 175 V New DesignSolids Loading m2/ton/day 0.11 0.11 V New DesignArea m2 429 472 V New DesignDiameter m 23 25 V New DesignFlocculant Additon Rate CCD 1 g/ton 50 50 V New DesignFlocculant Addition kg/day 195 215 V New DesignMaterials of Construction CS/Brick V New Design
CCD Thickeners 2 and 3 Unit Nominal Design Code Comment
No. CCD Thickeners No 2 2 A New DesignCCD Underflow percent solids % 58.0 58.0 V New DesignCCD feed rate, solids t/h 163 179 V New DesignSulfuric Acid Concentration in Feed gpl 5.0 15 V New DesignSolids Loading m2/ton/day 0.11 0.11 A New DesignArea m2 429 472 V New DesignDiameter m 23 25 V New Design
New DesignFlocculant Additon Rate CCD 1 g/ton 50 50 A New DesignFlocculant Additon Rate CCD 2 g/ton 30 30 A New DesignFlocculant Additon Rate CCD 3 g/ton 30 30 A New DesignFlocculant Additon kg/day 429 472 V New Design
New DesignWash Ratio t/t 7.0 7.0 New DesignWash Solution Reclaim Water New DesignWash Flow Rate m3/hr 837 1,050 New Design
Pennstrom Consulting Easton Process Consulting, Inc.
Page 14

ANATOLIADESIGN CRITERIA
Solution NeutralizationUnit Nominal Design Code Comment
No. Stage(s) 2Configuration 1st Stage Limestone A New Design
2nd Stage Lime A New DesignNeutralization Feed New DesignCombined CCD Overflows m3/hr 952 1,047.2 V New DesignSulfuric Acid Concentration in Feed gpl 14.3 14.3 V New Design
Limestone Neutralization TanksUnit Nominal Design Code Comment
No Tanks No. 3 3 New DesignFlowrate m3/hr 952 1,047.2 V New DesignSulfuric Acid Concentration in Feed gpl 13 New DesignTotal Residence Time minutes 68 68 A New DesignSolution Residence Time/Tank minutes 23 23 A New DesignRequired Volume m3 360 396 V New DesignDiameter m 8.0 8.0 A New DesignWorking HeightTank m 7.2 7.9 A New DesignFree Board + Heel m 2.7 2.7 A New DesignTotal Height m 9.9 10.6 V New DesignCalculated Volume m3 497 532 V New DesignMaterial of construction CS/RL New Design
Limestone Neutralization ThickenerUnit Nominal Design Code Comment
Slurry Flowrate m3/hr 945 1,040 V New DesignOverflow Solution m3/hr 840 924 V New DesignUnderflow Slurry m3/hr 105 116 New DesignFeed solids dry tph 76 83 V New DesignTemperature oC 33 33 New DesignType High Rate A New DesignFeed slurry density wt% 7.6 As Required A New DesignUnderflow density wt% 50.0 50.0 A New DesignOverflow solids mg/l TBD A New DesignSolids Sg 2.50 New DesignSolution Sg 1.00 New DesignSlurry Sg (Feed/UF) 1.05/1.44 New DesignSpecific Area solids m2/ton/day 0.098 0.089 A New DesignThickener Area Calculated m2 178 178 V New DesignThickener Diameter Calculated m 15 15.06 V New Design
ft 49.41 V New DesignMaterial of construction CS/RL New DesignSolution Composition Neutralized Solution
New DesignFlocculant Usage grams/t 20 A New Design
Pennstrom Consulting Easton Process Consulting, Inc.
Page 15

ANATOLIADESIGN CRITERIA
Limes Neutralization TanksUnit Nominal Design Code Comment
No Tanks No. 2 2 New DesignFlowrate m3/hr 840 924.0 V New DesignSulfuric Acid Concentration in Feed gpl 0.3 0-1 New DesignTotal Residence Time minutes 40 40 A New DesignSolution Residence Time/Tank minutes 20 20 A New DesignRequired Volume m3 280 308 V New DesignDiameter m 8.0 8.0 A New DesignWorking HeightTank m 5.6 6.1 A New DesignFree Board + Heel m 2.7 2.7 A New DesignTotal Height m 8.3 8.8 V New DesignCalculated Volume m3 416 441 V New DesignMaterial of construction CS A New Design
Limestone GrindingUnit Nominal Design Code Comment
Number of lines No. 1 1 A New DesignMill feed rate t/y 521,921 767,854 C New Design
t/d 1,589 2,337 C New DesignHourly Rate t/h 66.2 97.4 V New DesignBond Ball Mill index kW/t 9.0 14.0 C New DesignFinal Grind size P80 micron 74 74 C New Design
Limestone Ball MillUnit Nominal Design Code Comment
Number of mills No. 1 1 C New DesignMill size, each New Design diameter x length m 4.2 x 5.5 V New Design diameter x length ft 14 x 18 V New DesignInstalled power, each kW 1,870 V New DesignInstalled power, each hp 2,500 V New DesignSpeed, % of critical % 72 80 A New DesignBall charge by volume % 36 38 A New DesignNew feed rate t/h 66.2 97.4 V New DesignCirculating load % 100 100 A New DesignDischarge density % solids 70 65 A New DesignBall consumption kg/t 0.516 1.466 V New Design
t/d 0.82 3.43 V New DesignBall addition method Batch ball bucket and crane A New DesignCyclone size, diameter mm (in) 254 (10) A New DesignCyclone No. per line 3 3 V New DesignCyclone overflow density % solids 35 35 A New DesignCyclone overflow P80 micron 74 74 C New DesignLiner consumption kg/t 0.0697 0.1405 V New DesignLiner type Rubber or steel A New Design
Pennstrom Consulting Easton Process Consulting, Inc.
Page 16

ANATOLIADESIGN CRITERIA
Limestone Grinding Cyclone Overflow Trash ScreenUnit Nominal Design Code Comment
Type Horizontal BeltFeed Rate m3/hr 170 187 V New DesignType Linear A New DesignFlow rating m3/h/m2 125 A New DesignScreen Area Required m2 1 A New DesignScreen opening micron 600 A New DesignScreen Length m 1.50 A New DesignScreen Width m 2.00 A New Design
Limestone Grinding ThickenerUnit Nominal Design Code Comment
Slurry Flowrate m3/hr 125 138 V New DesignOverflow Solution m3/hr 50 55 V New DesignUnderflow Slurry m3/hr 74 82 New DesignFeed solids dry tph 66 73 V New DesignTemperature oC 20 20 New DesignType High Rate A New DesignFeed slurry density wt% 38.4 As Required A New DesignUnderflow density wt% 58.0 58.0 A New DesignOverflow solids mg/l TBD A New DesignSolids Sg 2.50 New DesignSolution Sg 1.00 New DesignSlurry Sg (Feed/UF) 1.29/1.53 New DesignSpecific Area solids m2/ton/day 0.075 0.075 A New DesignThickener Area Calculated m2 119 131 V New DesignThickener Diameter Calculated m 12 12.92 V New Design
ft 42.38 New DesignMaterial of construction CS New DesignSolution Composition Mill Solution New DesignFlocculant Usage grams/t 15 A New Design
Limestone Grinding Overflow TankUnit Nominal Design Code Comment
Flowrate m3/hr 95 104 V New DesignSolution Residence Time minutes 240 240 A New DesignRequired Volume m3 380 418 New DesignDiameter m 9.00 9.00 New DesignWorking HeightTank Height m 6.0 6.6 New DesignFree Board + Heel m 1.2 1.0 New DesignTotal Height m 7.2 7.6 V New DesignCalculated Volume m3 458 483 A New DesignMaterial of construction CS A New Design
Limestone Ground Slurry Storage TankUnit Nominal Design Code Comment
Flowrate m3/hr 74 82 V New DesignSolution Residence Time minutes 30 240 A New DesignRequired Volume m3 37 327 V New DesignDiameter m 7.50 8.50 A New DesignWorking HeightTank Height m 0.8 5.8 A New DesignFree Board + Heel m 1.2 3.4 New DesignTotal Height m 2.0 9.2 New DesignCalculated Volume m3 88 521 V New DesignMaterial of construction CS New Design
Pennstrom Consulting Easton Process Consulting, Inc.
Page 17

ANATOLIADESIGN CRITERIA
Lime Slaking Plant Unit Nominal Design Code Comment
Number of lines No. 1 1 A New DesignMill feed rate t/y 39,420 43,362 C New Design
t/d 120 132 C New DesignHourly Rate t/h 5.0 5.5 V New DesignBond Ball Mill index kW/t 9.0 12.0 C New DesignFeed size P80 micron 6,350 6,350 C New DesignFinal Grind size P80 micron 40 40 C New Design
Lime Storage SiloCapacity Days 5 5Bulk Density t/m3 0.65 0.65Volume Required t/m3 923 1,015No Tanks No. 3 3Required Volume m3 308 338 VDiameter m 6.5 6.5 AWorking HeightTank m 9.3 10.2 A New DesignFree Board m 1.0 1.0 ATotal Height m 10.3 11.2 VCalculated Volume m3 342 372 VMaterial of construction CS New Design
Lime Slaking MillUnit Nominal Design Code Comment
Number of mills No. 1 1 C New DesignMill size, each New Design diameter x length m 1.11 x 11.33 V New Design diameter x length ft 3.66 x 37' 2" V New DesignInstalled power, each kW 298 V New DesignInstalled power, each hp 400 V New DesignSpeed, % of critical % 72 80 A New DesignBall charge by volume % 36 38 A New DesignNew feed rate t/h 5.0 5.5 V New DesignCirculating load % 100 100 A New DesignDischarge density % solids 70 65 A New DesignBall consumption kg/t 0.075 0.075 V New Design
t/d 0.01 0.01 V New DesignBall addition method Batch ball bucket and crane A New DesignCyclone size, diameter mm (in) 75 (3) A New DesignCyclone No. per line 2 2 V New DesignCyclone overflow density % solids 20 20 A New DesignCyclone overflow P80 micron 40 40 C New DesignLiner consumption kg/t 0.0300 0.0700 V New DesignLiner type Rubber or steel A New Design
Pennstrom Consulting Easton Process Consulting, Inc.
Page 18

ANATOLIADESIGN CRITERIA
Slaked Lime Storage TankUnit Nominal Design Code Comment
Flowrate m3/hr 10 11 V New DesignSolution Residence Time minutes 24 24 A New DesignRequired Volume m3 240 264 V New DesignDiameter m 7.00 7.00 A New DesignWorking HeightTank Height m 6.2 6.9 A New DesignFree Board + Heel m 2.8 2.8 New DesignTotal Height m 9.0 9.7 New DesignCalculated Volume m3 344 371 V New DesignMaterial of construction Carbon steel New Design
CCD Slurry Lime Neutralization TankUnit Nominal Design Code Comment
Flowrate m3/hr 288 317 V New DesignSolution Residence Time minutes 120 120 A New DesignRequired Volume m3 576 634 V New DesignDiameter m 10.0 10.0 A New DesignWorking HeightTank Height m 7.3 8.1 A New DesignFree Board + Heel m 3.1 3.1 A New DesignTotal Height m 10.4 11.2 V New DesignCalculated Volume m3 817 880 V New DesignMaterial of construction CS New Design
Pennstrom Consulting Easton Process Consulting, Inc.
Page 19

ANATOLIADESIGN CRITERIA
Leach CircuitUnit Nominal Design Code Comment
Leach feed rate dry t/h 242.2 278.6 VSlurry Percent Solids % 55.0 20.5 ASlurry feed rate m3/h 292.0 335.8 VGold recovery, CIP % 95.0 95.0 CTrash Screen Type Vibrating ANumber of Trash Screens No. 3.0 AScreen Aperature mm 0.25 ANumber of Leach Stages No. 4.0 ATotal Leach Retention Time h 24.0 ARetention Time per Stage h 6.0 VLeach Tank Size m3 1,752 VAgitators Power kW 75 AAgitator Type hollow shaft dual blade AAir Injection Method AAir Quantity per Stage Nm3/hr (scfm) 170 (100) AAir Pressure kPa (psig) 175 (25) ATotal Air Quantity Nm3/hr (scfm) 680 (400) VNaCN Reagent Strength % 20.0 25.0 ANaCN Addition Rate kg/t ore 0.35 0.50 ANaCN Consumption t/d 1.8 2.5 V
Carbon In Pulp (CIP)Unit Nominal Design Code Comment
CIP feed rate dry t/h 242.2 278.5 VSlurry Percent Solids % 55.0 20.5 VSlurry feed rate m3/h 292.0 335.8 VNumber of Leach Stages No. 6.0 ATotal Adsorption Retention Time h 2.0 A Vendor to confirmRetention Time per Stage h 0.333 V Vendor to confirmCIP Tank Size m3 135 135 V Vendor to confirmAgitators Power kW 45 AAgitator Type hollow shaft dual blade AAir Injection Method AAir Quantity per Stage Nm3/hr (scfm) 42.5 (25) AAir Pressure kPa (psig) 175 (25) ATotal Air Quantity Nm3/hr (scfm) 255 (150) VCarbon Concentration g/l 36.0 43.2 A Vendor to confirmCarbon Size mesh 6 x 16 ACarbon Type coconut shell ATons Carbon per Stage t 4.8 5.7 V Vendor to confirmTons Carbon Advanced per Day t/d 4.8 5.7 V Vendor to confirmIntertank Screen Type Kemix type ACarbon Transfer Method Arecessed impeller pump
via agitator shaft
via agitator shaft
Pennstrom Consulting Easton Process Consulting, Inc.
Page 20

ANATOLIADESIGN CRITERIA
Cyanide DestructUnit Nominal Design Code Comment
Cyanide Destruct Method Metabisulfite / airTarget CN- Discharge Limit mg/l 1.0 1.0 A Client to confirmTarget CNWAD Discharge Limit mg/l 10.0 10.0 C Client to confirmTarget CNTOT Discharge Limit mg/l 250 250 A Client to confirm
Na2S2O5 Reagent Strength % 25 25 ARatio of Na2S2O5 / kg CN 7.08 7.08 ATotal kg Na2S2O5 / t ore kg/t 1.24 1.77 VDaily Na2S2O5 Consumption t/d 6.20 8.85 V
CuSO4.5H2O Reagent Strength % 25 25 ARatio of CuSO4.5H2O / CN 0.25 0.25 ATotal kg CuSO4.5H2O / t ore kg/t 0.04 0.06 VDaily CuSO4.5H2O Consumption t/d 0.22 0.31 V
Reagent Addition point CN destruct feed AAir Added to CN Destruct tanks Nm3/hr 175 A
kPa 175 ATank Type agitated cylindrical ANumber of tanks 1 ATank Size m3 1,752 V RDi requestTotal residence time hr 6 A RDi requestResidence time per tank hr 6 V RDi request
Tailing ThickenerUnit Nominal Design Code Comment
Thickener type high density ATailing production dry t/h 242.0 278.3 VThickener feed density % solids 54 21 ATailing slurry flow m3/h 224.0 257.6 VDesign factor m2/(t/d) 0.026 0.026 AThickener diameter m 13.9 14.9 VUnderflow density % solids 65.0 65.0 AUnderflow slurry flow m3/h 210.0 241.5 VUnderflow Solids SG 2.60 AUnderflow slurry SG 1.67 VOverflow flow rate m3/h 192.0 220.8 VFlocculant type Anionic high molecular weight AFlocculant consumption g/t 6.0 10.0 A
kg/d 30.0 50.0 VFlocculant strength g/l 0.2 0.2 AFlocculent addition rate m3/h 7.3 13.9 VTailings ultimate density (for pumping purposes) % solids 75.0 75.0 A
Pennstrom Consulting Easton Process Consulting, Inc.
Page 21

ANATOLIADESIGN CRITERIA
Heap Leaching and CIC CircuitUnit Nominal Design Code Comment
Heap leach feed rate t/y 0 0 Ct/d 0 10,500 Ct/h 0.0 583.3 V
Final crush size, P80 mm 12.7 9.5 A
Heap type permanent pad AHeap stacking method er conveyors & radial stacker A
Total leach and load cycle d 65 65 APregnant leach cycle d 45 45 APregnant leach recovery % 70 70 ATotal leach recovery % 75 75 ALift height m 6 9 AMaximum pad height m 102 102 CSolution application rate l/min/m2 0.163 0.204 AOre in place density t/m3 1.82 1.82 ADays for loading & piping d 20 20 A
Area under leach m2 57,692 0 VArea required for pad preparation m2 25,641 0 VTotal pad area required m2 83,333 0 V
Ore free draining moisture % 10.0 12.0 APreg solution flow rate m3/h 564 0 VHeap leach make up water required m3/h 0.0 40.8 VLeach solution NaCN concentration g/l 0.5 1.0 ACyanide addition point CIC feed launder ACyanide consumption kg/t ore 0.25 1.75 A
kg/h 0.0 1,020.8 VCyanide addition rate @ 20% NaCN conc. m3/h 0.00 5.10 V
CIC Circuit Type overflow cascading ANumber of stages 6 AVertical flow velocity m/min 1.00 0.00 ABed expansion percentage % 75 150 AColumn diameter m 3.5 #DIV/0! VColumn height m 2.50 2.50 VCarbon density kg/m3 480 480 ACarbon size mesh 6 x 16 12 x 30 ACarbon per CIC vessel t 3.9 #DIV/0! VCarbon transfer method recessed impeller pump ACarbon transferred per day t 2.5 5.0 ACarbon safety screen type stationary S.S. wire mesh ACarbon safety screen aperature mesh 40 50 ACIC Circuit Recovery % 95 95 A
Pennstrom Consulting Easton Process Consulting, Inc.
Page 22

ANATOLIADESIGN CRITERIA
Carbon HandlingUnit Nominal Design Code Comment
Carbon from CIL t/d 4.8 5.7 VCarbon from CIC t/d 2.5 5.0 VTotal carbon treated per day t/d 7.3 8.4 VCarbon treated per strip t 5.0 5.0 ACarbon strips per day No. 1.5 1.7 V
Copper StrippingUnit Nominal Design Code Comment
Copper stripping ambient concentrated cyanide strip ACyanide strength % w/w 1.0 2.0 ANaOH strength % w/w 0.2 0.4 ACopper strip pre-soak / recirculation time h 4.0 6.0 ACopper Strip Time h 4.0 6.0 ACopper strip vessel volume m3 10.4 10.4 VCopper strip vessel diameter m 1.6 1.6 VCopper strip vessel height m 5.4 5.4 VCopper strip solution bed volumes required No. 3.0 4.0 ACarbon void space percentage % 66.0 66.0 ABed volume quantity m3 6.9 6.9 VCopper strip solution total volume m3 20.6 27.5 VCopper strip solution tank volume m3 30.3 30.3 VCopper electroplating cell size m3 4.2 4.2 ACathodes per cell No. 14 14 ACathode type S.S. starter sheet AAnodes per cell No. 15 15 ACell amperage required amp 1,500 1,900 A
Gold StrippingUnit Nominal Design Code Comment
Gold stripping method ZadraStrip Cycle Times Pre-soak h 1.5 2.0 A Strip h 7.0 8.0 A Rinse h 0.5 1.0 ALoaded Carbon from CIP, Au Assay g/t 2,312.2 3,900.0 VLoaded Carbon from Heap Leach, Au Assay g/t 2,510.5 4,900.0 VLoaded Carbon Combined, Au Assay g/t 2,380.1 3,500.0 VStripped Carbon, Au Assay g/t 47.6 70.0 ANumber of Vessels No. 2 2 ACarbon capacity t 5 5 AGold strip vessel volume m3 10.4 11.5 VGold strip vessel diameter m 1.3 1.3 VGold strip vessel height m 7.5 8.2 VGold strip solution bed volumes required No. 8.0 10.0 ACarbon void space percentage % 66.0 66.0 ABed volume quantity m3 6.9 7.6 VGold strip solution total volume m3 55.0 75.6 VGold strip solution tank volume m3 83.2 83.2 VPreheat time h 1.25 1.50 AAmbient water temperature o C 15 5 AFinal preheat temperature o C 95 110 AFlow rate m3/h 7.3 8.4 VPreheat energy input Btu/h 7.5 x 10⁶ 7.5 x 10⁶ VHeat ExchangerType plate and frame AHot side in o C 68 VHot side out o C 130 VCold side in o C 10 VCold side out o C 85 VFlow rate m3/h 31 VDesign duty Btu/h 7.5 x 10⁶ VStrip Solution Heater Type boiler AMax cold side in o C 85 AMax hot side out o C 143 AFlow rate m3/h 31 ADesign duty Btu/hr 7 x 10⁶ A
Pennstrom Consulting Easton Process Consulting, Inc.
Page 23

ANATOLIADESIGN CRITERIA
Gold Stripping Operating ConditionsUnit Nominal Design Code Comment
Flow rate m3/h 7.2 8.6 VFluidizing force (vertical flow velocity) m3/h /m2 10.0 12.0 VStrip operating temperature o C 130 143 AStrip operating pressure kPa 500 700 AStrip solution NaCN concentration % w/w 1.5 3.0 ASodium cyanide makeup per strip kg 206.3 567.2 V20% NaCN added m3 1.03 2.84 VStrip solution NaOH concentration % w/w 1.0 2.0 ASodium hydroxide makeup per strip kg 137.5 378.1 V50% NaOH added m3 0.69 1.89 V
Strip Solution TankCapacity m3 83.2 83.2 VTank diameter m 4.5 4.5 VTank height m 5.2 5.2 V
ElectrowinningNumber of cells No. 2 2 AGold electroplating cell size m3 3.5 3.5 ACathodes per cell No. 28 28 ACathode type S.S. wool AAnodes per cell No. 29 29 ASteel wool per cathode kg 2.75 2.75 ASurface area per cathode m2 5.50 5.50 VCell amperage required amp 1,500 2,000 ACell voltage required volt 3.0 10.0 ACell cleaning frequency d 7 5 AElectrowinning time hrs 12 16 AElectrowinning feed m3/h 5.0 8.0 ANo. of electrowinning passes m3/h 1.5 2.4 AElectrolyte type caustic cyanide solution AElectrolyte temperature o C 85 A
RefiningUnit Nominal Design Code Comment
Gold pouring frequency d 7 5 APours per day No. 2 3 AOunces per pour t.oz. 1,817 1,038 AOunces per bar t.oz. 750 750 ADore fineness 0.850 0.800 ADore produced per pour t.oz. 2,138 1,298 VDore bars produced per pour No. 2.9 1.7 VGold furnace type gas fired manual tilt AGold furnace crucible size 100 lb alluminum A
Pennstrom Consulting Easton Process Consulting, Inc.
Page 24

ANATOLIADESIGN CRITERIA
Carbon Acid Wash Unit Nominal Design Code Comment
Number of units No. 1Carbon capacity in vessel t 5.0 5.0 VOperating volume m3 10.4 12.5 VOne bed volume m3 10.4 12.5 VVoid space in filled vessel % 60 60 AVoid space in filled vessel m3 6.3 7.5 VGold strip vessel volume m3 13.8 VGold strip vessel diameter m 1.80 VGold strip vessel height m 5.40 VAcid Wash Cycle Acid recirculation min 60 (2 BV/hr) A Water rinse min 60 (2 BV/hr) A Transfer to strip min 30 AAcid Information Type Hydrochloric A Strength % 1.45 (20o Baume) A Specific gravity sp.g. 1.16 1.16 A Delivery Bulk tanker A Storage loads 1.5 A Volume m3 26 VOperating capacity m3 5 VStrong acid addition method Centrifugal pump AStrong acid flow rate m3/h 3 AAcid injection time min 11 VWater addition flow rate m3/h 31 AWater addition time min 11 VAcid Wash InformationAcid wash acid strength % w/w 3.0 3.0 AHCL consumption per wash kg 218 261 VMixing ratio: water to acid v/v 11 VRecirculation pump type Centrifugal A3% HCL recirculation rate m3/h 12.6 (2 BV/hr) 15.0 (2 BV/hr) VWater Rinse Information Water type Process A Amount used (2 BV) m3 12.6 15.0 VCarbon Transfer from AW to Strip Vessel Type of transfer Batch with recessed impeller pump Flow rate m3/h 31 37.2 A
Carbon RegenerationUnit Nominal Design Code Comment
Kiln feed hopper capacity t 6.5 7.8 VKiln feed hopper capacity m3 14 16 VCarbon regeneration requirement tpd 7.3 8.4 VCarbon regeneration kiln availability % 76 65 VCarbon regeneration kiln capacity kg/hr 398 535 VRegeneration time min 15 – 20 ARegeneration kiln type 500 kg/h vertical, shell & tube APost regeneration cooling Water quench ARegenerated carbon return slurry w/w % 20 ARegenerated carbon sizing screen type Rectangular vibrating ARegenerated carbon sizing screen aperture mm 1.18 ACIL carbon attrition & degradation rate kg/t ore 0.025 0.025 A
kg carbon/d 125 125 VCIC carbon attrition & degradation rate kg/t ore 0.005 0.005 A
kg carbon/d 0 53 VTotal carbon consumed kg carbon/d 125 178 VCarbon delivery method Supersacks ACarbon addition method Batch by the bag ACarbon addtion frequency 1 - 2 per week VCarbon additoin point Kiln quench tank A
Pennstrom Consulting Easton Process Consulting, Inc.
Page 25

ATTACHMENT B
MATERIAL AND ENERGY BALANCE

STREAM NO. 1 2 3 6 22 40 41 42 44Description Units ROM Ore Water Dust
Control Primary Crusher
Feed Primary Crusher
Discharge
Crushed Product to Grinding
Flotation Ball Mill Feed
Ball Mill Dilution
Flotation Ball Mill Discharge
Cyclone Feed Dilution
Overall Solid t/hr 231.481 0.000 231.481 231.481 231.481 231.481 0.000 1,083.826 0.000Aqueous t/hr 4.724 2.189 6.913 6.913 6.913 108.932 102.019 474.223 798.094Gas t/hr 0.000 0.000 0.000 0.000 0.000 0.000 0.000 0.000 0.000Total t/hr 236.206 2.189 238.395 238.395 238.395 340.414 102.019 1,558.049 798.094Percent Solids wt% 98.000 0.000 97.100 97.100 97.100 68.000 0.000 69.563 0.000Flow rate Stream m3/hr 88.1 2.2 90.3 90.3 90.3 192.5 102.2 865.4 799.8Flow rate Stream gal/min 387.7 9.7 397.4 397.4 397.4 847.6 450.1 3,810.2 3,521.3Flowrate gas Nm3/hr 0.0 0.0 0.0 0.0 0.0 0.0 0.0 0.0 0.0Temperature oC 25.0 20.0 24.7 24.7 24.7 22.6 21.7 22.0 21.7Pressure kPag 0.0 0.0 0.0 0.0 0.0 0.0 0.0 0.0 0.0Pressure psig 0.0 0.0 0.0 0.0 0.0 0.0 0.0 0.0 0.0Solids Sg 2.778 0.000 2.778 2.778 2.778 2.778 0.000 2.778 0.000Aqueous Sg 0.997 0.998 0.997 0.997 0.997 0.998 0.998 0.998 0.998Stream Total Sg 2.682 0.998 2.641 2.641 2.641 1.768 0.998 1.800 0.998Enthalpy Mcal/hr -1.643 -10.931 -12.574 -12.574 -12.574 -350.143 -337.569 -1915.693 -2640.805
Solids Gold gr/hr 420 0 420 420 420 420 0 1966 0Gold oz/hr 13.503 0.000 13.503 13.503 13.503 13.503 0.000 63.223 0.000Gold gpt 1.81 1.81 1.81 1.81 1.81 1.81 0.00Sulfur t/hr 5.094 0.000 5.094 5.094 5.094 5.094 0.000 23.849 0.000Sulfur wt% 2.200 0.000 2.200 2.200 2.200 2.200 0.000 2.200 0.000
Aqueous H2O tph 4.724 2.189 6.913 6.913 6.913 108.932 102.019 474.223 798.094H2SO4 tph 0.000 0.000 0.000 0.000 0.000 0.000 0.000 0.000 0.000
Ca(OH)2 tph 0.000 0.000 0.000 0.000 0.000 0.000 0.000 0.000 0.000H2SO4 gpl 0.000 0.000 0.000 0.000 0.000 0.000 0.000 0.000 0.000
Ca(OH)2 gpl 0.000 0.000 0.000 0.000 0.000 0.000 0.000 0.000 0.000NaCN gpl 0.000 0.000 0.000 0.000 0.000 0.000 0.000 0.000 0.000
Cu gpl 0.000 0.000 0.000 0.000 0.000 0.000 0.000 0.000 0.000Mn gpl 0.000 0.000 0.000 0.000 0.000 0.000 0.000 0.000 0.000Mg gpl 0.000 0.000 0.000 0.000 0.000 0.000 0.000 0.000 0.000Na gpl 0.000 0.000 0.000 0.000 0.000 0.000 0.000 0.000 0.000
Gas N2 t/hr 0.000 0.000 0.000 0.000 0.000 0.000 0.000 0.000 0.000O2 t/hr 0.000 0.000 0.000 0.000 0.000 0.000 0.000 0.000 0.000
H2O t/hr 0.000 0.000 0.000 0.000 0.000 0.000 0.000 0.000 0.000CO2 t/hr 0.000 0.000 0.000 0.000 0.000 0.000 0.000 0.000 0.000N2 vol% 0.000 0.000 0.000 0.000 0.000 0.000 0.000 0.000 0.000O2 vol% 0.000 0.000 0.000 0.000 0.000 0.000 0.000 0.000 0.000
H2O vol% 0.000 0.000 0.000 0.000 0.000 0.000 0.000 0.000 0.000CO2 vol% 0.000 0.000 0.000 0.000 0.000 0.000 0.000 0.000 0.000
Note:Only major stream are shown on flowsheets.Streams may appear in table without flowsheet reference and are available in the process model.
Material and Energy BalanceRev. 12/07/07
Anatolia Minerals Development Ltd.Copler Project - Conceptual Sulfide Oxidation Process Flotation Ore 5000 tpd - 1.81 gpt Gold, 2.2 wt.% T(S), ~2 wt% CO2, Rougher-Cleaner FlotationDirect Mill Ore 3000 tpd - 3.11 gpt Gold, 4.6 wt.% T(S), ~2 wt% CO2
Pennstrom Consulting Easton Process Consulting, Inc.
1 of 17

STREAM NO.Description Units
Overall Solid t/hrAqueous t/hrGas t/hrTotal t/hrPercent Solids wt%Flow rate Stream m3/hrFlow rate Stream gal/minFlowrate gas Nm3/hrTemperature oCPressure kPagPressure psigSolids SgAqueous Sg Stream Total SgEnthalpy Mcal/hr
Solids Gold gr/hrGold oz/hrGold gptSulfur t/hrSulfur wt%
Aqueous H2O tphH2SO4 tph
Ca(OH)2 tphH2SO4 gpl
Ca(OH)2 gplNaCN gpl
Cu gplMn gplMg gplNa gpl
Gas N2 t/hrO2 t/hr
H2O t/hrCO2 t/hrN2 vol%O2 vol%
H2O vol%CO2 vol%
Note:Only major stream are shown on flowsheets.Streams may appear in table without flowsheet reference and are available in the process model.
Material and Energy BalanceRev. 12/07/07
Anatolia Minerals Development Ltd.Copler Project - Conceptual Sulfide Oxidation Process Flotation Ore 5000 tpd - 1.81 gpt Gold, 2.2 wt.% T(S), ~2 wt% CO2, Rougher-Cleaner FlotationDirect Mill Ore 3000 tpd - 3.11 gpt Gold, 4.6 wt.% T(S), ~2 wt% CO2
45 46 47 48 49 51 52 53 54 55Mill Solution
Excess Internal
Cyclone Feed Reclaim Solution From
Tailings
Flotation Cyclone
Underflow
Flotation Cyclone Overflow
Rougher Flotation Feed
Grinding Thickener Flocculant
Rougher Flotation Launder Water
Grinding Thickener Feedwell Internal
Rougher Flotation
Concentrate
0.000 1,083.826 0.000 852.344 231.481 251.884 0.000 0.000 24.937 45.3390.000 1,272.317 847.821 365.290 907.027 972.769 0.075 2.267 77.152 138.2840.000 0.000 0.000 0.000 0.000 0.000 0.000 0.000 0.000 0.0000.000 2,356.143 847.821 1,217.635 1,138.508 1,224.653 0.075 2.267 102.088 183.6230.000 46.000 0.000 70.000 20.332 20.568 0.000 0.000 24.426 24.6910.0 1,665.2 849.0 672.9 992.3 1,065.7 0.1 2.3 84.6 153.40.0 7,331.5 3,737.8 2,962.6 4,368.9 4,692.1 0.3 10.0 372.7 675.50.0 0.0 0.0 0.0 0.0 0.0 0.0 0.0 0.0 0.0
21.4 21.8 21.3 21.8 21.8 21.8 20.0 21.7 21.7 21.80.0 620.5 0.0 0.0 0.0 0.0 0.0 0.0 0.0 0.00.0 90.0 0.0 0.0 0.0 0.0 0.0 0.0 0.0 0.0
0.000 2.778 0.000 2.778 2.778 2.772 0.000 0.000 3.402 3.0520.000 0.998 0.999 0.998 0.998 0.998 1.001 0.998 0.998 0.9980.000 1.415 0.999 1.810 1.147 1.149 1.001 0.998 1.206 1.1970.000 -4556.498 -3094.431 -1565.549 -2990.948 -3211.951 -0.371 -7.500 -261.192 -459.184
0 1966 0 1546 420 420 0 0 357 3570.000 63.223 0.000 49.720 13.503 13.503 0.000 0.000 11.484 11.4840.00 1.81 0.00 1.81 1.81 1.67 0.00 0.00 14.32 7.88
0.000 23.849 0.000 18.755 5.094 5.157 0.000 0.000 4.012 4.0760.000 2.200 0.000 2.200 2.200 2.047 0.000 0.000 16.089 8.9890.000 1272.317 847.147 365.290 907.027 972.769 0.074 2.267 77.151 138.2840.000 0.000 0.000 0.000 0.000 0.000 0.000 0.000 0.000 0.0000.000 0.000 0.573 0.000 0.000 0.000 0.000 0.000 0.000 0.0000.000 0.000 0.000 0.000 0.000 0.000 0.000 0.000 0.000 0.0000.000 0.000 0.675 0.000 0.000 0.000 0.000 0.000 0.000 0.0000.000 0.000 0.000 0.000 0.000 0.000 0.000 0.000 0.000 0.0000.000 0.000 0.000 0.000 0.000 0.000 0.000 0.000 0.000 0.0000.000 0.000 0.000 0.000 0.000 0.000 0.000 0.000 0.000 0.0000.000 0.000 0.000 0.000 0.000 0.000 0.000 0.000 0.000 0.0000.000 0.000 0.051 0.000 0.000 0.000 0.000 0.000 0.000 0.0000.000 0.000 0.000 0.000 0.000 0.000 0.000 0.000 0.000 0.0000.000 0.000 0.000 0.000 0.000 0.000 0.000 0.000 0.000 0.0000.000 0.000 0.000 0.000 0.000 0.000 0.000 0.000 0.000 0.0000.000 0.000 0.000 0.000 0.000 0.000 0.000 0.000 0.000 0.0000.000 0.000 0.000 0.000 0.000 0.000 0.000 0.000 0.000 0.0000.000 0.000 0.000 0.000 0.000 0.000 0.000 0.000 0.000 0.0000.000 0.000 0.000 0.000 0.000 0.000 0.000 0.000 0.000 0.0000.000 0.000 0.000 0.000 0.000 0.000 0.000 0.000 0.000 0.000
Pennstrom Consulting Easton Process Consulting, Inc.
2 of 17

STREAM NO.Description Units
Overall Solid t/hrAqueous t/hrGas t/hrTotal t/hrPercent Solids wt%Flow rate Stream m3/hrFlow rate Stream gal/minFlowrate gas Nm3/hrTemperature oCPressure kPagPressure psigSolids SgAqueous Sg Stream Total SgEnthalpy Mcal/hr
Solids Gold gr/hrGold oz/hrGold gptSulfur t/hrSulfur wt%
Aqueous H2O tphH2SO4 tph
Ca(OH)2 tphH2SO4 gpl
Ca(OH)2 gplNaCN gpl
Cu gplMn gplMg gplNa gpl
Gas N2 t/hrO2 t/hr
H2O t/hrCO2 t/hrN2 vol%O2 vol%
H2O vol%CO2 vol%
Note:Only major stream are shown on flowsheets.Streams may appear in table without flowsheet reference and are available in the process model.
Material and Energy BalanceRev. 12/07/07
Anatolia Minerals Development Ltd.Copler Project - Conceptual Sulfide Oxidation Process Flotation Ore 5000 tpd - 1.81 gpt Gold, 2.2 wt.% T(S), ~2 wt% CO2, Rougher-Cleaner FlotationDirect Mill Ore 3000 tpd - 3.11 gpt Gold, 4.6 wt.% T(S), ~2 wt% CO2
56 57 58 59 60 61 62Grinding Thickener
Underflow Rougher Flotation Tailings
Grinding Thickener Overflow
Grinding Thickener Vent
Internal
Combined Feed to Preacidification
CCD 1 O/F Preacidification By-
pass Internal
Preacidification Vent
24.937 206.545 0.000 0.000 163.828 0.000 0.00018.058 836.751 59.094 0.000 183.330 37.044 0.0000.000 0.000 0.000 0.000 0.000 0.000 1.283
42.995 1,043.296 59.094 0.000 347.158 37.044 1.28358.000 19.797 0.000 0.000 47.191 0.000 0.00025.4 914.5 59.2 0.0 235.6 34.7 0.0111.9 4,026.5 260.7 0.0 1,037.3 152.9 0.0
0.0 0.0 0.0 0.0 0.0 0.0 804.021.7 21.8 21.7 21.7 36.6 76.3 35.90.0 0.0 0.0 0.0 0.0 0.0 0.00.0 0.0 0.0 0.0 0.0 0.0 0.0
3.402 2.718 0.000 0.000 2.903 0.000 0.0000.998 0.998 0.998 0.000 1.023 1.067 0.0001.691 1.141 0.998 0.000 1.474 1.067 0.000
-68.518 -2760.267 -192.673 0.000 2326.775 1717.352 3.764357 63 0 0 790 0 0
11.484 2.019 0.000 0.000 25.391 0.000 0.00014.32 0.30 0.00 0.00 4.82 0.00 #DIV/0!4.012 1.082 0.000 0.000 10.401 0.000 0.000
16.089 0.524 0.000 0.000 6.349 0.000 0.00018.058 836.751 59.094 0.000 175.521 32.573 0.0000.000 0.000 0.000 0.000 5.556 3.181 0.0000.000 0.000 0.000 0.000 0.000 0.000 0.0000.000 0.000 0.000 0.000 31.008 91.607 0.0000.000 0.000 0.000 0.000 0.000 0.000 0.0000.000 0.000 0.000 0.000 0.000 0.000 0.0000.000 0.000 0.000 0.000 1.286 3.799 0.0000.000 0.000 0.000 0.000 0.888 2.625 0.0000.000 0.000 0.000 0.000 0.948 2.801 0.0000.000 0.000 0.000 0.000 0.008 0.024 0.0000.000 0.000 0.000 0.000 0.000 0.000 0.2730.000 0.000 0.000 0.000 0.000 0.000 0.0840.000 0.000 0.000 0.000 0.000 0.000 0.0000.000 0.000 0.000 0.000 0.000 0.000 0.9220.000 0.000 0.000 0.000 0.000 0.000 29.1380.000 0.000 0.000 0.000 0.000 0.000 7.8170.000 0.000 0.000 0.000 0.000 0.000 0.0000.000 0.000 0.000 0.000 0.000 0.000 62.696
Pennstrom Consulting Easton Process Consulting, Inc.
3 of 17

STREAM NO.Description Units
Overall Solid t/hrAqueous t/hrGas t/hrTotal t/hrPercent Solids wt%Flow rate Stream m3/hrFlow rate Stream gal/minFlowrate gas Nm3/hrTemperature oCPressure kPagPressure psigSolids SgAqueous Sg Stream Total SgEnthalpy Mcal/hr
Solids Gold gr/hrGold oz/hrGold gptSulfur t/hrSulfur wt%
Aqueous H2O tphH2SO4 tph
Ca(OH)2 tphH2SO4 gpl
Ca(OH)2 gplNaCN gpl
Cu gplMn gplMg gplNa gpl
Gas N2 t/hrO2 t/hr
H2O t/hrCO2 t/hrN2 vol%O2 vol%
H2O vol%CO2 vol%
Note:Only major stream are shown on flowsheets.Streams may appear in table without flowsheet reference and are available in the process model.
Material and Energy BalanceRev. 12/07/07
Anatolia Minerals Development Ltd.Copler Project - Conceptual Sulfide Oxidation Process Flotation Ore 5000 tpd - 1.81 gpt Gold, 2.2 wt.% T(S), ~2 wt% CO2, Rougher-Cleaner FlotationDirect Mill Ore 3000 tpd - 3.11 gpt Gold, 4.6 wt.% T(S), ~2 wt% CO2
63 64 65 70 71 74 76CCD 1 Overflow to
Preacidification Internal
Air to PreAcidification
Mill Solution Pump Discharge
Preacidification Internal
Flotation Reagents Cleaner Flotation Feed
Cleaner Flotation Launder Water
0.000 0.000 0.000 164.383 0.000 45.339 0.00064.696 0.000 906.915 181.853 2.267 140.551 2.2670.000 0.361 0.000 0.000 0.000 0.000 0.000
64.696 0.361 906.915 346.236 2.267 185.890 2.2670.000 0.000 0.000 47.477 0.000 24.390 0.00060.6 0.0 908.2 234.5 2.3 155.7 2.3267.0 0.0 3,998.6 1,032.3 10.0 685.5 10.0
0.0 300.0 0.0 0.0 0.0 0.0 0.076.3 20.0 21.4 35.9 20.0 21.8 20.00.0 0.0 0.0 0.0 0.0 0.0 0.00.0 0.0 0.0 0.0 0.0 0.0 0.0
0.000 0.000 0.000 2.921 0.000 3.052 0.0001.067 0.000 0.999 1.021 0.998 0.998 0.9981.067 0.000 0.999 1.477 0.998 1.194 0.998
2999.292 -0.022 -3287.104 2179.923 -11.320 -470.504 -11.3200 0 0 790 0 357 0
0.000 0.000 0.000 25.391 0.000 11.484 0.0000.00 0.00 0.00 4.80 #DIV/0! 7.88 0.00
0.000 0.000 0.000 10.877 0.000 4.076 0.0000.000 0.000 0.000 6.617 0.000 8.989 0.000
56.887 0.000 906.241 175.363 2.267 140.551 2.2675.556 0.000 0.000 3.501 0.000 0.000 0.0000.000 0.000 0.573 0.000 0.000 0.000 0.000
91.607 0.000 0.000 19.646 0.000 0.000 0.0000.000 0.000 0.631 0.000 0.000 0.000 0.0000.000 0.000 0.000 0.000 0.000 0.000 0.0003.799 0.000 0.000 1.293 0.000 0.000 0.0002.625 0.000 0.000 0.893 0.000 0.000 0.0002.801 0.000 0.000 1.786 0.000 0.000 0.0000.024 0.000 0.048 0.008 0.000 0.000 0.0000.000 0.273 0.000 0.000 0.000 0.000 0.0000.000 0.084 0.000 0.000 0.000 0.000 0.0000.000 0.000 0.000 0.000 0.000 0.000 0.0000.000 0.000 0.000 0.000 0.000 0.000 0.0000.000 78.087 0.000 0.000 0.000 0.000 0.0000.000 20.948 0.000 0.000 0.000 0.000 0.0000.000 0.000 0.000 0.000 0.000 0.000 0.0000.000 0.031 0.000 0.000 0.000 0.000 0.000
Pennstrom Consulting Easton Process Consulting, Inc.
4 of 17

STREAM NO.Description Units
Overall Solid t/hrAqueous t/hrGas t/hrTotal t/hrPercent Solids wt%Flow rate Stream m3/hrFlow rate Stream gal/minFlowrate gas Nm3/hrTemperature oCPressure kPagPressure psigSolids SgAqueous Sg Stream Total SgEnthalpy Mcal/hr
Solids Gold gr/hrGold oz/hrGold gptSulfur t/hrSulfur wt%
Aqueous H2O tphH2SO4 tph
Ca(OH)2 tphH2SO4 gpl
Ca(OH)2 gplNaCN gpl
Cu gplMn gplMg gplNa gpl
Gas N2 t/hrO2 t/hr
H2O t/hrCO2 t/hrN2 vol%O2 vol%
H2O vol%CO2 vol%
Note:Only major stream are shown on flowsheets.Streams may appear in table without flowsheet reference and are available in the process model.
Material and Energy BalanceRev. 12/07/07
Anatolia Minerals Development Ltd.Copler Project - Conceptual Sulfide Oxidation Process Flotation Ore 5000 tpd - 1.81 gpt Gold, 2.2 wt.% T(S), ~2 wt% CO2, Rougher-Cleaner FlotationDirect Mill Ore 3000 tpd - 3.11 gpt Gold, 4.6 wt.% T(S), ~2 wt% CO2
78 79 94 95 96 97 98Cleaner Flotation
Concentrate Cleaner Flotation
Tails Preacidification Discharge Slurry
Preacidification Thickener Feed
Well Internal
Preacidification Thickener Underflow
Preacidificaiton Thickener Overflow
Preacidification Thickener Vent
24.937 20.403 164.383 164.383 164.388 0.000 0.00077.077 65.742 181.853 182.839 119.039 63.795 0.0000.000 0.000 0.000 0.000 0.000 0.000 0.000
102.013 86.144 346.236 347.222 283.427 63.795 0.00024.444 23.684 47.477 47.342 58.000 0.000 0.00084.6 73.4 234.4 235.4 172.9 62.5 0.0372.3 323.2 1,031.9 1,036.3 761.1 275.1 0.0
0.0 0.0 0.0 0.0 0.0 0.0 0.021.7 21.8 34.3 34.3 34.3 34.3 34.30.0 0.0 0.0 0.0 0.0 0.0 0.00.0 0.0 0.0 0.0 0.0 0.0 0.0
3.402 2.710 2.921 2.921 2.921 0.000 0.0000.998 0.998 1.021 1.021 1.021 1.021 0.0001.206 1.173 1.477 1.475 1.640 1.021 0.000
-260.821 -221.003 1869.012 1864.123 1293.361 570.762 0.000357 0 790 790 790 0 0
11.484 0.000 25.391 25.391 25.391 0.000 0.00014.32 0.00 4.80 4.80 4.80 0.00 0.004.012 0.064 10.877 10.877 10.877 0.000 0.000
16.089 0.312 6.617 6.617 6.617 0.000 0.00077.077 65.742 175.363 176.345 114.814 61.531 0.0000.000 0.000 3.501 3.501 2.279 1.222 0.0000.000 0.000 0.000 0.000 0.000 0.000 0.0000.000 0.000 19.657 19.548 19.548 19.548 0.0000.000 0.000 0.000 0.000 0.000 0.000 0.0000.000 0.000 0.000 0.000 0.000 0.000 0.0000.000 0.000 1.294 1.287 1.287 1.287 0.0000.000 0.000 0.894 0.889 0.889 0.889 0.0000.000 0.000 1.787 1.777 1.777 1.777 0.0000.000 0.000 0.008 0.008 0.008 0.008 0.0000.000 0.000 0.000 0.000 0.000 0.000 0.0000.000 0.000 0.000 0.000 0.000 0.000 0.0000.000 0.000 0.000 0.000 0.000 0.000 0.0000.000 0.000 0.000 0.000 0.000 0.000 0.0000.000 0.000 0.000 0.000 0.000 0.000 0.0000.000 0.000 0.000 0.000 0.000 0.000 0.0000.000 0.000 0.000 0.000 0.000 0.000 0.0000.000 0.000 0.000 0.000 0.000 0.000 0.000
Pennstrom Consulting Easton Process Consulting, Inc.
5 of 17

STREAM NO.Description Units
Overall Solid t/hrAqueous t/hrGas t/hrTotal t/hrPercent Solids wt%Flow rate Stream m3/hrFlow rate Stream gal/minFlowrate gas Nm3/hrTemperature oCPressure kPagPressure psigSolids SgAqueous Sg Stream Total SgEnthalpy Mcal/hr
Solids Gold gr/hrGold oz/hrGold gptSulfur t/hrSulfur wt%
Aqueous H2O tphH2SO4 tph
Ca(OH)2 tphH2SO4 gpl
Ca(OH)2 gplNaCN gpl
Cu gplMn gplMg gplNa gpl
Gas N2 t/hrO2 t/hr
H2O t/hrCO2 t/hrN2 vol%O2 vol%
H2O vol%CO2 vol%
Note:Only major stream are shown on flowsheets.Streams may appear in table without flowsheet reference and are available in the process model.
Material and Energy BalanceRev. 12/07/07
Anatolia Minerals Development Ltd.Copler Project - Conceptual Sulfide Oxidation Process Flotation Ore 5000 tpd - 1.81 gpt Gold, 2.2 wt.% T(S), ~2 wt% CO2, Rougher-Cleaner FlotationDirect Mill Ore 3000 tpd - 3.11 gpt Gold, 4.6 wt.% T(S), ~2 wt% CO2
99 100 102 104 105 106 107 108 109Flocculant
Preacidification Slurry to PLV
1 PLV Feed
Percent Solids Control Water
PLV 1 Quench Water
Demin Water to PLV 1
Agitator Gland Seal
Water
C2 Quench Water
Oxygen to PLV 1
C2 Oxygen
0.000 164.388 0.000 0.000 0.000 0.000 0.000 0.000 0.0000.986 119.039 45.348 0.000 48.976 3.628 0.000 0.000 0.0000.000 0.000 0.000 0.000 0.000 0.000 0.000 20.096 5.0080.986 283.427 45.348 0.000 48.976 3.628 0.000 20.096 5.0080.000 58.000 0.000 0.000 0.000 0.000 0.000 0.000 0.0001.0 172.9 45.4 0.0 49.1 3.6 0.0 0.0 0.04.3 761.1 200.0 0.0 216.0 16.0 0.0 0.0 0.00.0 0.0 0.0 0.0 0.0 0.0 0.0 15,075.4 3,757.2
20.0 34.3 20.0 20.0 20.0 20.0 25.3 20.0 20.00.0 0.0 0.0 0.0 0.0 0.0 0.0 3,298.7 3,298.70.0 0.0 0.0 0.0 0.0 0.0 0.0 478.4 478.4
0.000 2.921 0.000 0.000 0.000 0.000 0.000 0.000 0.0001.001 1.021 0.998 0.998 0.998 0.998 0.997 0.000 0.0001.001 1.640 0.998 0.998 0.998 0.998 0.997 0.000 0.000-4.889 1293.361 -226.406 0.000 -244.518 -18.112 0.000 -9.742 -2.428
0 790 0 0 0 0 0 0 00.000 25.391 0.000 0.000 0.000 0.000 0.000 0.000 0.0000.00 4.80 0.00 0.00 0.00 0.00 0.00 0.00 0.00
0.000 10.877 0.000 0.000 0.000 0.000 0.000 0.000 0.0000.000 6.617 0.000 0.000 0.000 0.000 0.000 0.000 0.0000.981 114.814 45.348 0.000 48.976 3.628 0.000 0.000 0.0000.000 2.279 0.000 0.000 0.000 0.000 0.000 0.000 0.0000.000 0.000 0.000 0.000 0.000 0.000 0.000 0.000 0.0000.000 19.548 0.000 0.000 0.000 0.000 0.000 0.000 0.0000.000 0.000 0.000 0.000 0.000 0.000 0.000 0.000 0.0000.000 0.000 0.000 0.000 0.000 0.000 0.000 0.000 0.0000.000 1.287 0.000 0.000 0.000 0.000 0.000 0.000 0.0000.000 0.889 0.000 0.000 0.000 0.000 0.000 0.000 0.0000.000 1.777 0.000 0.000 0.000 0.000 0.000 0.000 0.0000.000 0.008 0.000 0.000 0.000 0.000 0.000 0.000 0.0000.000 0.000 0.000 0.000 0.000 0.000 0.000 0.018 0.0040.000 0.000 0.000 0.000 0.000 0.000 0.000 19.853 4.9480.000 0.000 0.000 0.000 0.000 0.000 0.000 0.000 0.0000.000 0.000 0.000 0.000 0.000 0.000 0.000 0.000 0.0000.000 0.000 0.000 0.000 0.000 0.000 0.000 0.100 0.1000.000 0.000 0.000 0.000 0.000 0.000 0.000 99.000 99.0000.000 0.000 0.000 0.000 0.000 0.000 0.000 0.000 0.0000.000 0.000 0.000 0.000 0.000 0.000 0.000 0.000 0.000
Pennstrom Consulting Easton Process Consulting, Inc.
6 of 17

STREAM NO.Description Units
Overall Solid t/hrAqueous t/hrGas t/hrTotal t/hrPercent Solids wt%Flow rate Stream m3/hrFlow rate Stream gal/minFlowrate gas Nm3/hrTemperature oCPressure kPagPressure psigSolids SgAqueous Sg Stream Total SgEnthalpy Mcal/hr
Solids Gold gr/hrGold oz/hrGold gptSulfur t/hrSulfur wt%
Aqueous H2O tphH2SO4 tph
Ca(OH)2 tphH2SO4 gpl
Ca(OH)2 gplNaCN gpl
Cu gplMn gplMg gplNa gpl
Gas N2 t/hrO2 t/hr
H2O t/hrCO2 t/hrN2 vol%O2 vol%
H2O vol%CO2 vol%
Note:Only major stream are shown on flowsheets.Streams may appear in table without flowsheet reference and are available in the process model.
Material and Energy BalanceRev. 12/07/07
Anatolia Minerals Development Ltd.Copler Project - Conceptual Sulfide Oxidation Process Flotation Ore 5000 tpd - 1.81 gpt Gold, 2.2 wt.% T(S), ~2 wt% CO2, Rougher-Cleaner FlotationDirect Mill Ore 3000 tpd - 3.11 gpt Gold, 4.6 wt.% T(S), ~2 wt% CO2
110 114 116 120 121 122 123 124 133Feed Slurry to Pressure Leach
Vessel 1 Diluted
Pressure Leach Vessel 1 Vent Gas
Internal
Pressure Leach 1 Slurry
Internal
Pressure Leach 1 Flash
Slurry
Pressure Leach 1 Vent Gas
After Letdown
Pressure Leach 1 Slurry Flash Vapor
Combined PLV Vent and
Flash to Scrubber
Scrubber Slurry to CCD
Pressure Leach 1
Scrubber Gas to 2nd stage
164.388 0.000 161.800 158.296 0.000 3.231 3.231 3.231 0.000164.388 0.883 175.694 128.497 0.883 2.622 3.505 40.539 0.000
0.000 20.629 0.000 0.000 20.629 43.349 63.978 0.000 65.119328.775 21.512 337.494 286.793 21.512 49.202 70.714 43.770 65.11950.000 0.000 47.942 55.195 0.000 6.566 4.568 7.381 0.000218.4 1.0 251.5 176.7 1.0 3.6 4.5 43.1 0.0961.7 4.2 1,107.2 777.9 4.2 15.9 19.8 190.0 0.0
0.0 21,466.7 0.0 0.0 21,466.7 57,882.7 79,349.5 0.0 80,872.130.7 219.6 219.6 106.8 218.2 106.8 125.6 97.7 97.70.0 3,098.7 3,098.7 17.3 17.3 17.3 17.3 -0.2 -0.20.0 449.4 449.4 2.5 2.5 2.5 2.5 0.0 0.0
2.921 0.000 2.624 2.622 0.000 2.622 2.622 2.622 0.0001.014 0.926 0.926 1.105 0.928 1.105 1.073 0.967 0.0001.505 0.926 1.342 1.623 0.928 1.623 1.497 1.014 0.000
1061.620 1227.775 37917.483 11196.490 1227.775 1791.936 2929.120 2952.967 1919.321790 0 790 774 0 16 16 16 0
25.391 0.000 25.391 24.883 0.000 0.508 0.508 0.508 0.0004.80 0.00 4.88 4.89 0.00 4.89 4.89 4.89 0.00
10.877 0.000 5.760 4.397 0.000 0.090 0.090 0.090 0.0006.617 0.000 3.560 2.778 0.000 2.778 2.778 2.778 0.000
160.163 0.773 153.789 103.576 0.773 2.114 2.887 39.921 0.0002.279 0.071 14.131 17.731 0.071 0.362 0.433 0.433 0.0000.000 0.000 0.000 0.000 0.000 0.000 0.000 0.000 0.000
14.056 74.445 74.445 152.466 74.607 152.466 132.508 10.328 0.0000.000 0.000 0.000 0.000 0.000 0.000 0.000 0.000 0.0000.000 0.000 0.000 0.000 0.000 0.000 0.000 0.000 0.0000.925 3.914 3.914 6.298 3.922 6.298 5.718 0.446 0.0000.639 2.720 2.720 4.351 2.726 4.351 3.955 0.308 0.0001.278 2.902 2.902 4.642 2.909 4.642 4.220 0.329 0.0000.006 0.005 0.005 0.008 0.005 0.008 0.007 0.001 0.0000.000 0.022 0.000 0.000 0.022 0.000 0.022 0.000 0.0220.000 7.101 0.000 0.000 7.101 0.000 7.101 0.000 7.1010.000 11.046 0.000 0.000 11.046 43.349 54.396 0.000 55.5360.000 2.178 0.000 0.000 2.178 0.000 2.178 0.000 2.1780.000 0.084 0.000 0.000 0.084 0.000 0.022 0.000 0.0230.000 23.701 0.000 0.000 23.701 0.000 6.328 0.000 6.6010.000 65.487 0.000 0.000 65.487 93.602 86.096 0.000 91.6940.000 5.287 0.000 0.000 5.287 0.000 1.411 0.000 1.472
Pennstrom Consulting Easton Process Consulting, Inc.
7 of 17

STREAM NO.Description Units
Overall Solid t/hrAqueous t/hrGas t/hrTotal t/hrPercent Solids wt%Flow rate Stream m3/hrFlow rate Stream gal/minFlowrate gas Nm3/hrTemperature oCPressure kPagPressure psigSolids SgAqueous Sg Stream Total SgEnthalpy Mcal/hr
Solids Gold gr/hrGold oz/hrGold gptSulfur t/hrSulfur wt%
Aqueous H2O tphH2SO4 tph
Ca(OH)2 tphH2SO4 gpl
Ca(OH)2 gplNaCN gpl
Cu gplMn gplMg gplNa gpl
Gas N2 t/hrO2 t/hr
H2O t/hrCO2 t/hrN2 vol%O2 vol%
H2O vol%CO2 vol%
Note:Only major stream are shown on flowsheets.Streams may appear in table without flowsheet reference and are available in the process model.
Material and Energy BalanceRev. 12/07/07
Anatolia Minerals Development Ltd.Copler Project - Conceptual Sulfide Oxidation Process Flotation Ore 5000 tpd - 1.81 gpt Gold, 2.2 wt.% T(S), ~2 wt% CO2, Rougher-Cleaner FlotationDirect Mill Ore 3000 tpd - 3.11 gpt Gold, 4.6 wt.% T(S), ~2 wt% CO2
134 135 136 138 139 338 339 340 341 342Pressure Leach 1 Scrubber
Water
Pressure Leach 1 2nd
Scrubber Internal
PLV 1 Scrubber Discharge to Atmosphere
Pressure Leach 1 Scrubber Recycle
Pressure Leach 1 Scrubber
Discharge to 1st Stage
Autoclave Slurry and Scrubber
Solutions to CCD
Combined Slurry to CCD
CCD 1 Feedwell
CCD 1 Flocculant
CCD 1 Underflow
0.000 0.000 0.000 0.000 0.000 160.454 158.296 160.454 0.000 160.46232.559 214.892 0.000 182.332 38.174 126.340 128.497 217.944 1.605 116.1960.000 65.119 59.504 0.000 0.000 0.000 0.000 0.000 0.000 0.000
32.559 280.010 59.504 182.332 38.174 286.793 286.793 378.398 1.605 276.6580.000 0.000 0.000 0.000 0.000 55.947 55.195 42.403 0.000 58.00032.6 222.2 0.0 189.9 39.8 175.6 176.7 265.9 1.6 170.2143.6 978.3 0.0 836.2 175.1 773.1 777.9 1,170.9 7.1 749.5
0.0 80,872.1 73,374.7 0.0 0.0 0.0 0.0 0.0 0.0 0.020.0 86.9 97.2 97.2 97.2 108.9 106.8 79.0 20.0 76.30.0 -0.3 -0.3 -0.3 -0.3 17.3 17.3 0.0 0.0 -0.30.0 0.0 0.0 0.0 0.0 2.5 2.5 0.0 0.0 0.0
0.000 0.000 0.000 0.000 0.000 2.617 2.622 2.617 0.000 2.6170.998 0.967 0.000 0.960 0.960 1.106 1.105 1.065 1.001 1.0670.998 0.967 0.000 0.960 0.960 1.633 1.623 1.423 1.001 1.625
-162.556 14938.088 1729.360 13181.322 2759.728 11433.463 11196.490 12129.049 -7.953 6805.9530 0 0 0 0 774 774 774 0 774
0.000 0.000 0.000 0.000 0.000 24.883 24.883 24.883 0.000 24.8830.00 0.00 0.00 0.00 0.00 4.82 4.89 4.82 0.00 4.82
0.000 0.000 0.000 0.000 0.000 4.397 4.397 4.397 0.000 4.3970.000 0.000 0.000 0.000 0.000 2.741 2.778 2.741 0.000 2.740
32.559 214.892 0.000 182.332 38.174 101.458 103.576 191.630 1.597 102.1710.000 0.000 0.000 0.000 0.000 17.731 17.731 18.715 0.000 9.9780.000 0.000 0.000 0.000 0.000 0.000 0.000 0.000 0.000 0.0000.000 0.000 0.000 0.000 0.000 155.158 152.466 91.449 0.000 91.6070.000 0.000 0.000 0.000 0.000 0.000 0.000 0.000 0.000 0.0000.000 0.000 0.000 0.000 0.000 0.000 0.000 0.000 0.000 0.0000.000 0.000 0.000 0.000 0.000 6.409 6.298 3.793 0.000 3.7990.000 0.000 0.000 0.000 0.000 4.427 4.351 2.620 0.000 2.6250.000 0.000 0.000 0.000 0.000 4.724 4.642 2.796 0.000 2.8010.000 0.000 0.000 0.000 0.000 0.008 0.008 0.024 0.000 0.0240.000 0.022 0.022 0.000 0.000 0.000 0.000 0.000 0.000 0.0000.000 7.101 7.101 0.000 0.000 0.000 0.000 0.000 0.000 0.0000.000 55.536 49.921 0.000 0.000 0.000 0.000 0.000 0.000 0.0000.000 2.178 2.178 0.000 0.000 0.000 0.000 0.000 0.000 0.0000.000 0.005 0.026 0.000 0.000 0.000 0.000 0.000 0.000 0.0000.000 1.451 7.275 0.000 0.000 0.000 0.000 0.000 0.000 0.0000.000 20.161 90.845 0.000 0.000 0.000 0.000 0.000 0.000 0.0000.000 0.324 1.623 0.000 0.000 0.000 0.000 0.000 0.000 0.000
Pennstrom Consulting Easton Process Consulting, Inc.
8 of 17

STREAM NO.Description Units
Overall Solid t/hrAqueous t/hrGas t/hrTotal t/hrPercent Solids wt%Flow rate Stream m3/hrFlow rate Stream gal/minFlowrate gas Nm3/hrTemperature oCPressure kPagPressure psigSolids SgAqueous Sg Stream Total SgEnthalpy Mcal/hr
Solids Gold gr/hrGold oz/hrGold gptSulfur t/hrSulfur wt%
Aqueous H2O tphH2SO4 tph
Ca(OH)2 tphH2SO4 gpl
Ca(OH)2 gplNaCN gpl
Cu gplMn gplMg gplNa gpl
Gas N2 t/hrO2 t/hr
H2O t/hrCO2 t/hrN2 vol%O2 vol%
H2O vol%CO2 vol%
Note:Only major stream are shown on flowsheets.Streams may appear in table without flowsheet reference and are available in the process model.
Material and Energy BalanceRev. 12/07/07
Anatolia Minerals Development Ltd.Copler Project - Conceptual Sulfide Oxidation Process Flotation Ore 5000 tpd - 1.81 gpt Gold, 2.2 wt.% T(S), ~2 wt% CO2, Rougher-Cleaner FlotationDirect Mill Ore 3000 tpd - 3.11 gpt Gold, 4.6 wt.% T(S), ~2 wt% CO2
344 350 351 352 354 355 357 380 381 382CCD 1
Overflow CCD 2
Feedwell CCD 1
Overflow CCD 2
Underflow CCD 2
Overflow CCD 2
Overflow to CCD 1
CCD 2 Overflow to Solution
Neutralization
CCD 3 Feedwell Internal
CCD 3 Flocculant
CCD 3 Underflow
0.000 163.692 0.000 163.697 0.000 0.000 0.000 165.010 0.000 165.015101.740 992.498 0.982 118.539 873.954 90.000 783.954 954.280 0.990 119.494
0.000 0.000 0.000 0.000 0.000 0.000 0.000 0.000 0.000 0.000101.740 1,156.191 0.982 282.236 873.954 90.000 783.954 1,119.290 0.990 284.509
0.000 14.158 0.000 58.000 0.000 0.000 0.000 14.742 0.000 58.00095.4 1,052.2 1.0 180.7 871.3 89.7 781.6 1,021.2 1.0 183.1419.9 4,632.5 4.3 795.7 3,836.2 395.1 3,441.1 4,496.3 4.4 806.1
0.0 0.0 0.0 0.0 0.0 0.0 0.0 0.0 0.0 0.076.3 33.3 20.0 32.9 32.9 32.9 32.9 23.3 20.0 23.30.0 -0.3 0.0 0.0 0.0 0.0 0.0 0.0 0.0 -0.30.0 0.0 0.0 0.0 0.0 0.0 0.0 0.0 0.0 0.0
0.000 2.618 0.000 2.617 0.000 0.000 0.000 2.615 0.000 2.6151.067 1.003 1.001 1.003 1.003 1.003 1.003 0.996 1.001 0.9961.067 1.099 1.001 1.562 1.003 1.003 1.003 1.096 1.001 1.554
4716.644 8379.516 -4.868 1128.739 6831.801 703.540 6128.261 -1697.365 -4.908 -237.9610 790 0 790 0 0 0 790 0 790
0.000 25.391 0.000 25.391 0.000 0.000 0.000 25.391 0.000 25.3910.00 4.82 0.00 4.82 0.00 0.00 0.00 4.79 0.00 4.79
0.000 4.487 0.000 4.487 0.000 0.000 0.000 4.732 0.000 4.7320.000 2.741 0.000 2.741 0.000 0.000 0.000 2.868 0.000 2.867
89.459 976.793 0.977 116.664 860.129 88.576 771.553 953.067 0.985 119.3438.737 10.844 0.000 1.295 9.549 0.983 8.566 0.495 0.000 0.0620.000 0.000 0.000 0.000 0.000 0.000 0.000 0.000 0.000 0.000
91.607 10.958 0.000 10.960 10.960 10.960 10.960 0.517 0.000 0.5170.000 0.000 0.000 0.000 0.000 0.000 0.000 0.000 0.000 0.0000.000 0.000 0.000 0.000 0.000 0.000 0.000 0.000 0.000 0.0003.799 0.488 0.000 0.488 0.488 0.488 0.488 0.060 0.000 0.0602.625 0.337 0.000 0.337 0.337 0.337 0.337 0.042 0.000 0.0422.801 0.360 0.000 0.360 0.360 0.360 0.360 0.044 0.000 0.0440.024 0.045 0.000 0.045 0.045 0.045 0.045 0.050 0.000 0.0500.000 0.000 0.000 0.000 0.000 0.000 0.000 0.000 0.000 0.0000.000 0.000 0.000 0.000 0.000 0.000 0.000 0.000 0.000 0.0000.000 0.000 0.000 0.000 0.000 0.000 0.000 0.000 0.000 0.0000.000 0.000 0.000 0.000 0.000 0.000 0.000 0.000 0.000 0.0000.000 0.000 0.000 0.000 0.000 0.000 0.000 0.000 0.000 0.0000.000 0.000 0.000 0.000 0.000 0.000 0.000 0.000 0.000 0.0000.000 0.000 0.000 0.000 0.000 0.000 0.000 0.000 0.000 0.0000.000 0.000 0.000 0.000 0.000 0.000 0.000 0.000 0.000 0.000
Pennstrom Consulting Easton Process Consulting, Inc.
9 of 17

STREAM NO.Description Units
Overall Solid t/hrAqueous t/hrGas t/hrTotal t/hrPercent Solids wt%Flow rate Stream m3/hrFlow rate Stream gal/minFlowrate gas Nm3/hrTemperature oCPressure kPagPressure psigSolids SgAqueous Sg Stream Total SgEnthalpy Mcal/hr
Solids Gold gr/hrGold oz/hrGold gptSulfur t/hrSulfur wt%
Aqueous H2O tphH2SO4 tph
Ca(OH)2 tphH2SO4 gpl
Ca(OH)2 gplNaCN gpl
Cu gplMn gplMg gplNa gpl
Gas N2 t/hrO2 t/hr
H2O t/hrCO2 t/hrN2 vol%O2 vol%
H2O vol%CO2 vol%
Note:Only major stream are shown on flowsheets.Streams may appear in table without flowsheet reference and are available in the process model.
Material and Energy BalanceRev. 12/07/07
Anatolia Minerals Development Ltd.Copler Project - Conceptual Sulfide Oxidation Process Flotation Ore 5000 tpd - 1.81 gpt Gold, 2.2 wt.% T(S), ~2 wt% CO2, Rougher-Cleaner FlotationDirect Mill Ore 3000 tpd - 3.11 gpt Gold, 4.6 wt.% T(S), ~2 wt% CO2
384 385 401 410 412 414 416 417 418 420CCD 3
Overflow CCD Wash Solution Tailings Reclaim
CCD Floc Limestone Limestone Thcikener Overflow
Limestone to Mill
Limestone From Mill
Plant Water to Limestone
Mill
Limestone Thickener
Overflow to Mill Dilution
Limestone Cyclone Feed
0.000 0.000 0.000 66.217 0.000 114.891 114.891 0.000 0.000 114.891834.781 836.064 3.577 3.485 14.986 44.680 44.680 44.465 79.786 124.466
0.000 0.000 0.000 0.000 0.000 0.000 0.000 0.000 0.000 0.000834.781 836.064 3.577 69.702 14.986 159.571 159.571 44.465 79.786 239.357
0.000 0.000 0.000 95.000 0.000 72.000 72.000 0.000 0.000 48.000838.2 837.2 3.6 29.9 15.0 90.6 90.6 44.5 79.9 170.5
3,690.3 3,686.0 15.7 131.6 66.1 398.8 398.8 196.1 351.9 750.70.0 0.0 0.0 0.0 0.0 0.0 0.0 0.0 0.0 0.0
23.3 21.3 20.0 20.0 20.2 20.2 20.2 20.0 20.2 20.20.0 0.0 0.0 0.0 0.0 0.0 0.0 0.0 0.0 0.00.0 0.0 0.0 0.0 0.0 0.0 0.0 0.0 0.0 0.0
0.000 0.000 0.000 2.507 0.000 2.507 2.507 0.000 0.000 2.5070.996 0.999 1.001 0.998 0.998 0.998 0.998 0.998 0.998 0.9980.996 0.999 1.001 2.331 0.998 1.762 1.762 0.998 0.998 1.404
-1374.536 -3051.518 -17.729 -70.139 -71.265 -304.029 -304.029 -221.996 -379.429 -683.4580 0 0 0 0 0 0 0 0 0
0.000 0.000 0.000 0.000 0.000 0.000 0.000 0.000 0.000 0.0000.00 0.00 0.00 0.00 0.00 0.00 0.00 0.00 0.00 0.00
0.000 0.000 0.000 0.000 0.000 0.000 0.000 0.000 0.000 0.0000.000 0.000 0.000 0.000 0.000 0.000 0.000 0.000 0.000 0.000
833.725 835.399 3.559 3.485 14.986 44.680 44.680 44.465 79.786 124.4660.433 0.000 0.000 0.000 0.000 0.000 0.000 0.000 0.000 0.0000.000 0.565 0.000 0.000 0.000 0.000 0.000 0.000 0.000 0.0000.517 0.000 0.000 0.000 0.000 0.000 0.000 0.000 0.000 0.0000.000 0.675 0.000 0.000 0.000 0.000 0.000 0.000 0.000 0.0000.000 0.000 0.000 0.000 0.000 0.000 0.000 0.000 0.000 0.0000.060 0.000 0.000 0.000 0.000 0.000 0.000 0.000 0.000 0.0000.042 0.000 0.000 0.000 0.000 0.000 0.000 0.000 0.000 0.0000.044 0.000 0.000 0.000 0.000 0.000 0.000 0.000 0.000 0.0000.050 0.051 0.000 0.000 0.000 0.000 0.000 0.000 0.000 0.0000.000 0.000 0.000 0.000 0.000 0.000 0.000 0.000 0.000 0.0000.000 0.000 0.000 0.000 0.000 0.000 0.000 0.000 0.000 0.0000.000 0.000 0.000 0.000 0.000 0.000 0.000 0.000 0.000 0.0000.000 0.000 0.000 0.000 0.000 0.000 0.000 0.000 0.000 0.0000.000 0.000 0.000 0.000 0.000 0.000 0.000 0.000 0.000 0.0000.000 0.000 0.000 0.000 0.000 0.000 0.000 0.000 0.000 0.0000.000 0.000 0.000 0.000 0.000 0.000 0.000 0.000 0.000 0.0000.000 0.000 0.000 0.000 0.000 0.000 0.000 0.000 0.000 0.000
Pennstrom Consulting Easton Process Consulting, Inc.
10 of 17

STREAM NO.Description Units
Overall Solid t/hrAqueous t/hrGas t/hrTotal t/hrPercent Solids wt%Flow rate Stream m3/hrFlow rate Stream gal/minFlowrate gas Nm3/hrTemperature oCPressure kPagPressure psigSolids SgAqueous Sg Stream Total SgEnthalpy Mcal/hr
Solids Gold gr/hrGold oz/hrGold gptSulfur t/hrSulfur wt%
Aqueous H2O tphH2SO4 tph
Ca(OH)2 tphH2SO4 gpl
Ca(OH)2 gplNaCN gpl
Cu gplMn gplMg gplNa gpl
Gas N2 t/hrO2 t/hr
H2O t/hrCO2 t/hrN2 vol%O2 vol%
H2O vol%CO2 vol%
Note:Only major stream are shown on flowsheets.Streams may appear in table without flowsheet reference and are available in the process model.
Material and Energy BalanceRev. 12/07/07
Anatolia Minerals Development Ltd.Copler Project - Conceptual Sulfide Oxidation Process Flotation Ore 5000 tpd - 1.81 gpt Gold, 2.2 wt.% T(S), ~2 wt% CO2, Rougher-Cleaner FlotationDirect Mill Ore 3000 tpd - 3.11 gpt Gold, 4.6 wt.% T(S), ~2 wt% CO2
422 424 426 440 441 446 447 460Limestone Cyclone Overflow
Limestone Thickener Underflow
Limestone Thickener Overflow
Combined Solution to Limestone
Neutralization
Air to Limestone Neutralization
Limestone Neutralization
Slurry Discharge
Limestone Neutralization
Vent
Limestone Neutralization Thickener Feed
Well
66.217 66.217 0.000 66.217 0.000 75.768 0.000 75.76898.256 47.950 50.306 932.743 0.000 917.369 0.000 917.6730.000 0.000 0.000 0.000 0.361 0.000 6.184 0.000
164.473 114.167 50.306 998.960 0.361 993.137 6.184 993.44040.260 58.000 0.000 6.629 0.000 7.629 0.000 7.627124.8 74.4 50.4 952.9 0.0 946.0 0.0 946.3549.7 327.8 221.9 4,195.6 0.0 4,164.9 0.0 4,166.3
0.0 0.0 0.0 0.0 300.0 0.0 3,482.6 0.020.2 20.4 20.4 33.8 150.0 33.0 33.9 33.00.0 0.0 0.0 0.0 517.1 0.0 0.0 0.00.0 0.0 0.0 0.0 75.0 0.0 0.0 0.0
2.507 2.507 0.000 2.507 0.000 2.559 0.000 2.5590.998 0.998 0.998 1.007 0.000 1.001 0.000 1.0011.317 1.534 0.998 1.048 0.000 1.050 0.000 1.050
-520.833 -266.094 -228.698 8150.281 10.346 7395.230 15.829 7393.7270 0 0 0 0 0 0 0
0.000 0.000 0.000 0.000 0.000 0.000 0.000 0.0000.00 0.00 0.00 0.00 0.00 0.00 0.00 0.00
0.000 0.000 0.000 0.000 0.000 4.243 0.000 4.2430.000 0.000 0.000 0.000 0.000 5.599 0.000 5.599
98.256 47.950 50.306 913.606 0.000 911.216 0.000 911.5180.000 0.000 0.000 12.968 0.000 0.007 0.000 0.0070.000 0.000 0.000 0.000 0.000 0.000 0.000 0.0000.000 0.000 0.000 13.997 0.000 0.007 0.000 0.0070.000 0.000 0.000 0.000 0.000 0.000 0.000 0.0000.000 0.000 0.000 0.000 0.000 0.000 0.000 0.0000.000 0.000 0.000 0.641 0.000 0.648 0.000 0.6480.000 0.000 0.000 0.443 0.000 0.448 0.000 0.4480.000 0.000 0.000 0.528 0.000 0.534 0.000 0.5340.000 0.000 0.000 0.040 0.000 0.040 0.000 0.0400.000 0.000 0.000 0.000 0.273 0.000 0.273 0.0000.000 0.000 0.000 0.000 0.084 0.000 0.083 0.0000.000 0.000 0.000 0.000 0.000 0.000 0.000 0.0000.000 0.000 0.000 0.000 0.000 0.000 5.823 0.0000.000 0.000 0.000 0.000 78.087 0.000 6.727 0.0000.000 0.000 0.000 0.000 20.948 0.000 1.795 0.0000.000 0.000 0.000 0.000 0.000 0.000 0.000 0.0000.000 0.000 0.000 0.000 0.031 0.000 91.398 0.000
Pennstrom Consulting Easton Process Consulting, Inc.
11 of 17

STREAM NO.Description Units
Overall Solid t/hrAqueous t/hrGas t/hrTotal t/hrPercent Solids wt%Flow rate Stream m3/hrFlow rate Stream gal/minFlowrate gas Nm3/hrTemperature oCPressure kPagPressure psigSolids SgAqueous Sg Stream Total SgEnthalpy Mcal/hr
Solids Gold gr/hrGold oz/hrGold gptSulfur t/hrSulfur wt%
Aqueous H2O tphH2SO4 tph
Ca(OH)2 tphH2SO4 gpl
Ca(OH)2 gplNaCN gpl
Cu gplMn gplMg gplNa gpl
Gas N2 t/hrO2 t/hr
H2O t/hrCO2 t/hrN2 vol%O2 vol%
H2O vol%CO2 vol%
Note:Only major stream are shown on flowsheets.Streams may appear in table without flowsheet reference and are available in the process model.
Material and Energy BalanceRev. 12/07/07
Anatolia Minerals Development Ltd.Copler Project - Conceptual Sulfide Oxidation Process Flotation Ore 5000 tpd - 1.81 gpt Gold, 2.2 wt.% T(S), ~2 wt% CO2, Rougher-Cleaner FlotationDirect Mill Ore 3000 tpd - 3.11 gpt Gold, 4.6 wt.% T(S), ~2 wt% CO2
461 462 464 466 500 502 503 506Flocculant to
Limestone Thickener
Limestone Neutralization
Thickener Underflow
Limestone Solution
Neutralization Overflow
Limestone Thickener
Vent
Lime to Solution Neutralization
Plant Water to Solution
Neutralization Lime Slaker
Slaked Lime to Solution
Neutralization
Lime to Slurry Neutralization
0.000 75.769 0.000 0.000 3.648 0.000 0.963 0.9470.303 75.769 841.902 0.000 0.000 1.167 3.852 0.0000.000 0.000 0.000 0.000 0.000 0.000 0.000 0.0000.303 151.539 841.902 0.000 3.648 1.167 4.816 0.9470.000 50.000 0.000 0.000 100.000 0.000 20.000 100.0000.3 105.3 840.9 0.0 1.2 1.2 2.4 0.31.3 463.6 3,702.4 0.0 5.1 5.1 10.6 1.30.0 0.0 0.0 0.0 0.0 0.0 0.0 0.0
20.0 32.8 32.8 32.8 20.0 20.0 85.0 20.00.0 0.0 0.0 0.0 0.0 0.0 0.0 0.00.0 0.0 0.0 0.0 0.0 0.0 0.0 0.0
0.000 2.559 0.000 0.000 3.153 0.000 2.785 3.1531.001 1.001 1.001 0.000 0.000 0.998 1.860 0.0001.001 1.439 1.001 0.000 3.153 0.998 1.992 3.153-1.502 692.799 6479.117 0.000 -3.218 -5.828 58.612 -0.836
0 0 0 0 0 0 0 00.000 0.000 0.000 0.000 0.000 0.000 0.000 0.0000.00 0.00 0.00 0.00 0.00 0.00 0.00 0.00
0.000 4.243 0.000 0.000 0.000 0.000 0.000 0.0000.000 5.599 0.000 0.000 0.000 0.000 0.000 0.0000.302 75.261 836.257 0.000 0.000 1.167 0.305 0.0000.000 0.001 0.006 0.000 0.000 0.000 0.000 0.0000.000 0.000 0.000 0.000 0.000 0.000 3.548 0.0000.000 0.007 0.007 0.000 0.000 0.000 0.000 0.0000.000 0.000 0.000 0.000 0.000 0.000 1712.996 0.0000.000 0.000 0.000 0.000 0.000 0.000 0.000 0.0000.000 0.648 0.648 0.000 0.000 0.000 0.000 0.0000.000 0.448 0.448 0.000 0.000 0.000 0.000 0.0000.000 0.534 0.534 0.000 0.000 0.000 0.000 0.0000.000 0.040 0.040 0.000 0.000 0.000 0.000 0.0000.000 0.000 0.000 0.000 0.000 0.000 0.000 0.0000.000 0.000 0.000 0.000 0.000 0.000 0.000 0.0000.000 0.000 0.000 0.000 0.000 0.000 0.000 0.0000.000 0.000 0.000 0.000 0.000 0.000 0.000 0.0000.000 0.000 0.000 0.000 0.000 0.000 0.000 0.0000.000 0.000 0.000 0.000 0.000 0.000 0.000 0.0000.000 0.000 0.000 0.000 0.000 0.000 0.000 0.0000.000 0.000 0.000 0.000 0.000 0.000 0.000 0.000
Pennstrom Consulting Easton Process Consulting, Inc.
12 of 17

STREAM NO.Description Units
Overall Solid t/hrAqueous t/hrGas t/hrTotal t/hrPercent Solids wt%Flow rate Stream m3/hrFlow rate Stream gal/minFlowrate gas Nm3/hrTemperature oCPressure kPagPressure psigSolids SgAqueous Sg Stream Total SgEnthalpy Mcal/hr
Solids Gold gr/hrGold oz/hrGold gptSulfur t/hrSulfur wt%
Aqueous H2O tphH2SO4 tph
Ca(OH)2 tphH2SO4 gpl
Ca(OH)2 gplNaCN gpl
Cu gplMn gplMg gplNa gpl
Gas N2 t/hrO2 t/hr
H2O t/hrCO2 t/hrN2 vol%O2 vol%
H2O vol%CO2 vol%
Note:Only major stream are shown on flowsheets.Streams may appear in table without flowsheet reference and are available in the process model.
Material and Energy BalanceRev. 12/07/07
Anatolia Minerals Development Ltd.Copler Project - Conceptual Sulfide Oxidation Process Flotation Ore 5000 tpd - 1.81 gpt Gold, 2.2 wt.% T(S), ~2 wt% CO2, Rougher-Cleaner FlotationDirect Mill Ore 3000 tpd - 3.11 gpt Gold, 4.6 wt.% T(S), ~2 wt% CO2
508 510 512 524 550 554 556 558Slurry
Neutralization Lime Water
Slaked Lime to Slurry
Neutralization
Water to Lime Slaker
Neutralized Solution to
Tailings
Combined Feed to Leach
Neutralization
Neutralized Slurry to Leach
Leach Neutralization
Vent
Sodium Cyanide to Leach
0.000 0.814 0.000 10.691 240.785 242.213 0.000 0.0003.121 3.255 4.289 836.026 195.263 197.904 0.000 0.3180.000 0.000 0.000 0.000 0.000 0.000 0.000 0.0003.121 4.069 4.289 846.717 436.048 440.117 0.000 0.3180.000 20.000 0.000 1.263 55.220 55.034 0.000 0.0003.1 3.7 4.3 845.2 288.2 291.5 0.0 0.213.8 16.1 18.9 3,721.3 1,268.7 1,283.6 0.0 1.00.0 0.0 0.0 0.0 0.0 0.0 0.0 0.0
20.0 82.1 20.0 33.7 26.9 28.5 28.5 20.00.0 0.0 0.0 0.0 -0.3 0.0 0.0 0.00.0 0.0 0.0 0.0 0.0 0.0 0.0 0.0
0.000 1.320 0.000 1.962 2.597 2.593 0.000 0.0000.998 1.072 0.998 0.996 0.999 0.999 0.000 1.3570.998 1.114 0.998 1.002 1.513 1.510 0.000 1.357
-15.584 180.843 -21.412 7305.312 454.838 832.376 0.000 -1.2090 0 0 0 790 790 0 0
0.000 0.000 0.000 0.000 25.391 25.391 0.000 0.0000.00 0.00 0.00 0.00 3.28 3.26 0.00 0.00
0.000 0.000 0.000 1.260 8.974 9.124 0.000 0.0000.000 0.000 0.000 11.788 3.727 3.767 0.000 0.0003.121 2.914 4.289 835.120 194.604 197.376 0.000 0.2040.000 0.000 0.000 0.000 0.063 0.000 0.000 0.0000.000 0.340 0.000 0.800 0.000 0.500 0.000 0.0000.000 0.000 0.000 0.000 0.320 0.000 0.000 0.0000.000 112.088 0.000 0.953 0.000 2.523 0.000 0.0000.000 0.000 0.000 0.000 0.000 0.000 0.000 226.2310.000 0.000 0.000 0.000 0.288 0.000 0.000 0.0000.000 0.000 0.000 0.000 0.199 0.000 0.000 0.0000.000 0.000 0.000 0.000 0.234 0.000 0.000 0.0000.000 0.000 0.000 0.040 0.046 0.046 0.000 205.6390.000 0.000 0.000 0.000 0.000 0.000 0.000 0.0000.000 0.000 0.000 0.000 0.000 0.000 0.000 0.0000.000 0.000 0.000 0.000 0.000 0.000 0.000 0.0000.000 0.000 0.000 0.000 0.000 0.000 0.000 0.0000.000 0.000 0.000 0.000 0.000 0.000 0.000 0.0000.000 0.000 0.000 0.000 0.000 0.000 0.000 0.0000.000 0.000 0.000 0.000 0.000 0.000 0.000 0.0000.000 0.000 0.000 0.000 0.000 0.000 0.000 0.000
Pennstrom Consulting Easton Process Consulting, Inc.
13 of 17

STREAM NO.Description Units
Overall Solid t/hrAqueous t/hrGas t/hrTotal t/hrPercent Solids wt%Flow rate Stream m3/hrFlow rate Stream gal/minFlowrate gas Nm3/hrTemperature oCPressure kPagPressure psigSolids SgAqueous Sg Stream Total SgEnthalpy Mcal/hr
Solids Gold gr/hrGold oz/hrGold gptSulfur t/hrSulfur wt%
Aqueous H2O tphH2SO4 tph
Ca(OH)2 tphH2SO4 gpl
Ca(OH)2 gplNaCN gpl
Cu gplMn gplMg gplNa gpl
Gas N2 t/hrO2 t/hr
H2O t/hrCO2 t/hrN2 vol%O2 vol%
H2O vol%CO2 vol%
Note:Only major stream are shown on flowsheets.Streams may appear in table without flowsheet reference and are available in the process model.
Material and Energy BalanceRev. 12/07/07
Anatolia Minerals Development Ltd.Copler Project - Conceptual Sulfide Oxidation Process Flotation Ore 5000 tpd - 1.81 gpt Gold, 2.2 wt.% T(S), ~2 wt% CO2, Rougher-Cleaner FlotationDirect Mill Ore 3000 tpd - 3.11 gpt Gold, 4.6 wt.% T(S), ~2 wt% CO2
562 564 566 568 570 572 574 576Slurry to Leach Air to Leach Leach Vents Leach Slurry to
CIP Stripped Carbon
to Mill Slurry Feed to CIP Air to CIP CIP Internal
242.213 0.000 0.000 242.212 0.200 242.412 0.000 242.413198.532 0.000 0.000 198.503 0.001 198.504 0.000 198.472
0.000 1.249 1.279 0.000 0.000 0.000 1.249 0.000440.745 1.249 1.279 440.714 0.201 440.915 1.249 440.88554.955 0.000 0.000 54.959 99.602 54.979 0.000 54.983292.0 0.0 0.0 292.0 0.1 292.1 0.0 292.1
1,285.8 0.0 0.0 1,285.7 0.4 1,286.0 0.0 1,285.90.0 1,037.1 1,077.8 0.0 0.0 0.0 1,037.1 0.0
28.4 15.0 28.3 28.3 53.4 28.1 15.0 28.00.0 0.0 0.0 0.0 0.0 0.0 0.0 0.00.0 0.0 0.0 0.0 0.0 0.0 0.0 0.0
2.593 0.000 0.000 2.593 2.221 2.593 0.000 2.5930.999 0.000 0.000 0.999 1.258 1.000 0.000 1.0001.509 0.000 0.000 1.509 2.214 1.510 0.000 1.510
797.734 -1.305 2.041 776.404 0.872 738.412 -1.305 717.580790 0 0 39 15 54 0 808
25.391 0.000 0.000 1.258 0.493 1.751 0.000 25.9663.26 0.00 0.00 0.16 76.70 0.22 0.00 3.33
9.124 0.000 0.000 9.124 0.000 9.124 0.000 9.1243.767 0.000 0.000 3.767 0.000 3.764 0.000 3.764
197.874 0.000 0.000 197.844 0.000 197.844 0.000 197.8140.000 0.000 0.000 0.000 0.000 0.000 0.000 0.0000.500 0.000 0.000 0.500 0.000 0.500 0.000 0.5000.000 0.000 0.000 0.000 0.000 0.000 0.000 0.0002.517 0.000 0.000 2.518 0.055 2.518 0.000 2.5180.305 0.000 0.000 0.303 15.156 0.303 0.000 0.3030.000 0.000 0.000 0.000 0.000 0.000 0.000 0.0000.000 0.000 0.000 0.000 0.000 0.000 0.000 0.0000.000 0.000 0.000 0.000 0.000 0.000 0.000 0.0000.322 0.000 0.000 0.322 13.458 0.322 0.000 0.3210.000 0.943 0.943 0.000 0.000 0.000 0.943 0.0000.000 0.289 0.289 0.000 0.000 0.000 0.289 0.0000.000 0.000 0.031 0.000 0.000 0.000 0.000 0.0000.000 0.001 0.001 0.000 0.000 0.000 0.001 0.0000.000 78.087 75.135 0.000 0.000 0.000 78.087 0.0000.000 20.948 20.156 0.000 0.000 0.000 20.948 0.0000.000 0.000 3.780 0.000 0.000 0.000 0.000 0.0000.000 0.031 0.030 0.000 0.000 0.000 0.031 0.000
Pennstrom Consulting Easton Process Consulting, Inc.
14 of 17

STREAM NO.Description Units
Overall Solid t/hrAqueous t/hrGas t/hrTotal t/hrPercent Solids wt%Flow rate Stream m3/hrFlow rate Stream gal/minFlowrate gas Nm3/hrTemperature oCPressure kPagPressure psigSolids SgAqueous Sg Stream Total SgEnthalpy Mcal/hr
Solids Gold gr/hrGold oz/hrGold gptSulfur t/hrSulfur wt%
Aqueous H2O tphH2SO4 tph
Ca(OH)2 tphH2SO4 gpl
Ca(OH)2 gplNaCN gpl
Cu gplMn gplMg gplNa gpl
Gas N2 t/hrO2 t/hr
H2O t/hrCO2 t/hrN2 vol%O2 vol%
H2O vol%CO2 vol%
Note:Only major stream are shown on flowsheets.Streams may appear in table without flowsheet reference and are available in the process model.
Material and Energy BalanceRev. 12/07/07
Anatolia Minerals Development Ltd.Copler Project - Conceptual Sulfide Oxidation Process Flotation Ore 5000 tpd - 1.81 gpt Gold, 2.2 wt.% T(S), ~2 wt% CO2, Rougher-Cleaner FlotationDirect Mill Ore 3000 tpd - 3.11 gpt Gold, 4.6 wt.% T(S), ~2 wt% CO2
578 580 581 582 600 601 604 605CIP Vent Loaded
Carbon Mill CIP Slurry to Cyanide
Destruction CIL Tails to
Cyanide Destruction
Air to Cyanide Destruction
Combined Feed to Cyanide Destruction
Cyanide Destruction
Slurry Discharge
Cyanide Destruction
Vent
0.000 0.200 242.213 242.213 0.000 242.213 242.213 0.0000.000 0.011 198.461 198.461 0.000 198.461 198.351 0.0001.279 0.000 0.000 0.000 0.409 0.409 0.000 0.5201.279 0.211 440.674 440.674 0.409 441.084 440.564 0.5200.000 95.000 54.964 54.964 0.000 54.913 54.978 0.0000.0 0.1 292.0 292.0 0.0 292.0 291.9 0.00.0 0.4 1,285.4 1,285.4 0.0 1,285.4 1,285.4 0.0
1,077.2 0.0 0.0 0.0 339.8 339.8 0.0 427.828.0 28.0 28.0 28.0 20.0 28.0 28.5 28.50.0 0.0 0.0 0.0 0.0 0.0 0.0 0.00.0 0.0 0.0 0.0 0.0 0.0 0.0 0.0
0.000 2.220 2.593 2.593 0.000 2.593 2.593 0.0000.000 1.000 1.000 1.000 0.000 1.000 0.999 0.0000.000 2.092 1.509 1.509 0.000 1.509 1.509 0.0001.974 0.513 717.067 717.067 -0.025 717.042 828.109 0.811
0 767 41 41 0 41 41 00.000 24.658 1.307 1.307 0.000 1.307 1.307 0.0000.00 3828.62 0.17 0.17 0.00 0.17 0.17 0.00
0.000 0.000 9.124 9.124 0.000 9.124 9.124 0.0000.000 0.000 3.767 3.767 0.000 3.767 3.767 0.0000.000 0.011 197.804 197.804 0.000 197.804 197.727 0.0000.000 0.000 0.000 0.000 0.000 0.000 0.000 0.0000.000 0.000 0.500 0.500 0.000 0.500 0.500 0.0000.000 0.000 0.000 0.000 0.000 0.000 0.000 0.0000.000 2.518 2.518 2.518 0.000 2.518 2.518 0.0000.000 0.303 0.303 0.303 0.000 0.303 0.006 0.0000.000 0.000 0.000 0.000 0.000 0.000 0.000 0.0000.000 0.000 0.000 0.000 0.000 0.000 0.000 0.0000.000 0.000 0.000 0.000 0.000 0.000 0.000 0.0000.000 0.321 0.321 0.321 0.000 0.321 0.321 0.0000.943 0.000 0.000 0.000 0.309 0.309 0.000 0.3090.289 0.000 0.000 0.000 0.095 0.095 0.000 0.0750.030 0.000 0.000 0.000 0.000 0.000 0.000 0.0000.001 0.000 0.000 0.000 0.000 0.000 0.000 0.094
75.177 0.000 0.000 0.000 78.087 0.078 0.000 62.02920.167 0.000 0.000 0.000 20.948 0.021 0.000 13.2563.726 0.000 0.000 0.000 0.000 0.000 0.000 0.0000.030 0.000 0.000 0.000 0.031 0.000 0.000 11.999
Pennstrom Consulting Easton Process Consulting, Inc.
15 of 17

STREAM NO.Description Units
Overall Solid t/hrAqueous t/hrGas t/hrTotal t/hrPercent Solids wt%Flow rate Stream m3/hrFlow rate Stream gal/minFlowrate gas Nm3/hrTemperature oCPressure kPagPressure psigSolids SgAqueous Sg Stream Total SgEnthalpy Mcal/hr
Solids Gold gr/hrGold oz/hrGold gptSulfur t/hrSulfur wt%
Aqueous H2O tphH2SO4 tph
Ca(OH)2 tphH2SO4 gpl
Ca(OH)2 gplNaCN gpl
Cu gplMn gplMg gplNa gpl
Gas N2 t/hrO2 t/hr
H2O t/hrCO2 t/hrN2 vol%O2 vol%
H2O vol%CO2 vol%
Note:Only major stream are shown on flowsheets.Streams may appear in table without flowsheet reference and are available in the process model.
Material and Energy BalanceRev. 12/07/07
Anatolia Minerals Development Ltd.Copler Project - Conceptual Sulfide Oxidation Process Flotation Ore 5000 tpd - 1.81 gpt Gold, 2.2 wt.% T(S), ~2 wt% CO2, Rougher-Cleaner FlotationDirect Mill Ore 3000 tpd - 3.11 gpt Gold, 4.6 wt.% T(S), ~2 wt% CO2
606 609 610 612 620 622 624 630 631Flocculant to
Tails Thickener
Flotation Tailings Paste
Thickener Flocculant
Tails Thickener Underflow
Tails Thickener Overflow
Consolidated Tailings
Tailings Reclaim Solution
Tailing Evaporation
Combined Recliam Solution
Raw Water Make up to
Reclaim Solution
0.000 0.000 242.264 0.000 459.508 0.000 0.000 0.000 0.0001.454 1.239 130.450 69.276 154.817 1,666.563 0.000 1,735.839 45.3720.000 0.000 0.000 0.000 0.000 0.000 3.647 0.000 0.0001.454 1.239 372.713 69.276 614.325 1,666.563 3.647 1,735.839 45.3720.000 0.000 65.000 0.000 74.799 0.000 0.000 0.000 0.0001.5 1.2 224.0 69.3 330.1 1,671.0 0.0 1,738.4 45.56.4 5.5 986.3 305.3 1,453.4 7,357.2 0.0 7,653.9 200.10.0 0.0 0.0 0.0 0.0 0.0 4,870.3 0.0 0.0
20.0 20.0 28.6 28.6 26.5 26.5 26.5 22.0 20.00.0 0.0 0.0 0.0 0.0 0.0 0.0 0.0 0.00.0 0.0 0.0 0.0 0.0 0.0 0.0 0.0 0.0
0.000 0.000 2.593 0.000 2.628 0.000 0.000 0.000 0.0001.001 1.001 0.999 0.999 0.997 0.997 0.000 0.999 0.9981.001 1.001 1.664 0.999 1.861 0.997 0.000 0.999 0.998-7.205 -6.143 605.470 246.091 339.403 2491.291 3.774 -5191.124 -226.526
0 0 41 0 103 0 0 0 00.000 0.000 1.307 0.000 3.326 0.000 0.000 0.000 0.0000.00 0.00 0.17 0.00 0.23 0.00 0.00 0.00 0.00
0.000 0.000 9.124 0.000 11.466 0.000 0.000 0.000 0.0000.000 0.000 3.766 0.000 2.495 0.000 0.000 0.000 0.0001.446 1.233 130.043 69.060 154.706 1665.364 0.000 1734.424 45.3720.000 0.000 0.000 0.000 0.000 0.000 0.000 0.000 0.0000.000 0.000 0.327 0.173 0.096 1.031 0.000 1.204 0.0000.000 0.000 0.000 0.000 0.000 0.000 0.000 0.000 0.0000.000 0.000 2.501 2.501 0.617 0.617 0.000 0.693 0.0000.000 0.000 0.000 0.000 0.000 0.000 0.000 0.000 0.0000.000 0.000 0.000 0.000 0.000 0.000 0.000 0.000 0.0000.000 0.000 0.000 0.000 0.000 0.000 0.000 0.000 0.0000.000 0.000 0.000 0.000 0.000 0.000 0.000 0.000 0.0000.000 0.000 0.319 0.319 0.041 0.041 0.000 0.052 0.0000.000 0.000 0.000 0.000 0.000 0.000 0.000 0.000 0.0000.000 0.000 0.000 0.000 0.000 0.000 0.000 0.000 0.0000.000 0.000 0.000 0.000 0.000 0.000 3.647 0.000 0.0000.000 0.000 0.000 0.000 0.000 0.000 0.000 0.000 0.0000.000 0.000 0.000 0.000 0.000 0.000 0.000 0.000 0.0000.000 0.000 0.000 0.000 0.000 0.000 0.000 0.000 0.0000.000 0.000 0.000 0.000 0.000 0.000 100.000 0.000 0.0000.000 0.000 0.000 0.000 0.000 0.000 0.000 0.000 0.000
Pennstrom Consulting Easton Process Consulting, Inc.
16 of 17

STREAM NO.Description Units
Overall Solid t/hrAqueous t/hrGas t/hrTotal t/hrPercent Solids wt%Flow rate Stream m3/hrFlow rate Stream gal/minFlowrate gas Nm3/hrTemperature oCPressure kPagPressure psigSolids SgAqueous Sg Stream Total SgEnthalpy Mcal/hr
Solids Gold gr/hrGold oz/hrGold gptSulfur t/hrSulfur wt%
Aqueous H2O tphH2SO4 tph
Ca(OH)2 tphH2SO4 gpl
Ca(OH)2 gplNaCN gpl
Cu gplMn gplMg gplNa gpl
Gas N2 t/hrO2 t/hr
H2O t/hrCO2 t/hrN2 vol%O2 vol%
H2O vol%CO2 vol%
Note:Only major stream are shown on flowsheets.Streams may appear in table without flowsheet reference and are available in the process model.
Material and Energy BalanceRev. 12/07/07
Anatolia Minerals Development Ltd.Copler Project - Conceptual Sulfide Oxidation Process Flotation Ore 5000 tpd - 1.81 gpt Gold, 2.2 wt.% T(S), ~2 wt% CO2, Rougher-Cleaner FlotationDirect Mill Ore 3000 tpd - 3.11 gpt Gold, 4.6 wt.% T(S), ~2 wt% CO2
632 640 642 646 648 650 652 654 655 657Tailing Reclaim Excess
Flotation Tailings Paste
Thickener Feed
Flotation Tailings Paste
Thickener Underflow
Flotation Tailings Paste
Thickener Overflow
Flotation Thickener
Vent
Carbon Stripping Internal
Barren Strip Solution
Sodium Cyanide to Stripping
Stripped Carbon
Pregnant Stripping Solution
0.000 206.545 206.551 0.000 0.000 0.200 0.000 0.000 0.199 0.0000.000 837.990 111.220 726.764 0.000 0.011 10.000 0.043 0.000 10.0110.000 0.000 0.000 0.000 0.000 0.000 0.000 0.000 0.000 0.0000.000 1,044.535 317.771 726.764 0.000 0.211 10.000 0.043 0.200 10.0110.000 19.774 65.000 0.000 0.000 95.000 0.000 0.000 99.800 0.0000.0 915.8 187.5 728.3 0.0 0.1 9.6 0.0 0.1 9.70.0 4,032.0 825.4 3,206.6 0.0 0.4 42.5 0.1 0.4 42.50.0 0.0 0.0 0.0 0.0 0.0 0.0 0.0 0.0 0.0
21.3 21.8 21.8 21.8 21.8 28.0 53.7 26.2 53.6 53.60.0 0.0 0.0 0.0 0.0 0.0 0.0 0.0 0.0 0.00.0 0.0 0.0 0.0 0.0 0.0 0.0 0.0 0.0 0.0
0.000 2.718 2.718 0.000 0.000 2.220 0.000 0.000 2.220 0.0000.000 0.998 0.998 0.998 0.000 1.000 1.036 1.355 1.037 1.0370.000 1.141 1.695 0.998 0.000 2.092 1.036 1.355 2.215 1.0370.000 -2766.410 -454.616 -2311.794 0.000 0.513 276.136 0.037 0.871 275.778
0 63 63 0 0 767 0 0 15 00.000 2.019 2.019 0.000 0.000 24.658 0.000 0.000 0.493 0.0000.00 0.30 0.30 0.00 0.00 3828.62 0.00 0.00 77.01 0.00
0.000 1.082 1.082 0.000 0.000 0.000 0.000 0.000 0.000 0.0000.000 0.524 0.524 0.000 0.000 0.000 0.000 0.000 0.000 0.0000.000 837.984 111.220 726.764 0.000 0.011 9.494 0.027 0.000 9.5040.000 0.000 0.000 0.000 0.000 0.000 0.000 0.000 0.000 0.0000.000 0.000 0.000 0.000 0.000 0.000 0.001 0.000 0.000 0.0010.000 0.000 0.000 0.000 0.000 0.000 0.000 0.000 0.000 0.0000.000 0.000 0.000 0.000 0.000 2.518 0.089 0.000 0.091 0.0910.000 0.000 0.000 0.000 0.000 0.303 25.000 225.902 24.973 24.9730.000 0.000 0.000 0.000 0.000 0.000 0.000 0.000 0.000 0.0000.000 0.000 0.000 0.000 0.000 0.000 0.000 0.000 0.000 0.0000.000 0.000 0.000 0.000 0.000 0.000 0.000 0.000 0.000 0.0000.000 0.000 0.000 0.000 0.000 0.321 22.180 205.339 22.174 22.1740.000 0.000 0.000 0.000 0.000 0.000 0.000 0.000 0.000 0.0000.000 0.000 0.000 0.000 0.000 0.000 0.000 0.000 0.000 0.0000.000 0.000 0.000 0.000 0.000 0.000 0.000 0.000 0.000 0.0000.000 0.000 0.000 0.000 0.000 0.000 0.000 0.000 0.000 0.0000.000 0.000 0.000 0.000 0.000 0.000 0.000 0.000 0.000 0.0000.000 0.000 0.000 0.000 0.000 0.000 0.000 0.000 0.000 0.0000.000 0.000 0.000 0.000 0.000 0.000 0.000 0.000 0.000 0.0000.000 0.000 0.000 0.000 0.000 0.000 0.000 0.000 0.000 0.000
Pennstrom Consulting Easton Process Consulting, Inc.
17 of 17

STREAM NO. 658 659 660 662 664 670 680 701 702Description Units Barren EW
Solution Gold EW Vent Gold Dore Plant Water to
Stripping Strip Bleed Carbon Make-
up Oxygen to
Distribution CW Return
Oxygen Plant Cooling Water
To Cooling Tower
Overall Solid t/hr 0.000 0.000 0.001 0.000 0.000 0.001 0.000 0.000 0.000Aqueous t/hr 9.915 0.000 0.000 0.352 0.310 0.000 0.000 1,164.249 1,164.249Gas t/hr 0.000 0.095 0.000 0.000 0.000 0.000 25.104 0.000 0.000Total t/hr 9.915 0.095 0.001 0.352 0.310 0.001 25.104 1,164.249 1,164.249Percent Solids wt% 0.000 0.000 100.000 0.000 0.000 66.667 0.000 0.000 0.000Flow rate Stream m3/hr 9.6 0.0 0.0 0.4 0.3 0.0 0.0 1,167.6 1,167.6Flow rate Stream gal/min 42.1 0.0 0.0 1.6 1.3 0.0 0.0 5,140.8 5,140.8Flowrate gas Nm3/hr 0.0 126.9 0.0 0.0 0.0 0.0 18,832.5 0.0 0.0Temperature oC 55.0 55.0 55.0 20.0 53.7 20.0 20.0 25.0 25.0Pressure kPag 0.0 0.0 0.0 0.0 0.0 0.0 3,298.7 0.0 0.0Pressure psig 0.0 0.0 0.0 0.0 0.0 0.0 478.4 0.0 0.0Solids Sg 0.000 0.000 18.880 0.000 0.000 2.416 0.000 0.000 0.000Aqueous Sg 1.036 0.000 0.000 0.998 1.036 1.497 0.000 0.997 0.997Stream Total Sg 1.036 0.000 18.880 0.998 1.036 2.006 0.000 0.997 0.997Enthalpy Mcal/hr 286.406 1.262 0.001 -1.755 8.552 0.001 -12.170 -0.186 -0.186
Solids Gold gr/hr 0 0 749 0 0 0 0 0 0Gold oz/hr 0.000 0.000 24.084 0.000 0.000 0.000 0.000 0.000 0.000Gold gpt 0.00 0.00 1000000.00 0.00 0.00 0.00 0.00 0.00 0.00Sulfur t/hr 0.000 0.000 0.000 0.000 0.000 0.000 0.000 0.000 0.000Sulfur wt% 0.000 0.000 0.000 0.000 0.000 0.000 0.000 0.000 0.000
Aqueous H2O tph 9.409 0.000 0.000 0.352 0.294 0.000 0.000 1164.249 1164.249H2SO4 tph 0.000 0.000 0.000 0.000 0.000 0.000 0.000 0.000 0.000
Ca(OH)2 tph 0.001 0.000 0.000 0.000 0.000 0.000 0.000 0.000 0.000H2SO4 gpl 0.000 0.000 0.000 0.000 0.000 0.000 0.000 0.000 0.000
Ca(OH)2 gpl 0.092 0.000 0.000 0.000 0.089 0.000 0.000 0.000 0.000NaCN gpl 25.246 0.000 0.000 0.000 25.000 0.000 0.000 0.000 0.000
Cu gpl 0.000 0.000 0.000 0.000 0.000 0.000 0.000 0.000 0.000Mn gpl 0.000 0.000 0.000 0.000 0.000 0.000 0.000 0.000 0.000Mg gpl 0.000 0.000 0.000 0.000 0.000 0.000 0.000 0.000 0.000Na gpl 22.382 0.000 0.000 0.000 22.180 0.000 0.000 0.000 0.000
Gas N2 t/hr 0.000 0.000 0.000 0.000 0.000 0.000 0.022 0.000 0.000O2 t/hr 0.000 0.000 0.000 0.000 0.000 0.000 24.801 0.000 0.000
H2O t/hr 0.000 0.095 0.000 0.000 0.000 0.000 0.000 0.000 0.000CO2 t/hr 0.000 0.000 0.000 0.000 0.000 0.000 0.000 0.000 0.000N2 vol% 0.000 0.000 0.000 0.000 0.000 0.000 0.100 0.000 0.000O2 vol% 0.000 0.000 0.000 0.000 0.000 0.000 99.000 0.000 0.000
H2O vol% 0.000 100.000 0.000 0.000 0.000 0.000 0.000 0.000 0.000CO2 vol% 0.000 0.000 0.000 0.000 0.000 0.000 0.000 0.000 0.000
Note:Only major stream are shown on flowsheets.Streams may appear in table without flowsheet reference and are available in the process model.
Material and Energy BalanceRev. 12/07/07
Anatolia Minerals Development Ltd.Copler Project - Conceptual Sulfide Oxidation Process Flotation Ore 5000 tpd - 1.81 gpt Gold, 2.2 wt.% T(S), ~2 wt% CO2, Rougher-Cleaner FlotationDirect Mill Ore 3000 tpd - 3.11 gpt Gold, 4.6 wt.% T(S), ~2 wt% CO2
Pennstrom Consulting Easton Process Consulting, Inc.
1 of 5

STREAM NO.Description Units
Overall Solid t/hrAqueous t/hrGas t/hrTotal t/hrPercent Solids wt%Flow rate Stream m3/hrFlow rate Stream gal/minFlowrate gas Nm3/hrTemperature oCPressure kPagPressure psigSolids SgAqueous Sg Stream Total SgEnthalpy Mcal/hr
Solids Gold gr/hrGold oz/hrGold gptSulfur t/hrSulfur wt%
Aqueous H2O tphH2SO4 tph
Ca(OH)2 tphH2SO4 gpl
Ca(OH)2 gplNaCN gpl
Cu gplMn gplMg gplNa gpl
Gas N2 t/hrO2 t/hr
H2O t/hrCO2 t/hrN2 vol%O2 vol%
H2O vol%CO2 vol%
Note:Only major stream are shown on flowsheets.Streams may appear in table without flowsheet reference and are available in the process model.
Material and Energy BalanceRev. 12/07/07
Anatolia Minerals Development Ltd.Copler Project - Conceptual Sulfide Oxidation Process Flotation Ore 5000 tpd - 1.81 gpt Gold, 2.2 wt.% T(S), ~2 wt% CO2, Rougher-Cleaner FlotationDirect Mill Ore 3000 tpd - 3.11 gpt Gold, 4.6 wt.% T(S), ~2 wt% CO2
703 704 705 706 710 712 713 720 731Cooling Tower
Air Input Cooling Tower
Supply Cooling Tower Gas Discharge
Cooling Tower Blowdown
Cooling Water Supply Excess
Raw Water Make-up to
Cooling Tower
Cooling Water Supply to
Oxygen Plant
Lime Consumption
Raw Water to Flocculant Make-up
0.000 0.000 0.000 0.000 0.000 0.000 0.000 4.595 0.0000.000 1,144.396 1.149 3.309 0.000 21.642 1,166.038 0.000 8.010
2,328.499 0.000 2,343.895 0.000 0.000 0.000 0.000 0.000 0.0002,328.499 1,144.396 2,345.043 3.309 0.000 21.642 1,166.038 4.595 8.010
0.000 0.000 0.000 0.000 0.000 0.000 0.000 100.000 0.0000.0 1,145.9 1.2 3.3 0.0 21.7 1,167.6 1.5 8.00.0 5,045.4 5.1 14.6 0.0 95.5 5,140.8 6.4 35.3
1,933,814.2 0.0 1,954,370.6 0.0 0.0 0.0 0.0 0.0 0.020.0 18.0 18.0 18.0 18.0 20.0 18.0 20.0 20.00.0 0.0 0.0 0.0 0.0 0.0 0.0 0.0 0.00.0 0.0 0.0 0.0 0.0 0.0 0.0 0.0 0.0
0.000 0.000 0.000 0.000 0.000 0.000 0.000 3.153 0.0000.000 0.999 0.999 0.999 0.000 0.998 0.999 0.000 0.9980.000 0.999 0.999 0.999 0.000 0.998 0.999 3.153 0.998
-144.100 -8000.117 -1110.959 -23.131 0.000 -108.050 -8108.167 -4.054 -39.9920 0 0 0 0 0 0 0 0
0.000 0.000 0.000 0.000 0.000 0.000 0.000 0.000 0.0000.00 0.00 0.00 0.00 0.00 0.00 0.00 0.00 0.000.000 0.000 0.000 0.000 0.000 0.000 0.000 0.000 0.0000.000 0.000 0.000 0.000 0.000 0.000 0.000 0.000 0.0000.000 1144.396 1.149 3.309 0.000 21.642 1166.038 0.000 8.0100.000 0.000 0.000 0.000 0.000 0.000 0.000 0.000 0.0000.000 0.000 0.000 0.000 0.000 0.000 0.000 0.000 0.0000.000 0.000 0.000 0.000 0.000 0.000 0.000 0.000 0.0000.000 0.000 0.000 0.000 0.000 0.000 0.000 0.000 0.0000.000 0.000 0.000 0.000 0.000 0.000 0.000 0.000 0.0000.000 0.000 0.000 0.000 0.000 0.000 0.000 0.000 0.0000.000 0.000 0.000 0.000 0.000 0.000 0.000 0.000 0.0000.000 0.000 0.000 0.000 0.000 0.000 0.000 0.000 0.0000.000 0.000 0.000 0.000 0.000 0.000 0.000 0.000 0.000
1758.535 0.000 1758.535 0.000 0.000 0.000 0.000 0.000 0.000538.858 0.000 538.858 0.000 0.000 0.000 0.000 0.000 0.0000.001 0.000 15.396 0.000 0.000 0.000 0.000 0.000 0.0001.111 0.000 1.111 0.000 0.000 0.000 0.000 0.000 0.00078.087 0.000 77.205 0.000 0.000 0.000 0.000 0.000 0.00020.948 0.000 20.711 0.000 0.000 0.000 0.000 0.000 0.0000.000 0.000 1.051 0.000 0.000 0.000 0.000 0.000 0.0000.031 0.000 0.031 0.000 0.000 0.000 0.000 0.000 0.000
Pennstrom Consulting Easton Process Consulting, Inc.
2 of 5

STREAM NO.Description Units
Overall Solid t/hrAqueous t/hrGas t/hrTotal t/hrPercent Solids wt%Flow rate Stream m3/hrFlow rate Stream gal/minFlowrate gas Nm3/hrTemperature oCPressure kPagPressure psigSolids SgAqueous Sg Stream Total SgEnthalpy Mcal/hr
Solids Gold gr/hrGold oz/hrGold gptSulfur t/hrSulfur wt%
Aqueous H2O tphH2SO4 tph
Ca(OH)2 tphH2SO4 gpl
Ca(OH)2 gplNaCN gpl
Cu gplMn gplMg gplNa gpl
Gas N2 t/hrO2 t/hr
H2O t/hrCO2 t/hrN2 vol%O2 vol%
H2O vol%CO2 vol%
Note:Only major stream are shown on flowsheets.Streams may appear in table without flowsheet reference and are available in the process model.
Material and Energy BalanceRev. 12/07/07
Anatolia Minerals Development Ltd.Copler Project - Conceptual Sulfide Oxidation Process Flotation Ore 5000 tpd - 1.81 gpt Gold, 2.2 wt.% T(S), ~2 wt% CO2, Rougher-Cleaner FlotationDirect Mill Ore 3000 tpd - 3.11 gpt Gold, 4.6 wt.% T(S), ~2 wt% CO2
733 800 802 804 806 808 809 810 840Flocculant Dry Diesel for
Boiler Combustion Gas to Boiler
Boiler Exaust Gas
Boiler Internal Boiler Exahaust Gas after Discharge
Air to Bolier Boiler Combustion Air
Agitator Seal Water
0.040 0.000 0.000 0.000 0.000 0.000 0.000 0.000 0.0000.000 0.000 0.000 0.000 0.000 0.000 0.000 0.000 48.9760.000 0.000 53.973 53.973 0.000 53.973 51.974 51.974 0.0000.040 1.999 53.973 53.973 0.000 53.973 51.974 51.974 48.976
100.000 0.000 0.000 0.000 0.000 0.000 0.000 0.000 0.0000.0 0.0 0.0 0.0 0.0 0.0 0.0 0.0 49.10.1 0.0 0.0 0.0 0.0 0.0 0.0 0.0 216.00.0 0.0 44,642.3 44,642.3 0.0 44,642.3 43,164.3 43,164.3 0.020.0 20.0 1,407.1 600.0 600.0 375.0 20.0 298.4 20.00.0 0.0 0.0 0.0 0.0 0.0 0.0 0.0 0.00.0 0.0 0.0 0.0 0.0 0.0 0.0 0.0 0.0
2.000 0.000 0.000 0.000 0.000 0.000 0.000 0.000 0.0000.000 0.000 0.000 0.000 0.000 0.000 0.000 0.000 0.9982.000 0.000 0.000 0.000 0.000 0.000 0.000 0.000 0.9980.087 -4.690 21193.198 8166.732 0.000 4769.347 -3.216 3394.169 -244.518
0 0 0 0 0 0 0 0 00.000 0.000 0.000 0.000 0.000 0.000 0.000 0.000 0.0000.00 0.00 0.00 0.00 0.00 0.00 0.00 0.00 0.000.000 0.000 0.000 0.000 0.000 0.000 0.000 0.000 0.0000.000 0.000 0.000 0.000 0.000 0.000 0.000 0.000 0.0000.000 0.000 0.000 0.000 0.000 0.000 0.000 0.000 48.9760.000 0.000 0.000 0.000 0.000 0.000 0.000 0.000 0.0000.000 0.000 0.000 0.000 0.000 0.000 0.000 0.000 0.0000.000 0.000 0.000 0.000 0.000 0.000 0.000 0.000 0.0000.000 0.000 0.000 0.000 0.000 0.000 0.000 0.000 0.0000.000 0.000 0.000 0.000 0.000 0.000 0.000 0.000 0.0000.000 0.000 0.000 0.000 0.000 0.000 0.000 0.000 0.0000.000 0.000 0.000 0.000 0.000 0.000 0.000 0.000 0.0000.000 0.000 0.000 0.000 0.000 0.000 0.000 0.000 0.0000.000 0.000 0.000 0.000 0.000 0.000 0.000 0.000 0.0000.000 0.000 39.252 39.252 0.000 39.252 39.252 39.252 0.0000.000 0.000 5.446 5.446 0.000 5.446 12.028 12.028 0.0000.000 0.000 2.201 2.201 0.000 2.201 0.000 0.000 0.0000.000 0.000 6.403 6.403 0.000 6.403 0.025 0.025 0.0000.000 0.000 75.502 75.502 0.000 75.502 78.087 78.087 0.0000.000 0.000 9.170 9.170 0.000 9.170 20.948 20.948 0.0000.000 0.000 6.584 6.584 0.000 6.584 0.000 0.000 0.0000.000 0.000 7.839 7.839 0.000 7.839 0.031 0.031 0.000
Pennstrom Consulting Easton Process Consulting, Inc.
3 of 5

STREAM NO.Description Units
Overall Solid t/hrAqueous t/hrGas t/hrTotal t/hrPercent Solids wt%Flow rate Stream m3/hrFlow rate Stream gal/minFlowrate gas Nm3/hrTemperature oCPressure kPagPressure psigSolids SgAqueous Sg Stream Total SgEnthalpy Mcal/hr
Solids Gold gr/hrGold oz/hrGold gptSulfur t/hrSulfur wt%
Aqueous H2O tphH2SO4 tph
Ca(OH)2 tphH2SO4 gpl
Ca(OH)2 gplNaCN gpl
Cu gplMn gplMg gplNa gpl
Gas N2 t/hrO2 t/hr
H2O t/hrCO2 t/hrN2 vol%O2 vol%
H2O vol%CO2 vol%
Note:Only major stream are shown on flowsheets.Streams may appear in table without flowsheet reference and are available in the process model.
Material and Energy BalanceRev. 12/07/07
Anatolia Minerals Development Ltd.Copler Project - Conceptual Sulfide Oxidation Process Flotation Ore 5000 tpd - 1.81 gpt Gold, 2.2 wt.% T(S), ~2 wt% CO2, Rougher-Cleaner FlotationDirect Mill Ore 3000 tpd - 3.11 gpt Gold, 4.6 wt.% T(S), ~2 wt% CO2
850 852 854 910 912 2002 2004 2006Demin Plant
Reject Boiler Feed
Water High Pressure
Steam Raw Water to Demin Plant
Raw Water Demand
Combined Slurry Feed to
Preacidification
Direct Feed Crushed Ore
Direct Feed Ballmill Feed
0.000 0.000 0.000 0.000 0.000 163.828 138.889 415.99817.261 20.068 0.000 86.305 245.184 118.634 2.834 195.7640.000 0.000 20.068 0.000 0.000 0.000 0.000 0.00017.261 20.068 20.068 86.305 245.184 282.462 141.723 611.7620.000 0.000 0.000 0.000 0.000 58.000 98.000 68.00017.3 20.1 0.0 86.5 245.6 175.3 51.9 343.276.2 88.5 0.0 380.7 1,081.5 771.7 228.7 1,510.80.0 0.0 26,796.3 0.0 0.0 0.0 0.0 0.024.6 20.0 253.8 20.9 20.3 20.3 20.0 20.00.0 4,186.9 4,136.9 0.0 0.0 0.0 0.0 0.00.0 607.3 600.0 0.0 0.0 0.0 0.0 0.0
0.000 0.000 0.000 0.000 0.000 2.903 2.829 2.8290.997 0.998 0.000 0.998 0.998 0.998 0.998 0.9980.997 0.998 0.000 0.998 0.998 1.612 2.729 1.783-7.685 -100.193 1207.476 -352.396 -1145.614 -672.517 -116.018 -1282.480
0 0 0 0 0 790 433 12960.000 0.000 0.000 0.000 0.000 25.391 13.907 41.6540.00 0.00 0.00 0.00 0.00 4.82 3.11 3.110.000 0.000 0.000 0.000 0.000 10.401 6.389 19.1370.000 0.000 0.000 0.000 0.000 6.349 4.600 4.60017.261 20.068 0.000 86.305 245.184 118.634 2.834 195.7640.000 0.000 0.000 0.000 0.000 0.000 0.000 0.0000.000 0.000 0.000 0.000 0.000 0.000 0.000 0.0000.000 0.000 0.000 0.000 0.000 0.000 0.000 0.0000.000 0.000 0.000 0.000 0.000 0.000 0.000 0.0000.000 0.000 0.000 0.000 0.000 0.000 0.000 0.0000.000 0.000 0.000 0.000 0.000 0.000 0.000 0.0000.000 0.000 0.000 0.000 0.000 0.000 0.000 0.0000.000 0.000 0.000 0.000 0.000 0.000 0.000 0.0000.000 0.000 0.000 0.000 0.000 0.000 0.000 0.0000.000 0.000 0.000 0.000 0.000 0.000 0.000 0.0000.000 0.000 0.000 0.000 0.000 0.000 0.000 0.0000.000 0.000 20.068 0.000 0.000 0.000 0.000 0.0000.000 0.000 0.000 0.000 0.000 0.000 0.000 0.0000.000 0.000 0.000 0.000 0.000 0.000 0.000 0.0000.000 0.000 0.000 0.000 0.000 0.000 0.000 0.0000.000 0.000 100.000 0.000 0.000 0.000 0.000 0.0000.000 0.000 0.000 0.000 0.000 0.000 0.000 0.000
Pennstrom Consulting Easton Process Consulting, Inc.
4 of 5

STREAM NO.Description Units
Overall Solid t/hrAqueous t/hrGas t/hrTotal t/hrPercent Solids wt%Flow rate Stream m3/hrFlow rate Stream gal/minFlowrate gas Nm3/hrTemperature oCPressure kPagPressure psigSolids SgAqueous Sg Stream Total SgEnthalpy Mcal/hr
Solids Gold gr/hrGold oz/hrGold gptSulfur t/hrSulfur wt%
Aqueous H2O tphH2SO4 tph
Ca(OH)2 tphH2SO4 gpl
Ca(OH)2 gplNaCN gpl
Cu gplMn gplMg gplNa gpl
Gas N2 t/hrO2 t/hr
H2O t/hrCO2 t/hrN2 vol%O2 vol%
H2O vol%CO2 vol%
Note:Only major stream are shown on flowsheets.Streams may appear in table without flowsheet reference and are available in the process model.
Material and Energy BalanceRev. 12/07/07
Anatolia Minerals Development Ltd.Copler Project - Conceptual Sulfide Oxidation Process Flotation Ore 5000 tpd - 1.81 gpt Gold, 2.2 wt.% T(S), ~2 wt% CO2, Rougher-Cleaner FlotationDirect Mill Ore 3000 tpd - 3.11 gpt Gold, 4.6 wt.% T(S), ~2 wt% CO2
2008 2010 2020 2022 2024 2026 2028 2040Direct Feed
Ballmill Discharge
Direct Feed Cyclone Sump
Dilution
Direct Feed Cyclone Feed
Direct Feed Cyclone
Underflow
Direct Feed Cyclone Overflow
Direct Feed Grinding Thickener Flocculent
Direct Feed Grinding
Thickener Feed
Direct Feed Grinding Thickener Underflow
415.998 0.000 415.998 277.109 138.889 0.000 138.889 138.891195.764 312.678 508.442 118.761 389.681 0.417 390.098 100.5760.000 0.000 0.000 0.000 0.000 0.000 0.000 0.000
611.762 312.678 924.440 395.870 528.570 0.417 528.986 239.46768.000 0.000 45.000 70.000 26.276 0.000 26.256 58.000343.2 313.2 656.4 216.9 439.5 0.4 439.9 149.8
1,510.8 1,379.1 2,889.9 955.1 1,934.9 1.8 1,936.7 659.80.0 0.0 0.0 0.0 0.0 0.0 0.0 0.020.0 20.0 20.0 20.0 20.0 20.0 20.0 20.00.0 0.0 0.0 0.0 0.0 0.0 0.0 0.00.0 0.0 0.0 0.0 0.0 0.0 0.0 0.0
2.829 0.000 2.829 2.829 2.829 0.000 2.829 2.8290.998 0.998 0.998 0.998 0.998 1.001 0.998 0.9981.783 0.998 1.408 1.825 1.203 1.001 1.203 1.598
-1282.480 -1561.077 -2843.558 -796.170 -2047.387 -2.066 -2049.453 -603.9991296 0 1296 863 433 0 433 433
41.654 0.000 41.654 27.747 13.907 0.000 13.907 13.9073.11 0.00 3.11 3.11 3.11 0.00 3.11 3.11
19.137 0.000 19.137 12.747 6.389 0.000 6.389 6.3894.600 0.000 4.600 4.600 4.600 0.000 4.600 4.600
195.764 312.678 508.442 118.761 389.681 0.415 390.096 100.5760.000 0.000 0.000 0.000 0.000 0.000 0.000 0.0000.000 0.000 0.000 0.000 0.000 0.000 0.000 0.0000.000 0.000 0.000 0.000 0.000 0.000 0.000 0.0000.000 0.000 0.000 0.000 0.000 0.000 0.000 0.0000.000 0.000 0.000 0.000 0.000 0.000 0.000 0.0000.000 0.000 0.000 0.000 0.000 0.000 0.000 0.0000.000 0.000 0.000 0.000 0.000 0.000 0.000 0.0000.000 0.000 0.000 0.000 0.000 0.000 0.000 0.0000.000 0.000 0.000 0.000 0.000 0.000 0.000 0.0000.000 0.000 0.000 0.000 0.000 0.000 0.000 0.0000.000 0.000 0.000 0.000 0.000 0.000 0.000 0.0000.000 0.000 0.000 0.000 0.000 0.000 0.000 0.0000.000 0.000 0.000 0.000 0.000 0.000 0.000 0.0000.000 0.000 0.000 0.000 0.000 0.000 0.000 0.0000.000 0.000 0.000 0.000 0.000 0.000 0.000 0.0000.000 0.000 0.000 0.000 0.000 0.000 0.000 0.0000.000 0.000 0.000 0.000 0.000 0.000 0.000 0.000
Pennstrom Consulting Easton Process Consulting, Inc.
5 of 5

STREAM NO. 2042 2044 2050 2052 2054 2058Description Units Direct Feed
Grinding Thickener Overflow
Direct Feed Thickener Vent
Internal
Direct Feed Mill Solution
Excess
Direct Feed Ballmill Dilution
Direct Feed Mill Soluition Tank
Make-up
Direct Feed Mill Solution Pump
Discharge
Overall Solid t/hr 0.000 0.000 0.000 0.000 0.000 0.000Aqueous t/hr 289.519 0.000 0.000 74.168 97.327 386.846Gas t/hr 0.000 0.000 0.000 0.000 0.000 0.000Total t/hr 289.519 0.000 0.000 74.168 97.327 386.846Percent Solids wt% 0.000 0.000 0.000 0.000 0.000 0.000Flow rate Stream m3/hr 290.0 0.0 0.0 74.3 97.5 387.5Flow rate Stream gal/min 1,276.9 0.0 0.0 327.1 429.1 1,706.2Flowrate gas Nm3/hr 0.0 0.0 0.0 0.0 0.0 0.0Temperature oC 20.0 20.0 20.3 20.0 21.3 20.3Pressure kPag 0.0 0.0 0.0 0.0 0.0 0.0Pressure psig 0.0 0.0 0.0 0.0 0.0 0.0Solids Sg 0.000 0.000 0.000 0.000 0.0 0.0Aqueous Sg 0.998 0.000 0.000 0.998 1.0 1.0Stream Total Sg 0.998 0.000 0.000 0.998 1.00 1.00Enthalpy Mcal/hr -1445.455 0.000 0.000 -370.292 -355.231 -1800.685
Solids Gold gr/hr 0 0 0 0 0 0Gold oz/hr 0.000 0.000 0.000 0.000 0.000 0.000Gold gpt 0.00 0.00 0.00 0.00 0.00 0.00Sulfur t/hr 0.000 0.000 0.000 0.000 0.000 0.000Sulfur wt% 0.000 0.000 0.000 0.000 0.000 0.000
Aqueous H2O tph 289.519 0.000 0.000 74.168 97.250 386.769H2SO4 tph 0.000 0.000 0.000 0.000 0.000 0.000
Ca(OH)2 tph 0.000 0.000 0.000 0.000 0.066 0.066H2SO4 gpl 0.000 0.000 0.000 0.000 0.000 0.000
Ca(OH)2 gpl 0.000 0.000 0.000 0.000 0.675 0.170NaCN gpl 0.000 0.000 0.000 0.000 0.000 0.000
Cu gpl 0.000 0.000 0.000 0.000 0.000 0.000Mn gpl 0.000 0.000 0.000 0.000 0.000 0.000Mg gpl 0.000 0.000 0.000 0.000 0.000 0.000Na gpl 0.000 0.000 0.000 0.000 0.051 0.013
Gas N2 t/hr 0.000 0.000 0.000 0.000 0.000 0.000O2 t/hr 0.000 0.000 0.000 0.000 0.000 0.000
H2O t/hr 0.000 0.000 0.000 0.000 0.000 0.000CO2 t/hr 0.000 0.000 0.000 0.000 0.000 0.000N2 vol% 0.000 0.000 0.000 0.000 0.000 0.000O2 vol% 0.000 0.000 0.000 0.000 0.000 0.000
H2O vol% 0.000 0.000 0.000 0.000 0.000 0.000CO2 vol% 0.000 0.000 0.000 0.000 0.000 0.000
Note:Only major stream are shown on flowsheets.Streams may appear in table without flowsheet reference and are available in the process model.
Material and Energy BalanceRev. 12/07/07
Anatolia Minerals Development Ltd.Copler Project - Conceptual Sulfide Oxidation Process Flotation Ore 5000 tpd - 1.81 gpt Gold, 2.2 wt.% T(S), ~2 wt% CO2, Rougher-Cleaner FlotationDirect Mill Ore 3000 tpd - 3.11 gpt Gold, 4.6 wt.% T(S), ~2 wt% CO2
Pennstrom Consulting Easton Process Consulting, Inc.
1 of 1

ATTACHMENT C
PROCESS FLOW DIAGRAMS

Overall Sulfide Process
Grizzly
ROM Ore
Crushing Open Circuit Primary
Secondary, Tertiary (Closed Circuit-2
parallel)
PFD-F-001Drawing No.
ARev.
Revision DescriptionRev. Date:
A
Revision DescriptionDate: By:
CLE
Client: Easton Process Consulting, Inc.
By: Project:
Project No:
Sulfide Preliminary Study
Title:
Conceptual
Rev.
11/07
Pennstrom Consulting
Anatolia Minerals Development Limited
Concentrate Thickener
Ball Mill
Ball Mill Cyclone
Tailings Reclaim Water
Mill Solution Tank
New Equipment
Rougher Flotation
Flotation Conditioning Tank
Flotation Reagents
Flocculant
Scrubber Solution to CCDAutoclave Feed Pumps
Autoclave Feed Tank
6 Compartment Pressure Leach Vessel
Vent to Atmosphere
Slurry to CCD
Flash Vessel
Vent Scrubber
Gland Seal Water Typical All Agitators
CCD Thickener 1
CCD Thickener 2
CCD Thickener 3
PreAcidificaton Thickener
Concentrate and Direct Thickener
Underflows
Oxygen
Demineralized Water
FlocculantB/L
Steam
Blower Air
Cooling Water Loop All Agitators
(Intermittent)
New Equipment
Pre-Acidification
Flocculant to all CCD’s as 5 gpl solution.
Limestone Neutralization
Thickener
Flocculant
Gold Dore
Raw Water
Limestone Milling
Preacidification Thickener Overflow to Solution
Neutralization
No. 2 CCD O/F to Solution Neutralization
Lime
Raw WaterLime
Slaking
Carbon Plant Gold
Recovery
Lime Neutralization and CIL
Oxidized Slurry to Neutralization and Leach
Existing Leach and CIP Recovery
Consolidated Tails
Reclaim Solution
Tailings Paste Thickener
Cyanide Detoxification
Flocculant
Solution Neutralization
with Lime
Cooling Tower Blowdown
Demineralization Reject
Mill Solution Tank
CCD Wash Solution
Excess Reclaim Solution
New Equipment
Raw Water Make-up
Intermittent
Existing ReagentsCyanide, Caustic,
Lime
Boiler
Oxygen Plant
Oxygen 99 vol%
High Pressure Steam
Demin Reject Water
Cooling Tower
Air
Cooling Tower Blowdown
Flocculant Make-Up
Demineralization Plant
Fuel Oil
Cooling Tower Make-up
CCD Feed Tank
Raw Water
Blower Air
No. 1 CCD O/F to Solution Neutralization (Excess)
Limestone From Heap Leach
Raw Water
Flotation Tailings
New Equipment
New Equipment
New Equipment
Raw Water
Quench Vessel
Cleaner Flotation
Grinding Thickener
Direct Mill Ore Grinding Circuit
New Equipment
Flotation Ore
Grinding Circuit
Flotation Tailings Paste Thickener
New Equipment
Copler Project

Crushing, Milling, and Flotation
Grizzly
B/L
ROM Ore
Crushing Open Circuit Primary and Secondary, Tertiary
(Closed Circuit-2 parallel)
PFD-F-010Drawing No.
ARev.
Revision DescriptionRev. Date:
A
Revision DescriptionDate: By:
CLE
Client: Easton Process Consulting, Inc.
By: Project:
Project No:
Sulfide Preliminary Study
Title:
Conceptual
Rev.
11/07
Pennstrom Consulting
Anatolia Minerals Development Limited
Concentrate Thickener
Ball Mill
Ball Mill Cyclone
1
F-030
Tailings Reclaim Water
47 F-020
Grinding Thickener Underflow to
Preacidification
56
Mill Solution Tank
54
46
48
41
44
F-040
Raw Water Dust Control
2
22
42
New Equipment
Rougher Flotation
Flotation Conditioning
Tank
Flotation Reagents
Launder Water
F-030
Flotation Tails
57
49
78F-040
Flocculant
52
65
53
Cleaner Flotation
Cleaner Flotation
Conditioning Tank
Launder Water
F-012
Direct Mill Feed
2004
58
74
79
76
53
71
Conditioning Reagents
Copler Project
New Equipment

Direct Milling Ore
PFD-F-012Drawing No.
ARev.
Revision DescriptionRev. Date:
A
Revision DescriptionDate: By:
CLE
Client: Easton Process Consulting, Inc.
By: Project:
Project No:
Sulfide Preliminary Study
Title:
Conceptual
Rev.
11/07
Pennstrom Consulting
Anatolia Minerals Development Limited
Grinding Thickener
Ball Mill
Ball Mill Cyclone
F-030
Tailings Reclaim Water
2054
F-020
Grinding Thickener Underflow to
Preacidification
2040
Mill Solution Tank
2028
2042
2020
2052
2010
New Equipment
2024
F-040
Flocculant
2026
2058
F-010
Direct Mill Ore
2004
2022
2008
Copler Project

Preacdification, Pressure Leach and CCD
PFD-F-020Drawing No.
ARev.
Revision DescriptionRev. Date:
A
Revision DescriptionDate: By:
CLE
Client: Easton Process Consulting, Inc.
By: Project:
Project No:
Sulfide Preliminary Study
Title:
Conceptual
Rev.
11/07
Pennstrom Consulting
Anatolia Minerals Development Limited
Scrubber Solution to CCD
Autoclave Feed Pumps
Autoclave Feed Tank
6 Compartment Pressure Leach Vessel
Vent to Atmosphere
Slurry to CCD
Flash Vessel
Vent Scrubber
CCD Thickener 1 CCD Thickener 2
CCD Thickener 3
PreAcidificaton Thickener
F-010
Flotation Concentrate
56
F-040
Tailings Reclaim Water
F-040
Raw Water to Scrubber
134
F-030
No. 2 CCD O/F to Solution Neutralization
F-040
Oxygen
F-040
Demineralized Water
105
104
110
F-040
Flocculant
99
96
94
B/L
F-030
Preacidification Thickener Overflow to Solution
Neutralization
97
138
139
133
124
F-040
Steam
854
F-030
Flocculant
63
F-0XX
Blower Air
64
385
Steam for Start-up
401
106
F-030
Oxidized Slurry to Neutralization
and Leach
382
Autoclave Feed Booster Pumps
357
355
120
121
122
123
136
137
108
Cooling Water Loop All Agitators
(Intermittent)
New Equipment
Pre-Acidification
102
Flocculant to all CCD’s as 5 gpl solution.
F-030
Excess Overflow to Solution Neutralization
61
CCD Feed Tank
Quench Vessel
134Raw Water to Scrubber
F-012
Direct Milling Ore
2040
2002
Copler Project
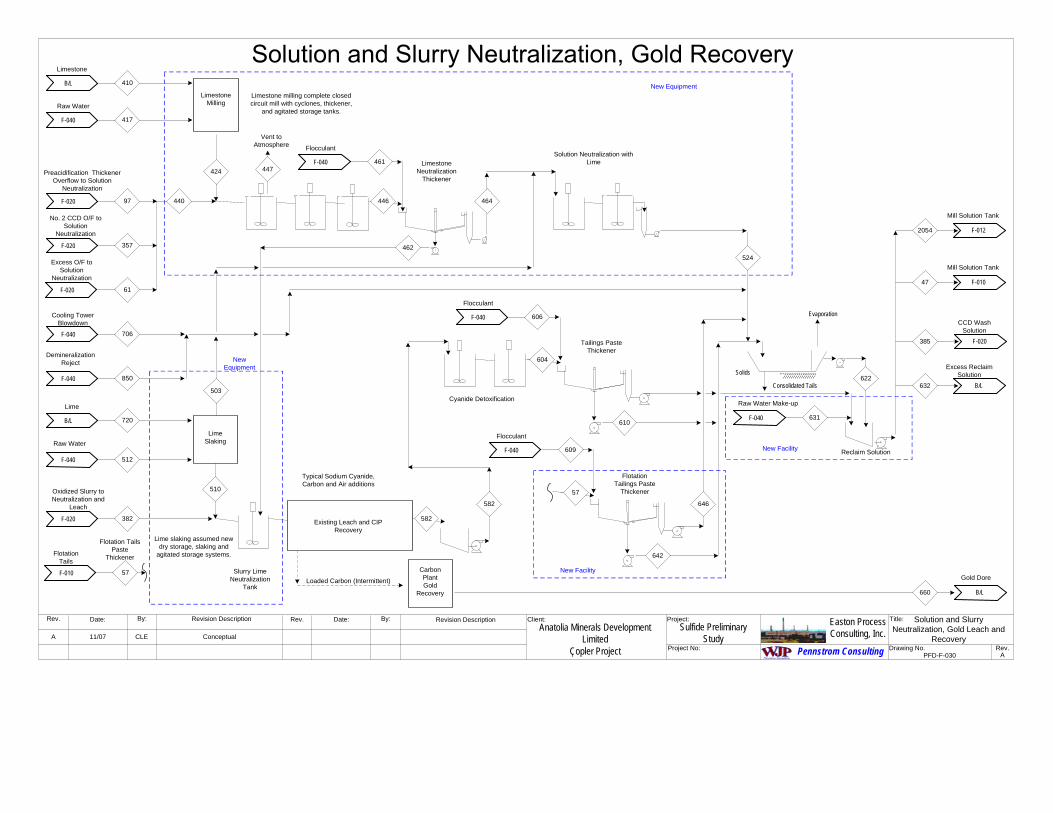
Solution and Slurry Neutralization, Gold Leach and
Recovery
PFD-F-030Drawing No.
ARev.
Revision DescriptionRev. Date:
A
Revision DescriptionDate: By:
CLE
Client: Easton Process Consulting, Inc.
By: Project:
Project No:
Sulfide Preliminary Study
Title:
Conceptual
Rev.
11/07
Pennstrom Consulting
Anatolia Minerals Development Limited
Limestone Neutralization
Thickener
B/L
Limestone
410
F-040
Flocculant
461
462
446F-020 97
B/L
Gold Dore
660
F-040
Raw Water
417
Limestone Milling
F-020 357
Preacidification Thickener Overflow to Solution
Neutralization
No. 2 CCD O/F to Solution
Neutralization
424
440 464
B/L
Lime
720
582F-020 382
F-040
Raw Water
512
Lime Slaking
510
Carbon Plant Gold
Recovery
Slurry Lime Neutralization
Tank
Oxidized Slurry to Neutralization and
Leach
Typical Sodium Cyanide, Carbon and Air additions
Loaded Carbon (Intermittent)
Existing Leach and CIP Recovery
447
Vent to Atmosphere
Evaporation
Consolidated Tails
Solids
524
Reclaim Solution
Tailings Paste Thickener
604
Cyanide Detoxification
582
F-040
Flocculant
606
Solution Neutralization with Lime
F-040 706
Cooling Tower Blowdown
F-040 850
Demineralization Reject
610
622
F-010
Mill Solution Tank
47
F-020
CCD Wash Solution
385
B/L
Excess Reclaim Solution
632
New Equipment
New Facility
New Equipment
F-040
Raw Water Make-up
631
F-020
Excess O/F to Solution
Neutralization
61
503
Limestone milling complete closed circuit mill with cyclones, thickener,
and agitated storage tanks.
Lime slaking assumed new dry storage, slaking and
agitated storage systems.
F-012
Mill Solution Tank
2054
Flotation Tailings Paste
Thickener57
F-040
Flocculant
609
642
F-010 57
646
Flotation Tails
Flotation Tails Paste
Thickener
New Facility
Copler Project

Reagents, Utilities, and Water Balance
PFD-F-040Drawing No.A
Rev.
Intermittent
Rev. Date:
A
Revision DescriptionDate: By:
CLE
Easton Process Consulting, Inc.
By: Project:
Project No:
Sulfide Preliminary Study
Title:
Conceptual
Rev.
11/07
Pennstrom Consulting
Anatolia Minerals Development Limited
F-012
Direct Mill Grinding Thickener
F-030
Autoclave
105
New Equipment
Existing ReagentsCyanide, Caustic,
Lime
Boiler
Oxygen Plant
B/L 912
Raw Water From Wells
F-030
Tailings Paste Thickener
606
F-030
Oxygen
680
F-020
High Pressure Steam
854
F-030
Demin Reject Water
850
F-020
Flocculant CCD
401
F-030
Limestone Neutralization
Thickener
461
2026
F-010
Flocculant Preacidification
Thickener
99
Cooling Tower
Air
Cooling Tower Blowdown
F-030706
713
703
705
703
712
731
B/L
Flocculant
733
Demineralization Plant
B/L
Fuel Oil
800
852
910
F-010
Dust Control Crusher
F-030
Reclaim Make-up
631
F-030
Limestone Milling
417
F-030Lime Slaking
512
2
F-020
Pressure Leach Scrubber
134
Cooling Tower Make-up
Flocculant731
F-030622
Strip Solution Make-up
F-030609
Fotation Tailings Paste Thickener
F-010
Flocculant Grinding Thickener
52
New Equipment
New Equipment
Copler Project
ATTACHMENT D
EQUIPMENT LIST AND CAPITAL COST ESTIMATE DETAIL

ANATOLIA MINERALS DEVELOPMENT, LTDCAPITAL COST ESTIMATE
Description Area Equipment Cost Total
Flotation Feed Grinding Area 10 $337,000 $800,000Rougher Sulfide Flotation 12 $2,800,000 $6,700,000Cleaner Sulfide Flotation 14 $910,000 $2,200,000Direct Feed Grinding 16 $3,900,000 $9,400,000Preacidification 22 $1,450,000 $3,500,000Pressure Oxidation 24 $15,530,000 $41,300,000CCD Thickening 26 $5,350,000 $12,100,000
Solution and Slurry Neutralization 30 $6,430,000 $14,000,000Utilities 40 $3,070,000 $6,800,000
$39,777,000 $96,800,000
Percent of Directs 41.092
Freight % of Directs 5.1 $5,000,000Taxes, Import/Export Duties ExcludedEngineering, Procurement, and Construction Management
% of Directs 18.1 $17,600,000Vendor Equipment Reps % of Directs 2.3 $2,300,000Escalation ExcludedCapital Spare Parts % of Equipment 5.1 $2,100,000
Subtotal $123,800,000
Contingency % of Sub-total 30.0 $37,200,000
Owners CostsReagent Inventory and First Fills Excluded 0.0Phase 1 Pilot Plant Work Excluded 0.0Phase 2 Pilot Plant Work Excluded 0.0Feasibility Study Excluded 0.0Permiting Excluded
Total $161,000,000
Pennstrom Consulting, Inc. Easton Process Consulting, Inc.
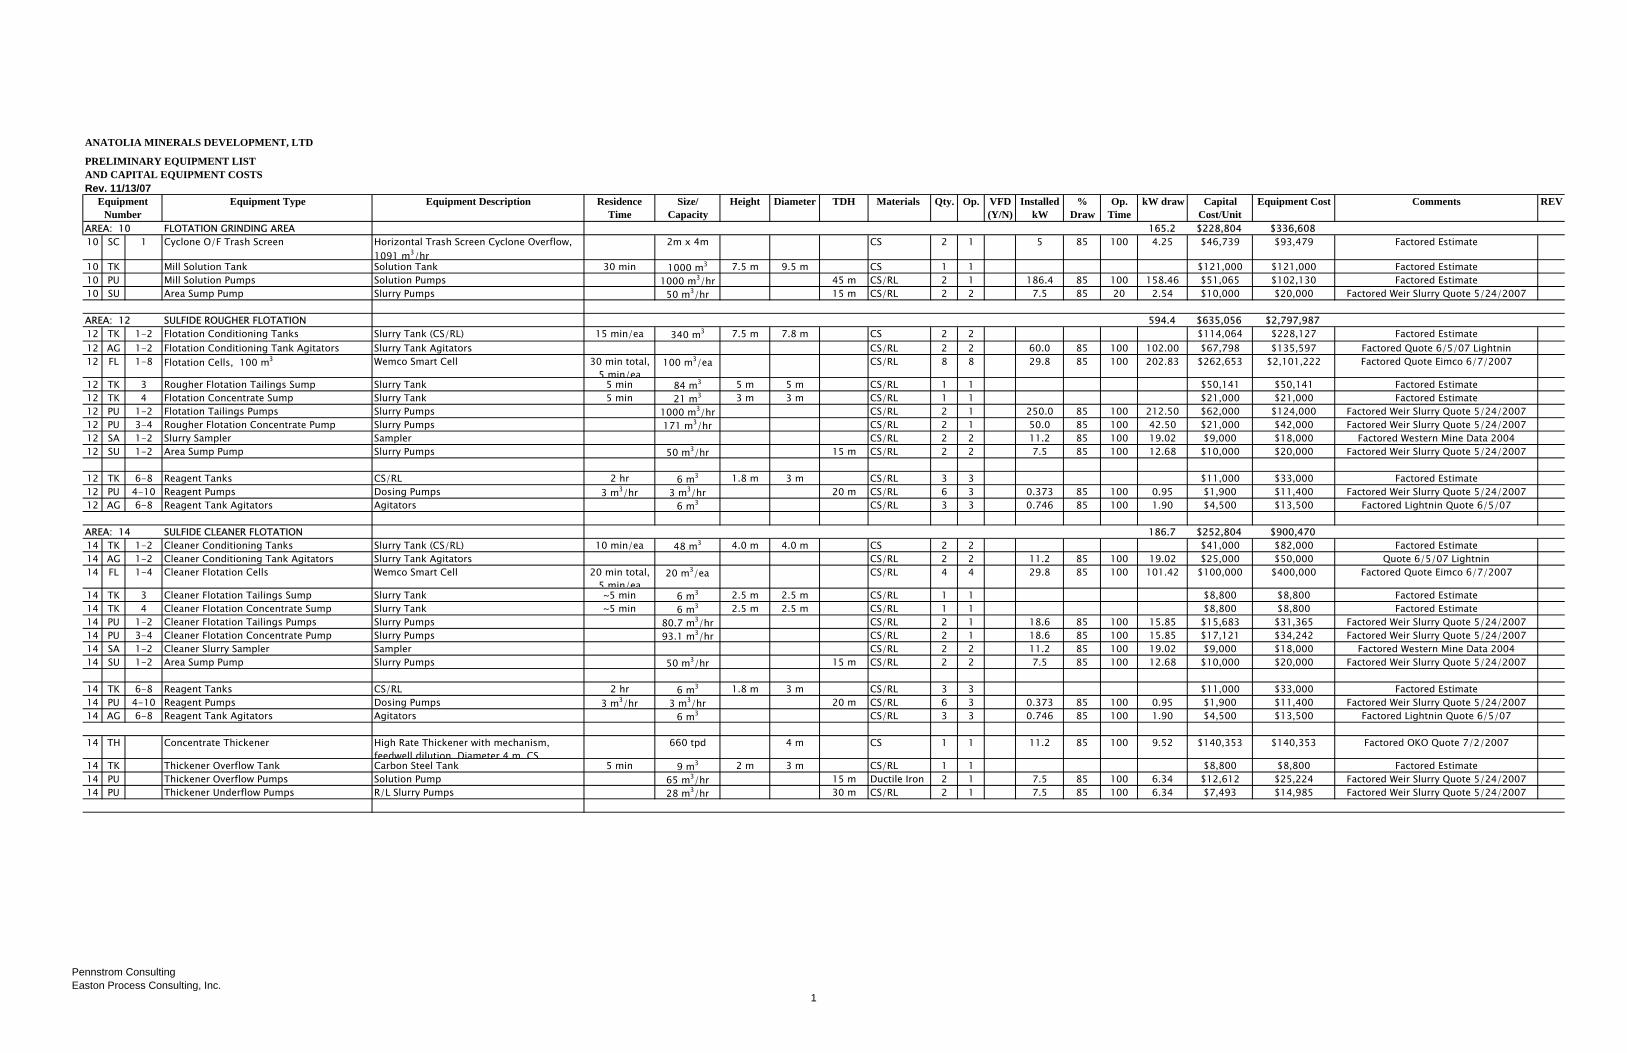
ANATOLIA MINERALS DEVELOPMENT, LTD
PRELIMINARY EQUIPMENT LIST AND CAPITAL EQUIPMENT COSTSRev. 11/13/07
Equipment Type Equipment Description Residence Time
Size/ Capacity
Height Diameter TDH Materials Qty. Op. VFD (Y/N)
Installed kW
% Draw
Op. Time
kW draw Capital Cost/Unit
Equipment Cost Comments REV
AREA: 10 FLOTATION GRINDING AREA 165.2 $228,804 $336,60810 SC 1 Cyclone O/F Trash Screen Horizontal Trash Screen Cyclone Overflow,
1091 m3/hr2m x 4m CS 2 1 5 85 100 4.25 $46,739 $93,479 Factored Estimate
10 TK Mill Solution Tank Solution Tank 30 min 1000 m3 7.5 m 9.5 m CS 1 1 $121,000 $121,000 Factored Estimate10 PU Mill Solution Pumps Solution Pumps 1000 m3/hr 45 m CS/RL 2 1 186.4 85 100 158.46 $51,065 $102,130 Factored Estimate10 SU Area Sump Pump Slurry Pumps 50 m3/hr 15 m CS/RL 2 2 7.5 85 20 2.54 $10,000 $20,000 Factored Weir Slurry Quote 5/24/2007
AREA: 12 SULFIDE ROUGHER FLOTATION 594.4 $635,056 $2,797,98712 TK 1-2 Flotation Conditioning Tanks Slurry Tank (CS/RL) 15 min/ea 340 m3 7.5 m 7.8 m CS 2 2 $114,064 $228,127 Factored Estimate12 AG 1-2 Flotation Conditioning Tank Agitators Slurry Tank Agitators CS/RL 2 2 60.0 85 100 102.00 $67,798 $135,597 Factored Quote 6/5/07 Lightnin12 FL 1-8 Flotation Cells, 100 m3 Wemco Smart Cell 30 min total,
5 min/ea100 m3/ea CS/RL 8 8 29.8 85 100 202.83 $262,653 $2,101,222 Factored Quote Eimco 6/7/2007
12 TK 3 Rougher Flotation Tailings Sump Slurry Tank 5 min 84 m3 5 m 5 m CS/RL 1 1 $50,141 $50,141 Factored Estimate12 TK 4 Flotation Concentrate Sump Slurry Tank 5 min 21 m3 3 m 3 m CS/RL 1 1 $21,000 $21,000 Factored Estimate12 PU 1-2 Flotation Tailings Pumps Slurry Pumps 1000 m3/hr CS/RL 2 1 250.0 85 100 212.50 $62,000 $124,000 Factored Weir Slurry Quote 5/24/200712 PU 3-4 Rougher Flotation Concentrate Pump Slurry Pumps 171 m3/hr CS/RL 2 1 50.0 85 100 42.50 $21,000 $42,000 Factored Weir Slurry Quote 5/24/200712 SA 1-2 Slurry Sampler Sampler CS/RL 2 2 11.2 85 100 19.02 $9,000 $18,000 Factored Western Mine Data 200412 SU 1-2 Area Sump Pump Slurry Pumps 50 m3/hr 15 m CS/RL 2 2 7.5 85 100 12.68 $10,000 $20,000 Factored Weir Slurry Quote 5/24/2007
12 TK 6-8 Reagent Tanks CS/RL 2 hr 6 m3 1.8 m 3 m CS/RL 3 3 $11,000 $33,000 Factored Estimate12 PU 4-10 Reagent Pumps Dosing Pumps 3 m3/hr 3 m3/hr 20 m CS/RL 6 3 0.373 85 100 0.95 $1,900 $11,400 Factored Weir Slurry Quote 5/24/200712 AG 6-8 Reagent Tank Agitators Agitators 6 m3 CS/RL 3 3 0.746 85 100 1.90 $4,500 $13,500 Factored Lightnin Quote 6/5/07
AREA: 14 SULFIDE CLEANER FLOTATION 186.7 $252,804 $900,47014 TK 1-2 Cleaner Conditioning Tanks Slurry Tank (CS/RL) 10 min/ea 48 m3 4.0 m 4.0 m CS 2 2 $41,000 $82,000 Factored Estimate14 AG 1-2 Cleaner Conditioning Tank Agitators Slurry Tank Agitators CS/RL 2 2 11.2 85 100 19.02 $25,000 $50,000 Quote 6/5/07 Lightnin14 FL 1-4 Cleaner Flotation Cells Wemco Smart Cell 20 min total,
5 min/ea20 m3/ea CS/RL 4 4 29.8 85 100 101.42 $100,000 $400,000 Factored Quote Eimco 6/7/2007
14 TK 3 Cleaner Flotation Tailings Sump Slurry Tank ~5 min 6 m3 2.5 m 2.5 m CS/RL 1 1 $8,800 $8,800 Factored Estimate14 TK 4 Cleaner Flotation Concentrate Sump Slurry Tank ~5 min 6 m3 2.5 m 2.5 m CS/RL 1 1 $8,800 $8,800 Factored Estimate14 PU 1-2 Cleaner Flotation Tailings Pumps Slurry Pumps 80.7 m3/hr CS/RL 2 1 18.6 85 100 15.85 $15,683 $31,365 Factored Weir Slurry Quote 5/24/200714 PU 3-4 Cleaner Flotation Concentrate Pump Slurry Pumps 93.1 m3/hr CS/RL 2 1 18.6 85 100 15.85 $17,121 $34,242 Factored Weir Slurry Quote 5/24/200714 SA 1-2 Cleaner Slurry Sampler Sampler CS/RL 2 2 11.2 85 100 19.02 $9,000 $18,000 Factored Western Mine Data 200414 SU 1-2 Area Sump Pump Slurry Pumps 50 m3/hr 15 m CS/RL 2 2 7.5 85 100 12.68 $10,000 $20,000 Factored Weir Slurry Quote 5/24/2007
14 TK 6-8 Reagent Tanks CS/RL 2 hr 6 m3 1.8 m 3 m CS/RL 3 3 $11,000 $33,000 Factored Estimate14 PU 4-10 Reagent Pumps Dosing Pumps 3 m3/hr 3 m3/hr 20 m CS/RL 6 3 0.373 85 100 0.95 $1,900 $11,400 Factored Weir Slurry Quote 5/24/200714 AG 6-8 Reagent Tank Agitators Agitators 6 m3 CS/RL 3 3 0.746 85 100 1.90 $4,500 $13,500 Factored Lightnin Quote 6/5/07
14 TH Concentrate Thickener High Rate Thickener with mechanism, feedwell dilution, Diameter 4 m, CS
660 tpd 4 m CS 1 1 11.2 85 100 9.52 $140,353 $140,353 Factored OKO Quote 7/2/2007
14 TK Thickener Overflow Tank Carbon Steel Tank 5 min 9 m3 2 m 3 m CS/RL 1 1 $8,800 $8,800 Factored Estimate14 PU Thickener Overflow Pumps Solution Pump 65 m3/hr 15 m Ductile Iron 2 1 7.5 85 100 6.34 $12,612 $25,224 Factored Weir Slurry Quote 5/24/200714 PU Thickener Underflow Pumps R/L Slurry Pumps 28 m3/hr 30 m CS/RL 2 1 7.5 85 100 6.34 $7,493 $14,985 Factored Weir Slurry Quote 5/24/2007
Equipment Number
Pennstrom Consulting Easton Process Consulting, Inc.
1

ANATOLIA MINERALS DEVELOPMENT, LTD
PRELIMINARY EQUIPMENT LIST AND CAPITAL EQUIPMENT COSTSRev. 11/13/07
Equipment Type Equipment Description Residence Time
Size/ Capacity
Height Diameter TDH Materials Qty. Op. VFD (Y/N)
Installed kW
% Draw
Op. Time
kW draw Capital Cost/Unit
Equipment Cost Comments REVEquipment Number
AREA: 16 DIRECT FEED GRINDING AREA 2314.0 $3,604,668 $3,892,36516 CV Conveyors Conveors, 3000 tpd mill, 2m x 4m 3 3 11.2 85 100 28.52 $68,200 $204,600 Factored Estimate16 ML Ballmill 3m x 5m, 2000 kW 1 1 2237.1 85 100 1901.54 $2,528,218 $2,528,218 Factored SNC Forcast 9/200716 SU Cyclone Feed Sump Carbon Steel Tank/RL 2 m 2.5 m CS/RL 1 1 $11,000 $11,000 Factored Estimate16 PU Cyclone Feed Pumps R/L Slurry Pumps 722 m3/hr 30 m CS/RL 2 1 223.7 85 100 190.15 $53,472 $106,944 Factored Weir Slurry Quote 5/24/200716 CY Cyclone Package Cyclone Package 1 1 $37,000 $37,000 Factored SNC Forcast 9/200716 SC Cyclone O/F Trash Screen Horizontal Trash Screen Cyclone Overflow,
484 m3/hr2m x 3m CS 1 1 5 85 100 4.25 $42,354 $42,354 Factored Estimate
16 TH Grinding Thickener High Rate Thickener with mechanism, feedwell dilution, Diameter 25 m, CS
3000 tpd 25 m CS 1 1 11.2 85 100 9.52 $648,600 $648,600 OKO Quote 7/2/2007
16 TK Thickener Overflow Tank Carbon Steel Tank 5 min 44 m3 5 m 3.5 m CS 1 1 $33,000 $33,000 Factored Estimate16 PU Thickener Overflow Pumps Solution Pump 320 m3/hr 15 m Ductile Iron 2 1 22.4 85 100 19.02 $32,824 $65,649 Factored Weir Slurry Quote 5/24/200716 PU Thickener Underflow Pumps R/L Slurry Pumps 165 m3/hr 30 m CS/RL 2 1 74.6 85 100 63.38 $22,000 $44,000 Factored Weir Slurry Quote 5/24/200716 TK Mill Solution Tank Solution Tank 30 min 270 m3 7 m 7 m CS 1 1 $85,000 $85,000 Factored Estimate16 PU Mill Solution Pumps Solution Pumps 426 m3/hr 45 m CS/RL 2 1 111.9 85 100 95.08 $33,000 $66,000 Factored Weir Slurry Quote 5/24/200716 SU Area Sump Pump Slurry Pumps 50 m3/hr 15 m CS/RL 2 2 7.5 85 20 2.54 $10,000 $20,000 Factored Weir Slurry Quote 5/24/2007
AREA: 22 PREACIDIFICATION 1 1 180.7 $1,442,308 Factored Based on Flowrate Change22 TK 1-3 Preacidifation Tanks Slurry Tank (CS/RL) Total 60 min 6.9 m 5.3 m CS/RL 3 3 $60,500 $181,500 Factored Estimate22 LN 1-3 Preacidifation Tanks Lining Slurry Tank (CS/RL) 6.9 m 5.3 m CS/RL 3 3 $28,000 $84,000 Verbal - Bittner Industries, Inc. 6/12/0722 AG 1-3 Preacidfiction Tank Agitators Slurry Tank Agitators CS/RL 3 3 29.828 85 100 76.06 $33,000 $99,000 Factored Estimate22 BL 1 Preacidification Tank Blower Slurry Tank Blower - See Untilities22 TK 4 Preacidification Thickener Feed Tank Slurry Feed Tank 1 min 4.4 m 1.5 m CS/RL 1 1 $11,000 $11,000 Factored Estimate22 TH 1 Preacidification Thickener High Rate Thickener with mechanism,
feedwell dilution, Diameter 25 m, CS/RL25 m CS/RL 1 1 11.2 85 100 9.52 $650,000 $650,000 Eimco Quote 6/7/2007
22 LN 4 Preacidification Thickener Lining High Rate Thickener lining 25 m CS/RL 1 1 $330,000 $330,000 Verbal - Bittner Industries, Inc. 6/12/0722 TK 5 Thickener Overflow Tank Tank CS with RL 5 min 13 m3 2.6 2.5 CS/RL 1 1 $15,000 $15,000 Factored Estimate22 PU 1 Thickener Overflow Pumps Solution Pump, Sg 1.1, 40 C 65 m3/hr 45 m CS/RL 2 1 37.285 85 100 31.69 $11,904 $23,808 Factored Weir Slurry Quote 5/24/200722 PU 1 Thickener Underflow Pumps R/L Slurry Pumps, 58%, Sg 1.34 208 m3/hr 45 m CS/RL 2 1 74.570 85 100 63.38 $24,000 $48,000 Factored Weir Slurry Quote 5/24/2007
Pennstrom Consulting Easton Process Consulting, Inc.
2

ANATOLIA MINERALS DEVELOPMENT, LTD
PRELIMINARY EQUIPMENT LIST AND CAPITAL EQUIPMENT COSTSRev. 11/13/07
Equipment Type Equipment Description Residence Time
Size/ Capacity
Height Diameter TDH Materials Qty. Op. VFD (Y/N)
Installed kW
% Draw
Op. Time
kW draw Capital Cost/Unit
Equipment Cost Comments REVEquipment Number
AREA: 24 PRESSURE OXIDATION 1 1 1058.1 $15,521,15224 TK 1-2 PO Feed Tanks Slurry Tank (CS/RL) Total 720 min 17.8 m 25.6 m CS/RL 2 2 $620,000 $1,240,000 Factored Estimate24 LN 1-2 PO Feed Tank Lining Slurry Tank Rubber Lining Total 720 min 17.8 m 25.6 m CS/RL 2 2 $316,000 $632,000 Verbal - Bittner Industries, Inc. 6/12/0724 AG 1-2 PO Feed Tank Agitators Slurry Tank Agitators CS/RL 2 2 186.4 85 100 316.92 $189,000 $378,000 Quote 6/5/07 Lightnin24 PU 1-2 Autoclave Feed Pump Positive Displacement Slurry Pump 241 m3/hr 3200 kPa CD4MCu 2 1 298.3 80 100 238.62 $1,321,446 $2,642,892 Weir Slurry Quote 5/30/200724 VE 1 Pressure Oxidation Autoclave (CS Vessel ) ID:4000 mm x 26200 mm, 3800 kPag, 225
oC,CS60 min 1 $2,870,000 $2,870,000 Factored Stebbins Quote 3/10/2006
24 LN 1 Pressure Oxidation Autoclave Shell Lining Lead 6 mm 1 $1,089,360 $1,089,360 Factored Stebbins Quote 3/10/200624 LN 2 Pressure Oxidation Autoclave Brick Lining Acid Brick 1 $1,708,800 $1,708,800 Factored Stebbins Quote 3/10/200624 MS 1 Intenal Wall and Baffles, Titanium 1 $427,200 $427,200 Factored Stebbins Quote 3/10/200624 AG 1-6 Pressure Oxidation Autoclave Agitator A340- Up-Pumping, Ti Construction Ti 7 6 55.9 85 100 285.23 $300,000 $2,100,000 Quote 6/5/07 Lightnin24 XX XX Pressure Oxidation Autoclave Seal Water
Panel1 $10,000 $10,000 Factored Estimate
24 CY 1 Pressure Oxidation Autoclave Vent Cyclone 1 $65,000 $65,000 Factored Estimate
24 VE 2 Flash Tank ID:4000 mm x 10300 mm, 200 kPag, 110 oC 1 $475,000 $475,000 Factored Stebbins Quote 3/10/2006
24 LN 3 Flash Tank Brick Lining 1 $640,000 $640,000 Factored Stebbins Quote 3/10/200624 MS 2 Flash Tank Demister/Internals 1 $85,000 $85,000 Factored Stebbins Quote 3/10/200624 MS 2 Flash Tank Letdown Valve 1 $100,000 $100,000 Factored Estimate24 TK 3 Seal Water Make Up Tank ID:4000 mm x 5000 mm, 101.3 kPag, 25 oC,
SS1 $22,000 $22,000 Factored Estimate
24 VE 3 Seal Water Accumulator ID:4000 mm x 5000 mm, 101.3 kPag, 25 oC, SS
1 $75,000 $75,000 Factored Estimate
24 FL 1 Seal Water Filter 2 $15,000 $30,000 Factored Estimate24 PU 3 Seal Water Circulation Pump 2 1 $35,000 $70,000 Factored Estimate24 PU 4 Seal Water Make Up Pump 2 1 $15,000 $30,000 Factored Estimate24 HX 1 Seal Water Cooler 1 $15,000 $15,000 Factored Estimate24 TK 4 Quench Water Tank ID:6000 mm x 7000 mm, 101.3 kPag, 100
oC, 12 min 6 m 7 m SS 1 $240,000 $240,000 Factored Estimate
24 PU 5-6 HP Quench Water Pump 80 m3/hr SS 2 1 186.4 80 100 149.14 $33,750 $67,500 Factored Estimate24 VE 4 Oxygen Blowback Vessel 1 $55,000 $55,000 Factored Estimate24 SC 1 Venturi Scrubber 93700 m3/hr CS/Brick
Lined1 $235,400 $235,400 Factored Estimate
24 PU 7-8 Venturi Scrubber Pumps 300 m3/hr CS/RL 2 1 55.9 80 100 44.74 $30,000 $60,000 Factored Estimate24 SA 1-2 Slurry Sampler Sampler CS/RL 2 2 11.2 85 100 19.02 $9,000 $18,000 Factored Western Mine Data 200424 SU 1-3 Area Sump Pump Slurry Pumps 50 m3/hr 15 m CS/RL 3 3 7.5 85 20 3.80 $10,000 $30,000 Factored Weir Slurry Quote 5/24/200724 CR 1 Area Crane 60 ft span, 15 ton 1 1 3.7 80 20 0.60 $110,000 $110,000 Factored Estimate
Pennstrom Consulting Easton Process Consulting, Inc.
3

ANATOLIA MINERALS DEVELOPMENT, LTD
PRELIMINARY EQUIPMENT LIST AND CAPITAL EQUIPMENT COSTSRev. 11/13/07
Equipment Type Equipment Description Residence Time
Size/ Capacity
Height Diameter TDH Materials Qty. Op. VFD (Y/N)
Installed kW
% Draw
Op. Time
kW draw Capital Cost/Unit
Equipment Cost Comments REVEquipment Number
AREA: 26 CCD THICKENING 1 1 889.3 $5,343,10726 TK 1 CCD Feed Tank Slurry Tank (CS/RL) Total 120 min 10.5 m 8 m CS/Brick 1 1 $204,000 $204,000 Factored Estimate26 LN 1 CCD Feed Tank Lining Slurry Tank Rubber Lining Total 120 min 10.5 m 8 m CS/Brick 1 1 $273,319 $273,319 Factored Estimate26 AG 1 CCD Feed Tank Agitator Slurry Tank Agitators CS/RL 1 1 111.9 85 100 95.08 $94,000 $94,000 Factored Quote 6/5/07 Lightnin
26 TK 2 CCD 1 Thickener Feed Tank Slurry Feed Tank w/ Lining 1 min 4 m 1.5 m CS/Brick 1 1 $27,800 $27,800 Factored Estimate26 TH 1 CCD Thickener High Rate Thickener with mechanism,
feedwell dilution, Diameter 25 m, CS/RL25 m CS/Brick 1 1 11.2 85 100 9.52 $650,000 $650,000 Eimco Quote 6/7/2007
26 LN 1 CCD 1 Thickener Lining High Rate Thickener lining assumed 20 degree cone
25 m CS/Brick 1 1 $1,020,000 $1,020,000 Factored Estimate
26 TK 3 Thickener Overflow Tank Tank CS with RL 30 min 6 m 7 m CS/Brick 1 1 $218,372 $218,372 Factored Estimate26 PU 1-2 Thickener Overflow Pumps Solution Pump, Sg 1.1, 40 C 1050 m3/hr 45 m CS/RL 2 1 223.710 85 100 190.15 $63,000 $126,000 Factored Weir Slurry Quote 5/24/200726 PU 3-4 Thickener Underflow Pumps R/L Slurry Pumps, 58%, Sg 1.63 210 m3/hr 45 m CS/RL 2 1 74.570 85 100 63.38 $24,000 $48,000 Factored Weir Slurry Quote 5/24/2007
26 TK 4-6 CCD 2 & 3 Thickener Feed Tank Slurry Feed Tank 1 min 4 m 1.5 m CS/RL 2 2 $11,000 $22,000 Factored Estimate26 TH 2-3 CCD 2 & 3 Thickener High Rate Thickener with mechanism,
feedwell dilution, Diameter 25 m, CS/RL25 m CS/RL 2 2 11.2 85 100 19.04 $650,000 $1,300,000 OKO Quote 7/2/07
26 LN 2-3 CCD 2 &3 Thickener Lining High Rate Thickener lining 25 m CS/RL 2 2 $363,808 $727,616 OKO Quote 7/2/0726 TK 5-7 CCD 2 & 3 Thickener Overflow Tank Tank CS with RL 10 min 7 m 6 m CS/RL 2 2 $122,000 $244,000 Factored Estimate - Verbal Bittner
Industries, Inc. 6/12/0726 PU XX CCD 2 &3 Thickener Overflow Pumps Solution Pump, Sg 1.1, 40 C 1050 m3/hr 45 m CS/RL 4 2 223.710 85 100 380.31 $63,000 $252,000 Factored Weir Slurry Quote 5/24/200726 PU XX CCD 2 & 3 Thickener Underflow Pumps R/L Slurry Pumps, 58%, Sg 1.34 201 m3/hr 45 m CS/RL 4 2 74.570 85 100 126.77 $24,000 $96,000 Factored Weir Slurry Quote 5/24/200726 SU 1-4 Area Sump Pump Slurry Pumps 50 m3/hr 15 m CS/RL 4 4 7.5 85 20 5.07 $10,000 $40,000 Factored Weir Slurry Quote 5/24/2007
Pennstrom Consulting Easton Process Consulting, Inc.
4

ANATOLIA MINERALS DEVELOPMENT, LTD
PRELIMINARY EQUIPMENT LIST AND CAPITAL EQUIPMENT COSTSRev. 11/13/07
Equipment Type Equipment Description Residence Time
Size/ Capacity
Height Diameter TDH Materials Qty. Op. VFD (Y/N)
Installed kW
% Draw
Op. Time
kW draw Capital Cost/Unit
Equipment Cost Comments REVEquipment Number
AREA: 30 SOLUTION & SLURRY NEUTRALIZATION 1 1 3027.8 $6,426,892Limestone Neutralization
30 TK 1-3 Limestone Neutralization Slurry Tank (CS/RL) Total 65 min 9 m 8 m CS/RL 3 3 $137,500 $412,500 Factored Estimate30 LN 1 Limestone Neutralization Lining Slurry Tank Rubber Lining 9 m 8 m CS/RL 3 3 $87,000 $261,000 Verbal - Bittner Industries, Inc. 6/12/0730 AG 1-3 Limestone Neutralization Tank Agitator Slurry Tank Agitators CS/RL 3 3 55.9 85 100 142.62 $72,000 $216,000 Factored Quote 6/5/07 Lightnin30 TK 4 Limestone Thickener Feed Tank Slurry Feed Tank w/ Lining 1 min 4 m 1.5 m CS/RL 1 1 $27,800 $27,800 Factored Estimate30 TH 1 Limestone Thickener High Rate Thickener with mechanism,
feedwell dilution, Diameter 15 m, CS/RL15 m CS/RL 1 1 11.2 85 100 9.52 $400,000 $400,000 Eimco Quote 6/7/07
30 LN 1 Limestone Thickener Lining High Rate Thickener lining assumed 20 degree cone
25 m CS/RL 1 1 $120,000 $120,000 Factored Estimate
30 TK 5 Thickener Overflow Tank Tank CS with RL 10 min 6 m 7 m CS/RL 1 1 $218,372 $218,372 Factored Estimate30 PU 1-2 Thickener Overflow Pumps Solution Pump, Sg 1.1, 40 C 924 m3/hr 45 m CS/RL 2 1 186.425 85 100 158.46 $61,000 $122,000 Factored Weir Slurry Quote 5/24/200730 PU 3-4 Thickener Underflow Pumps R/L Slurry Pumps, 58%, Sg 1.63 116m3/hr 45 m CS/RL 2 1 55.9 85.0 100.0 47.5 $20,000 $40,000 Factored Weir Slurry Quote 5/24/2007
Lime Solution Neutralization32 TK 6-7 Lime Solution Neutralization Slurry Tank (CS/RL) Total 40 min 9 m 8 m CS/RL 2 2 $127,000 $254,000 Factored Estimate32 AG 4-5 Lime Neutralization Tank Agitator Slurry Tank Agitators CS/RL 2 2 55.9 85.0 100.0 95.1 $70,000 $140,000 Factored Quote 6/5/07 Lightnin32 TK 5 Lime Neutralization Overflow Tank Tank CS with RL 5 min 4 m 7 m CS/RL 1 1 $47,500 $47,500 Factored Estimate32 PU 1-2 Lime Neutralization Overflow Pumps Solution Pump, Sg 1.016, 40 C 924 m3/hr 45 m CS/RL 2 1 186.4 85.0 100.0 158.5 $61,000 $122,000 Factored Weir Slurry Quote 5/24/2007
Limestone Milling34 BM 1 Limestone Ball Mill 2337 tpd, 2500 HP, Diam. 14' x 18' 4.3 m x 5.5
m1 1 1864.3 85.0 100.0 1584.6 $1,154,600 $1,154,600 Factored Quote
34 SU Cyclone Feed Sump 5 min 4 m 3 m CS/RL 1 1 $36,570 $36,570 Factored Quote 34 PU Cyclone Feed Pumps 280 m3/hr 90 m 2 1 261.0 85.0 100.0 221.8 $60,000 $120,000 Factored Quote 34 CY Cyclones 280 m3/hr CS/RL 3 2 $4,000 $12,000 Factored Quote 34 SC 1 Cyclone O/F Trash Screen Horizontal Trash Screen Cyclone Overflow,
200 m3/hr1.5m x 2m CS 1 1 1.0 85.0 100.0 0.9 $20,000 $20,000 Factored Estimate
34 TH 1 Grinding Thickener High Rate Thickener with mechanism, feedwell dilution, Diameter 15 m, CS
2337 tpd 15 m CS 1 1 5.6 85.0 100.0 4.8 $400,000 $400,000 Eimco Quote 6/7/2007
34 TK 1 Thickener Overflow Tank Carbon Steel Tank 480 min 9 m 10.5 m CS 1 1 $160,000 $160,000 Factored Estimate34 PU 1 Thickener Overflow Pumps Solution Pump 150 m3/hr 15 m Ductile Iron 2 1 37.3 85.0 100.0 31.7 $20,000 $40,000 Factored Weir Slurry Quote 5/24/200734 PU 2 Thickener Underflow Pumps R/L Slurry Pumps 82 m3/hr 30 m CS/RL 2 1 37.3 85.0 100.0 31.7 $20,000 $40,000 Factored Weir Slurry Quote 5/24/200734 TK 2 Limestone Slurry Tank Solution Tank 30 min 729 m3 9 m 10.5 m CS 1 1 $160,000 $160,000 Factored Estimate34 AG 1 Limestone Slurry Tank Agitator Slurry Tank Agitators CS/RL 1 1 74.6 85.0 100.0 63.4 $83,000 $83,000 Factored Quote 6/5/07 Lightnin34 PU Limestone Slurry Pumps Solution Pumps 110 m3/hr 45 m CS/RL 2 1 74.6 85.0 100.0 63.4 $18,000 $36,000 Factored Estimate34 SU Area Sump Pump Slurry Pumps 50 m3/hr 15 m CS/RL 2 2 7.5 85.0 100.0 12.7 $10,000 $20,000 Factored Weir Slurry Quote 5/24/2007
Lime Slaking 36 TK 1-3 Storage Silos 15 m 9 m CS 3 3 $200,000 $600,000 Factored Quote 36 CV 1-3 Transport Conveyors 15 tph, 100 ft/conveyor 3 3 1.5 85.0 100.0 3.8 $15,000 $45,000 Factored Quote 36 BM 1 Lime Ball Mill 340 tpd, HP, Tower Mill Diam.44" x 37'2",
400 HP1 1 298.3 85.0 100.0 253.5 $612,950 $612,950 Factored Quote
36 SU Lime Cyclone Feed Sump 5 min 2 m 1.5 m CS/RL 1 1 $8,000 $8,000 Factored Quote 36 PU Lime Cyclone Feed Pumps 30 m3/hr 90 m 2 1 14.9 85.0 100.0 12.7 $7,500 $15,000 Factored Quote 36 CY Lime Cyclone 30 m3/hr CS/RL 3 2 $1,500 $4,500 Factored Quote 36 TK 2 Lime Slurry Tank Solution Tank 24 hr 7 m 9.7 m CS 1 1 $113,000 $113,000 Factored Estimate36 AG 1 Lime Slurry Tank Agitator Slurry Tank Agitators CS/RL 1 1 37.3 85.0 100.0 31.7 $58,000 $58,000 Factored Quote 6/5/07 Lightnin36 PU Lime Slurry Pumps Solution Pumps 10 m3/hr 45 m CS/RL 2 1 3.7 85.0 100.0 3.2 $3,800 $7,600 Factored Estimate36 SU Area Sump Pump Slurry Pumps 5 m3/hr 15 m CS/RL 1 2 3.7 85.0 20.0 1.3 $2,500 $2,500 Factored Estimate
Slurry Neutralization Tank38 TK 2 Slurry Neutralization Tank Solution Tank 2 hr 10 m 11.3 m CS 1 1 $190,000 $190,000 Factored Estimate38 AG 1 Slurry Neutralization Tank Agitator Slurry Tank Agitators CS/RL 1 1 111.9 85.0 100.0 95.1 $107,000 $107,000 Factored Quote 6/5/07 Lightnin
Pennstrom Consulting Easton Process Consulting, Inc.
5

ANATOLIA MINERALS DEVELOPMENT, LTD
PRELIMINARY EQUIPMENT LIST AND CAPITAL EQUIPMENT COSTSRev. 11/13/07
Equipment Type Equipment Description Residence Time
Size/ Capacity
Height Diameter TDH Materials Qty. Op. VFD (Y/N)
Installed kW
% Draw
Op. Time
kW draw Capital Cost/Unit
Equipment Cost Comments REVEquipment Number
AREA: 40 Utilities 1 1 1054.5 $3,062,23642 BL 1-2 Blower Pre-Acidificaiton, Pressure Leach
Discharge, Compressor, Air Reciever, Air Drier
3000 Nm3/hr, at 120 psia. 3000 Nm3/hr 1 1 298.3 85.0 100.0 253.5 $195,000 $195,000 Factored Estimate
44 HE 1 Boiler Package Deareator 1 1 74.6 85.0 10.0 6.3 $110,000 $110,000 Quote 6/11/0744 HE 1 Chemical Feed Systems Chemical Feed Systems 1 $10,000 $10,000 Quote 6/11/0744 HE 1 Blowdown Tank Blowdown Tank 1 $18,000 $18,000 Quote 6/11/0744 HE 1 Boiler Nebraska Boiler Model ND-200D-45 Turnkey Boiler Package: 20 tph, 500 psig 1 $858,000 $858,000 Quote 6/11/0744 TK 1 Fuel Oil Storage For Boiler CS Tank 50 m3 4 m 4 m CS 1 $34,000 $34,000 Factored Estimate44 PU 1-2 Fuel Oil Supply Pumps Pumps 2.5 m3/hr 2 1 1.5 85.0 10.0 0.1 $1,700 $3,400 Factored Estimate
545 CT 1 Cooling Tower Package (5460 gpm) 1900 m3/hr, Tower, Fans, Pumps, Internals 1900 m3/hr 2 2 55.0 85.0 100.0 93.5 $90,000 $180,000 Quote 6/13/07 Cooling Tower Depot45 PU 1-2 Cooling Water Supply Pumps Pumps, 1240 m3/hr 1240 m3/hr 40 m 2 1 298.3 85.0 100.0 253.5 $69,568 $139,136 Factored Estimate45 CT 2 Chemical Feed Systems Chemical Feed Systems 1 $10,000 $10,000 Factored Estimate
46 DM XX Demineralisation Plant (BWT) Water Softeners - Only 100 m3/hr 1 1 $175,000 $175,000 Factored From 6/11/07 Boiler Quote46 PU 1-4 Pumps Pumps 100 m3/hr 40 m 4 2 18.6 85.0 100.0 31.7 $15,500 $62,000 Factored From 6/11/07 Boiler Quote46 TK XX Tanks Tanks 2 hr 2 2 $92,000 $184,000 Factored Quote46 TK XX Filters Filters Pressure 74 m2/ea 2 1 44.7 85.0 100.0 38.0 $115,000 $230,000 Factored Quote
47 PU 1-2 Flocculant Pumps Flocculant Pumps 10 m3/hr 40 m 4 2 1.5 85.0 100.0 2.5 $3,800 $15,200 Factored From 6/11/07 Boiler Quote47 TK 1 Flocculant Mix Tank Flocculant Mix Tank 30 min 2.5 m 2.5 m 1 $15,000 $15,000 Factored Quote47 AG 1 Flocculant Mix Tank Agitators Flocculant Mix Tank Agitators 1 1 1.5 85.0 100.0 1.3 $6,000 $6,000 Factored Quote47 TK 2 Flocculant Storage Tank Flocculant Storage Tank 12 hr 6 m 6 m 1 $70,000 $70,000 Factored Quote47 AG 2 Flocculant Storage Tank Agitators Flocculant Storage Tank Agitators 1 1 18.6 85.0 100.0 15.8 $35,000 $35,000 Factored Quote47 TH 1 Flotation Tailings Thickener Paste Thickener with mechanism, feedwell
dilution,5000 tpd CS 1 1 11.2 85 100 9.52 $288,580 $288,580 SNC Forcast Costs 9/07
47 TK Thickener Overflow Tank CS Steel Tank 5 min 60 m3 6 m 4 m CS 1 1 $43,300 $43,300 Factored Estimate47 PU Thickener Overflow Pumps Solution Pump 801m3/hr 15 m Ductile Iron 2 1 37.3 85 100 31.69 $39,444 $78,888 Factored Weir Slurry Quote 5/24/200747 PU Thickener Underflow Pumps R/L Slurry Pumps 210 m3/hr 30 m CS/RL 2 1 74.6 85 100 63.38 $24,000 $48,000 Factored Weir Slurry Quote 5/24/2007
Tailings Reclaim Sump and Pumps48 TK 1 Recalim Sump Tank CS with RL 5 min 6 m 6 m CS 1 1 $70,400 $70,400 Factored Estimate48 PU 1-2 Reclaim Pumps Solution Pump, Sg 1.016, 40 C 1900 m3/hr 45 m CS 2 1 298.3 85.0 100.0 253.5 $91,666 $183,332 Factored Weir Slurry Quote 5/24/2007
Pennstrom Consulting Easton Process Consulting, Inc.
6

ATTACHMENT E
PROCESS OPERATING COST ESTIMATE DETAIL

All Sulfide Ore TypesPower Costs 0.089 $/kWhSulfide Sulfur Grade 2.729 %Ore Throughput Rate 8,000 mtpdAvg Gold Grade 2.30 g/tOverall Gold Recovery 87.9 %Gold Produced 189,490 oz/y
Crushing and Grinding $/t ore milledPower for crushing and grinding 1.42Liners primary crushing 0.01
secondary crushing 0.01tertiary crushing 0.02ball milling 0.22
Media ball milling 0.45Pump and cyclone parts 0.32Crushing and Grinding Costs per Ton Milled 2.44
Flotation$/t ore floated
Power 0.24 Reagants 0.57 Flotation Costs per Ton Floated 0.82
$/t ore milledFlotation Costs per Ton Milled 0.51
Pressure Oxidation, Leaching, and Refining$/t POX feed
Limestone Cost, $/t oxidized 0.90 Oxygen Cost, $/t oxidized 11.70 Other Power, $/t oxidized 5.45 Maintenance, $/t oxidized 4.00 POX Costs per Ton Oxidized 22.05
$/t ore milledPOX Costs per Ton Milled 9.75 Leaching Costs per Ton Milled 0.33 Consumables: Lime Cost, $/t milled 1.73 NaCN Cost, $/t milled 1.45 Carbon Handling & Refinery 0.23
POX, Leaching, and Refining Costs per Ton Milled 13.48
Tailings Disposal Costs per Ton Milled 0.92
Labor Costs per Ton Milled 1.97
Total Milling Costs Sulfides ($/t ore milled) 19.32
ANATOLIA PROCESS OPERATING COSTS SUMMARY
Easton Process Consulting, Inc.

8000 METRIC tons ore per day
Ore Feed Rate, tons per calendar day 8,000Crushing operating time, % 75Crushing rate, t/h 444Mill operating time, % 90Milling rate, t/h 370Specific gravity of ore 2.7Impact work index, kwh/t 5.5Bond work index, kWh/t
Ball mill 11.0Ball mill inefficiency factor 1.1
Abrasion index, gram 0.16Ore sizes, 80% passing, µm
Primary crusher feed 600,000 Primary crusher product 65,000
Secondary crusher Product 23,000Tertiary crusher product 11,500Ball mill feed 11,500Primary grind 105
Ball mill circulating load, % 300
POWER REQUIREMENT CALCULATIONSWi Feed Prod. EF Work kW Throughput Required Recom.
Crushing k80,µm k80,µm kW.h/ton Drawn t/op h t/op d hp hpPrimary Crusher 5.5 600,000 65,000 1.20 0.17 77 444 8,000 103 375Secondary Crusher 5.5 65,000 23,000 1.20 0.18 78 444 8,000 105 300Tertiary Crusher 5.5 23,000 11,500 1.20 0.18 80 444 8,000 107 600GrindingBall Mills 11.0 11,500 105 1.11 10.78 3,992 370 8,000 5,574 7,500
Total 11.31 4,227 370 8,000 5,889 8,775
POWER DRAW CALCULATIONSDia. Length k Steel Rock Density, kg/m3 C.S. Power Drawm m Load Load Ball Rock % kW hp
Ball Mill (Existing) 5.00 8.80 0.003 38% 12% 7,850 3,200 72% 3,339 4,476Ball Mill (New) 5.00 6.00 0.003 38% 12% 7,850 3,200 72% 2,277 3,052
RECOMMENDED CRUSHERS AND GRINDING MILLS
Primary Crusher 1 - 54" x 75" 450 kW (600 hp) motor.Secondary Crusher 1 - Metso MP1000 Standard Crusher with 745 kW (1000 hp) motor.Tertiary Crusher 2 - Metso MP1000 Shorthead Crusher with 745 kW (1000 hp) motor each.Ball Mill - Existing 1 - 5.00 dia. x 8.80 m EGL with one 3350 kW (4500 hp) motor.Ball Mill - New 1 - 5.00 dia. x 6.00 m EGL with one 2250 kW (3000 hp) motor.
POWER CONSUMPTION AND COST
PowerEquipment Wi Feed Product EF Work Cost
k80, µm k80, µm kW.h/t $/t
Primary Crusher 5.5 600,000 65,000 1.20 0.17 0.02Secondary Crusher 5.5 65,000 23,000 1.20 0.18 0.00Tertiary Crusher 5.5 65,000 11,500 1.20 0.36 0.03Ball Mills 11.0 11,500 105 1.11 10.78 0.96Conveyors/Screens/Pumps 4.50 0.40 1,500 kW
Total 15.98 1.42
Power cost @ 0.089 US cents/kW.h 1.42 $ /tonne
Anatolia Three Stage Crushing / Primary Ball Mill CircuitOperating Costs
Sulfide Ore Types
Easton Process Consulting, Inc.

Liner Consumption, per modified Bond, expressed in lb/kW.h:
Crushers (Ai + 0.22)/11Sag Mill 0.035*(Ai - 0.015)^0.30Ball Mill 0.026*(Ai - 0.015)^0.30
FOB Mine FOB MineLiners W Ai Unit Consumption Cost Cost
kW·h/t gram lb/kW·h kg/kW·h kg/t $/kg $/t
Primary Crusher 0.174 0.16 0.0345 0.0157 0.0027 3.024 0.008Secondary Crusher 0.176 0.16 0.0345 0.0157 0.0028 3.024 0.008Tertiary Crusher 0.357 0.16 0.0345 0.0157 0.0056 3.024 0.017Ball Mills 10.777 0.16 0.0146 0.0066 0.0712 3.024 0.215
Sub-total 0.249
Grinding MediaMedia Consumption, per Bond, expressed in lb/kW.h:
Sag mill 0.22*(Ai - 0.015)^0.5Ball Mills 0.3*(Ai - 0.015)^0.53 high quality balls
0.3*(Ai - 0.015)^0.33 average quality balls
FOB MineMedia W Ai Unit Consumption Cost Cost
kW·h/t gram lb/kW·h kg/kW·h kg/t $/kg $/t
Ball mill 10.777 0.16 0.1078 0.0489 0.5270 0.85 0.447
Sub-total 0.447
Pump Parts, Cyclone Parts, Conveyor, and Screens
Cyclone Feed @ 300% circulating load @ 55% solids by weight 1761 m3/h
Pump Size estimated 450 x 400 mm6 sets of liners per annum @ $8,000 per set $48,000
Cyclones size 500 mmNo of cyclones based on 980 m3/h per m2 of cyclone cross sectional areaNo of cyclones 9.1Cost of replacement liners per restoration $2,400 per set $21,945Conveyor and Screen Maintenance 0.30 $ per tonne milled
Total cost of Pump Parts, Cyclone Parts, Conveyor, and Screens $945,945
Cost per tonne milled, US $/t 0.32 $ per tonne milled
Cost of Crushing and Grinding$/t ore
Power for crushing and grinding 1.423Liners primary crushing 0.008
secondary crushing 0.008tertiary crushing 0.017ball milling 0.215
Balls ball milling 0.447Pump and cyclone parts 0.324
Sub-Total Crushing and Grinding 2.44 $/t ore
LINERS AND GRINDING MEDIA CONSUMPTION AND COST
Easton Process Consulting, Inc.

NOTE: ALL TONS ARE METRIC TONSPercent of ore sent to flotation 62.5%Tons per day to flotation 5000
Unit Power Cost 0.089 $/kW.h
Power $0.241 $/ton ore
Reagants $0.575 $/ton ore
Total cost per ton floated $0.816 $/ton ore floated
Total cost per ton milled $0.510 $/ton ore milled
Consumption Unit Cost Cost per ton FloatedReagents: (g/t) ($/kg) ($/t)
PbNO3 0 $1.21 $0.00MIBC 35 $1.85 $0.06PAX 25 $1.63 $0.04AF 250 25 $1.63 $0.04Flocculant (Incl CCD) 171 $2.50 $0.43
Power:kWh consumed 820 cost per ton floated $0.241 /t
Anatolia Flotation Operating Costs
Easton Process Consulting, Inc.

NOTE: ALL TONS ARE METRIC TONSUnit Power Cost 0.089 $ per kW.hPressure Oxidation:
Sulfide Sulfur in Flotation Ore Feed 1.800 %S=
Sulfide Sulfur Flotation Recovery 90 %Concentrate Weight % 10.77 %Concentrate % S 16.25 %Concentrate Produced 538.5 t/d
24.931 t/h concentrateSulfur in Autoclave Feed,% 5.92 %STotal Autoclave Feed, tph 163.8 t/h POX feedO2 Requirement, t O2/t S 2.51O2 Requirement, t O2/t POX feed 0.148 tO2/t POX feedO2 Requirement, t O2/day 524.4 tO2/dayO2 Power requirement, kW.h/t O2 425O2 Unit Cost, $/t O2 (Over the Fence) 78.92 $/t O2O2 Cost, $/t POX feed 11.70 $/t POX feedLimestone Grinding Power per Tonne 9.35 kw.h/t LimestoneLimestone Consumption Rate 66.22 tph LimestoneLimestone Grinding Power Required 619.13 kWLimestone Grinding Circuit Power 681.04 kWLimestone Grinding Power Costs 0.92 $/t LimestoneLimestone Grinding Media and Liners Costs 0.66 $/t LimestoneLimestone Delivery Costs (load and haul from leach pad 0.65 $/t LimestoneLimestone Costs Total 2.23 $/t LimestoneLimestone Costs per Tonne POX feed 0.90 $/t POX feedOther Power, kW 1889.7 kWOther Power, kW.h/t POX feed 276.85 kW.h/t POX feedOther Power, kW.h/t Total feed 61.2 kW.h/t Total feedOther Power, $/t POX feed 5.45 $/t POX feedMaintenance, $/t POX feed 4.00 $/t POX feedPOX Cost, $/t POX feed 22.05 $/t POX feedPOX Cost, $/t ore milled 9.75 $/t ore milled
Leaching:Gold in Feed 2.30 g/tCopper in Feed 50 ppmGold Recovery 88 %Copper Leach Percentage 85 %Copper Recovery to Carbon 20 %Leach Weight % Solids 40.0 %Carbon Concentration, g/l slurry 5.4 g/lTonnes Carbon Stripped per Day, tpd 3.0 tpdGold on Carbon, g/t 5331 g/t AuCIL Power, kW 1890 kWLeach Power, kW.h/t POX feed 5.67 kW.h/t POX feedLeach Power, $/t POX feed 0.50 $/t POX feedMaintenance, $/t POX feed 0.25 $/t POX feedLeach Cost, $/t POX feed 0.75 $/t POX feedLeach Cost, $/t ore milled 0.33 $/t ore milled
Anatolia Oxidation, Neutralizing, and Leaching Circuit Operating Costs
Sulfide Ore Types
Easton Process Consulting, Inc.

Consumables:Lime, kg/t (assumes some CO2 available from ore) 12.4 kg/t milledLime Unit Cost, $/t CaO 139 $/t Lime Cost, $/t ore ** 1.73 $/t ore milledNaCN, kg/t 1.98 kg/t POX feedNaCN, kg/t 0.88 kg/t ore milledNaCN,$/kg 1.650 $/kgNaCN, $/t 1.45 $/t ore milled
Carbon Stripping/ Refining, $/t 0.23 $/t ore milledStrips per day 1.50Carbon Cost, $/Strip 131.25 $/StripNaOH Cost, $/Strip 130.63 $/StripHCl Cost, $/Strip 154.00 $/StripPropane Cost, $/Strip 450.00 $/StripMaintenance Cost, $/Strip 350.00 $/Strip
1215.88 $/Strip
Limestone Cost, $/t POX feed 0.90 $/t POX feedOxygen Cost, $/t POX feed 11.70 $/t POX feedOther Power, $/t POX feed 5.45 $/t POX feedMaintenance, $/t POX feed 4.00 $/t POX feed
Costs per Tonne POX feed 22.05 $/t POX feedCosts per Tonne Ore Milled 9.75 $/t ore milled
Consumables:Lime Cost, $/t ore ** 1.73 $/t ore milledNaCN Cost, $/t ore milled 1.45 $/t ore milledCarbon & Refinery 0.23 $/t ore milledSubtotal Consumables 3.40 $/t ore milled
Sub-Total, POX, Cyanidation, Refining 13.48 $/t ore milled
Easton Process Consulting, Inc.

Tailing Operating Costs $0.92 per ton milled
Reagents: Consumption Unit Cost Cost per ton CIL Cost per ton milledNaCN Destruct (kg/t) ($/kg) ($/t) ($/t)Sodium Metabisulfite 1.5 $0.90 $1.36 $0.60Copper Sulfate 0.04 $0.90 $0.04 $0.02Lime 2 $0.09 $0.18 $0.08
ThickeningFlocculant 0.03 $2.50 $0.08
Power:kWh consumed 500 cost per ton $0.15
Anatolia Tailings Operating Cost
Easton Process Consulting, Inc.

Based on tonnage of 8,000 tons per calendar day
No. Required Salary incl Benefits Base Salary Burden RateLabor - Staff
Process Manager 1 160,650 90,000 1.79 Chief Metallurgist 1 140,650 80,000 1.76 Process General Foreman 1 121,650 70,000 1.74 Maintenance General Foreman 1 114,650 70,000 1.64 Metallurgists 2 93,650 55,000 1.70 Shift Foreman 4 79,650 45,000 1.77 Maintenance/Electrical Foreman 2 81,900 45,000 1.82 Chief Assayer 1 84,150 45,000 1.87 Refiner 2 67,400 35,000 1.93
Sub-total 15 1,426,250
Labour - Wages
Crushing Operator 8 50,250 30,000 1.68 Grinding Operator 4 50,250 30,000 1.68 Mill Control Room Operator 4 50,250 30,000 1.68 Float Operator 4 50,250 30,000 1.68 Autoclave Operator 4 50,250 30,000 1.68 Leach/CIP Operator 4 50,250 30,000 1.68 Stripping Operator 4 50,250 30,000 1.68 Tailing Operator 4 50,250 30,000 1.68 O2 Plant Operator 4 50,250 30,000 1.68 Helper 4 36,250 20,000 1.81
Assayer 4 53,050 26,000 2.04
Maintenance Artisans 34 57,250 35,000 1.64
Sub - total 82 4,313,700
Total Labor Cost, $/Year 97 5,739,950
Total Labor Cost, $/t 1.97
LABOR COSTS FOR ANATOLIA SULFIDE PROCESS OPERATIONS
Easton Process Consulting, Inc.

ATTACHMENT F
SIMPLIFIED CASH FLOW

ANATOLIA MINERALS DEVELOPMENT, LTDSulfide Study Simplified Cash FlowSulfide Capital Cost $ $161,000,000Operating CostsMining Cost per ton Mined $/t $1.70
Strip Ratio Waste to Ore - 1.70
Ore Mining Costs per ton Ore $/ton ore $4.59
Total Process Costs $/ton processed $19.32
G&A $/ton processed $1.10
Total Operating Cost $/ton $25.01
Direct Feed tpa 1,094,999Flotation Feed tpa 1,825,000Direct Feed Au Grade - Base gpt 3.1100Flotation Feed Grade - Base gpt 1.8100Flotation Au Recovery % 85.00CIL Au Recovery % 95.00Weighted Overall Recovery % 87.85Gold Price - 1 Year Average $/oz. 683.34 As of November 30, 2007Gold Price - 2 Year Average $/oz. 640.91 As of November 30, 2007Gold Price - 3 Year Average $/oz. 573.59 As of November 30, 2007
Year -1 0 1 2 3 4 5 6 7 8 9 10 11 12 TotalCapitalCapital Distribution %/a 40.00% 60.00%Capital -$64,400,000 -$96,600,000Sustaining Capital $ $0.0 $0.0 $0.0 $0.0 $0.0 $0.0 $0.0 $0.0 $0.0 $0.0 $0.0 $0.0Operation
Flotation Feed Ore Processed tpa 1,825,000 1,825,000 1,825,000 1,825,000 1,825,000 1,825,000 1,825,000 1,825,000 1,825,000 1,825,000 1,825,000 1,825,000 21,900,000Flotation Gold Grade gpt 1.810 1.810 1.810 1.810 1.810 1.810 1.810 1.810 1.810 1.810 1.810 1.810 1.810Flotation Gold In Feed kg 3,303.3 3,303.3 3,303.3 3,303.3 3,303.3 3,303.3 3,303.3 3,303.3 3,303.3 3,303.3 3,303.3 3,303.3 39,639Flotation Gold In Feed oz. 106,202 106,202 106,202 106,202 106,202 106,202 106,202 106,202 106,202 106,202 106,202 106,202 1,274,423
Direct Feed Ore Processed tpa 1,094,999 1,094,999 1,094,999 1,094,999 1,094,999 1,094,999 1,094,999 1,094,999 1,094,999 1,094,999 1,094,999 1,094,999 13,139,988Direct Feed Gold Grade gpt 3.110 3.110 3.110 3.110 3.110 3.110 3.110 3.110 3.110 3.110 3.110 3.110 3.110Direct Feed Gold In Feed kg 3,405.4 3,405.4 3,405.4 3,405.4 3,405.4 3,405.4 3,405.4 3,405.4 3,405.4 3,405.4 3,405.4 3,405.4 40,865Direct Feed Gold In Feed oz.
109,488 109,488 109,488 109,488 109,488 109,488 109,488 109,488 109,488 109,488 109,488 109,488 1,313,852
Total Tons In Feed t 2,919,999 2,919,999 2,919,999 2,919,999 2,919,999 2,919,999 2,919,999 2,919,999 2,919,999 2,919,999 2,919,999 2,919,999 35,039,988Total Grade gpt 2.297 2.297 2.297 2.297 2.297 2.297 2.297 2.297 2.297 2.297 2.297 2.297 2.297Total Gold In Feed kg 6,709 6,709 6,709 6,709 6,709 6,709 6,709 6,709 6,709 6,709 6,709 6,709 80,504Total Gold In Feed oz. 215,690 215,690 215,690 215,690 215,690 215,690 215,690 215,690 215,690 215,690 215,690 215,690 2,588,275
Overall Recovery % 87.85 87.85 87.85 87.85 87.85 87.85 87.85 87.85 87.85 87.85 87.85 87.85 0.00Gold Produced - Base GradeGold Recovered kg 5,894.00 5,894.00 5,894.00 5,894.00 5,894.00 5,894.00 5,894.00 5,894.00 5,894.00 5,894.00 5,894.00 5,894.00 70,728.00Gold Produced oz. 189,490 189,490 189,490 189,490 189,490 189,490 189,490 189,490 189,490 189,490 189,490 189,490 2,273,880
CostsOre and Waste Mined $ $13,402,795 $13,402,795 $13,402,795 $13,402,795 $13,402,795 $13,402,795 $13,402,795 $13,402,795 $13,402,795 $13,402,795 $13,402,795 $13,402,795Ore Processed $ $56,414,381 $56,414,381 $56,414,381 $56,414,381 $56,414,381 $56,414,381 $56,414,381 $56,414,381 $56,414,381 $56,414,381 $56,414,381 $56,414,381G&A Costs $ $3,211,999 $3,211,999 $3,211,999 $3,211,999 $3,211,999 $3,211,999 $3,211,999 $3,211,999 $3,211,999 $3,211,999 $3,211,999 $3,211,999Total Operating Costs $ $73,029,175 $73,029,175 $73,029,175 $73,029,175 $73,029,175 $73,029,175 $73,029,175 $73,029,175 $73,029,175 $73,029,175 $73,029,175 $73,029,175Adjusted Operating Cost $ $16,614,794 $16,614,794 $16,614,794 $16,614,794 $16,614,794 $16,614,794 $16,614,794 $16,614,794 $16,614,794 $16,614,794 $16,614,794 $16,614,794Operating Cost $/oz $385 $385 $385 $385 $385 $385 $385 $385 $385 $385 $385 $385Capital Cost $/oz. $71 $71 $71 $71 $71 $71 $71 $71 $71 $71 $71 $71
Pennstrom Consulting Easton Process Consulting, Inc.
1

ANATOLIA MINERALS DEVELOPMENT, LTDSulfide Study Simplified Cash FlowSulfide Capital Cost $ $161,000,000Operating CostsMining Cost per ton Mined $/t $1.70
Strip Ratio Waste to Ore - 1.70
Ore Mining Costs per ton Ore $/ton ore $4.59
Total Process Costs $/ton processed $19.32
G&A $/ton processed $1.10
Total Operating Cost $/ton $25.01
Direct Feed tpa 1,094,999Flotation Feed tpa 1,825,000Direct Feed Au Grade - Base gpt 3.1100Flotation Feed Grade - Base gpt 1.8100Flotation Au Recovery % 85.00CIL Au Recovery % 95.00Weighted Overall Recovery % 87.85Gold Price - 1 Year Average $/oz. 683.34 As of November 30, 2007Gold Price - 2 Year Average $/oz. 640.91 As of November 30, 2007Gold Price - 3 Year Average $/oz. 573.59 As of November 30, 2007
Year -1 0 1 2 3 4 5 6 7 8 9 10 11 12 TotalGross Gold Sales Gold Price - 1 Year Average $ $129,486,097 $129,486,097 $129,486,097 $129,486,097 $129,486,097 $129,486,097 $129,486,097 $129,486,097 $129,486,097 $129,486,097 $129,486,097 $129,486,097Gold Price - 2 Year Average $ $121,446,036 $121,446,036 $121,446,036 $121,446,036 $121,446,036 $121,446,036 $121,446,036 $121,446,036 $121,446,036 $121,446,036 $121,446,036 $121,446,036Gold Price - 3 Year Average $ $108,689,569 $108,689,569 $108,689,569 $108,689,569 $108,689,569 $108,689,569 $108,689,569 $108,689,569 $108,689,569 $108,689,569 $108,689,569 $108,689,569Cash FlowsOperating Cost $25.01 /tGold Grade Direct/Flotation 3.11 gpt 1.81 gptGold Price - 1 Year Average -$64,400,000 -$96,600,000 $56,456,922 $56,456,922 $56,456,922 $56,456,922 $56,456,922 $56,456,922 $56,456,922 $56,456,922 $56,456,922 $56,456,922 $56,456,922 $56,456,922Gold Price - 2 Year Average -$64,400,000 -$96,600,000 $48,416,861 $48,416,861 $48,416,861 $48,416,861 $48,416,861 $48,416,861 $48,416,861 $48,416,861 $48,416,861 $48,416,861 $48,416,861 $48,416,861Gold Price - 3 Year Average -$64,400,000 -$96,600,000 $35,660,394 $35,660,394 $35,660,394 $35,660,394 $35,660,394 $35,660,394 $35,660,394 $35,660,394 $35,660,394 $35,660,394 $35,660,394 $35,660,394Net Present Value Gold Price - 1
Year Look BackGold Price - 2
Year Look BackGold Price - 3 Year
Look Back
Flotation Gold Grade 1.81 gpt 1.81 gpt 1.81 gptDirect Feed Gold Grade 3.11 gpt 3.11 gpt 3.11 gptGold Price $/oz $683.34 $640.91 $573.59NPV 0% 516,483,064 420,002,332 266,924,728NPV 5% 304,917,829 240,281,925 137,729,746NPV 10% 179,537,246 134,262,454 62,428,872NPV 15% 102,360,275 69,405,941 17,120,158Internal Rate of Return 29.96 25.50 17.78
Pennstrom Consulting Easton Process Consulting, Inc.
2