Embed Size (px)
Citation preview
Member’s Paper
Dental Insurance Claims Identification of Atypical Claims
Activity
By Barry Senensky, BSc, FCIA, FSA
Jonathan Polon, BSc, FSA
Any opinions expressed in this paper are those of the author and are not necessarily the opinion or position of the Canadian Institute of Actuaries.
Les opinions exprimées dans cette communication sont celles de l’auteur et ne sont pas nécessairement les opinions ou politiques de l’Institut canadien des actuaires.
Written comments on this paper received at the Secretariat by August 2007 will be published in the Proceedings along with the paper.
Les observations écrites sur cette communication reçues au Secrétariat avant août 2007 seront publiées dans les Déliberations avec la communication. Un résumé en français est inclus ci-après.
April 2007
Document 207033
© 2007 Canadian Institute of Actuaries
Member’s Paper April 2007
Dental Insurance Claims Identification of Atypical Claims Activity
By
Barry Senensky, BSc, FCIA, FSA Jonathan Polon, BSc, FSA
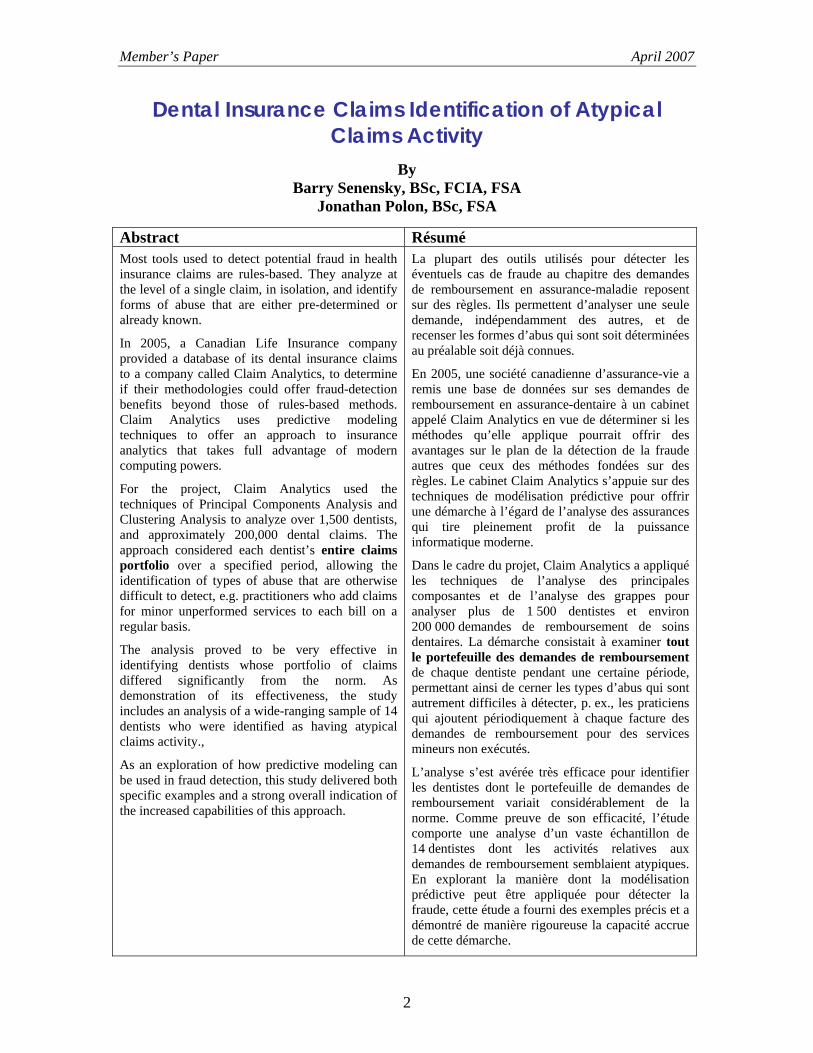
Abstract Résumé Most tools used to detect potential fraud in health insurance claims are rules-based. They analyze at the level of a single claim, in isolation, and identify forms of abuse that are either pre-determined or already known.
In 2005, a Canadian Life Insurance company provided a database of its dental insurance claims to a company called Claim Analytics, to determine if their methodologies could offer fraud-detection benefits beyond those of rules-based methods. Claim Analytics uses predictive modeling techniques to offer an approach to insurance analytics that takes full advantage of modern computing powers.
For the project, Claim Analytics used the techniques of Principal Components Analysis and Clustering Analysis to analyze over 1,500 dentists, and approximately 200,000 dental claims. The approach considered each dentist’s entire claims portfolio over a specified period, allowing the identification of types of abuse that are otherwise difficult to detect, e.g. practitioners who add claims for minor unperformed services to each bill on a regular basis.
The analysis proved to be very effective in identifying dentists whose portfolio of claims differed significantly from the norm. As demonstration of its effectiveness, the study includes an analysis of a wide-ranging sample of 14 dentists who were identified as having atypical claims activity.,
As an exploration of how predictive modeling can be used in fraud detection, this study delivered both specific examples and a strong overall indication of the increased capabilities of this approach.
La plupart des outils utilisés pour détecter les éventuels cas de fraude au chapitre des demandes de remboursement en assurance-maladie reposent sur des règles. Ils permettent d’analyser une seule demande, indépendamment des autres, et de recenser les formes d’abus qui sont soit déterminées au préalable soit déjà connues.
En 2005, une société canadienne d’assurance-vie a remis une base de données sur ses demandes de remboursement en assurance-dentaire à un cabinet appelé Claim Analytics en vue de déterminer si les méthodes qu’elle applique pourrait offrir des avantages sur le plan de la détection de la fraude autres que ceux des méthodes fondées sur des règles. Le cabinet Claim Analytics s’appuie sur des techniques de modélisation prédictive pour offrir une démarche à l’égard de l’analyse des assurances qui tire pleinement profit de la puissance informatique moderne.
Dans le cadre du projet, Claim Analytics a appliqué les techniques de l’analyse des principales composantes et de l’analyse des grappes pour analyser plus de 1 500 dentistes et environ 200 000 demandes de remboursement de soins dentaires. La démarche consistait à examiner tout le portefeuille des demandes de remboursement de chaque dentiste pendant une certaine période, permettant ainsi de cerner les types d’abus qui sont autrement difficiles à détecter, p. ex., les praticiens qui ajoutent périodiquement à chaque facture des demandes de remboursement pour des services mineurs non exécutés.
L’analyse s’est avérée très efficace pour identifier les dentistes dont le portefeuille de demandes de remboursement variait considérablement de la norme. Comme preuve de son efficacité, l’étude comporte une analyse d’un vaste échantillon de 14 dentistes dont les activités relatives aux demandes de remboursement semblaient atypiques. En explorant la manière dont la modélisation prédictive peut être appliquée pour détecter la fraude, cette étude a fourni des exemples précis et a démontré de manière rigoureuse la capacité accrue de cette démarche.
2
Member’s Paper April 2007
TABLE OF CONTENTS
1. Executive Summary ........................................................................................... 4 2. Sample of Atypical Dentists .............................................................................. 6 3. Outline of Remainder of Report....................................................................... 22 4. Principal Components Analysis ....................................................................... 22 5. Clustering Analysis .......................................................................................... 28 6. K-Means Clustering ......................................................................................... 28 7. Expectation-Maximization Clustering ............................................................. 33 Appendix A: Methodology for Classifying Dentists as Atypical ..................................... 38
3
Member’s Paper April 2007
1. EXECUTIVE SUMMARY
Introduction In 2005, A Canadian Life Insurance Company provided a database of its dental insurance claims to Claim Analytics for the purpose of applying data mining technology to uncover atypical claims activity. This is a summary of the Claim Analytics research project.
Objective To determine if the Claim Analytics data mining methodologies could produce benefits in the detection of potential dental claim fraud.
Scope As this was a research project, we chose to limit our analysis to dental services that were provided:
a) In Ontario
b) In 2004
c) By a general practitioner (which excluded all specialist work).
There were approximately 6,000 dentists that had at least one claim meeting our three criteria and our analysis included all of these claims. Of these, there were 1,644 dentists for whom there was sufficient data for us to classify as typical or atypical.
In total, approximately 200,000 dental claims representing close to $40 million billed were analyzed, where a dental claim is defined as all dental procedures performed on an individual during a single visit to the dentist.
Approach
Traditional Approach Most of the tools available for analyzing dental insurance claims are rules-based. These tools are very strong at identifying transactions that match known types of potentially fraudulent activity.
However, they are limited to:
a) Identifying the types of abuse that are already known.
b) Analyzing at the level of a single claim, in isolation.
Claim Analytics Approach For this project, we developed a series of analytical tools to expand on the discoveries that can be made by either rules-based analysis or claim-by-claim analysis.
Our approach used data mining tools to analyze tens of thousands of transactions, thereby uncovering patterns that allowed the measurement of how typical or atypical any given transaction was. This approach enabled the discovery of forms of abuse that are neither predetermined, nor already known.
4
Member’s Paper April 2007
Our approach considered each dentist’s entire portfolio of claims over a specified time period. In this way, we identified types of abuse that are otherwise difficult to detect, such as practitioners who add claims for minor unperformed services to each bill on a regular basis.
Methodology The data has been analyzed using two different techniques as listed below:
a) Principal components analysis. This is a method of reducing dimensionality of data while maximizing the retention of information. It allows for high dimensional data to be represented graphically so that outliers can be identified. Dentists with a disproportionate amount of outlying claims may be of interest.
b) Clustering techniques. Two different clustering methods are used to categorize claims into groups of similar claims. With clustering, we may be interested in dentists that have a distribution of claims by cluster that differs greatly from the norm.
We considered the claims data from three different perspectives and then analyzed each of these independently of the others. Specifically, we looked for patterns as follows:
• By claim (work done on one claimant during one visit);
• By tooth (all work done on one specific tooth of one specific claimant by one specific dentist, across all visits);
• By general work (all non-tooth-specific work – exams, fluoride, radiographs, scaling and polishing) done on one specific patient by one dentist, across all visits.
Findings Of the 1,644 dentists considered, 214 (13%) were classified as atypical. These atypical dentists were paid a total of $2.49 million by the Life Insurance Company in 2004. The methodology for determining whether a dentist is atypical is discussed in Appendix A.
As demonstration of the effectiveness of this analysis, the next section provides a sample of 14 dentists who have been identified as having atypical claims activity. We have identified them as dentist “A”, “B,” “C” etc. to protect confidentiality.
Conclusion Our data mining analysis proved to be very effective in patterning dental work and in identifying dentists whose portfolio of claims differed significantly from the norm.
Additionally, the analysis provides a high-level understanding of how the portfolio of work of a specific dentist differs from the norm. This information should enable an expert to quickly identify and then focus on those dentists with atypical claims activity.
5
Member’s Paper April 2007
2. SAMPLE OF ATYPICAL DENTISTS
Note: Please note that this section refers to Clustering Analysis and Principal Components Analysis, both of which are discussed in detail later in the report.
Also, as mentioned in the Methodology section of the Executive Summary, the purpose of clustering is to categorize claims into groups of similar claims. Dentists that have a distribution of claims by cluster that differs greatly from the norm are atypical.
The 6 different sets of cluster that were created are summarized in the tables below. These tables may be of interest as a reference when reviewing the sample of atypical dentists that follows.
Summary of Clusters
i. K-Means Clustering by Claim Cluster 1: Work performed indicative of major dental problems
Cluster 2: Work performed indicative of moderate dental problems
Cluster 3: Claimant age > 28.5, minor work
Cluster 4: Includes procedures that may be unbundled
Cluster 5: Minor work combined with expensive technologies
Cluster 6: Claimant age < 28.5, minor work
ii. K-Means Clustering by Tooth Cluster 1: Claimant age between 35 and 49, minor work
Cluster 2: Claimant age > 35, moderate work
Cluster 3: Claimant age < 35, moderate work
Cluster 4: Claimant age > 49, minor work
Cluster 5: Claimant age between 19 and 35, minor work
Cluster 6: Claimant age < 19, minor work
Cluster 7: Claimant age > 19, major work
iii. K-Means Clustering by General (Non-Tooth Specific) Work Cluster 1: Claimant age < 19, no fluoride, minor work
Cluster 2: Claimant age > 19, major work, expensive technologies used
Cluster 3: Claimant age < 19, fluoride provided
Cluster 4: Claimant age > 41, minor work
Cluster 5: Minor to moderate work, expensive technologies used
Cluster 6: Moderate to major work, no expensive technologies used
Cluster 7: Claimant age between 19 and 41, minor work, no expensive technologies
Cluster 8: Claimant age > 18, moderate work, no expensive technologies used
6
Member’s Paper April 2007
iv. EM Clustering by Claim Cluster 1: More than 3 procedures and no specialist-type work OR less than 4 procedures and some procedures that may be unbundled
Cluster 2: No unbundling and less than 4 procedures OR more than 3 procedures and some specialist-type work
Cluster 3: Crowns and a high proportion of endodontic work
Cluster 4: Minor work, no unbundling, little or no lab work
v. EM Clustering by Tooth Cluster 1: Preventative work performed
Cluster 2: Oral surgery performed, procedures that may be performed by specialists
Cluster 3: Crowns
Cluster 4: Little or no preventative work, no crowns, no specialist-type work
Cluster 5: Procedures that may be performed by specialists but not oral surgery
vi. EM Clustering by General (Non-Tooth Specific) Work
Cluster 1: Moderate to major work OR minor to moderate work and amount of diagnostic work > $140 OR minor to moderate work and amount of preventative work > $340
Cluster 2: Minor to moderate work, amount of diagnostic work < $140 and amount of preventative work < $340
As proof of the effectiveness of the Claim Analytics analysis, below is a sample of 14 dentists that have been identified as having atypical claims activity.
7
Member’s Paper April 2007
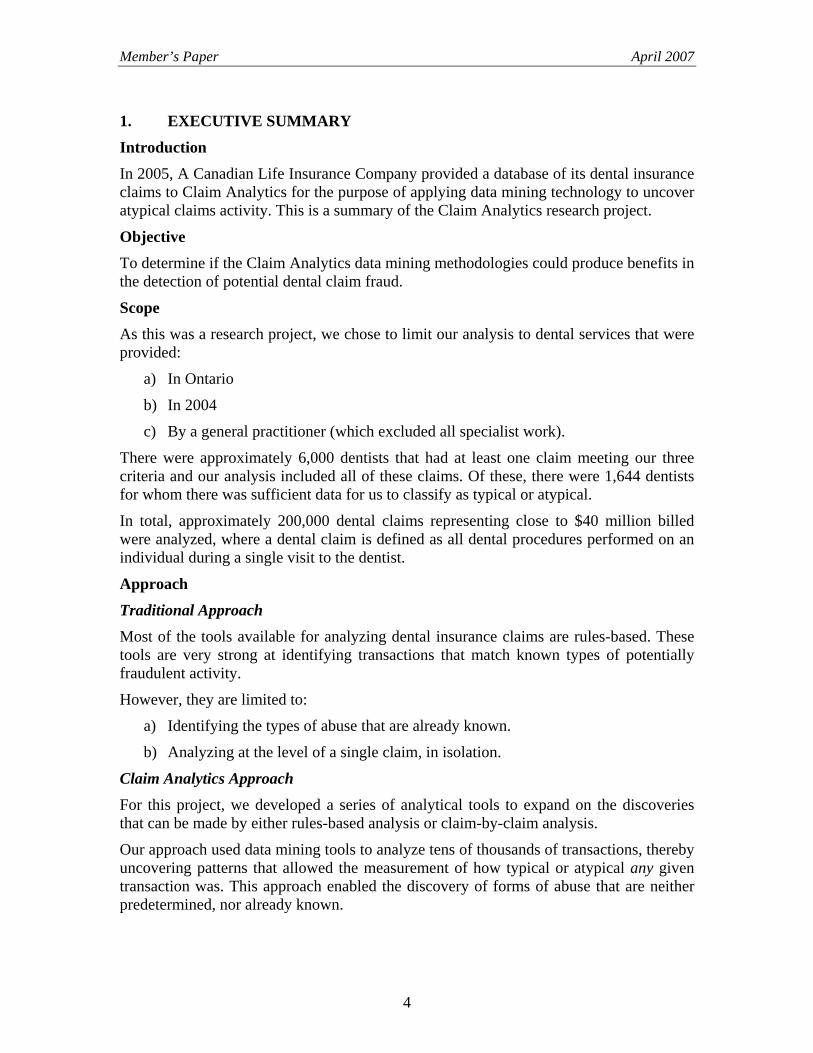
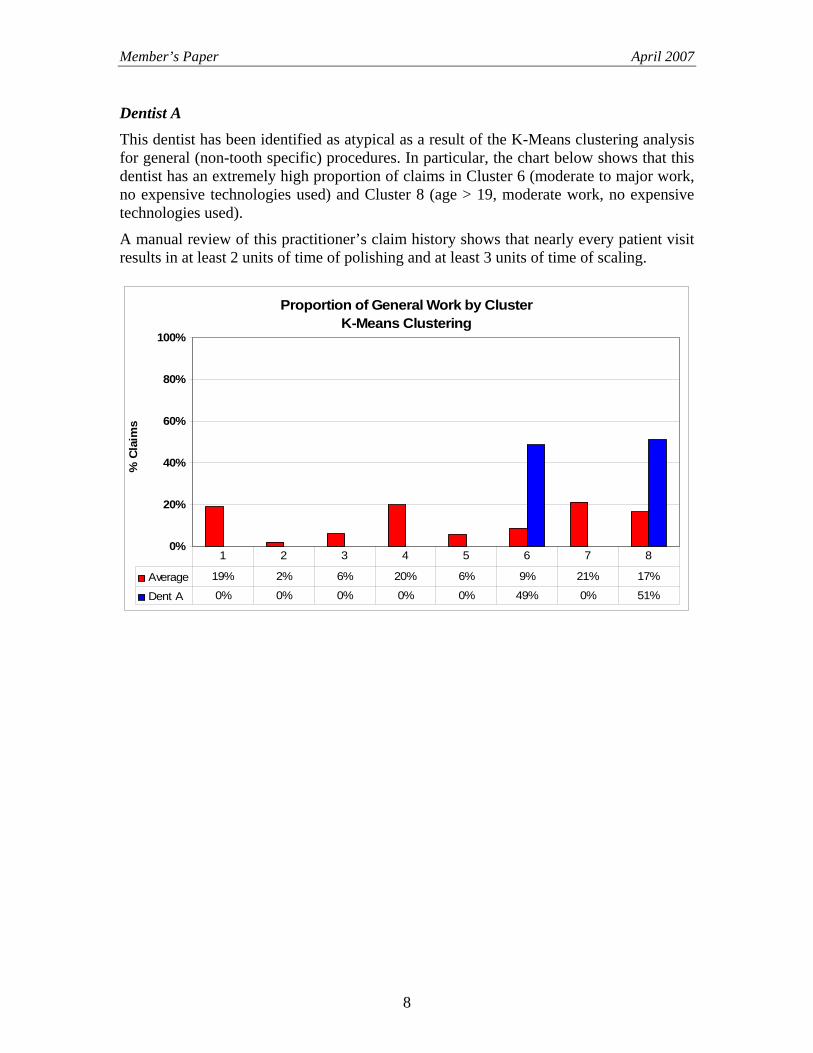
Dentist A This dentist has been identified as atypical as a result of the K-Means clustering analysis for general (non-tooth specific) procedures. In particular, the chart below shows that this dentist has an extremely high proportion of claims in Cluster 6 (moderate to major work, no expensive technologies used) and Cluster 8 (age > 19, moderate work, no expensive technologies used).
A manual review of this practitioner’s claim history shows that nearly every patient visit results in at least 2 units of time of polishing and at least 3 units of time of scaling.
Proportion of General Work by ClusterK-Means Clustering
0%
20%
40%
60%
80%
100%
% C
laim
s X
Average 19% 2% 6% 20% 6% 9% 21% 17%
Dent A 0% 0% 0% 0% 0% 49% 0% 51%
1 2 3 4 5 6 7 8
8
Member’s Paper April 2007
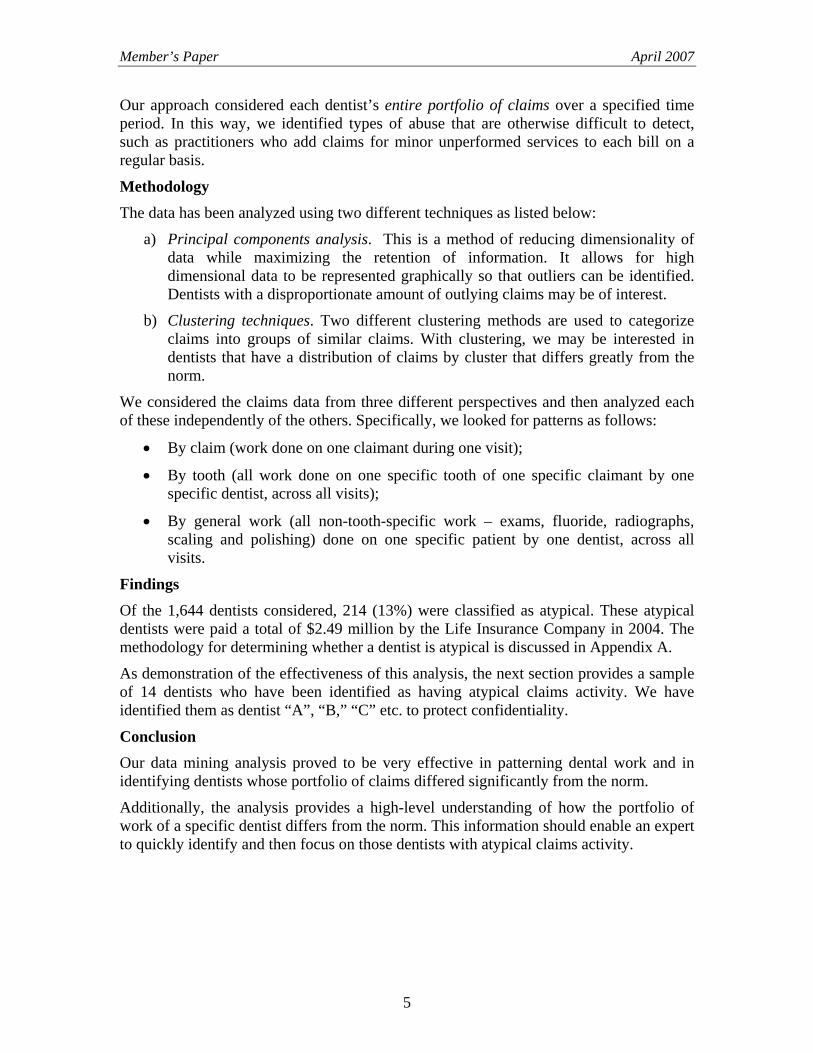
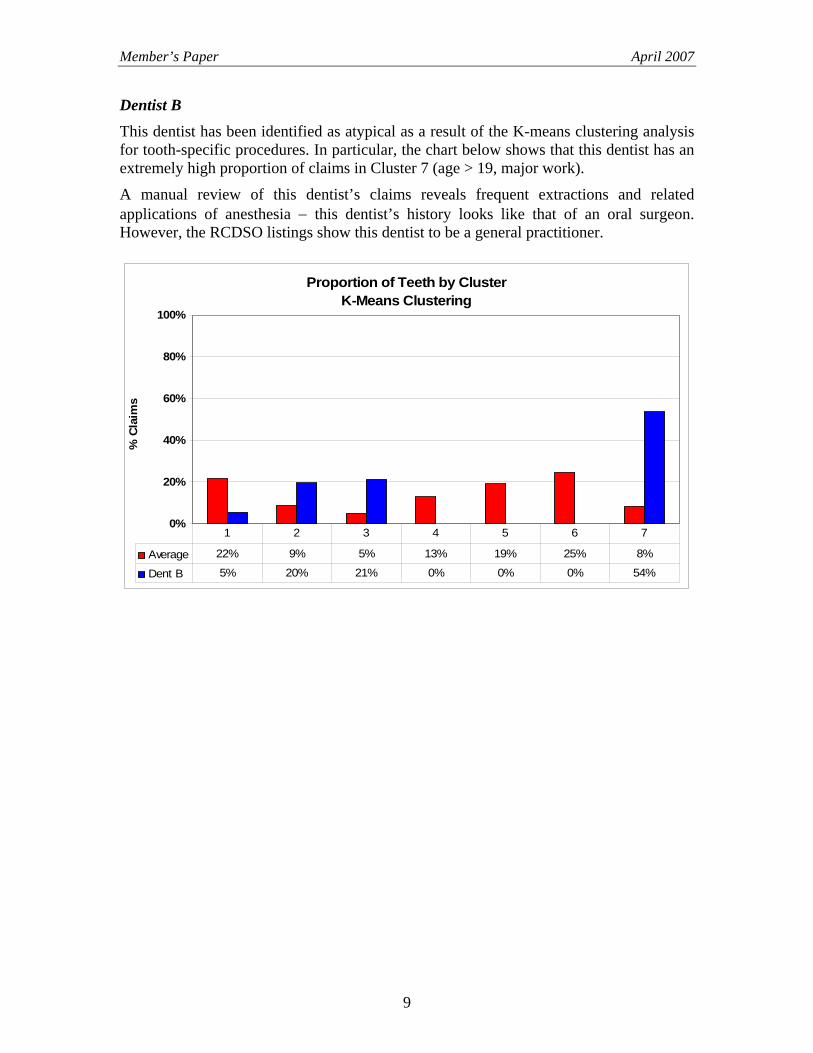
Dentist B This dentist has been identified as atypical as a result of the K-means clustering analysis for tooth-specific procedures. In particular, the chart below shows that this dentist has an extremely high proportion of claims in Cluster 7 (age > 19, major work).
A manual review of this dentist’s claims reveals frequent extractions and related applications of anesthesia − this dentist’s history looks like that of an oral surgeon. However, the RCDSO listings show this dentist to be a general practitioner.
Proportion of Teeth by ClusterK-Means Clustering
0%
20%
40%
60%
80%
100%
% C
laim
s X
Average 22% 9% 5% 13% 19% 25% 8%
Dent B 5% 20% 21% 0% 0% 0% 54%
1 2 3 4 5 6 7
9

Member’s Paper April 2007
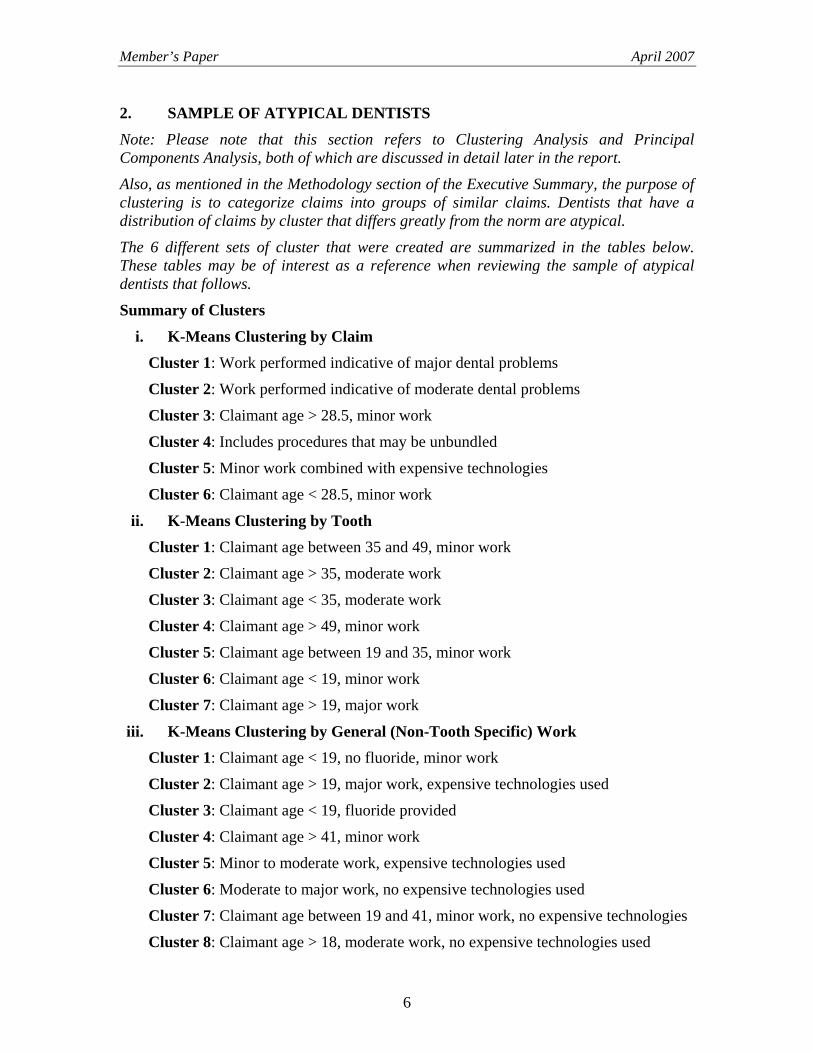
Dentist C This dentist has been identified as atypical as a result of the EM clustering analysis for general (non tooth-specific) procedures. In particular, the chart below shows that this dentist has an extremely high proportion of claims in Cluster 1 (moderate to major work OR amount of diagnostic work > $140 OR amount of preventative work > $340).
A manual review of this dentist’s claims revealed two interesting facts. First, this dentist performs a great deal of scaling (typically 4 units of time). Also, this dentist performs emergency examinations with atypically high frequency.
Proportion of General Work by ClusterEM Clustering
0%
20%
40%
60%
80%
100%
% C
laim
s X
Average 23% 77%
Dent C 66% 34%
1 2
10
Member’s Paper April 2007
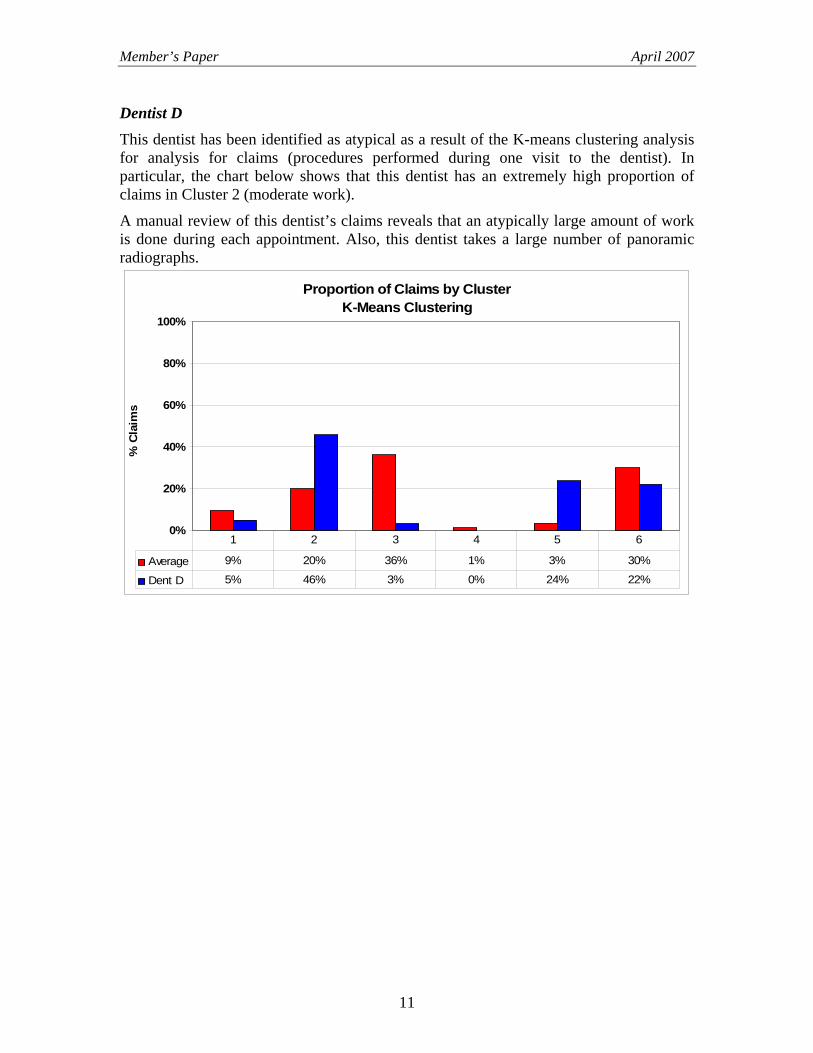
Dentist D This dentist has been identified as atypical as a result of the K-means clustering analysis for analysis for claims (procedures performed during one visit to the dentist). In particular, the chart below shows that this dentist has an extremely high proportion of claims in Cluster 2 (moderate work).
A manual review of this dentist’s claims reveals that an atypically large amount of work is done during each appointment. Also, this dentist takes a large number of panoramic radiographs.
Proportion of Claims by ClusterK-Means Clustering
0%
20%
40%
60%
80%
100%
% C
laim
s X
Average 9% 20% 36% 1% 3% 30%
Dent D 5% 46% 3% 0% 24% 22%
1 2 3 4 5 6
11
Member’s Paper April 2007
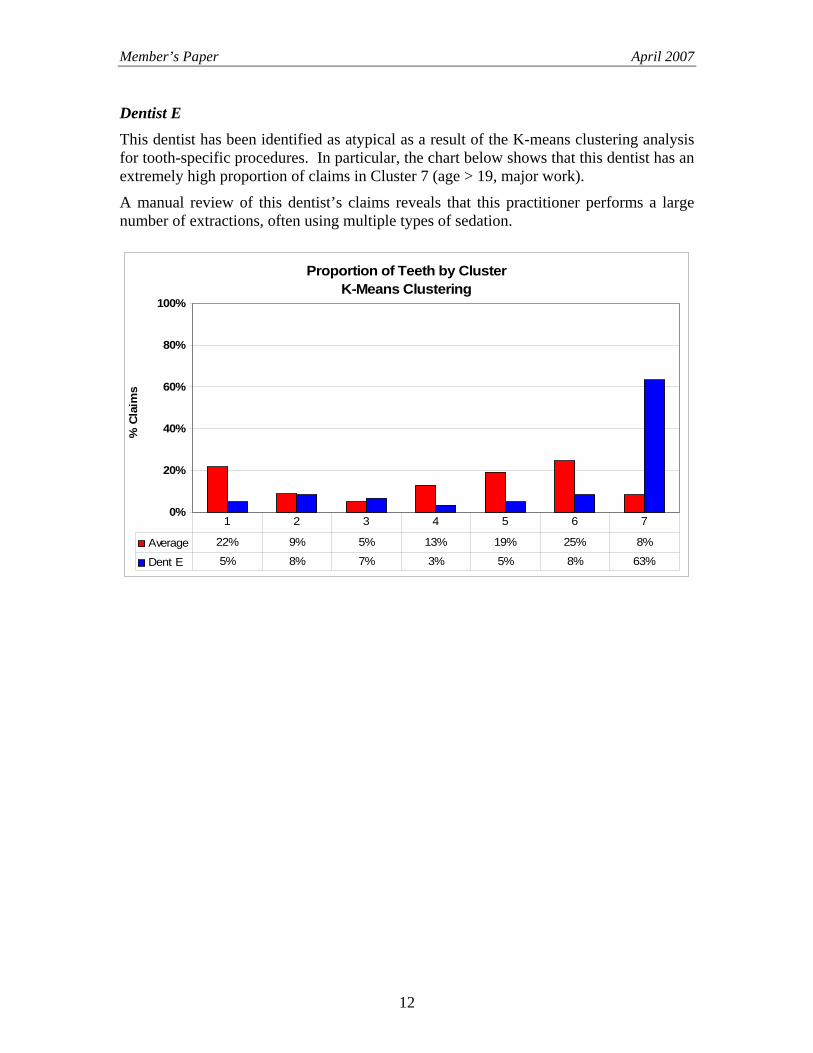
Dentist E This dentist has been identified as atypical as a result of the K-means clustering analysis for tooth-specific procedures. In particular, the chart below shows that this dentist has an extremely high proportion of claims in Cluster 7 (age > 19, major work).
A manual review of this dentist’s claims reveals that this practitioner performs a large number of extractions, often using multiple types of sedation.
Proportion of Teeth by ClusterK-Means Clustering
0%
20%
40%
60%
80%
100%
% C
laim
s X
Average 22% 9% 5% 13% 19% 25% 8%
Dent E 5% 8% 7% 3% 5% 8% 63%
1 2 3 4 5 6 7
12
Member’s Paper April 2007
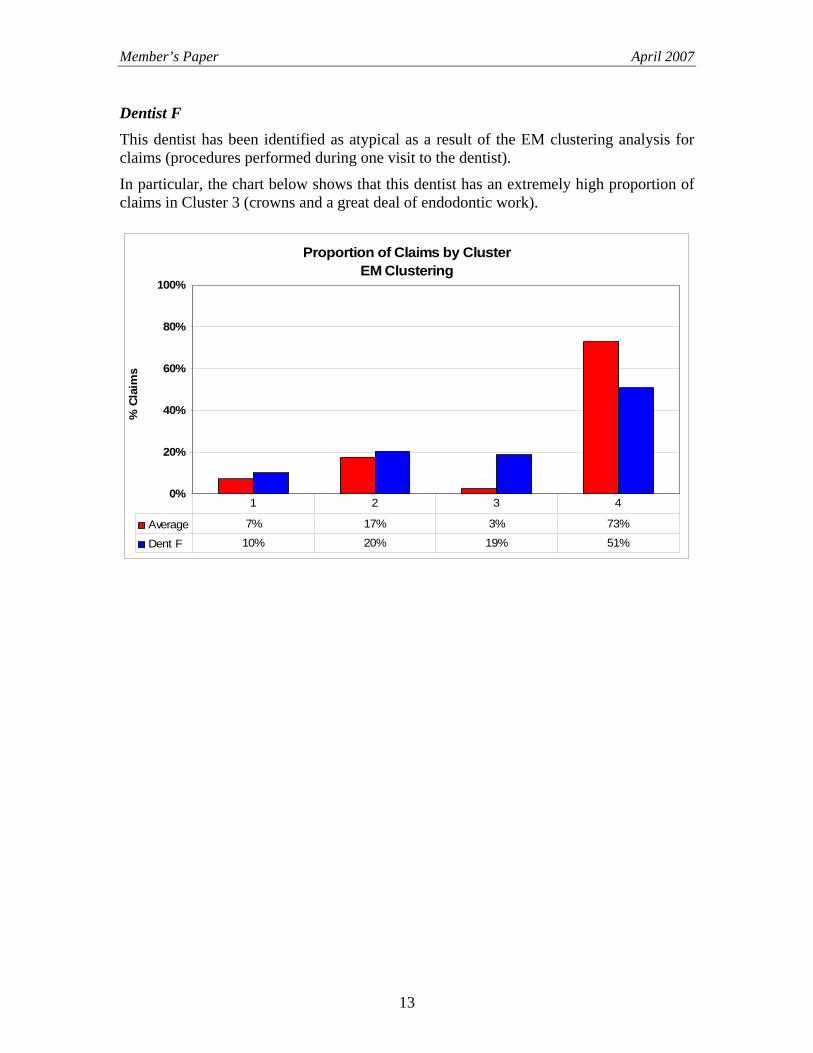
Dentist F This dentist has been identified as atypical as a result of the EM clustering analysis for claims (procedures performed during one visit to the dentist).
In particular, the chart below shows that this dentist has an extremely high proportion of claims in Cluster 3 (crowns and a great deal of endodontic work).
Proportion of Claims by ClusterEM Clustering
0%
20%
40%
60%
80%
100%
% C
laim
s X
Average 7% 17% 3% 73%
Dent F 10% 20% 19% 51%
1 2 3 4
13
Member’s Paper April 2007
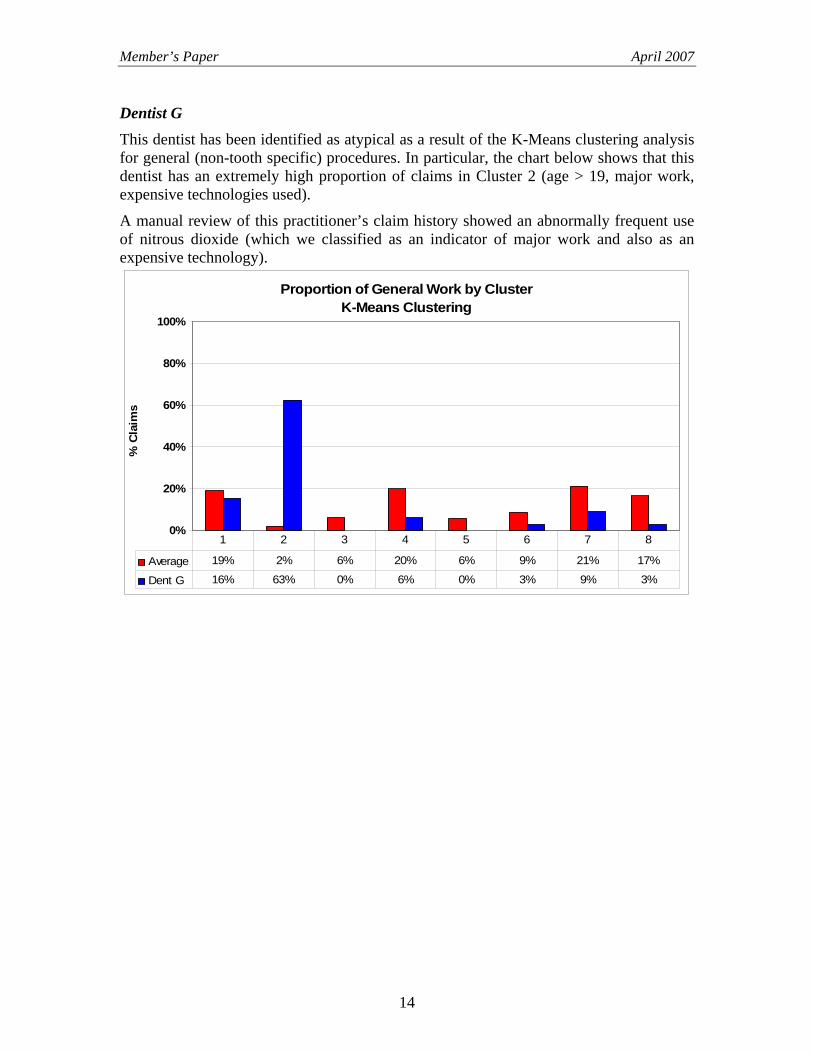
Dentist G This dentist has been identified as atypical as a result of the K-Means clustering analysis for general (non-tooth specific) procedures. In particular, the chart below shows that this dentist has an extremely high proportion of claims in Cluster 2 (age > 19, major work, expensive technologies used).
A manual review of this practitioner’s claim history showed an abnormally frequent use of nitrous dioxide (which we classified as an indicator of major work and also as an expensive technology).
Proportion of General Work by ClusterK-Means Clustering
0%
20%
40%
60%
80%
100%
% C
laim
s X
Average 19% 2% 6% 20% 6% 9% 21% 17%
Dent G 16% 63% 0% 6% 0% 3% 9% 3%
1 2 3 4 5 6 7 8
14
Member’s Paper April 2007
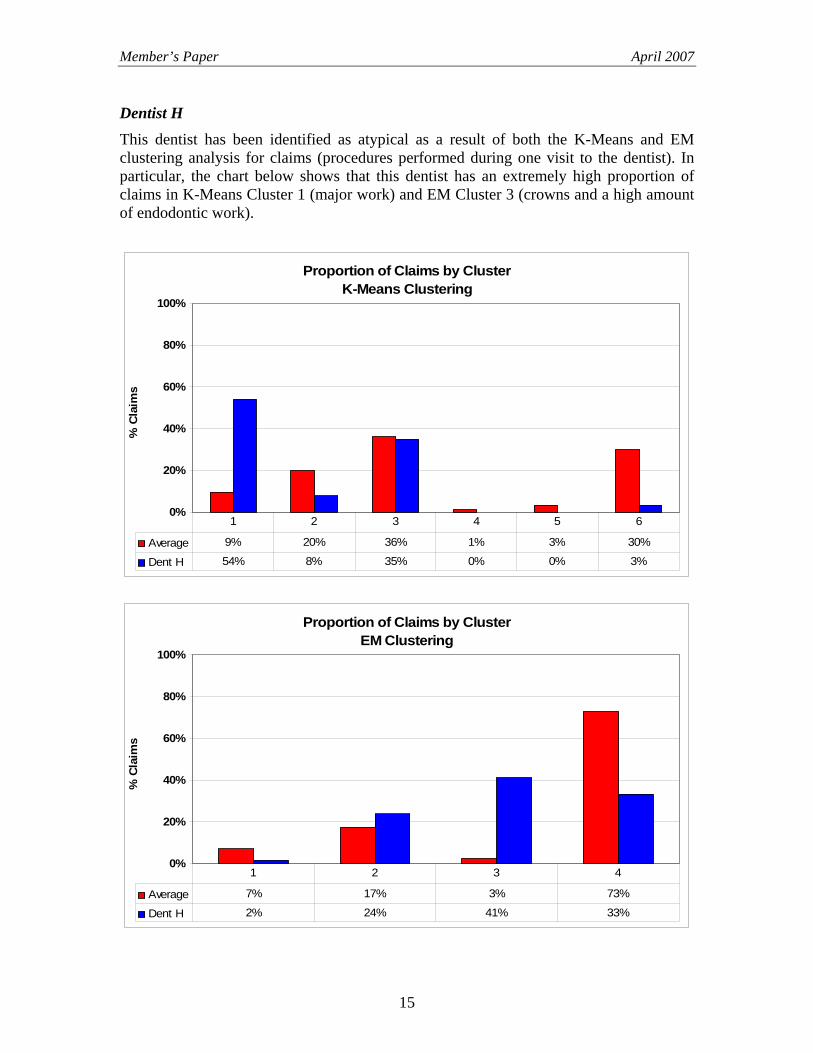
Dentist H This dentist has been identified as atypical as a result of both the K-Means and EM clustering analysis for claims (procedures performed during one visit to the dentist). In particular, the chart below shows that this dentist has an extremely high proportion of claims in K-Means Cluster 1 (major work) and EM Cluster 3 (crowns and a high amount of endodontic work).
Proportion of Claims by ClusterK-Means Clustering
0%
20%
40%
60%
80%
100%
% C
laim
s X
Average 9% 20% 36% 1% 3% 30%
Dent H 54% 8% 35% 0% 0% 3%
1 2 3 4 5 6
Proportion of Claims by ClusterEM Clustering
0%
20%
40%
60%
80%
100%
% C
laim
s X
Average 7% 17% 3% 73%
Dent H 2% 24% 41% 33%
1 2 3 4
15
Member’s Paper April 2007
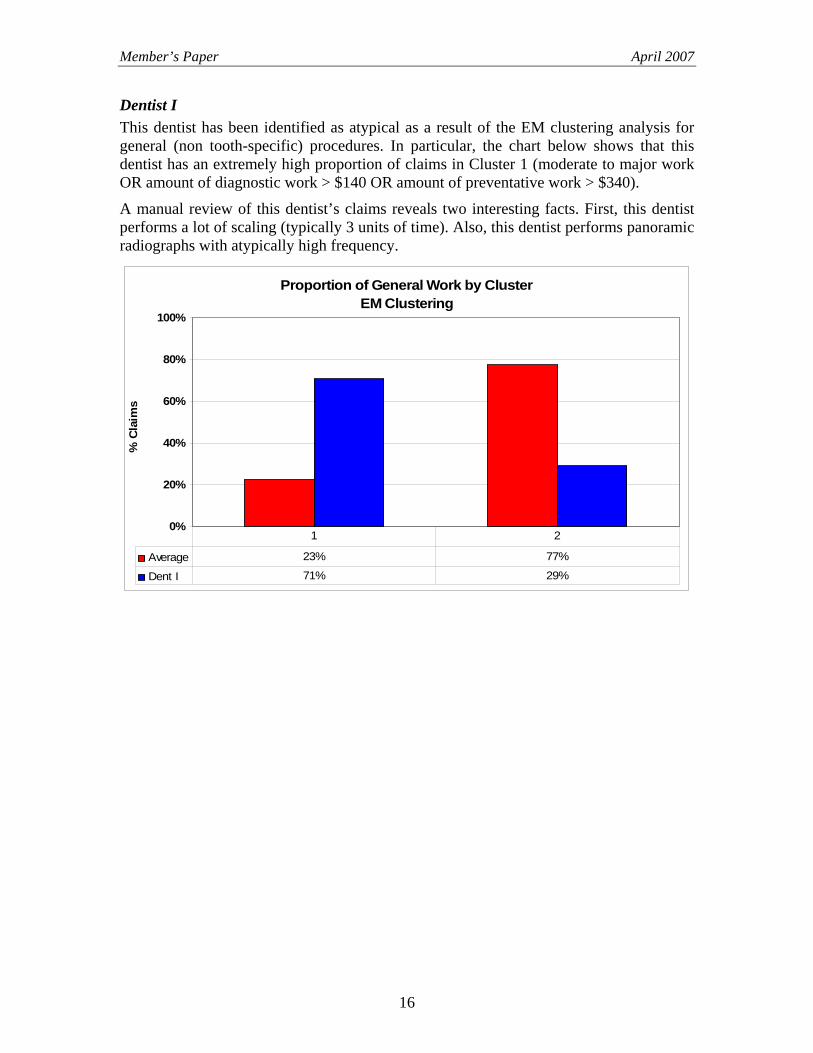
Dentist I This dentist has been identified as atypical as a result of the EM clustering analysis for general (non tooth-specific) procedures. In particular, the chart below shows that this dentist has an extremely high proportion of claims in Cluster 1 (moderate to major work OR amount of diagnostic work > $140 OR amount of preventative work > $340).
A manual review of this dentist’s claims reveals two interesting facts. First, this dentist performs a lot of scaling (typically 3 units of time). Also, this dentist performs panoramic radiographs with atypically high frequency.
Proportion of General Work by ClusterEM Clustering
0%
20%
40%
60%
80%
100%
% C
laim
s X
Average 23% 77%
Dent I 71% 29%
1 2
16
Member’s Paper April 2007
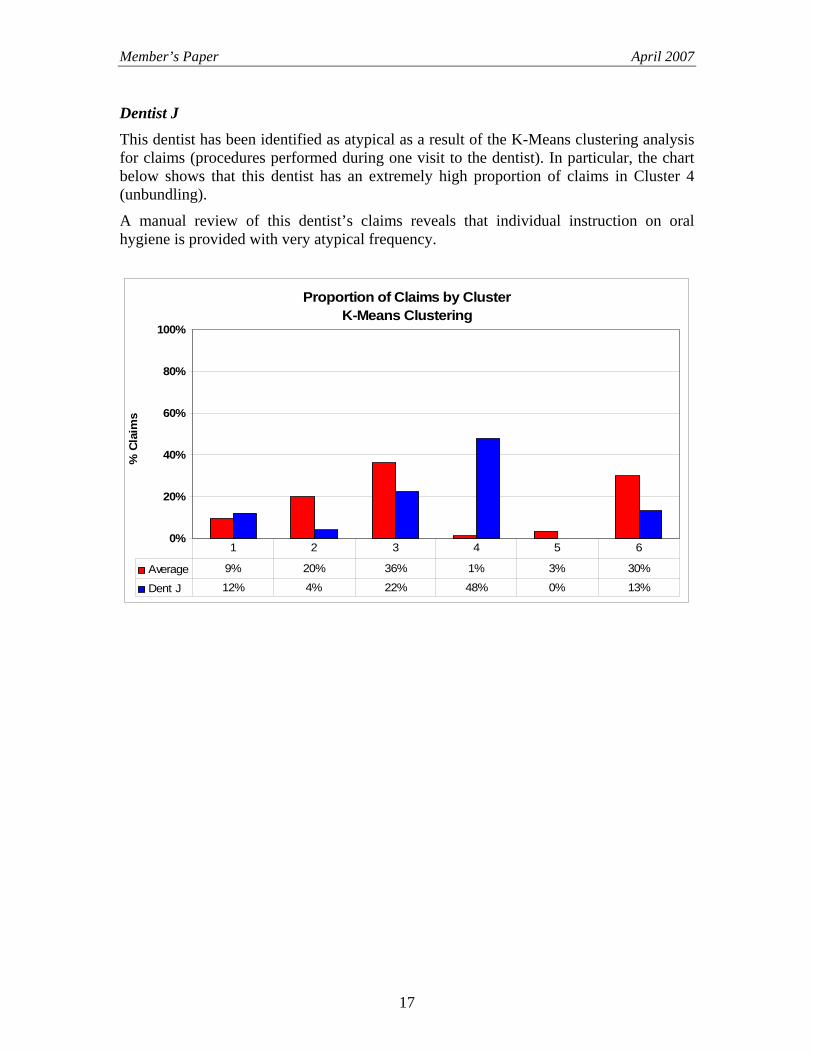
Dentist J This dentist has been identified as atypical as a result of the K-Means clustering analysis for claims (procedures performed during one visit to the dentist). In particular, the chart below shows that this dentist has an extremely high proportion of claims in Cluster 4 (unbundling).
A manual review of this dentist’s claims reveals that individual instruction on oral hygiene is provided with very atypical frequency.
Proportion of Claims by ClusterK-Means Clustering
0%
20%
40%
60%
80%
100%
% C
laim
s X
Average 9% 20% 36% 1% 3% 30%
Dent J 12% 4% 22% 48% 0% 13%
1 2 3 4 5 6
17
Member’s Paper April 2007
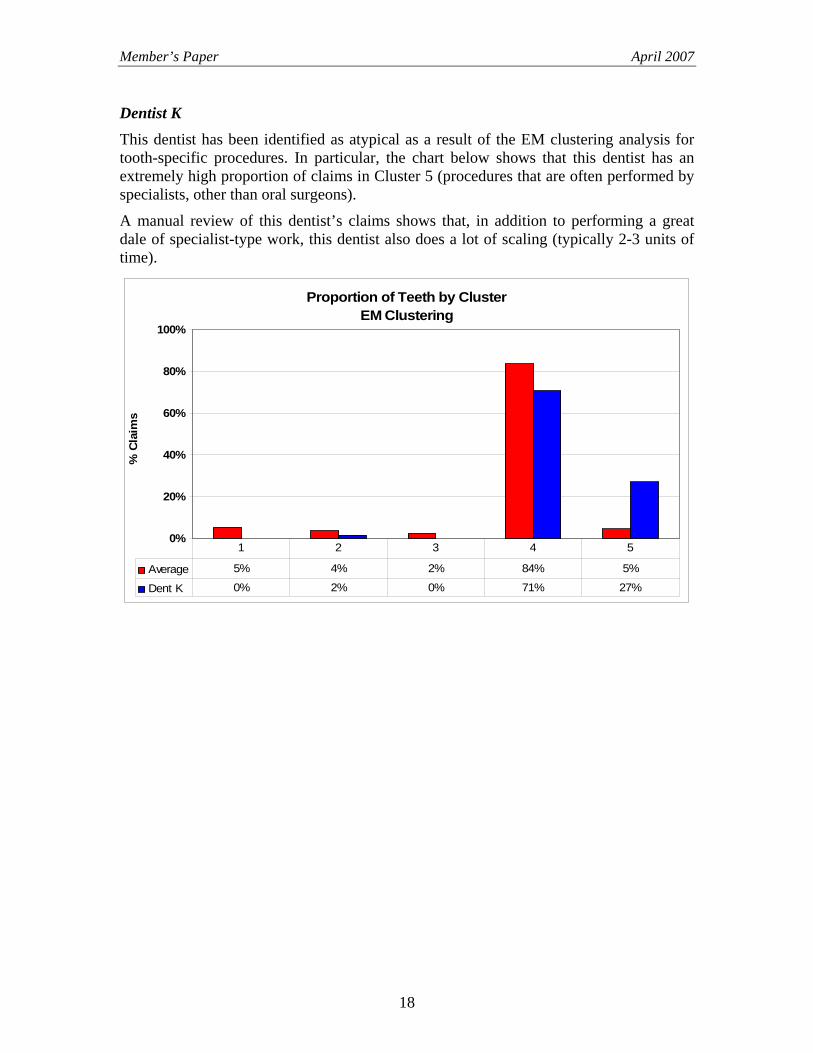
Dentist K This dentist has been identified as atypical as a result of the EM clustering analysis for tooth-specific procedures. In particular, the chart below shows that this dentist has an extremely high proportion of claims in Cluster 5 (procedures that are often performed by specialists, other than oral surgeons).
A manual review of this dentist’s claims shows that, in addition to performing a great dale of specialist-type work, this dentist also does a lot of scaling (typically 2-3 units of time).
Proportion of Teeth by ClusterEM Clustering
0%
20%
40%
60%
80%
100%
% C
laim
s X
Average 5% 4% 2% 84% 5%
Dent K 0% 2% 0% 71% 27%
1 2 3 4 5
18
Member’s Paper April 2007
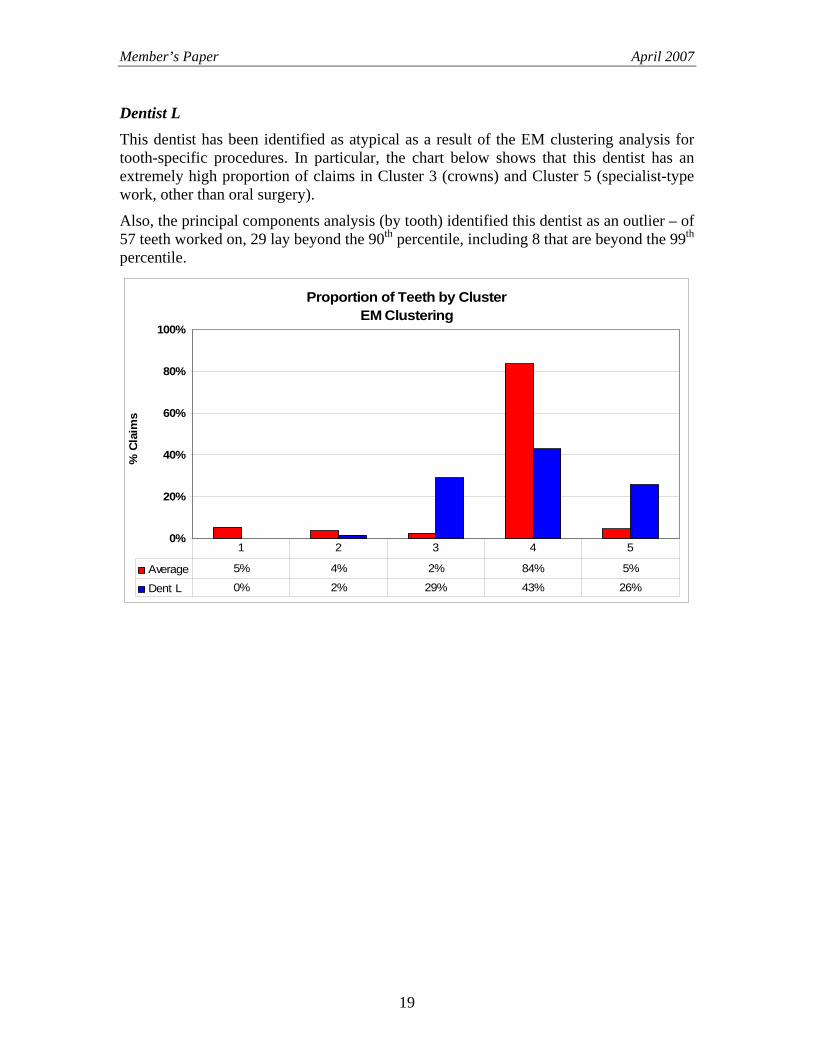
Dentist L This dentist has been identified as atypical as a result of the EM clustering analysis for tooth-specific procedures. In particular, the chart below shows that this dentist has an extremely high proportion of claims in Cluster 3 (crowns) and Cluster 5 (specialist-type work, other than oral surgery).
Also, the principal components analysis (by tooth) identified this dentist as an outlier – of 57 teeth worked on, 29 lay beyond the 90th percentile, including 8 that are beyond the 99th percentile.
Proportion of Teeth by ClusterEM Clustering
0%
20%
40%
60%
80%
100%
% C
laim
s X
Average 5% 4% 2% 84% 5%
Dent L 0% 2% 29% 43% 26%
1 2 3 4 5
19
Member’s Paper April 2007
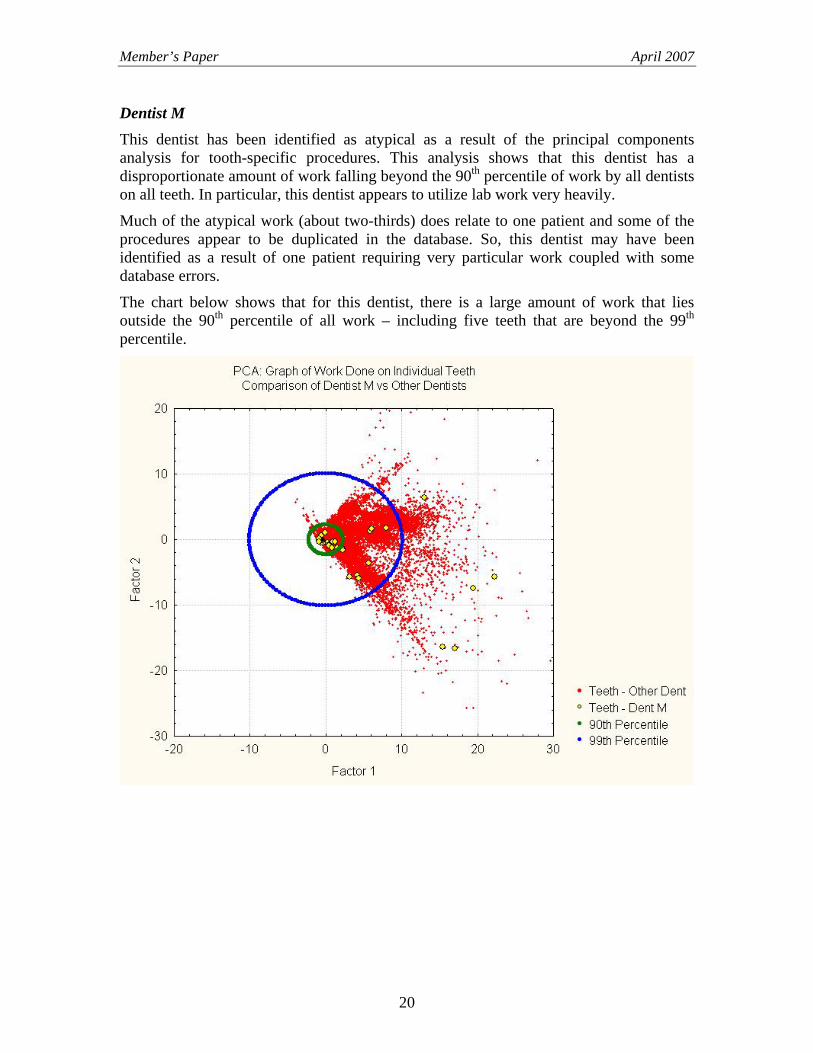
Dentist M This dentist has been identified as atypical as a result of the principal components analysis for tooth-specific procedures. This analysis shows that this dentist has a disproportionate amount of work falling beyond the 90th percentile of work by all dentists on all teeth. In particular, this dentist appears to utilize lab work very heavily.
Much of the atypical work (about two-thirds) does relate to one patient and some of the procedures appear to be duplicated in the database. So, this dentist may have been identified as a result of one patient requiring very particular work coupled with some database errors.
The chart below shows that for this dentist, there is a large amount of work that lies outside the 90th percentile of all work – including five teeth that are beyond the 99th percentile.
20
Member’s Paper April 2007
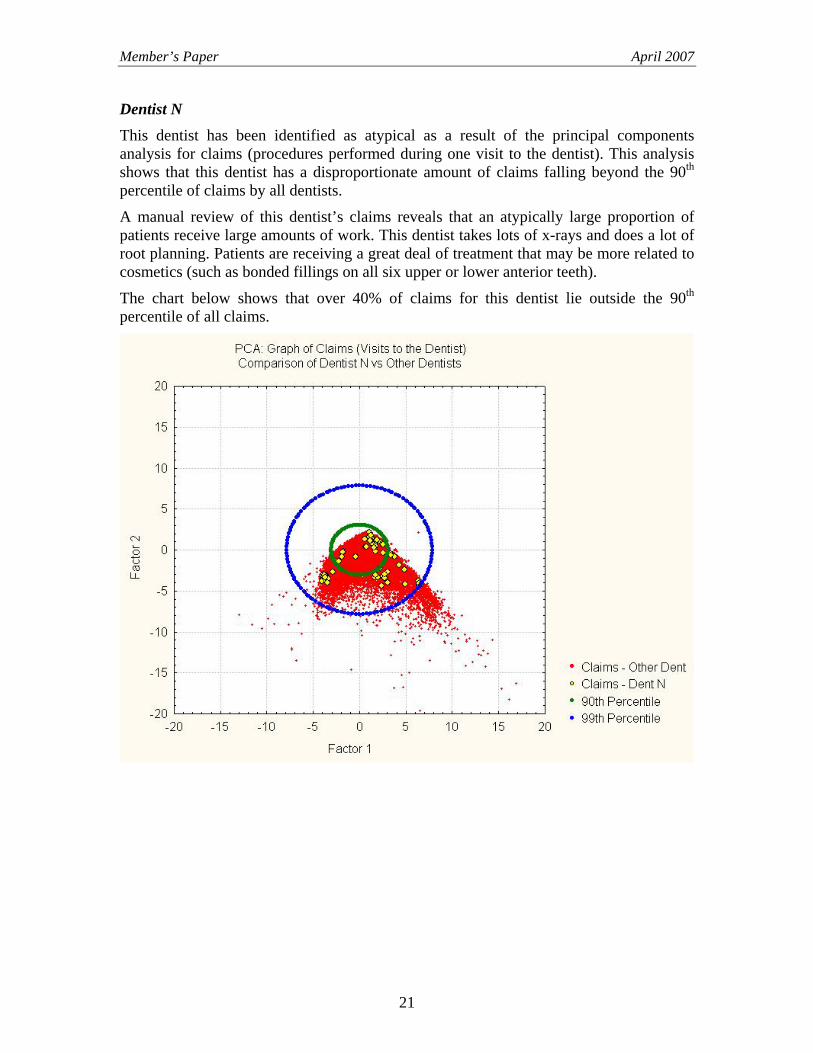
Dentist N This dentist has been identified as atypical as a result of the principal components analysis for claims (procedures performed during one visit to the dentist). This analysis shows that this dentist has a disproportionate amount of claims falling beyond the 90th percentile of claims by all dentists.
A manual review of this dentist’s claims reveals that an atypically large proportion of patients receive large amounts of work. This dentist takes lots of x-rays and does a lot of root planning. Patients are receiving a great deal of treatment that may be more related to cosmetics (such as bonded fillings on all six upper or lower anterior teeth).
The chart below shows that over 40% of claims for this dentist lie outside the 90th percentile of all claims.
21
Member’s Paper April 2007
3. OUTLINE OF REMAINDER OF REPORT The remainder of this report contains the following sections:
• Sections 4 - 8: Technical Overview. These sections describe the analytical techniques used to analyze the data, including our findings.
• Appendix A: Methodology for Classifying Claims as Atypical. A review of the methodology we used to classify dentists as either typical or atypical.
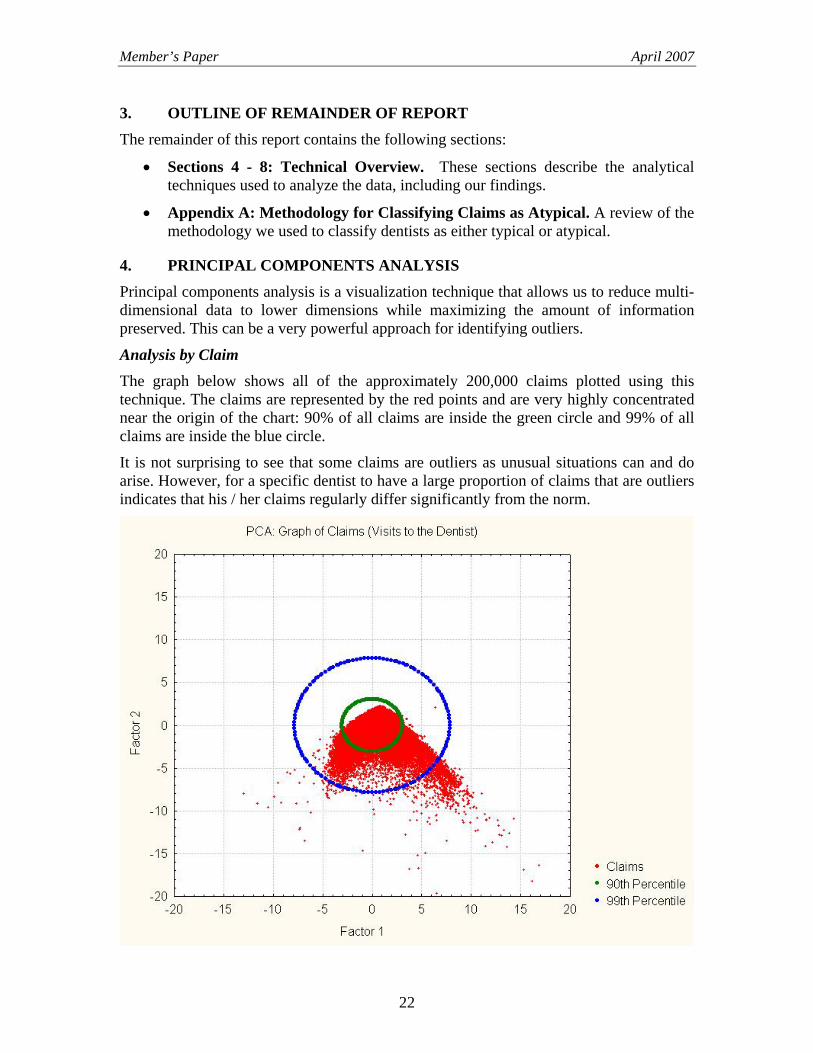
4. PRINCIPAL COMPONENTS ANALYSIS Principal components analysis is a visualization technique that allows us to reduce multi-dimensional data to lower dimensions while maximizing the amount of information preserved. This can be a very powerful approach for identifying outliers.
Analysis by Claim The graph below shows all of the approximately 200,000 claims plotted using this technique. The claims are represented by the red points and are very highly concentrated near the origin of the chart: 90% of all claims are inside the green circle and 99% of all claims are inside the blue circle.
It is not surprising to see that some claims are outliers as unusual situations can and do arise. However, for a specific dentist to have a large proportion of claims that are outliers indicates that his / her claims regularly differ significantly from the norm.
22
Member’s Paper April 2007
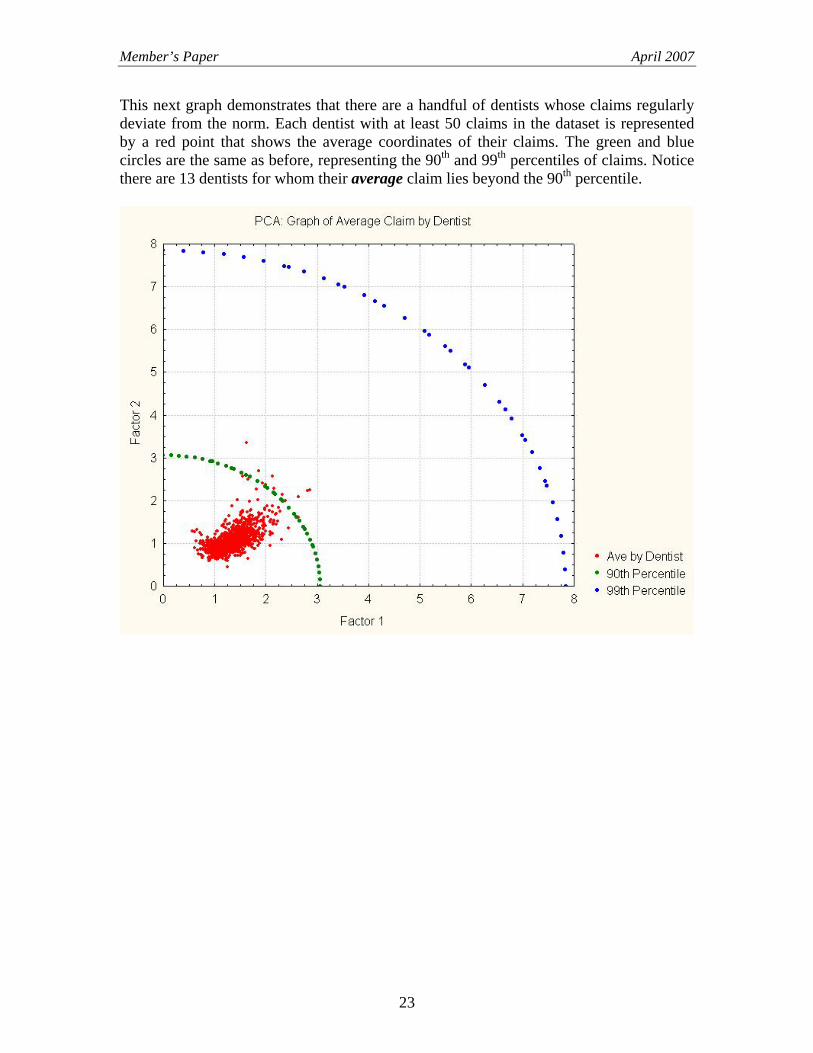
This next graph demonstrates that there are a handful of dentists whose claims regularly deviate from the norm. Each dentist with at least 50 claims in the dataset is represented by a red point that shows the average coordinates of their claims. The green and blue circles are the same as before, representing the 90th and 99th percentiles of claims. Notice there are 13 dentists for whom their average claim lies beyond the 90th percentile.
23
Member’s Paper April 2007
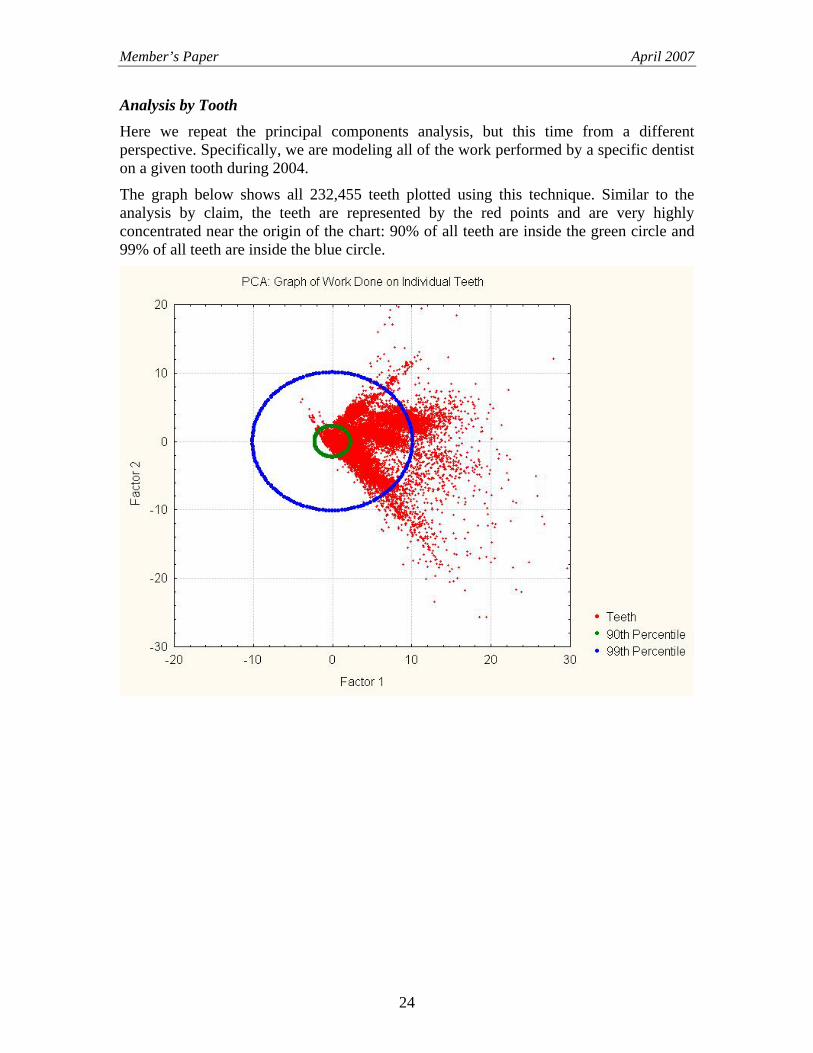
Analysis by Tooth Here we repeat the principal components analysis, but this time from a different perspective. Specifically, we are modeling all of the work performed by a specific dentist on a given tooth during 2004.
The graph below shows all 232,455 teeth plotted using this technique. Similar to the analysis by claim, the teeth are represented by the red points and are very highly concentrated near the origin of the chart: 90% of all teeth are inside the green circle and 99% of all teeth are inside the blue circle.
24
Member’s Paper April 2007
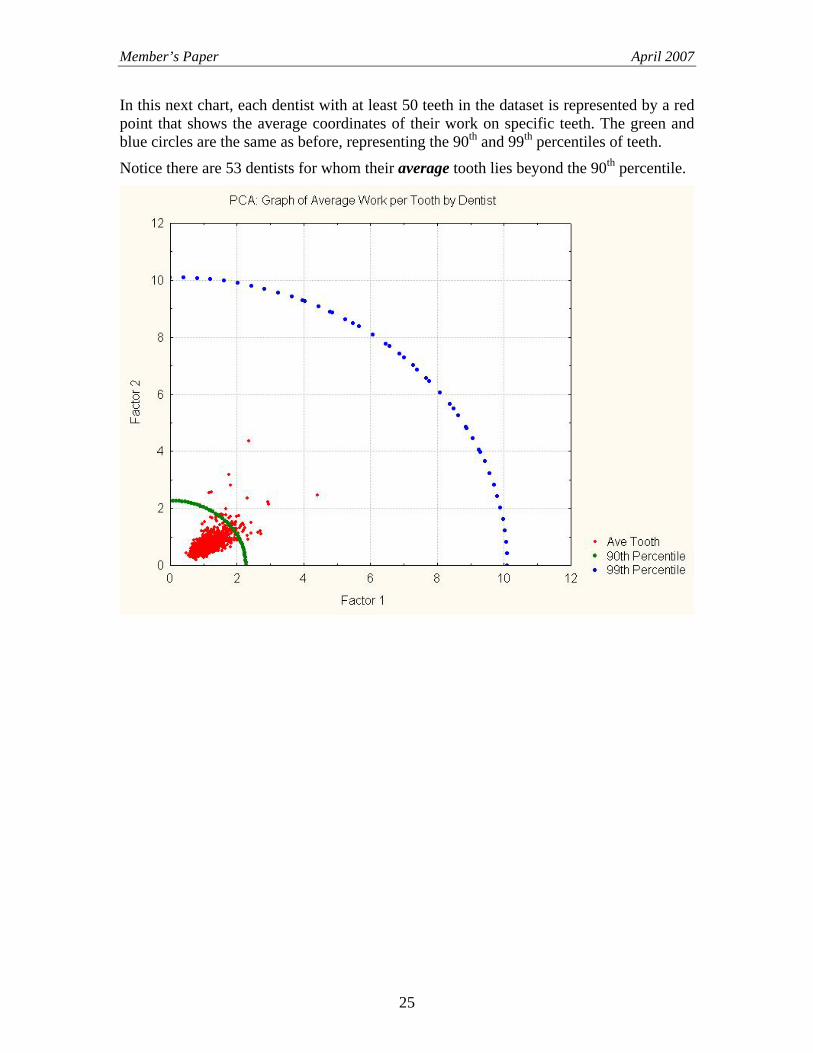
In this next chart, each dentist with at least 50 teeth in the dataset is represented by a red point that shows the average coordinates of their work on specific teeth. The green and blue circles are the same as before, representing the 90th and 99th percentiles of teeth.
Notice there are 53 dentists for whom their average tooth lies beyond the 90th percentile.
25
Member’s Paper April 2007
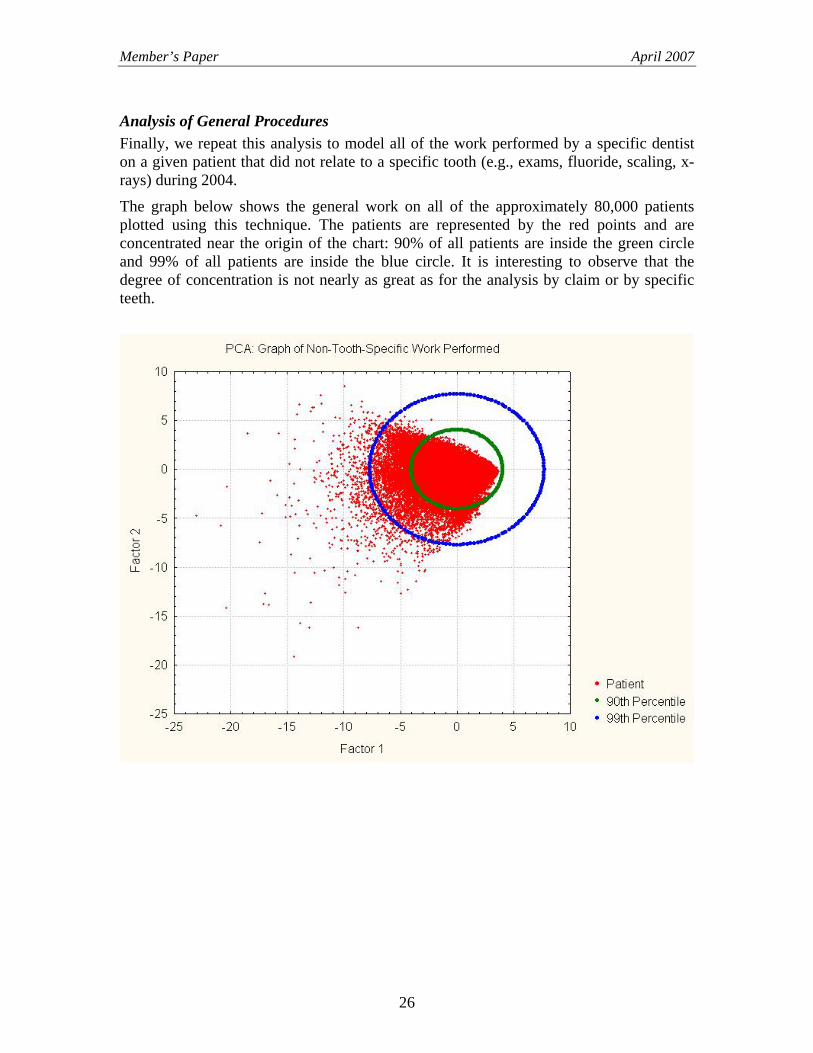
Analysis of General Procedures Finally, we repeat this analysis to model all of the work performed by a specific dentist on a given patient that did not relate to a specific tooth (e.g., exams, fluoride, scaling, x-rays) during 2004.
The graph below shows the general work on all of the approximately 80,000 patients plotted using this technique. The patients are represented by the red points and are concentrated near the origin of the chart: 90% of all patients are inside the green circle and 99% of all patients are inside the blue circle. It is interesting to observe that the degree of concentration is not nearly as great as for the analysis by claim or by specific teeth.
26
Member’s Paper April 2007
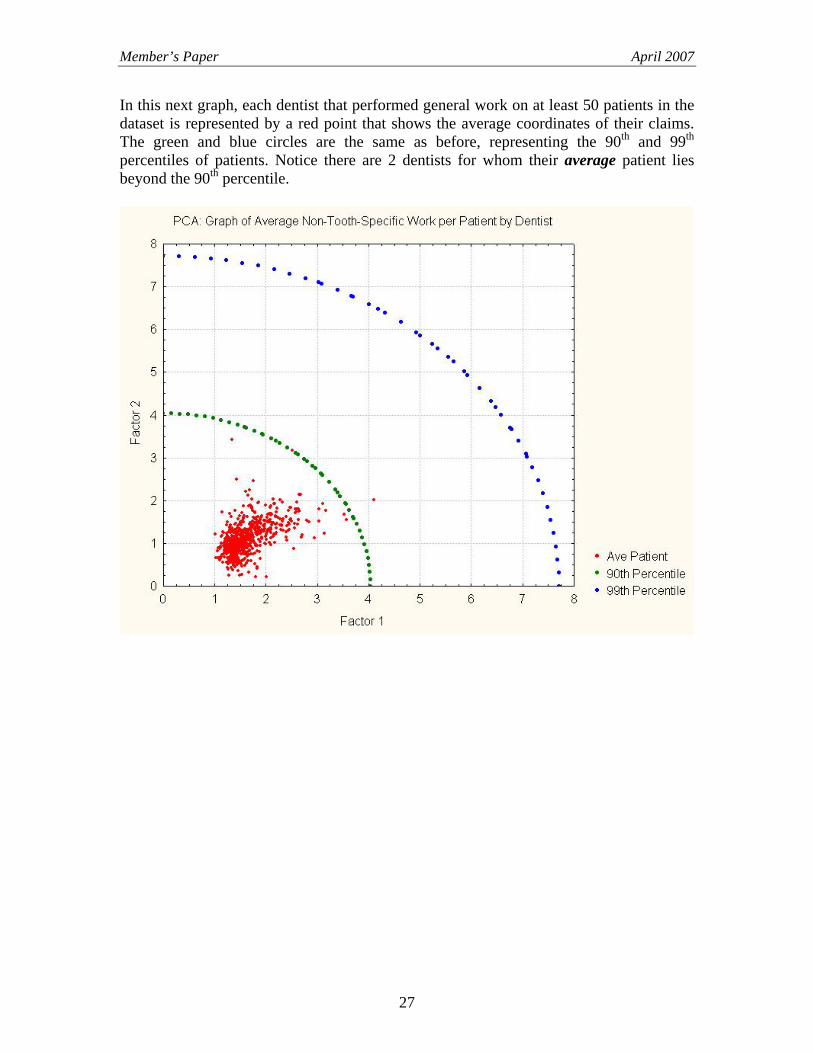
In this next graph, each dentist that performed general work on at least 50 patients in the dataset is represented by a red point that shows the average coordinates of their claims. The green and blue circles are the same as before, representing the 90th and 99th percentiles of patients. Notice there are 2 dentists for whom their average patient lies beyond the 90th percentile.
27
Member’s Paper April 2007
5. CLUSTERING ANALYSIS The objective of clustering is to allocate individual data points into groups while trying to achieve two criteria:
a) Minimize the total distance between points in the same group,
b) Maximize the distance between points in different groups.
For this analysis, we applied two different clustering techniques: K-means Clustering and Expectation-Maximization (EM) Clustering. The resulting equations for allocating claims to a group are very complex. Thus, we also applied a data mining technique to uncover simple rules to accurately – but not perfectly – understand which attributes resulted in claims being allocated to the various groups.
Clustering dental work – whether by claim, by tooth or by general procedure – is an effective way to identify potential insurance abuse. For each dentist, we can compare the proportion of work allocated to each cluster to the average across all dentists.
The next two sections will detail the results of analyzing the dental insurance data with the two clustering techniques.
6. K-MEANS CLUSTERING
Analysis by Claim The analysis by claim resulted in six clusters being formed. These clusters are approximately defined as follows:
• Cluster 1: Work performed indicative of major dental problems
• Cluster 2: Work performed indicative of moderate dental problems
• Cluster 3: Claimant age > 28.5, minor work performed
• Cluster 4: Includes procedures that may be unbundled
• Cluster 5: Minor work combined with expensive technologies
• Cluster 6: Claimant age < 28.5, minor work performed
28
Member’s Paper April 2007
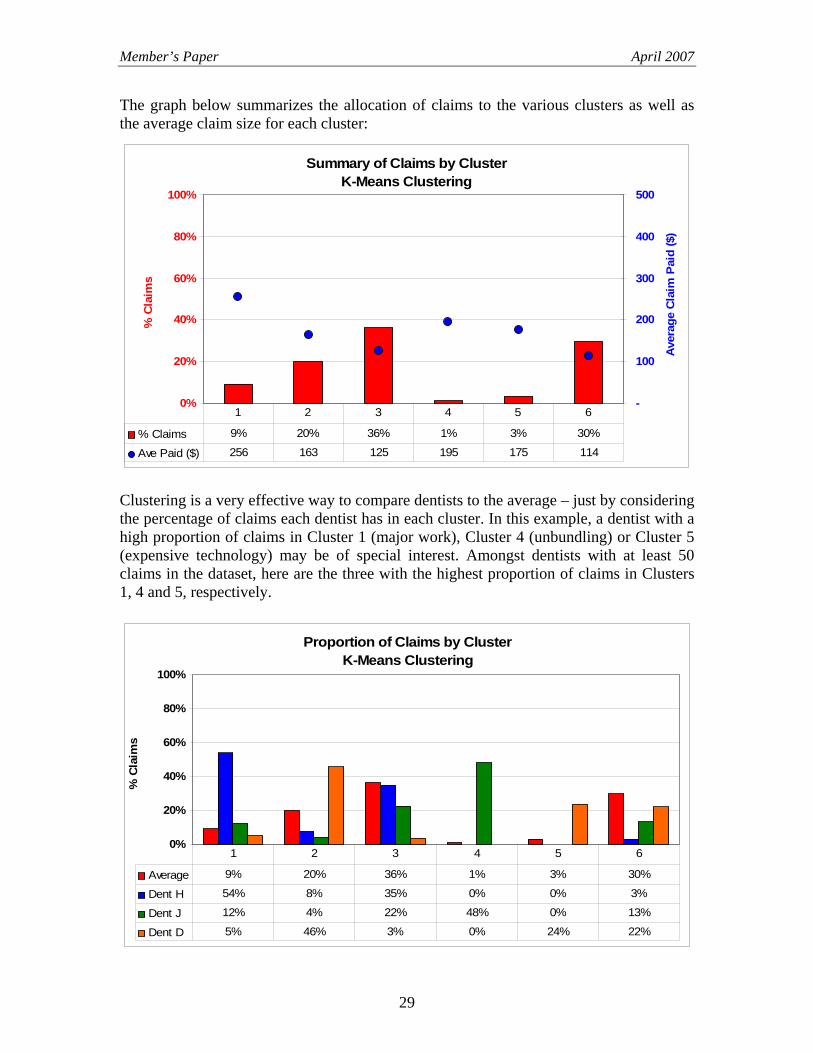
The graph below summarizes the allocation of claims to the various clusters as well as the average claim size for each cluster:
Summary of Claims by ClusterK-Means Clustering
0%
20%
40%
60%
80%
100%
% C
laim
s X
-
100
200
300
400
500
Aver
age
Cla
im P
aid
($) X
% Claims 9% 20% 36% 1% 3% 30%
Ave Paid ($) 256 163 125 195 175 114
1 2 3 4 5 6
Clustering is a very effective way to compare dentists to the average – just by considering the percentage of claims each dentist has in each cluster. In this example, a dentist with a high proportion of claims in Cluster 1 (major work), Cluster 4 (unbundling) or Cluster 5 (expensive technology) may be of special interest. Amongst dentists with at least 50 claims in the dataset, here are the three with the highest proportion of claims in Clusters 1, 4 and 5, respectively.
Proportion of Claims by ClusterK-Means Clustering
0%
20%
40%
60%
80%
100%
% C
laim
s X
Average 9% 20% 36% 1% 3% 30%
Dent H 54% 8% 35% 0% 0% 3%
Dent J 12% 4% 22% 48% 0% 13%
Dent D 5% 46% 3% 0% 24% 22%
1 2 3 4 5 6
29
Member’s Paper April 2007
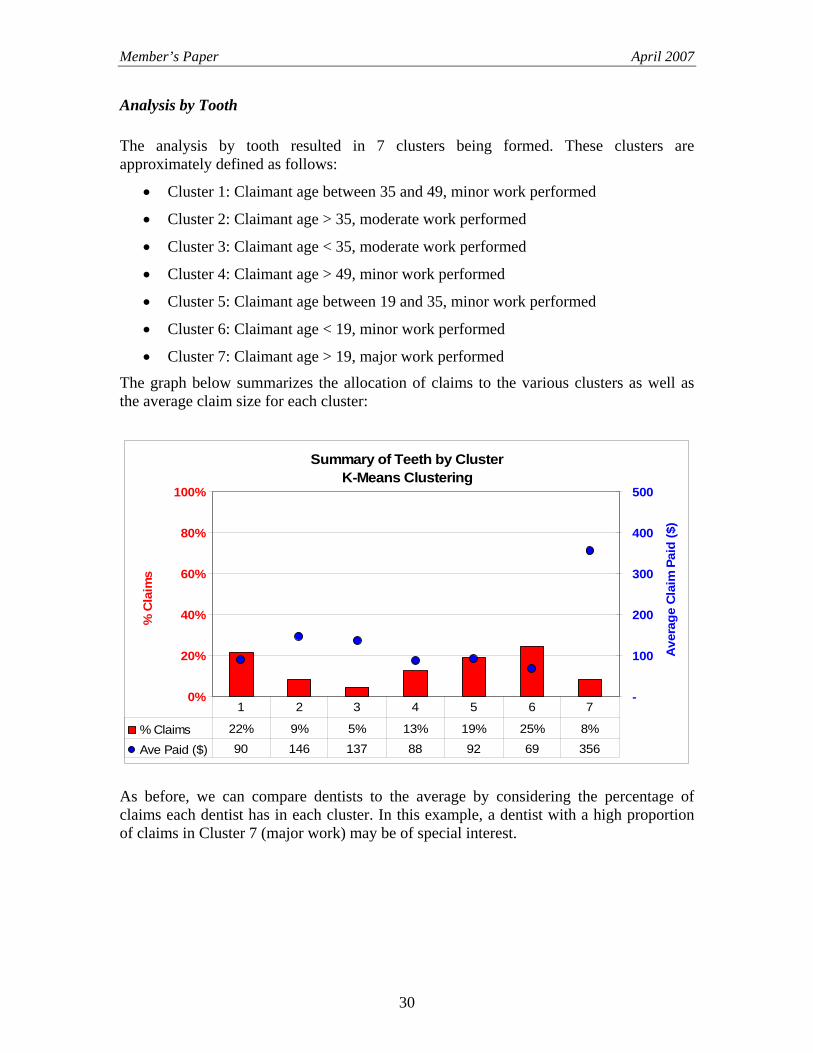
Analysis by Tooth The analysis by tooth resulted in 7 clusters being formed. These clusters are approximately defined as follows:
• Cluster 1: Claimant age between 35 and 49, minor work performed
• Cluster 2: Claimant age > 35, moderate work performed
• Cluster 3: Claimant age < 35, moderate work performed
• Cluster 4: Claimant age > 49, minor work performed
• Cluster 5: Claimant age between 19 and 35, minor work performed
• Cluster 6: Claimant age < 19, minor work performed
• Cluster 7: Claimant age > 19, major work performed
The graph below summarizes the allocation of claims to the various clusters as well as the average claim size for each cluster:
Summary of Teeth by ClusterK-Means Clustering
0%
20%
40%
60%
80%
100%
% C
laim
s X
-
100
200
300
400
500
Ave
rage
Cla
im P
aid
($) X
% Claims 22% 9% 5% 13% 19% 25% 8%
Ave Paid ($) 90 146 137 88 92 69 356
1 2 3 4 5 6 7
As before, we can compare dentists to the average by considering the percentage of claims each dentist has in each cluster. In this example, a dentist with a high proportion of claims in Cluster 7 (major work) may be of special interest.
30
Member’s Paper April 2007
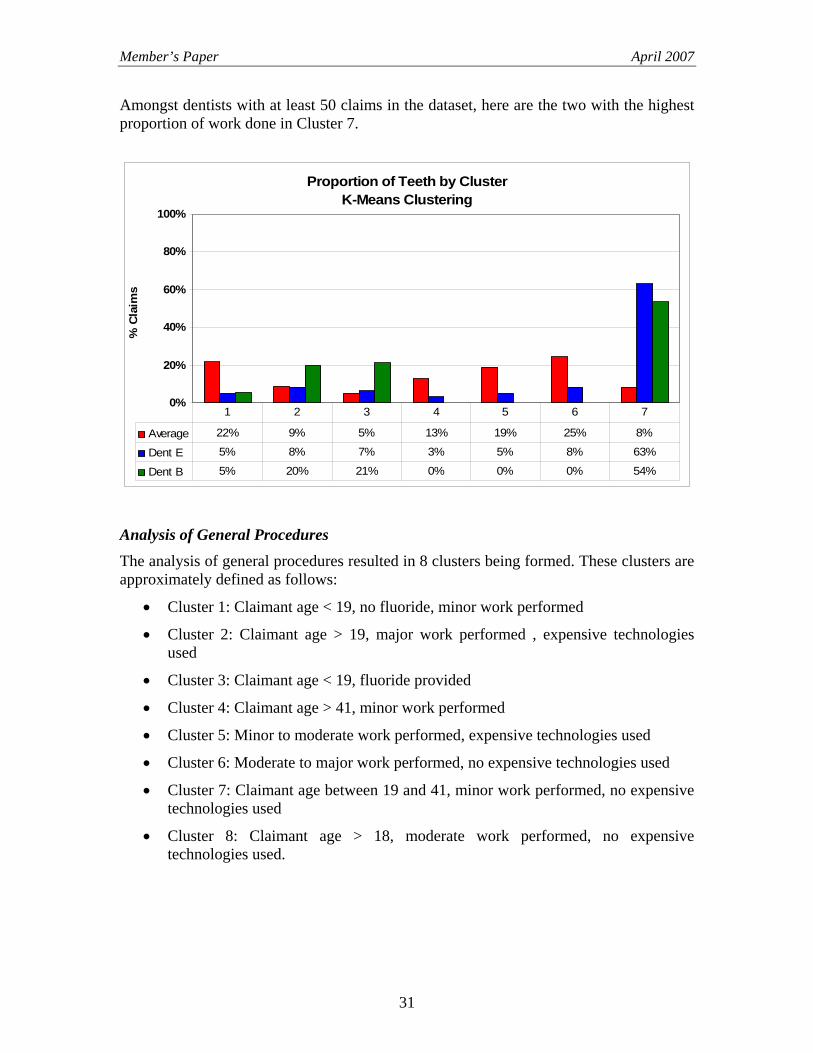
Amongst dentists with at least 50 claims in the dataset, here are the two with the highest proportion of work done in Cluster 7.
Proportion of Teeth by ClusterK-Means Clustering
0%
20%
40%
60%
80%
100%
% C
laim
s X
Average 22% 9% 5% 13% 19% 25% 8%
Dent E 5% 8% 7% 3% 5% 8% 63%
Dent B 5% 20% 21% 0% 0% 0% 54%
1 2 3 4 5 6 7
Analysis of General Procedures The analysis of general procedures resulted in 8 clusters being formed. These clusters are approximately defined as follows:
• Cluster 1: Claimant age < 19, no fluoride, minor work performed
• Cluster 2: Claimant age > 19, major work performed , expensive technologies used
• Cluster 3: Claimant age < 19, fluoride provided
• Cluster 4: Claimant age > 41, minor work performed
• Cluster 5: Minor to moderate work performed, expensive technologies used
• Cluster 6: Moderate to major work performed, no expensive technologies used
• Cluster 7: Claimant age between 19 and 41, minor work performed, no expensive technologies used
• Cluster 8: Claimant age > 18, moderate work performed, no expensive technologies used.
31
Member’s Paper April 2007
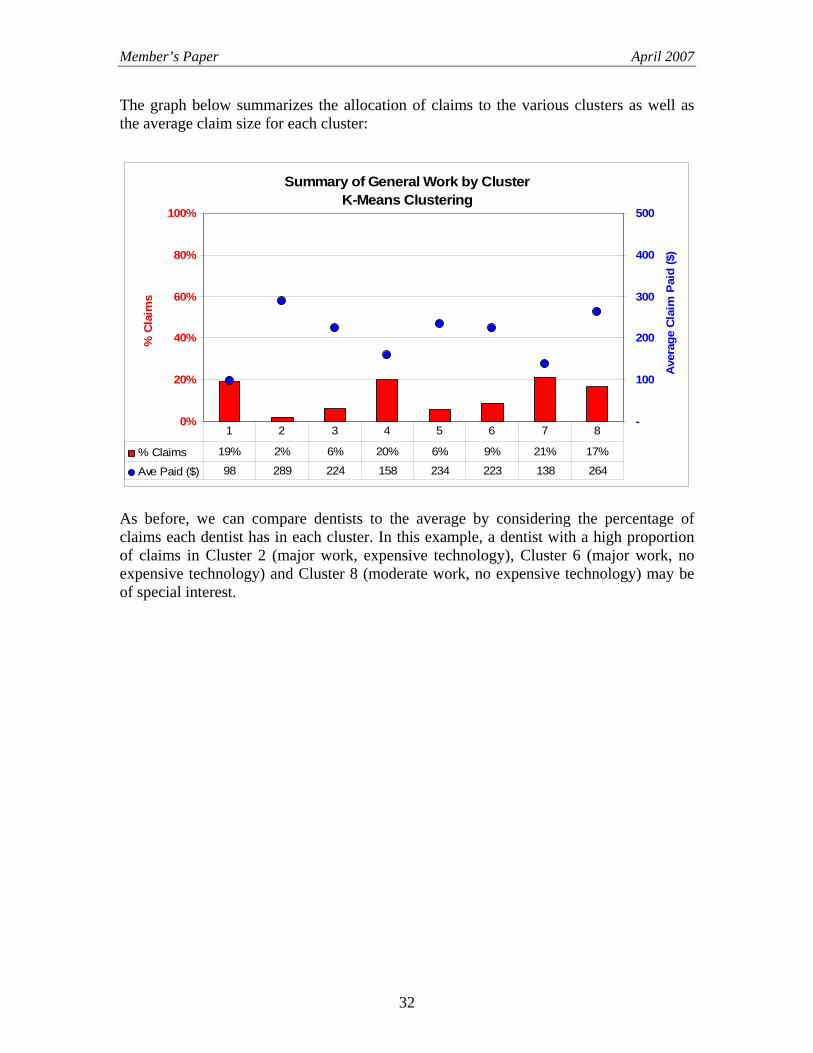
The graph below summarizes the allocation of claims to the various clusters as well as the average claim size for each cluster:
Summary of General Work by ClusterK-Means Clustering
0%
20%
40%
60%
80%
100%
% C
laim
s X
-
100
200
300
400
500
Aver
age
Cla
im P
aid
($)
X
% Claims 19% 2% 6% 20% 6% 9% 21% 17%
Ave Paid ($) 98 289 224 158 234 223 138 264
1 2 3 4 5 6 7 8
As before, we can compare dentists to the average by considering the percentage of claims each dentist has in each cluster. In this example, a dentist with a high proportion of claims in Cluster 2 (major work, expensive technology), Cluster 6 (major work, no expensive technology) and Cluster 8 (moderate work, no expensive technology) may be of special interest.
32
Member’s Paper April 2007
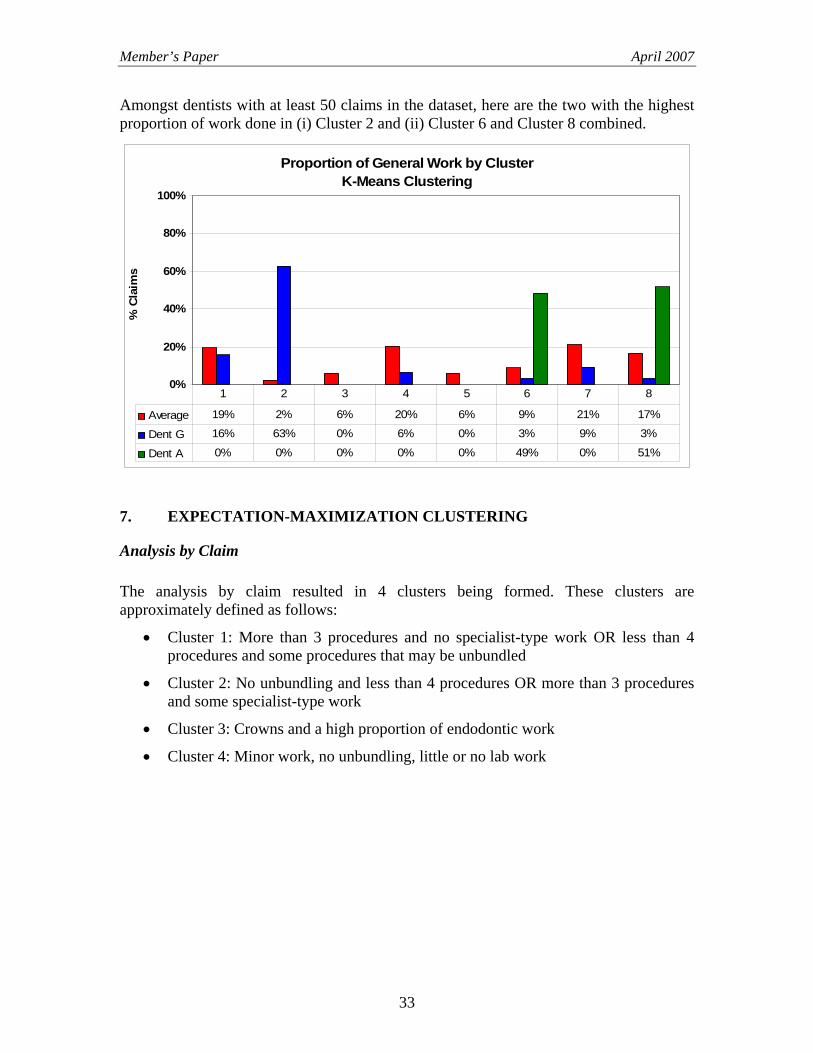
Amongst dentists with at least 50 claims in the dataset, here are the two with the highest proportion of work done in (i) Cluster 2 and (ii) Cluster 6 and Cluster 8 combined.
Proportion of General Work by ClusterK-Means Clustering
0%
20%
40%
60%
80%
100%
% C
laim
s X
Average 19% 2% 6% 20% 6% 9% 21% 17%
Dent G 16% 63% 0% 6% 0% 3% 9% 3%
Dent A 0% 0% 0% 0% 0% 49% 0% 51%
1 2 3 4 5 6 7 8
7. EXPECTATION-MAXIMIZATION CLUSTERING
Analysis by Claim The analysis by claim resulted in 4 clusters being formed. These clusters are approximately defined as follows:
• Cluster 1: More than 3 procedures and no specialist-type work OR less than 4 procedures and some procedures that may be unbundled
• Cluster 2: No unbundling and less than 4 procedures OR more than 3 procedures and some specialist-type work
• Cluster 3: Crowns and a high proportion of endodontic work
• Cluster 4: Minor work, no unbundling, little or no lab work
33
Member’s Paper April 2007
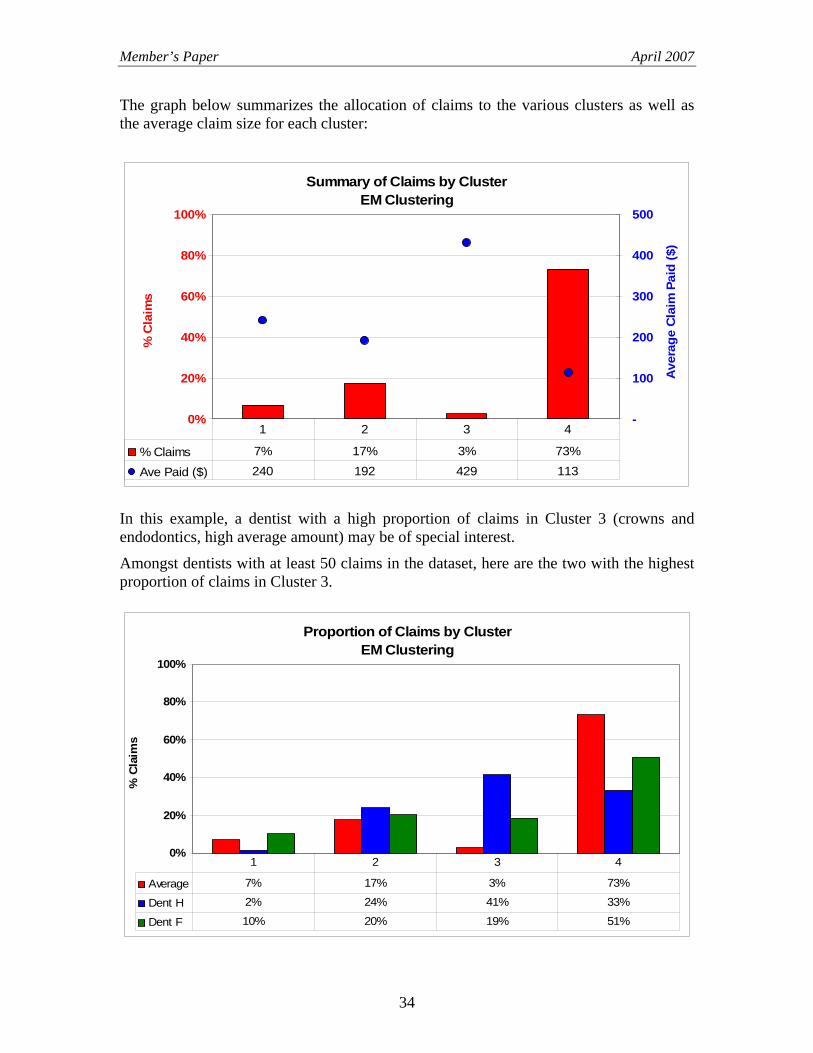
The graph below summarizes the allocation of claims to the various clusters as well as the average claim size for each cluster:
Summary of Claims by ClusterEM Clustering
0%
20%
40%
60%
80%
100%
% C
laim
s X
-
100
200
300
400
500
Ave
rage
Cla
im P
aid
($) X
% Claims 7% 17% 3% 73%
Ave Paid ($) 240 192 429 113
1 2 3 4
In this example, a dentist with a high proportion of claims in Cluster 3 (crowns and endodontics, high average amount) may be of special interest.
Amongst dentists with at least 50 claims in the dataset, here are the two with the highest proportion of claims in Cluster 3.
Proportion of Claims by ClusterEM Clustering
0%
20%
40%
60%
80%
100%
% C
laim
s X
Average 7% 17% 3% 73%
Dent H 2% 24% 41% 33%
Dent F 10% 20% 19% 51%
1 2 3 4
34
Member’s Paper April 2007
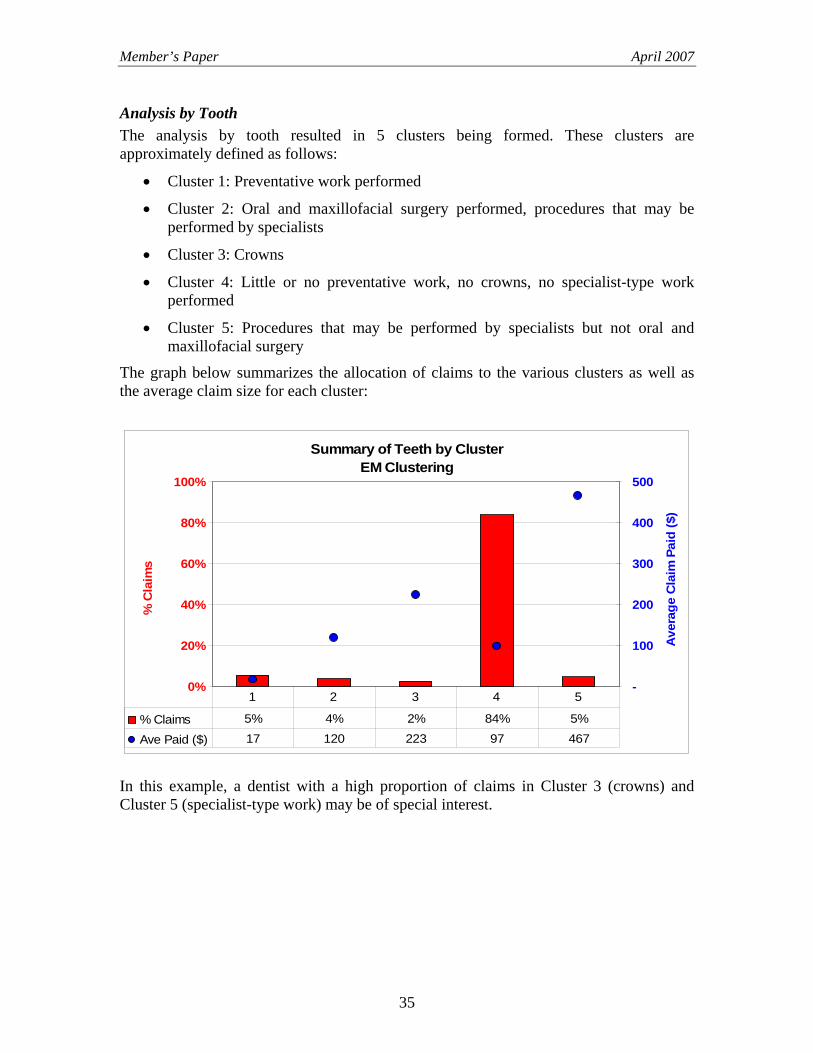
Analysis by Tooth The analysis by tooth resulted in 5 clusters being formed. These clusters are approximately defined as follows:
• Cluster 1: Preventative work performed
• Cluster 2: Oral and maxillofacial surgery performed, procedures that may be performed by specialists
• Cluster 3: Crowns
• Cluster 4: Little or no preventative work, no crowns, no specialist-type work performed
• Cluster 5: Procedures that may be performed by specialists but not oral and maxillofacial surgery
The graph below summarizes the allocation of claims to the various clusters as well as the average claim size for each cluster:
Summary of Teeth by ClusterEM Clustering
0%
20%
40%
60%
80%
100%
% C
laim
s X
-
100
200
300
400
500
Ave
rage
Cla
im P
aid
($) X
% Claims 5% 4% 2% 84% 5%
Ave Paid ($) 17 120 223 97 467
1 2 3 4 5
In this example, a dentist with a high proportion of claims in Cluster 3 (crowns) and Cluster 5 (specialist-type work) may be of special interest.
35
Member’s Paper April 2007
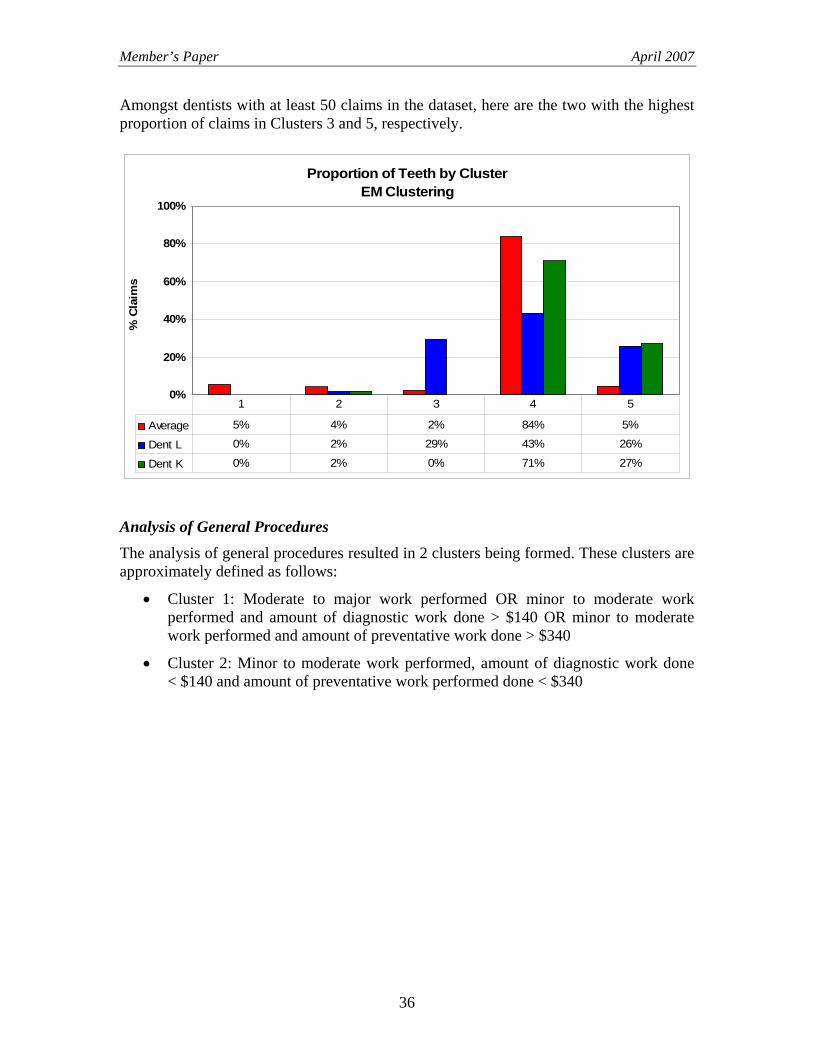
Amongst dentists with at least 50 claims in the dataset, here are the two with the highest proportion of claims in Clusters 3 and 5, respectively.
Proportion of Teeth by ClusterEM Clustering
0%
20%
40%
60%
80%
100%
% C
laim
s X
Average 5% 4% 2% 84% 5%
Dent L 0% 2% 29% 43% 26%
Dent K 0% 2% 0% 71% 27%
1 2 3 4 5
Analysis of General Procedures The analysis of general procedures resulted in 2 clusters being formed. These clusters are approximately defined as follows:
• Cluster 1: Moderate to major work performed OR minor to moderate work performed and amount of diagnostic work done > $140 OR minor to moderate work performed and amount of preventative work done > $340
• Cluster 2: Minor to moderate work performed, amount of diagnostic work done < $140 and amount of preventative work performed done < $340
36
Member’s Paper April 2007
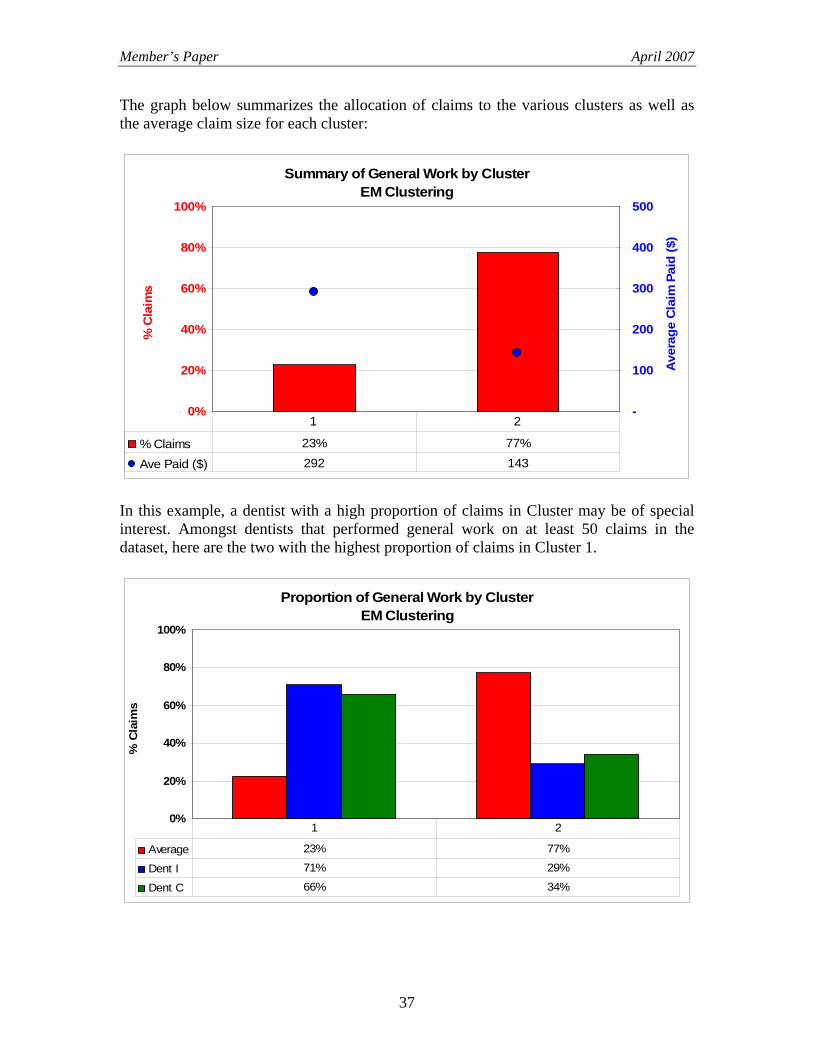
The graph below summarizes the allocation of claims to the various clusters as well as the average claim size for each cluster:
Summary of General Work by ClusterEM Clustering
0%
20%
40%
60%
80%
100%
% C
laim
s X
-
100
200
300
400
500
Ave
rage
Cla
im P
aid
($) X
% Claims 23% 77%
Ave Paid ($) 292 143
1 2
In this example, a dentist with a high proportion of claims in Cluster may be of special interest. Amongst dentists that performed general work on at least 50 claims in the dataset, here are the two with the highest proportion of claims in Cluster 1.
Proportion of General Work by ClusterEM Clustering
0%
20%
40%
60%
80%
100%
% C
laim
s X
Average 23% 77%
Dent I 71% 29%
Dent C 66% 34%
1 2
37
Member’s Paper April 2007
APPENDIX A
METHODOLOGY FOR CLASSIFYING DENTISTS AS ATYPICAL The analytic techniques applied to the Life Insurance Company’s dental insurance data allowed us to measure by how much the work of specific dentists differed from the norm. An important question to address is: How many dentists are atypical, and how much is the dollar exposure to these dentists?
For the principal components analyses, we have defined as atypical any dentist for which the average of his / her work is beyond the 90th percentile of all work by all dentists. For the clustering analyses, we have defined as atypical any practitioner whose distribution of claims differs from the average by at least two standard deviations.
In all cases, we only considered dentists with at least 50 claims/teeth worked on/patients, to ensure credible data.
38


![J NN#=8 ];J =` Jg · §§ UI claims may exceeed the number of jobs in the geographical area. First and foremost, the UI claims are still preliminary data the initial assignment of](https://img.dokumen.tips/doc/110x75/5f1167d0c7555a2ac7791581/j-nn8-j-jg-ui-claims-may-exceeed-the-number-of-jobs-in-the-geographical.jpg)