Embed Size (px)
Citation preview

Preferred sensor sites for surface EMG signal decomposition
This article has been downloaded from IOPscience. Please scroll down to see the full text article.
2012 Physiol. Meas. 33 195
(http://iopscience.iop.org/0967-3334/33/2/195)
Download details:
IP Address: 89.202.245.164
The article was downloaded on 09/02/2012 at 14:55
Please note that terms and conditions apply.
View the table of contents for this issue, or go to the journal homepage for more
Home Search Collections Journals About Contact us My IOPscience

IOP PUBLISHING PHYSIOLOGICAL MEASUREMENT
Physiol. Meas. 33 (2012) 195–206 doi:10.1088/0967-3334/33/2/195
Preferred sensor sites for surface EMG signaldecomposition
Farah Zaheer1,2,5, Serge H Roy1,2 and Carlo J De Luca1,3,4
1 NeuroMuscular Research Center, Boston University, Boston, MA 02215, USA2 Sargent College of Health and Rehabilitation Sciences, Boston University, Boston, MA 02215,USA3 Department of Biomedical Engineering, Boston University, Boston, MA 02215, USA4 Department of Electrical and Computer Engineering, Boston University, Boston, MA 02215,USA
E-mail: [email protected]
Received 21 July 2011, accepted for publication 28 November 2011Published 20 January 2012Online at stacks.iop.org/PM/33/195
AbstractTechnologies for decomposing the electromyographic (EMG) signal into itsconstituent motor unit action potential trains have become more practicalby the advent of a non-invasive methodology using surface EMG (sEMG)sensors placed on the skin above the muscle of interest (De Luca et al2006 J. Neurophysiol. 96 1646–57 and Nawab et al 2010 Clin. Neurophysiol.121 1602–15). This advancement has widespread appeal among researchersand clinicians because of the ease of use, reduced risk of infection, and thegreater number of motor unit action potential trains obtained compared toneedle sensor techniques. In this study we investigated the influence of thesensor site on the number of identified motor unit action potential trains insix lower limb muscles and one upper limb muscle with the intent of locatingpreferred sensor sites that provided the greatest number of decomposed motorunit action potential trains, or motor unit yield. Sensor sites rendered varyingmotor unit yields throughout the surface of a muscle. The preferred sites werelocated between the center and the tendinous areas of the muscle. The motorunit yield was positively correlated with the signal-to-noise ratio of the detectedsEMG. The signal-to-noise ratio was inversely related to the thickness of thetissue between the sensor and the muscle fibers. A signal-to-noise ratio of 3was found to be the minimum required to obtain a reliable motor unit yield.
Keywords: sEMG signal decomposition, sEMG sensor, motor units, motor unitaction potential train
(Some figures may appear in colour only in the online journal)
5 Author to whom any correspondence should be addressed.
0967-3334/12/020195+12$33.00 © 2012 Institute of Physics and Engineering in Medicine Printed in the UK & the USA 195

196 F Zaheer et al
1. Introduction
Over the past several decades, methodologies for decomposing the electromyographic (EMG)signal into its constituent motor unit action potential trains (MUAPTs) have predominantlyrelied upon the use of a needle sensor inserted into the muscle of interest to record the EMGsignals (LeFever and De Luca 1982, Nawab et al 2008). Drawbacks of this technology, relatedto the invasiveness of the procedures and limited motor unit (MU) yields, have prompteda number of researchers to seek a non-invasive alternative (Holobar et al 2009, Merlettiet al 2009, Gazzoni et al 2004). These prior attempts have been minimally effective towarda non-invasive surface EMG solution because of relatively low motor unit yields (3–6 MUs)and low force level contractions (∼5–9% of maximal voluntary contraction, MVC). However,recent developments by De Luca et al (2006) and Nawab et al (2010) have advanced thestate of the art to achieve a non-invasive technology (figure 1) that produces high MU yields(typically 30–40) with high accuracies (>95%) over the full force range (0–100% MVC) froma wide variety of superficial muscles.
The algorithm identifies the individual action potentials within the sEMG signals andallocates them to individual MUAPTs. This operation is presently done with a measuredaccuracy averaging 95.2% and at times reaching 100% (for details see Nawab et al (2010),and the appendix of De Luca and Hostage (2010)). Presently, the technology is able toidentify the firings of 30–40 MUs (occasionally surpassing 50) from sEMG signals obtainedduring isometric constant-force contractions. An example of the decomposed sEMG signal ispresented in figure 2. The top panel shows one of the four channels of the sEMG signal alongwith the firing instances of 34 MUs. An expanded view of 6 MUAPTs (# 26–31) is shown onthe right side. The action potential shape of each of the MUs is displayed near the left axis.The dark line represents the force produced by the subject.
Currently there are no guidelines for locating the surface sensor specifically for motor unitdecomposition studies. However, we have observed that the site of the sensor on the musclesurface influences the number of MUAPTs that are identified by the decomposition algorithm.The present study was undertaken to systematically quantify these observations. Furthermore,we investigated whether the skinfold thickness, and its relationship to signal quality, influencesthe MU yield.
2. Methods
2.1. Subjects
Four neurologically healthy subjects, aged 18–22 years (mean = 21, SD = ± 1.89),volunteered for the study. The body mass index for the subjects ranged from 21.9 to 24(mean = 22.8); all were within normal limits (Cole 1991). All subjects read and signed aninformed consent form approved by the Institutional Review Board of Boston University priorto their participation.
2.2. Muscles
The following skeletal muscles in each subject were tested: Biceps Brachii (BB), VastusLateralis (VL), Rectus Femoris (RF), Hamstrings (HS) group, Gastrocnemius (GS), Soleus(SL) and Tibialis Anterior (TA) muscles. No distinction was made between the Semitendinosis,Semimembranosis and the Biceps Femoris muscle compartments of the HS group. The BB,GS and HS muscles were considered as individual medial and lateral sections. The muscles

Sensor Sites for surface EMG decomposition 197
Figure 1. The sEMG sensor, the signal acquisition and amplification unit and a PC loaded withthe decomposition algorithm are shown. The pins on the sEMG sensor are 1.25 mm long andapproximately 0.57 mm in diameter; four of which are located at the corner of a 5 mm2, and onein the center of the square.
were selected because they provide examples of superficial limb muscles with a relativelylarge area for sensor placement, and because they are overlaid with varying amounts of fattytissue.
2.3. Sensor sites
In previous pilot observations in our laboratory, a substantial region covering the entire musclebelly had been sampled with the surface sensor electrode for each muscle. The decompositionresults from these observations guided the selection of the final candidate sites to be sampledsystematically in the present study. The dominant factor in the site selection for each musclewas to focus primarily on those areas that had the relatively richer MU yields. The sensor siteswere furthermore chosen to attain a balance between the available area of the muscle belly, thesize of the surface sensor itself and the limitation on the total number of sensor sites that couldbe assayed without introducing fatigue. Therefore, the total number of sites usually rangedfrom 10 to 12 per muscle.
A rectangular template whose length approximated the borders of the myo-tendinousregions of the muscle, and whose width approximated the lateral margins of the muscle belly(figure 3) was drawn on each muscle. The location of the tendinous junction and the widthof the muscle were confirmed by palpation. For the SL muscle, the surface area available fortesting was in the form of a V. The sensors for this muscle were placed linearly along theexposed surfaces directly beneath the gastrocnemius muscle.
2.4. EMG signal acquisition
The skin surface was debrided using multiple applications of a hypoallergenic tape and was thenwiped with an isopropanol alcohol prep pad. This procedure improved the quality of electricalcontact between the pins of the sensor and the skin. The sensor was attached to the skin at adesignated sensor site. A 4 cm diameter adhesive gel reference electrode (Dermatrode R©) wasplaced on a bony region on either the elbow or the kneecap. The procedure for acquiring thesignal is described by De Luca et al (2006). Briefly, sEMG signals from the four differentialpairs of the sensor array were band-pass filtered at 20 Hz (12 dB/octave) to 1750 Hz(24 dB/octave) and digitized with 16-bit resolution at a sampling rate of 20 kHz. The forcedata were band-pass filtered from DC-550 Hz and sampled at the same rate as the sEMGsignal.

198 F Zaheer et al
Raw sEMG signal
Expanded View
100 ms
12345678910111213141516171819202122232425262728293031323334
2 4 6 8 10 12 14 16Time (s)
00
10
20
30
40
Fo
rce
( %M
VC
)Figure 2. The raw sEMG signal on the top represents one of the four channels of differentiallydetected signal from a pair of pins on the sensor. Below the signal is an expanded epoch to show thecomplexity of the signal. The signal was acquired during an isometric constant force contractionat 40% MVC from the HS muscle. The force produced by the muscle is shown as a dark blackline. The bars represent the firing times of the action potentials from 34 motor units identified bythe decomposition algorithm. The frame on the left shows a time scale expanded view of the firinginstances. The waveforms on the left represent the action potentials from each of the motor units.
2.5. Test procedure
A protocol was designed to acquire sEMG signals from each of the sensor sites according toa randomized sampling procedure, in order to negate the possible influence of muscle fatigueon MU activity. The subject was positioned in a custom chair (Adam and De Luca 2003) fortesting the lower limb muscles. The lower limb was fixed so that designated isometric kneeor ankle forces could be maintained against a load cell, either during joint extension (such asfor testing the VL, RF and TA muscles) or flexion (such as for testing the HS, GS, and SLmuscles). The hip and ankle joints were fixed at 90◦ while the knee angle was varied dependingon the test muscle to be sampled (120◦ for the RF, VL, TA and SL muscles; 110◦ for the HSmuscle; and 180◦ for the GS muscle). For the BB muscle, an adjustable strap attached to aload cell was held by the subject in the supinated hand position, with the length of the strapadjusted to maintain 90◦ of elbow flexion.

Sensor Sites for surface EMG decomposition 199
In order to compare force levels across subjects, the MVC was obtained for each subjectby requesting that they contract the test muscle as forcefully as possible. These contractionswere repeated three times for each muscle, with a 3 min rest between the contractions. Thegreatest value was taken as the MVC level. All subsequent contractions for each subject werereferenced to this value. Executing an MVC is an unfamiliar task; hence the subjects wererequired to practice the MVC and force trajectory tracking tasks on a separate day prior to thedata collection experiments.
The sensor was placed on one of the candidate sensor sites of the muscle grid. The subjectswere asked to track a trapezoidal force trajectory that consisted of an initial 10% MVC/s rampto a 40% MVC plateau that was sustained for 10 s followed by a downward ramp at 10%MVC/s. The subjects used visual force feedback from a display monitor to comply with thetask. A 40% MVC level was specified because it provided substantial recruitment of MUswithout fatiguing the subject. A sample force trajectory may be seen in figure 2. The sensorwas moved to another site on the muscle template and the protocol was repeated. This processwas repeated until all the candidate sensor sites on the muscle had been sampled. At the end ofthe experiments, the tissue thickness at each of the sensor sites was measured according to theprocedure described by Edwards (1954). The skin and subcutaneous tissue at each test site waslifted by pinching it with the thumb and the index finger and measuring the thickness usinga spring-loaded caliper (SAEHAN Medical Skinfold Caliper Model # SH5020) positioned atthe center of the folded skin.
2.6. Data analysis
Task compliance for the force trajectory was assessed by calculating the root-mean-squaredvalue of the difference between the force produced by the subject and the target force levelduring the plateau region. This error amplitude was expressed as a percentage of the MVClevel for normalization across subjects. A maximum deviation of ± 1% MVC was allowed.Only data from trials that met the task compliance requirements were subsequently analyzed.A total of 304 files were decomposed using the algorithm described by Nawab et al (2010). Asample decomposition result is shown in figure 2, where the firings of 34 distinct MUs wereidentified. This is the MU yield which was obtained for each sensor site of each muscle. Inorder to determine the degree of MU yield throughout the various sensor sites within eachmuscle, the MU yields were normalized with respect to the greatest MU yield from all thecontractions of that test muscle, and then averaged across all subjects. Hence, the normalizedMU yields ranged from 0 to 1 in all muscles. The signal-to-noise ratio (SNR) at each site wascomputed as the ratio of the root-mean-squared sEMG signal in a 3 s epoch from the constantforce region to that of a 3 s signal from the baseline at 0% MVC. An epoch of 3 s provides anadequate window of time because both the sEMG signal and the baseline noise are stationarysignals.
3. Results
A total of 4120 MUAPTs were obtained from 304 contractions from seven muscles derivedfrom n = 4 subjects.
3.1. Preferred sensor sites
Table 1 reports the range of MU yields for each subject by muscle. The MU yield from thevarious muscles ranged anywhere from 3 to 40 with a particularly restricted range obtained in

200 F Zaheer et al
(a)
(b)
(c)
(d)
(f) (g)
(e)
Figure 3. The seven tested muscles are topographically mapped by the normalized MU yield persensor site (see section 3.1) with increasing circle sizes reflecting greater yields indicated by thescale below. The average skinfold thickness is indicated by the hue of the color as indicated inthe scale below. The values for each muscle are as follows: (a) Vastus lateralis: The normalizedMU yield ranges from 0.3 to 0.9 and the skinfold ranges from 4 to 12.6 mm. (b) Rectus femoris:The normalized MU yield ranges from 0.3 to 0.8 and the skinfold ranges from 5.9 to 12.4 mm. (c)Tibialis anterior: The normalized MU yield ranges from 0.4 to 1 and the skinfold ranges from 3.3 to6.7 mm. (d) Hamstrings medial: The normalized MU yield ranges from 0.4 to 0.9 and the skinfoldranges from 7.8 to 11.5 mm. Hamstrings lateral: The normalized MU yield ranges from 0.5 to 0.9and the skinfold ranges from 6.4 to 12.5 mm. (e) Gastrocnemius medial: The normalized MU yieldranges from 0.3 to 0.9 and the skinfold ranges from 6 to 12.6 mm. Gastrocnemius lateral: Thenormalized MU yield ranges from 0.3 to 1 and the skinfold ranges from 6 to 12 mm. (f) Soleus:The normalized MU yield ranges from 0.2 to 0.9 and the skinfold ranges from 5.4 to 9 mm.(g) Biceps brachii medial: The normalized MU yield ranges from 0.7 to 1 and the skinfold rangesfrom 3.1 to 6.7 mm. Biceps brachii lateral: The normalized MU yield ranges from 0.6 to 0.9 andthe skinfold ranges from 3.3 to 8.5 mm.
the gastrocnemius muscles. The values of the normalized MU yields for each site on all themuscles are plotted in figure 3. The radius of the circle on each site represents the normalizedMU yield, with values ranging from 0.2 to 1. The shade of color in the circle is proportionalto the average skinfold thickness of that site, with darker shades representing greater skinfoldthicknesses. The skinfold color scale ranges from 3.1 to 12.6 mm.

Sensor Sites for surface EMG decomposition 201
Table 1. The MU range in each muscle for each subject is reported.
Muscle Subj 1 Subj 2 Subj 3 Subj 4
Vastus lateralis 7–11 15–26 3–30 5–25Rectus femoris 3–15 6–20 7–30 10–39Tibialis anterior 11–32 6–28 8–35 10–35Soleus 3–22 3–14 5–25 6–17Hamstrings medial 14–34 3–31 14–28 14–29Hamstrings lateralis 20–25 17–28 5–28 5–15Gastrocnemius medial 5–6 3–16 3–15 5–23Gastrocnemius lateral 5–12 3–9 5–15 3–18Biceps brachii medial 18–40 12–28 25–35 14–33Biceps brachii lateral 17–34 3–24 19–34 4–27
Table 2. Landmarks for the preferred sensor sites are referenced from the center of the musclebelly. (In the SL muscle, due to the nonrectangular asymmetrical V shape, the sensor site labeledas ‘center’ was used as the origin.)
Muscle Preferred site
Vastus lateralis 2/3 Distal from the centerRectus femoris 1/3 Distal-lateral from the centerTibialis anterior 1/3 Distal from the centerSoleus Distal end from the centerHamstrings medial 2/3 Proximal from the centerHamstrings lateralis 1/3 Distal from the centerGastrocnemius medial Distal end from the centerGastrocnemius lateral 2/3 Proximal from the centerBiceps brachii medial Proximal end from the centerBiceps brachii lateralis 1/2 Distal from the center
The normalized MU yield was site dependent for all the muscles and the range washigher for the VL, GS (both lateral and medial heads), SL and TA muscles compared to theHS, RF and BB muscles. The HS, RF and BB muscles had several sensor sites with similarnormalized MU yield. Sites corresponding to the highest normalized MU yield in each muscleare indicated with an ‘X’ symbol and are referred to as preferred sensor sites (table 2). Forexample, in the VL muscle (figure 3(a)), the preferred site was identified at approximatelytwo-thirds the distance from the center of the muscle belly toward the distal tendon. The MUyield ranged from 3 to 30 across all subjects in this muscle. The highest yielding sensor sitesfor the RF and TA muscles were also located in the distal portions of the muscle, as shownin figures 3(b) and (c). In the GS muscle, there was a contrasting distribution of normalizedMU yield for the two separate heads. The medial GS had its preferred site in the most distalportion of the muscle, whereas for the lateral head it was near the proximal end (figure 3(e)).MU yield was also studied separately for each of the two heads of the BB and the HS muscles.For the medial heads of these muscles, the preferred site was located in the proximal portionsof the muscle, whereas for the lateral head of the BB and HS it was distally located at 1/2 and1/3 of the way from the center of the muscle respectively (figures 3(d) and (g)). The preferredsite for the SL muscle was also located in the distal portion of the muscle as illustrated infigure 3(f). A few muscles such as the VL, RF, medial BB and lateral HS muscles in facthad several adjacent sensor sites with similar normalized MU yields constituting a preferredregion as opposed to just one site.
202 F Zaheer et al
(a) (b) (c) (d)
(e) (f) (g) (h)
(i) (j)
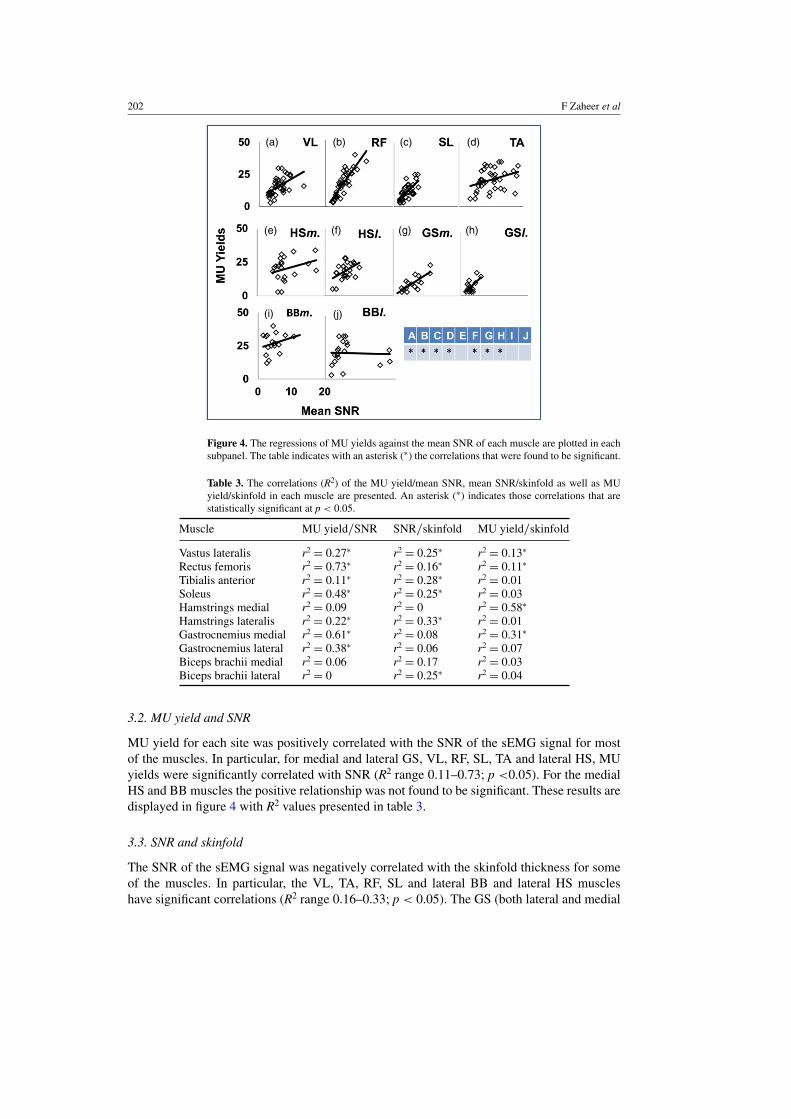
Figure 4. The regressions of MU yields against the mean SNR of each muscle are plotted in eachsubpanel. The table indicates with an asterisk (∗) the correlations that were found to be significant.
Table 3. The correlations (R2) of the MU yield/mean SNR, mean SNR/skinfold as well as MUyield/skinfold in each muscle are presented. An asterisk (∗) indicates those correlations that arestatistically significant at p < 0.05.
Muscle MU yield/SNR SNR/skinfold MU yield/skinfold
Vastus lateralis r2 = 0.27∗ r2 = 0.25∗ r2 = 0.13∗
Rectus femoris r2 = 0.73∗ r2 = 0.16∗ r2 = 0.11∗
Tibialis anterior r2 = 0.11∗ r2 = 0.28∗ r2 = 0.01Soleus r2 = 0.48∗ r2 = 0.25∗ r2 = 0.03Hamstrings medial r2 = 0.09 r2 = 0 r2 = 0.58∗
Hamstrings lateralis r2 = 0.22∗ r2 = 0.33∗ r2 = 0.01Gastrocnemius medial r2 = 0.61∗ r2 = 0.08 r2 = 0.31∗
Gastrocnemius lateral r2 = 0.38∗ r2 = 0.06 r2 = 0.07Biceps brachii medial r2 = 0.06 r2 = 0.17 r2 = 0.03Biceps brachii lateral r2 = 0 r2 = 0.25∗ r2 = 0.04
3.2. MU yield and SNR
MU yield for each site was positively correlated with the SNR of the sEMG signal for mostof the muscles. In particular, for medial and lateral GS, VL, RF, SL, TA and lateral HS, MUyields were significantly correlated with SNR (R2 range 0.11–0.73; p <0.05). For the medialHS and BB muscles the positive relationship was not found to be significant. These results aredisplayed in figure 4 with R2 values presented in table 3.
3.3. SNR and skinfold
The SNR of the sEMG signal was negatively correlated with the skinfold thickness for someof the muscles. In particular, the VL, TA, RF, SL and lateral BB and lateral HS muscleshave significant correlations (R2 range 0.16–0.33; p < 0.05). The GS (both lateral and medial

Sensor Sites for surface EMG decomposition 203
(a) (b) (c) (d)
(e) (f) (g) (h)
(i) (j)
Figure 5. The regressions of the mean SNR against the skinfold thickness. Each panel containsthe data from one of the tested muscles. The table indicates the significant correlations with theasterisk (∗) at p < 0.05. See table 3 for statistics.
heads), the medial BB and medial HS muscles were also negatively correlated with skinfoldthickness, but the trend did not reach statistical significance. These results are displayed andtabulated in figure 5 and table 3.
3.4. MU yield and skinfold
The MU yield per site had only moderate negative correlations with skinfold thickness forsome of the muscles tested, as shown in figure 6 and table 3. The MU yield versus skinfoldrelationship is significant (p < 0.05) for the VL, RF, and medial GS muscles with R2 rangingbetween 0.1 and 0.31 while not reaching statistical significance in the SL, TA, medial BB andlateral GS muscles. In the VL and RF muscles localized high yield sensor sites were mostlyfound in areas with reduced skinfold thickness. This association is visually depicted by thecoloring scheme in figure 3. For example, in the VL muscle, the areas with reduced skinfoldthickness, denoted by the lighter circle colors, were associated with higher decompositionyields characterized by the larger circle areas. Similarly in the proximal regions for thismuscle where the skinfold thickness is considerably greater, the circle sizes are smaller andthey are darker in color. However, this association is not present in the HS muscle. In fact, themedial HS muscle has a significant positive correlation between skinfold thickness and MUyield. The slightly positive trend also obtained in the lateral HS and lateral BB muscles washowever not significant (p < 0.05).
4. Discussion
Our results confirm that there are preferred regions on the surface of the muscle whichprovide richer MU yields. The preferred region was located either in the proximal or the distal

204 F Zaheer et al
(a) (b) (c) (d)
(e) (f) (g) (h)
(i) (j)
Figure 6. The regressions of the MU yields against the skinfold thickness. Each panel containsthe data from one of the tested muscles. The table indicates with an asterisk (∗) the significantcorrelations. The medial HS muscle presents anomalous trend that was also significant. Seetable 3 for statistics.
portions of the muscle; typically the latter. These sites differ from preferred sensor locationsrecommended for conventional kinesiology sEMG studies using bar electrodes where theintent is to acquire global muscle activity. For those applications, the preferred sensor site isin the center of the muscle belly (De Luca 1997). The present study nonetheless confirms thatreasonable MU yields can be obtained from multiple sites on the muscle belly for sEMG MUstudies. However, certain sites are recommended for the richer MU yields as reported here.
The finding that muscles have localized regions that provide greater MU yields is likelyrelated to alterations in the sEMG signal resulting from the tissue inhomogeneity across themuscle surface, as well as the quality of electrical contact between the pins (electrodes) of thesensor and the skin. As expected, there exists a direct relationship between the MU yield andthe SNR of the sEMG signal. When more of the sEMG signal is distinguishable above thenoise level, the decomposition algorithm is more able to identify and distinguish the actionpotentials in the signal. There appears to be a minimum SNR level of 3 in the collected signalbelow which the MU yield is either poor or unreliable. An exception seen in figure 4 is thecase of the lateral BB muscle whose SNR values are in fact unevenly distributed throughoutits range.
One likely source of decreasing SNR is the presence of fatty tissue between the skin andthe surface of the muscle. The increased space acts as a low-pass filter which decreases theamplitude of the sEMG signal originating in the muscle. As expected, the association betweenSNR and skinfold was found to be negative, reaching statistical significance for most muscles.The negative relationship in the lateral GS was not significant likely due to the low range ofskinfold values in this muscle. The HS muscle is unique in the group of muscles tested inthat it has a tight layer of fascia overlying the muscle. The tautness of the fascia renders themeasurement of the skinfold difficult and unreliable. It is likely that this is the reason why the

Sensor Sites for surface EMG decomposition 205
relationship between the SNR and the skinfold in the medial HS did not reach significance.Similarly, the relationship between MU yields and skinfold was generally found to be negativefor all the muscles tested, with the sole exception of the medial HS muscle, as shown infigure 6. In the medial and lateral BB, SL, TA, lateral HS and lateral GS muscles the rangeof skinfold value was low compared to the other muscles. Consequently, their R2 values werelow, ranging from 0.01 to 0.07, and the regressions were not significant.
Although the data indicate the presence of preferred sensor sites on the muscle that wereassociated with lower skinfold thicknesses, the relationship is not completely consistent andnot statistically robust. It appears that there are other factors that influence the MU yield.The dominant among them is likely to be the muscle innervation zone. It is known that theregion in the vicinity of the innervation zones produces sEMG signals with lower amplitudes,hence lower SNR (Basmajian and De Luca 1985, Rainoldi et al 2004) due to the cancellationof the action potentials traveling in opposite directions. It has also been shown by Roy et al(1986) that the frequency spectrum of the sEMG signal detected near the innervation zone hasmore higher frequency components. These are due to the more complex action potentials thatare present in this region. They present a greater challenge to the decomposition algorithm,resulting in fewer units being identified. It was beyond the scope of this study to locate theinnervation zones on each of the tested muscles. We focused on identifying easy to locatelandmarks that could be used to guide the fruitful placement of the sensor for collecting datathat would provide the greatest MU yield from the decomposition algorithm. In summary,almost all locations on the surface of a muscle provide sEMG signals that may be decomposedto yield the firing instances and shapes of several MUs. However, muscles have preferred sitesthat provide richer MU yields. They are generally located between the center of the musclebelly and the tendinous areas of the muscle. These sites are associated with regions where theeasily measurable skinfolds have the least thickness. Additionally, we recommend a minimalSNR of 3 for reliable MU yields.
Acknowledgments
This work was supported in part by grant HD050111 from NCMRR/NICHD/NIH. We thankall the subjects who patiently collaborated in the experiments. We also thank senior projectstudents Allie Paquette and Megan Fessenden for their assistance in data collection and dataprocessing.
References
Adam A and De Luca C J 2003 Recruitment order of motor units in human vastus lateralis muscle is maintainedduring fatiguing contractions J. Neurophysiol. 90 2919–27
Basmajian J and De Luca C J 1985 Apparatus, Detection and Recording Techniques Muscles Alive 5th edn (Baltimore,MD: Williams & Wilkins) pp 60–4
Cole T J 1991 Weight-stature indices to measure underweight, overweight and obesity Anthropometric Assessment ofNutritional Status (New York: Wiley-Liss) pp 83–111
De Luca C J 1997 The use of surface electromyography in biomechanics J. Appl. Biomech. 13 135–63De Luca C J, Adam A, Wotiz R, Gilmore D and Nawab S H 2006 Decomposition of surface EMG signals
J. Neurophysiol. 96 1646–57De Luca C J and Hostage E 2010 Relationship between firing rate and recruitment threshold of motoneurons in
voluntary isometric contractions J. Neurophysiol. 104 1034–46Edwards D A W 1954 Design and accuracy of calipers for measuring subcutaneous tissue thickness Br. J.
Nutrition 9 133–43Gazzoni M, Farina D and Merletti R 2004 A new method for the extraction and classification of single motor unit
action potentials from surface EMG signals J. Neurosci. Methods 136 165–77

206 F Zaheer et al
Holobar A, Farina D, Gazzoni M, Merletti R and Zazula D 2009 Estimating motor unit discharge patterns fromhigh-density surface elctromyogram J. Neurophysiol. 102 1890–901
LeFever R S and De Luca C J 1982 A procedure for decomposing the myoelectric signal into its constituent actionpotentials: part I—technique, theory and implementation IEEE Trans. Biomed. Eng. 29 149–57
Merletti R, Botter A, Troiano A, Merlo E and Minetto M A 2009 Technology and instrumentation for detection andconditioning of the surface electromyographic signal: state of the art Clin. Biomech. 24 122–34
Nawab S H, Chang S and De Luca C J 2010 High-yield decomposition of surface EMG signals Clin.Neurophysiol. 121 1602–15
Nawab S H, Wotiz R P and De Luca C J 2008 Decomposition of indwelling EMG signals J. Appl. Physiol. 105 700–10Rainoldi A, Melchiorri G and Caruso I 2004 A method for positioning electrodes during surface EMG recordings in
lower limb muscles J. Neurosci. Methods 134 37–43Roy S H, De Luca C J and Schneider J 1986 Effects of electrode site on myoelectric conduction velocity and median
frequency estimates J. Appl. Physiol. 61 1510–7