Embed Size (px)
Citation preview

1
Preference, value and attitude in the context of some familiar and unfamiliar goods: The preliminary results of a survey.
Graham Loomes & Judith Mehta
University of East Anglia.
SCARR Project: ‘Risk in Perspective: Private Choices and Public Decisions’
January 2005 This is a preliminary draft so, please, do not quote.

2
!!!! Introduction
Governments face a dilemma in deciding how to allocate scarce public funds
to reduce risks to health and safety in the face of a wide range of competing
demands. The ideal is to allocate finds as closely as possible in line with the
preferences and values of citizens; but eliciting preferences, and determining
the value to the individual of each of the benefits at issue, is problematic.
Individuals are required to evaluate benefits that are unfamiliar, and where
evaluations involve dealing with notions of probability, risk and uncertainty
that are not a well-rehearsed part of everyday decision-making. There is now
a substantial body of evidence to suggest that the results of surveys are
affected by the particular elicitation methods used and the contexts in which
questions are asked: for example, whether respondents are asked open-
ended or closed-ended questions; and whether potential benefits are
presented separately or alongside one another (see Bateman et al, 2002,
especially chapters 8 and 12).
To fix ideas, consider a case where the individual is asked about three
possible personal risk reductions: a 5% reduction in the risk of being involved
in a road accident; a 5% reduction in the risk of their home being burgled; and
a 10% reduction in the risk of their home being burgled. Key questions for
policy-makers and economic theorists are as follows:

3
! Can the individual rank these options according to their
preferences and assign a monetary value to each of the
benefits?
! Are the monetary values assigned to benefits consistent with
(i) the position of each benefit in the preference ranking, and (ii)
the scale of benefits?
! And is it the case that the preference ranking, and the values
assigned to benefits, are stable regardless of the contexts in
which those benefits appear?
According to conventional economic models, in order to generate a coherent
representation of the wishes of citizens, the responses to these questions
must all be positive. Yet the results of surveys designed to elicit values for
reducing risks to health and safety exhibit patterns that depart from the
requirements of those models and thereby pose serious problems for
policymakers and for conventional theories of rational choice. This paper
reports the preliminary results of a survey designed to explore some of those
patterns and how they may vary as the subject matter changes from familiar
private goods involving little or no uncertainty through to less familiar public
goods involving risk. At issue for the wider project of which the current
investigation is one part are the limits of individual decision-making, and
whether in the light of the evidence it makes sense for health and safety policy
to be constructed on the basis of the preferences and monetary values
elicited through surveys.

!!!! Methodology
Semi-structured face-to-face interviews are being conducted at the University
of East Anglia with a sample of people from the Norwich area controlled for
age, sex and socio-economic status. Interviews are of approximately 40
minutes� duration, and both quantitative and qualitative data is being collected
with a view to understanding the thought processes involved in responding to
questions about choice and value 1.
The interview is divided into five main parts where each part comprises a set
of items and a series of questions relating to those items. These sets are as
follows:
1
Ttt
Set 1 (6 items):! Mars Bar ! 1 bottle of Muscadet white wine ! battery-operated smoke detector ! disposable camera ! 300gm pack of Continental chocolates ! box of scented tea-lights.
Set 2 (12 items):! £1 in cash ! £5 in cash ! £10 in cash ! £10 Boots voucher ! £10 donation to Oxfam made by us on your behalf ! 1 bottle of Muscadet white wine ! 3 bottles of Muscadet white wine ! battery-operated smoke detector ! 100gm pack of Continental chocolates ! 300gm pack of Continental chocolates ! decorated mug ! portable radio
4
The survey is ongoing at the time of writing with 27 interviews having been conducted so far. hus, the results reported here are provisional and offered as food for thought. Comments on
he methodology are welcome. A copy of the interview schedule is available on request from he authors.
5
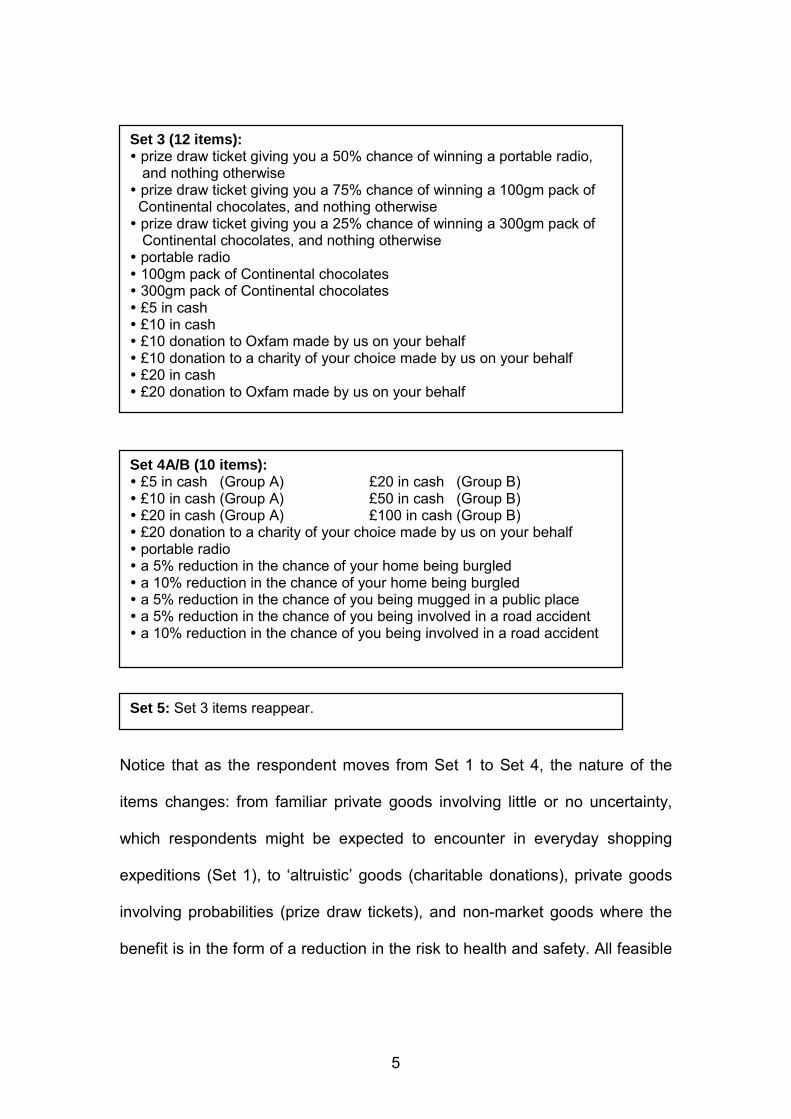
Notice that as the respondent moves from Set 1 to Set 4, the nature of the
items changes: from familiar private goods involving little or no uncertainty,
which respondents might be expected to encounter in everyday shopping
expeditions (Set 1), to �altruistic� goods (charitable donations), private goods
involving probabilities (prize draw tickets), and non-market goods where the
benefit is in the form of a reduction in the risk to health and safety. All feasible
Set 3 (12 items):! prize draw ticket giving you a 50% chance of winning a portable radio, and nothing otherwise ! prize draw ticket giving you a 75% chance of winning a 100gm pack of Continental chocolates, and nothing otherwise ! prize draw ticket giving you a 25% chance of winning a 300gm pack of Continental chocolates, and nothing otherwise ! portable radio ! 100gm pack of Continental chocolates ! 300gm pack of Continental chocolates ! £5 in cash ! £10 in cash ! £10 donation to Oxfam made by us on your behalf ! £10 donation to a charity of your choice made by us on your behalf ! £20 in cash ! £20 donation to Oxfam made by us on your behalf
Set 4A/B (10 items): ! £5 in cash (Group A) £20 in cash (Group B) ! £10 in cash (Group A) £50 in cash (Group B) ! £20 in cash (Group A) £100 in cash (Group B) ! £20 donation to a charity of your choice made by us on your behalf ! portable radio ! a 5% reduction in the chance of your home being burgled ! a 10% reduction in the chance of your home being burgled ! a 5% reduction in the chance of you being mugged in a public place ! a 5% reduction in the chance of you being involved in a road accident ! a 10% reduction in the chance of you being involved in a road accident
Set 5: Set 3 items reappear.

6
items are on display in front of the respondent during the interview, and any
price labels attached to items are removed beforehand.
For each set of items, the respondent is presented with a set of cards in
random order where each card represents an item, for example:
The respondent�s first task is to rank the items according to their preferences
by aligning the cards on a template with their most preferred item at the top
down to their least preferred item at the bottom. Respondents are then asked
to assign a monetary value to some of the items.
To encourage respondents to think carefully about every item in the set, an
incentive is built in to the questions pertaining to Set 2. Respondents are told
that once they have responded to these questions, the cards will be shuffled
and placed face down, and the respondent invited to pick two cards at
random. The respondent will then take home whichever of the two items they
placed highest in their ranking.
Multiples of some items are included in order to test for the sensitivity of
valuations to the magnitude or �scope� of the benefit. Most economic models
would predict that assigned values will be roughly proportionate to the size of
benefits2. For example, if a respondent assigns a value of £2 to the 100gm
2 However, this is an area of some disagreement, as we discuss below.
1 bottle of Muscadet white wine

7
pack of chocolates, one would expect to observe a value of £6 assigned to
the 300gm pack of chocolates.
Overlapping pairs of goods appear across the sets in order to test for the
consistency of preferences and values in the context of different lists of items.
Under conventional economic models, the context in which goods appear (or
the way in which questions are �framed�) has no influence either on the
preference ranking or on the values assigned. Moreover, values should
correspond to preferences. So, for example, a respondent who states that
they prefer item X to item Y will always place X higher than Y in their ranking
regardless of the set of items in which X and Y appear; and the value they
assign to X will be higher than the value assigned to Y. As a further test of the
influence of context on value, for Set 4, respondents are randomly divided into
two groups. The items facing Group A include two �low� cash sums (£5 and
£10), whereas the items facing Group B include two �high� cash sums (£50
and £100). Since values are assumed to be independent of context, there
should be no significant difference between the values assigned to items by
Group A and the values assigned by Group B, that is, there is no �anchoring�
effect with arbitrary clues to the value of an item being provided by one or
more other items in a set 3.
3 We are not yet in a position to test for the influence of arbitrary anchors on assigned values. However, Ariely et al (2003) found that valuations of a number of consumer products were strongly influenced by arbitrary anchors leading to a pattern of valuations (described as coherent arbitrariness) that give the illusion of order as if valuations are informed by stable underlying preferences. Thus, significantly, this �anomaly� is not restricted to non-market goods.

8
!!!! Results
Given that data collection is at an early stage, we report only on those results
that are already flagging problems for a preference-based approach to health
and safety policy, and where we feel we are beginning to gain some insight to
the sources of problems.
Can people assign a monetary value to a reduction in risk?
Once respondents have ranked the items in each of Sets 1 to 4 according to
their preferences, they are asked to determine the value to them in monetary
terms of two of the risk reduction items in Set 4: the 5%, and then the 10%,
reduction in the risk of burglary. They are also asked to determine the value to
them of six of the items in Set 5: the 300gm, and then the 100gm, packs of
chocolates; the £10, and then the £20, donations to Oxfam; and each of the
prize draw tickets. Respondents are asked to value Set 5 items after Set 4
items to avoid the valuations of non-market goods being contaminated by the
valuations assigned to more familiar private goods, that is, to deflect the
argument that respondents may have been �trained�. The valuation question
takes the form:
“What sum of money that you could take home with you is as good
as [�]? Feel free to say ‘nothing’ if the item is of no value to you.”
Respondents had little or no difficulty in assigning monetary values to familiar
private goods (see Tables 1 and 2 in the Appendices), with several
respondents indicating that they were taking into account what they thought
might be the market price of a good. Consider the two packs of chocolates.

9
The values assigned to the 100gm pack range from £0 to £5, with a mean of
£1.66 and a standard deviation of 1.13. And the values assigned to the
300gm pack range from £0 to £10.50, with a mean of £3.81 and a standard
deviation of 2.43 4.
In contrast, almost all respondents expressed difficulty in assigning monetary
values to the two risk reduction items. Here, of course, there are no readily
accessible market prices that might be considered salient to the task. Most
respondents (20 = 74%) were eventually able to determine the value to them
in monetary terms of both risk reductions, and two respondents were at least
able to determine broad bands within which they felt the values they assigned
to the risk reductions must lie (see Tables 3 and 4). Some of these 22
respondents turned to the cost of household insurance, or to the monetary
value of their household contents, for clues to the value to them of the risk
reduction; and some reached their valuations by determining the amount of
money they would have to spend to achieve the same reduction in risk, for
example, the cost of extra window locks or door locks, or a proportion of the
cost of a household alarm system. The values assigned to the 5% reduction in
risk range from £0 to £10,000, with a mean of 1890.73 and a standard
deviation of 3468.23. And the values assigned to the 10% reduction in risk
range from £8 to £20,000, with a mean of 3271.81 and a standard deviation of
6111.15.
4 In fact, the market price of the chocolates is £2.00 per 100gms.

10
Five respondents either refused, or felt wholly unable, to assign a monetary
value to one or both risk reduction items. For these respondents, the problem
was not that they didn�t value a reduction in the risk of their home being
burgled. Instead, all five indicated that a sum of money would fail to
encapsulate the value to them of an improvement in personal safety and
security, for example:
“But other things are involved.”
“I can’t put a figure on it.”
“It’s the psychological effect.”
Indeed, some respondents indicated that to express the value of the good in
monetary form is to devalue it. Moreover, several of those respondents who
were able to determine a monetary value felt the need to qualify their
responses in similar terms, for example:
“But I don’t think I could put a price on my home being burgled.”
“It’s the intrusion – it’s very difficult to put a monetary value on that.”
“It’s a silly question: it’s an emotional thing.”
The comments made by respondents suggest that, with regard to a reduction
in the risk of one�s home being burgled, money is not the only - and, possibly,
not the most appropriate - measure of value since it may well underestimate
the value of the two items to the individual. This observation is suggestive of
recent criticisms in the literature on the contingent valuation approach to utility
valuations in which people are asked to report their willingness to pay (WTP)
or willingness to accept (WTA) for non-market goods. For goods of this kind, a
key issue is what exactly is being measured. In this spirit, Kahneman and

11
Sugden (2005) suggest that contingent valuation responses may be
measuring attitudes rather than preferences. They point out that these are
different entities entailing different logics: preferences are about states of the
world, whereas attitudes are about events in the mind. They argue that for
goods that people have no experience or expectation of actually buying,
responses tend to express affective attitudes and that these are susceptible to
framing and context effects that sit uneasily with the theory of preference.
Thus, as the comments of several of our respondents suggest, when burglary
is mentioned, people tend to have an immediate emotional response: they
imagine (or may even recall the experience of) the fear and horror of
discovering that the sanctity of their home has been violated. Part of the
problem for respondents in giving coherent expression to an emotional
response of this kind is that there is no standard, or modulus, against which to
measure the intensity of the response; as Kahneman and Sugden point out,
each person must construct their own. Under these conditions, it is not
surprising that there is more variability in the values assigned to risk
reductions than in the values assigned to the more familiar packs of
chocolates. Moreover, if it is indeed the case that it is attitudes rather than
preferences that are informing the values assigned to risk reductions, then
there is no reason to believe that the translation of an affective attitude into an
amount of money is underpinned by a well-behaved preference ordering as
conventional models would assume; preferences are simply not a part of the
picture.

12
Is the preference ranking stable regardless of the context in which benefits
appear?
This question can be addressed by examining overlapping pairs of items
across Sets 1 to 4. For example, a single bottle of Muscadet and a 300gm
pack of chocolates feature in both Set 1 and Set 2. There are 24 such
overlapping pairs involving tangible private goods, cash sums and donations
to charity. For the consistency requirement of standard models to be satisfied,
the respondent�s ranking of each item in a pair relative to the other must be
the same in both sets.
Of the 27 respondents, 12 are perfectly consistent in their preference ordering
across sets. The other 15 respondents vary in the frequency with which they
are inconsistent (see Table 5), with 9 respondents being inconsistent once or
twice and 6 respondents being inconsistent four or more times times.
Just one overlapping pair of items is immune to inconsistency: unsurprisingly,
this is the pair comprising the £5 and £10 cash sums that feature in Sets 3
and 4. For the most part, there is no discernible pattern to inconsistencies.
But, curiously, overlapping pairs featuring the portable radio, the £10 cash
sum and the £10 donation to Oxfam do give rise to �clusters� of inconsistency:
the pairs consisting of the £10 cash sum and the radio, and the £10 donation
to Oxfam and the radio, each attract five respondents to be inconsistent; and

13
the pair consisting of the £10 cash sum and the £10 donation to Oxfam
attracts four respondents to be inconsistent 5 6.
It is frequently argued that many of the problems that attach to contingent
valuation arise because of the nature of the goods, the thought being that
people are more competent when it comes to evaluating familiar private
goods than they are in the case of public goods. The presence of probabilities
is understood to exacerbate people�s difficulties. The risk reduction items do
not feature in any of the overlapping pairs and so at this stage of the project
we are unable to make a comparison. However, the results so far do suggest
that the consistency requirement cannot be relied upon completely when
private goods are presented in different contexts. Even for relatively ordinary
private goods, there may be a degree of uncertainty about preferences such
that the orderings between goods of similar value may be liable to vary
somewhat from one question to the next.
Are the monetary values assigned to benefits consistent with the position of
each benefit in the preference ranking?
This question can be addressed by examining, first, the position in the
preference ordering of a good relative to a given cash sum, and then the
5 It may be that more can be said about these inconsistencies at a later date when there are more observations and further analysis has taken place. Respondents are also being asked about the strength of their preferences and how confident they are that they would give the same preference ordering again if the exercise was to be repeated on several occasions. This data has yet to be analysed, but it may be that inconsistencies arise when preferences are weak and/or confidence is low. 6 A complication arising in the interpretation of data is that the Asian tsunami disaster occurred in the middle of the period in which interviews were conducted giving a high profile to the giving of charitable donations. Thus, respondents interviewed in January may be more sensitive to the value of charitable donations than those interviewed in November and December.

14
value assigned to that good. If a respondent states that they prefer the cash
sum to the good, one would expect the respondent to assign a value to the
good that is less than the cash sum if the consistency requirement is to be
satisfied. Of course, the numbers of respondents to date is limited, but we
report on what we have so far.
In the case of the 5% reduction in the chance of burglary and the £20 cash
sum, the values assigned by 15 respondents are perfectly consistent with the
preference ordering; two respondents rank the £20 cash sum higher/lower
than the risk reduction but then assign a value of £20 to the risk reduction
which would suggest indifference between the two items; and the values of
four respondents are wholly inconsistent with the preference ordering (see
Table 6). (Six respondents are unable to assign a value.)
In the case of the 10% reduction in the chance of burglary and the £20 cash
sum, the values assigned by 15 respondents are perfectly consistent with the
preference ordering; one respondent ranks the £20 higher than the risk
reduction but then assigns a value of £20 to the risk reduction which would
suggest indifference between the items; and the values of five respondents
are wholly inconsistent with the preference ordering. (Six respondents are
unable to assign a value.)
4 respondents are inconsistent with respect to both risk reductions and, for
some of these respondents, the extent of the inconsistency is marked, for
example, one respondent states that they prefer the £20 to both the 5% and

15
the 10% risk reductions, but then assigns values of £10,000 and £20,000,
respectively, to these benefits.
In the case of the 300gm pack of chocolates and the £5 cash sum, the values
assigned by 17 respondents are perfectly consistent with the preference
ordering; 7 respondents rank the £5 higher or lower than the chocolates but
then assign a value of £5 to the chocolates which would suggest indifference
between the items; and the values of just two respondents are wholly
inconsistent with the preference ordering. (There is a missing value for one
respondent.) Thus, in this respect, it would seem that people are more
consistent with regard to preferences and values in the case of familiar private
goods than they are in the case of the non-market goods 7.
Are the monetary values assigned to benefits consistent with the scope of
benefits?
Three goods allow us to address this question; these are the chocolates
(100gm and 300gm packs), the donations to Oxfam (of £10 and £20), and the
reductions in the chance of burglary (of 5% and 10%). The data are still
limited at this stage of the survey � especially with half a dozen respondents
unable or unwilling to assign money values to the risk reductions � and we
7 Respondents are not given the opportunity to express any indifference between goods. Thus, where a respondent expresses a preference for one good over another, but then the values assigned to those same goods indicate indifference, this might be considered a less serious infringement of the consistency requirement, reflecting little more than an inclination to express values in round numbers. It might then be argued that, in the face of the relatively large number of respondents who behave in this way with respect to the chocolates, this amplifies the strength of our tentative conclusion, i.e. that people may be more consistent with regard to familiar private goods than with regard to non-market goods.

16
stress the provisional nature of any patterns to date. Nevertheless, we report
what we have and comment briefly.
In the case of the chocolates, four respondents are perfectly sensitive to
scope, and there is a discrepancy of only a few pence for two respondents.
But there are discrepancies of between 50 pence and £10 for 21 respondents.
In the case of the donations to Oxfam, 17 respondents are perfectly sensitive
to scope; there are discrepancies of between £1 and £10 for 9 respondents;
and one respondent felt unable to provide a valuation. And in the case of the
risk reductions, 9 respondents are perfectly sensitive to scope; there are
discrepancies of between £5 and £10,000 for 11 respondents; but there are
no observations for 7 respondents.
One possible interpretation of this is that in cases such as the donation where
a sum of money is specified as part of the good, the cue is so strong that the
majority of respondents pick up on it. The information on risk reduction,
although numeric, is less likely to induce as much conformity. And while the
quantity information about the chocolates is also numeric, it may be that
respondents are influenced to some degree by the convention that prices of
larger packs entail some discount for �buying in bulk� 8.
What we also notice when looking at the frequencies of values as reported in
Tables 1 to 4 is that in the case of the chocolates the distributions tend to be
8 When the value assigned to the large pack of chocolates is compared with three times the value assigned to the small pack of chocolates, there is a discrepancy of £1 or less for 12 respondents (or 14 if one includes the two respondents whose valuations deviate by just a few pence).

17
reasonably symmetrical, with no great differences between means and
medians: a pattern which plausibly reflects the way in which tastes for
chocolate may vary between individuals. By contrast, the values for reducing
risks of burglary display the pattern common in many contingent valuation
studies, whereby a minority of respondents give very high � some might think,
implausibly high � values, so that in both cases the means are more than ten
times their respective medians. Thus although those means, and the within-
respondent values, seem to show reasonable sensitivity to scope overall,
questions must be asked about whether this reflects a desire to appear
consistent of the �coherent arbitrariness� kind discussed by Ariely et al (2003)
rather than estimates that would hold up if respondents had thought through
the issues carefully and were actually faced with the prospect of parting with
the kinds of sums they stated.
The issues surrounding the sensitivity of monetary values to the scope of
benefits is one that we are pursuing in this and other parts of the project with
a view to determining how far any insensitivity is particular to the domain of
public goods or is more widespread. Certainly, the literature offers many
examples of so-called scope problems, or �embedding effects� (Kahneman
and Knetsch, 1992). For example, Desvouges et al (1993) and Schkade and
Payne (1994) both find that respondents� willingness to pay to protect
migratory waterfowl is similar regardless of whether policy intervention results
in saving 2,000 birds or 200,000 birds. It can be argued that some insensitivity
to scope is consistent with economic theory to the extent that the marginal
value of an extra unit of a good might be expected to decline (the principle of

18
diminishing marginal rate of substitution). However, it is not clear that the
evidence of surveys supports this interpretation of scope insensitivity and,
hence, how policy-makers should respond where it arises (Frederick and
Fischhoff, 1997).
Concluding remarks
Clearly, no statistical significance can be accorded to our results so far since
interviews are at an early stage. We therefore restrict ourselves to a brief
commentary on the central direction of our project.
The literature is replete with evidence of the problems posed by surveys
designed to elicit people�s preferences and values for health and safety
benefits. At the same time, government agencies urgently require
standardised methods of collecting people�s views, and firm theoretical
grounds for implementing one policy rather than another, if the best possible
use is to be made of public funds. It may be that, ultimately, approaches
grounded in the assumption of a well-behaved preference ordering are
displaced as alternative approaches drawing on different theoretical protocols
emerge. Yet to move forward, with or without the contingent valuation method,
calls for a deeper understanding of the processes and limits of decision-
making; it is this thought that provides the primary motivation for our study. As
the evidence of this and many other surveys demonstrates, people do have
strong feelings about risks to health and safety, and the policies that can
reduce those risks. It is just that the judgments people reach can sit uneasily
with conventional economic models and they can pose difficulties for

19
quantification and aggregation. However, it has to be emphasized in this
regard that, as Kahneman, Ritov and Schkade (1999) point out, measures of
WTP in contingent valuation are not necessarily useless: they do measure
something, and a better understanding of what that �something� is may well
provide the route to sounder policy.
Introductory economics texts frequently point to the role of money as the unit
of account when we want to measure and record economic value. While
money may satisfy this function in the context of familiar private goods, when
it comes to less familiar public goods, money performs less well. Thus, when
people are asked to provide a summary measure of the value to them of a
reduction in risk, a major problem would appear to be that money fails to
provide either the most coherent or the only expression of value. At best, it
would seem that money can give some measure of the material benefits of
the risk reduction; at worst, money inadequately articulates the emotional
and/or psychological dimensions of well-being - which, for many people, are
important, if not the most important, components of value in the context of
health and safety policy. This being the case, the concept of affective attitude
is potentially more helpful than the concept of preference in understanding
how social scientists might make the connection between the
emotional/psychological impact on people�s lives of particular health and
safety policies and some summary measure of the value of those policies.
Accordingly, we focus at this stage of our project on gaining insights to the
decision-making process. Of particular interest are the limits of decision-
making, or the point at which �preferences� that broadly conform with standard

20
economic models may give way to responses which are influenced by other
considerations as people move from more familiar private goods to less
familiar public goods. We hope to have more to say on this topic as the
project develops.
!!!
!!!!REFERENCES
Ariely D, Loewenstein G and Prelec D, (2003). ��Coherent arbitrariness�:
Stable demand curves without stable preferences�, Quarterly Journal of
Economics, 118: 73-105.
Bateman I, Carson, R., Day, B., Hanemann, M., Hanley, N., Hett, T., Jones-
Lee, M., Loomes, G., Mourato, S., Ozdemiroglu, E., Pearce, D., Sugden, R.
and Swanson, J. (2002). Economic Valuation with Stated Preference
Techniques. Edward Elgar.
Desvouges WH, Johnson F, Dunford R, Hudson S, Wilson K and Boyle K,
1993, �Measuring resource damages with contingent valuation: Tests of
validity and reliability�, in Hausman JA (ed.), Contingent Valuation: A Critical
Assessment, Elsevier.
Frederick S and Fischoff B, 1998, Scope (in)sensitivity in elicited valuations.
Risk, Decision, and Policy. 3: 109-123.

21
Kahneman D and Knetsch J, 1992, �Valuing public goods: The purchase of
moral satisfaction�, Journal of Environmental Economics and Management
22(1): 57-70.
Kahneman D, Ritov, I. and Schkade, D, 1999, �Economic preferences or attitude
expressions? An analysis of dollar responses to public issues.� Journal of Risk
and Uncertainty, 19: 203-35.
Kahneman, D. and Sugden, R. (2005). Experienced utility as a standard of policy
evaluation. Forthcoming in Environmental and Resource Economics.
Schkade and Payne, 1994, �How people respond to contingent valuation
questions: A verbal protocol analysis of willingness to pay for an
environmental regulation�, Journal of Environmental Economics and
Management 26: 88-109.
Sugden R, 2004, �Experienced utility as a standard of policy evaluation�,
Working Paper, University of East Anglia.

22
!!!! APPENDICES
Table 1: 100gm pack of chocolates: range and frequency of values.
Value Frequency£5.00 1 £4.00 1 £3.00 1 £2.99 1 £2.50 1 £2.00 7 £1.65 1 £1.50 3 £1.00 6 £0.50 2 £0.30 1 £0.00 2
Table 2: 300gm pack of chocolates: range and frequency of values.
Value Frequency£10.50 1 £10.00 1 £6.00 1 £5.00 7 £4.99 1 £4.50 1 £4.00 2 £3.00 2 £2.50 2 £2.00 5 £1.00 3 £0.00 1
n = 27 x = 1.66 σ n = 1.13
n = 27 x = 3.81 σ n = 2.43

Table 3: a 5% reduction in the chance of your home being burgled: range and frequency of values.
Value Frequency£10,000 3 £4,500 1 £2,500 1 £699 1 £500 2 £300 1 £200 1 £175 1 £100 2 £50 1 £30 1 £20 2 £7.50 1 £4 1 £0 2
Table 4: a 10% reduction in the chance of your home being burgled: range and frequency of values.
Value Frequency£20,000 2 £10,000 1 £9,000 1 £5,000 1 £1,000 2 £600 1 £500 2 £300 1 £200 2 £150 1 £100 1 £50 1 £40 1 £30 1 £20 1 £10 1 £8 1
n = 21 x = 1890.73 σ n = 3468.23(excludes 4 refusals and 2 bands)
n = 21 x = 3271.81 σ n = 6111.15 (excludes 4 refusals and 2 bands)
23

24
Table 5: The frequency of inconsistencies across preference orderings.
No. of inconsistencies
No. of respondents
1 4 2 5 4 2 5 2 6 1 7 1
Table 6: Monetary values and the position of goods in the preference ordering.
Perfectly consistentresponses
Preference followed by indifference
Wholly inconsistentresponses
No value assigned
15
2
4
6
15
1
5
6
17
7
2
1
5% reduction in chance of burglary: 10% reduction in chance of burglary: 300gm pack of chocolates:

![Context-aware Preference Modeling with Factorization · [1] BalázsHidasiand DomonkosTikk: Fast ALS-based tensor factorization for context-aware recommendation from implicit feedback](https://img.dokumen.tips/doc/110x75/604e2bf863b64e0bca3d1b1c/context-aware-preference-modeling-with-1-balzshidasiand-domonkostikk-fast-als-based.jpg)