Embed Size (px)
Citation preview

nutrients
Article
A Provegetarian Food Pattern EmphasizingPreference for Healthy Plant-Derived Foods Reducesthe Risk of Overweight/Obesity in the SUN Cohort
Clara Gómez-Donoso 1,2, Miguel Ángel Martínez-González 1,2,3,4 , J. Alfredo Martínez 2,3,5 ,Alfredo Gea 1,2,3, Julen Sanz-Serrano 6, Federico J. A. Perez-Cueto 7 andMaira Bes-Rastrollo 1,2,3,*
1 Department of Preventive Medicine and Public Health, School of Medicine, University of Navarra,31008 Pamplona, Spain
2 Biomedical Research Centre Network of Physiopathology of Obesity and Nutrition (CIBERobn),Institute of Health Carlos III, 28029 Madrid, Spain
3 Navarra Institute for Health Research (IdiSNA), 31008 Pamplona, Spain4 Department of Nutrition, Harvard TH Chan School of Public Health, Boston, MA 02115, USA5 Department of Nutrition, Food Sciences and Physiology, School of Pharmacy and Nutrition,
University of Navarra, 31008 Pamplona, Spain6 Department of Pharmacology and Toxicology, School of Pharmacy and Nutrition, University of Navarra,
31008 Pamplona, Spain7 Food Design and Consumer Behavior Section, Department of Food Science, University of Copenhagen,
Rolighedsvej 26, 1958 Frederiksberg C, Denmark* Correspondence: [email protected]
Received: 21 May 2019; Accepted: 5 July 2019; Published: 9 July 2019�����������������
Abstract: Provegetarian diets (i.e., preference for plant-derived foods but not exclusion of animal foods)have been associated with a reduced risk of long-term weight gain and could be more easilyembraced than strict vegetarian diets. However, not all plant-derived foods are equally healthy.In the “Seguimiento Universidad de Navarra” (SUN) cohort, we prospectively evaluated theassociation between different provegetarian food patterns and the incidence of overweight/obesityin 11,554 participants with initial body mass index <25 kg/m2. A provegetarian food pattern (FP)was built by assigning positive scores to plant foods and reverse scores to animal foods. A healthfuland an unhealthful provegetarian FP, which distinguished between healthy (fruits/vegetables/wholegrains/nuts/legumes/olive oil/coffee) and less-healthy plant foods (fruit juices/potatoes/refinedgrains/pastries/sugary beverages), were also built. A total of 2320 new cases of overweight orobesity were identified after a median follow-up of 10.3 years. Higher baseline conformity with theoverall provegetarian FP was inversely associated with overweight/obesity (HR comparing extremequintiles: 0.85; 95% CI: 0.75 to 0.96; p-trend: 0.014). This association was stronger for the healthfulFP (HR: 0.78; 95% CI: 0.67 to 0.90; p-trend: <0.001) and was not apparent for the unhealthful FP(HR: 1.07; 95% CI: 0.92 to 1.23; p-trend: 0.551). In a large prospective cohort of relatively young adults,better conformity with a healthy provegetarian diet was associated with a reduced long-term risk ofoverweight/obesity, whereas no consistent trend was found for a FP that emphasized less-healthyplant foods.
Keywords: overweight; obesity; dietary patterns; vegetarian; provegetarian; epidemiology; nutrition;prospective cohort study
Nutrients 2019, 11, 1553; doi:10.3390/nu11071553 www.mdpi.com/journal/nutrients

Nutrients 2019, 11, 1553 2 of 17
1. Introduction
It is well-established that diets higher in plant-based foods and with fewer animal source foodsconfer both health and environmental benefits [1–3]. Plant-based diets have been associated witha lower risk of various diseases [4–11], including a lower risk of obesity [12–19], which is among thegreatest contributors to premature mortality [20–22]. Moreover, whereas strict vegan or vegetarian dietsmight not be easily embraced within the general population, provegetarian diets (i.e., preferentiallybut not exclusively consuming plant-derived foods) based on gradual dietary changes may be easierto adopt. Although this type of plant-based diet is also commonly known as flexitarian, we used theprovegetarian operational score because it has been defined in a quantitative and easily reproducibleway [10]. However, with the exception of several recent studies [23–27], prior studies of plant-baseddiets do not take into account the fact that not all plant-derived foods are equally healthy.
Since the potential mechanisms responsible for the beneficial effects of plant-based diets on bodyweight [28–37] are mainly supported by dietary constituents like fiber and other biologically activemicronutrients which are characteristic of healthy plant foods (i.e., fruits and vegetables), it is warrantedto evaluate whether the healthfulness of plant-derived foods influences the risk of long-term weightgain. Additionally, it is important to provide evidence towards the advantages and disadvantagesof strategies that consumers may put in practice when they adopt plant-based diets following thesocietal trends, and to provide insights for tomorrow’s food innovation. Therefore, we aimed toprospectively examine the association between different versions of a provegetarian food pattern andthe incidence of overweigh/obesity in the SUN (Seguimiento Universidad de Navarra/University ofNavarra Follow-up) cohort.
2. Materials and Methods
2.1. Study Population
The “Seguimiento Universidad de Navarra” (SUN) prospective cohort study started on December1999 following the models of the Nurses’ Health Study and the Health Professionals Follow-Up Study.It is a multipurpose and dynamic cohort (i.e., recruitment is permanently open) composed of youngmiddle-aged university graduates from different Spanish universities, including the University ofNavarra. Baseline assessment and follow-up information is gathered through postal or web-basedquestionnaires completed by participants every 2 years. Self-administered questionnaires includeinformation on sociodemographic, lifestyle and dietary variables as well as the use of medicationand the prevalence or incidence of diseases during follow-up. For the main outcomes, medicalrecords are requested to participants or their next of kin in order to confirm the diagnoses by a panelof medical doctors of the study, blinded to the dietary habits of participants and other exposuresof interest. For participants lost to follow-up, the National Death Index is periodically checked todetermine their vital status and cause of death. The overall retention in the cohort is higher than 90%.All procedures were approved by the Institutional Review Board of the University of Navarra (2017.151)according to Declaration of Helsinki guidelines. Voluntary completion of the baseline self-administratedquestionnaire was considered to imply informed consent, as participants received detailed informationabout the study. Further details about the methodology and characteristics of participants have beendescribed in more detail elsewhere [38].
Up to July 2018, there were 22,791 participants who had completed the baseline questionnaire.In order to ensure that all participants had completed at least one follow-up questionnaire, only thosewho were recruited before October 2015 were considered eligible. Out of the 22,467 eligible participants,we excluded 6655 with prevalent overweight or obesity (body mass index (BMI) ≥ 25 kg/m2) atbaseline, 1628 who reported implausible values for total energy intake according to predefined limits(>4000 kcal/d in men and >3500 kcal/d in women or <800 kcal/d in men and <500 kcal/d in women),95 women who were pregnant at baseline, 714 with prevalent chronic disease (diabetes, cardiovasculardisease and/or cancer), and 393 with a weight change > 10 kg in the 5 years before entering the study to

Nutrients 2019, 11, 1553 3 of 17
reduce the potential source of confounding by other causes of weight changes. Among the remaining12,982 participants, 1160 were lost to follow-up leaving a total of 11,822 (retention = 91%). Additionally,we excluded 268 participants who had missing values in the variables of interest regarding the outcome.After exclusions, a sample of 11,554 participants was included in this study (Figure 1).
Figure 1. Flow chart depicting the selection process among participants of the Seguimiento Universidadde Navarra (SUN) cohort.
2.2. Dietary Assessment
A 136-item semi-quantitative food frequency questionnaire (FFQ) repeatedly validated in Spanishparticipants [39,40] was completed at baseline. Frequencies of consumption were measured in9 categories (ranging from never/almost never to >6 servings/day) for each food item, in orderto assess typical food intake over the previous year. Daily intake (grams/day) was calculated bymultiplying the specified portion size for each food item by the frequency of consumption. Nutrientintake was updated by a trained dietician using the latest available information on Spanish food

Nutrients 2019, 11, 1553 4 of 17
composition tables [41,42]. The scoring criteria for the overall, healthful and unhealthful provegetarianfood patterns (FPs) are showed in Table 1, as described in previous studies [10,23]. Informationon the food items from the FFQ included in each food group is shown in Table S1. Differences infood consumption between the lowest and highest quintiles of the provegetarian FPs are graphicallyrepresented in Figures S1–S3, showing differences (in percentage) between medians of extreme quintiles(quintile 1 and 5) and the median of the whole sample.
Table 1. Scoring criteria for the provegetarian food patterns.
Provegetarian Food Pattern (Potential Range of 12–60) Healthful/Unhealthful Provegetarian Food Patterns (Potential Range of 18–90)
Component Criteria Component Criteria
Plant food Groups Energy-Adjusted Quintiles Plant Food Groups Energy-Adjusted Quintiles
Healthy Healthful Unhealthful
1. Vegetables Positive 1. Vegetables Positive Reverse2. Fruits Positive 2. Fruits Positive Reverse3. Legumes Positive 3. Legumes Positive Reverse4. Cereal grains Positive 4. Whole grains Positive Reverse5. Potatoes Positive 5. Nuts Positive Reverse6. Nuts Positive 6. Olive oil Positive Reverse7. Olive oil Positive 7. Coffee Positive Reverse
Less-healthy
Animal Food Groups 8. Fruit juices Reverse Positive
8. Dairy Reverse 9. Potatoes Reverse Positive9. Eggs Reverse 10. Refined grains Reverse Positive10. Meat Reverse 11. Sugary beverages Reverse Positive11. Fish & seafood Reverse 12. Pastries Reverse Positive12. Animal fat Reverse Animal Food Groups
13. Dairy Reverse Reverse14. Eggs Reverse Reverse15. Meat Reverse Reverse16. Fish & seafood Reverse Reverse17. Miscellaneous food Reverse Reverse18. Animal fat Reverse Reverse
Adherence to an overall provegetarian FP was calculated according to the score proposed byMartínez-González et al. [10], which quantifies the habit of preferentially consuming plant-derivedfoods instead of animal-derived foods without the need to follow a strict vegetarian diet. This scorequantifies the energy-adjusted consumption (g/d) of seven plant food groups (fruits, vegetables,potatoes, nuts, legumes, cereal grains and olive oil) and five animal food groups (dairy, eggs, meat,fish and seafood and animal fat). The residual method was used separately for men and women toadjust for total energy intake and the energy-adjusted estimates (residuals) were ranked according totheir sex-specific quintiles. The quintile values for animal food groups were reversed (a value of 5was assigned for the first quintile, 4 for the second quintile, and successively until the value of 1 wasassigned to the fifth quintile). To obtain the overall provegetarian FP score, quintile values of plantfoods and reverse quintile values of animal foods were summed. Thus, the final scores assigned toparticipants could range from 12 (lowest adherence) to 60 (highest adherence).
Likewise, adherence to a healthful and unhealthful provegetarian FP was calculated accordingto the scoring criteria suggested by Satija et al. [23]. Healthy (fruits, vegetables, whole grains, nuts,legumes, olive oil, coffee) and less-healthy plant foods (fruit juices, potatoes, refined grains, pastries,sugary beverages) were distinguished. As shown in Table 1, to build the healthful provegetarianFP, positive scores were assigned to healthy plant foods and reverse scores to less-healthy plantfoods as well as to animal foods. For the unhealthful provegetarian FP, positive scores were assignedto less-healthy plant foods and reverse scores to healthy plant foods and animal foods. Quintilesand reverse quintiles were summed to obtain scores of the healthful and unhealthful versions ofa provegetarian FP. Participants were categorized into energy-adjusted quintiles of the healthful andunhealthful provegetarian FPs. Thus, their final scores could range from 18 (lowest adherence) to90 (highest adherence).

Nutrients 2019, 11, 1553 5 of 17
Adherence to the Mediterranean diet was assessed using the a priori 9-item Mediterranean dietscore (MDS) proposed by Trichopoulou et al. [43].
2.3. Other Covariates Assessment
The baseline questionnaire gathered information about sociodemographic and anthropometriccharacteristics, health-related habits, and clinical data including personal and family history of disease.Physical activity was assessed using a previously validated questionnaire, which included 17 differentactivities during leisure time [44]. Metabolic equivalents (METs) were calculated to yield MET-hoursper week scores for each participant.
Baseline dietary intake data derived from food composition tables for Spain [41,42] were used toidentify the fat quality index (FQI) and the carbohydrate quality index (CQI). The FQI was calculatedusing the ratio (monounsaturated + polyunsaturated fatty acids)/(saturated + trans fatty acids) asa continuous variable, ranging from 1.01 to 4.93. The CQI was determined by summing up quintiles ofthe following four criteria: Dietary fiber intake (g/day), glycemic index, the ratio whole grains/totalgrains and the ratio solid carbohydrates/solid + liquid carbohydrates. All criteria had the sameweighting, and the CQI ranged from 4 to 20. The FQI and CQI have been previously used in thiscohort [45] and also in the Prevención con Dieta Mediterránea (PREDIMED) study [46].
2.4. Outcome Ascertainment
Weight of participants was self-reported at baseline and every 2 years in the follow-upquestionnaires. BMI was calculated as the self-reported weight in kilograms divided by the square ofheight in meters. Weight was self-reported by participants at baseline and every 2 years of follow-up.BMI was calculated as weight in kilograms divided by the square of height in meters, which wasascertained at baseline. Anthropometric data (i.e., self-reported weight and BMI) have been previouslyvalidated in a subsample of this cohort finding strong correlation results [47]. The outcomes were:(1) Incidence of overweight/obesity (BMI ≥ 25 kg/m2); and (2) average change in body weight (grams)per year (g/y).
2.5. Statistical Analysis
Inverse probability weighting was used to determine the age- and sex-adjusted baselinecharacteristics of participants according to quintiles of adherence to the different provegetarianFPs in order to remove differences that were only explained by the different age and sex distributionacross baseline quintiles of provegetarian FPs.
Cox proportional hazards analyses were conducted to assess the relationship betweenprovegetarian FPs with varying degree of healthfulness and the incidence of overweight/obesity.All models included age as underlying time variable and were stratified by age groups and yearof recruitment. After crude analyses, a model adjusted for sex and age was fitted. Multivariablemodels were additionally adjusted for known risk factors of weight gain and potential confoundersby using baseline values of the following covariates: Baseline BMI (kg/m2, continuous), physicalactivity (METs-h/week, quartiles), hours of TV watching (quartiles), smoking status (never, current,or former), marital status (single, married, other), years of university education (continuous), totalenergy intake (kcal/day, continuous), snacking between meals (yes, no), following a special diet atbaseline (yes, no), parental family history of obesity (yes, no) and hours of siesta sleep (0, >0 to ≤0.5,>0.5). Robust standard errors were used. In order to reduce the effects of potential measurementerrors due to diet variation during follow-up, dietary data were updated after 10 years of follow-up ifthe participant was followed for longer than 10 years and had completed the 10-year follow-up FFQ.Tests of linear trends were conducted using the medians of each provegetarian score for each quintileand treating the variable as continuous in Cox models. Moreover, to minimize the potential distortionsproduced by different measurement units in each provegetarian score, z scores were used. Each z scorewas calculated for each participant as the score value of the participant minus the mean value for theoverall sample divided by the standard deviation of the score in the overall sample.

Nutrients 2019, 11, 1553 6 of 17
Multiple linear regression models were used to assess the association between the provegetarianFPs and the average yearly weight change during follow-up, considering the first quintile of adherenceas the reference group. We estimated β regression coefficients (and their 95% confidence interval (CI))for the other four quintiles, which should be interpreted as the difference in average yearly weightchange (g/y) for each of the upper four quintiles versus the lowest quintile. To take into accountrepeated measurements of diet, generalized estimating equations with an unstructured correlationmatrix were used to assess the relationship between updated scores of the provegetarian FPs andaverage yearly weight change. Analyses were adjusted for the same confounding factors as the mainCox regression analysis.
Additional analyses were conducted after excluding participants with a baseline BMI ≥ 30 kg/m2
instead of BMI ≥ 25 kg/m2 (as in the main analyses, which only included normal weight participants)in order to assess the incidence of obesity among overweight participants (i.e., change of BMI categoryfrom overweight to obese).
Sensitivity analyses were conducted to explore the robustness of our findings by rerunning theanalyses under the following scenarios: Excluding participants with energy intake between the 5thand 95th percentiles; excluding participants with no answer in > 12 items in the 136-item baselineFFQ; including participants with weight change > 10 kg over the previous 5 years before entering thestudy; excluding participants with BMI > 24.5 kg/m2 at baseline (even though self-reported BMI hasbeen previously validated finding good correlation results, some degree of misclassification might stillexist); excluding early incident cases of overweight (participants who became overweight or obeseonly during the first 2 y of follow-up); additionally adjusting for weight gain ≥ 3 kg over the previous5 years before entering the cohort; considering as the outcome only obesity (BMI ≥ 30 kg/m2) insteadof overweight (BMI ≥ 25 kg/m2) and truncating follow-up at 10 years.
All analyses were performed using STATA/SE version 12.0 (StataCorp, College Station, TX, USA).
3. Results
A total of 11,554 participants (8419 women and 3135 men; 34.7 ± 10.8 years [mean age ± SD])were followed for a median of 10.3 years. Age-and sex-adjusted baseline characteristics of participantsaccording to quintiles of adherence to the different provegetarian FPs are presented in Tables S2–S4.Compared with participants in the first quintile, those in the fifth quintile with higher scores onthe overall and healthful provegetarian FPs were more likely to live alone, follow a special diet,be non-smokers, be more physically active, have a family history of obesity, and have a higher totalenergy and dietary fiber intake. Conversely, those with high scores on the unhealthful provegetarianFP were less physically active, less likely to live alone, more likely to smoke, have snacks, have a highertotal energy intake and lower total fiber intake than those with low scores.
Over 113,213 person-years of follow-up, a total of 2320 new cases of overweight/obesity(BMI ≥ 25 kg/m2) were identified. Hazard ratios (HR) and their 95% confidence intervals (CI) for therisk of overweight/obesity in the age-and sex-adjusted and multivariable-adjusted models are shownin Table 2. In the fully adjusted models, the overall provegetarian FP was inversely associated withoverweight/obesity incidence (HR comparing extreme quintiles: 0.85; 95% CI: 0.75 to 0.96; HR for eachadditional 2 z-score units: 0.89; 95% CI: 0.82 to 0.97; p-trend = 0.014). When we distinguished amonghealthful and unhealthful provegetarian FPs, we found a stronger inverse association between thehealthful provegetarian FP and overweight/obesity incidence (HR comparing extreme quintiles: 0.78;95% CI: 0.67 to 0.90; HR for each additional 2 z-score units: 0.84; 95% CI: 0.77 to 0.92; p-trend < 0.001),whereas null findings were observed for the unhealthful provegetarian FP (HR comparing extremequintiles: 1.07; 95% CI: 0.92 to 1.23; HR for each additional 2 z-score units: 1.00; 95% CI: 0.91 to 1.10;p-trend = 0.551). Results from the multivariable-adjusted models are also graphically representedin Figure 2, showing HRs and 95% CIs of overweight/obesity according to baseline quintiles of the3 provegetarian FPs.

Nutrients 2019, 11, 1553 7 of 17
Figure 2. Hazard ratios (HR) and 95% confidence intervals (CI) of overweight/obesity according tobaseline quintiles of the provegetarian food patterns.
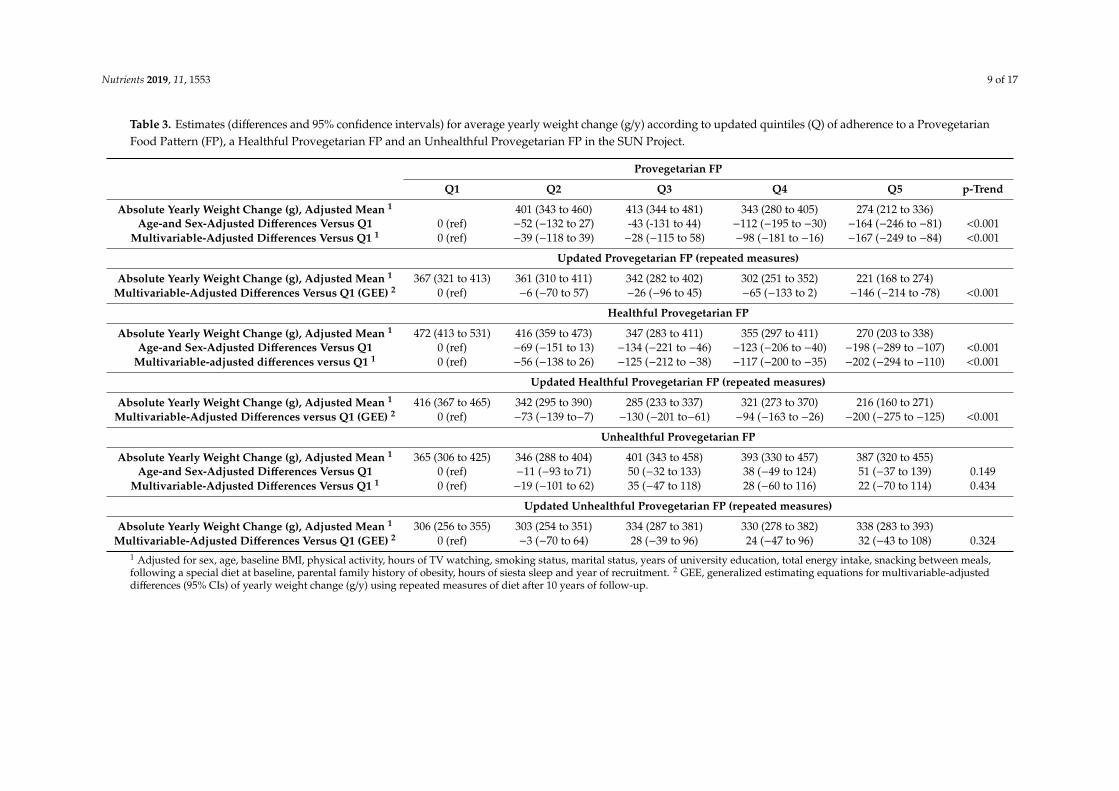
Consistently, absolute average yearly weight change (g/y) modestly decreased across quintilesof overall and healthful provegetarian FPs (i.e., higher adherence to both overall and healthfulprovegetarian FPs was associated with less weight gain over time) and remained fairly constant acrossquintiles of the unhealthful provegetarian FP (Table 3). The average difference in yearly weight gainbetween extreme quintiles of adherence to the overall provegetarian FP was −167 g (95% CI: −249 to−84) and for the healthful provegetarian FP it was −202 g (95% CI: −294 to −110).
In an additional analysis conducted to assess the effect of several provegetarian FPs on incidenceof obesity among overweight participants, a total of 669 new cases of obesity (BMI ≥ 30 kg/m2)were identified. HRs and their 95% CIs for the risk of obesity in the age-and sex-adjusted andmultivariable-adjusted models are shown in Table 4. Fully adjusted estimates suggested that the inverseassociation between the overall and healthful provegetarian food patterns and overweight/obesityamong normal weight participants is not as evident among initially overweight subjects (HR comparingextreme quintiles of the overall provegetarian food pattern: 0.79; 95% CI: 0.61 to 1.02; p-trend = 0.056.HR comparing extreme quintiles of the healthful provegetarian food pattern: 0.79; 95% CI: 0.59 to 1.05;p-trend = 0.066).
In ancillary analyses (data not shown), we investigated the association between adherence toan unhealthful provegetarian FP exclusively composed of plant-based foods (less-healthy plant foodspositively weighted and healthy plant foods negatively weighted) and risk of overweight/obesity.We also explored the association between an unhealthful provegetarian FP composed of less-healthyplant foods (positively weighted) and animal foods (negatively weighted) and risk of overweight/obesity.The purpose of running these ancillary analyses was to study the independent effects of consumingmore less-healthy plant foods compared to healthier plant foods (HR comparing extreme quintiles:1.21; 95% CI: 1.05 to 1.40; p-trend: (0.021) and compared to more animal foods (HR comparing extremequintiles: 0.91; 95% CI: 0.80 to 1.05; p-trend: (0.130).
Sensitivity analyses were conducted to assess the robustness of our results under a variety ofscenarios (Figure 3 and Table S5). The associations of overall and healthful provegetarian FPs withthe risk of overweight/obesity were attenuated when participants with no answer in >12 out of the136 items included in the baseline FFQ were excluded and when obesity (BMI ≥ 30 kg/m2) was themain outcome considered. Slightly stronger associations were found when participants with baselineBMI > 24.5 kg/m2 were excluded. The adverse association with the unhealthful provegetarian FPbecame stronger when the follow-up period was truncated at 10 years.

Nutrients 2019, 11, 1553 8 of 17
Table 2. Risk of overweight/obesity (HR and 95% CI) 1 according to quintiles (Q) of different provegetarian food patterns (FP).
Provegetarian FP Q1 Q2 Q3 Q4 Q5 p-Trend z-Continuous 2
Cases/Person-years 622/29,366 494/24,015 358/17,697 429/20,395 417/21,740 2320/113,213Age-and sex-adjusted 1 (ref) 0.97 (0.86 to 1.10) 0.93 (0.82 to 1.06) 0.94 (0.83 to 1.06) 0.77 (0.68 to 0.88) <0.001 0.83 (0.77 to 0.90)
Repeated measures 1 (ref) 0.98 (0.87 to 1.10) 0.92 (0.81 to 1.05) 0.94 (0.83 to 1.07) 0.76 (0.67 to 0.86) <0.001 0.82 (0.75 to 0.88)Multivariable-adjusted 1 1 (ref) 0.97 (0.85 to 1.09) 0.95 (0.83 to 1.09) 0.93 (0. 82 to1.06) 0.85 (0.75 to 0.96) 0.014 0.89 (0.82 to 0.97)
Repeated measures 1 (ref) 0.98 (0.87 to 1.11) 0.94 (0.83 to 1.08) 0.94 (0. 83 to1.06) 0.83 (0.73 to 0.95) 0.005 0.88 (0.81 to 0.95)
Healthful ProvegetarianFP
Cases/Person-years 490/24,576 528/24,878 413/19,903 516/25,293 373/18,563 2320/113,213
Age-and sex-adjusted 1 (ref) 0.99 (0.87 to 1.12) 0.95 (0.84 to 1.09) 0.89 (0.79 to 1.01) 0.81 (0.71 to 0.93) 0.001 0.87 (0.80 to 0.94)Repeated measures 1 (ref) 0.99 (0.88 to 1.12) 0.94 (0.82 to 1.07) 0.92 (0.81 to 1.04) 0.80 (0.70 to 0.92) 0.001 0.87 (0.80 to 0.94)
Multivariable-adjusted 1 1 (ref) 0.98 (0.86 to 1.12) 0.87 (0.76 to 1.00) 0.87 (0.76 to 0.99) 0.78 (0.67 to 0.90) <0.001 0.84 (0.77 to 0.92)Repeated measures 1 (ref) 0.98 (0.86 to 1.11) 0.85 (0.74 to 0.97) 0.89 (0.78 to 1.01) 0.76 (0.66 to 0.88) <0.001 0.84 (0.77 to 0.92)
UnhealthfulProvegetarian FP
Cases/Person-years 544/23,243 516/24,135 514/25,004 388/20,549 358/20,282 2320/113,213Age-and sex-adjusted 1 (ref) 0.94 (0.83 to 1.06) 0.93 (0.82 to 1.05) 0.88 (0.77 to 1.00) 0.84 (0.73 to 0.96) 0.006 0.88 (0.81 to 0.96)
Repeated measures 1 (ref) 0.95 (0.85 to 1.08) 0.92 (0.81 to 1.04) 0.87 (0.76 to 0.99) 0.86 (0.75 to 0.99) 0.012 0.88 (0.81 to 0.96)Multivariable-adjusted 1 1 (ref) 1.03 (0.91 to 1.17) 1.04 (0.92 to 1.18) 1.00 (0.87 to 1.15) 1.07 (0.92 to 1.23) 0.551 1.00 (0.91 to 1.10)
Repeated measures 1 (ref) 1.04 (0.92 to 1.17) 1.03 (0.91 to 1.16) 0.99 (0.86 to 1.13) 1.09 (0.94 to 1.26) 0.416 1.01 (0.92 to 1.10)
Age was used as the underlying time variable in all the models. All the models were stratified by age groups (10-year periods) and year of recruitment (4-year periods). 1 Additionallyadjusted for baseline body mass index (BMI, kg/m2, continuous), physical activity (metabolic equivalents (METs)-h/week, quartiles), hours of TV watching (quartiles), smoking status(current, never, former), marital status (single, married, other), years of university education (years, continuous), total energy intake (kcal/day, continuous), snacking between meals (yes,no), following a special diet at baseline (yes, no), parental family history of obesity (yes, no), hours of siesta (0, >0 to ≤0.5, >0.5). Robust standard errors were used. 2 Standardized z-scoresdivided by 2 (i.e., HR and 95% CI for each additional 2 z-score units).
Nutrients 2019, 11, 1553 9 of 17
Table 3. Estimates (differences and 95% confidence intervals) for average yearly weight change (g/y) according to updated quintiles (Q) of adherence to a ProvegetarianFood Pattern (FP), a Healthful Provegetarian FP and an Unhealthful Provegetarian FP in the SUN Project.
Provegetarian FP
Q1 Q2 Q3 Q4 Q5 p-Trend
Absolute Yearly Weight Change (g), Adjusted Mean 1 401 (343 to 460) 413 (344 to 481) 343 (280 to 405) 274 (212 to 336)Age-and Sex-Adjusted Differences Versus Q1 0 (ref) −52 (−132 to 27) -43 (-131 to 44) −112 (−195 to −30) −164 (−246 to −81) <0.001
Multivariable-Adjusted Differences Versus Q1 1 0 (ref) −39 (−118 to 39) −28 (−115 to 58) −98 (−181 to −16) −167 (−249 to −84) <0.001
Updated Provegetarian FP (repeated measures)
Absolute Yearly Weight Change (g), Adjusted Mean 1 367 (321 to 413) 361 (310 to 411) 342 (282 to 402) 302 (251 to 352) 221 (168 to 274)Multivariable-Adjusted Differences Versus Q1 (GEE) 2 0 (ref) −6 (−70 to 57) −26 (−96 to 45) −65 (−133 to 2) −146 (−214 to -78) <0.001
Healthful Provegetarian FP
Absolute Yearly Weight Change (g), Adjusted Mean 1 472 (413 to 531) 416 (359 to 473) 347 (283 to 411) 355 (297 to 411) 270 (203 to 338)Age-and Sex-Adjusted Differences Versus Q1 0 (ref) −69 (−151 to 13) −134 (−221 to −46) −123 (−206 to −40) −198 (−289 to −107) <0.001
Multivariable-adjusted differences versus Q1 1 0 (ref) −56 (−138 to 26) −125 (−212 to −38) −117 (−200 to −35) −202 (−294 to −110) <0.001
Updated Healthful Provegetarian FP (repeated measures)
Absolute Yearly Weight Change (g), Adjusted Mean 1 416 (367 to 465) 342 (295 to 390) 285 (233 to 337) 321 (273 to 370) 216 (160 to 271)Multivariable-Adjusted Differences versus Q1 (GEE) 2 0 (ref) −73 (−139 to−7) −130 (−201 to−61) −94 (−163 to −26) −200 (−275 to −125) <0.001
Unhealthful Provegetarian FP
Absolute Yearly Weight Change (g), Adjusted Mean 1 365 (306 to 425) 346 (288 to 404) 401 (343 to 458) 393 (330 to 457) 387 (320 to 455)Age-and Sex-Adjusted Differences Versus Q1 0 (ref) −11 (−93 to 71) 50 (−32 to 133) 38 (−49 to 124) 51 (−37 to 139) 0.149
Multivariable-Adjusted Differences Versus Q1 1 0 (ref) −19 (−101 to 62) 35 (−47 to 118) 28 (−60 to 116) 22 (−70 to 114) 0.434
Updated Unhealthful Provegetarian FP (repeated measures)
Absolute Yearly Weight Change (g), Adjusted Mean 1 306 (256 to 355) 303 (254 to 351) 334 (287 to 381) 330 (278 to 382) 338 (283 to 393)Multivariable-Adjusted Differences Versus Q1 (GEE) 2 0 (ref) −3 (−70 to 64) 28 (−39 to 96) 24 (−47 to 96) 32 (−43 to 108) 0.324
1 Adjusted for sex, age, baseline BMI, physical activity, hours of TV watching, smoking status, marital status, years of university education, total energy intake, snacking between meals,following a special diet at baseline, parental family history of obesity, hours of siesta sleep and year of recruitment. 2 GEE, generalized estimating equations for multivariable-adjusteddifferences (95% CIs) of yearly weight change (g/y) using repeated measures of diet after 10 years of follow-up.

Nutrients 2019, 11, 1553 10 of 17
Table 4. Risk of obesity (HR and 95% CI) 1 in overweight participants (n = 3935) according to quintiles of different provegetarian food patterns (FP).
Provegetarian FP Q1 Q2 Q3 Q4 Q5 p-Trend z-Continuous 2
Cases/Person-years 178/9650 162/8178 96/5655 126/7693 107/8288 2320/113,213Age-and sex-adjusted 1 (ref) 1.06 (0.86 to 1.32) 0.93 (0.72 to 1.20) 0.90 (0.72 to 1.14) 0.71 (0.55 to 0.90) 0.003 0.78 (0.67 to 0.91)
Repeated measures 1 (ref) 1.06 (0.86 to 1.32) 0.86 (0.67 to 1.12) 0.92 (0.73 to 1.16) 0.74 (0.58 to 0.94) 0.007 0.80 (0.68 to 0.93)Multivariable-adjusted 1 1 (ref) 1.09 (0.87 to 1.36) 0.91 (0.70 to 1.18) 0.96 (0.75 to 1.23) 0.79 (0.61 to 1.02) 0.056 0.82 (0.69 to 0.98)
Repeated measures 1 (ref) 1.03 (0.83 to 1.29) 0.83 (0.64 to 1.08) 0.97 (0.77 to 1.24) 0.83 (0.65 to 1.07) 0.123 0.85 (0.72 to 1.01)Healthful Provegetarian FP
Cases/Person-years 141/7423 139/7876 135/6808 149/9846 105/7510 2320/113,213Age-and sex-adjusted 1 (ref) 0.95 (0.75 to 1.20) 1.04 (0.82 to 1.32) 0.80 (0.63 to 1.01) 0.73 (0.56 to 0.95) 0.006 0.79 (0.68 to 0.93)
Repeated measures 1 (ref) 0.98 (0.77 to 1.23) 1.05 (0.83 to 1.33) 0.78 (0.62 to 0.99) 0.74 (0.57 to 0.96) 0.004 0.79 (0.68 to 0.92)Multivariable-adjusted 1 1 (ref) 0.93 (0.73 to 1.20) 1.03 (0.80 to 1.33) 0.86 (0.67 to 1.10) 0.79 (0.59 to 1.05) 0.066 0.87 (0.73 to 1.04)
Repeated measures 1 (ref) 0.94 (0.74 to 1.21) 1.04 (0.81 to 1.34) 0.82 (0.64 to 1.05) 0.79 (0.60 to 1.03) 0.036 0.86 (0.73 to 1.02)Unhealthful Provegetarian FP
Cases/Person-years 179/9930 143/8761 144/8338 108/6443 95/5991 2320/113,213Age-and sex-adjusted 1 (ref) 0.93 (0.74 to 1.16) 0.99 (0.79 to 1.24) 0.93 (0.73 to 1.19) 0.87 (0.68 to 1.11) 0.305 0.92 (0.78 to 1.07)
Repeated measures 1 (ref) 0.92 (0.74 to 1.14) 0.97 (0.78 to 1.21) 0.90 (0.70 to 1.15) 0.86 (0.67 to 1.11) 0.256 0.92 (0.78 to 1.08)Multivariable-adjusted 1 1 (ref) 1.12 (0.90 to 1.40) 1.05 (0.83 to 1.32) 1.03 (0.80 to 1.33) 0.96 (0.73 to 1.26) 0.763 0.96 (0.81 to 1.14)
Repeated measures 1 (ref) 1.12 (0.90 to 1.39) 1.04 (0.83 to 1.31) 1.02 (0.79 to 1.30) 0.95 (0.73 to 1.25) 0.698 0.97 (0.82 to 1.15)
Age was used as the underlying time variable in all the models. All the models were stratified by age groups (10-year periods) and year of recruitment (4-year periods). 1 Additionallyadjusted for baseline BMI (kg/m2, continuous), physical activity (METs-h/week, quartiles), hours of TV watching (quartiles), smoking status (current, never, former), marital status (single,married, other), years of university education (years, continuous), total energy intake (kcal/day, continuous), snacking between meals (yes, no), following a special diet at baseline (yes, no),parental family history of obesity (yes, no), hours of siesta (0, >0 to ≤0.5, >0.5). Robust standard errors were used. 2 Standardized z-scores divided by 2 (i.e., HR and 95% CI for eachadditional 2 z-score units).

Nutrients 2019, 11, 1553 11 of 17
Figure 3. Sensitivity Analyses (results under different scenarios). Hazard Ratios (95% CI) of incidentoverweight/obesity for extreme quintiles (Q5 vs. Q1) of adherence to the overall, healthful andunhealthful provegetarian food patterns.

Nutrients 2019, 11, 1553 12 of 17
4. Discussion
In a Mediterranean dynamic prospective cohort study composed of university graduates withan initial BMI < 25 kg/m2 (normal weight), we found that a general preference for plant-derivedfoods (provegetarian FP) was modestly associated with lower risk of subsequently developingoverweight/obesity during follow-up. This inverse association was considerably stronger when wespecifically evaluated the preference for healthy plant-derived foods (healthful provegetarian FP),whereas no such association was found for the preference for less healthy plant-derived foods(unhealthful provegetarian FP). Our findings were robust in sensitivity analyses and remainedconsistent and significant when updating diet measurements with the use of repeated nutritional dataobtained from the FFQ administered after 10 years of follow-up. Additional analyses including normalweight and overweight participants with an initial BMI < 30 kg/m2 revealed that we cannot be equallycertain about the inverse association between these provegetarian food patterns and obesity amongoverweight subjects. These results are in line with recent findings from three ongoing prospectivecohort studies in the United States, which were published while our paper was under review [25].
A-priori defined provegetarian indices were used to assess the effect of preference for plant-derivedfoods compared with preferential selection of foods from animal sources on the risk of new-onsetoverweight/obesity. This approach builds on previous research and includes well-defined food groupswith varying nutritional content. Thus, results are in close agreement with previous findings, whichcould be expected, as most healthy plant foods positively weighed in the healthful provegetarian FP(vegetables, fruits, legumes, whole grains, nuts, olive oil, coffee) have been consistently associatedwith lower risk of weight gain. Likewise, less-healthy plant foods positively weighed in theunhealthful provegetarian FP (fruit juices, potatoes, refined grains, sugary beverages, pastries)have been consistently associated with higher risk of weight gain [48]. Noteworthy, most of thecereal grains consumed by our participants were refined, especially white bread, which accountedfor 49% of the cereal group. In addition, according to the NOVA (a name, not an acronym) foodclassification system that categorizes foods based on the extent and purpose of food processing,plant-based foods such as sugary beverages and pastries can be considered ultra-processed foods. Theirconvenience (imperishable, ready-to-consume), hyper-palatability, branding and aggressive marketinggive ultra-processed foods enormous market advantages over minimally processed healthy food, andtheir consumption has been systematically associated with the deterioration of overall nutritionalquality of diets and with several chronic non-communicable diseases including obesity [49]. Therefore,from a public health perspective, focusing solely on plant or animal origin of foods may not be themost effective message in terms of obesity prevention.
The associations observed between a general preference for plant-derived foods and lowerrisk of overweight/obesity are consistent with previous research [12–20]. In particular, preferencefor less-healthy plant foods was associated with an increased risk of overweight/obesity comparedwith preferential selection of healthier plant foods, as could be expected. However, preference forless-healthy plant foods did not affect the risk of overweight/obesity compared with preference forfoods from animal sources. These results suggest that plant-based foods should be prioritized overanimal foods, and reinforce the importance of a preference for healthier plant foods in terms of weightgain prevention. Similarly, a recent study found that exclusion of less healthy plant-based foodsfrom a plant-based diet index did not substantially change its beneficial effect, while exclusion of thehealthy plant-based foods combined from the plant-based diet index moderately attenuated the inverseassociation. Therefore, it seems that healthy plant foods could apparently be driving the observedbeneficial effect. The associations were also moderately attenuated by giving healthier animal foodspositive scores [12]. Additionally, another study found that a greater consumption of sugar-sweetenedbeverages and ultra-processed food was associated with a higher risk of being overweight amongvegetarians [50], which further supports our results. Hence, an additional implication of this studyis to call for evidence regarding the effects on health and sustainability of innovatively processedplant-based products that are becoming increasingly common among consumers.

Nutrients 2019, 11, 1553 13 of 17
The potential mechanisms underlying our findings may be related to the preventive effect againstoverweight/obesity of a high intake of foods containing dietary fiber and bioactive compounds, whichare naturally found in fruits and vegetables. Minimally processed plant-based foods are typically low inenergy density and contain high concentrations of micronutrients and phytochemicals like flavonoidsthat may have a beneficial influence on energy homeostatic pathways [51]. Other components like fibermay also increase satiation and positively modulate gut microbiota composition [30]. In fact, we foundevidence that fiber may mediate the beneficial effect of a provegetarian diet on overweight/obesity(i.e., the inverse association was attenuated after additionally adjusting for total fiber intake [g/day]).Another study in the SUN cohort found a significant inverse association between the CQI andthe incidence of overweight/obesity, which highlights the importance of preferentially consuminghigh-quality carbohydrates in terms of obesity prevention [52]. Moreover, vegetable-and fruit-baseddietary patterns have been suggested to modulate inflammation status [53], and a previous study inour cohort found that a higher proinflammatory diet was associated with a higher risk of overweightand obesity [54].
Beyond the health of individuals, and taking into consideration the health of our planet, it is alsoknown that the adoption of provegetarian food patterns could significantly reduce greenhouse gasemissions [1] as well as other environmental impacts, and it is not as expensive as adopting otherhealthy and environmentally friendly dietary patterns such as the Mediterranean Diet (MedDiet) [55].This focus may be a useful strategy to change dietary behaviors in the general public towardsa healthier diet, as it is a way to connect with deeper needs and desires of people while improvingtheir health as a side effect [56]. Although the MedDiet is also associated with a significantly lowerrisk of overweight/obesity in our cohort (HR [95% CI] for the highest category of adherence to theMDS [range 6–9] vs the lowest [range 0–3]: 0.78 [0.69 to 0.87]) and represents a food pattern rich inplant-derived foods, there are some important differences between the provegetarian food pattern andthe MedDiet in relation to the scoring criteria for fish, potatoes and alcohol. In fact, the provegetarianFP and its healthful version were only moderately correlated (Pearson correlation coefficient: 0.54) withthe traditional MedDiet (as defined by the MDS score proposed by Trichopoulou et al. [43]), reflectingthat these are novel diet indices that capture unique aspects of a pro-vegetarian diet. Importantly,linking obesity with other major global challenges like climate change and health of the planet focusesattention on the scale and urgency of addressing these challenges and may increase demand forpolicy action by the public [57]. Our study reinforces current evidence and recommendations thatsuggest a shift towards diets rich in plant foods with lower intake of animal foods, and emphasizes theimportance of prioritizing healthy plant foods. Finally, the present study also provides insights for thedevelopment of innovative foods of plant origin by food scientists and the food industry. The designof new foods should be performed within boundaries of key nutrients (e.g., added sugar and salt),but also boundaries in the number of ingredients and their level of processing.
The strengths of the present study include the prospective longitudinal design with a longfollow-up period and a relatively large sample size; the restriction to participants with baselineBMI < 25 kg/m2, which minimized the possibility of reverse causation bias; and the use of repeatedmeasurements of the diet, which reduced potential measurement errors and increase validity ofwell-validated self-reported comprehensive food-frequency methods such as the SUN cohort FFQ thathas been repeatedly validated in Spanish participants [36,37].
The present study also has some limitations. Although we adjusted for a wide array of potentialconfounders, we cannot exclude the possibility of residual confounding given the observational natureof the study design and the fact that adherence to the overall and healthful provegetarian was higheramong participants with healthier characteristics (non-smokers, higher levels of physical activity).However, the restriction to highly educated participants was applied to control for confounding bysocioeconomic status, which is an approach considered in epidemiology as an excellent technique toreduce confounding [58]. This also implies that our sample from the SUN cohort is not representative ofthe general Spanish population. However, most cohorts are usually non-representative, and “it is not

Nutrients 2019, 11, 1553 14 of 17
representativeness of the study subjects that enhances the generalization, it is knowledge of specificconditions and an understanding of mechanism that makes for a proper generalization” [59]. Therefore,the dose-response trend found in our results, as well as the consistency with previous studies and theexistence of biological plausibility confer high potential of causality for the benefits of a plant-baseddietary pattern, particularly a healthy provegetarian pattern, in the prevention of long-term weight gain.Another potential limitation is that weight and dietary information were self-reported so, althoughthey were validated as previously mentioned, we cannot rule out some degree of nondifferentialmisclassification. Moreover, whole grain consumption has only recently started to be more common inSpain, so the only whole grain product included in the FFQ was brown bread. Therefore, we couldnot fully consider the effect of a higher consumption of other whole grains on the risk of incidentoverweight and obesity.
In conclusion, higher adherence to a provegetarian FP emphasizing preference for healthyplant-derived foods was associated with a lower risk of developing overweight and obesity in a cohortof Spanish university graduates with initial low body mass index. Given that excess weight is alsoa critical risk factor for developing other increasingly frequent non-communicable chronic diseases,a generalized adoption of healthful provegetarian diets is an important target that should be consideredin future public health policies.
Supplementary Materials: The following are available online at http://www.mdpi.com/2072-6643/11/7/1553/s1,Table S1. Food groups included in the provegetarian food patterns and food items from the SUN Project baselineFFQ, Table S2. Age-and sex-adjusted baseline characteristics (means [SDs] for continuous variables and percentagesfor dichotomous variables) by quintiles of the provegetarian food pattern in the SUN cohort, Table S3. Age-andsex-adjusted baseline characteristics (means [SDs] for continuous variables and percentages for dichotomousvariables) by quintiles of the healthful provegetarian food pattern in the SUN cohort, Table S4. Age-and sex-adjustedbaseline characteristics (means [SDs] for continuous variables and percentages for dichotomous variables) byquintiles of the unhealthful provegetarian food pattern in the SUN cohort, Table S5: Sensitivity analyses. HazardRatios (95% confidence intervals) of incident overweight/obesity for extreme quintiles (Q5 vs. Q1) of adherence tothe different provegetarian food patterns. Figure S1. Percentage differences between extreme quintiles (quintile1 and 5) and median scores (quintile 3) for the consumption of each food category of the provegetarian foodpattern: Overall study population (The SUN Project, 1999–2015). Figure S2. Percentage differences betweenextreme quintiles (quintile 1 and 5) and median scores (quintile 3) for the consumption of each food category ofthe healthful provegetarian food pattern: Overall study population. Figure S3. Percentage differences betweenextreme quintiles (quintile 1 and 5) and median scores (quintile 3) for the consumption of each food category ofthe unhealthful provegetarian food pattern: overall study population.
Author Contributions: Conceptualization, M.Á.M.G., M.B.R. and F.J.A.P.C.; methodology, M.Á.M.G. andM.B.R.; validation, M.Á.M.G. and M.B.R.; formal analysis, C.G.D., A.G. and J.S.S.; investigation, M.Á.M.G. andM.B.R.; resources, M.Á.M.G. and M.B.R.; data curation, M. Á.M.G.; writing—original draft preparation, C.G.D.;writing—review and editing, all authors; supervision, M.B.R. and J.A.M.; project administration, M.Á.M.G. andM.B.R.; funding acquisition, M. Á.M.G. and M.B.R.
Funding: This research was funded by the Spanish Government-Instituto de Salud Carlos III, the EuropeanRegional Development Fund (FEDER) (RD 06/0045, CIBER-OBN, Grants PI10/02658, PI10/02293, PI13/00615,PI14/01668, PI14/01798, PI14/01764, PI17/01795, and G03/140), the Navarra Regional Government (45/2011,122/2014), and the University of Navarra. C.G.D. was supported by a predoctoral contract for training in healthresearch (PFIS) (FI18/00073) of the Instituto de Salud Carlos III.
Acknowledgments: The authors are indebted to the participants of the SUN cohort for their continued cooperationand participation. We are also grateful to the members of the Department of Nutrition of the Harvard School ofPublic Health (Willett W.C., Hu F.B., and Ascherio A.) who helped us to design the SUN study. We also thank theother members of the SUN Group.
Conflicts of Interest: The authors declare no conflicts of interest.
References
1. Springmann, M.; Clark, M.; Mason-D’Croz, D.; Wiebe, K.; Bodirsky, B.; Lassaletta, L.; de Vries, W.;Vermeulen, S.; Herrero, M.; Carlson, K.; et al. Options for keeping the food system within environmentallimits. Nature 2018, 562, 519–525. [CrossRef] [PubMed]
Nutrients 2019, 11, 1553 15 of 17
2. Godfray, H.C.J.; Aveyard, P.; Garnett, T.; Hall, J.W.; Key, T.J.; Lorimer, J.; Pierrehumber, R.T.; Scarborough, P.;Springmann, M.; Jebb, S.A. Meat consumption, health, and the environment. Science 2018, 361, 5324.[CrossRef] [PubMed]
3. Willett, W.; Rockström, J.; Loken, B.; Springmann, M.; Lang, T.; Vermeulen, S.; Garnett, T.; Tilman, D.;Declerck, F.; Wood, A.; et al. Food in the Anthropocene: The EAT–Lancet Commission on healthy diets fromsustainable food systems. Lancet 2019, 393, 447–492. [CrossRef]
4. Key, T.; Fraser, G.; Thorogood, M.; Appleby, P.; Beral, V.; Reeves, G.; Burr, M.; Chang-Claude, J.;Frentzel-Beyme, R.; Kuzma, J.; et al. Mortality in Vegetarians and Nonvegetarians: Detailed Findings from ACollaborative Analysis Of 5 Prospective Studies. Am. J. Clin. Nutr. 1999, 70, 516s–524s. [CrossRef] [PubMed]
5. Fraser, G.E. Vegetarian diets: What do we know of their effects on common chronic diseases? Am. J. Clin. Nutr.2009, 89, 1607S–1612S. [CrossRef] [PubMed]
6. McEvoy, C.T.; Temple, N.; Woodside, J.V. Vegetarian diets, low-meat diets and health: A review. Public HealthNutr. 2012, 15, 2287–2294. [CrossRef] [PubMed]
7. Huang, T.; Yang, B.; Zheng, J.; Li, G.; Wahlqvist, M.; Li, D. Cardiovascular disease mortality and cancerincidence in vegetarians: A meta-analysis and systematic review. Ann. Nutr. Metab. 2012, 60, 233–240.[CrossRef] [PubMed]
8. Orlich, M.; Singh, P.; Sabaté, J.; Jaceldo-Siegl, K.; Fan, J.; Knutsen, S.; Beeson, W.; Fraser, G. Vegetarian DietaryPatterns and Mortality in Adventist Health Study 2. JAMA Intern. Med. 2013, 173, 1230–1238. [CrossRef]
9. Kwok, C.; Umar, S.; Myint, P.; Mamas, M.; Loke, Y. Vegetarian Diet, Seventh Day Adventists and Riskof Cardiovascular Mortality: A Systematic Review and Meta-Analysis. Int. J. Cardiol. 2014, 176, 680–686.[CrossRef]
10. Martínez-González, M.A.; Sanchez-Tainta, A.; Corella, D.; Salas-Salvadó, J.; Ros, E.; Arós, F.; Gómez-Gracia, E.;Fiol, M.; Lamuela-Raventós, R.M.; Schröder, H.; et al. A provegetarian food pattern and reduction in totalmortality in the Prevencion con Dieta Mediterranea (PREDIMED) study. Am. J. Clin. Nutr. 2014, 100, 320S–328S.[CrossRef]
11. Chen, Z.; Zuurmond, M.; van der Schaft, N.; Nano, J.; Wijnhoven, H.; Ikram, M.; Franco, O.; Voortman, T.Plant Versus Animal Based Diets and Insulin Resistance, Prediabetes and Type 2 Diabetes: The RotterdamStudy. Eur. J. Epidemiol. 2018, 33, 883–893. [CrossRef] [PubMed]
12. Chen, Z.; Schoufour, J.; Rivadeneira, F.; Lamballais, S.; Ikram, M.; Franco, O.; Voortman, T. Plant-BasedDiet and Adiposity Over Time in A Middle-Aged and Elderly Population. Epidemiology 2018, 30, 303–310.[CrossRef] [PubMed]
13. Turner-McGrievy, G.M.; Mandes, T.; Crimarco, A. A plant-based diet for overweight and obesity preventionand treatment. J. Geriatr. Cardiol. 2017, 14, 369–374. [PubMed]
14. Huang, R.Y.; Huang, C.C.; Hu, F.B.; Chavarro, J.E. Vegetarian diets and weight reduction: A meta-analysis ofrandomized controlled trials. J. Gen. Intern. Med. 2016, 31, 109–116. [CrossRef] [PubMed]
15. Turner-McGrievy, G.M.; Davidson, C.R.; Wingard, E.E.; Wilcox, S.; Frongillo, E.A. Comparative effectivenessof plant-based diets for weight loss: A randomized controlled trial of five different diets. Nutrition 2015, 31,350–358. [CrossRef] [PubMed]
16. Tonstad, S.; Butler, T.; Yan, R.; Fraser, G.E. Type of vegetarian diet, body weight, and prevalence of type 2diabetes. Diabetes Care 2009, 32, 791–796. [CrossRef] [PubMed]
17. Rosell, M.; Appleby, P.; Spencer, E.; Key, T. Weight gain over 5 years in 21 966 meat-eating, fish-eating,vegetarian, and vegan men and women in EPIC-Oxford. Int. J. Obes. 2006, 30, 1389–1396. [CrossRef]
18. Newby, P.; Tucker, K.L.; Wolk, A. Risk of overweight and obesity among semivegetarian, lactovegetarian,and vegan women. Am. J. Clin. Nutr. 2005, 81, 1267–1274. [CrossRef]
19. Spencer, E.A.; Appleby, P.N.; Davey, G.K.; Key, T.J. Diet and Body Mass Index in 38 000 EPIC-OxfordMeat-Eaters, Fish-Eaters, Vegetarians and Vegans. Int. J. Obes. 2003, 27, 728–734. [CrossRef]
20. Schulz, M.; Nöthlings, U.; Hoffmann, K.; Bergmann, M.M.; Boeing, H. Identification of a food patterncharacterized by high-fiber and low-fat food choices associated with low prospective weight change in theEPIC-Potsdam cohort. J. Nutr. 2005, 135, 1183–1189. [CrossRef]
21. Hruby, A.; Manson, J.E.; Qi, L.; Malik, V.S.; Rimm, E.B.; Sun, Q.; Willett, W.C.; Hu, F.B. Determinants andconsequences of obesity. Am. J. Public Health 2016, 106, 1656–1662. [CrossRef]

Nutrients 2019, 11, 1553 16 of 17
22. Foreman, K.; Marquez, N.; Dolgert, A.; Fukutaki, K.; Fullman, N.; McGaughey, M.; Pletcher, M.; Smith, A.;Tang, K.; Yuan, C.; et al. Forecasting Life Expectancy, Years of Life Lost, And All-Cause and Cause-SpecificMortality For 250 Causes of Death: Reference and Alternative Scenarios For 2016–40 For 195 Countries andTerritories. Lancet 2018, 392, 2052–2090. [CrossRef]
23. Satija, A.; Bhupathiraju, S.N.; Rimm, E.B.; Spiegelman, D.; Chiuve, S.E.; Borgi, L.; Willett, W.C.; Manson, J.E.;Sun, Q.; Hu, F.B. Plant-Based Dietary Patterns and Incidence of Type 2 Diabetes in US Men and Women:Results from Three Prospective Cohort Studies. PLoS Med. 2016, 13, e1002039. [CrossRef] [PubMed]
24. Satija, A.; Bhupathiraju, S.; Spiegelman, D.; Chiuve, S.; Manson, J.; Willett, W.; Rexrode, K.; Rimm, E.; Hu, F.B.Healthful and Unhealthful Plant-Based Diets and The Risk of Coronary Heart Disease In, U.S. Adults.J. Am. Coll. Cardiol. 2017, 70, 411–422. [CrossRef] [PubMed]
25. Satija, A.; Malik, V.; Rimm, E.B.; Sacks, F.; Willett, W.; Hu, F.B. Changes in intake of plant-based diets andweight change: Results from 3 prospective cohort studies. Am. J. Clin. Nutr. 2019. [CrossRef] [PubMed]
26. Kim, H.; Caulfield, L.E.; Rebholz, C.M. Healthy Plant-Based Diets Are Associated with Lower Risk ofAll-Cause Mortality in US Adults. J. Nutr. 2018, 148, 624–631. [CrossRef] [PubMed]
27. Kim, H.; Caulfield, L.E.; Garcia-Larsen, V.; Steffen, L.M.; Grams, M.E.; Coresh, J.; Rebholz, C.M. Plant-BasedDiets and Incident CKD and Kidney Function. Clin. J. Am. Soc. Nephrol. 2019, 14, 682–691. [CrossRef][PubMed]
28. McKeown, N.; Jacobs, D. In Defence Of Phytochemical-Rich Dietary Patterns. Br. J. Nutr. 2010, 104, 1–3.[CrossRef]
29. Liang, N.; Kitts, D.D. Role of Chlorogenic Acids in Controlling Oxidative and Inflammatory Stress Conditions.Nutrients 2015, 8, 16. [CrossRef]
30. Cuevas-Sierra, A.; Ramos-Lopez, O.; Riezu-Boj, J.I.; Milagro, F.I.; Martinez, J.A. Diet, Gut Microbiota, andObesity: Links with Host Genetics and Epigenetics and Potential Applications. Adv. Nutr. 2019, 10, S17–S30.
31. Song, M.; Fung, T.; Hu, F.; Willett, W.; Longo, V.; Chan, A.; Giovannucci, E. Association of Animal andPlant Protein Intake with All-Cause and Cause-Specific Mortality. JAMA Intern. Med. 2016, 176, 1453–1463.[CrossRef] [PubMed]
32. Westerterp-Plantenga, M.; Nieuwenhuizen, A.; Tomé, D.; Soenen, S.; Westerterp, K. Dietary Protein, WeightLoss, and Weight Maintenance. Annu. Rev. Nutr. 2009, 29, 21–41. [CrossRef] [PubMed]
33. Lopez-Garcia, E.; Schulze, M.; Fung, T.; Meigs, J.; Rifai, N.; Manson, J.; Hu, F. Major Dietary Patterns AreRelated to Plasma Concentrations of Markers of Inflammation and Endothelial Dysfunction. Am. J. Clin.Nutr. 2004, 80, 1029–1035. [CrossRef] [PubMed]
34. Watzl, B.; Kulling, S.; Möseneder, J.; Barth, S.; Bub, A. A 4-Wk Intervention with High Intake of Carotenoid-RichVegetables and Fruit Reduces Plasma C-Reactive Protein in Healthy, Nonsmoking Men. Am. J. Clin. Nutr.2005, 82, 1052–1058. [CrossRef] [PubMed]
35. Ma, Y.; Griffith, J.A.; Chasan-Taber, L.; Olendzki, B.C.; Jackson, E.; Stanek, E.J.; Li, W.; Pagoto, S.L.; Hafner, A.R.;Ockene, I.S. Association between dietary fiber and serum C-reactive protein. Am. J. Clin. Nutr. 2006, 83,760–766. [CrossRef]
36. Hermsdorff, H.H.; Zulet, M.; Puchau, B.; Martínez, J.A. Fruit and vegetable consumption and proinflammatorygene expression from peripheral blood mononuclear cells in young adults: A translational study. Nutr. Metab.2010, 7, 42. [CrossRef] [PubMed]
37. Lopez-Legarrea, P.; Iglesia, R.D.L.; Abete, I.; Navas-Carretero, S.; Martinez, J.A.; Zulet, M.A. The protein typewithin a hypocaloric diet affects obesity-related inflammation: The RESMENA project. Nutrition 2014, 30,424–429. [CrossRef]
38. Carlos, S.; Fuente-Arrillaga, C.; Bes-Rastrollo, M.; Razquin, C.; Rico-Campà, A.; Martínez-González, M.A.;Ruiz-Canela, M. Mediterranean Diet and Health Outcomes in the SUN Cohort. Nutrients 2018, 10, 439.[CrossRef]
39. De la Fuente-Arrillaga, C.; Ruiz, Z.V.; Bes-Rastrollo, M.; Sampson, L.; Martinez-González, M.A.Reproducibility of an FFQ validated in Spain. Public Health Nutr. 2010, 13, 1364–1372. [CrossRef]
40. Martin-Moreno, J.M.; Boyle, P.; Gorgojo, L.; Maisonneuve, P.; Fernandez-Rodriguez, J.C.; Salvini, S.;Willett, W.C. Development and validation of a food frequency questionnaire in Spain. Int. J. Epidemiol. 1993,22, 512–519. [CrossRef]
41. Mataix, J. Tabla de Composición de Alimentos, 5th ed.; Universidad de Granada: Granada, Spain, 2009.

Nutrients 2019, 11, 1553 17 of 17
42. Moreiras, O.; Carbajal, A.; Cabrera, L.; Cuadrado, C. Tablas de Composición de Los Alimentos; de Prácticas, G.,Ed.; Pirámide: Madrid, Spain, 2015.
43. Trichopoulou, A.; Costacou, T.; Bamia, C.; Trichopoulos, D. Adherence to a Mediterranean diet and survivalin a Greek population. N. Engl. J. Med. 2003, 348, 2595–2596. [CrossRef] [PubMed]
44. Martínez-González, M.A.; López-Fontana, C.; Varo, J.J.; Sánchez-Villegas, A.; Martinez, J.A. Validation ofthe Spanish version of the physical activity questionnaire used in the Nurses’ Health Study and the HealthProfessionals’ Follow-up Study. Public Health Nutr. 2005, 8, 920–927. [CrossRef] [PubMed]
45. Zazpe, I.; Sánchez-Taínta, A.; Santiago, S.; Fuente-Arrillaga, C.D.L.; Bes-Rastrollo, M.; Martínez, J.A.;Martínez-González, M.A. Association between dietary carbohydrate intake quality and micronutrient intakeadequacy in a Mediterranean cohort: The SUN (Seguimiento Universidad de Navarra) Project. Br. J. Nutr.2014, 111, 2000–2009. [CrossRef] [PubMed]
46. Sanchez-Tainta, A.; Zazpe, I.; Bes-Rastrollo, M.; Salas-Salvado, J.; Bullo, M.; Sorli, J.V.; Corella, D.; Covas, M.I.;Arós, F.; Gutierrez-Bedmar, M.; et al. Nutritional adequacy according to carbohydrates and fat quality.Eur. J. Nutr. 2016, 55, 93–106. [CrossRef] [PubMed]
47. Bes-Rastrollo, M.; Pérez, J.R.; Sánchez-Villegas, A.; Alonso, A.; Martínez-González, M.A. Validation ofself-reported weight and body mass index in a cohort of university graduates in Spain. Rev. Esp. Obes. 2005,3, 352–358.
48. Mozaffarian, D. Dietary and Policy Priorities for Cardiovascular Disease, Diabetes, and Obesity:A Comprehensive Review. Circulation 2016, 133, 187–225. [CrossRef] [PubMed]
49. Monteiro, C.A.; Cannon, G.; Moubarac, J.C.; Levy, R.B.; Louzada, M.L.C.; Jaime, P.C. The UN Decade ofNutrition, the NOVA food classification and the trouble with ultra-processing. Public Health Nutr. 2018, 21,5–17. [CrossRef]
50. Silveira, J.A.C.D.; Meneses, S.S.; Quintana, P.T.; Santos, V.D.S. Association between Overweight andConsumption of Ultra-Processed Food and Sugar-Sweetened Beverages among Vegetarians. Rev. Nutr. 2017,30, 431–441. [CrossRef]
51. Bertoia, M.L.; Rimm, E.B.; Mukamal, K.J.; Hu, F.B.; Willett, W.C.; Cassidy, A. Dietary Flavonoid Intake andWeight Maintenance: Three Prospective Cohorts of 124 086 US Men and Women Followed for up to 24 Years.BMJ 2016, 352, i17. [CrossRef]
52. Santiago, S.; Zazpe, I.; Bes-Rastrollo, M.; Sánchez-Tainta, A.; Sayón-Orea, C.; Fuente-Arrillaga, C.D.L.;Benito, S.; Martínez, J.A.; Martínez-González, M.Á. Carbohydrate Quality, Weight Change and IncidentObesity in a Mediterranean Cohort: The SUN Project. Eur. J. Clin. Nutr. 2014, 69, 297–302. [CrossRef]
53. Barbaresko, J.; Koch, M.; Schulze, M.B.; Nöthlings, U. Dietary Pattern Analysis and Biomarkers of Low-GradeInflammation: A Systematic Literature Review. Nutr. Rev. 2013, 71, 511–527. [CrossRef] [PubMed]
54. Ramallal, R.; Toledo, E.; Martínez, J.A.; Shivappa, N.; Hébert, J.R.; Martínez-González, M.A.; Ruiz-Canela, M.Inflammatory Potential of Diet, Weight Gain, and Incidence of Overweight/Obesity: The SUN Cohort.Obesity 2017, 25, 997–1005. [CrossRef] [PubMed]
55. Fresán, U.; Martínez-González, M.A.; Sabaté, J.; Bes-Rastrollo, M. Global Sustainability (Health, Environmentand Monetary Costs) of Three Dietary Patterns: Results from a Spanish Cohort (the SUN Project). BMJ Open2019, 9, e021541. [CrossRef] [PubMed]
56. Hekler, E.B.; Gardner, C.D.; Robinson, T.N. Effects of a College Course About Food and Society on StudentsEating Behaviors. Am. J. Prev. Med. 2010, 38, 543–547. [CrossRef] [PubMed]
57. Swinburn, B.A.; Kraak, V.I.; Allender, S.; Atkins, V.J.; Baker, P.I.; Bogard, J.R.; Brinsden, H.; Calvillo, A.;Schutter, O.D.; Devarajan, R.; et al. The Global Syndemic of Obesity, Undernutrition, and Climate Change:The Lancet Commission Report. Lancet 2019, 393, 791–846. [CrossRef]
58. Rothman, K.J. Epidemiology: An Introduction, 2nd ed.; Oxford University Press: New York, NY, USA, 2012.59. Rothman, K.J.; Gallacher, J.E.; Hatch, E.E. Why representativeness should be avoided. Int. J. Epidemiol. 2013,
42, 1012–1014. [CrossRef]
© 2019 by the authors. Licensee MDPI, Basel, Switzerland. This article is an open accessarticle distributed under the terms and conditions of the Creative Commons Attribution(CC BY) license (http://creativecommons.org/licenses/by/4.0/).