Embed Size (px)
Citation preview

Prefatory Note
The attached document represents the most complete and accurate version available based on original files from the FOMC Secretariat at the Board of Governors of the Federal Reserve System.
Please note that some material may have been redacted from this document if that material was received on a confidential basis. Redacted material is indicated by occasional gaps in the text or by gray boxes around non-text content. All redacted passages are exempt from disclosure under applicable provisions of the Freedom of Information Act.
Content last modified 04/01/2015.

CLASS I FOMC - RESTRICTED CONTROLLED (FR)
MONETARY POLICY ALTERNATIVES
PREPARED FOR THE FEDERAL OPEN MARKET COMMITTEE BY THE STAFF OF THE BOARD OF GOVERNORS OF THE FEDERAL RESERVE SYSTEM
JUNE 18, 2009
RECENT DEVELOPMENTS SUMMARY
Strains in financial markets eased further over the intermeeting period. Investor
unease about the largest U.S. bank holding companies seemed to lessen following the
release of the results of the Supervisory Capital Assessment Program (SCAP), and
subsequently these institutions issued a large amount of equity and nonguaranteed
debt. Equity price indexes rallied, with financial stocks outperforming. Short-term
funding rates generally fell, and market functioning showed widespread improvement.
Consistent with the improvements in financial markets, demand for Federal Reserve
credit declined.
Yields on nominal Treasury securities climbed steeply over the intermeeting
period, especially for longer-dated issues. Market participants attributed the move to
several factors, including an upward shift in the expected path of the federal funds
rate resulting from the somewhat improved economic outlook, and a rise in term
premiums reflecting, in part, technical factors associated with mortgage-related
hedging flows. The increase in TIPS yields did not keep pace with the rise in their
nominal counterparts, leaving inflation compensation markedly higher over the
period. While some of the widening in inflation compensation likely reflected an
increase in inflation expectations, evidence suggests that an increase in inflation risk
premiums as well as technical factors may also have boosted inflation compensation.
In private debt markets, rates on mortgages and mortgage-backed securities climbed
along with the run-up in nominal Treasury yields. In contrast, yields on both
investment-grade and speculative-grade corporate bonds declined, and their spreads
to comparable-maturity Treasury securities narrowed substantially.
June 18, 2009 Class I FOMC - Restricted Controlled (FR) Page 1 of 79

Domestic nonfinancial sector debt is projected to have expanded at an annual
rate of 5½ percent in the second quarter, with net borrowing due almost entirely to
the federal government. Bank credit increased slightly in May, following six
consecutive months of decline, although core loans shrank again. Recent issuance of
credit card and auto asset-backed securities (ABS) was solid, stimulated by the Term
Asset-Backed Securities Loan Facility (TALF).
Money market conditions abroad also improved slightly over the intermeeting
period. Yields on sovereign bonds rose notably, and the dollar depreciated against
most major currencies. Many foreign central banks eased policy rates or expanded
nonconventional policies. Stock market indexes around the world moved up sharply.
FINANCIAL INSTITUTIONS
Investors’ concerns about the health of the largest U.S. financial institutions eased
somewhat over the intermeeting period as the announcement of the results of the
SCAP stress tests and subsequent successful capital raising efforts were seen as key
steps toward recovery of the financial system. In particular, stock prices of banks rose
11 percent and CDS spreads on debt of major bank holding companies narrowed
considerably (Chart 1).1
The results of the SCAP, released on May 7, were positively received in financial
markets. Implied volatility of bank share prices declined markedly after the results,
apparently reflecting a reduction in uncertainty about prospects for these institutions.
1 On June 17, Standard & Poor’s announced that it lowered its ratings for 18 U.S. banks,
noting that operating conditions for the industry will become less favorable than they were in the past. The rating action included 7 banks that were included in the stress tests. While the announcement was reportedly not entirely unexpected, equity prices of the downgraded institutions declined.
June 18, 2009 Class I FOMC - Restricted Controlled (FR) Page 2 of 79

Chart 1Financial Institutions
Jan. May Aug. Dec. Apr. Aug. Dec. Apr.2007 2008 2009
0
20
40
60
80
100
120
140Jan. 03, 2007 = 100
Daily
Bank ETF
Note. There are 24 banks included.Source. Bloomberg, Keefe Bruyette & Woods.
Apr.FOMC
June 18
Jan. May Sept. Jan. May Sept. Jan. May2007 2008 2009
0
50
100
150
200
250
300
350
400
Basis points
Major bank holding companiesOther banks
June 17
Daily
Bank CDS spreads
Note. Median spreads for 6 major bank holding companies and 12other banks.Source. Markit.
Apr.FOMC
0
5
10
15
20
25
30
35
40$Billions
Bank ofAmerica
WellsFargo
Citi RegionsFinancial
SunTrust
Key MorganStanley**
FifthThird
PNC**
Capital Required Capital Raised
1
1 Source. Staff estimates.* Includes new common equity offering, exchange of preferred to common,and asset sales.** Morgan Stanley and PNC have raised more capital than required.Note. Chart excludes GMAC.
SCAP Capital Buffer*
Dec. Jan. Feb. Mar. Apr. May June2008 2009
0
50
100
150
200
Basis points
CitigroupGE CapitalJPMorgan ChaseMorgan StanleyWells Fargo
Daily
June 18
Apr.FOMC
Selected FDIC-guaranteed spreads
Note. Spreads to comparable-maturity Treasury securities for issuesmaturing around year-end 2011.Source. Bloomberg.
Jan. May Aug. Dec. Apr. Aug. Dec. Apr.2007 2008 2009
0
20
40
60
80
100
120
140Jan. 03, 2007 = 100
Daily
Insurance ETF
Note. There are 24 insurance companies included.Source. Bloomberg, Keefe Bruyette & Woods.
Apr.FOMC
June 18
Jan. May Sept. Jan. May Sept. Jan. May2007 2008 2009
0
50
100
150
200
250
300
Basis points
Daily
CDS spreads for insurance companies
Note. Median spread for 53 insurance companies.Source. Markit.
Apr.FOMC
June 17
June 18, 2009 Class I FOMC - Restricted Controlled (FR) Page 3 of 79

Spreads on outstanding FDIC-guaranteed debt for most issuers narrowed a bit over
the intermeeting period but there was considerable variation across institutions in the
yields on non-guaranteed debt. CDS spreads for large banking organizations declined
notably over the period, though they remained elevated.
Subsequent to the release of the SCAP results, the 10 institutions that were
required to increase their capital buffer raised or announced plans to raise around
$55 billion in common equity through public offerings, conversions of preferred
stock, and asset sales, and they submitted capital plans to raise the remaining capital
required under the SCAP by November. Most of the other institutions evaluated in
the stress tests also raised capital, totaling an additional $15 billion, with the intent to
repay U.S. Treasury capital. The 19 firms issued more than $25 billion of non-
guaranteed debt after the SCAP results were announced, and a few firms issued a total
of roughly $10 billion in FDIC-guaranteed debt. On June 1 the Federal Reserve
Board released an outline of the criteria it would use to evaluate applications to repay
U.S. government capital, and on June 9, the Treasury announced that 10 of the largest
institutions had met the requirements for repaying funds; equity prices of these
institutions generally rose and CDS spreads ticked lower on the day of the Treasury
announcement. On June 17, about $68 billion was repaid to the Treasury.
Fannie Mae and Freddie Mac reported fourth-quarter losses in line with market
expectations and requested an additional $19 billion and $6 billion, respectively, from
the Treasury under the Senior Preferred Stock Purchase Agreement. Nonetheless,
Fannie Mae issued $5 billion of five-year notes and Freddie Mac issued $9 billion of
three-year notes in well-subscribed auctions. The Federal Home Loan Bank System
auctioned $5 billion in two-year notes, its largest such issuance in a year, amid
reportedly high demand. Spreads of yields on agency debt over those on comparable-
June 18, 2009 Class I FOMC - Restricted Controlled (FR) Page 4 of 79

maturity Treasury securities narrowed over the intermeeting period as the Federal
Reserve continued its purchases of agency debt.
Market participants appeared to view the outlook for insurance firms as somewhat
improved, as their equity prices rose, on net, over the intermeeting period. The
improvements coincided with news reports suggesting that insurance companies
would be eligible for TARP funds. Some insurance companies, including Ameriprise
Financial and Allstate, announced that they would not accept such funds, but others,
such as Hartford Financial and Lincoln National, announced that they intend to issue
preferred stock to the Treasury and have obtained preliminary approval to do so.
MARKET FUNCTIONING
Functioning in many financial markets improved, on net, over the intermeeting
period. Pressures in short-term bank funding markets eased further, as evidenced by
declines in Libor fixings and spreads over OIS (Chart 2). Spreads at the one- and
three-month horizons narrowed to levels not seen since early 2008, volume increased
modestly, and market participants reported tentative signs of improved liquidity. The
reverse repurchase (repo) market saw slight improvement, with bid-asked spreads for
most types of transactions ticking down and haircuts roughly unchanged. Delivery
fails on Treasury securities dropped after the May 1 implementation of the Treasury
Market Practices Group’s fails charge.2 Nevertheless, the 10-year on-the-run Treasury
2 On May 1, a “fails charge” recommended by the Treasury Market Practices Group was
implemented. The charge is incurred when a party to a repo or cash transaction fails to deliver the contracted Treasury security to the other party by the date agreed upon by the parties. The charge is a share of the value of the securities, where the share is the greater of 3 percent (annual rate) minus the target federal funds rate (or the bottom of the range when the FOMC specifies that instead) and zero. Previously, the practice was that a failed transaction was allowed to settle on a subsequent day at an unchanged invoice price; therefore, the cost of a fail was the opportunity cost of the funds owed in the transaction, which was minimal when short-term interest rates were very low, and thus provided little
June 18, 2009 Class I FOMC - Restricted Controlled (FR) Page 5 of 79
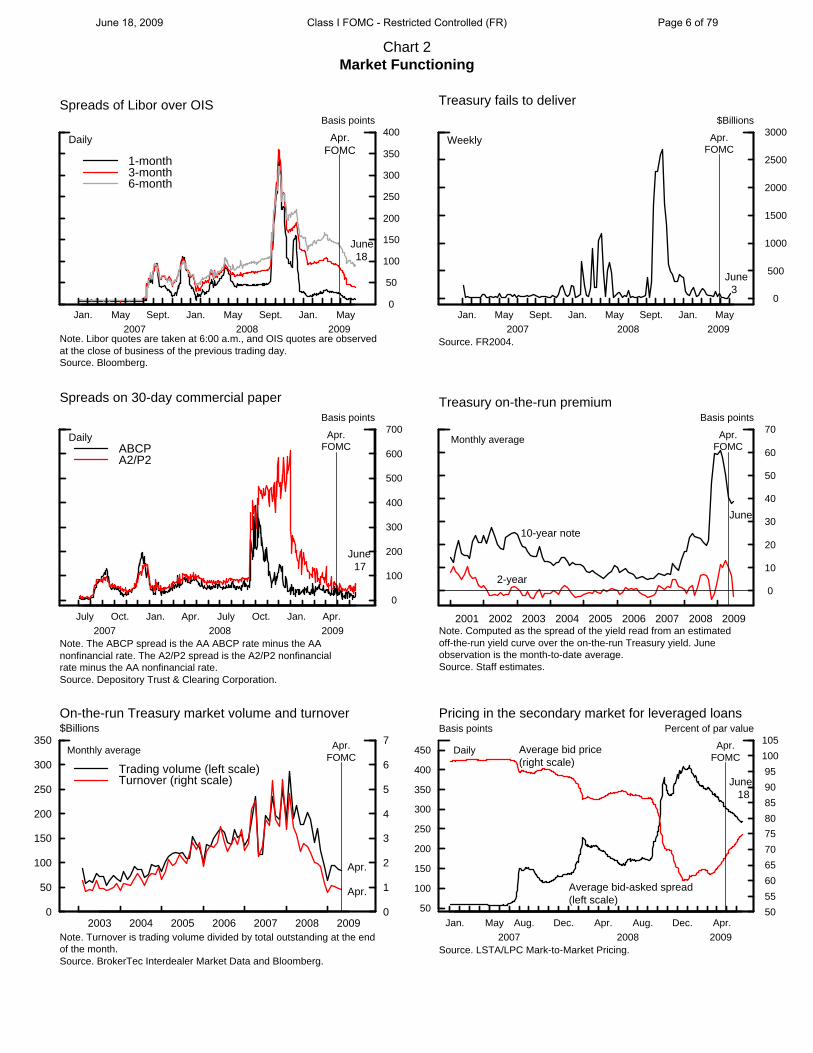
Chart 2Market Functioning
Jan. May Sept. Jan. May Sept. Jan. May2007 2008 2009
0
50
100
150
200
250
300
350
400Basis points
1-month3-month6-month
Note. Libor quotes are taken at 6:00 a.m., and OIS quotes are observedat the close of business of the previous trading day.Source. Bloomberg.
Spreads of Libor over OIS
Daily Apr.FOMC
June 18
Jan. May Sept. Jan. May Sept. Jan. May2007 2008 2009
0
500
1000
1500
2000
2500
3000$Billions
June 3
Apr.FOMC
Weekly
Treasury fails to deliver
Source. FR2004.
July Oct. Jan. Apr. July Oct. Jan. Apr.2007 2008 2009
0
100
200
300
400
500
600
700Basis points
ABCPA2/P2
June 17
Apr.FOMC
Daily
Spreads on 30-day commercial paper
Note. The ABCP spread is the AA ABCP rate minus the AAnonfinancial rate. The A2/P2 spread is the A2/P2 nonfinancialrate minus the AA nonfinancial rate.Source. Depository Trust & Clearing Corporation.
0
10
20
30
40
50
60
70Basis points
2001 2002 2003 2004 2005 2006 2007 2008 2009
2-year
10-year note
Treasury on-the-run premium
Monthly average
Note. Computed as the spread of the yield read from an estimatedoff-the-run yield curve over the on-the-run Treasury yield. Juneobservation is the month-to-date average.Source. Staff estimates.
Apr.FOMC
June
0
50
100
150
200
250
300
350
2003 2004 2005 2006 2007 2008 20090
1
2
3
4
5
6
7$Billions
Trading volume (left scale)Turnover (right scale)
On-the-run Treasury market volume and turnover
Monthly average
Note. Turnover is trading volume divided by total outstanding at the endof the month.Source. BrokerTec Interdealer Market Data and Bloomberg.
Apr.
Apr.
Apr.FOMC
50
100
150
200
250
300
350
400
450
Jan. May Aug. Dec. Apr. Aug. Dec. Apr.2007 2008 2009
50
55
60
65
70
75
80
85
90
95
100
105Basis points Percent of par value
Daily
Source. LSTA/LPC Mark-to-Market Pricing.
Pricing in the secondary market for leveraged loans
Apr.FOMC
Average bid price(right scale)
Average bid-asked spread(left scale)
June 18
June 18, 2009 Class I FOMC - Restricted Controlled (FR) Page 6 of 79

security was in particularly short supply in early June, and delivery fails for that issue
increased notably and trades in overnight repos for this issue took place at negative
yields. On June 15, a new supply of the on-the-run 10-year note settled following the
regular reopening, and delivery fails fell to zero.
Consistent with improvement in the bank funding markets, use of Federal
Reserve liquidity facilities directed at depository institutions declined. (See box
entitled “Balance Sheet Developments During the Intermeeting Period.”) Term
Auction Facility (TAF) credit outstanding declined by nearly $70 billion over the
intermeeting period. Bidding in both the 28-day and 84-day auctions decreased fairly
steadily over the period, although the 28-day auction that immediately preceded the
announcement of the SCAP results drew more aggressive bidding, reportedly because
of anxiety on the part of a few SCAP banks about the stress tests results. Foreign
central bank liquidity swaps outstanding dropped about $100 billion over the period,
continuing their steady decline since the start of the year. With the improvement in
bank funding markets and the relatively higher cost of this funding relative to the
TAF, foreign central bank dollar liquidity was seen as less attractive.
Lending through the Commercial Paper Funding Facility (CPFF) dropped by
$50 billion, as less than half of maturing commercial paper in the program was
reissued to the CPFF. Reportedly, many firms issued longer-term debt to pay down
short-term borrowing financed through the facility. Outside the CPFF, spreads on
30-day asset-backed commercial paper and A2/P2 commercial paper edged down
further to around the low end of their ranges recorded over the past 18 months.
incentive to minimize fails. The new practice of a fails charge ensures that the total cost of a fail (opportunity cost plus the fails charge) is at least 3 percent. Given the new rules, repo rates for securities in especially high demand can routinely trade as low as -3 percent; previously, market conventions prevented repo rates from falling much below zero even during periods of intense demand for particular securities.
June 18, 2009 Class I FOMC - Restricted Controlled (FR) Page 7 of 79

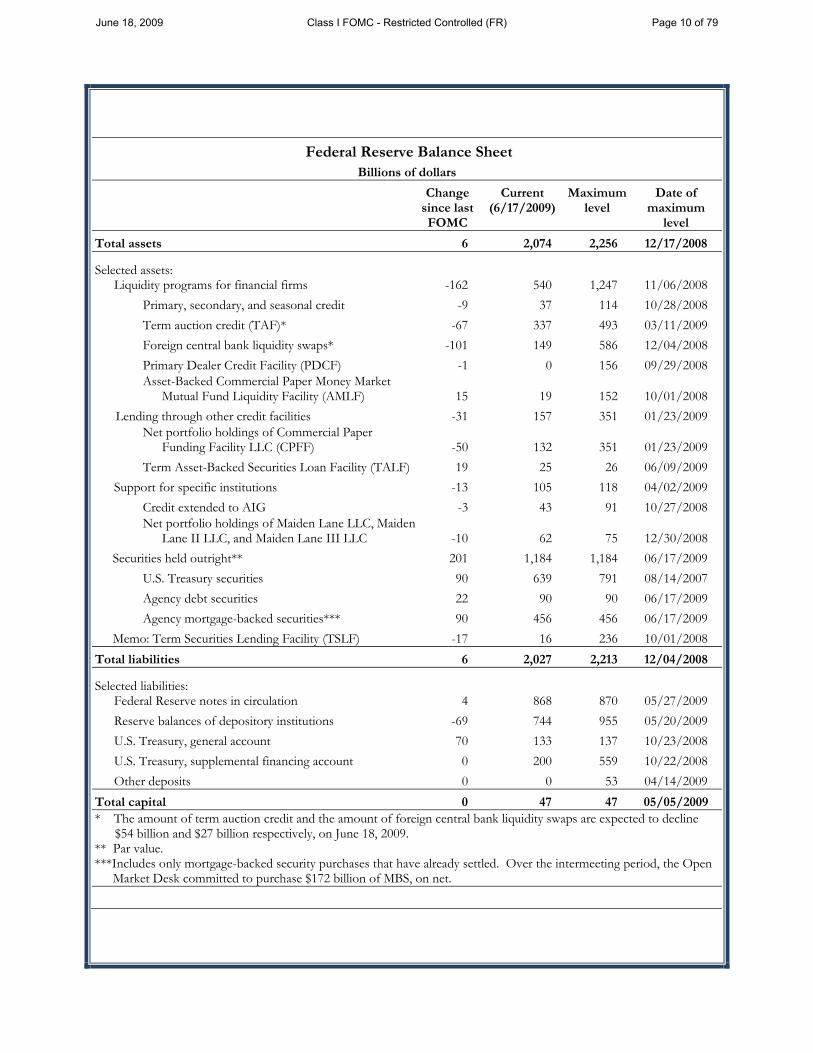
Balance Sheet Developments During the Intermeeting Period
Since the April FOMC meeting, the Federal Reserve’s total assets have remained at around $2 trillion, but their composition has shifted significantly.1 As a result of the ongoing asset purchase programs, securities held outright increased $201 billion, but this increase was roughly offset by a decrease of $206 billion in liquidity programs and other credit facilities.
The Open Market Desk purchased $90 billion in U.S. Treasury securities, $22 billion in agency debt securities, and $90 billion in agency mortgage-backed securities.2 Loans extended under the Term Asset-Backed Securities Loan Facility (TALF) increased by $19 billion, and those extended under the Asset-Backed Commercial Paper Money Market Mutual Fund Liquidity Facility (AMLF) increased by $15 billion. The TALF conducted two operations during the intermeeting period to finance the issuance of asset-backed securities. The increased lending through the AMLF occurred just prior to the announcement of results from the Supervisory Capital Assessment Program and reportedly reflected money market mutual funds’ concern that their holdings of commercial paper issued by some of the institutions subject to the stress tests might be downgraded or placed on watch for downgrade by the rating agencies and thereby become ineligible for the facility.
A number of the System’s credit and liquidity programs contracted. Foreign central bank liquidity swaps declined $101 billion, term auction credit declined $67 billion, and primary credit declined $9 billion.3 All of these declines likely reflect improvements in global bank funding markets. Credit extended through the Commercial Paper Funding Facility declined $50 billion after a large amount of commercial paper funded under the program matured and was not completely rolled over. This decline likely reflects, at least in part, some substitution of longer term credit for commercial paper. Lending under the Primary Dealer Credit Facility declined $1 billion to zero, and securities lent through the Term Securities Lending Facility (TSLF), which do not affect assets because the Federal Reserve retains ownership of the securities lent, declined by $17 billion. The decline in TSLF lending reportedly reflects improvements in the repo market, particularly a narrowing of risk spreads on term repo transactions.
1 These data are through June 17, 2009. 2 The figures for MBS holdings reflect only trades that have settled. Over the intermeeting period, the Open
Market Desk committed to purchase $172 billion of MBS, on net. 3 The amount of term auction credit and the amount of foreign central bank liquidity swaps are expected to
decline $54 billion and $27 billion respectively, on June 18, 2009.
June 18, 2009 Class I FOMC - Restricted Controlled (FR) Page 8 of 79

On the liability side of the Federal Reserve’s balance sheet, the U.S. Treasury’s general account increased $70 billion as a result of tax payments and the repayment of some of the preferred stock provided to financial institutions under the U.S. Treasury’s Troubled Asset Relief Program. This increase was roughly offset by a $69 billion decrease in reserve balances of depository institutions, leaving the Federal Reserve’s total liabilities about unchanged over the period.
June 18, 2009 Class I FOMC - Restricted Controlled (FR) Page 9 of 79
Federal Reserve Balance Sheet Billions of dollars
Change since last FOMC
Current (6/17/2009)
Maximum level
Date of maximum
level
Total assets 6 2,074 2,256 12/17/2008
Selected assets: Liquidity programs for financial firms -162 540 1,247 11/06/2008
Primary, secondary, and seasonal credit -9 37 114 10/28/2008 Term auction credit (TAF)* -67 337 493 03/11/2009 Foreign central bank liquidity swaps* -101 149 586 12/04/2008 Primary Dealer Credit Facility (PDCF) -1 0 156 09/29/2008 Asset-Backed Commercial Paper Money Market
Mutual Fund Liquidity Facility (AMLF) 15 19 152 10/01/2008 Lending through other credit facilities -31 157 351 01/23/2009
Net portfolio holdings of Commercial Paper Funding Facility LLC (CPFF) -50 132 351 01/23/2009
Term Asset-Backed Securities Loan Facility (TALF) 19 25 26 06/09/2009 Support for specific institutions -13 105 118 04/02/2009
Credit extended to AIG -3 43 91 10/27/2008 Net portfolio holdings of Maiden Lane LLC, Maiden
Lane II LLC, and Maiden Lane III LLC -10 62 75 12/30/2008 Securities held outright** 201 1,184 1,184 06/17/2009
U.S. Treasury securities 90 639 791 08/14/2007 Agency debt securities 22 90 90 06/17/2009 Agency mortgage-backed securities*** 90 456 456 06/17/2009
Memo: Term Securities Lending Facility (TSLF) -17 16 236 10/01/2008 Total liabilities 6 2,027 2,213 12/04/2008
Selected liabilities: Federal Reserve notes in circulation 4 868 870 05/27/2009
Reserve balances of depository institutions -69 744 955 05/20/2009 U.S. Treasury, general account 70 133 137 10/23/2008 U.S. Treasury, supplemental financing account 0 200 559 10/22/2008 Other deposits 0 0 53 04/14/2009
Total capital 0 47 47 05/05/2009 * The amount of term auction credit and the amount of foreign central bank liquidity swaps are expected to decline $54 billion and $27 billion respectively, on June 18, 2009. ** Par value. ***Includes only mortgage-backed security purchases that have already settled. Over the intermeeting period, the Open
Market Desk committed to purchase $172 billion of MBS, on net.
June 18, 2009 Class I FOMC - Restricted Controlled (FR) Page 10 of 79

One exception to the decreased usage of Federal Reserve facilities was the Asset-
Backed Commercial Paper Money Market Mutual Fund Liquidity Facility (AMLF),
which jumped from zero to $27 billion in early May. The increase was sparked by
concerns about potential downgrades of commercial paper issued by banking
institutions around the time of the stress tests that led money funds to place their
paper in the AMLF in case the collateral subsequently became ineligible for this
facility. Subsequently, amounts borrowed from the AMLF declined, with amounts
outstanding falling to $19 billion most recently.
Functioning in the market for Treasury securities generally improved and trading
volumes picked up, but some strains remained. The average fitting error estimated
from staff yield curve models decreased noticeably. The on-the-run/off-the-run
premium narrowed considerably at the short end of the yield curve. Concerns about
volatility linked to mortgage-related hedging flows, however, appeared to keep these
spreads somewhat wide for longer-dated issues. Some strains emerged at times in the
mortgage-backed securities (MBS) market perhaps associated with the mortgage-
related hedging flows; market participants reacted to the large and rapid changes in
MBS yields by widening the bid-asked spreads on MBS.
Functioning in the corporate bond market reportedly improved a bit over the
intermeeting period. Bid-asked spreads for speculative-grade and investment-grade
bonds declined on net over the period. Meanwhile, the basis between the CDX
investment-grade index of CDS spreads and measures of investment-grade corporate
bond spreads―a rough measure of unexploited arbitrage opportunities in the
corporate bond market―decreased, although it remained wide. Market sentiment
toward the syndicated leveraged loan market also improved, with the average bid price
June 18, 2009 Class I FOMC - Restricted Controlled (FR) Page 11 of 79
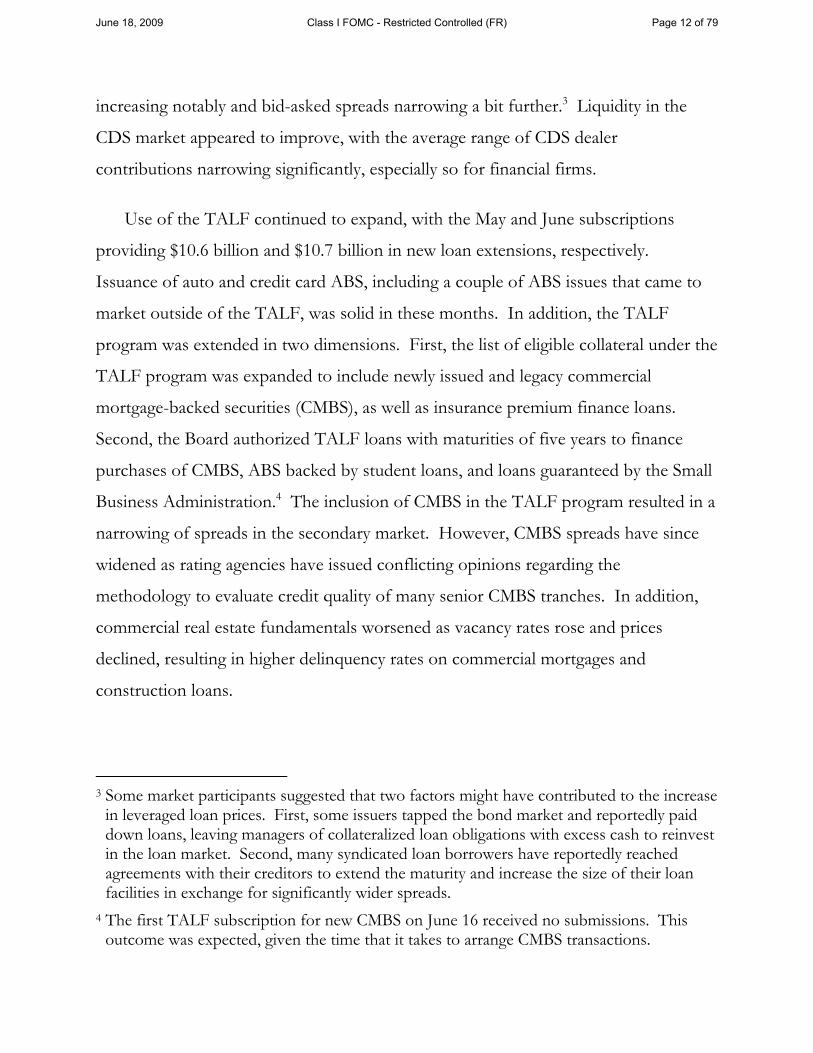
increasing notably and bid-asked spreads narrowing a bit further.3 Liquidity in the
CDS market appeared to improve, with the average range of CDS dealer
contributions narrowing significantly, especially so for financial firms.
Use of the TALF continued to expand, with the May and June subscriptions
providing $10.6 billion and $10.7 billion in new loan extensions, respectively.
Issuance of auto and credit card ABS, including a couple of ABS issues that came to
market outside of the TALF, was solid in these months. In addition, the TALF
program was extended in two dimensions. First, the list of eligible collateral under the
TALF program was expanded to include newly issued and legacy commercial
mortgage-backed securities (CMBS), as well as insurance premium finance loans.
Second, the Board authorized TALF loans with maturities of five years to finance
purchases of CMBS, ABS backed by student loans, and loans guaranteed by the Small
Business Administration.4 The inclusion of CMBS in the TALF program resulted in a
narrowing of spreads in the secondary market. However, CMBS spreads have since
widened as rating agencies have issued conflicting opinions regarding the
methodology to evaluate credit quality of many senior CMBS tranches. In addition,
commercial real estate fundamentals worsened as vacancy rates rose and prices
declined, resulting in higher delinquency rates on commercial mortgages and
construction loans.
3 Some market participants suggested that two factors might have contributed to the increase
in leveraged loan prices. First, some issuers tapped the bond market and reportedly paid down loans, leaving managers of collateralized loan obligations with excess cash to reinvest in the loan market. Second, many syndicated loan borrowers have reportedly reached agreements with their creditors to extend the maturity and increase the size of their loan facilities in exchange for significantly wider spreads.
4 The first TALF subscription for new CMBS on June 16 received no submissions. This outcome was expected, given the time that it takes to arrange CMBS transactions.
June 18, 2009 Class I FOMC - Restricted Controlled (FR) Page 12 of 79

MONETARY POLICY EXPECTATIONS AND TREASURY YIELDS
The Committee’s decision at its April 28-29 meeting to leave the target range for
the federal funds rate unchanged and the accompanying statement indicating that the
FOMC would maintain the size of the large-scale asset purchase program were largely
anticipated, but yields on Treasury securities rose slightly as a few investors apparently
had placed some odds on the Committee expanding the purchase program.5 The
release of the April FOMC minutes three weeks later prompted a reversal of this
move, as market participants reportedly focused on the suggestion that the total size
of the purchase program might need to be increased at some point to spur a more
rapid pace of recovery. The expected path for the federal funds rate implied by
futures prices was largely unchanged by the releases of the Committee’s statement and
the minutes. However, in the days following the release of the May employment
report, which was read as being significantly less negative than anticipated, market
participants marked up their expected path for the federal funds rate. Although about
half of this upward shift has since been reversed, futures quotes – combined with our
standard assumptions about the term premium – imply an expected federal funds rate
at the end of 2010 of about 1.8 percent, up about 65 basis points from the expected
rate at the time of the April FOMC meeting (Chart 3). Part of the increase in the
expected funds rate path might reflect an increase in the term premium that is not
incorporated in our standard assumptions. The option-implied distribution of the
federal funds rate six months from now widened substantially over the period
possibly pointing to a widening in the term premium. And the Desk’s survey of
primary dealers reported that all respondents continued to expect short-term policy
5 The effective federal funds rate averaged 0.19 percent over the intermeeting period.
Trading volumes declined somewhat toward the end of the period, and the intraday standard deviation averaged 5 basis points.
June 18, 2009 Class I FOMC - Restricted Controlled (FR) Page 13 of 79
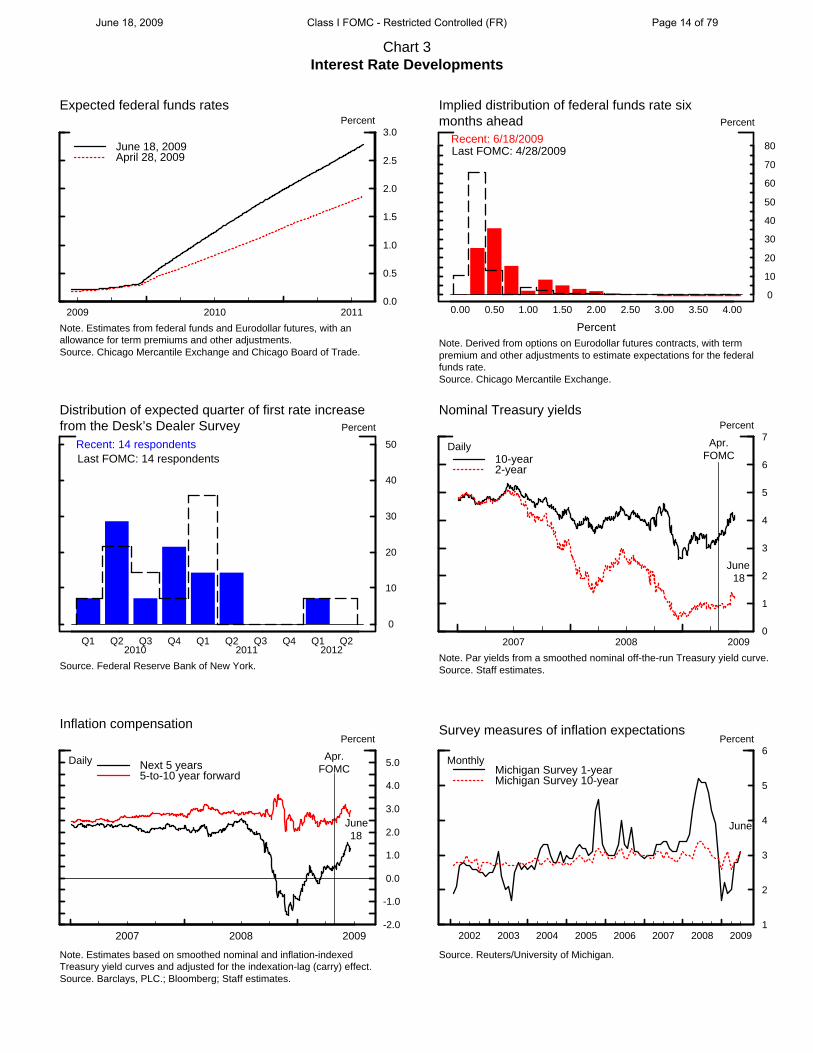
Chart 3Interest Rate Developments
2009 2010 20110.0
0.5
1.0
1.5
2.0
2.5
3.0Percent
June 18, 2009April 28, 2009
Expected federal funds rates
Note. Estimates from federal funds and Eurodollar futures, with anallowance for term premiums and other adjustments.Source. Chicago Mercantile Exchange and Chicago Board of Trade.
Implied distribution of federal funds rate six months ahead
0.00 0.50 1.00 1.50 2.00 2.50 3.00 3.50 4.00
Recent: 6/18/2009Last FOMC: 4/28/2009
0
10
20
30
40
50
60
70
80
Percent
PercentNote. Derived from options on Eurodollar futures contracts, with termpremium and other adjustments to estimate expectations for the federalfunds rate.Source. Chicago Mercantile Exchange.
Distribution of expected quarter of first rate increasefrom the Desk’s Dealer Survey
Q1 Q2 Q3 Q4 Q1 Q2 Q3 Q4 Q1 Q2
Recent: 14 respondentsLast FOMC: 14 respondents
0
10
20
30
40
50
Percent
2010 2011 2012
Source. Federal Reserve Bank of New York.
2007 2008 20090
1
2
3
4
5
6
7Percent
10-year2-year
Nominal Treasury yields
Daily
Note. Par yields from a smoothed nominal off-the-run Treasury yield curve.Source. Staff estimates.
Apr.FOMC
June 18
2007 2008 2009-2.0
-1.0
0.0
1.0
2.0
3.0
4.0
5.0
Percent
Next 5 years5-to-10 year forward
Inflation compensation
Daily
Note. Estimates based on smoothed nominal and inflation-indexedTreasury yield curves and adjusted for the indexation-lag (carry) effect.Source. Barclays, PLC.; Bloomberg; Staff estimates.
Apr.FOMC
June 18
2002 2003 2004 2005 2006 2007 2008 20091
2
3
4
5
6Percent
Michigan Survey 1-yearMichigan Survey 10-year
Survey measures of inflation expectations
Source. Reuters/University of Michigan.
June
Monthly
June 18, 2009 Class I FOMC - Restricted Controlled (FR) Page 14 of 79

rates to remain on hold in 2009, again suggesting that some portion of the upward
revision in the futures path may reflect higher term premiums.
Nominal Treasury yields increased sharply over the intermeeting period, with
yields on two- and ten-year notes up about 35 and 80 basis points, respectively.
Against a backdrop of heavy Treasury issuance, the ten-year yield trended up over the
intermeeting period likely reflecting a number of factors, including the favorable
reception of the SCAP results and better-than-expected economic data, which
boosted the expected path of future short rates and pushed up the term premium, as
well as technical factors related to mortgage-related hedging flows. (See box entitled
“The Recent Rise in Long-term Nominal Treasury Yields.”) The two-year Treasury
yield increase mainly followed the release of the milder-than-expected May
employment report.
Inflation compensation rose over the intermeeting period as yields on inflation-
indexed Treasury securities increased much less than those on their nominal
counterparts. Some of the increase in inflation compensation may reflect an increase
in inflation expectations, but an improvement in liquidity in the TIPS market and
mortgage-related hedging flows may have boosted inflation compensation as well.
(See box entitled “Interpreting the Rise in Inflation Compensation.”)
CAPITAL MARKETS
Broad stock price indexes rose about 7 percent, on balance, over the intermeeting
period amid generally better-than-expected economic data releases (Chart 4). Implied
stock-price volatility continued to decline, although it remained elevated. The equity
premium―measured as the staff’s estimate of the expected real equity return over the
next ten years relative to the real 10-year Treasury yield―narrowed notably but
remained high by historical standards. Revisions to analysts’ forecasts of year-ahead
June 18, 2009 Class I FOMC - Restricted Controlled (FR) Page 15 of 79

The Recent Rise in Long‐term Nominal Treasury Yields
Yields on long-term nominal Treasury securities increased substantially over the intermeeting period. The 10-year yield climbed 80 basis points (left chart below), with much of the increase concentrated in forward rates at horizons between 3 and 7 years. Estimates from the staff’s three-factor affine term structure model suggest that much of the rise in the 10-year yield can be attributed to wider term premiums, although the expected path of future short-term rates also boosted yields.
A more optimistic assessment of the economic outlook on the part of investors was reportedly a significant factor boosting the expected path of future short rates. Data releases in the United States and other countries pointed to some tentative signs that the global deterioration in economic activity could be moderating. Indeed, nominal government bond yields moved higher in most industrialized countries. Stronger economic data and rising oil prices may also have contributed to an increase in inflation expectations over the period, leading to higher inflation compensation in nominal government bond yields in a number of advanced foreign economies.
A number of factors reportedly boosted term premiums for Treasury securities. The favorable reception of the Supervisory Capital Assessment Program (SCAP) results and the improved tone of economic data seemed to spur an unwinding of safe-haven demands. As yields moved higher, other factors reportedly amplified the upturn in rates. First, investors concluded that the Fed was not defending particular rate levels for Treasuries and mortgages as part of its large-scale asset
June 18, 2009 Class I FOMC - Restricted Controlled (FR) Page 16 of 79

purchase (LSAP) programs. Second, the rise in yields reportedly prompted mortgage-related hedging flows—as mortgage rates moved higher, the duration of mortgage-backed securities increased and investors reportedly pared holdings of longer-term Treasuries in an effort to keep the duration of their portfolios at desired levels. The rise in mortgage hedging demands was accompanied by a notable increase in option-implied measures of uncertainty about long-term interest rates (shaded grey area in the right chart above), which may have also contributed to the widening of term premiums.
June 18, 2009 Class I FOMC - Restricted Controlled (FR) Page 17 of 79

Interpreting the Rise in Inflation Compensation
Inflation compensation, defined as the difference between yields on nominal Treasury securities and those on comparable-maturity TIPS, increased notably over the intermeeting period. Five-year inflation compensation rose about 70 basis points, and five-year inflation compensation five years forward increased about 35 basis points, with the largest increases occurring following the May nonfarm payroll release, comments from Fed officials pointing to upside inflation risks, and large increases in oil prices.
The staff’s real term structure model provides one means of decomposing these changes into changes in inflation expectations, inflation risk premiums, and other factors. As noted in the table below, the model suggests that inflation expectations at the five-year and five-year forward horizon moved up about 40 basis points over the intermeeting period. For comparison, the Michigan and Philadelphia Fed measures of long-term inflation expectations increased 40 basis points and 10 basis points, respectively, since the April meeting. The model also points to an increase of about 20 basis points in the inflation risk premium at both the five-year and five-year forward horizons.
Changes over the intermeeting period (in basis points)
5-year 5-year, 5-year
forward
Change in inflation expectations +40 +37
Change in inflation risk premium +17 +22
Change in residuals +11 –25
Total change +68 +34
While these model results are suggestive, the point estimates of changes in the components may be subject to more than the usual degree of uncertainty. In particular, market participants pointed to a number of special factors boosting nominal yields over the period that probably would not have affected TIPS yields to the same degree. For example, the unwinding of safe haven demands in light of the perceived improvement in the economic outlook as well as the upward pressure on longer-term rates stemming from mortgage-hedging flows both are factors that could be expected to boost nominal Treasury yields relative to TIPS yields. Indeed, inflation compensation at both the five-year and five-year forward horizon moved up very sharply in the summer of 2003 during the intense mortgage-hedging episode at that time.
June 18, 2009 Class I FOMC - Restricted Controlled (FR) Page 18 of 79

Chart 4Asset Market Developments
2002 2003 2004 2005 2006 2007 2008 2009 20
40
60
80
100
120
140
160
Dec. 31, 2001 = 100
Dow Jones Total US Stock Index
Equity prices
Daily
Source. Bloomberg.
Apr.FOMC
June 18
2002 2003 2004 2005 2006 2007 2008 2009
20
40
60
80
100Percent
Implied volatility on S&P 500 (VIX)
Weekly (Fri.*)
*Latest observation is for most recent business day.Source. Chicago Board Options Exchange.
Apr.FOMC
June 18
150
250
350
450
550
650
750
2002 2003 2004 2005 2006 2007 2008 2009 0
250
500
750
1000
1250
1500
1750
2000Basis points Basis points
10-year BBB (left scale)10-year High-Yield (right scale)
Corporate bond spreads
Daily
Note. Measured relative to an estimated off-the-run Treasury yield curve.Source. Merrill Lynch and staff estimates.
Apr.FOMC
June 18
4.0
4.5
5.0
5.5
6.0
6.5
7.0
7.5
8.0
Jan. May Aug. Dec. Apr. Aug. Dec. Apr.2007 2008 2009
130
150
170
190
210
230
250
270
290
310
330Percent Basis points
FRM rate (left scale)FRM spread (right scale)
Residential mortgage rates and spreads
Weekly
Note. FRM spread is relative to 10-year Treasury.Source. Freddie Mac.
Apr.FOMC
June 17
0
5
10
15
20
25
30
35
40$Billions
2006 2007 2008 2009
H1
H2 Q1
AM
J*
Gross ABS Issuance
Monthly Rate
Credit CardAutoStudent Loan
*Actual issuance as of June 16.Note. Auto ABS include car loans and leases and financing for buyers ofmotorcylces.Source. Inside MBS & ABS, Merrill Lynch, Bloomberg, and the FederalReserve.
Jan. May Sept. Jan. May Sept. Jan. May2007 2008 2009
0
100
200
300
400
500
600
Basis points
2-year credit card2-year auto3-year FFELP
AAA ABS spreads
Weekly
Note. Last observations for 2-year auto and credit card ABS spreads areJune 12. Last observation for 3-year FFELP is May 8.Source. For credit card and auto spreads, trader estimates providedby Citigroup. For FFELP spreads, trader estimates provided byMerrill Lynch.
Apr.FOMC
June 18, 2009 Class I FOMC - Restricted Controlled (FR) Page 19 of 79

earnings for S&P 500 firms were negative in the month ending in mid-May, but the
downward revision was much smaller than in the prior several months. Financial
firms issued a record volume of public equity in May, and seasoned offerings by
nonfinancial firms surged. Net issuance of equity by nonfinancial firms, which had
been negative since 2002, was essentially zero in the first quarter, as equity retirements
from cash-financed mergers and share repurchases slowed significantly.
Yields on speculative-grade and investment-grade bonds dropped, and spreads
over yields on comparable-maturity Treasury debt narrowed considerably. Consistent
with the generally improved market sentiment, CDX indexes of spreads for both
investment-grade and speculative-grade debt fell over the intermeeting period, with
the largest declines recorded for financial firms. Gross issuance of corporate bonds
was strong over the intermeeting period by both nonfinancial and financial firms.
Issuance by investment-grade nonfinancial firms rebounded from its April lull, and
the pace of issuance by speculative-grade companies was the highest since June 2007.
Many firms reportedly used the proceeds to pay down bank loans and commercial
paper over the intermeeting period. Bond issuance by financial firms was primarily
outside the FDIC’s Temporary Liquidity Guarantee Program. The expected year-
ahead default rate from Moody’s KMV, which covers both financial and nonfinancial
firms, decreased markedly over the period, reflecting both higher estimated asset
values and lower estimated asset volatilities. Nevertheless, this measure of expected
defaults remained extremely high by historical standards.
Mortgage rates increased sharply over the intermeeting period. Yields on MBS
increased 80 basis points, while the average rate on 30-year fixed-rate conforming
mortgages increased less, rising about 60 basis points to 5.4 percent. As a result, the
spread between the yield on Fannie Mae MBS and the primary mortgage market rate
narrowed on net. Rates offered on jumbo mortgages rose even less. Issuance of
June 18, 2009 Class I FOMC - Restricted Controlled (FR) Page 20 of 79

MBS by the housing-related GSEs increased in recent months, due to the
securitization of refinance mortgages originated earlier this year, as well as seasoned
mortgages securitized from Fannie Mae's portfolio. MBS issuance by Ginnie Mae
expanded modestly in March and April. However, the private-label MBS market
remained closed.
The credit card and auto ABS market saw a marked pickup in issuance, primarily
associated with deals funded through the TALF. Spreads on AAA-rated consumer
ABS continued the narrowing that began early in the year and have now retraced a
large portion of the run-up that occurred between mid-2007 and the end of 2008.
Conditions in the municipal bond market continued to improve. Gross
issuance of municipal bonds remained solid in May. Yields on long-term municipal
bonds rose less over the intermeeting period than those on comparable-maturity
Treasury securities, reducing the ratio of municipal-to-Treasury yields to its lowest
level in almost a year. As indicated by the 7-day SIFMA Municipal Swap Index, yields
on short-term municipal instruments declined notably and the index reached its
lowest level on record.
FOREIGN DEVELOPMENTS
The major currencies index of the dollar has declined nearly 6½ percent during
the intermeeting period as the dollar depreciated sharply against the currencies of all
of our major trading partners except the yen (Chart 5). This decline appeared to be
driven by a renewed sense of optimism about global growth prospects, leading
investors to shift demand from safe-haven assets in the United States and Japan to
riskier assets elsewhere. As in the United States, conditions in bank funding markets
abroad improved over the period; spreads between Libor and OIS rates in euro and
sterling decreased. Investors’ concerns about foreign financial institutions eased a bit,
June 18, 2009 Class I FOMC - Restricted Controlled (FR) Page 21 of 79

Chart 5International Financial Indicators
Note. Last daily observation is for June 18, 2009.
2006 2007 2008 2009 30
50
70
90
110
130
150
170
UK (FTSE-350)Euro Area (DJ Euro)Japan (Topix)
Stock price indexesIndustrial countries
Daily
Dec. 29, 2005 = 100
Source. Bloomberg.
Apr.FOMC
2006 2007 2008 50
75
100
125
150
175
200
225
250
Brazil (Bovespa)Korea (KOSPI)Mexico (Bolsa)
Stock price indexesEmerging market economies
Daily
Dec. 29, 2005 = 100
Source. Bloomberg.
Apr.FOMC
2.5
3.0
3.5
4.0
4.5
5.0
5.5
6.0
2006 2007 2008 20090.0
0.5
1.0
1.5
2.0
2.5
3.0UK (left scale)Germany (left scale)Japan (right scale)
Nominal Ten-year government bond yields
Daily
Percent
Source. Bloomberg.
Apr.FOMC
2006 2007 2008 2009 80
85
90
95
100
105
110
BroadMajor CurrenciesOther Important Trading Partners
Nominal trade-weighted dollar indexes
Daily
Dec. 30, 2005 = 100
Source. FRBNY and Bloomberg.
Apr.FOMC
June 18, 2009 Class I FOMC - Restricted Controlled (FR) Page 22 of 79
and foreign banks took advantage of better market conditions to raise capital. This
improved access to capital markets and the better economic outlook helped lead bank
stocks higher. Headline stock indexes in Europe and Japan rose roughly 4 and 16
percent, respectively, while bank stocks increased 11 to 14 percent.
The European Central Bank lowered its policy rate 25 basis points to 1 percent
and announced that it would purchase €60 billion in covered bonds. The Bank of
England kept its policy rate constant at 50 basis points but increased the size of its
planned asset purchases from £75 billion to £125 billion. Despite these policy
decisions, yields on longer-term sovereign nominal and inflation-indexed bonds rose
over the period. As in the United States, the rise in yields was likely driven by several
factors, including an increased willingness on the part of investors to move out of safe
assets such as government bonds and into riskier investments; the improvement in the
global outlook, which may have led markets to expect that central banks will tighten
rates sooner than had been anticipated; and concerns among some investors that
rising fiscal deficits may lead to rising inflation. Ten-year gilt yields rose about 15
basis points following Standard & Poor’s warning that rising fiscal deficits might lead
it to downgrade the United Kingdom’s sovereign rating, but Moody’s and Fitch
reaffirmed the United Kingdom’s AAA rating.
The dollar depreciated 3 percent against the currencies of our other important
trading partners on a trade-weighted basis, falling 11 percent against the Brazilian real
and 6½ percent against the Korean won. Chinese authorities held the renminbi nearly
unchanged against the dollar and the dollar depreciated a more modest 1 to 4 percent
against most other emerging market currencies. Several central banks intervened to
purchase dollars in recent weeks, attempting to lessen the rate of the dollar’s
depreciation against their currencies. Stock indexes in most emerging market
June 18, 2009 Class I FOMC - Restricted Controlled (FR) Page 23 of 79

economies rose at least 10 percent and several climbed more than 20 percent as
mutual fund flows into those markets remained positive.
DEBT, BANK CREDIT, AND MONEY
The level of private-sector debt is projected to have remained about unchanged
in the second quarter as a further modest decline in household debt likely about offset
a slight increase in nonfinancial business debt (Chart 6). In contrast, the federal
government issued debt at a rapid clip, and state and local government debt is
projected to have expanded moderately. All told, the growth rate of domestic
nonfinancial sector debt is projected to have increased from an annual rate of 4
percent in the first quarter of this year to 5½ percent in the second quarter.
Call Report data for the first quarter showed a rebound in the profitability of
commercial banks, although earnings remained quite low by historical standards. The
increase in profitability was concentrated among the largest banks and reflected a
sharp increase in noninterest income and a drop in banks’ noninterest expense. In
contrast, profits for banks outside the top 25 stayed negative as loss provisions
increased further amid deteriorating asset quality. Indeed, the aggregate charge-off
rate and the overall delinquency rate reached their highest levels in more than fifteen
years last quarter.
Commercial bank credit rose slightly in May, following six consecutive months of
decline. The turnaround, however, was accounted for by increases in reverse
repurchase agreements as well as in banks’ securities holdings, with the latter boosted
as a few banks reportedly retained portions of their recent securitizations of consumer
loans. In contrast, core loans — that is, loans to nonfinancial businesses and
households — continued to contract, shrinking at a 7 percent annual rate in May,
likely reflecting an ongoing tightening of lending standards and terms along with weak
June 18, 2009 Class I FOMC - Restricted Controlled (FR) Page 24 of 79
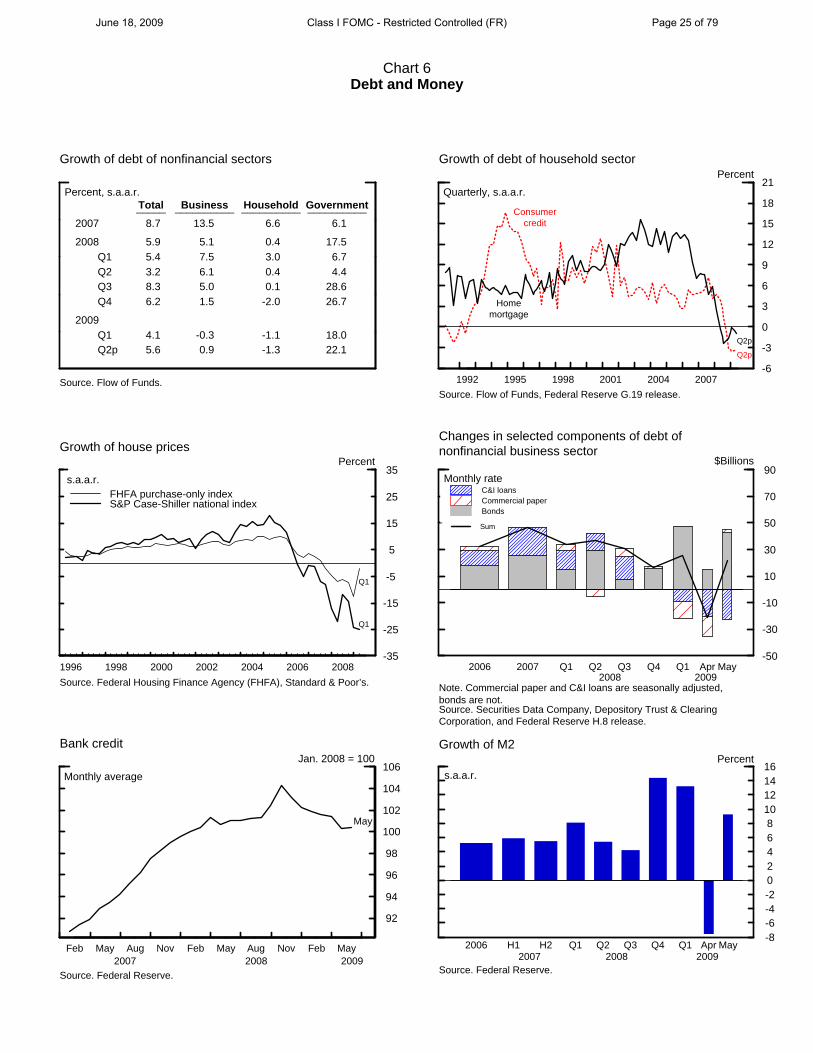
Chart 6Debt and Money
Growth of debt of nonfinancial sectors
Percent, s.a.a.r.
2007
2008
2009
Q1Q2Q3Q4
Q1Q2p
Total_____
8.7
5.95.43.28.36.2
4.15.6
Business__________
13.5
5.17.56.15.01.5
-0.30.9
Household__________
6.6
0.43.00.40.1
-2.0
-1.1-1.3
Government__________
6.1
17.56.74.4
28.626.7
18.022.1
Source. Flow of Funds. 1992 1995 1998 2001 2004 2007-6
-3
0
3
6
9
12
15
18
21
Growth of debt of household sectorPercent
Quarterly, s.a.a.r.
Q2p
Q2p
Consumercredit
Homemortgage
Source. Flow of Funds, Federal Reserve G.19 release.
1996 1998 2000 2002 2004 2006 2008-35
-25
-15
-5
5
15
25
35
FHFA purchase-only indexS&P Case-Shiller national index
Growth of house prices
s.a.a.r.
Percent
Q1
Q1
Source. Federal Housing Finance Agency (FHFA), Standard & Poor’s.
-50
-30
-10
10
30
50
70
90
C&I loansCommercial paperBonds
Sum
Changes in selected components of debt ofnonfinancial business sector
$Billions
2006 2007 Q1 Q2 Q3 Q4 Q1 Apr May2008 2009
Monthly rate
Note. Commercial paper and C&I loans are seasonally adjusted,bonds are not.Source. Securities Data Company, Depository Trust & ClearingCorporation, and Federal Reserve H.8 release.
Feb May Aug Nov Feb May Aug Nov Feb May
92
94
96
98
100
102
104
106
2007 2008 2009
May
Bank creditJan. 2008 = 100
Monthly average
Source. Federal Reserve.
-8-6-4-20246810121416
Growth of M2
s.a.a.r.
Percent
Source. Federal Reserve.
2006 H1 H2 Q1 Q2 Q3 Q4 Q1 Apr May2007 2008 2009
June 18, 2009 Class I FOMC - Restricted Controlled (FR) Page 25 of 79
loan demand, and some shifts in funding from banks to long-term credit markets.
Those trends in securities holdings and core loans continued, on balance, through
early June.
All major components of core loans contracted in May. C&I loans dropped at
about a 15 percent annual rate amid subdued origination activity and broad-based
paydowns of outstanding loans. Real estate loans fell nearly 5 percent, reflecting
declines in commercial real estate loans, home equity loans (the first such decline
since October 2006), and closed-end residential mortgages. Consumer loans, both
those originated by and those retained by banks, edged down. Meanwhile, large banks
significantly increased their allowances for loan and lease losses again in May,
suggesting continued worsening of credit quality in the second quarter.
M2 expanded at an average annual rate of about ¾ percent over April and May, a
sharp slowdown from the rate of growth observed in the first quarter. Considerable
inflows into bond and equity mutual funds during these months suggest that
households might have shifted funds away from M2 assets as concerns about the
financial crisis eased. Within M2, flows into liquid deposits were offset by flows out
of retail money market funds and small time deposits, likely in response to declining
rates on money funds and consumer CDs. Currency growth slowed in April and May,
apparently due to a softening in foreign demand. The monetary base continued its
recent expansion in April and May, although at a slower pace than in the first quarter
as the effect of Federal Reserve asset purchases on reserves was mostly offset by a
drop in usage of liquidity facilities.
June 18, 2009 Class I FOMC - Restricted Controlled (FR) Page 26 of 79
ECONOMIC OUTLOOK
Information received since the April meeting suggests that the downturn
in economic activity is abating. Consumer spending appears to have leveled off
in recent months, and the housing sector has exhibited signs of stabilization.
Tempering the positive news, further deterioration in the labor market has boosted
the unemployment rate to 9.4 percent, considerably higher than the staff projected
last round.
As in April, the Greenbook outlook is predicated on the assumption that the
Federal Reserve will not implement any further liquidity or credit programs beyond
those that have already been announced and will not further expand its large-scale
asset purchase programs. The staff also assumes that the federal funds rate will
remain at exceptionally low levels for the next few years.
In the staff’s projection, longer-term Treasury yields edge up slightly during
the remainder of this year and in 2010; this rise is moderated by the assumption
that financial market participants will gradually revise their expectations regarding
the onset of federal funds rate tightening to match the timing assumed in the
Greenbook. Mortgage rates shift up in parallel with yields on longer-term Treasuries,
whereas investment-grade corporate bond yields drop substantially as risk spreads
continue to moderate from historically high levels. The equity risk premium—which
remains very high by historical standards—diminishes further over coming quarters,
and hence equity prices rise at a fairly brisk annual rate of 15 percent through the end
of 2010. The foreign exchange value of the dollar is assumed to depreciate at an
annual rate of about 2 percent over this horizon. The spot price of West Texas
Intermediate crude oil jumped almost 50 percent to $70 per barrel over the
June 18, 2009 Class I FOMC - Restricted Controlled (FR) Page 27 of 79
intermeeting period; readings from futures quotes indicate that this price is likely to
reach about $80 per barrel by the end of next year.
Against this backdrop, the staff now expects real GDP to grow at an annual rate
of about 1 percent during the second half of 2009, roughly ¼ percentage point faster
than in the April Greenbook but still about a percentage point below the staff’s
estimate of the current growth rate of potential output. The unemployment rate
is projected to rise further, reaching a peak of 10 percent by the fourth quarter of
this year. The economy is expected to strengthen somewhat further next year, with
real GDP growing at a rate of 3 percent and the unemployment rate declining slightly
to about 9¾ percent by the end of 2010.
Core PCE prices increased almost 2 percent at an annual rate during the first
half of this year, boosted in part by the transitory effects of a hike in excise taxes on
tobacco. Excluding tobacco prices, core prices rose at a pace closer to 1¼ percent
over the first half. With no further boost from excise taxes expected in coming
months, and given the current high level of economic slack, the staff projects that
core PCE inflation will moderate over time, averaging just under 1 percent over
the second half of this year and ¾ percent in 2010. Reflecting the recent runup
in the prices of energy and other commodities, headline PCE prices are expected
to rise at an annual rate of about 2½ percent over the remainder of the year before
moderating to about 1 percent next year.
Looking further ahead, the staff assumes that the federal funds rate will remain at
its effective lower bound until 2012 and then move up to about 4 percent by the end
of 2013. The staff forecasts that real GDP will expand at an average rate of about
4¾ percent from 2011 through 2013, outpacing a rise in potential output that
averages nearly 2½ percent per year. As a result, the unemployment rate declines
June 18, 2009 Class I FOMC - Restricted Controlled (FR) Page 28 of 79

steadily, falling to 4.9 percent by late 2013—a bit below the staff’s estimate of the
NAIRU. As real activity recovers, PCE inflation slowly rises to 1.3 percent by 2013
but still remains well below the assumed long-run inflation goal of 2 percent.
June 18, 2009 Class I FOMC - Restricted Controlled (FR) Page 29 of 79

MONETARY POLICY STRATEGIES
As shown in Chart 7, all of the staff’s estimates of short-run r*—the value of the
real federal funds rate that would close the output gap within twelve quarters—have
moved up since the April Bluebook. The Greenbook-consistent measure of short-run
r* based on the FRB/US model, at about -2¾ percent, has risen by ½ percentage
point since April, mainly reflecting higher stock prices, a lower foreign exchange value
of the dollar, and lower corporate bond rates. The same factors largely account for an
upward revision of the FRB/US model estimate to -5½ percent, about 1¼ percentage
points higher than reported in the previous Bluebook. The FRB/US model estimate
still lies substantially below the Greenbook-consistent estimate in part because the
former does not incorporate some of the effects of nontraditional monetary policy
that are embedded in the Greenbook projection. The short-run r* estimate from the
small structural model is now -3½ percent, and its marked increase since the April
Bluebook is largely due to declines in the equity risk premium and the real corporate
bond yield. All of these estimates remain substantially below the current real funds
rate of -1.6 percent. By contrast, the estimate from the single-equation model, which
depends only on the level of the output gap and the lagged real funds rate and so does
not take account of the effects of financial market strains, is a bit above the actual real
rate.
In addition to the three models that have been employed in the past to generate
estimates of short-run r*, this Bluebook introduces new measures derived from the
EDO model (see box “Measures of the Equilibrium Real Interest Rate from a DSGE
Model”). The current estimate of Greenbook-consistent r* from EDO is about
-4 percent; this estimate is noticeably below the FRB/US Greenbook-consistent
estimate of -2¾ percent because the estimated boost to real activity that results from a
sustained period of low real rates is smaller in EDO than in FRB/US. The EDO
June 18, 2009 Class I FOMC - Restricted Controlled (FR) Page 30 of 79

Chart 7Equilibrium Real Federal Funds Rate
1990 1991 1992 1993 1994 1995 1996 1997 1998 1999 2000 2001 2002 2003 2004 2005 2006 2007 2008 2009-10
-8
-6
-4
-2
0
2
4
6
8
-10
-8
-6
-4
-2
0
2
4
6
8Percent
Note: Appendix A provides background information regarding the construction of these measures and confidence intervals. The actual real federal funds rate shown is based on lagged core inflation as a proxy for inflation expectation. For informationregarding alternative measures, see Appendix A.
Short-Run Estimates with Confidence Intervals
The actual real funds rate based on lagged core inflationRange of model-based estimates70 Percent confidence interval90 Percent confidence intervalGreenbook-consistent measure (FRB/US)
Short-Run and Medium-Run Measures
Current Estimate Previous Bluebook
Short-Run Measures
Single-equation model -1.4 -1.7
Small structural model -3.5 -9.1
EDO model -3.8 ---
FRB/US model -5.5 -6.7
Confidence intervals for four model-based estimates
70 percent confidence interval -5.7 to -1.4
90 percent confidence interval -6.7 to -0.1
Greenbook-consistent measures
EDO model -3.9 ---
FRB/US model -2.7 -3.2
Medium-Run Measures
Single-equation model 1.5 (1.5
Small structural model 1.5 (1.2
Confidence intervals for two model-based estimates
70 percent confidence interval (0.6 to 2.4
90 percent confidence interval -0.1 to 3.0
TIPS-based factor model (2.0 2.0
Memo
Actual real federal funds rate -1.6 -1.7
June 18, 2009 Class I FOMC - Restricted Controlled (FR) Page 31 of 79
Measures of the Equilibrium Real Interest Rate from a DSGE Model
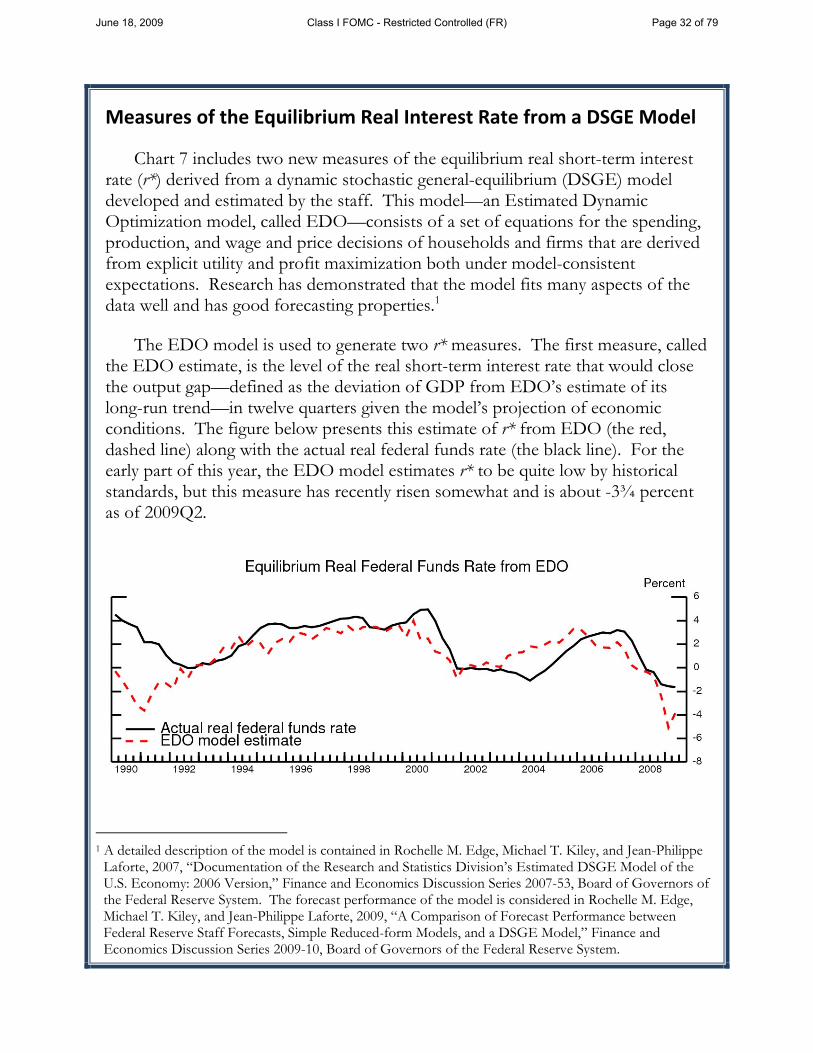
Chart 7 includes two new measures of the equilibrium real short-term interest rate (r*) derived from a dynamic stochastic general-equilibrium (DSGE) model developed and estimated by the staff. This model—an Estimated Dynamic Optimization model, called EDO—consists of a set of equations for the spending, production, and wage and price decisions of households and firms that are derived from explicit utility and profit maximization both under model-consistent expectations. Research has demonstrated that the model fits many aspects of the data well and has good forecasting properties.1
The EDO model is used to generate two r* measures. The first measure, called the EDO estimate, is the level of the real short-term interest rate that would close the output gap—defined as the deviation of GDP from EDO’s estimate of its long-run trend—in twelve quarters given the model’s projection of economic conditions. The figure below presents this estimate of r* from EDO (the red, dashed line) along with the actual real federal funds rate (the black line). For the early part of this year, the EDO model estimates r* to be quite low by historical standards, but this measure has recently risen somewhat and is about -3¾ percent as of 2009Q2.
1 A detailed description of the model is contained in Rochelle M. Edge, Michael T. Kiley, and Jean-Philippe
Laforte, 2007, “Documentation of the Research and Statistics Division’s Estimated DSGE Model of the U.S. Economy: 2006 Version,” Finance and Economics Discussion Series 2007-53, Board of Governors of the Federal Reserve System. The forecast performance of the model is considered in Rochelle M. Edge, Michael T. Kiley, and Jean-Philippe Laforte, 2009, “A Comparison of Forecast Performance between Federal Reserve Staff Forecasts, Simple Reduced-form Models, and a DSGE Model,” Finance and Economics Discussion Series 2009-10, Board of Governors of the Federal Reserve System.
June 18, 2009 Class I FOMC - Restricted Controlled (FR) Page 32 of 79
The second measure of r*, called the Greenbook-consistent estimate from EDO, is the value that closes the output gap given the staff’s extended projection for the economy. Discrepancies between Greenbook-consistent r* from EDO and Greenbook-consistent r* from FRB/US reflect differences across the models in the responses of activity and inflation to changes in interest rates. The current estimate of Greenbook-consistent r* from EDO is about -4 percent. The EDO Greenbook-consistent estimate lies below the FRB/US Greenbook-consistent estimate of around -2¾ percent because the boost to real activity from a sustained period of low real interest rates is smaller in EDO than in FRB/US. 2
2 A DSGE model can also be used to generate an alternative concept called the natural real interest rate. This
value corresponds to the real interest rate consistent with “efficient” economic fluctuations, or fluctuations that would occur in the absence of economic distortions generated by the presence of nominal wage and price rigidities. This concept is less prevalent in policy discussion and relies to a considerable extent on modeling assumptions (for example, regarding the structural rigidities in price and wage setting) that are not necessarily comparable across models. For a discussion of the natural rate of interest in the EDO model, see Rochelle M. Edge, Michael T. Kiley, and Jean-Philippe Laforte, 2008. “Natural Rate Measures in an Estimated DSGE Model of the U.S. Economy,” Journal of Economic Dynamics and Control, vol. 32(8), pages 2512-2535, August.
June 18, 2009 Class I FOMC - Restricted Controlled (FR) Page 33 of 79

model estimate of r* is about -3¾ percent, 1¾ percentage points higher than the
FRB/US model estimate; the higher value reflects the faster waning of the surprising
weakness in spending in the EDO model than in FRB/US.
Chart 8 shows the result of optimal control simulations of the FRB/US model
that were conducted using the extended staff forecast as a starting point.
Policymakers are assumed to place equal weight on keeping core PCE inflation close
to their 2 percent inflation goal, on keeping unemployment close to the NAIRU, and
on avoiding changes in the federal funds rate. The staff now estimates that the
NAIRU is 5 percent—¼ percentage point higher than assumed in previous
Bluebooks—reflecting the staff’s assessment that this recession’s very high rates of
permanent job loss will raise the level of frictional unemployment. As in recent
Bluebooks, monetary policy remains severely constrained by the zero lower bound in
these simulations, with the nominal funds rate remaining at the lower bound until late
2012 (black solid lines). Due to this constraint, the unemployment rate stays
significantly above the NAIRU until 2012, and core PCE inflation remains noticeably
below the 2 percent goal.
Chart 8 also displays the optimal control results that would be obtained if the zero
bound did not constrain the nominal funds rate (blue dashed lines). Under this
unconstrained policy, the funds rate falls to almost -8 percent next year and stays
below zero until mid-2012; the real funds rate decreases to about -9 percent in 2010.
Relative to the constrained policy, such a policy would reduce unemployment by
about 1½ percentage points over the next few years and would put core PCE inflation
on a significantly higher trajectory. These paths for unemployment and inflation are
slightly above those reported in the April Bluebook (red dotted lines), reflecting the
net effect of the following three intermeeting developments. First, the outlook for
aggregate demand has improved, as evidenced by the increase in r* in Chart 7.
June 18, 2009 Class I FOMC - Restricted Controlled (FR) Page 34 of 79
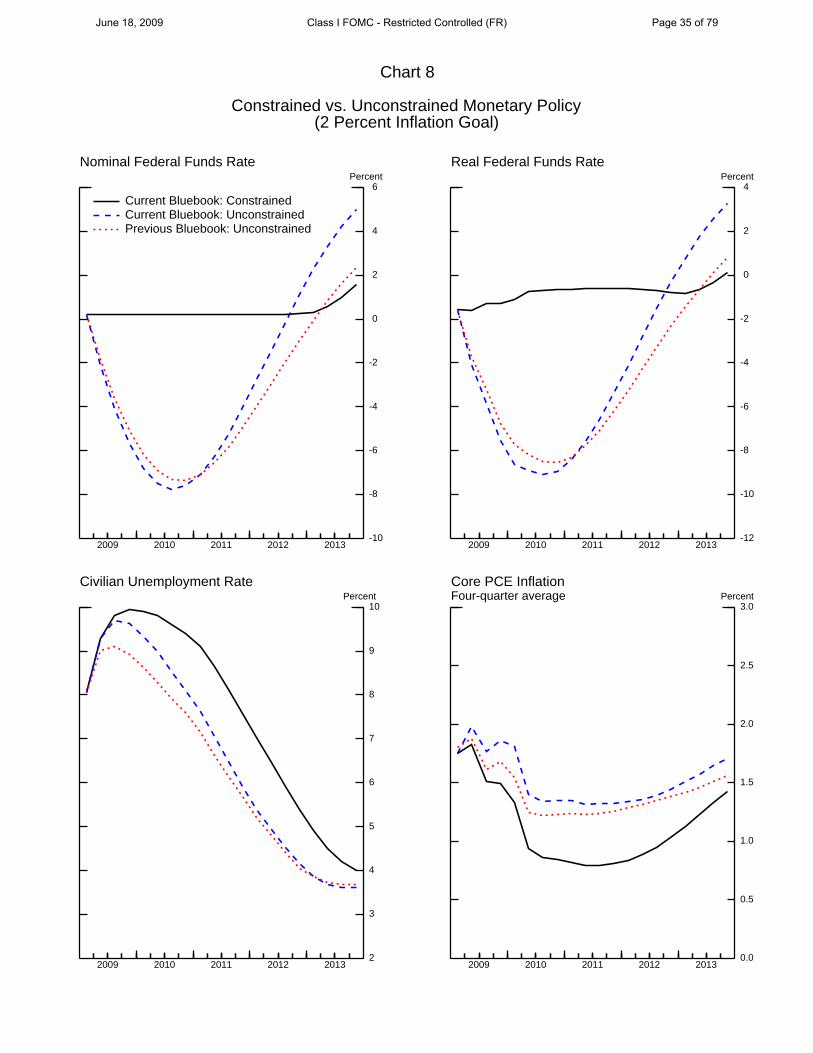
Chart 8
Constrained vs. Unconstrained Monetary Policy(2 Percent Inflation Goal)
2009 2010 2011 2012 2013-10
-8
-6
-4
-2
0
2
4
6
-10
-8
-6
-4
-2
0
2
4
6Percent
Nominal Federal Funds Rate
Current Bluebook: ConstrainedCurrent Bluebook: UnconstrainedPrevious Bluebook: Unconstrained
2009 2010 2011 2012 2013-12
-10
-8
-6
-4
-2
0
2
4
-12
-10
-8
-6
-4
-2
0
2
4Percent
Real Federal Funds Rate
2009 2010 2011 2012 20132
3
4
5
6
7
8
9
10
2
3
4
5
6
7
8
9
10Percent
Civilian Unemployment Rate
2009 2010 2011 2012 20130.0
0.5
1.0
1.5
2.0
2.5
3.0
0.0
0.5
1.0
1.5
2.0
2.5
3.0Percent
Core PCE InflationFour-quarter average
June 18, 2009 Class I FOMC - Restricted Controlled (FR) Page 35 of 79

Second, since April the unemployment rate has continued to move up by more than
would be expected given developments in spending and production, implying that the
outlook for labor market slack, which is reflected in the calculation of the optimal
policy path, has not improved despite the revision in r*. Third, the current projection
of core inflation is slightly higher than in the previous Greenbook, in part because
long-run inflation expectations have not declined as anticipated over recent months,
but if anything, have increased modestly.
As depicted in Chart 9, the outcome-based policy rule prescribes a funds rate at its
effective lower bound until mid-2011; the federal funds rate begins to increase about a
quarter earlier than the prescription shown in the April Bluebook and is consistently
above the April path by about 1 percentage point, largely reflecting the improvement
in the outlook for aggregate demand. Financial market participants expect that the
federal funds rate will rise above 2 percent by 2011 and subsequently reach a plateau
of about 4 percent.6 The expected funds rate path is significantly higher than in the
previous Bluebook, reflecting increased optimism on the part of market participants
about the economic outlook. The distribution of the anticipated federal funds rate is
quite wide, with the 90 percent confidence interval ranging from 1½ to 7½ percent in
2013, and is skewed to the upside. The federal funds rate path anticipated by market
participants appears to involve a much earlier start to tightening than implied by the
outcome-based rule. For example, in the second quarter of 2011, the outcome-based
rule prescribes a funds rate at the lower bound, whereas the funds rate expected by
financial markets appears to be about 2½ percent.
6 The staff has incorporated some technical adjustments in the calculation of the expected
federal funds rate path and the confidence intervals since the April Bluebook. To facilitate comparison, the upper right panel of Chart 9 displays the expected path and the confidence intervals for the current and previous Bluebooks based on the revised estimation procedure.
June 18, 2009 Class I FOMC - Restricted Controlled (FR) Page 36 of 79

Chart 9
The Policy Outlook in an Uncertain Environment
2009 2010 2011 2012 2013
0
1
2
3
4
5
6
7
8
9
0
1
2
3
4
5
6
7
8
9Percent
Note: In calculating the near-term prescriptions of these simple policy rules, policymakers’ long-run inflation objective isassumed to be 2 percent. Appendix B provides further background information.
FRB/US Model Simulations ofEstimated Outcome-Based Rule
Note: In both panels, the dark and light shading represent the 70 and 90 percent confidence intervals respectively. In theright-hand panel, the results labeled as "Previous Bluebook" have been generated using the revised estimation procedurenoted in the text.
Current BluebookPrevious BluebookGreenbook assumption
2009 2010 2011 2012 2013
0
1
2
3
4
5
6
7
8
9
0
1
2
3
4
5
6
7
8
9Percent
Information from Financial Markets
Current BluebookPrevious Bluebook
Near-Term Prescriptions of Simple Policy Rules
Constrained Policy Unconstrained Policy
2009Q3 2009Q4 2009Q3 2009Q4
Taylor (1993) rule 0.13 0.13 -0.03 -0.12
Previous Bluebook 0.13 0.13 -0.47 -0.66 Taylor (1999) rule 0.13 0.13 -3.21 -3.34
Previous Bluebook 0.13 0.13 -3.87 -4.15 First-difference rule 0.13 0.13 -0.51 -0.90
Previous Bluebook 0.13 0.13 -1.94 -2.56 Estimated outcome-based rule 0.13 0.13 -0.56 -1.26
Previous Bluebook 0.13 0.13 -1.79 -2.59 Estimated forecast-based rule 0.13 0.13 -0.61 -1.46
Previous Bluebook 0.13 0.13 -2.09 -3.02
Memo2009Q3 2009Q4
Greenbook assumption 0.13 0.13
Fed funds futures 0.22 0.29
Median expectation of primary dealers 0.13 0.13
Blue Chip forecast (June 1, 2009) 0.20 0.20
June 18, 2009 Class I FOMC - Restricted Controlled (FR) Page 37 of 79

The lower panel of Chart 9 provides near-term prescriptions from simple policy
rules. As shown in the left-hand columns, all the prescriptions are at the effective
lower bound. The right-hand columns show the prescriptions that would be implied
by these rules if the lower bound was not imposed. Under this counterfactual
condition, the Taylor (1993) rule prescribes a slightly negative funds rate for the next
couple of quarters. This prescription is higher than in the April Bluebook by about
½ percentage point, consistent with the improvement in the economic outlook as
summarized in the output gap and inflation. The funds rate prescriptions of all the
other simple rules are also higher than in April.
June 18, 2009 Class I FOMC - Restricted Controlled (FR) Page 38 of 79
POLICY ALTERNATIVES
This Bluebook presents three main policy alternatives—labeled A, B, and C—for
the Committee’s consideration. A variant of B, labeled as B´, is also presented.
Table 1 gives an overview of key elements of these alternatives, and draft statements
are provided on the following pages.
Each of the alternatives refers to the slowing pace of economic contraction and to
improvements in financial market conditions but has a distinct characterization of the
outlook for economic activity and inflation. Consistent with these distinctions, each
alternative presents a different set of judgments regarding the appropriate path of
monetary policy, including the anticipated funds rate trajectory, the total amount and
composition of the Federal Reserve’s large-scale asset purchases (LSAPs), and the
likely timing of the end of such purchases.
In characterizing the incoming information on economic activity, all of the
alternatives state that “indicators of consumer and business sentiment have risen”
and note that household spending has shown “further signs” of stabilizing but
remains constrained by “job losses, reduced housing wealth, and tight credit.” Each
statement also refers to cuts in business spending and staffing while adding that firms
are or appear to be “making progress in bringing inventory stocks into better
alignment with sales.”
Regarding the prospects for economic recovery, Alternative A indicates that
in the absence of further monetary policy stimulus, “the sharp rise in some longer-
term interest rates over recent months” could undermine the economic recovery.
Alternative B reiterates the language from the April FOMC statement indicating that
the Committee anticipates that economic activity “is likely to remain weak for a time”
but that the policies now in train, together with market forces, “will contribute to a
June 18, 2009 Class I FOMC - Restricted Controlled (FR) Page 39 of 79

gradual resumption of sustainable economic growth in a context of price stability.”
These two alternatives are not specific about the likely timing of the recovery, whereas
Alternative C indicates that a gradual recovery “is expected to begin later this year.”
As in the April FOMC statement, each alternative indicates that the Committee
expects inflation “will remain subdued.” In elaborating on this outlook, Alternatives
A and B make reference to “substantial resource slack here and abroad,” while
Alternative C does not refer to the degree of resource slack. Alternatives B and C
also note that the prices of energy and other commodities have risen “of late.”
Following the language of the April statement, Alternative A indicates that the
Committee still sees some downside risks to the inflation outlook, whereas
Alternatives B and C do not comment on the risks to inflation.
All of the alternatives maintain an unchanged target range of 0 to ¼ percent for
the federal funds rate while providing forward guidance about the anticipated duration
of this policy setting. As in the previous two FOMC statements, Alternative B
indicates that economic conditions are likely to warrant an exceptionally low funds
rate “for an extended period.” Alternative A includes an option under which the
Committee would specify that the funds rate will likely remain exceptionally low
“at least through mid-2010.” Alternative C states that the funds rate is likely to
remain at exceptionally low levels “until late this year.”
Each alternative includes the continuation of the previously announced LSAPs.
Alternative A expands the total size of the LSAP program by specifying that the
Federal Reserve will purchase up to $750 billion in Treasury securities and indicating
that those purchases will be conducted through the end of this year. Alternatives B
and C make no changes to the maximum amounts or timing of securities purchases.
June 18, 2009 Class I FOMC - Restricted Controlled (FR) Page 40 of 79
All of the alternatives include language stating that the Committee will continue
to evaluate the timing, composition, and amounts of the LSAPs based on financial
market conditions and the economic outlook. Alternatives A and B indicate that
any additional purchases beyond the announced amounts will be evaluated in view
of “the necessity of assuring that policy accommodation can ultimately be withdrawn
smoothly and at the appropriate time,” thereby underscoring the importance of the
exit strategy in the Committee’s decision-making process. In contrast, Alternative B´
does not include this additional phrase. Alternative C indicates that the Committee
expects that the pace of LSAPs “will taper off gradually by the end of this year” and
hence that this program is unlikely to be expanded or prolonged.
FOMC statements since last December have indicated that the Federal Reserve
will employ “all available tools” in promoting economic recovery and preserving price
stability, whereas the alternatives presented here modify this phrase by referring to
“a wide array of tools.” Moreover, each of the alternatives concludes by stating that
the Committee will continue to monitor the Federal Reserve’s balance sheet and that
adjustments to credit and liquidity programs will be made “as warranted” by evolving
economic and financial conditions. These adjustments to the statement language
could be particularly appropriate if policymakers determine that some liquidity
facilities should be discontinued in light of the recent improvements in financial
market functioning.7
7 See the memo “Proposal Regarding Credit and Liquidity Facilities” that was sent to the
Board and the Committee on June 12, 2009.
June 18, 2009 Class I FOMC - Restricted Controlled (FR) Page 41 of 79
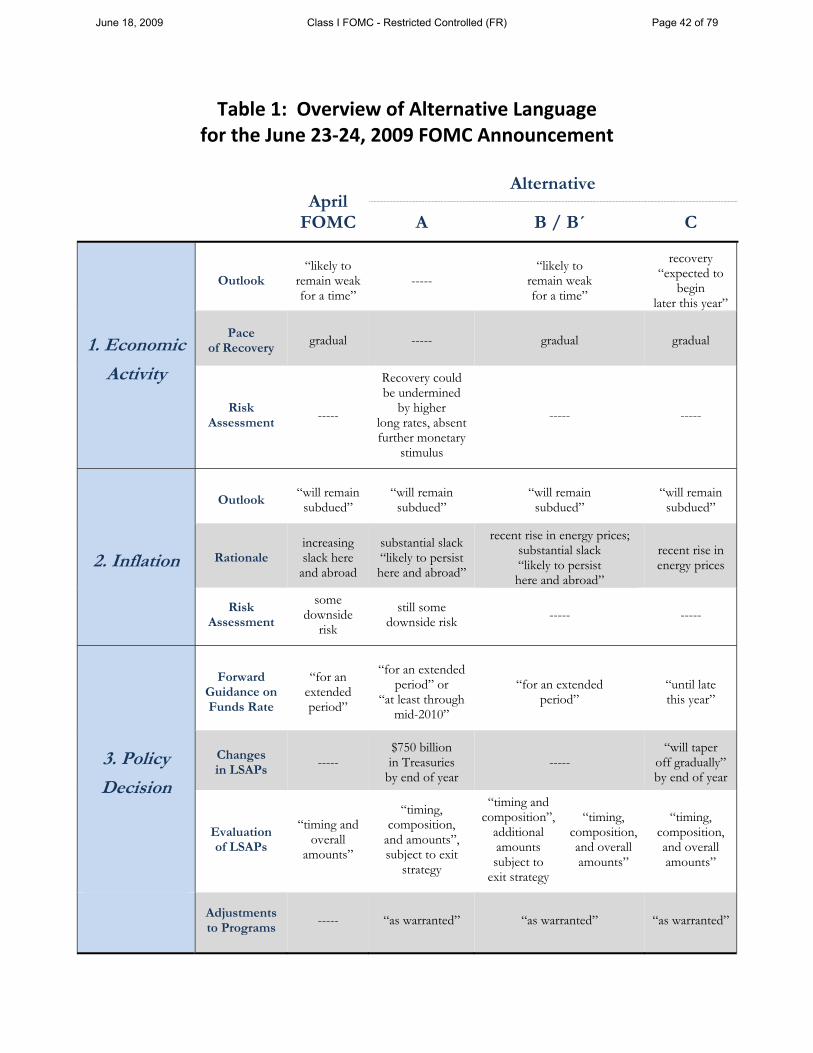
Table 1: Overview of Alternative Language for the June 23‐24, 2009 FOMC Announcement
April FOMC
Alternative
A B / B´ C
1. Economic
Activity
Outlook “likely to
remain weak for a time”
----- “likely to
remain weak for a time”
recovery “expected to
begin later this year”
Pace of Recovery
gradual ----- gradual gradual
Risk Assessment
-----
Recovery could be undermined
by higher long rates, absent further monetary
stimulus
----- -----
2. Inflation
Outlook “will remain subdued”
“will remain subdued”
“will remain subdued”
“will remain subdued”
Rationale increasing slack here
and abroad
substantial slack “likely to persist here and abroad”
recent rise in energy prices; substantial slack “likely to persist here and abroad”
recent rise in energy prices
Risk Assessment
some downside
risk
still some downside risk ----- -----
3. Policy
Decision
Forward Guidance on Funds Rate
“for an extended
period”
“for an extended period” or
“at least through mid-2010”
“for an extended period”
“until late this year”
Changes in LSAPs
----- $750 billion in Treasuries
by end of year -----
“will taper off gradually” by end of year
Evaluation of LSAPs
“timing andoverall
amounts”
“timing, composition,
and amounts”, subject to exit
strategy
“timing and composition”,
additional amounts subject to
exit strategy
“timing, composition, and overall amounts”
“timing, composition, and overall amounts”
Adjustments to Programs
----- “as warranted” “as warranted” “as warranted”
June 18, 2009 Class I FOMC - Restricted Controlled (FR) Page 42 of 79

April FOMC Statement
Information received since the Federal Open Market Committee met in March indicates that the economy has continued to contract, though the pace of contraction appears to be somewhat slower. Household spending has shown signs of stabilizing but remains constrained by ongoing job losses, lower housing wealth, and tight credit. Weak sales prospects and difficulties in obtaining credit have led businesses to cut back on inventories, fixed investment, and staffing. Although the economic outlook has improved modestly since the March meeting, partly reflecting some easing of financial market conditions, economic activity is likely to remain weak for a time. Nonetheless, the Committee continues to anticipate that policy actions to stabilize financial markets and institutions, fiscal and monetary stimulus, and market forces will contribute to a gradual resumption of sustainable economic growth in a context of price stability.
In light of increasing economic slack here and abroad, the Committee expects that inflation will remain subdued. Moreover, the Committee sees some risk that inflation could persist for a time below rates that best foster economic growth and price stability in the longer term.
In these circumstances, the Federal Reserve will employ all available tools to promote economic recovery and to preserve price stability. The Committee will maintain the target range for the federal funds rate at 0 to ¼ percent and anticipates that economic conditions are likely to warrant exceptionally low levels of the federal funds rate for an extended period. As previously announced, to provide support to mortgage lending and housing markets and to improve overall conditions in private credit markets, the Federal Reserve will purchase a total of up to $1.25 trillion of agency mortgage-backed securities and up to $200 billion of agency debt by the end of the year. In addition, the Federal Reserve will buy up to $300 billion of Treasury securities by autumn. The Committee will continue to evaluate the timing and overall amounts of its purchases of securities in light of the evolving economic outlook and conditions in financial markets. The Federal Reserve is facilitating the extension of credit to households and businesses and supporting the functioning of financial markets through a range of liquidity programs. The Committee will continue to carefully monitor the size and composition of the Federal Reserve’s balance sheet in light of financial and economic developments.
June 18, 2009 Class I FOMC - Restricted Controlled (FR) Page 43 of 79

June FOMC Statement — Alternative A
1. Information received since the Federal Open Market Committee met in April suggests that the pace of economic contraction is slowing. Indicators of consumer and business sentiment have risen, and household expenditures have shown further signs of stabilizing; nonetheless, spending remains constrained by ongoing job losses, lower housing wealth, and tight credit. Businesses continue to cut back on fixed investment and staffing but are making progress in bringing inventory stocks into better alignment with sales. Although conditions in financial markets have generally improved, the Committee judges that further monetary policy stimulus is warranted to help ensure that the sharp rise in some longer-term interest rates over recent months does not undermine a recovery in overall economic activity.
2. Substantial resource slack is likely to persist here and abroad, and the Committee expects that inflation will remain subdued. Moreover, the Committee still sees some risk that inflation could persist for a time below rates that best foster economic growth and price stability in the longer term.
3. In these circumstances, the Federal Reserve is employing a wide array of tools to promote economic recovery and to preserve price stability. The Committee will maintain the target range for the federal funds rate at 0 to ¼ percent and anticipates that economic conditions are likely to warrant exceptionally low levels of the federal funds rate [for an extended period|at least through mid-2010]. To provide additional support to mortgage lending and housing markets and to facilitate further improvement in private credit market conditions, the Committee decided to increase the total amount of its large-scale securities purchases. The Committee now anticipates that over the course of this year the Federal Reserve will purchase up to $1.25 trillion of agency mortgage-backed securities, up to $200 billion of agency debt, and up to $750 billion of Treasury securities. The Committee will evaluate the timing, composition, and amounts of any additional purchases of securities in view of market conditions, the evolving economic outlook, and the necessity of assuring that policy accommodation can ultimately be withdrawn smoothly and at the appropriate time. The Federal Reserve will also be monitoring the size and composition of its balance sheet and will make adjustments to its credit and liquidity programs as warranted in light of financial and economic developments.
June 18, 2009 Class I FOMC - Restricted Controlled (FR) Page 44 of 79
June FOMC Statement — Alternative B
1. Information received since the Federal Open Market Committee met in April suggests that the pace of economic contraction is slowing. Conditions in financial markets have generally improved in recent months, and indicators of consumer and business sentiment have risen. Household spending has shown further signs of stabilizing but remains constrained by ongoing job losses, lower housing wealth, and tight credit. Businesses have continued to cut back on fixed investment and staffing but appear to be making progress in bringing inventory stocks into better alignment with sales. Although economic activity is likely to remain weak for a time, the Committee anticipates that policy actions to stabilize financial markets and institutions, fiscal and monetary stimulus, and market forces will contribute to a gradual resumption of sustainable economic growth in a context of price stability.
2. The prices of energy and other commodities have risen of late. However, substantial resource slack is likely to persist here and abroad, dampening cost pressures for some time, and the Committee expects that inflation will remain subdued.
3. In these circumstances, the Federal Reserve is employing a wide array of tools to promote economic recovery and to preserve price stability. The Committee will maintain the target range for the federal funds rate at 0 to ¼ percent and continues to anticipate that economic conditions are likely to warrant exceptionally low levels of the federal funds rate for an extended period. As previously announced, to provide support to mortgage lending and housing markets and to improve overall conditions in private credit markets, the Federal Reserve will purchase a total of up to $1.25 trillion of agency mortgage-backed securities and up to $200 billion of agency debt by the end of the year. In addition, the Federal Reserve will buy up to $300 billion of Treasury securities by autumn. The Committee may modify the timing and composition of these purchases in view of market conditions and the evolving economic outlook. In evaluating possible purchases beyond the amounts already announced, the Committee will also take careful account of the necessity of assuring that policy accommodation can ultimately be withdrawn smoothly and at the appropriate time. The Federal Reserve will be monitoring the size and composition of its balance sheet and will make adjustments to its credit and liquidity programs as warranted in light of financial and economic developments.
June 18, 2009 Class I FOMC - Restricted Controlled (FR) Page 45 of 79

June FOMC Statement — Alternative B´
1. Information received since the Federal Open Market Committee met in April suggests that the pace of economic contraction is slowing. Conditions in financial markets have generally improved in recent months, and indicators of consumer and business sentiment have risen. Household spending has shown further signs of stabilizing but remains constrained by ongoing job losses, lower housing wealth, and tight credit. Businesses have continued to cut back on fixed investment and staffing but appear to be making progress in bringing inventory stocks into better alignment with sales. Although economic activity is likely to remain weak for a time, the Committee anticipates that policy actions to stabilize financial markets and institutions, fiscal and monetary stimulus, and market forces will contribute to a gradual resumption of sustainable economic growth in a context of price stability.
2. The prices of energy and other commodities have risen of late. However, substantial resource slack is likely to persist here and abroad, dampening cost pressures for some time, and the Committee expects that inflation will remain subdued.
3. In these circumstances, the Federal Reserve is employing a wide array of tools to promote economic recovery and to preserve price stability. The Committee will maintain the target range for the federal funds rate at 0 to ¼ percent and anticipates that economic conditions are likely to warrant exceptionally low levels of the federal funds rate for an extended period. As previously announced, to provide support to mortgage lending and housing markets and to improve overall conditions in private credit markets, the Federal Reserve will purchase a total of up to $1.25 trillion of agency mortgage-backed securities and up to $200 billion of agency debt by the end of the year. In addition, the Federal Reserve will buy up to $300 billion of Treasury securities by autumn. The Federal Reserve is facilitating the extension of credit to households and businesses and supporting the functioning of financial markets through a range of liquidity programs. The Committee will continue to evaluate the timing, composition, and overall amounts of its securities purchases and to carefully monitor the Federal Reserve’s balance sheet. The Federal Reserve will make adjustments to its credit and liquidity programs as warranted in light of the evolving economic outlook and conditions in financial markets.
June 18, 2009 Class I FOMC - Restricted Controlled (FR) Page 46 of 79

June FOMC Statement — Alternative C
1. Information received since the Federal Open Market Committee met in April suggests that the pace of economic contraction is slowing. Conditions in financial markets have improved in recent months, and indicators of consumer and business sentiment have risen. Household spending has shown further signs of stabilizing but remains constrained by ongoing job losses, lower housing wealth, and tight credit. Businesses have continued to cut back on fixed investment and staffing but appear to be making progress in bringing inventory stocks into better alignment with sales. The Committee anticipates that policy actions to stabilize financial markets and institutions, fiscal and monetary stimulus, and market forces will contribute to a gradual recovery in economic activity that is expected to begin later this year.
2. Although the prices of energy and other commodities have risen of late, core inflation has remained moderate, and the Committee expects that overall inflation will remain subdued.
3. In these circumstances, the Federal Reserve is employing a wide array of tools to promote economic recovery and to preserve price stability. The Committee will maintain the target range for the federal funds rate at 0 to ¼ percent and anticipates that economic conditions are likely to warrant exceptionally low levels of the federal funds rate until late this year. As previously announced, to provide support to mortgage lending and housing markets and to improve overall conditions in private credit markets, the Federal Reserve will purchase a total of up to $1.25 trillion of agency mortgage-backed securities and up to $200 billion of agency debt by the end of the year. In addition, the Federal Reserve will buy up to $300 billion of Treasury securities by autumn. The Committee anticipates that the pace of purchases of such securities will taper off gradually by the end of this year. The Committee will continue to evaluate the timing, composition, and overall amounts of its securities purchases and to carefully monitor the Federal Reserve’s balance sheet. The Federal Reserve will make adjustments to its credit and liquidity programs as warranted in light of the evolving economic outlook and conditions in financial markets.
June 18, 2009 Class I FOMC - Restricted Controlled (FR) Page 47 of 79

THE CASE FOR ALTERNATIVE B
If policymakers judge that the monetary policy stimulus already in train is likely
to foster economic and financial conditions that improve at an acceptable pace, then
the Committee could choose to reiterate its previous forward policy guidance and
to continue implementing the previously announced LSAPs while providing further
clarification of its strategy for these purchases, as in Alternative B. The Committee’s
modal outlook may be broadly similar to that of the Greenbook, in which this
policy stance contributes to a gradual acceleration in economic activity and to
an unemployment rate trajectory that peaks later this year and then moves lower
next year. The indication that the federal funds rate is likely to remain exceptionally
low “for an extended period” is consistent with the funds rate path prescribed by the
constrained optimal control policy (Chart 8) and with that implied by the estimated
outcome-based rule (Chart 9); moreover, given various sources of uncertainty about
the evolution of economic and financial conditions, this expression may be helpful in
preserving the Committee’s flexibility regarding the timing of its initiation of funds
rate tightening.
The Committee may also judge that developments over the intermeeting period—
including improved financial market functioning, the ability of banking institutions to
raise significant amounts of private capital, the pickup in consumer and business
sentiment, and the recent stabilization of household spending—point to a waning
of downside risks to economic growth and inflation. Even if Committee members
remain concerned about significant downside risks to inflation stemming from their
expectation of persistently elevated resource slack, they may also perceive a similar
degree of upside risks to inflation associated with the possibility that inflation
expectations could shift upward as a consequence of large federal budget deficits,
June 18, 2009 Class I FOMC - Restricted Controlled (FR) Page 48 of 79

exceptionally low levels of the federal funds rate, and the extraordinary size of the
Federal Reserve’s balance sheet.
While participants may anticipate—as in the projections they submitted in April—
that economic activity is likely to recover only gradually over the next few years, they
may see the slow pace of this recovery as largely unavoidable in light of the nature and
severity of the global financial crisis and the time required for healing of the financial
system and for the other structural adjustments—such as the overhaul of the
automobile sector—that are now underway. Even if policymakers would prefer
to foster a speedier recovery, they might be concerned that measures for providing
further monetary stimulus could turn out to be counterproductive. For example,
expanding the total amount of purchases of Treasury securities could lead to an
increase in private nominal and real borrowing rates if investors interpreted this
policy as pointing towards possible future monetization of federal budget deficits and
hence required greater compensation for inflation risk in nominal lending contracts.
Committee members may perceive substantial benefits of providing additional
guidance regarding the LSAP program in the statement for this meeting, especially
if the recent upswing in measures of implied and realized volatility in Treasury bond
markets is seen as partly reflecting investor uncertainty about the Committee’s LSAP
strategy.8 First, stating that the Committee “may modify the timing and composition
of these purchases in view of market conditions” could help signal that policymakers
are prepared to be flexible in adjusting these aspects of the LSAP program. As a case
in point, if the recent rise in mortgage rates persists over coming months and induces
8 As discussed in Appendix I of the memo “Large-Scale Asset Purchases: Recent
Experience and Some Policy Considerations” that was sent to the Committee on June 16, 2009, theoretical and empirical research generally confirms that policy communications can significantly reduce the volatility of asset prices when market participants have imperfect information about the structure of the economy or the objectives of policymakers.
June 18, 2009 Class I FOMC - Restricted Controlled (FR) Page 49 of 79

a slower pace of refinancing, the Committee might conclude that the timeframe for
completing its agency MBS purchases should be extended into the first quarter of
next year or that the composition of purchases should be adjusted. By indicating
that policy accommodation will be “withdrawn smoothly,” the Committee could
help underscore that the LSAPs are likely to taper off rather than ending abruptly.
Finally, policymakers may wish to underscore the importance of maintaining a viable
exit strategy by indicating that the Committee will take careful account of the need
for policy accommodation to be withdrawn “at the appropriate time” in evaluating
any securities purchases beyond the amounts that have already been announced.9
Financial markets are likely to react only modestly to an announcement like that
of Alternative B in which the Committee reiterates its forward policy guidance and
maintains the LSAP program at the previously announced amounts. Based on the
latest Desk survey, dealers generally anticipate that at this meeting the Committee
will continue to state that the funds rate is likely to remain exceptionally low “for an
extended period.” Dealers also place low odds on the possibility that the Committee’s
announcement at this meeting will include an increase in the maximum amount of
purchases of Treasury securities, agency MBS, or agency debt. The survey indicates
that dealers currently expect that the Federal Reserve’s purchases of Treasury
securities will reach the announced maximum of $300 billion by autumn and that
a majority of dealers anticipate that an additional amount in the range of $50 to
$150 billion will be purchased during the fourth quarter. Dealers expect that
purchases of agency MBS and agency debt will reach the previously announced
maximum amounts by December. No additional LSAP purchases are anticipated
beyond the end of this year.
9 For further discussion of various exit strategies, see the memo “Reserve Management
Tools to Target a Higher Policy Rate” that was sent to the Committee on June 12, 2009.
June 18, 2009 Class I FOMC - Restricted Controlled (FR) Page 50 of 79

Nonetheless, the market reaction to a statement like that of Alternative B might
also depend on how investors interpret the new language describing the Committee’s
evaluation of further adjustments to the LSAP program. For example, the reference
to “possible purchases beyond the amounts already announced” could cause investors
to raise their assessment of the likelihood of expanding the total amount of LSAPs.
On the other hand, market participants might interpret the clause referring to “the
necessity of assuring that policy accommodation can ultimately be withdrawn” as
indicating a high hurdle to any such expansion and as suggesting that the Committee
has become more concerned about the viability of its exit strategy. Moreover,
the announcement could prompt some persistent volatility in asset prices as
these interpretations continued to evolve. On net, short- and long-term yields,
equity prices, and the foreign exchange value of the dollar might not move
very substantially, but judging the likely response of financial markets to this
statement is subject to considerable uncertainty.
If members’ assessment of the current outlook and the appropriate stance of
policy matches that of Alternative B, but they see a significant risk that the associated
statement could cause confusion on the part of financial market participants, then
the Committee might wish to follow the language of the April FOMC statement
more closely, as in Alternative B´. The financial market reaction to the publication
of a statement like Alternative B´ would likely be muted, with little change in yields,
equity prices, or the foreign exchange value of the dollar.
THE CASE FOR ALTERNATIVE A
If policymakers judge that a protracted period of substantial resource slack
continues to pose downside risks to inflation and if they are concerned that the recent
increase in some longer-term interest rates could undermine the economic recovery,
then the Committee may wish to expand the total amount of purchases of Treasury
June 18, 2009 Class I FOMC - Restricted Controlled (FR) Page 51 of 79

securities and to extend the timeframe for conducting those purchases, as in
Alternative A. Even if participants generally agree with the contours of the staff’s
modal outlook, they may not view that outcome as acceptable and may see compelling
grounds for providing increased monetary policy stimulus to promote a more rapid
pace of recovery and to help keep inflation from falling persistently below rates
consistent with the Federal Reserve’s dual mandate. Indeed, the optimal control
simulations depicted in Chart 8 indicate that the real federal funds rate would be
substantially lower and would foster significantly better outcomes for unemployment
and inflation if the nominal funds rate were not constrained by the effective
lower bound; thus, these simulations may provide motivation for policymakers
to expand the degree of monetary stimulus provided through nontraditional policies
such as LSAPs.
Policymakers may view the upward shift in mortgage rates over the intermeeting
period as posing a significant threat to the stabilization of the housing sector that
could put further pressure on financial institutions and economic activity. Moreover,
members may perceive a number of other factors as augmenting the magnitude of the
downside risks, such as those considered in the “False Dawn” and “Deflation”
scenarios in the Greenbook. Thus, the Committee may conclude that an expansion of
the LSAP program is warranted to reduce longer-term yields or at least to mitigate any
further increases in such yields, thereby limiting the downside risks to the economy.
As noted in recent staff analysis, the Committee may see expanded Treasury
securities purchases as the most suitable means of implementing an expansion in the
overall size of the LSAP program, given that the current flow of the Federal Reserve’s
purchases of Treasury securities is relatively small in comparison with the amount of
June 18, 2009 Class I FOMC - Restricted Controlled (FR) Page 52 of 79
new issuance of those securities.10 In contrast, the monthly volume of agency MBS
purchases already constitutes a large share of new issuance, and a further increase
might be particularly problematic if the pace of mortgage refinancing falls off further
in coming months. Expanded purchases of agency securities would appear to be
inadvisable in light of their narrow spreads and shrinking supply.
Since market participants reportedly see only small odds that the Committee
will announce an expansion of its securities purchases at this meeting, it is likely
that longer-term yields would fall substantially following the release of a statement
like that accompanying Alternative A. Although considerable uncertainty surrounds
any assessment of the effects of LSAPs on asset prices, recent experience suggests
that an expansion of $450 billion in purchases of Treasury securities would induce
a decline of about 20 to 45 basis points in Treasury yields and other longer-term rates
immediately following the announcement. Equity prices would likely climb, and the
foreign exchange value of the dollar would fall. Forward inflation compensation
could increase if this announcement led to a heightening of investor concerns
regarding the Federal Reserve’s exit strategy or the future monetization of federal
budget deficits.
THE CASE FOR ALTERNATIVE C
If policymakers are reasonably confident that an economic recovery will begin
during the second half of this year and that laying the foundations for a gradual
withdrawal of monetary stimulus would thus be appropriate under present
circumstances, they may judge that the LSAP program should taper off this fall and
that an increased funds rate might well be warranted at the end of this year or early
10 See section IV of the memo “Large-Scale Asset Purchases: Recent Experience and Some
Policy Considerations” that was sent to the Committee on June 16, 2009.
June 18, 2009 Class I FOMC - Restricted Controlled (FR) Page 53 of 79
next year, as in Alternative C. Given the recent behavior of inflation expectations,
the somewhat smaller margin of projected resource slack, and the rises in the prices of
energy and other commodities, the Committee may now see the risks to the inflation
outlook as roughly balanced, with significantly diminished odds of excessive
disinflation. Participants may also prefer to assign relatively little weight to real-time
estimates of resource slack in projecting the likely path of inflation and in assessing
the risks to the inflation outlook. Uncertainties about the path of potential output
and the level of the NAIRU might be seen as particularly high in the current context
of structural changes related to the financial crisis, the housing collapse, and the
overhaul of the auto sector.
In light of the recent pickup in forward inflation compensation, policymakers
may also determine that a preemptive move towards reducing policy accommodation
would be appropriate to help ensure that long-term inflation expectations do not
drift upward over coming quarters. Moreover, participants may perceive a substantial
likelihood that the recuperation of financial markets and institutions could contribute
to a stronger rebound in economic activity than the staff projects, as illustrated by the
Greenbook’s “Early Liftoff” scenario.
An announcement like that of Alternative C would come as a considerable
surprise to financial market participants and would likely lead many investors to
expect a significantly less accommodative path of monetary policy than they had
previously anticipated. The Desk survey indicates that primary dealers uniformly
expect that the Committee’s statement at this meeting will reiterate the same forward
policy guidance as in recent FOMC statements. Only one-third of the dealers expect
the federal funds rate to be raised above its effective lower bound by next June, while
another third expect the initial rate hike to occur during the second half of 2010,
and the remainder do not expect tightening before 2011. Thus, the publication of a
June 18, 2009 Class I FOMC - Restricted Controlled (FR) Page 54 of 79

statement like Alternative C would likely push up short- and long-term yields and the
foreign exchange value of the dollar, while equity prices would likely fall. Forward
inflation compensation might decline if the statement were seen as signaling the
Federal Reserve’s determination to avoid a significant increase in inflation.
June 18, 2009 Class I FOMC - Restricted Controlled (FR) Page 55 of 79

LONG‐RUN PROJECTIONS OF THE BALANCE SHEET AND MONETARY BASE
Under the Federal Reserve’s current policy approach, the size of the Federal
Reserve’s balance sheet is driven by the evolution of its assets, specifically, the scale of
asset purchases and demand for Federal Reserve liquidity facilities and credit
programs. Total liabilities are determined by total assets, and the composition of
liabilities depends on currency demand and other factors on the liability side, with
reserve balances determined as a residual.
Two balance sheet scenarios are presented here; they differ in their assumptions
regarding asset purchases. The first scenario is a baseline scenario, which includes the
maximum of large-scale asset purchases previously announced by the FOMC:
$300 billion of Treasury securities by the autumn, $200 billion of agency debt by the
end of this year, and $1,250 billion of agency mortgage-backed securities (MBS) by the
end of this year. This baseline scenario corresponds to Alternative B in the Policy
Alternatives section. The second scenario is an expanded purchases scenario, which
corresponds to Alternative A in the Policy Alternatives section, where purchases of
Treasury securities are increased by $450 billion to $750 billion, and the purchases
continue through the end of this year.
To construct the projections, we made assumptions about all components of the
balance sheet other than reserve balances, which are the residual item. On the asset
side of the balance sheet, the foreign central bank liquidity swap lines and the Term
Auction Facility (TAF) are assumed to wind down by year-end 2010 as financial
markets continue to improve. The assets held by Maiden Lane LLC, Maiden Lane II
LLC, and Maiden Lane III LLC are assumed to be sold over time; they reach zero by
2015. The Term Asset-Backed Securities Loan Facility (TALF) is assumed to reach its
peak at $175 billion–well below the announced $1 trillion limit–at the end of 2010.
June 18, 2009 Class I FOMC - Restricted Controlled (FR) Page 56 of 79
The first phase of the TALF makes $125 billion of three-year loans by the end of
2010; later phases are assumed to make $50 billion of five-year loans by that date.
Other Section 13(3) facilities are assumed to be extended beyond October 30, 2009,
but are expected to run off by the end of 2010 in a similar fashion to the swap lines.
For large-scale asset purchases, the baseline path of purchases matches the assumed
path in the Greenbook whereas the expanded purchases scenario boosts Treasury
purchases; both scenarios assume that the assets purchased are held to maturity. For
the projection of MBS holdings, a slower-than-average path for the prepayment of
MBS implies that more than half of the MBS purchased are still on the balance sheet
in 2016.
Relative to the April Bluebook, there are two notable changes to the projections
for assets. First, the TALF is assumed to make a total of $175 billion in loans, sharply
less than the $500 billion in total loans assumed in the last Bluebook. This revision
reflects experience to date with the uptake of the facility. A second significant
revision comes from the prepayment rate assumed for MBS holdings. Higher interest
rates in this projection and a reassessment of the models used to make these
projections have led the staff to mark down the assumed prepayment rate of the MBS,
implying holdings that are about $185 billion higher in 2016 than in the last Bluebook.
In addition to these changes, holdings of agency debt are assumed to mature a bit
more quickly than last round. Some of the other lending facilities are now seen as
running off slightly faster than was previously projected in light of the improvement
in financial markets. All told, total assets at year-end 2009 are about $500 billion
lower in this projection compared with that presented in the April Bluebook.
However, by the end of the projection period in 2016, total assets are in line with the
April Bluebook projection.
June 18, 2009 Class I FOMC - Restricted Controlled (FR) Page 57 of 79
On the liability side of the Federal Reserve’s balance sheet, both scenarios assume
that currency (Federal Reserve notes) grows at the same rate as the staff forecast for
money stock currency through 2010 and after that point expands at the projected
growth rate of nominal GDP in the extended Greenbook forecast. The Treasury’s
Supplementary Financing Account is projected to wind down by the middle of 2010,
and the U.S. Treasury’s general account is assumed to return to its historical target
level of $5 billion by the end of 2009. All other liabilities other than reverse
repurchase agreements and reserve balances are assumed to be constant at their level
as of May 29, 2009. Federal Reserve Bank capital is projected to grow in line with its
average pace of expansion over the past ten years. Relative to the April Bluebook, the
staff has made only modest changes to the assumptions for liabilities. The
Supplementary Financing Account is now assumed to stay at its current level of
$200 billion somewhat longer, based on statements made by the Treasury in its last
quarterly financing estimates. The assumption about capital replaces the previous
assumption that capital was constant. 11
These projections for liabilities and capital, combined with the assumed path for
assets, imply a path for reserve balances under each scenario. In both scenarios, the
implied level of reserve balances rises rapidly until the end of 2009, and then declines
through the end of the projection period. Relative to the April Bluebook, the level of
reserve balances is lower for the next few years, primarily reflecting the smaller
assumed size of the TALF program. However, from 2013 forward, the slower
prepayment rate assumed for MBS holdings leads to a somewhat higher level of
reserve balances.
Under both scenarios, the Federal Reserve’s balance sheet expands rapidly over
the course of 2009. For the baseline scenario, the balance sheet reaches a peak of 11 More details on the assumptions are provided in Appendix C.
June 18, 2009 Class I FOMC - Restricted Controlled (FR) Page 58 of 79
$2.8 trillion in the fourth quarter of 2009 and then declines to a level just below
$1.5 trillion at the end of the projection period. For the expanded scenario, the peak
is at the same date, but at a higher level of $3.3 trillion. Assets then decline to roughly
the same level as in the baseline at the end of the projection period. Relative to the
last Bluebook, the peak under either scenario is lower because of the assumed usage
of the TALF and the runoff of other liquidity facilities. By the end of the forecast
period, the projected size of the balance sheet is in line with the last Bluebook.
The composition of Federal Reserve assets in both of these projections differs
notably from historical patterns. Prior to August 2007, U.S. Treasury securities were
about 90 percent of assets and the Federal Reserve did not hold any agency mortgage-
backed securities. By contrast, under the baseline scenario, Treasuries are projected to
account for only around one-fourth of total assets at the end of 2009 and rise to just
40 percent of total assets at the end of the projection period. Even under the
expanded purchases scenario, Treasury securities account for only about one-third of
assets at the end of 2009.
Projections for the growth rates of the monetary base are derived from these
balance sheet projections using the sum of Federal Reserve notes in circulation and
reserve balances.12 Under both scenarios, the monetary base expands rapidly in 2009
and into early 2010. In the second quarter of 2010, however, as the liquidity facilities
wind down and asset purchases cease, the monetary base begins to contract; the base
continues to decline through the remainder of the projection period despite continued
growth in currency.
12 The calculated growth rates of the monetary base presented in the table are based on an
approximation for month-average values. In the April Bluebook, the calculation was based on month-end values. The April values shown in this table use the new methodology.
June 18, 2009 Class I FOMC - Restricted Controlled (FR) Page 59 of 79

The extended Greenbook projection shows the target federal funds rate rising
from the current 0 to ¼ percent range to 2.4 percent over the course of 2012. Under
the operating procedures employed before the financial crisis, the projected 2012 end-
of-year reserve balances of approximately $800 billion would not have been consistent
with a federal funds rate significantly above zero. If the interest rate paid on excess
reserve balances becomes an effective floor for the federal funds rate, a higher target
rate could be achieved even with quite elevated reserve balances simply by raising the
excess reserves rate. The experience last autumn, however, suggests that the Desk
would likely need to drain reserves through open market operations to keep the funds
rate close to the excess reserves rate. The projection for the balance sheet implicitly
assumes that alternative operating procedures can be put into place to achieve the
path for the federal funds rate assumed in the Greenbook projection; such procedures
might employ a range of tools such as reverse repurchase agreements, outright sales of
securities, a term deposit facility, or other strategies.13
13 A discussion of the issues surrounding tools to raise the federal funds rate can be found in
a memorandum to the FOMC dated June 12, 2009 “Reserve Management Tools to Target a Higher Policy Rate.”
June 18, 2009 Class I FOMC - Restricted Controlled (FR) Page 60 of 79

Growth Rates for Monetary Base
Date Baseline Expanded Purchases
April Baseline
Percent, annual rate Monthly
Jun-09 -52.1 -52.1 60.2Jul-09 -0.4 -0.4 131.9
Aug-09 99.3 99.3 133.9Sep-09 97.3 97.3 120.5Oct-09 103.1 148.3 98.1Nov-09 95.7 173.1 79.9Dec-09 102.1 163.8 71.1
Quarterly Q2 2009 24.9 24.9 38.4Q3 2009 22.7 22.7 111.9Q4 2009 108.2 157.0 107.3Q1 2010 48.0 78.6 26.2Q2 2010 -7.1 -6.7 -17.2Q3 2010 -15.6 -14.0 -17.9Q4 2010 -19.0 -16.9 -18.8
Annual - period average 2009 92.5 98.2 120.32010 32.5 51.3 34.42011 -11.1 -10.0 -14.12012 -9.0 -10.0 -14.42013 -12.4 -14.2 -25.02014 -9.3 -11.2 -19.72015 -9.2 -10.3 -14.82016 -7.7 -10.2 2.3
Note: Not seasonally adjusted.
June 18, 2009 Class I FOMC - Restricted Controlled (FR) Page 61 of 79
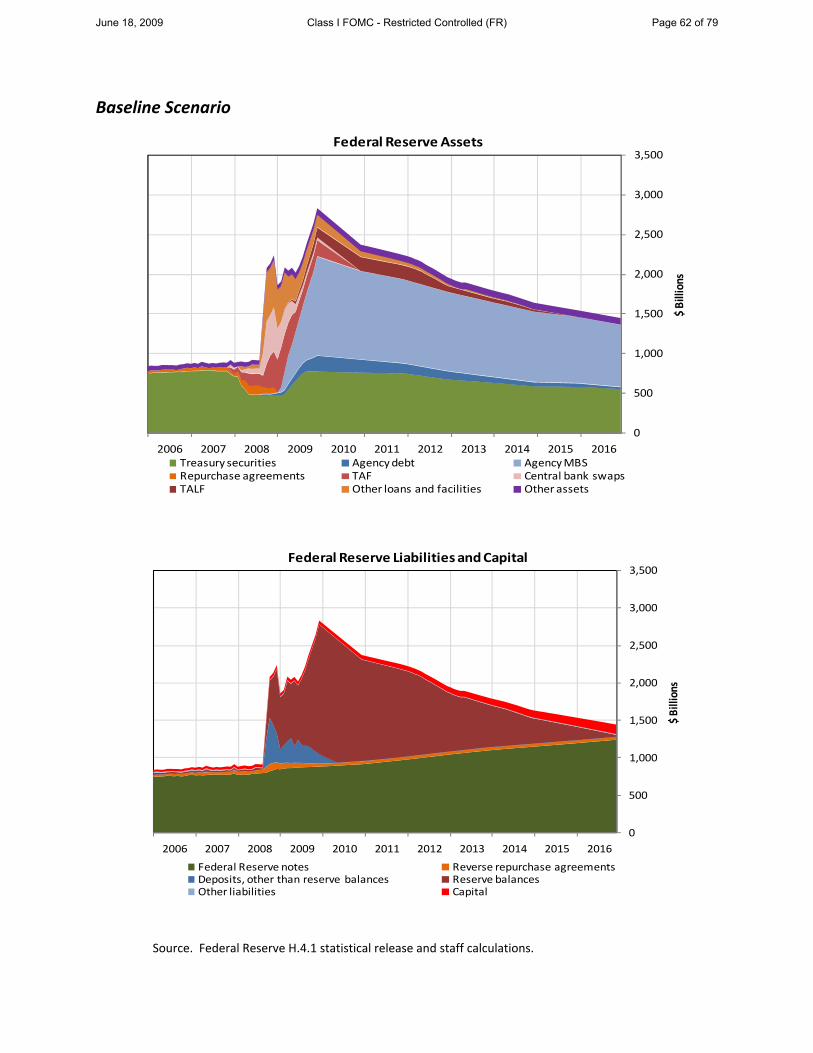
Baseline Scenario
Source. Federal Reserve H.4.1 statistical release and staff calculations.
0
500
1,000
1,500
2,000
2,500
3,000
3,500
2006 2007 2008 2009 2010 2011 2012 2013 2014 2015 2016
$ Billions
Federal Reserve Assets
Treasury securities Agency debt Agency MBSRepurchase agreements TAF Central bank swaps TALF Other loans and facilities Other assets
0
500
1,000
1,500
2,000
2,500
3,000
3,500
2006 2007 2008 2009 2010 2011 2012 2013 2014 2015 2016
$ Billions
Federal Reserve Liabilities and Capital
Federal Reserve notes Reverse repurchase agreementsDeposits, other than reserve balances Reserve balancesOther liabilities Capital
June 18, 2009 Class I FOMC - Restricted Controlled (FR) Page 62 of 79

Expanded Purchases Scenario
Source. Federal Reserve H.4.1 statistical release and staff calculations.
0
500
1,000
1,500
2,000
2,500
3,000
3,500
2006 2007 2008 2009 2010 2011 2012 2013 2014 2015 2016
$ Billions
Federal Reserve Assets
Treasury securities Agency debt Agency MBSRepurchase agreements TAF Central bank swaps TALF Other loans and facilities Other assets
0
500
1,000
1,500
2,000
2,500
3,000
3,500
2006 2007 2008 2009 2010 2011 2012 2013 2014 2015 2016
$ Billions
Federal Reserve Liabilities and Capital
Federal Reserve notes Reverse repurchase agreementsDeposits, other than reserve balances Reserve balancesOther liabilities Capital
June 18, 2009 Class I FOMC - Restricted Controlled (FR) Page 63 of 79
BANK CREDIT, DEBT, AND MONEY FORECASTS
Bank credit is forecast to decline about 1 percent in 2009, reflecting weak loan
demand and tight credit standards and terms, and to expand 4¾ percent in 2010.
C&I loans are projected to grow only modestly through 2010, as business spending
stays weak and some firms continue to substitute other sources of funding for bank
loans. Real estate loans will likely keep contracting this year amid higher mortgage
rates and weak residential investment spending. These loans are expected to grow
modestly in 2010 as conditions in the housing sector begin to improve. After staying
about flat this year, consumer loans are also forecast to resume expanding in 2010,
reflecting renewed growth in personal consumption expenditures and a pickup in
nominal GDP growth. An expansion in banks’ holdings of securities is also expected
to support bank credit growth in 2010.
Growth of domestic nonfinancial sector debt is forecast to be below its second-
quarter pace over the next few quarters and then to pick up somewhat in 2010 as the
economy recovers. Household debt is projected to edge lower and then remain weak
next year, reflecting continuing declines in house prices, the sharply elevated level of
unemployment, and lending standards that ease only slowly. Similarly, business
borrowing is forecast to remain sluggish, although it strengthens a bit next year in
response to a pickup in capital expenditures and some improvement in credit
conditions. By contrast, federal government debt is expected to continue to increase
rapidly over the forecast period, primarily reflecting the lower tax revenues and
increased spending associated with the recession as well as the budget costs of the
large fiscal stimulus package.
M2 is projected to grow 3¾ percent in 2009, well above the rate of nominal GDP
growth, boosted by the lagged effects of declines in opportunity cost as well as an
June 18, 2009 Class I FOMC - Restricted Controlled (FR) Page 64 of 79

increased preference for safe and liquid assets in view of heightened volatility in
financial markets in recent quarters. After growing robustly in the first half of 2009,
M2 is expected to contract slightly in the second half of the year as the financial
markets continue to recover and some of these safe-haven flows unwind. In 2010,
M2 growth is expected to pick up gradually over the course of the year, but the
aggregate is forecast to expand only 2¼ percent for the year as a whole. The rise in
M2 velocity next year reflects some continued unwinding of the buildup in M2 that
was related to the financial crisis.
June 18, 2009 Class I FOMC - Restricted Controlled (FR) Page 65 of 79
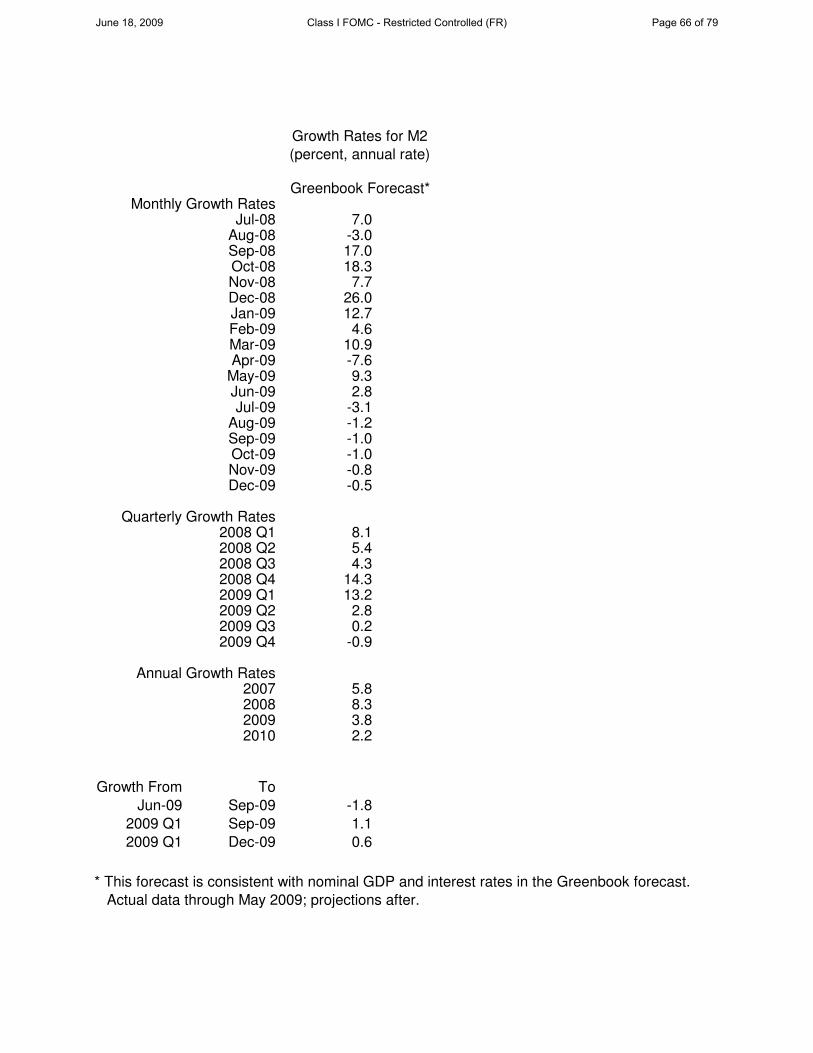
Growth Rates for M2
(percent, annual rate)
Greenbook Forecast*Monthly Growth Rates
Jul-08 7.0Aug-08 -3.0Sep-08 17.0Oct-08 18.3Nov-08 7.7Dec-08 26.0Jan-09 12.7Feb-09 4.6Mar-09 10.9Apr-09 -7.6
May-09 9.3Jun-09 2.8Jul-09 -3.1
Aug-09 -1.2Sep-09 -1.0Oct-09 -1.0Nov-09 -0.8Dec-09 -0.5
Quarterly Growth Rates2008 Q1 8.12008 Q2 5.42008 Q3 4.32008 Q4 14.32009 Q1 13.22009 Q2 2.82009 Q3 0.22009 Q4 -0.9
Annual Growth Rates2007 5.82008 8.32009 3.82010 2.2
Growth From To
Jun-09 Sep-09 -1.8
2009 Q1 Sep-09 1.1
2009 Q1 Dec-09 0.6
* This forecast is consistent with nominal GDP and interest rates in the Greenbook forecast.
Actual data through May 2009; projections after.
June 18, 2009 Class I FOMC - Restricted Controlled (FR) Page 66 of 79

DIRECTIVE
The April directive and draft language for the June directive are provided below.
APRIL FOMC MEETING
The Federal Open Market Committee seeks monetary and financial conditions that
will foster price stability and promote sustainable growth in output. To further its
long-run objectives, the Committee seeks conditions in reserve markets consistent
with federal funds trading in a range from 0 to ¼ percent. The Committee directs the
Desk to purchase agency debt, agency MBS, and longer-term Treasury securities
during the intermeeting period with the aim of providing support to private credit
markets and economic activity. The timing and pace of these purchases should
depend on conditions in the markets for such securities and on a broader assessment
of private credit market conditions. The Committee anticipates that the combination
of outright purchases and various liquidity facilities outstanding will cause the size of
the Federal Reserve’s balance sheet to expand significantly in coming months. The
Desk is expected to purchase up to $200 billion in housing-related agency debt by the
end of this year. The Desk is expected to purchase at least $500 billion in agency
MBS by the end of the second quarter of this year and is expected to purchase up to
$1.25 trillion of these securities by the end of this year. The Desk is expected to
purchase up to $300 billion of longer-term Treasury securities by the end of the third
quarter. The System Open Market Account Manager and the Secretary will keep the
Committee informed of ongoing developments regarding the System's balance sheet
that could affect the attainment over time of the Committee's objectives of maximum
employment and price stability.
June 18, 2009 Class I FOMC - Restricted Controlled (FR) Page 67 of 79

JUNE FOMC MEETING — ALTERNATIVE A
The Federal Open Market Committee seeks monetary and financial conditions that
will foster price stability and promote sustainable growth in output. To further its
long-run objectives, the Committee seeks conditions in reserve markets consistent
with federal funds trading in a range from 0 to ¼ percent. The Committee directs
the Desk to purchase agency debt, agency MBS, and longer-term Treasury securities
during the intermeeting period with the aim of providing support to private credit
markets and economic activity. The timing and pace of these purchases should
depend on conditions in the markets for such securities and on a broader assessment
of private credit market conditions. The Committee anticipates that the combination
of outright purchases and various liquidity facilities outstanding will cause the size
of the Federal Reserve's balance sheet to expand significantly in coming months.
The Desk is expected to purchase up to $200 billion in housing-related agency debt
by the end of this year. The Desk is expected to purchase at least $500 billion in
agency MBS by the end of the second quarter of this year and is expected to purchase
up to $1.25 trillion of these securities by the end of this year. The Committee also
directs the Desk to expand the System’s purchases of longer-term Treasury securities
by up to $750 billion of longer-term Treasury securities by the end of this year. The
System Open Market Account Manager and the Secretary will keep the Committee
informed of ongoing developments regarding the System's balance sheet that could
affect the attainment over time of the Committee’s objectives of maximum
employment and price stability.
June 18, 2009 Class I FOMC - Restricted Controlled (FR) Page 68 of 79
JUNE FOMC MEETING — ALTERNATIVES B AND B’
The Federal Open Market Committee seeks monetary and financial conditions that
will foster price stability and promote sustainable growth in output. To further its
long-run objectives, the Committee seeks conditions in reserve markets consistent
with federal funds trading in a range from 0 to ¼ percent. The Committee directs the
Desk to purchase agency debt, agency MBS, and longer-term Treasury securities
during the intermeeting period with the aim of providing support to private credit
markets and economic activity. The timing and pace of these purchases should
depend on conditions in the markets for such securities and on a broader assessment
of private credit market conditions. The Committee anticipates that the combination
of outright purchases and various liquidity facilities outstanding will cause the size of
the Federal Reserve’s balance sheet to expand significantly in coming months. The
Desk is expected to purchase up to $200 billion in housing-related agency debt by the
end of this year. The Desk is expected to purchase at least $500 billion in agency
MBS by the end of the second quarter of this year and is expected to purchase up to
$1.25 trillion of these securities by the end of this year. The Desk is expected to
purchase up to $300 billion of longer-term Treasury securities by the end of the third
quarter. The System Open Market Account Manager and the Secretary will keep the
Committee informed of ongoing developments regarding the System's balance sheet
that could affect the attainment over time of the Committee's objectives of maximum
employment and price stability.
June 18, 2009 Class I FOMC - Restricted Controlled (FR) Page 69 of 79

JUNE FOMC MEETING — ALTERNATIVE C
The Federal Open Market Committee seeks monetary and financial conditions that
will foster price stability and promote sustainable growth in output. To further its
long-run objectives, the Committee seeks conditions in reserve markets consistent
with federal funds trading in a range from 0 to ¼ percent. The Committee directs the
Desk to purchase agency debt, agency MBS, and longer-term Treasury securities
during the intermeeting period with the aim of providing support to private credit
markets and economic activity. The timing and pace of these purchases should
depend on conditions in the markets for such securities and on a broader assessment
of private credit market conditions, and the pace of these purchases should taper off
gradually by the end of this year. The Committee anticipates that the combination of
outright purchases and various liquidity facilities outstanding will cause the size of the
Federal Reserve’s balance sheet to expand significantly in coming months. The Desk
is expected to purchase up to $200 billion in housing-related agency debt by the end
of this year. The Desk is expected to purchase at least $500 billion in agency MBS by
the end of the second quarter of this year and is expected to purchase up to $1.25
trillion of these securities by the end of this year. The Desk is expected to purchase
up to $300 billion of longer-term Treasury securities by the end of the third quarter.
The System Open Market Account Manager and the Secretary will keep the
Committee informed of ongoing developments regarding the System’s balance sheet
that could affect the attainment over time of the Committee's objectives of maximum
employment and price stability.
June 18, 2009 Class I FOMC - Restricted Controlled (FR) Page 70 of 79

Measure Description
Single-equation
Model
The measure of the equilibrium real rate in the single-equation model is based on an estimated aggregate-demand relationship between the current value of the output gap and its lagged values as well as the lagged values of the real federal funds rate.
Small Structural
Model
The small-scale model of the economy consists of equations for six variables: the output gap, the equity premium, the federal budget surplus, the trend growth rate of output, the real bond yield, and the real federal funds rate.
EDO Model
Estimates of the equilibrium real rate using EDO—an estimated dynamic-stochastic-general-equilibrium (DSGE) model of the U.S. economy—depend on data for major spending categories, price and wages, and the federal funds rate as well as the model’s structure and estimate of the output gap.
FRB/US Model
Estimates of the equilibrium real rate using FRB/US—the staff’s large-scale econometric model of the U.S. economy—depend on a very broad array of economic factors, some of which take the form of projected values of the model’s exogenous variables.
Greenbook-consistent
Two measures are presented—based on the FRB/US and the EDO models. Both models are matched to the extended Greenbook forecast. Model simulations determine the value of the real federal funds rate that closes the output gap conditional on the extended baseline.
TIPS-based Factor Model
Yields on TIPS (Treasury Inflation-Protected Securities) reflect investors’ expectations of the future path of real interest rates. The TIPS-based measure of the equilibrium real rate is constructed using the seven-year-ahead instantaneous real forward rate derived from TIPS yields as of the Bluebook publication date. This forward rate is adjusted to remove estimates of the term and liquidity premiums based on a three-factor arbitrage-free term-structure model applied to TIPS yields, nominal yields, and inflation.
APPENDIX A: MEASURES OF THE EQUILIBRIUM REAL RATE
The equilibrium real rate is the real federal funds rate that, if maintained, would be projected to return output to its potential level over time. The short-run equilibrium rate is defined as the rate that would close the output gap in twelve quarters given the corresponding model’s projection of the economy. The medium-run concept is the value of the real federal funds rate projected to keep output at potential in seven years, under the assumption that monetary policy acts to bring actual and potential output into line in the short run and then keeps them equal thereafter. The TIPS-based factor model measure provides an estimate of market expectations for the real federal funds rate seven years ahead.
The actual real federal funds rate is constructed as the difference between the nominal rate and realized inflation, where the nominal rate is measured as the quarterly average of the observed federal funds rate, and realized inflation is given by the log difference between the core PCE price index and its lagged value four quarters earlier. If the upcoming FOMC meeting falls early in the quarter, the lagged inflation measure ends in the last quarter. For the current quarter, the nominal rate is specified as the target federal funds rate on the Bluebook publication date.
June 18, 2009 Class I FOMC - Restricted Controlled (FR) Page 71 of 79
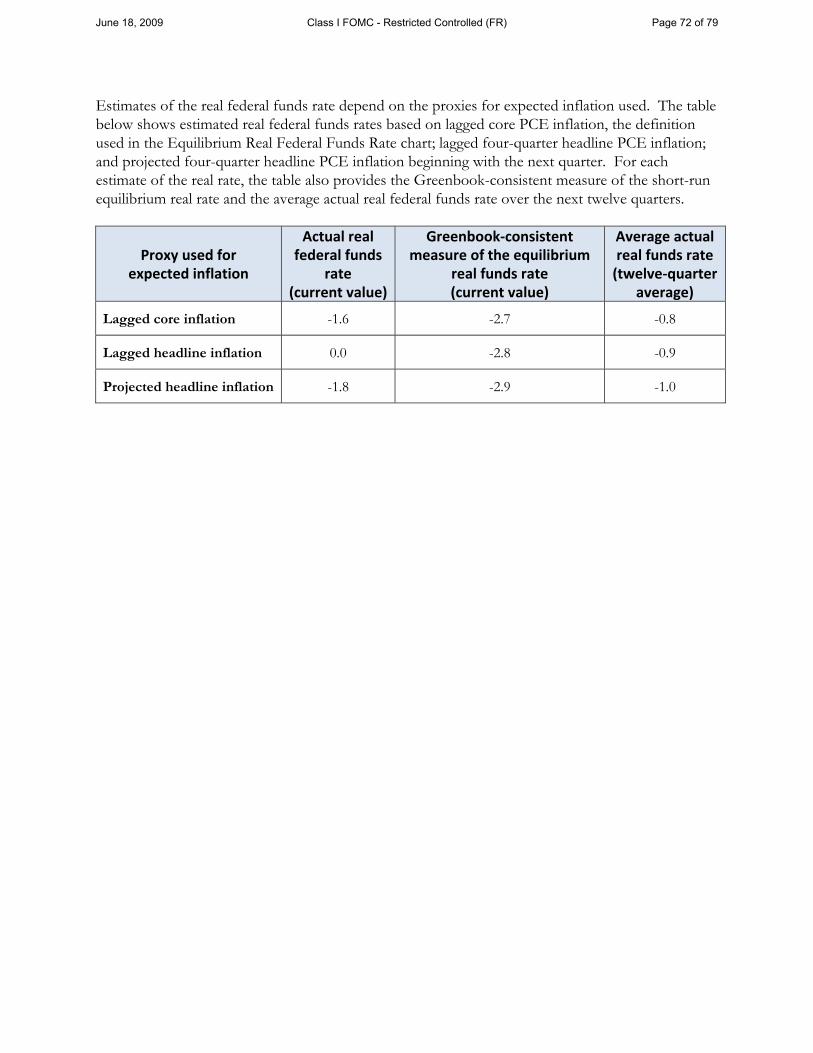
Proxy used for expected inflation
Actual real federal funds
rate (current value)
Greenbook‐consistent measure of the equilibrium
real funds rate (current value)
Average actual real funds rate (twelve‐quarter
average)
Lagged core inflation -1.6 -2.7 -0.8
Lagged headline inflation 0.0 -2.8 -0.9
Projected headline inflation -1.8 -2.9 -1.0
Estimates of the real federal funds rate depend on the proxies for expected inflation used. The table below shows estimated real federal funds rates based on lagged core PCE inflation, the definition used in the Equilibrium Real Federal Funds Rate chart; lagged four-quarter headline PCE inflation; and projected four-quarter headline PCE inflation beginning with the next quarter. For each estimate of the real rate, the table also provides the Greenbook-consistent measure of the short-run equilibrium real rate and the average actual real federal funds rate over the next twelve quarters.
June 18, 2009 Class I FOMC - Restricted Controlled (FR) Page 72 of 79

APPENDIX B: ANALYSIS OF POLICY PATHS AND CONFIDENCE INTERVALS
RULE SPECIFICATIONS For the following rules, it denotes the federal funds rate for quarter t, while the explanatory variables include the staff’s projection of trailing four-quarter core PCE inflation (πt), inflation two and three quarters ahead (πt+2|t and πt+3|t), the output gap in the current period and one quarter ahead ( *
t ty y− and *
1| 1|t t t ty y+ +− ), and the three-quarter-ahead forecast of annual average GDP growth relative to potential ( 4 *
3| 3|t t t ty y+ +Δ ), and *π denotes an assumed value of policymakers’ long-run inflation objective. The outcome-based and forecast-based rules were estimated using real-time data over the sample 1988:1-2006:4; each specification was chosen using the Bayesian information criterion. Each rule incorporates a 75 basis point shift in the intercept, specified as a sequence of 25 basis point increments during the first three quarters of 1998. The first two simple rules were proposed by Taylor (1993, 1999). The prescriptions of the first-difference rule do not depend on assumptions regarding r* or the level of the output gap; see Orphanides (2003).
4− Δ
Outcome-based rule it = 1.20it-1–0.39it-2+0.19[1.17 + 1.73 πt + 3.66( *t ty y− ) – 2.72( *
1 1t ty y− −− )]
Forecast-based rule it = 1.18it-1–0.38it-2+0.20[0.98 +1.72 πt+2|t+2.29( *1| 1|t t t ty y+ +− )–1.37( *
1 1t ty y− −− )]
Taylor (1993) rule it = 2 + πt + 0.5(πt – *π ) + 0.5( *t ty y− )
Taylor (1999) rule it = 2 + πt + 0.5(πt – *π ) + ( *t ty y− )
First-difference rule it = it-1 + 0.5(πt+3|t – *π ) + 0.5( 4 4 *3| 3|t t t ty y+ +Δ − Δ )
FRB/US MODEL SIMULATIONS Prescriptions from the two empirical rules are computed using dynamic simulations of the FRB/US model, implemented as though the rule were followed starting at this FOMC meeting. The dotted line labeled “Previous Bluebook” is based on the current specification of the policy rule, applied to the previous Greenbook projection. Confidence intervals are based on stochastic simulations of the FRB/US model with shocks drawn from the estimated residuals over 1969-2008.
INFORMATION FROM FINANCIAL MARKETS The expected funds rate path is based on forward rate agreement quotes and implied three-month forward rates from swaps, and the confidence intervals for this path are constructed using prices of interest rate caps.
NEAR‐TERM PRESCRIPTIONS OF SIMPLE POLICY RULES These prescriptions are calculated using Greenbook projections for inflation and the output gap. Because the first-difference rule involves the lagged funds rate, the value labeled “Previous Bluebook” for the current quarter is computed using the actual value of the lagged funds rate, and the one-quarter-ahead prescriptions are based on this rule’s prescription for the current quarter.
June 18, 2009 Class I FOMC - Restricted Controlled (FR) Page 73 of 79

REFERENCES Taylor, John B. (1993). “Discretion versus policy rules in practice,” Carnegie-Rochester Conference Series on Public Policy, vol. 39 (December), pp. 195-214.
————— (1999). “A Historical Analysis of Monetary Policy Rules,” in John B. Taylor, ed., Monetary Policy Rules. The University of Chicago Press, pp. 319-341.
Orphanides, Athanasios (2003). “Historical Monetary Policy Analysis and the Taylor Rule,” Journal of Monetary Economics, vol. 50 (July), pp. 983-1022.
June 18, 2009 Class I FOMC - Restricted Controlled (FR) Page 74 of 79

APPENDIX C: LONG‐RUN PROJECTIONS OF THE BALANCE SHEET AND MONETARY BASE
This appendix presents more detail on the assumptions underlying the long-run projections of the Federal Reserve’s balance sheet and the monetary base shown in the section entitled “Long-run Projections of the Balance Sheet and Monetary Base.”
GENERAL ASSUMPTIONS The projections are constructed on a monthly frequency from June 2009 to December 2016. The few balance sheet items that are not discussed below are assumed to be constant over the projection period at the level reported in the May 29, 2009, H.4.1 Statistical Release. The projections for all major asset and liability categories are summarized in the charts and table that follow the bullet points.
ASSETS
Asset Purchases
• The baseline scenario incorporates only those asset purchases that have already been announced. The Desk purchases a total of $300 billion of Treasury securities (by September 2009), $200 billion of agency debt, and $1,250 billion of agency MBS; purchases in the latter two categories are to be completed by year-end 2009. The maturity distribution of the Treasuries purchases is based on FRBNY Markets Group internal forecasts. The maturities of most purchases are between two and ten years, with the average being approximately five years. No sales are assumed, but maturing securities are redeemed and are not replaced. As a result, total holdings of Treasury securities decline as issues mature. Securities previously held in the SOMA portfolio are assumed to be reinvested as they mature. Agency debt peaks at $200 billion in 2009, and declines slowly over the remainder of the forecast horizon. For agency MBS, the rate of prepayment is based on rough estimates from the Desk. The historically low coupon on these securities implies a relatively slow prepayment rate. As a result, at the end of 2016, $784 billion of the $1.25 trillion of MBS purchased remains on the balance sheet.
• In the alternative scenario, purchases of Treasury securities are increased by $450 billion to $750 billion by the end of the year. No other changes to the assumptions are made and securities mature at the same rate as in the baseline scenario.
• By the end of the projection period, the expansion of currency and capital combined with a runoff of other assets necessitates the resumption of standard open market purchases to maintain reserve balances at a level of $25 billion. It is assumed that the Desk purchases shorter-dated Treasury securities to satisfy this need.
June 18, 2009 Class I FOMC - Restricted Controlled (FR) Page 75 of 79

Liquidity and Credit Facilities
• Primary credit is assumed to decline moderately from its current level to $1 billion by the end of 2010 and remain at that level thereafter. Secondary credit is assumed to be zero for the entire projection period.
• Term Auction Facility (TAF) credit is assumed to decline with improved market functioning and is zero at the end of 2010.
• Foreign central bank liquidity swaps decline with improved market functioning and are zero at the end of 2010.
• Credit extended to AIG winds down by the end of 2014. In addition, the assets held by Maiden Lane LLC, Maiden Lane II LLC, and Maiden Lane III LLC are assumed to be sold over time, and reach zero by 2015.
• The Term Asset-Backed Securities Loan Facility (TALF), based partly on its slow initial uptake, is assumed to peak at $175 billion, well below the $1 trillion limit. For purposes of these projections, TALF is assumed to consist of two components: TALF 1.0 and TALF 2.0/3.0. TALF 1.0 issues loans with a three-year maturity and reaches $125 billion by the end of 2010. These loans are held to maturity; the quantity outstanding reaches zero by the end of 2013. TALF 2.0/3.0 extends loans with a five-year maturity and reaches $50 billion by the end of 2010. These loans are also held to maturity, and the quantity outstanding reaches zero by the end of 2015.
• Section 13(3) facilities other than the TALF are assumed to be extended beyond October 30, 2009. Credit extended through these facilities declines with improved market functioning and is zero at the end of 2010.
LIABILITIES • Currency (Federal Reserve notes in circulation) grows in line with the staff forecast for
money stock currency through the end of 2010. From 2010 to the end of the projection period, currency grows at the same rate as nominal GDP as projected in the extended Greenbook forecast.
• The U.S. Treasury’s general account returns to its historical target level of $5 billion by the end of 2009. This account remains constant at that level over the forecast period.
• The Treasury’s Supplementary Financing Account is projected to wind down to zero by the middle of 2010, and remain at zero for the rest of the of the forecast period.
• Reverse repurchase agreements with foreign official and international accounts are expected to decrease to $38 billion by the end of 2010 as these funds move to other investments.
• Capital is expected to grow at 15 percent per year, in line with the average rate of the past ten years.
• For most of the projection period, reserve balances of depository institutions are assumed to be determined by the evolution of the assets and other liabilities of the Federal Reserve. As the asset side of the balance sheet contracts, so do reserve balances. When the implied level of reserve balances reaches $25 billion, the Desk is assumed to conduct open market operations to offset the growth of currency and capital to maintain a constant $25 billion level.
June 18, 2009 Class I FOMC - Restricted Controlled (FR) Page 76 of 79

APPENDIX C: INDIVIDUAL BALANCE SHEET ITEM PROFILES
Asset purchases and Federal Reserve liquidity and credit facilities
Note: All values are in billions of dollars.
0
200
400
600
800
Dec‐08 Dec‐10 Dec‐12 Dec‐14 Dec‐16
Temporary Holdings of Longer‐term Treasuries
Baseline Expanded purchases April baseline April expanded purchases
0
50
100
150
200
250
Dec‐08 Dec‐10 Dec‐12 Dec‐14 Dec‐16
Agency Debt
Current April
0
200
400
600
800
1000
1200
1400
Dec‐08 Dec‐10 Dec‐12 Dec‐14 Dec‐16
Agency MBS
Current April
0
20
40
60
80
100
Dec‐08 Dec‐10 Dec‐12 Dec‐14 Dec‐16
Primary and Secondary Credit
Current April
0
100
200
300
400
500
600
Dec‐08 Dec‐10 Dec‐12 Dec‐14 Dec‐16
TAF
Current April
0
100
200
300
400
500
600
Dec‐08 Dec‐10 Dec‐12 Dec‐14 Dec‐16
Foreign Central Bank Liquidity Swaps
Current April
0
10
20
30
40
50
Dec‐08 Dec‐10 Dec‐12 Dec‐14 Dec‐16
Credit Extended to AIG
Current April
0
5
10
15
20
25
30
Dec‐08 Dec‐10 Dec‐12 Dec‐14 Dec‐16
Maiden Lanes
Maiden Lane LLC Maiden Lane II LLC Maiden Lane III LLC
June 18, 2009 Class I FOMC - Restricted Controlled (FR) Page 77 of 79
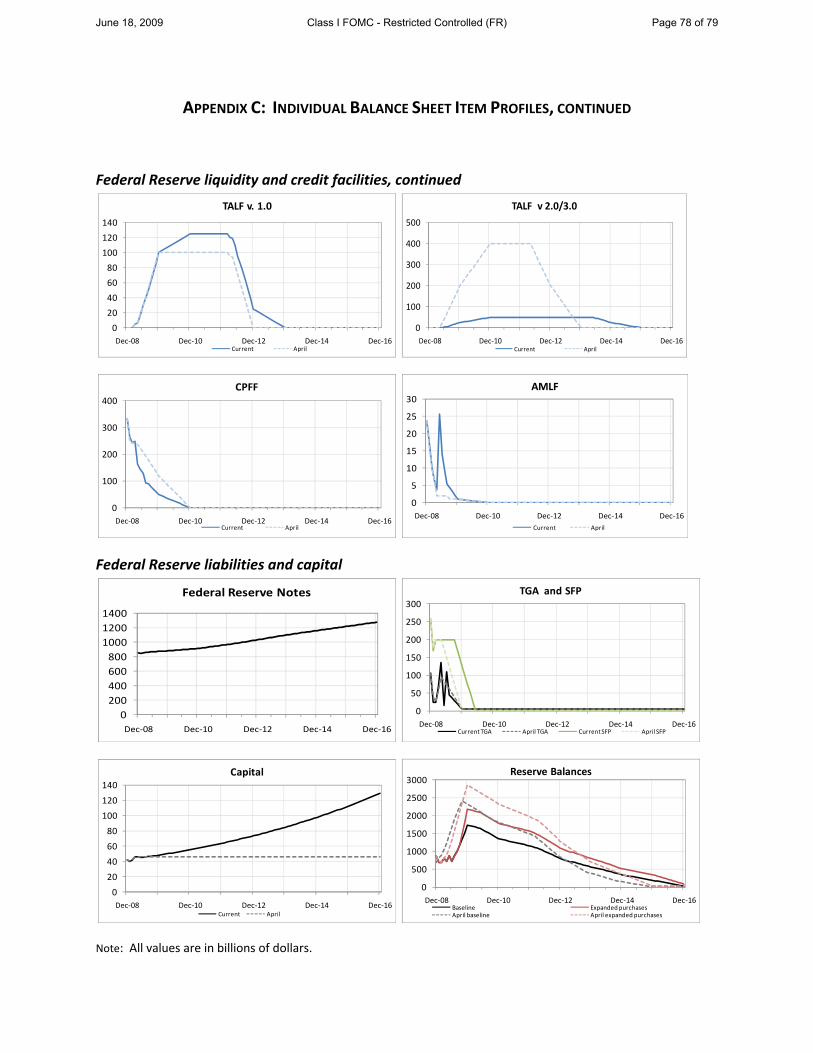
APPENDIX C: INDIVIDUAL BALANCE SHEET ITEM PROFILES, CONTINUED
Federal Reserve liquidity and credit facilities, continued
Federal Reserve liabilities and capital
Note: All values are in billions of dollars.
0
20
40
60
80
100
120
140
Dec‐08 Dec‐10 Dec‐12 Dec‐14 Dec‐16
TALF v. 1.0
Current April
0
100
200
300
400
500
Dec‐08 Dec‐10 Dec‐12 Dec‐14 Dec‐16
TALF v 2.0/3.0
Current April
0
100
200
300
400
Dec‐08 Dec‐10 Dec‐12 Dec‐14 Dec‐16
CPFF
Current April
0
5
10
15
20
25
30
Dec‐08 Dec‐10 Dec‐12 Dec‐14 Dec‐16
AMLF
Current April
0200400600800
100012001400
Dec‐08 Dec‐10 Dec‐12 Dec‐14 Dec‐16
Federal Reserve Notes
0
50
100
150
200
250
300
Dec‐08 Dec‐10 Dec‐12 Dec‐14 Dec‐16
TGA and SFP
Current TGA April TGA Current SFP April SFP
0
20
40
60
80
100
120
140
Dec‐08 Dec‐10 Dec‐12 Dec‐14 Dec‐16
Capital
Current April
0
500
1000
1500
2000
2500
3000
Dec‐08 Dec‐10 Dec‐12 Dec‐14 Dec‐16
Reserve Balances
Baseline Expanded purchasesApril baseline April expanded purchases
June 18, 2009 Class I FOMC - Restricted Controlled (FR) Page 78 of 79

End-of-YearMay 29, 2009 2009 2010 2011 2012 2013 2014 2015 2016
$ BillionsTotal assets 2,084 2,837 2,376 2,244 1,965 1,803 1,641 1,547 1,448
Selected assets:Liquidity programs for financial firms 618 251 1 1 1 1 1 1 1
Primary, secondary, and seasonal credit 42 10 1 1 1 1 1 1 1 Term auction credit (TAF) 373 200 - - - - - - - Foreign central bank liquidity swaps 178 40 - - - - - - - Primary Dealer Credit Facility (PDCF) - - - - - - - - - Asset-Backed Commercial Paper Money Market
Mutual Fund Liquidty Facility (AMLF) 26 1 - - - - - - - Lending though other credit facilities 160 175 175 175 75 50 25 - -
Net portfolio holdings of Commercial PaperFunding Facility (CPFF) 145 50 - - - - - - -
Term Asset-Backed Securities Loan Facility (TALF) 15 125 175 175 75 50 25 - - Support for specific institutions 106 102 74 49 27 16 3 - -
Credit extended to AIG 44 44 30 20 10 5 - - -
62 58 44 29 17 11 3 - - Securities held outright 1,114 2,225 2,042 1,935 1,778 1,652 1,528 1,462 1,363
U.S. Treasury securities 606 775 761 753 676 636 589 583 556 Agency securities 80 200 164 124 103 73 51 44 23 Agency mortgage-backed securities 428 1,250 1,117 1,058 999 943 888 835 784
Memo: TSLF 27 27 - - - - - - - Repurchase agreements 0 0 0 0 0 0 0 0 0
Total liabilities 2,039 2,789 2,321 2,180 1,892 1,719 1,544 1,435 1,319 Selected liabilities:
Federal Reserve notes in circulation 868 884 915 972 1,040 1,101 1,146 1,192 1,240 Reserve balances of depository institutions 878 1,726 1,352 1,154 798 564 344 190 25 U.S. Treasury, general account 15 5 5 5 5 5 5 5 5 U.S. Treasury, supplemental financing account 200 125 - - - - - - -
Total capital 46 48 56 64 74 85 97 112 129
Source: Federal Reserve H.4.1 statistical release and staff calculations
Net portfolio holdings of Maiden Lane LLC, Maiden Lane II LLC, and Maiden Lane III LLC
Federal Reserve Balance Sheet: End‐of‐Year Projections ‐‐ Baseline ScenarioAppendix C: Table
June 18, 2009 Class I FOMC - Restricted Controlled (FR) Page 79 of 79