Embed Size (px)
Citation preview

PrefaceA comprehensive exercise has been commissioned by Small Farmers Agri-Business Consortium in assessing the extent of achievements under MM-11 in terms of expansion of area, production and productivity of fruits, vegetables, floriculture and spices Physical verification of beneficiaries on random basis to see the activities have also been carried out districts level across the 11 states covered by the programme. The prevailing system of identification of farmers including processes followed, overall impact of the programme in terms of increase in income level of target beneficiaries, quality of life, reduction in migration, occupational diversification, adoption of new and/or sustainable technologies will be studied to suggest improvement/modification in these programme. The physical and financial target suggest large involvements of beneficiaries through various projects and schemes with various simultaneous exercises being undertaken to find solutions for marking of horticultural produce, organic certification and mechanization for running programmes for sustainability of economic growth and empowerment of women farmers segments with new workable delivery models in the North Eastern and Hilly States under HMNEH. The overall exercise is expected to bring results in meaningful improvements in implementation of the programmes. A suitable design for Managements information System(MIS) at District, State and National levels envisages collection, and preparations of a data base of beneficiaries covered under XI Plan. The MIS system data base could readily accessed by stake holders at Central and State levels.
The cumulative physical and financial targets and achievemnets since inception of the Mission (2001-02 to 2011-12) has been brought out in this Annual Report.
We are thankful to Secretary (Agriculture & Cooperation), Additional Secretary (HMNEH), Horticulture Commissioner, Addl. Commissioner (Hort) for their guidance to SFAC in implementation of the Mission. We are also thankful to officers and staff of horticulture Division of Department of Agriculture & Cooperation for their commendable support and cooperation.
Managing Director
Small Farmers’ Agribusiness Consortium(Society sponsored by Dept. of Agriculture, Govt. of India)
NCUI Auditorium Building, 5th Floor, 3 Siri Institutional Area, August Kranti Marg, Hauz Khas, New Delhi - 110016, Tel: 91-11-26862365, 26966017, Fax: 91-11-26862367
Email: [email protected], Web: www.sfacindia.com
MessageI am extremely happy that small Farmers Agri-business Consortium is bringing out an Annual Report 2011-12 of Horticulture Mission for North East and Himalayan States (HMNEH). It is a compilation of activities and few success stories under HMNEH States.
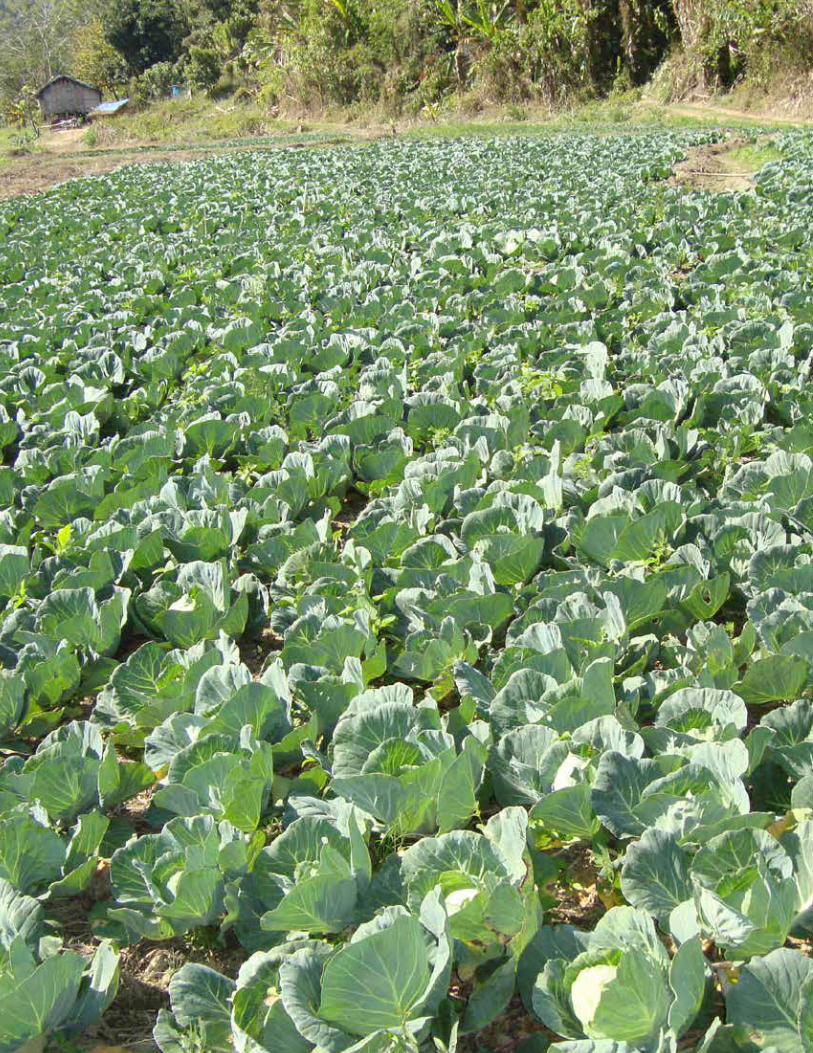
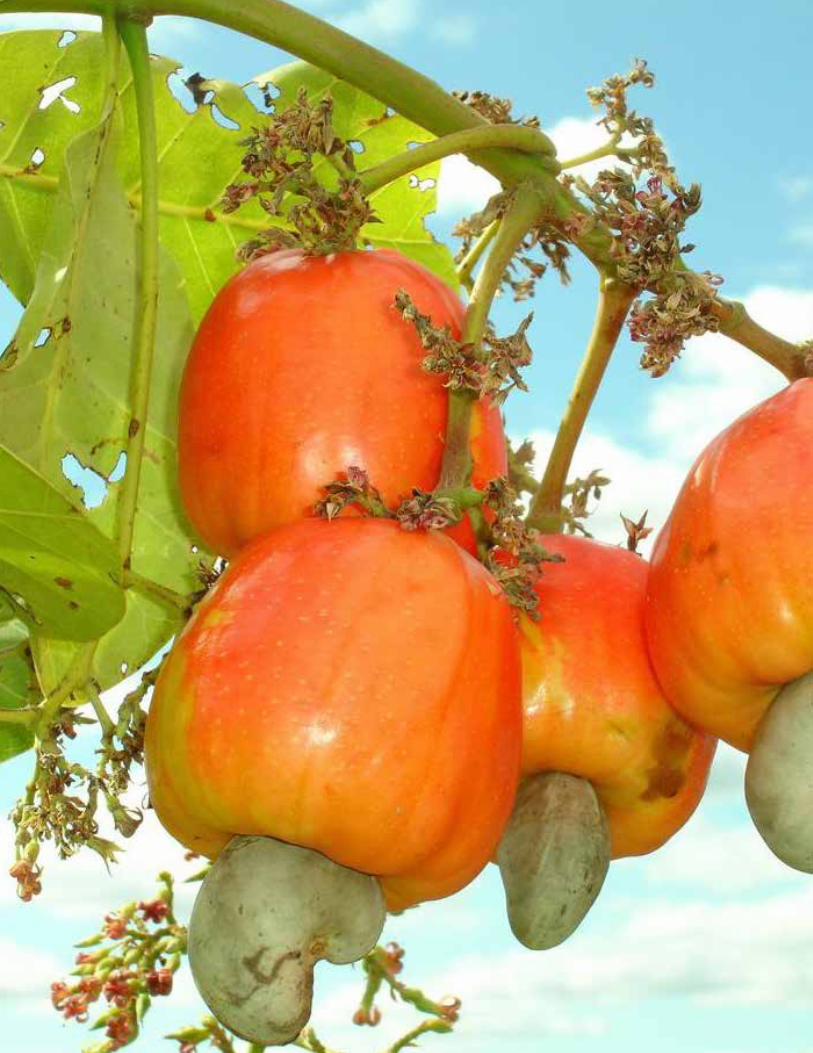
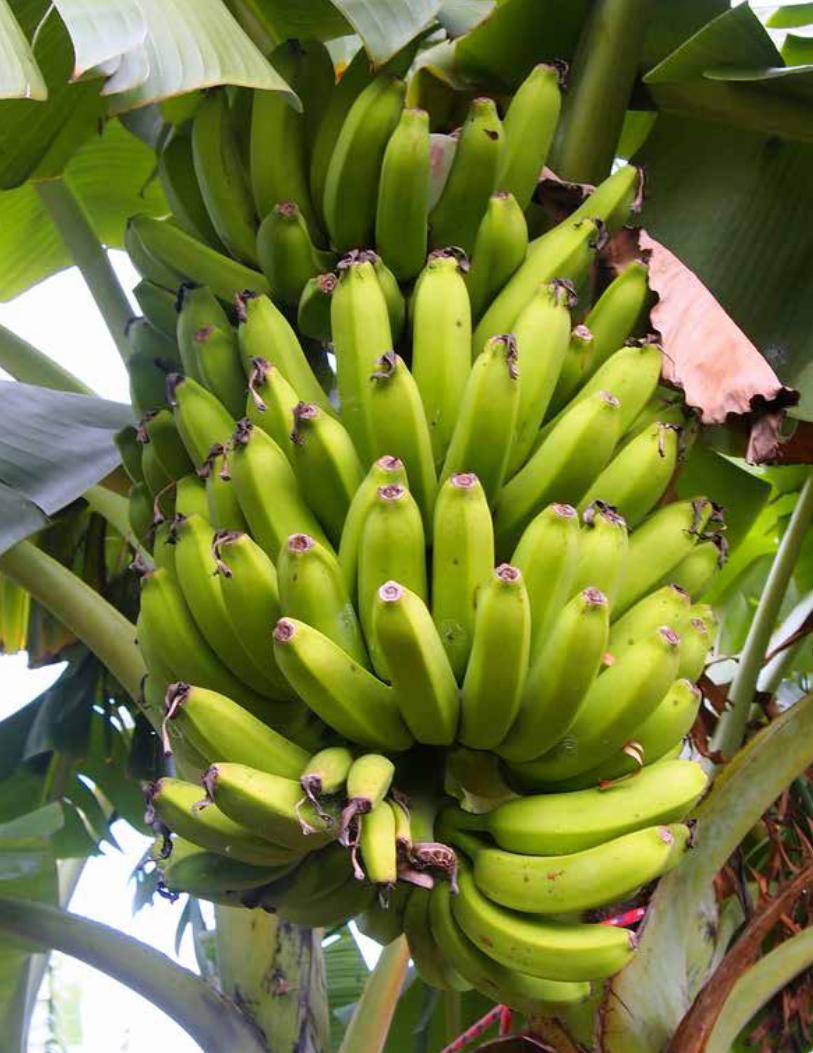
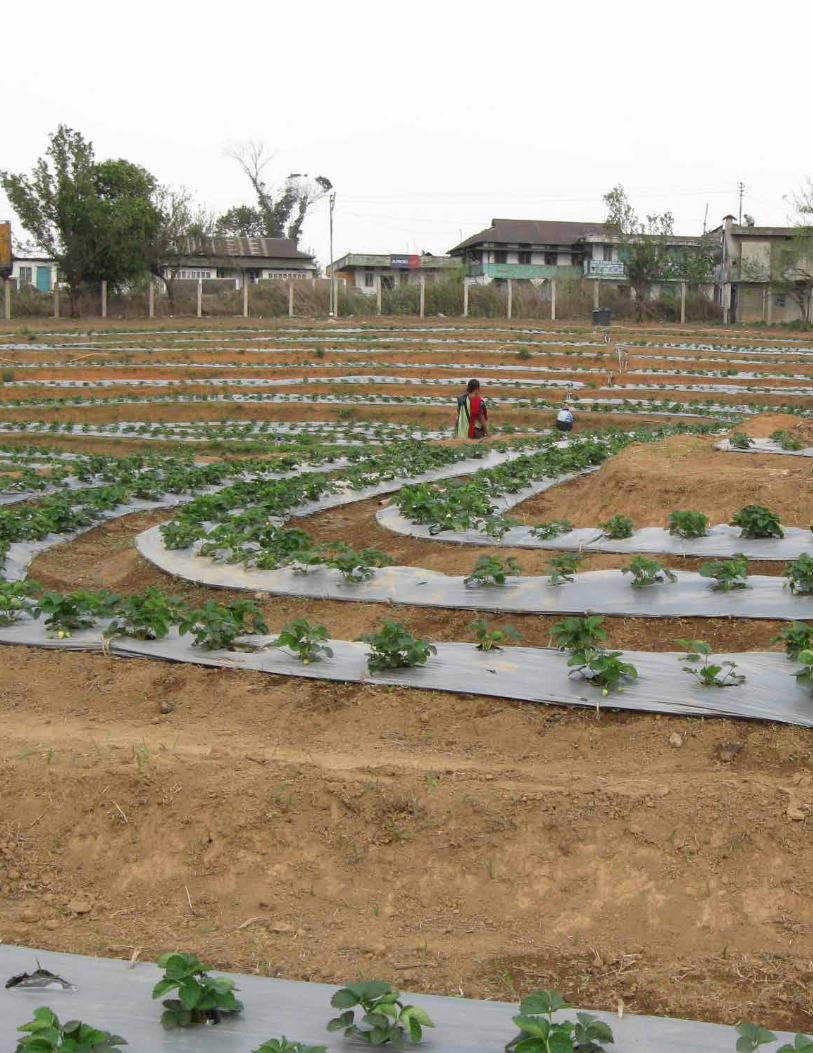
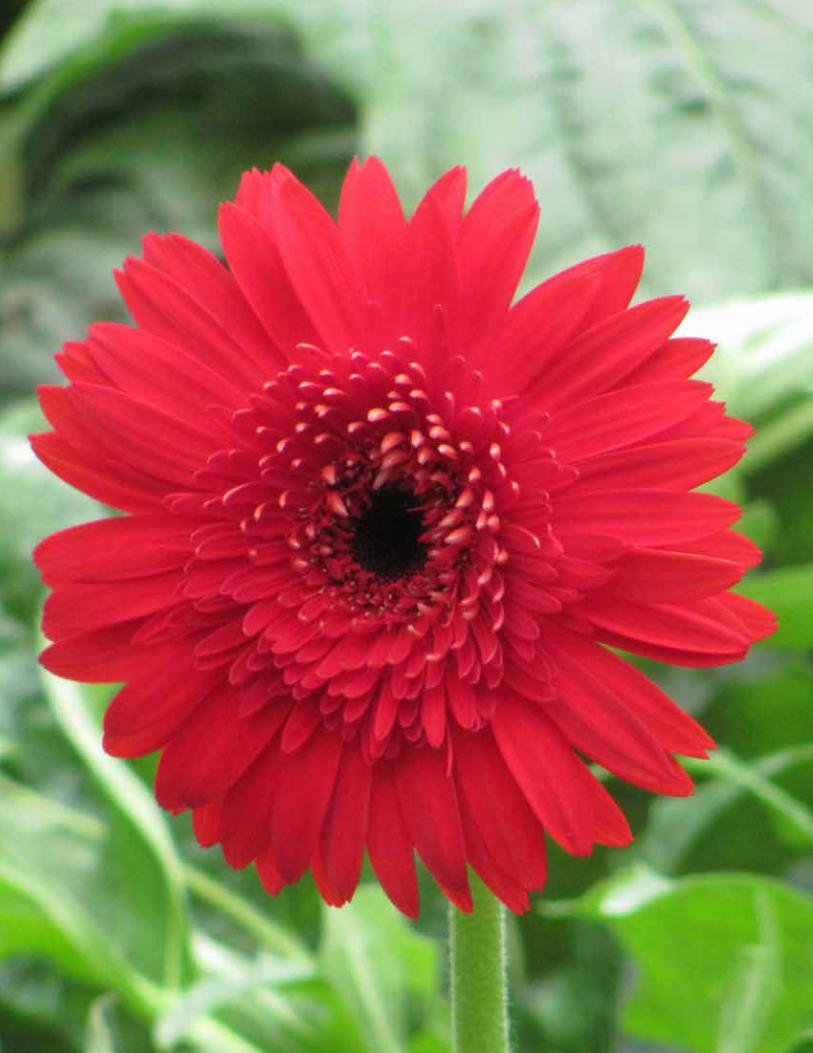
North East and Himalayan region with its favourable climatic conditions has emerged as one of the important horticulture hun of the country. The region has successfully demonstrated its strength in commercialization of production of fruit crops like banana, khasi mandarin, pineapple, apple, passion fruit, kiwi, strawberry; and vegetables like capsicum, tomato, cabbage, cauliflower; flowers like roses, anthurium, gerbera, orchids, lilium, tulips; spices like ginger, turmeric and aromatic plants like patchouli, aloe vera, etc.
Implementation of HMNEH has helped in achieving horticulture led transformation in the region especially in generating sizeable revenue as well employment avenues particularly to unemployed youth and women in a big way.
Some of the success stories in indicate are establishment of vegetable villages in Nagaland, rose and tomato villages in Sikkim, rose and strawberry villages in Meghalaya, kiwi clusters in Arunchal Pradesh, passion fruit clusters in Manupur, scion blocks under green house in Mizoram, tissue cultured banana clusters in Assam, rejuvenation of apple & Litchi in Jammu & Kashmir, Himachal Pradesh and Uttarakhand.
Dr. Gorakh SinghHorticulture Commissioner
Dr. Gorakh SinghHorticulture Commissioner
Government of IndiaMinistry of Agriculture
(Department of Agriculture & Cooperation)Krishi Bhawan, New Delhi – 110001

Contents
Chapters1. Overview 1
2. Implementation Procedure 7
3. Mini Mission- I: Research 13
4. Mini Mission- II: Production and Productivity 29
5. Mini Mission- III: PHM and Marketing 37
6. Mini Mission- IV: Processing 41
7. Few Success Stories 45
AnnexureAnnexure-I. State-wise Progress Report during 2011-12 69
Annexure-II. Consolidated physical progress report during 2011-12 108
Annexure-III. Consolidated financial progress report during 2011-12 146
Annexure-IV. Cumulative HMNEH Progress 2001-02 to 2011-12 182
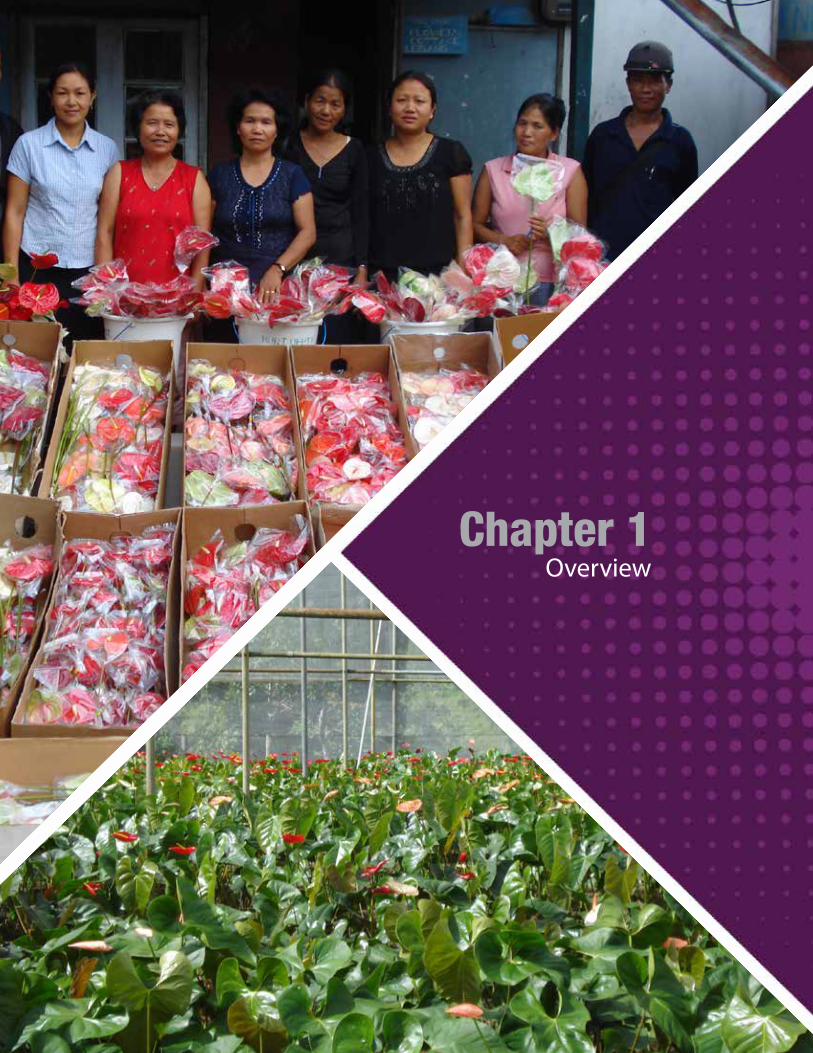
Chapter 1Overview
Chap t e r 1 Overview
Department of Agriculture & Cooperation is implementing a Centrally Sponsored Scheme ”Horticulture Mission for North East and Himalayan States (HMNEH)” FOR Overall developments of horticulture in a mission mode approach. The mission consists of four mini
missions which individually address specific goals and cover entire spectrum of horticulture right from production to consumption thought backward and forward linkages.
The mission consists of four mini missions:
MINI MISSION- I relates to production and supply of quality seed and planting material, generation, standardization and refinement of technology, on-farm demonstration, training, etc.
MINI MISSION-II Relates to increasing production and productivity of horticulture crops by adoption of improved production technologies.
MINI MISSION-III relates to creation of efficient post harvest managements and marketing infrastructure.
MINI MISSION-IV relates to setting up of new processing units, up gradation and modernization of exiting processing units.
THE major planned activities under the mission are as below: � Technology generation, refinement and on farm demonstration. � Setting up of nurseries, tissue culture units for production of quality seed and planting material. � Area expansion with improved and high yielding varieties. � High density planting and canopy managements of orchards. � Rejuvenation unproductive orchards. � Protected cultivation to improve productivity and to grow off season vegetables. � Organic farming for capitalizing niche market. � Creation of water resources. � Bee-keeping for pollination. � Mechanization to bring efficiency and competence. � Creation of post harvest managements and marketing infrastrure. � Processing and value addition. � Capacity building of all stakeholders.
Horticulture Mission for North East and Himalayan States | Annual Report 2011-124
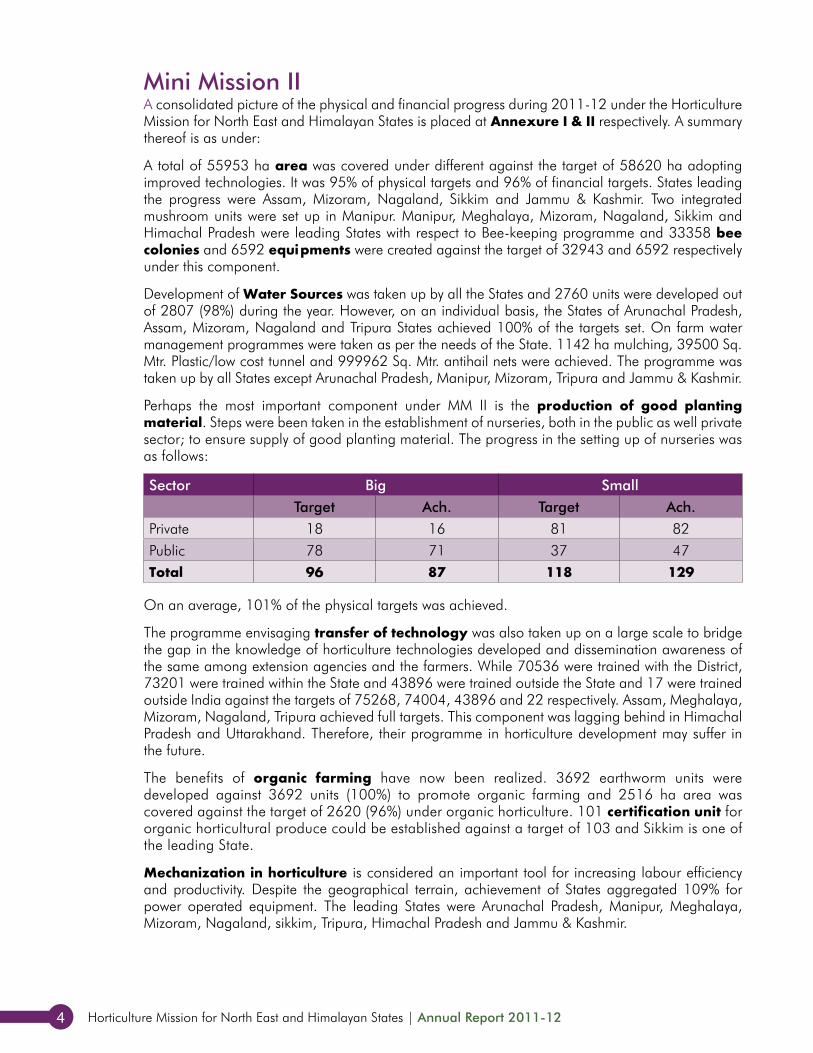
Mini Mission IIA consolidated picture of the physical and financial progress during 2011-12 under the Horticulture Mission for North East and Himalayan States is placed at Annexure I & II respectively. A summary thereof is as under:
A total of 55953 ha area was covered under different against the target of 58620 ha adopting improved technologies. It was 95% of physical targets and 96% of financial targets. States leading the progress were Assam, Mizoram, Nagaland, Sikkim and Jammu & Kashmir. Two integrated mushroom units were set up in Manipur. Manipur, Meghalaya, Mizoram, Nagaland, Sikkim and Himachal Pradesh were leading States with respect to Bee-keeping programme and 33358 bee colonies and 6592 equipments were created against the target of 32943 and 6592 respectively under this component.
Development of Water Sources was taken up by all the States and 2760 units were developed out of 2807 (98%) during the year. However, on an individual basis, the States of Arunachal Pradesh, Assam, Mizoram, Nagaland and Tripura States achieved 100% of the targets set. On farm water management programmes were taken as per the needs of the State. 1142 ha mulching, 39500 Sq. Mtr. Plastic/low cost tunnel and 999962 Sq. Mtr. antihail nets were achieved. The programme was taken up by all States except Arunachal Pradesh, Manipur, Mizoram, Tripura and Jammu & Kashmir.
Perhaps the most important component under MM II is the production of good planting material. Steps were been taken in the establishment of nurseries, both in the public as well private sector; to ensure supply of good planting material. The progress in the setting up of nurseries was as follows:
Sector Big SmallTarget Ach. Target Ach.
Private 18 16 81 82Public 78 71 37 47Total 96 87 118 129
On an average, 101% of the physical targets was achieved.
The programme envisaging transfer of technology was also taken up on a large scale to bridge the gap in the knowledge of horticulture technologies developed and dissemination awareness of the same among extension agencies and the farmers. While 70536 were trained with the District, 73201 were trained within the State and 43896 were trained outside the State and 17 were trained outside India against the targets of 75268, 74004, 43896 and 22 respectively. Assam, Meghalaya, Mizoram, Nagaland, Tripura achieved full targets. This component was lagging behind in Himachal Pradesh and Uttarakhand. Therefore, their programme in horticulture development may suffer in the future.
The benefits of organic farming have now been realized. 3692 earthworm units were developed against 3692 units (100%) to promote organic farming and 2516 ha area was covered against the target of 2620 (96%) under organic horticulture. 101 certification unit for organic horticultural produce could be established against a target of 103 and Sikkim is one of the leading State.
Mechanization in horticulture is considered an important tool for increasing labour efficiency and productivity. Despite the geographical terrain, achievement of States aggregated 109% for power operated equipment. The leading States were Arunachal Pradesh, Manipur, Meghalaya, Mizoram, Nagaland, sikkim, Tripura, Himachal Pradesh and Jammu & Kashmir.
Overview 5
The integrated pest management system has established its significant importance for horticultural crops to control/reduce the pesticide residue in the produce. This technique is being popularized in all the States. An area of 63600 ha out of 64079 ha was covered under Integrated pest Management and under 8800 ha were covered under Integrated Nutrient Management, 7 disease forecasting units out of 9 and 1 Centre of Excellence were established.
136 out of 140 seminars, several review meetings and awareness programmes were organized.
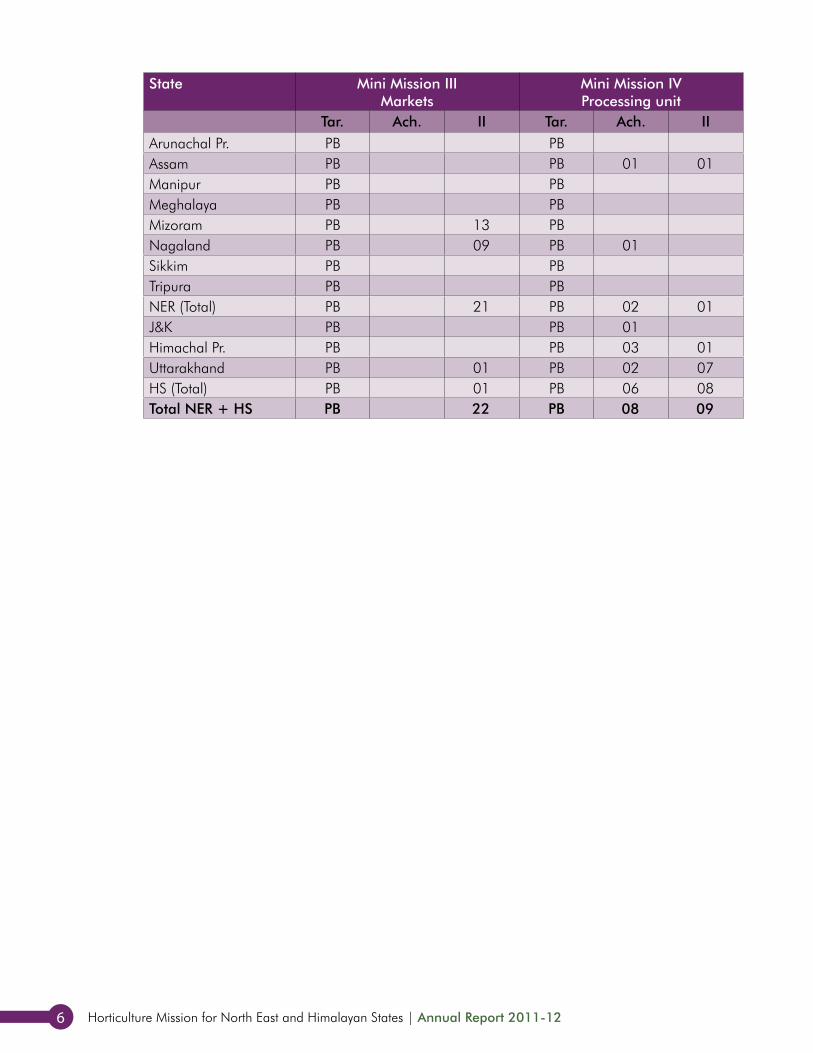
Mini Mission IIIDuring the year 1 Wholesale Market in Uttarakhand 21 Rural Primary Markets (13 in Mizoram and 8 in Nagaland) were sanctioned an amount of Rs.78.75 lakhs and 1 Apni Mandi in Nagaland were sanctioned an amount of Rs.3.75 lakh as second and final installment.
Mini Mission IVDuring the year, a total of Eight new processing units (1 each in Assam and Nagaland [NER] 3 in Himachal Pradesh, 1 in Jammu & Kashmir and 2 in Uttarakhand [HS]) was sanctioned for an amount of Rs. 604.56 lakhs by MFPI. Second and final Installment was sanctioned to Nine units (one in Assam [NER] and 1 in Himachal Pradesh and 7 in Uttarakhand [HS]) for an amount of Rs.1754.96 lakhs by MFPI.
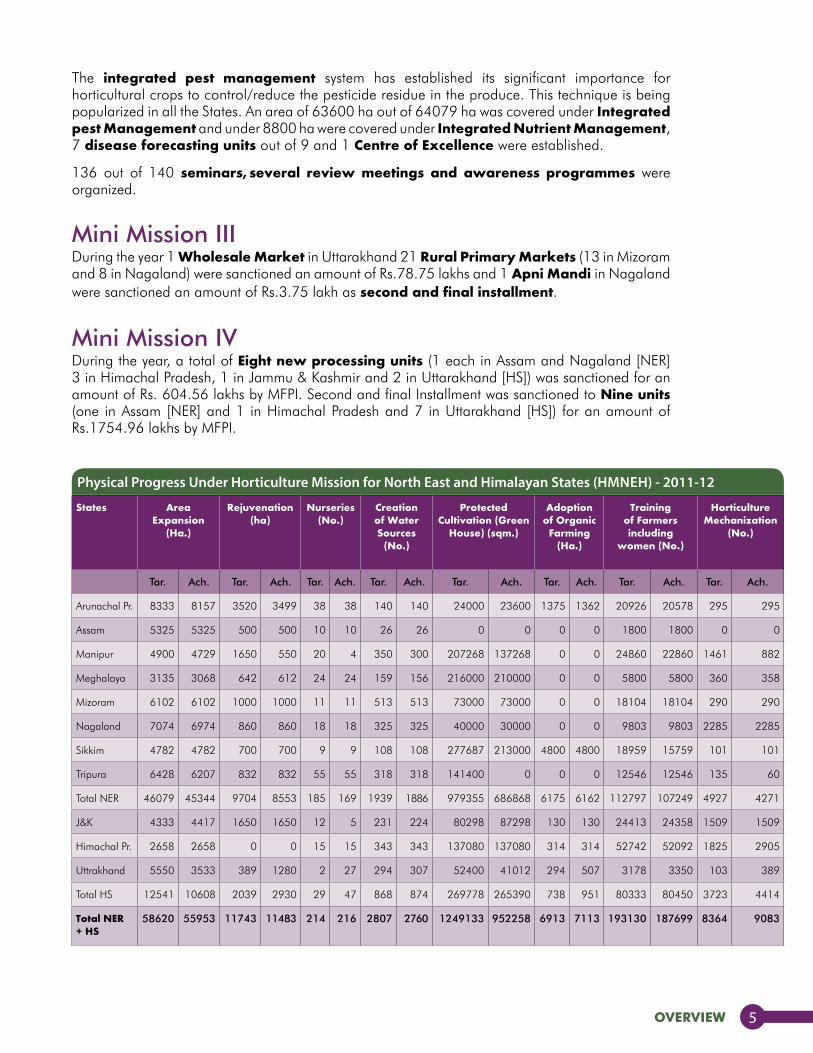
States Area Expansion
(Ha.)
Rejuvenation (ha)
Nurseries (No.)
Creation of Water Sources
(No.)
Protected Cultivation (Green
House) (sqm.)
Adoption of Organic
Farming (Ha.)
Training of Farmers including
women (No.)
Horticulture Mechanization
(No.)
Tar. Ach. Tar. Ach. Tar. Ach. Tar. Ach. Tar. Ach. Tar. Ach. Tar. Ach. Tar. Ach.
Arunachal Pr. 8333 8157 3520 3499 38 38 140 140 24000 23600 1375 1362 20926 20578 295 295
Assam 5325 5325 500 500 10 10 26 26 0 0 0 0 1800 1800 0 0
Manipur 4900 4729 1650 550 20 4 350 300 207268 137268 0 0 24860 22860 1461 882
Meghalaya 3135 3068 642 612 24 24 159 156 216000 210000 0 0 5800 5800 360 358
Mizoram 6102 6102 1000 1000 11 11 513 513 73000 73000 0 0 18104 18104 290 290
Nagaland 7074 6974 860 860 18 18 325 325 40000 30000 0 0 9803 9803 2285 2285
Sikkim 4782 4782 700 700 9 9 108 108 277687 213000 4800 4800 18959 15759 101 101
Tripura 6428 6207 832 832 55 55 318 318 141400 0 0 0 12546 12546 135 60
Total NER 46079 45344 9704 8553 185 169 1939 1886 979355 686868 6175 6162 112797 107249 4927 4271
J&K 4333 4417 1650 1650 12 5 231 224 80298 87298 130 130 24413 24358 1509 1509
Himachal Pr. 2658 2658 0 0 15 15 343 343 137080 137080 314 314 52742 52092 1825 2905
Uttrakhand 5550 3533 389 1280 2 27 294 307 52400 41012 294 507 3178 3350 103 389
Total HS 12541 10608 2039 2930 29 47 868 874 269778 265390 738 951 80333 80450 3723 4414
Total NER + HS
58620 55953 11743 11483 214 216 2807 2760 1249133 952258 6913 7113 193130 187699 8364 9083
Physical Progress Under Horticulture Mission for North East and Himalayan States (HMNEH) - 2011-12
Horticulture Mission for North East and Himalayan States | Annual Report 2011-126
State Mini Mission III Markets
Mini Mission IV Processing unit
Tar. Ach. II Tar. Ach. IIArunachal Pr. PB PBAssam PB PB 01 01Manipur PB PBMeghalaya PB PBMizoram PB 13 PBNagaland PB 09 PB 01Sikkim PB PBTripura PB PBNER (Total) PB 21 PB 02 01J&K PB PB 01Himachal Pr. PB PB 03 01Uttarakhand PB 01 PB 02 07HS (Total) PB 01 PB 06 08Total NER + HS PB 22 PB 08 09

Chapter 2Implementation Procedure
Chap t e r 2 Implementation Procedure
Approval of Programmes The project proposals related to research should be submitted to DG (ICAR) through concerned Nodal Officers of Mini Mission - I for approval.
State will prepare yearly work plan/action plan or Annual Action Plan (AAP) within the parameters of the Mission and submit the same to the Horticulture Mission Cell at Department of Agriculture & Cooperation. The AAP should be accompanied with project report of each district and it should reflect consolidated approach at state level. The work plan/action plan should have assessment of export potential and detail quantification of all inputs and outputs. AAP needs to be supported with data/write up on outcome of past interventions covering the details of area expansion (variety introduced, increase in productivity achieved and number of clusters created), water resource development as per felt need of the State (amount of irrigation potential created, whether linked with micro irrigation, maintenance, etc.), INM/IPM (including infrastructure created and how these are being utilized for benefit of the farmers) and organic farming. Area expansion should be determined based on the availability of quality seed and planting material.
Proposals on marketing should be submitted in prescribed format to DMI, Ministry of Agriculture, Government of India through SFAC and the proposals on Post Harvest Management should be submitted directly to NHB in a similar prescribed format. The proposals appraised by DMI/NHB will be submitted to DAC for approval by the Central Subcommittee of MM-III (post harvest management and marketing). Horticulture Mission Cell will examine the proposal further for directing SFAC/NHB to release the funds.
Proposals on processing should be submitted to MFPI through concerned State Implementing Agency.
Fund Flow Mechanism The funds for Mini Missions-II, III and IV (except to designated agencies like NHB, NBB for capacity building in Agriculture/ Horticulture, etc.) will be routed through SFAC for further release to respective State Level SFAC of the States concerned. Funds of Mini Mission - I will be directly released to Nodal Officers (Mini Mission - I) of ICAR institutes.
The DAC would release funds to Central SFAC, NHB and ICAR based on approved Annual Action Plans. Central SFAC would further release these funds to State level SFACs/ Director (Hort./Agri.) of respective States immediately within 15 days of receipt of the funds from DAC as per physical
Horticulture Mission for North East and Himalayan States | Annual Report 2011-1210
and financial targets approved. On the directions of Secretary (Hort./Agri.)/ Director (Hort.)/Nodal Officer of the State for implementing Horticulture Mission, the State level SFAC/ Director (Hort./Agri.) would release funds to District Hort./Agri. Officer. The District Hort./Agri. Officer would further release funds, as far as possible through cheques, to beneficiaries identified in the district on the basis of approved work plan (based on district project report). Even in case of big projects, as far as possible, funds will be routed through District Hort./Agri. Officer, to facilitate post disbursement inspection. The District Hort./Agri. Officer would facilitate beneficiaries in procurement of planting material, organic manures, equipments, etc.
Monitoring MechanismAt National Level the implementation of all the four Mini Missions are being regularly reviewed and monitored by a Central Steering Committee headed by Secretary (A&C). In addition the Mini Mission wise programmes are being reviewed and monitored by concerned Steering Committees headed by DG (ICAR) for MM-I, Additional Secretary (DAC) for Mini Mission - II and III and Secretary (MFPI) for Mini Mission - IV.
At State level, the programmes are being reviewed and monitored by State Level Steering Committee headed by Chief Secretary of concerned States.
National agencies Involved in Implementation of the schemeA. Indian Council of Agricultural Research (ICAR)All the research project proposals including production of nucleus seed and planting material, Human Resource Development are being taken up by ICAR through its concerned Nodal Officers.
B. Small Farmers’ Agri-Business Consortium (SFAC), New Delhii. SFAC will interact with State Governments/State agencies to obtain their views on the programmes
of the Mission and it may suggest modifications in policies or scheme parameters for consideration of DAC.
ii. SFAC will obtain quarterly progress reports from State level agencies, consolidate them and send to Horticulture Mission Cell at DAC. SFAC will obtain utilization certificates from concerned agencies and forward them to the Horticulture Mission Cell at Department of Agriculture & Cooperation. SFAC will also give statements on utilization of funds regularly and audited certificates at the close of each financial year in GFR-19.
iii. SFAC will ensure ground level monitoring of the Scheme and record their observations in quarterly progress reports sent to Horticulture Mission Cell.
iv. Each State will prepare an annual report giving details of the programmes implemented under the Mission and benefits accrued to the State and provide it to Horticulture Mission Cell with the list of beneficiaries along with their names, addresses and details of funds provided to them and for the purpose. The Central SFAC within 3 months of close of the year after collection of the annual reports from the respective states would compile a consolidated report mentioning the performance of the scheme and its role as an implementing agency. The consolidated annual report would be made available to the Horticulture Mission Cell in DAC within the stipulated period of 3 months after close of the financial year.
v. In addition to its role of monitoring and sending quarterly progress report to Horticulture Mission Cell, DAC, SFAC will also act directly as an implementing agency for any component of the Mission programme on request of DAC.
implementatiOn prOceDure 11
vi. The funds for Mini Mission - II and III (except to designated agencies like NHB) will be routed through SFAC for further release to concerned agency/State level SFAC of the respective states. The SFAC will be paid service charges @ 0.5% of the funds routed through it.
vii. Under Mini Mission - III, Director Horticulture of the State, would prepare projects which after the approval of State Level Steering Committee would be appraised by NHB/DMI/SFAC on the basis of suitability of locations and economic viability.
viii. Projects proposals under Mini Mission - IV would be sent by the respective State Governments to the MFPI with a copy to DAC. The MFPI’s Project Approval Committee would approve the proposal and would recommend it for funding through SFAC.
C. National Horticulture Board (NHB), GurgaonAll the project proposals relating to Post Harvest Management (except those relating to marketing infrastructure) will be received in the prescribed format (Annexure-II) by the NHB from the State Governments. It would appraise these proposals and advice the DAC accordingly.
D. Directorate of Marketing & Inspection (DMI), New DelhiDMI would be responsible for appraisal of all the proposals regarding setting up of marketing infrastructure for horticulture produce received from the respective State Governments in the prescribed format and would advice the DAC. In addition to this it would also provide market intelligence and be responsible for monitoring of all programmes relating to marketing of horticulture crops.
E. Ministry of Food Processing Industries (MFPI)All the project proposals relating to processing will be received by MFPI through concerned State Implementing Agencies. MFPI’s Project Approval Committee would approve proposals for funding under HMNEH.
F. Other MinistriesDepartments associated in implementation of various programmes under HMNEH are Ministry of Panchayat Raj, Department for Development of North Eastern Region (DONER), APEDA, NCDC, NBB, etc.
chapter 3 13
Chapter 3Mini Mission I: Research
Chap t e r Mini Mission I: Research3
The Mini Mission wise progress of implementation of programmes under HMNEH during 2011-12 are as under:
Mini Mission I (Research)This mission concentrates on technology generation appropriate to the region. The major components are production and supply of seed and planting material, technology, standardization and refinement specific to the region and on farm demonstration and training. The programmes are being under taken by ICAR Nodal Institutes’ namely,
i. NRC for Orchids, Sikkim covering all the North Eastern States, ii. CPRI, Shimla for Himachal Pradesh, iii. Vivekananda Parvatiya Krishi Anusandhan Sansathan, Almora for Uttarakhand, and iv. Central Institute of Temperate Horticulture for Jammu & Kashmir.
The Institute wise progress of achievements made during 2011-12 are given as under:
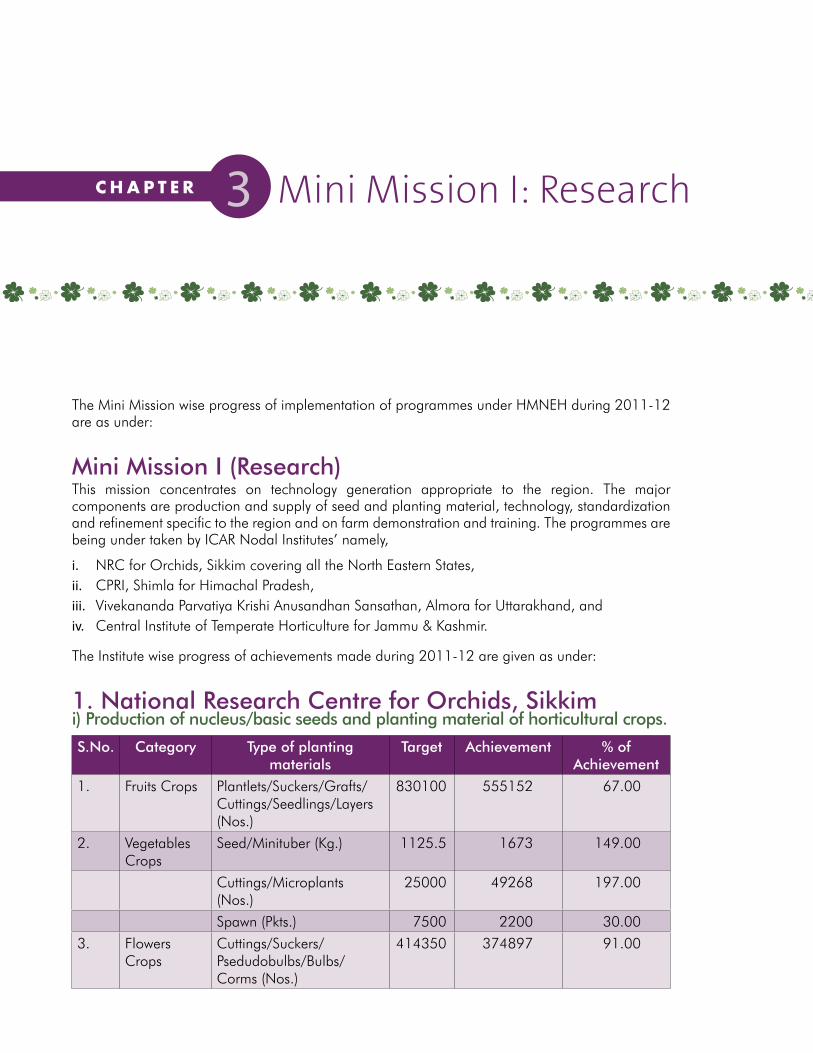
1. National Research Centre for Orchids, Sikkimi) Production of nucleus/basic seeds and planting material of horticultural crops.
S.No. Category Type of planting materials
Target Achievement % of Achievement
1. Fruits Crops Plantlets/Suckers/Grafts/Cuttings/Seedlings/Layers (Nos.)
830100 555152 67.00
2. Vegetables Crops
Seed/Minituber (Kg.) 1125.5 1673 149.00
Cuttings/Microplants (Nos.)
25000 49268 197.00
Spawn (Pkts.) 7500 2200 30.003. Flowers
CropsCuttings/Suckers/Psedudobulbs/Bulbs/Corms (Nos.)
414350 374897 91.00
Horticulture Mission for North East and Himalayan States | Annual Report 2011-1216
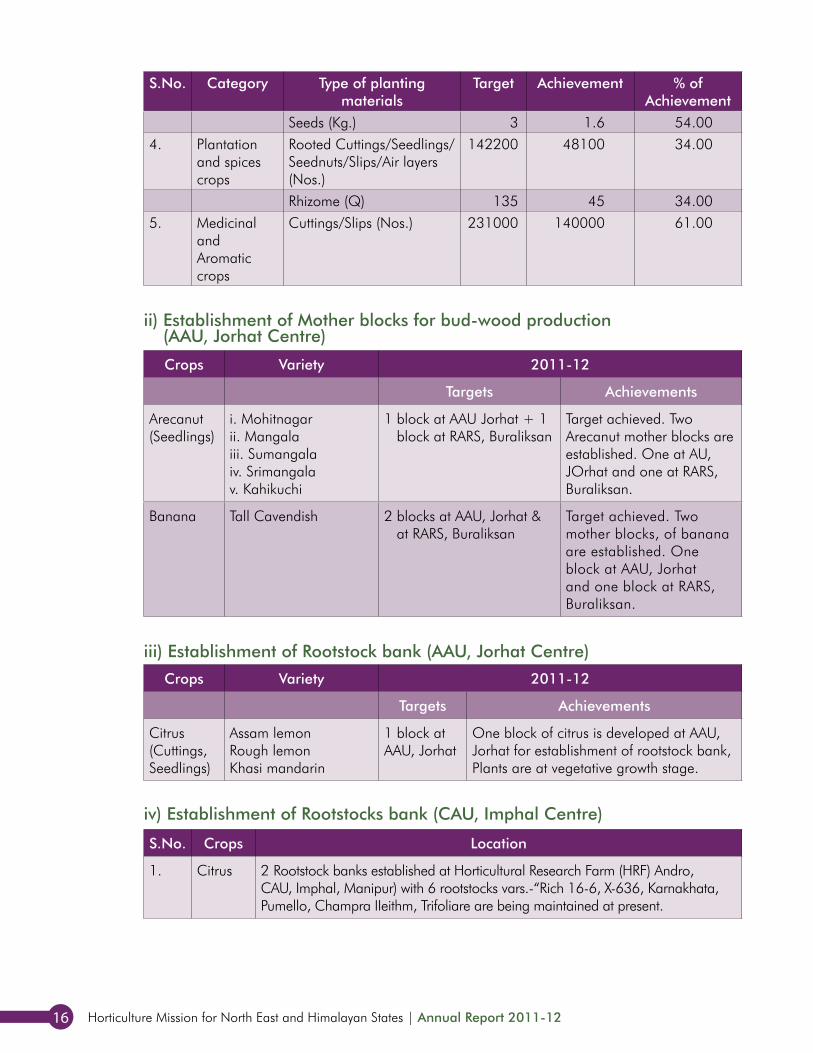
S.No. Category Type of planting materials
Target Achievement % of Achievement
Seeds (Kg.) 3 1.6 54.004. Plantation
and spices crops
Rooted Cuttings/Seedlings/Seednuts/Slips/Air layers (Nos.)
142200 48100 34.00
Rhizome (Q) 135 45 34.005. Medicinal
and Aromatic crops
Cuttings/Slips (Nos.) 231000 140000 61.00
Crops Variety 2011-12
Targets Achievements
Arecanut (Seedlings)
i. Mohitnagarii. Mangalaiii. Sumangalaiv. Srimangalav. Kahikuchi
1 block at AAU Jorhat + 1 block at RARS, Buraliksan
Target achieved. Two Arecanut mother blocks are established. One at AU, JOrhat and one at RARS, Buraliksan.
Banana Tall Cavendish 2 blocks at AAU, Jorhat & at RARS, Buraliksan
Target achieved. Two mother blocks, of banana are established. One block at AAU, Jorhat and one block at RARS, Buraliksan.
ii) Establishment of Mother blocks for bud-wood production (AAU, Jorhat Centre)
iii) Establishment of Rootstock bank (AAU, Jorhat Centre)
iv) Establishment of Rootstocks bank (CAU, Imphal Centre)
Crops Variety 2011-12
Targets Achievements
Citrus (Cuttings, Seedlings)
Assam lemon Rough lemon Khasi mandarin
1 block at AAU, Jorhat
One block of citrus is developed at AAU, Jorhat for establishment of rootstock bank, Plants are at vegetative growth stage.
S.No. Crops Location
1. Citrus 2 Rootstock banks established at Horticultural Research Farm (HRF) Andro, CAU, Imphal, Manipur) with 6 rootstocks vars.-“Rich 16-6, X-636, Karnakhata, Pumello, Champra IIeithm, Trifoliare are being maintained at present.
mini miSSiOn i: reSearch 17
2. Standardization of Improved production and protection technologies for horticultural crops.
� In high density planting of peach, three low chilling varieties of peach vi. Partap, Shan-e-Punjab and Floradasun were planted at a spacing of 2 x 2m. The no. of fruits per plant was recorded highest in Shan-e-Punjab (135.7) followed by Pratap (107.5) whereas, lowest in Floradasun (59.9). The Pratap (58.90 g) recorded maximum fruit weight followed by Floradasum (44.3g) whereas, lowest in Shan-e-Punjab (36.6g). The yield was recorded highest in Pratap (6.31 kg/tree) followed by Shan-e-Punajb (4.96 kg/tree) and lowest in Floradasum (2.65 kg/tree). (Barapani centre).
� While studying the establishment of agro techniques for strawberry, runners from field were transplanted into poly bags. While transplanting into polybags, three different pruning treatments were imposed such as pruned up to two leaves, four leaves and un-pruned and executed with and without dipping in bavistin solution (2gm/I). It was recorded that pruning upto two leaves along with Bavistin dip treatment showed better survival better survival rate and early establishment by four leaves (A.P. Centre).
� Rejuvenation techniques of Khasi mandarin were studied. Various treatments were included like Pruning and training, correction of soil p11, integrated nutrient management, integrated management of trunk borer and bark cating caterpillar, integrated management of disease & integrated weed management.
Soil pH, organic carbon increased after treatment of the plants in all the treated plots. The weed population, incidence of insect pest and diseases were reduces in all the treated plots (CRS, Tinsukia).
� The development of packages of practices for organic ginger was studied. The experiment was set on randomized block design with six treatments viz., T1; Vermicompst (VC: 2.5 t/ha), T2: Poultry manure (PM; 1.25 t/ha). T3; Swine manure (SM: 3.0 t/ha), T4: control and replicated thrice to study the effect of applied organic nutrients on growth and yield attributes of ginger. The growth performance was recorded higher under the VC followed by PM but crop is yet to harvest, (A.P. Centre).
� The production technology of mushroom was standardized. The addition of rice bran recorded stimulatory effect on Pleurotus sajarcaju. The sporophore appeared within (19.50 days) after spawning. The other yield parametes, viz., weight of sporophore (474.00g) and biological efficiency (95.8%) were also significantly high in rice bran supplementation. (A.P. Centre).
� The effect of NPK on growth and flowering of Chrysanthemum var. Carnval Pride were studied. The treatments include different ratios of N, P and K at 3 levels each of 10 g/m3, 20g/m2 & 30g/m2. Among different treatments, NPK with (30:20:20g/m2) resulted
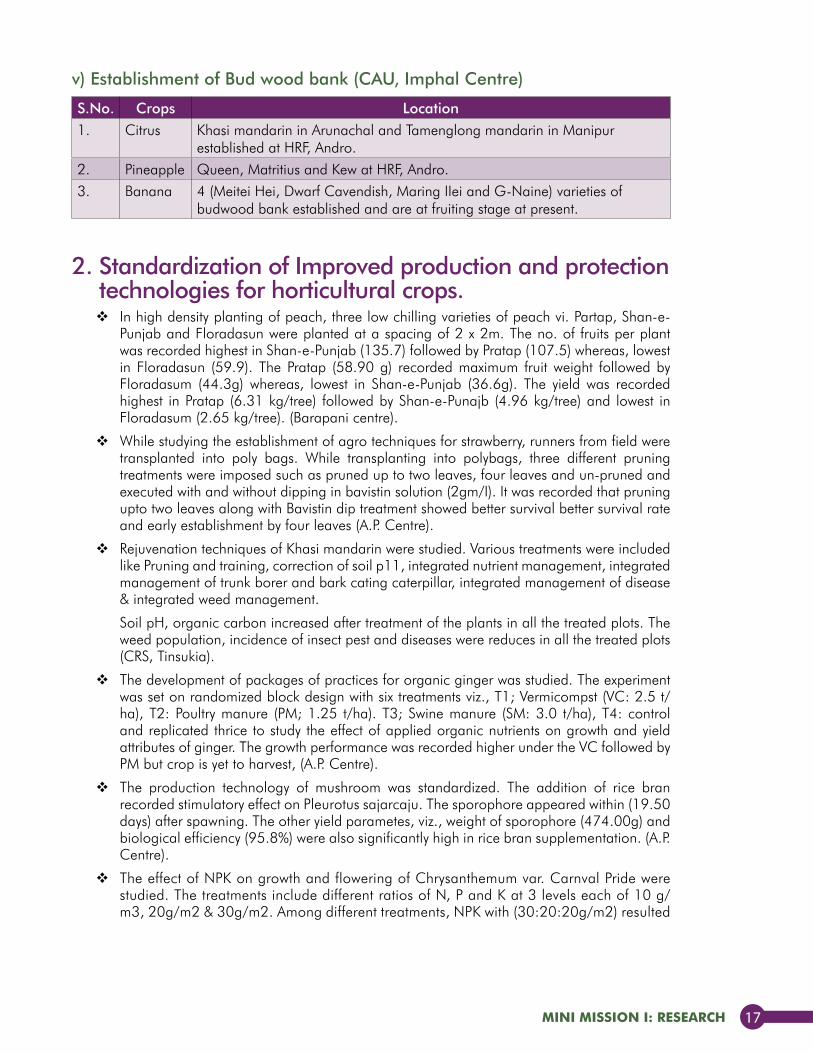
v) Establishment of Bud wood bank (CAU, Imphal Centre)
S.No. Crops Location1. Citrus Khasi mandarin in Arunachal and Tamenglong mandarin in Manipur
established at HRF, Andro.2. Pineapple Queen, Matritius and Kew at HRF, Andro.3. Banana 4 (Meitei Hei, Dwarf Cavendish, Maring IIei and G-Naine) varieties of
budwood bank established and are at fruiting stage at present.
Horticulture Mission for North East and Himalayan States | Annual Report 2011-1218
in better growth and flower character; namely plant height (40.10cm),no. of branches/plant (34.33 no.), flower no./plant (244.33 no.) and flower duration (44.33 days). (AAU, Jorhat).
� While studying the performance of different anthurium cultivars like Fire, Tropical, Calore, Moments, Acropolis Agniotri, IAHS-1, Sweet Heart, Cherry Red & Sunset Orange under agro shade net for Assam conditions. Among the different varieties, Acropolis resulted in better growth & flower characters. Maximum leaf size (18.4 cm x 10.6cm), early flowering (100 days), flower size (8.0 cm x 6.0 cm) was revealed in Acropolis. Whereas, Moments produced highest plant height (48cm) & flower no. (2.0). (AAU, Jorhat).
� While studying the suitable dose of organic and biofertilizer for growth and flowering of gerbera var. Red Gem. Out of the 9 treatments, Enrich compost @ 10t/ha was superior in growth and flower characters. Namely, plant height (51.66cm), leaf no. (52), carly flowering (59.40 days), flowers no./plant 937.60), stalk length (56.50 cm), flower size (9.54 cm), flower duration (19.80 days) vase life (9.20 days). (AAU, Jorhat).
� While evaluating the organic fertilizer as a source of nutrient for Cymbidium, maximum no. of new shoot (2.78)and no. of back bulb were recorded from the plants treated with Bone meal. Similarly more no. of leaves (62.78), no. of psedudobulb (6.33), plant height (69.78cm) and leaf length (67.55 cm) were found in the plants treated with Pushkal (20N) + Biopotash + Megacal. (NRCO, Pakyong).
� Thirteen locally collected pepper accessions for growth and yield was evaluated. It was observed that the highest yield (4.7 kg/vine) was obtained in KKHP-3 (4.5kg/vine) after 6 years of planting. (CPCRI, Kahikuchi).
� Out of the different coconut varieties/hybrids under North East conditions, I.O x COD recorded maximum trunk height (2.55m), COD x WCT possess maximum collar girth (1.44m), WCT x GB produced maximum annual leaves/palm. All the varieties and hybrids started flowering on 6th year of planting . COD x WCT recorded the highest no. of spadices (5.33); Spadi initiation and flower opening still continuing. WCT x GB recorded the highest no. nut yield/palm (23) on 7th year of planting. (CPCRI, Kahikuchi).
� The comparative performance of areca hybrids alongwith parental lines under North East conditions was done. The results revealed that after 4th year of planting, Sumangala performs better in terms of seedling height and collar girth (3.84m and 46.63 cm, respectively) and Hirehalli Dwarf with respect to annual leaves production (3 no.). Among the hybrids, Sumangala x HD recoreded the highest seedling hiehgt (3.36m) and collar circumference (46.75cm) HD x Sumangala recorded maximum (3.08 no.) annual leaf production. (CPCRI Kahikuchi).
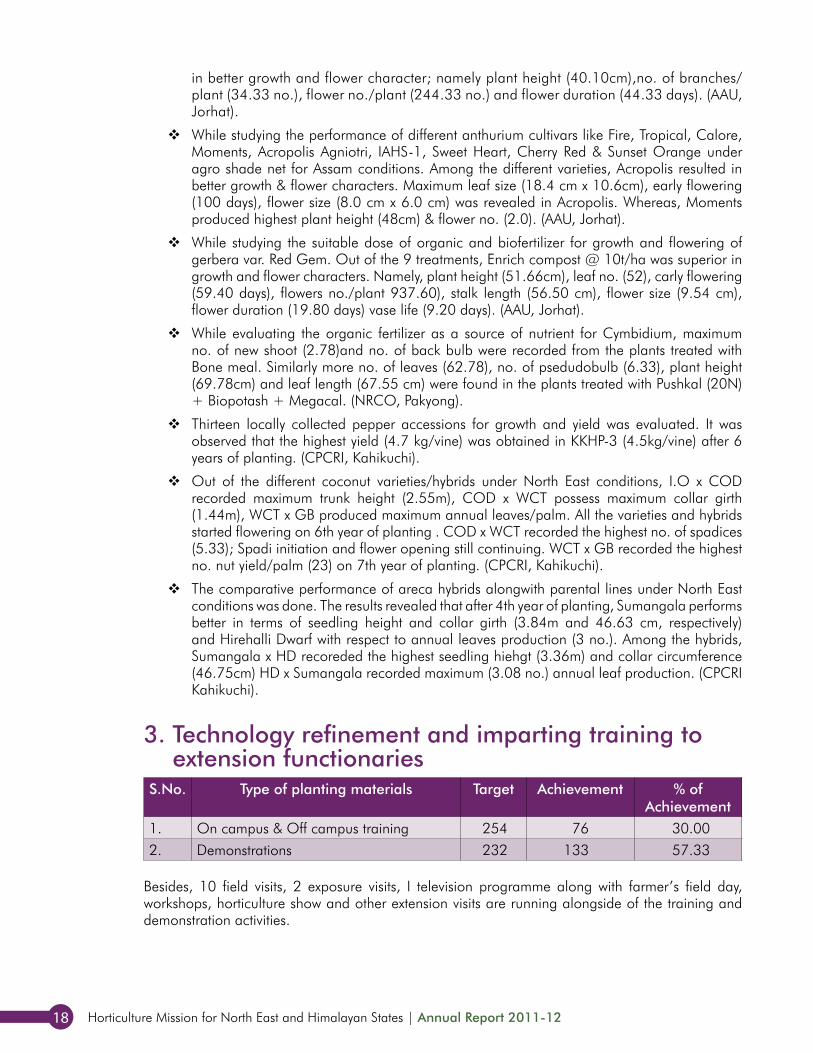
3. Technology refinement and imparting training to extension functionaries
S.No. Type of planting materials Target Achievement % of Achievement
1. On campus & Off campus training 254 76 30.002. Demonstrations 232 133 57.33
Besides, 10 field visits, 2 exposure visits, I television programme along with farmer’s field day, workshops, horticulture show and other extension visits are running alongside of the training and demonstration activities.
mini miSSiOn i: reSearch 19
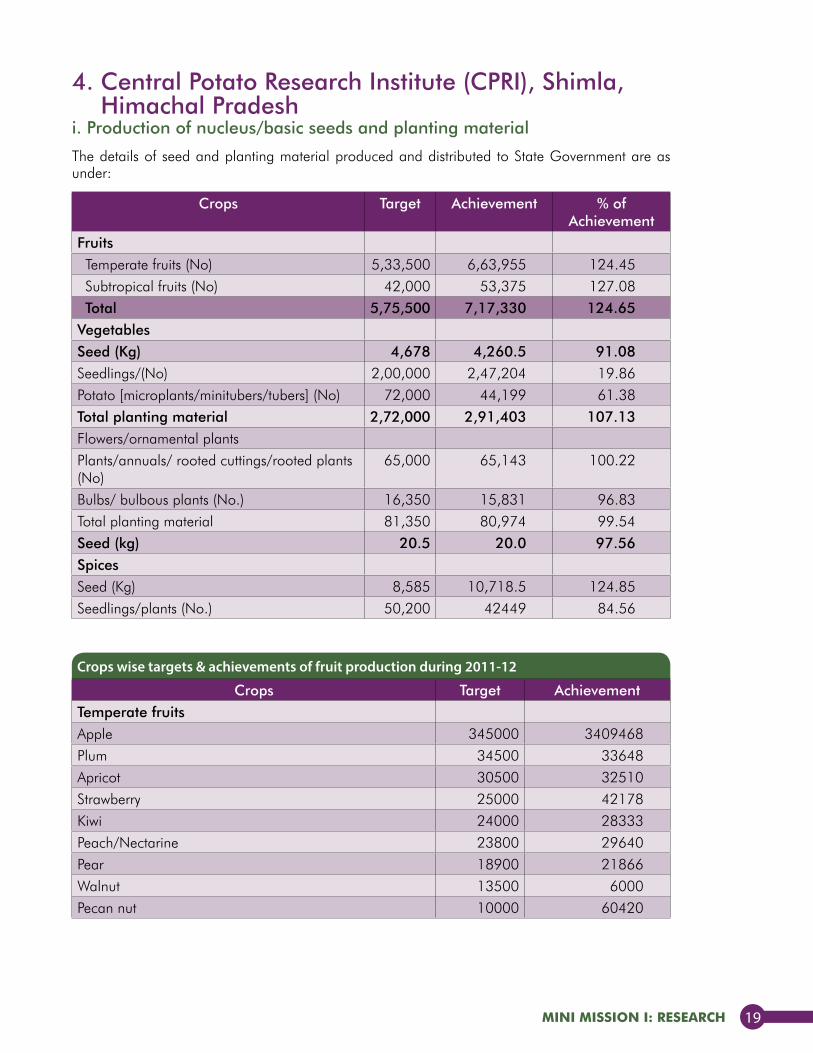
4. Central Potato Research Institute (CPRI), Shimla, Himachal Pradesh
i. Production of nucleus/basic seeds and planting material
The details of seed and planting material produced and distributed to State Government are as under:
Crops Target Achievement % of Achievement
FruitsTemperate fruits (No) 5,33,500 6,63,955 124.45Subtropical fruits (No) 42,000 53,375 127.08Total 5,75,500 7,17,330 124.65
VegetablesSeed (Kg) 4,678 4,260.5 91.08Seedlings/(No) 2,00,000 2,47,204 19.86Potato [microplants/minitubers/tubers] (No) 72,000 44,199 61.38Total planting material 2,72,000 2,91,403 107.13Flowers/ornamental plantsPlants/annuals/ rooted cuttings/rooted plants (No)
65,000 65,143 100.22
Bulbs/ bulbous plants (No.) 16,350 15,831 96.83Total planting material 81,350 80,974 99.54Seed (kg) 20.5 20.0 97.56SpicesSeed (Kg) 8,585 10,718.5 124.85Seedlings/plants (No.) 50,200 42449 84.56
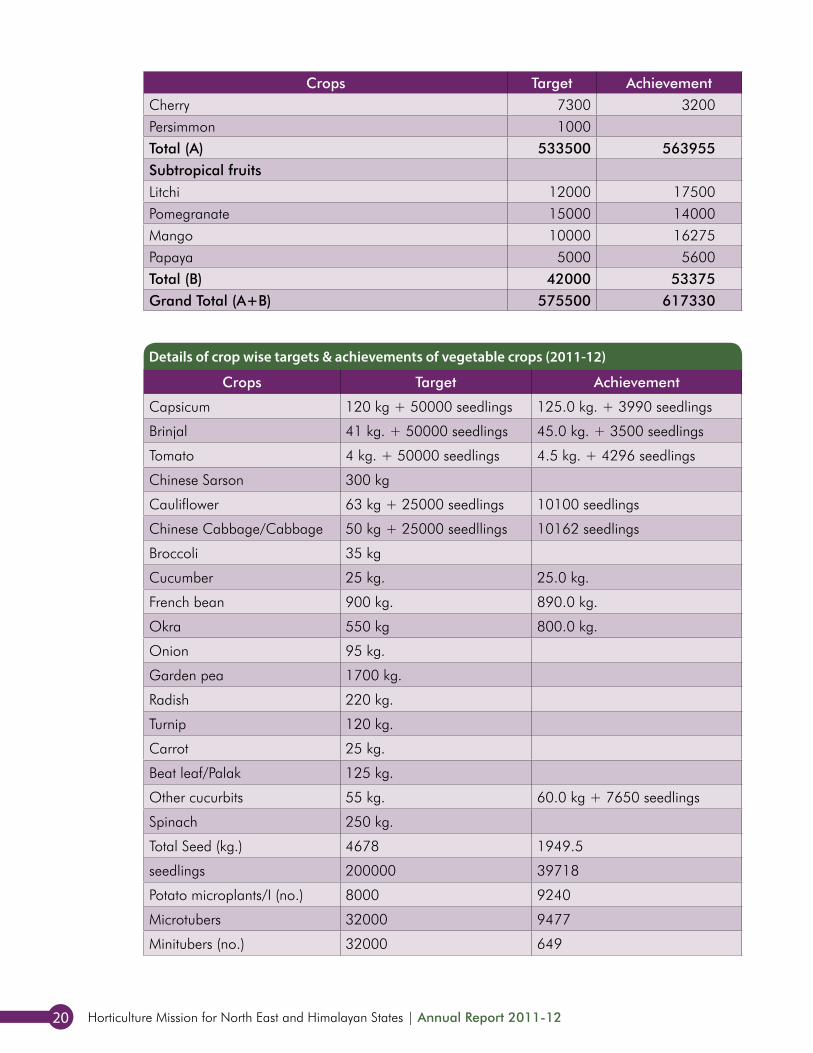
Crops wise targets & achievements of fruit production during 2011-12
Crops Target AchievementTemperate fruitsApple 345000 3409468Plum 34500 33648Apricot 30500 32510Strawberry 25000 42178Kiwi 24000 28333Peach/Nectarine 23800 29640Pear 18900 21866Walnut 13500 6000Pecan nut 10000 60420
Horticulture Mission for North East and Himalayan States | Annual Report 2011-1220
Crops Target AchievementCherry 7300 3200Persimmon 1000Total (A) 533500 563955Subtropical fruitsLitchi 12000 17500Pomegranate 15000 14000Mango 10000 16275Papaya 5000 5600Total (B) 42000 53375Grand Total (A+B) 575500 617330
Details of crop wise targets & achievements of vegetable crops (2011-12)
Crops Target Achievement
Capsicum 120 kg + 50000 seedlings 125.0 kg. + 3990 seedlings
Brinjal 41 kg. + 50000 seedlings 45.0 kg. + 3500 seedlings
Tomato 4 kg. + 50000 seedlings 4.5 kg. + 4296 seedlings
Chinese Sarson 300 kg
Cauliflower 63 kg + 25000 seedlings 10100 seedlings
Chinese Cabbage/Cabbage 50 kg + 25000 seedllings 10162 seedlings
Broccoli 35 kg
Cucumber 25 kg. 25.0 kg.
French bean 900 kg. 890.0 kg.
Okra 550 kg 800.0 kg.
Onion 95 kg.
Garden pea 1700 kg.
Radish 220 kg.
Turnip 120 kg.
Carrot 25 kg.
Beat leaf/Palak 125 kg.
Other cucurbits 55 kg. 60.0 kg + 7650 seedlings
Spinach 250 kg.
Total Seed (kg.) 4678 1949.5
seedlings 200000 39718
Potato microplants/I (no.) 8000 9240
Microtubers 32000 9477
Minitubers (no.) 32000 649
mini miSSiOn i: reSearch 21
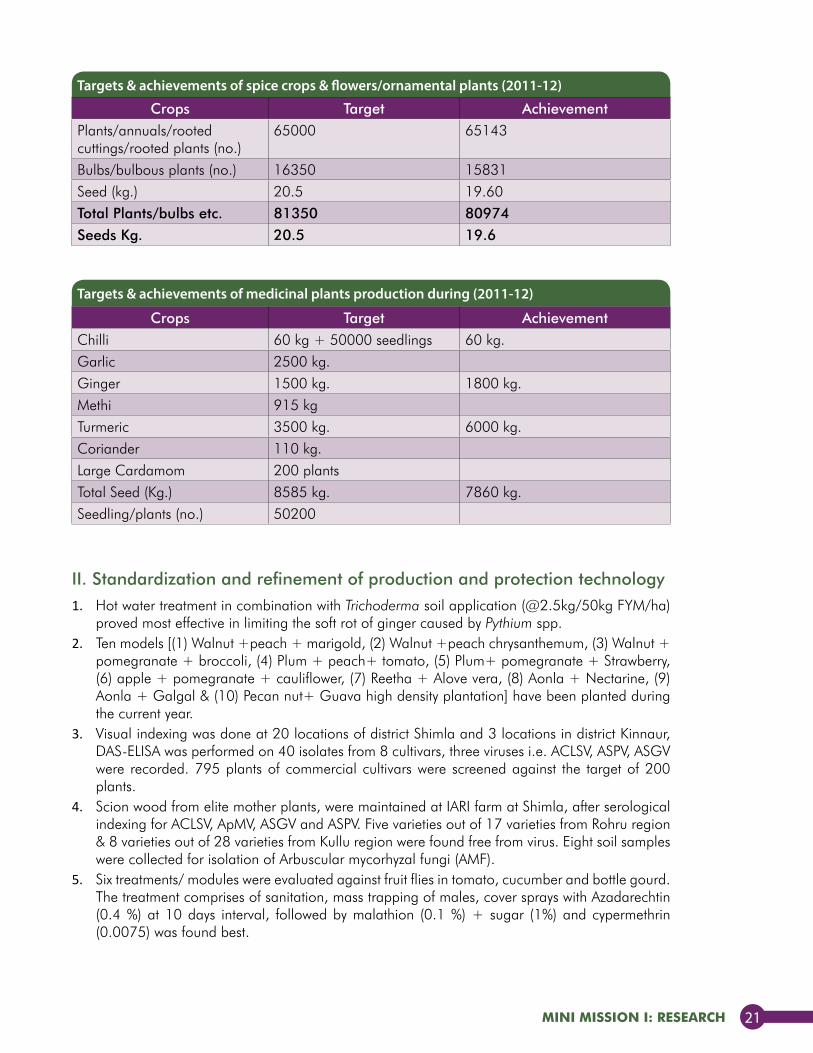
II. Standardization and refinement of production and protection technology1. Hot water treatment in combination with Trichoderma soil application (@2.5kg/50kg FYM/ha)
proved most effective in limiting the soft rot of ginger caused by Pythium spp. 2. Ten models [(1) Walnut +peach + marigold, (2) Walnut +peach chrysanthemum, (3) Walnut +
pomegranate + broccoli, (4) Plum + peach+ tomato, (5) Plum+ pomegranate + Strawberry, (6) apple + pomegranate + cauliflower, (7) Reetha + Alove vera, (8) Aonla + Nectarine, (9) Aonla + Galgal & (10) Pecan nut+ Guava high density plantation] have been planted during the current year.
3. Visual indexing was done at 20 locations of district Shimla and 3 locations in district Kinnaur, DAS-ELISA was performed on 40 isolates from 8 cultivars, three viruses i.e. ACLSV, ASPV, ASGV were recorded. 795 plants of commercial cultivars were screened against the target of 200 plants.
4. Scion wood from elite mother plants, were maintained at IARI farm at Shimla, after serological indexing for ACLSV, ApMV, ASGV and ASPV. Five varieties out of 17 varieties from Rohru region & 8 varieties out of 28 varieties from Kullu region were found free from virus. Eight soil samples were collected for isolation of Arbuscular mycorhyzal fungi (AMF).
5. Six treatments/ modules were evaluated against fruit flies in tomato, cucumber and bottle gourd. The treatment comprises of sanitation, mass trapping of males, cover sprays with Azadarechtin (0.4 %) at 10 days interval, followed by malathion (0.1 %) + sugar (1%) and cypermethrin (0.0075) was found best.
Targets & achievements of spice crops & flowers/ornamental plants (2011-12)
Targets & achievements of medicinal plants production during (2011-12)
Crops Target AchievementPlants/annuals/rooted cuttings/rooted plants (no.)
65000 65143
Bulbs/bulbous plants (no.) 16350 15831Seed (kg.) 20.5 19.60Total Plants/bulbs etc. 81350 80974Seeds Kg. 20.5 19.6
Crops Target AchievementChilli 60 kg + 50000 seedlings 60 kg.Garlic 2500 kg.Ginger 1500 kg. 1800 kg.Methi 915 kgTurmeric 3500 kg. 6000 kg.Coriander 110 kg.Large Cardamom 200 plantsTotal Seed (Kg.) 8585 kg. 7860 kg.Seedling/plants (no.) 50200
Horticulture Mission for North East and Himalayan States | Annual Report 2011-1222
6. Six botanical extracts were tested against oviposition, eggs and larval stages of cut worm (Agrotis sp.) and white grubs in which Neem seed kernel and soapnut extracts in cattle urine found effective.
7. Technology for lactic acid fermentation of vegetables (radish and carrot) was optimized. 2.5% salt + 2% mustard & 2.5% salt + 1.5% mustard were found best for lactic acid fermentation of carrot and radish, respectively.
8. Artificial short days provided by using black polythene and tarpaulin showed bud formation in the month of July and flowering during August in 8 commercial cultivars.
9. Eight fungisides were tested against powdery mildew (Sphaerotheca pannosa) & black spot (Diplocarpon rosae) of rose. Difenconazole was found effective for powdery mildew and mencozeb + carbendazim for management of black spot. Soil solarization with transparent polyethylene mulch (100gauze thick) was found effective for the management of wilt (Fusarium oxysporum). Prophanifos (0.1%) provided effective management of mite in carnation and rose.
10. Modified MS medium with increased level of NH4No3 (25.7mM) and supplemented with GA3 (0.58 μM) as well as NAA (0.1 μM), used for improving morphological growth characteristics of recalcitrant potato cultivar Kufri Jyoti
11. French and African marigold were evaluated and 80 crosses of French marigold and 5 crosses of African marigold were done. Seventeen selections of Antirhinum and 15 selections of Pansy were maintained, crossed and nursary of the lines and the hybrids has been raised.
12. Domestication of bumble bees in refined wooden domiciles to enhance the success of bumble bee rearing and utilization this technology to meet the increasing need of pollinators in open as well as protected cultivation of crops.
13. Field survey of different Apiaries (Kullu, Bilaspur, Hamirpur, Solan districts) conducted at monthly interval, revealed that percent infestation of Varroa destructor increased from 2010-2011 and from the month of August it started decreasing.
14. Refined growing media (Vermicompost: soil (2:1) + neem manure (250 gm/m2) + Trichoderma (10 gm/m2) + crucifer leaves + biofertilizers) gave better results for soil borne diseases in sweet pepper.
15. Evaluation of different cultivars of Lillium for commercial cultivation parameters is in progress.16. Maximum population of white fly in poly house during second week of June (1542.21adults/
trap) indicating a positive correlation with temperature. Imidacloprid was most effective followed by acetamiprid. ESSO (summer oil) showed compatibility with acetamiprid. Beauveria bassiana provided 76.7% control at 108 conidia/ ml.
17. Parthenium, Lantana and Pinus were as substrates for cultivation of medicinal mushroom. Calcium oxychloride & sodium hypochlorite in the concentration of 4 & 5% were found effective for sterilization of substrates. Polypropylene bags and bamboo baskets were successfully used for cultivation of medicinal mushrooms.
18. Six cultures of AMF, 6 isolates of fungal antagonists and 3 isolates of bacterial antagonists were purified from soil samples of bearing apple orchards at Shimla, Kinnaur, Kullu, and Sirmour districts. Talc based formulations of fungal and bacterial antagonists were prepared.
19. The seedlings of kalazira were used for in vitro shoot multiplication and callus formation. Shoot was found best explant amongst leaf, stem, shoot, cotyledon, is which gave 100% callus initiation.
20. Seven districts of HP covering 81 locations against a target of 20 locations were suveyed and Melolontha sp, Brahmina coriacea and Holotrichia logipennis were observed as important species. Carbofuran3G or chloropyrophos20EC providing 80-100% mortality.
21. Analysis of substrates for preparation of fortified FYM has been done.
mini miSSiOn i: reSearch 23
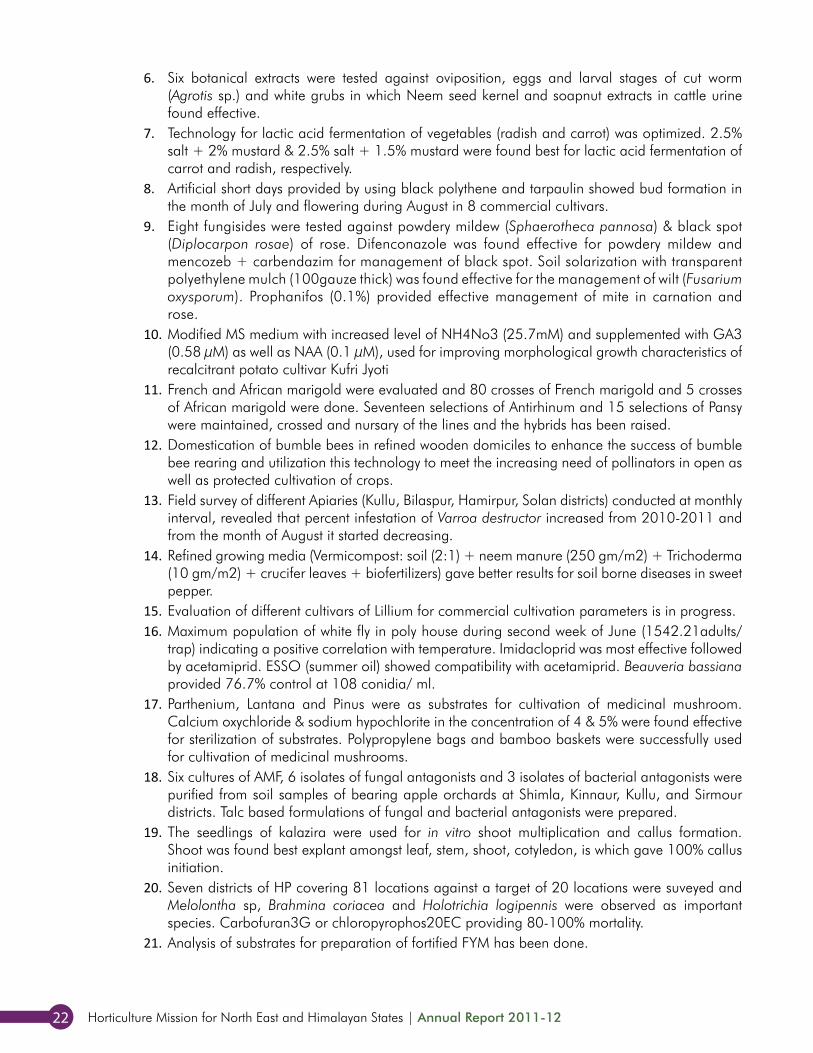
22. Plantation of one microplantlet/ hill was found better as there were less number of <3g minitubers. Upper half of microplant produced 5% less <3g minitubers as compared to lower half segment and full plantlets.
23. Sowing and transplanting date were optimized for hybrid seed production of capsicum and LD onion for bulb-to-seed method
Crops AchievementsNo. of trainings/ awareness
camps/ DemonstrationsNo. of Demos No. of
beneficiaryFruits - - -Vegetables 5 8 154Flowers - - -Total 5 8 154
Number of Trainings, Demonstrations and Beneficiaries
5. Central Institute of Temperate Horticulture (CITH), Srinagar, J&K
i. Production of nucleus/basic seed and planting material
FruitsIn temperate fruits and nuts (apple, almond, walnut, pear, peach/nectarine, plum, apricot, cherry, strawberry) and subtropical fruits (mango, guava, aonla, phalsa, ber, citrus, grapes and lemon) the following quantity of grafted/budded plants and clonal/seedling rootstocks and budwood have been produced for supply to farmers and development departments.
S.No. Particulars Target Number (lakh) Percent target achieved1 Grafted/budded plants 3.50 2.52 72.002 Rootstocks 4.00 3.50 87.503 Budwood 4.00 4.50 112.50
VegetablesThe following quantity of quality seeds of vegetables varieties/hybrids seeds and seedlings of important vegetable crops have been produced and is being supplied to the farmers.
S.No. Particulars Target Number (lakh) Percent target achieved1 Quality seeds of vegetables
varieties800 kgs 812 kgs 101.50
2 Potato tubers 5000 kgs 5000 kgs. 100.003 Vegetables seedlings 3.5 lakh 4.40 lakh 125.71
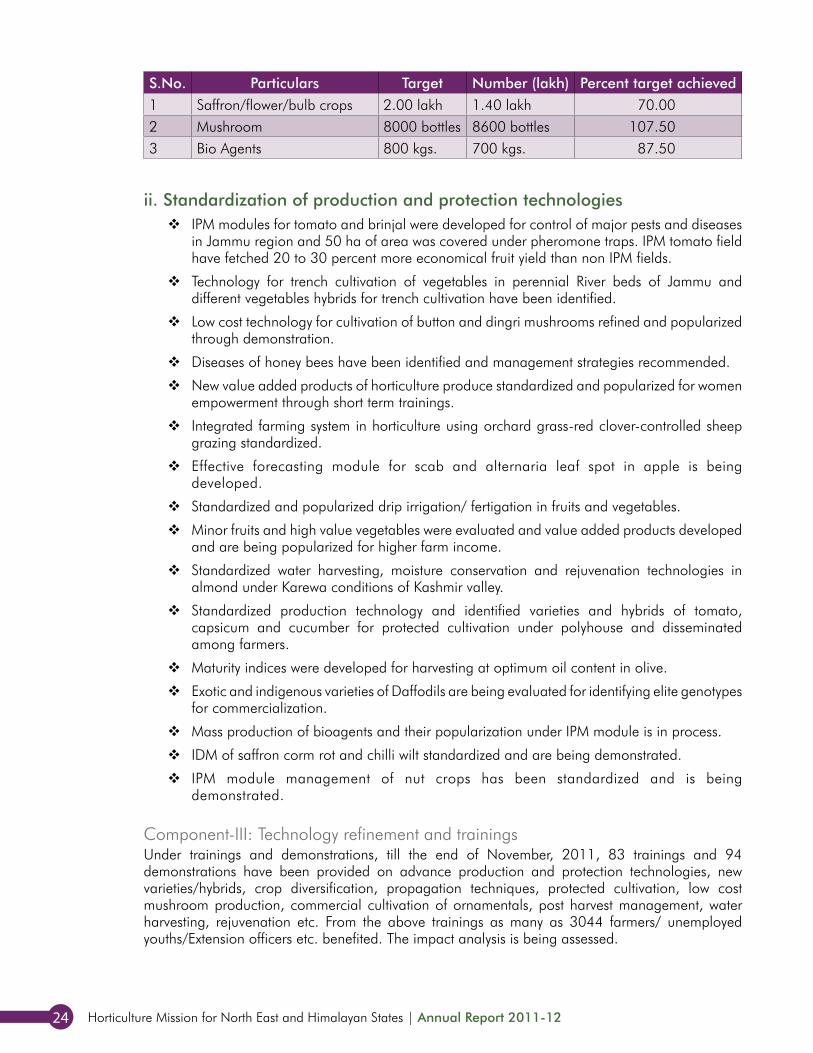
Saffron and ornamentalsIn saffron, ornamental crops and mushroom the following quantity of corms, bulbs and spawn were produced and distributed.
Horticulture Mission for North East and Himalayan States | Annual Report 2011-1224
ii. Standardization of production and protection technologies � IPM modules for tomato and brinjal were developed for control of major pests and diseases
in Jammu region and 50 ha of area was covered under pheromone traps. IPM tomato field have fetched 20 to 30 percent more economical fruit yield than non IPM fields.
� Technology for trench cultivation of vegetables in perennial River beds of Jammu and different vegetables hybrids for trench cultivation have been identified.
� Low cost technology for cultivation of button and dingri mushrooms refined and popularized through demonstration.
� Diseases of honey bees have been identified and management strategies recommended.
� New value added products of horticulture produce standardized and popularized for women empowerment through short term trainings.
� Integrated farming system in horticulture using orchard grass-red clover-controlled sheep grazing standardized.
� Effective forecasting module for scab and alternaria leaf spot in apple is being developed.
� Standardized and popularized drip irrigation/ fertigation in fruits and vegetables.
� Minor fruits and high value vegetables were evaluated and value added products developed and are being popularized for higher farm income.
� Standardized water harvesting, moisture conservation and rejuvenation technologies in almond under Karewa conditions of Kashmir valley.
� Standardized production technology and identified varieties and hybrids of tomato, capsicum and cucumber for protected cultivation under polyhouse and disseminated among farmers.
� Maturity indices were developed for harvesting at optimum oil content in olive.
� Exotic and indigenous varieties of Daffodils are being evaluated for identifying elite genotypes for commercialization.
� Mass production of bioagents and their popularization under IPM module is in process.
� IDM of saffron corm rot and chilli wilt standardized and are being demonstrated.
� IPM module management of nut crops has been standardized and is being demonstrated.
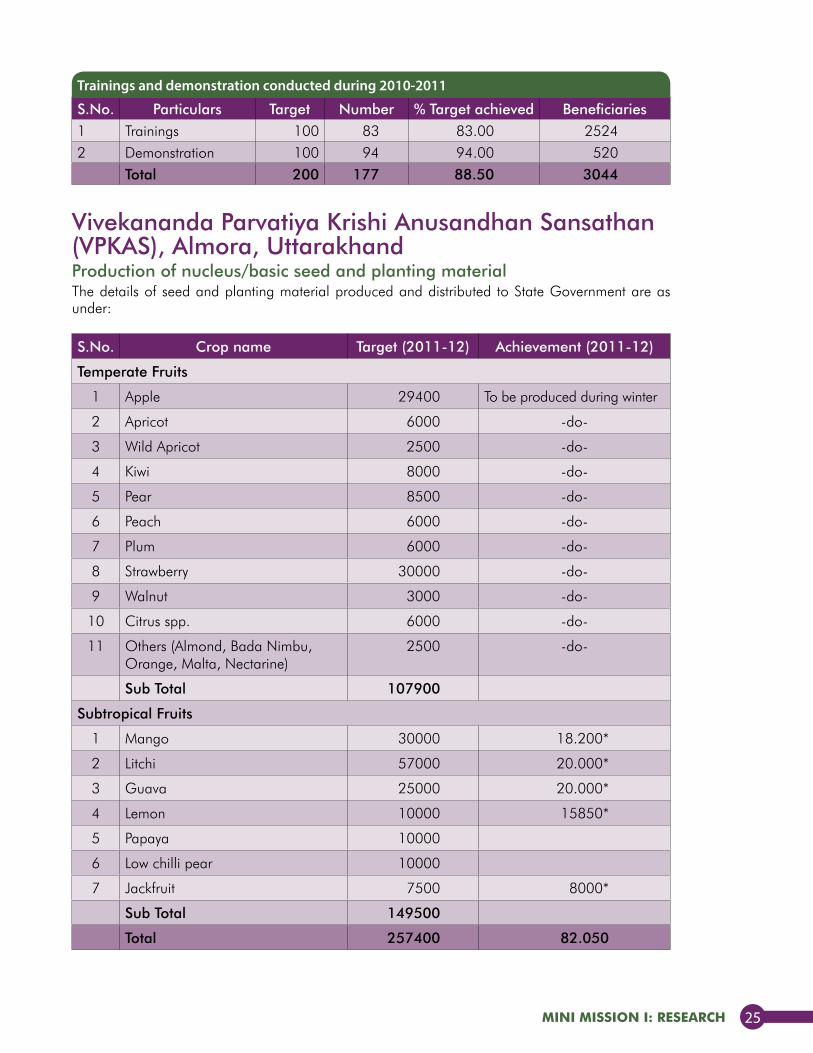
Component-III: Technology refinement and trainingsUnder trainings and demonstrations, till the end of November, 2011, 83 trainings and 94 demonstrations have been provided on advance production and protection technologies, new varieties/hybrids, crop diversification, propagation techniques, protected cultivation, low cost mushroom production, commercial cultivation of ornamentals, post harvest management, water harvesting, rejuvenation etc. From the above trainings as many as 3044 farmers/ unemployed youths/Extension officers etc. benefited. The impact analysis is being assessed.
S.No. Particulars Target Number (lakh) Percent target achieved1 Saffron/flower/bulb crops 2.00 lakh 1.40 lakh 70.002 Mushroom 8000 bottles 8600 bottles 107.503 Bio Agents 800 kgs. 700 kgs. 87.50
mini miSSiOn i: reSearch 25
Vivekananda Parvatiya Krishi Anusandhan Sansathan (VPKAS), Almora, UttarakhandProduction of nucleus/basic seed and planting materialThe details of seed and planting material produced and distributed to State Government are as under:
S.No. Particulars Target Number % Target achieved Beneficiaries1 Trainings 100 83 83.00 25242 Demonstration 100 94 94.00 520
Total 200 177 88.50 3044
Trainings and demonstration conducted during 2010-2011
S.No. Crop name Target (2011-12) Achievement (2011-12)
Temperate Fruits
1 Apple 29400 To be produced during winter
2 Apricot 6000 -do-
3 Wild Apricot 2500 -do-
4 Kiwi 8000 -do-
5 Pear 8500 -do-
6 Peach 6000 -do-
7 Plum 6000 -do-
8 Strawberry 30000 -do-
9 Walnut 3000 -do-
10 Citrus spp. 6000 -do-
11 Others (Almond, Bada Nimbu, Orange, Malta, Nectarine)
2500 -do-
Sub Total 107900
Subtropical Fruits
1 Mango 30000 18.200*
2 Litchi 57000 20.000*
3 Guava 25000 20.000*
4 Lemon 10000 15850*
5 Papaya 10000
6 Low chilli pear 10000
7 Jackfruit 7500 8000*
Sub Total 149500
Total 257400 82.050

Horticulture Mission for North East and Himalayan States | Annual Report 2011-1226
S.No. Crop name Target in Kg. (2011-12) Seed Produced in kg. (2011-12)
1 Bottle gourd 100 Crop in field
2 Brinjal 32 Crop in field
3 Hybrid Bottle gourd 20 16.75
4 Bitter gourd 7 Crop in field
5 Hybrid Bitter gourd 5 3.5
6 Capsicum 4 Crop in field
7 Carrot 25 Crop in field
8 Cauliflower 65 Crop in field
9 Cowpea 300 Crop in field
10 Cucumber 12 Crop in field
11 Hybrid Cucumber 10 8
12 French bean 170 Crop to be sown
13 Okra 780 840
14 Pea 8550 Crop in field
15 Potato 11000 Crop in field
16 Radish 60 Crop in field
17 Dunagiri Radish 40 Crop in field
18 Spinach 180 Crop in field
19 Pahari Palak 15 Crop in field
20 Smooth gourd 12 To be sown
21 Summer Squash 35 To be sown
22 Tomato 24 To be sown
23 Vegetable Rai 25 Crop in field
24 Cabbage 8 To be sown
25 Chillie 45 Crop in field
26 Coriander 1200 Crop in field
27 Fenugreek 100 Crop in field
28 Garlic 150 Crop in field
29 Ginger 400 Crop in field
30 Turmeric 8000 Crop in field
31 Onion (Bulb) 650 Crop in field
Onion (Seed) 35 Crop in field
32 Paprika 0.5 0.15
Total 32059.5 Kg.
Production of quality seed and planting material of vegetables, spices and condiments
mini miSSiOn i: reSearch 27
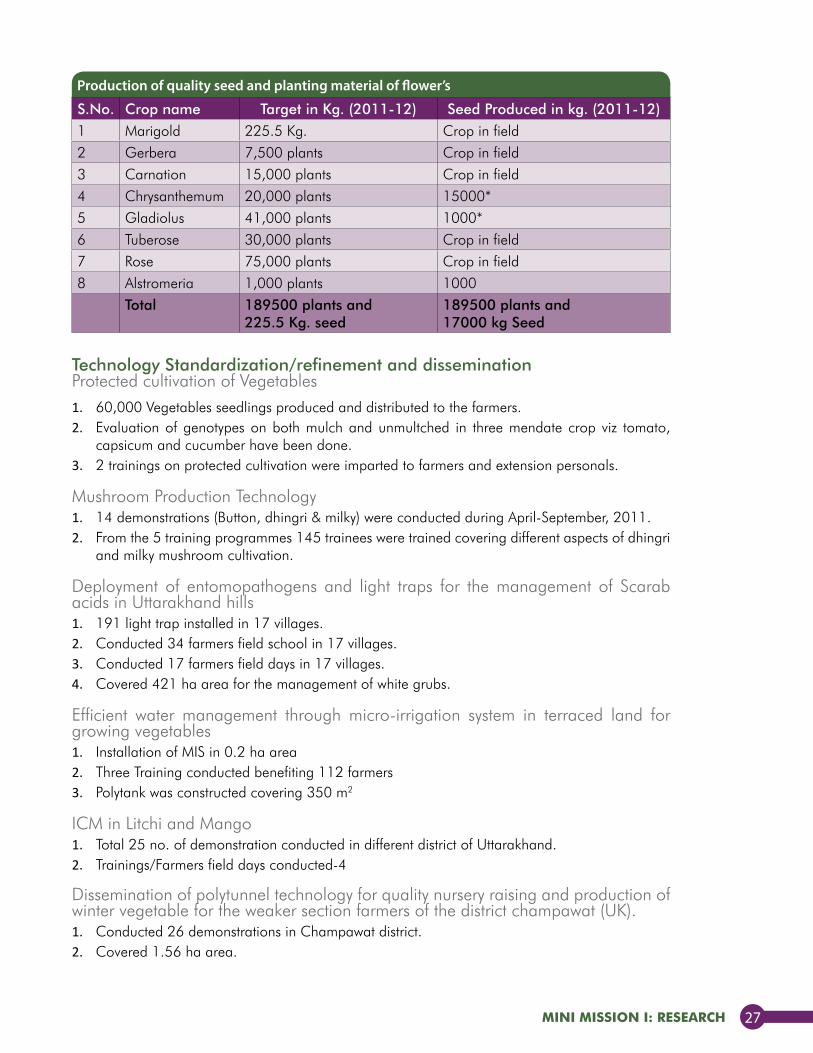
Technology Standardization/refinement and disseminationProtected cultivation of Vegetables1. 60,000 Vegetables seedlings produced and distributed to the farmers.2. Evaluation of genotypes on both mulch and unmultched in three mendate crop viz tomato,
capsicum and cucumber have been done.3. 2 trainings on protected cultivation were imparted to farmers and extension personals.
Mushroom Production Technology1. 14 demonstrations (Button, dhingri & milky) were conducted during April-September, 2011.2. From the 5 training programmes 145 trainees were trained covering different aspects of dhingri
and milky mushroom cultivation.
Deployment of entomopathogens and light traps for the management of Scarab acids in Uttarakhand hills 1. 191 light trap installed in 17 villages.2. Conducted 34 farmers field school in 17 villages.3. Conducted 17 farmers field days in 17 villages.4. Covered 421 ha area for the management of white grubs.
Efficient water management through micro-irrigation system in terraced land for growing vegetables1. Installation of MIS in 0.2 ha area2. Three Training conducted benefiting 112 farmers3. Polytank was constructed covering 350 m2
ICM in Litchi and Mango1. Total 25 no. of demonstration conducted in different district of Uttarakhand.2. Trainings/Farmers field days conducted-4
Dissemination of polytunnel technology for quality nursery raising and production of winter vegetable for the weaker section farmers of the district champawat (UK).1. Conducted 26 demonstrations in Champawat district.2. Covered 1.56 ha area.
Production of quality seed and planting material of flower’s
S.No. Crop name Target in Kg. (2011-12) Seed Produced in kg. (2011-12)1 Marigold 225.5 Kg. Crop in field2 Gerbera 7,500 plants Crop in field3 Carnation 15,000 plants Crop in field4 Chrysanthemum 20,000 plants 15000*5 Gladiolus 41,000 plants 1000*6 Tuberose 30,000 plants Crop in field7 Rose 75,000 plants Crop in field8 Alstromeria 1,000 plants 1000
Total 189500 plants and 225.5 Kg. seed
189500 plants and 17000 kg Seed
Horticulture Mission for North East and Himalayan States | Annual Report 2011-1228
On-Farm Sustainable Production and Dissemination of Fruits and Vegetables based farming system in Uttarakhand.1. Fruit plantation (Sub-tropical, Tempeate)-35242. Spices production-100 plants of Tejpatta3. Vegetable production-1.6 ha4. Protected cultivation-10600 m2
5. Polyhouse construction and repaired-3+26. Polytank construction-27. Animal treated and dewormed-78+2008. Trainings/Exposure visits-5 (159 beneficiaries)
Dissemination of growing off-season vegetables technology under protected environment1. Conducted 176 demonstration covering 13.76 ha area on off season vegetable production
technology.2. Construction five polyhouses covering 500m2 floor area with five beneficiaries.3. Organized three trainings benefiting 129 farmers.
Imparting training through on farm trials/front line demonstrationsTraining-cum-demonstration programme for rural women to develop bio-village for cultivation of MAPs.
General awareness were created for the production of medicinal and aromatic plants, trade related activities and conservation of endangered/extinct of M&AP in their surroundings. Participatory farmers have come to know the importance and safe guarding the traditional knowledge based M&AP and their popularization.
Planned Honeybee pollination for Improvement in Horticultural crop production1. 128 wall hives treated.2. Conducted 17 farmers field school in 19 villages.3. Conduced 1 farmers field days in 19 villages.4. Covered 22 ha area.
Status of horticulture and market opportunity in the state of Uttarakhand1. Data has been collected from farmers and mushroom growers for assessing economic impact
of vegetable cultivation and mushroom cultivation.2. One training on “marketing of vegetables” and one field day for farmers’ club was organized.3. One Retail shop has been started for facilitating farmers club in selling their produce with the
help of NABARD financial assistance.4. Market survey has been conducted at Haldwani market from traders dealing with vegetable and
fruits.5. One farmers’ club bagged state level best farmers’ club award on April, 2011.
Technology transfer of crop regulation in guava1. Conducted 7 demonstration on crop regulation in guava.2. Organized 4 training.
Chapter 4Mini Mission II During 2011-12
Chap t e r Mini Mission II During 2011-124
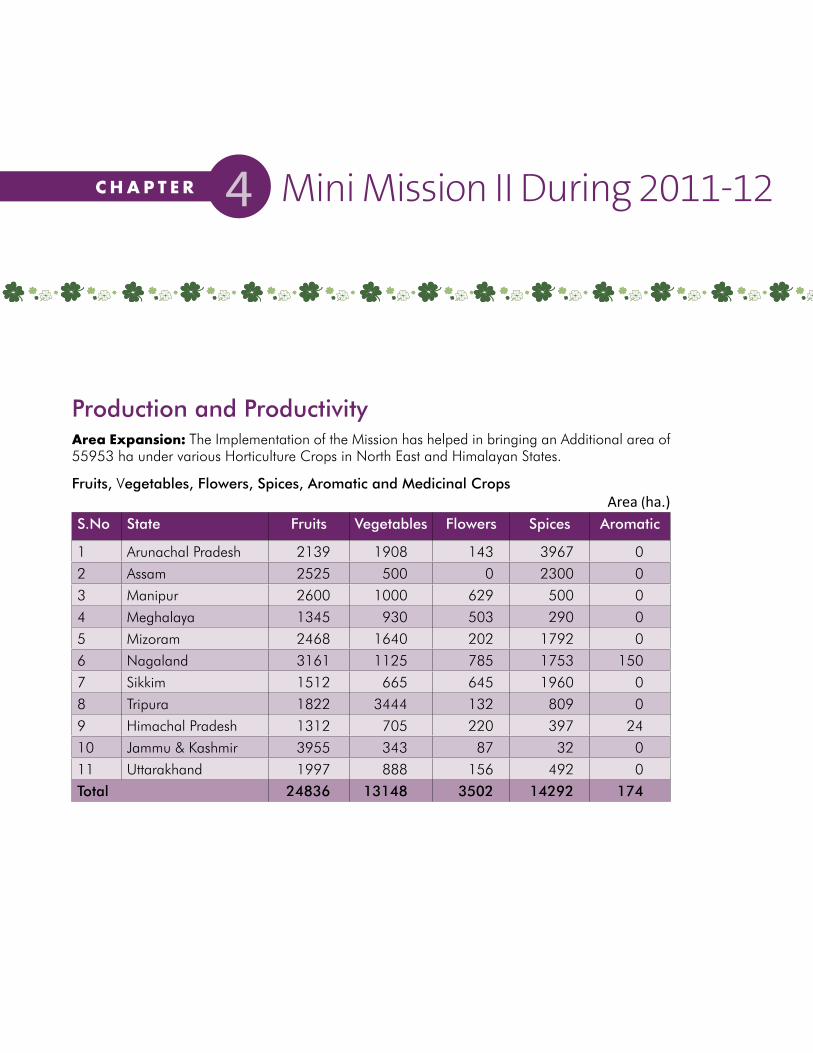
Production and ProductivityArea Expansion: The Implementation of the Mission has helped in bringing an Additional area of 55953 ha under various Horticulture Crops in North East and Himalayan States.
Fruits, Vegetables, Flowers, Spices, Aromatic and Medicinal CropsArea (ha.)
S.No State Fruits Vegetables Flowers Spices Aromatic
1 Arunachal Pradesh 2139 1908 143 3967 02 Assam 2525 500 0 2300 03 Manipur 2600 1000 629 500 04 Meghalaya 1345 930 503 290 05 Mizoram 2468 1640 202 1792 06 Nagaland 3161 1125 785 1753 1507 Sikkim 1512 665 645 1960 08 Tripura 1822 3444 132 809 09 Himachal Pradesh 1312 705 220 397 2410 Jammu & Kashmir 3955 343 87 32 011 Uttarakhand 1997 888 156 492 0Total 24836 13148 3502 14292 174
Horticulture Mission for North East and Himalayan States | Annual Report 2011-1232
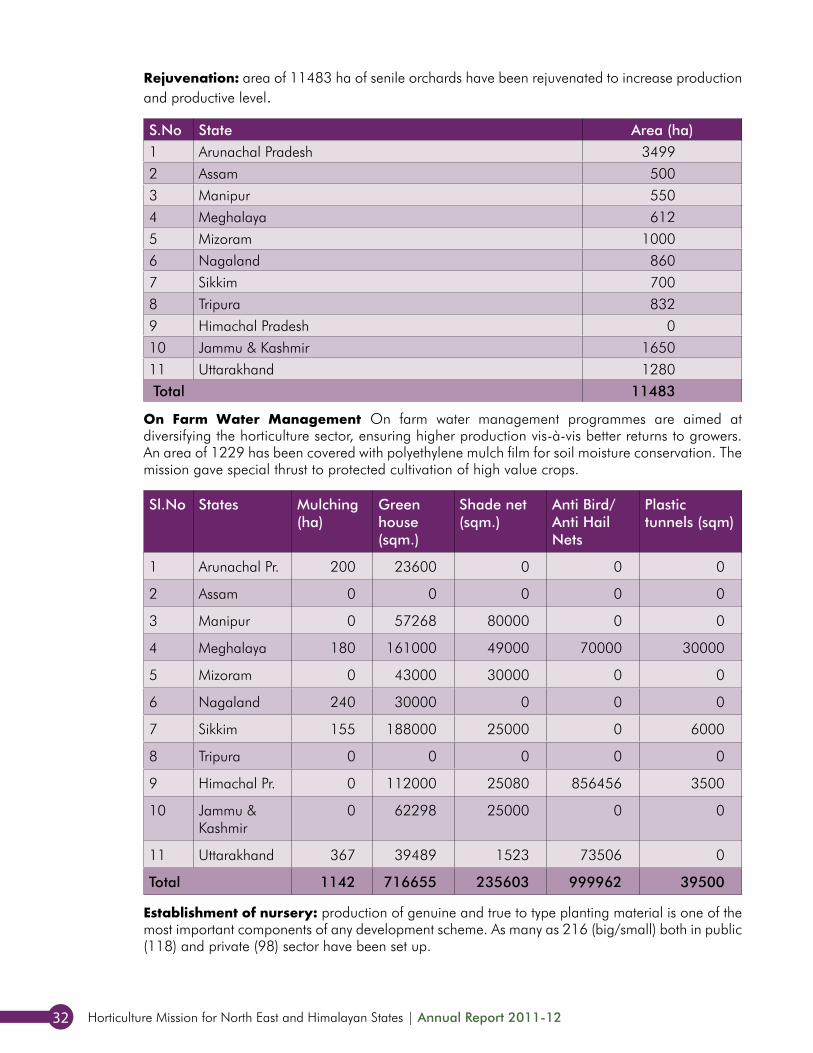
Rejuvenation: area of 11483 ha of senile orchards have been rejuvenated to increase production and productive level.
S.No State Area (ha)1 Arunachal Pradesh 34992 Assam 5003 Manipur 5504 Meghalaya 6125 Mizoram 10006 Nagaland 8607 Sikkim 7008 Tripura 8329 Himachal Pradesh 010 Jammu & Kashmir 165011 Uttarakhand 1280 Total 11483
On Farm Water Management On farm water management programmes are aimed at diversifying the horticulture sector, ensuring higher production vis-à-vis better returns to growers. An area of 1229 has been covered with polyethylene mulch film for soil moisture conservation. The mission gave special thrust to protected cultivation of high value crops.
Sl.No States Mulching (ha)
Green house (sqm.)
Shade net (sqm.)
Anti Bird/Anti Hail Nets
Plastic tunnels (sqm)
1 Arunachal Pr. 200 23600 0 0 0
2 Assam 0 0 0 0 0
3 Manipur 0 57268 80000 0 0
4 Meghalaya 180 161000 49000 70000 30000
5 Mizoram 0 43000 30000 0 0
6 Nagaland 240 30000 0 0 0
7 Sikkim 155 188000 25000 0 6000
8 Tripura 0 0 0 0 0
9 Himachal Pr. 0 112000 25080 856456 3500
10 Jammu & Kashmir
0 62298 25000 0 0
11 Uttarakhand 367 39489 1523 73506 0
Total 1142 716655 235603 999962 39500
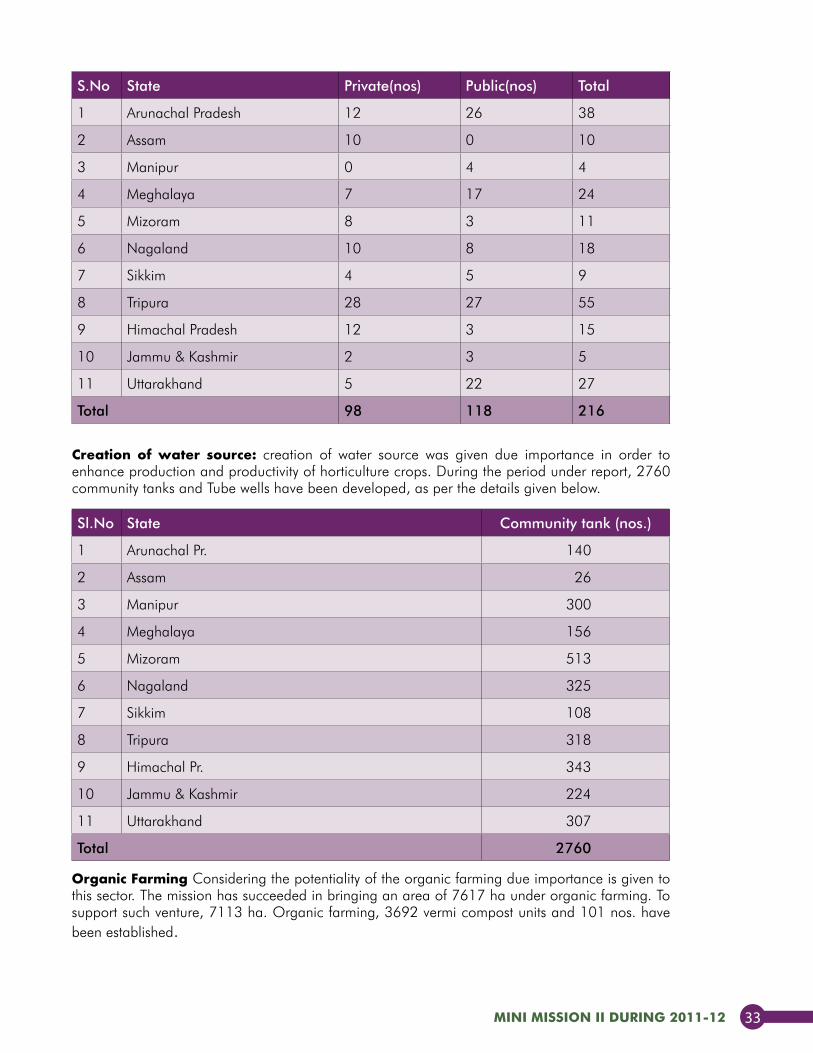
Establishment of nursery: production of genuine and true to type planting material is one of the most important components of any development scheme. As many as 216 (big/small) both in public (118) and private (98) sector have been set up.
mini miSSiOn ii DurinG 2011-12 33
S.No State Private(nos) Public(nos) Total
1 Arunachal Pradesh 12 26 38
2 Assam 10 0 10
3 Manipur 0 4 4
4 Meghalaya 7 17 24
5 Mizoram 8 3 11
6 Nagaland 10 8 18
7 Sikkim 4 5 9
8 Tripura 28 27 55
9 Himachal Pradesh 12 3 15
10 Jammu & Kashmir 2 3 5
11 Uttarakhand 5 22 27
Total 98 118 216
Creation of water source: creation of water source was given due importance in order to enhance production and productivity of horticulture crops. During the period under report, 2760 community tanks and Tube wells have been developed, as per the details given below.
Sl.No State Community tank (nos.)
1 Arunachal Pr. 140
2 Assam 26
3 Manipur 300
4 Meghalaya 156
5 Mizoram 513
6 Nagaland 325
7 Sikkim 108
8 Tripura 318
9 Himachal Pr. 343
10 Jammu & Kashmir 224
11 Uttarakhand 307
Total 2760
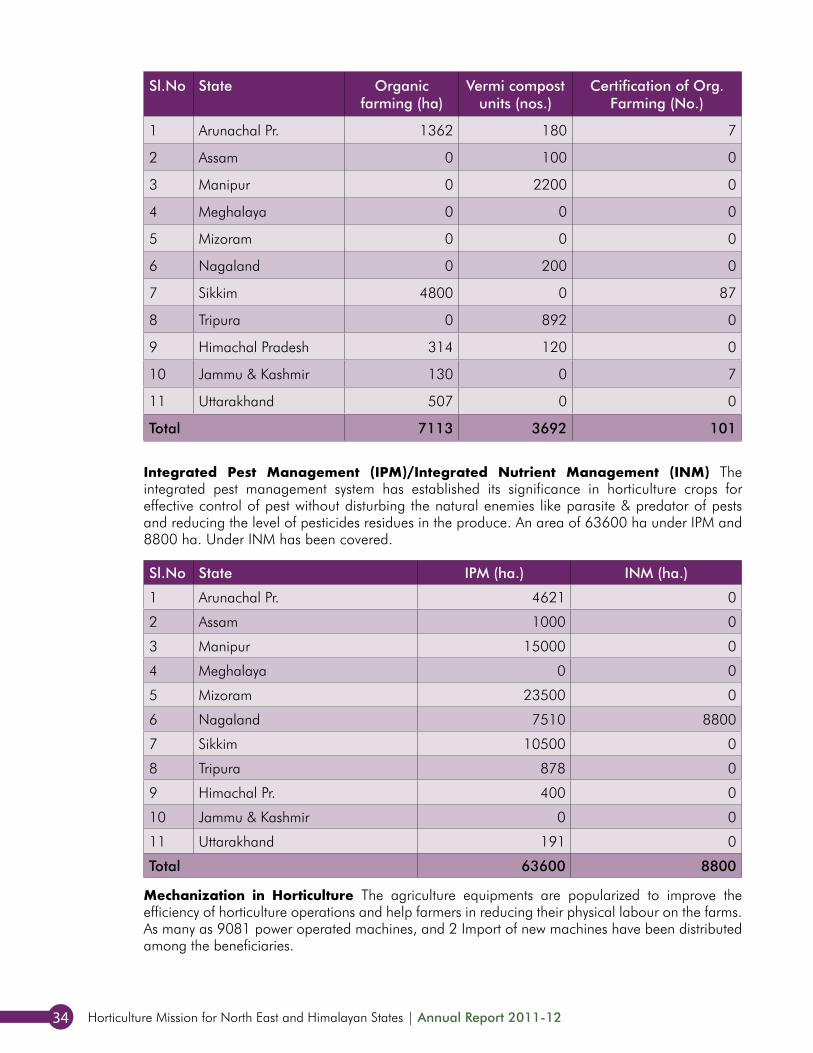
Organic Farming Considering the potentiality of the organic farming due importance is given to this sector. The mission has succeeded in bringing an area of 7617 ha under organic farming. To support such venture, 7113 ha. Organic farming, 3692 vermi compost units and 101 nos. have been established.
Horticulture Mission for North East and Himalayan States | Annual Report 2011-1234
Sl.No State Organic farming (ha)
Vermi compost units (nos.)
Certification of Org. Farming (No.)
1 Arunachal Pr. 1362 180 7
2 Assam 0 100 0
3 Manipur 0 2200 0
4 Meghalaya 0 0 0
5 Mizoram 0 0 0
6 Nagaland 0 200 0
7 Sikkim 4800 0 87
8 Tripura 0 892 0
9 Himachal Pradesh 314 120 0
10 Jammu & Kashmir 130 0 7
11 Uttarakhand 507 0 0
Total 7113 3692 101
Integrated Pest Management (IPM)/Integrated Nutrient Management (INM) The integrated pest management system has established its significance in horticulture crops for effective control of pest without disturbing the natural enemies like parasite & predator of pests and reducing the level of pesticides residues in the produce. An area of 63600 ha under IPM and 8800 ha. Under INM has been covered.
Sl.No State IPM (ha.) INM (ha.)
1 Arunachal Pr. 4621 0
2 Assam 1000 0
3 Manipur 15000 0
4 Meghalaya 0 0
5 Mizoram 23500 0
6 Nagaland 7510 8800
7 Sikkim 10500 0
8 Tripura 878 0
9 Himachal Pr. 400 0
10 Jammu & Kashmir 0 0
11 Uttarakhand 191 0
Total 63600 8800
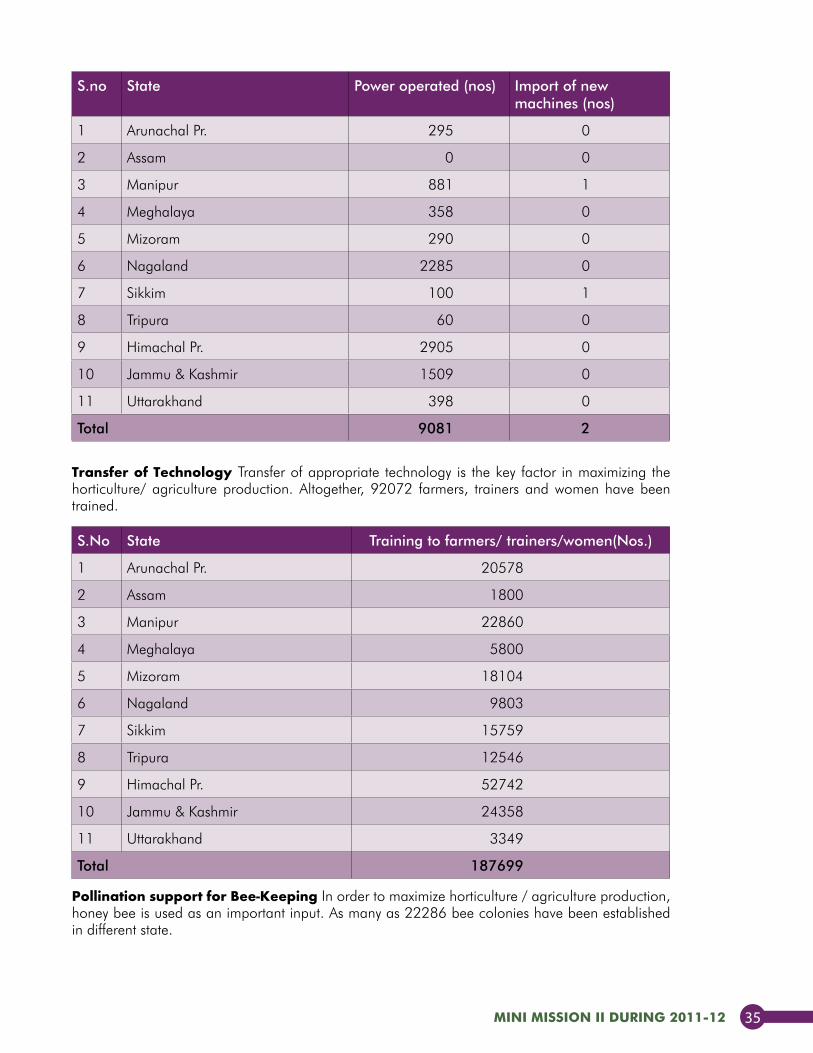
Mechanization in Horticulture The agriculture equipments are popularized to improve the efficiency of horticulture operations and help farmers in reducing their physical labour on the farms. As many as 9081 power operated machines, and 2 Import of new machines have been distributed among the beneficiaries.
mini miSSiOn ii DurinG 2011-12 35
S.no State Power operated (nos) Import of new machines (nos)
1 Arunachal Pr. 295 0
2 Assam 0 0
3 Manipur 881 1
4 Meghalaya 358 0
5 Mizoram 290 0
6 Nagaland 2285 0
7 Sikkim 100 1
8 Tripura 60 0
9 Himachal Pr. 2905 0
10 Jammu & Kashmir 1509 0
11 Uttarakhand 398 0
Total 9081 2
Transfer of Technology Transfer of appropriate technology is the key factor in maximizing the horticulture/ agriculture production. Altogether, 92072 farmers, trainers and women have been trained.
S.No State Training to farmers/ trainers/women(Nos.)
1 Arunachal Pr. 20578
2 Assam 1800
3 Manipur 22860
4 Meghalaya 5800
5 Mizoram 18104
6 Nagaland 9803
7 Sikkim 15759
8 Tripura 12546
9 Himachal Pr. 52742
10 Jammu & Kashmir 24358
11 Uttarakhand 3349
Total 187699
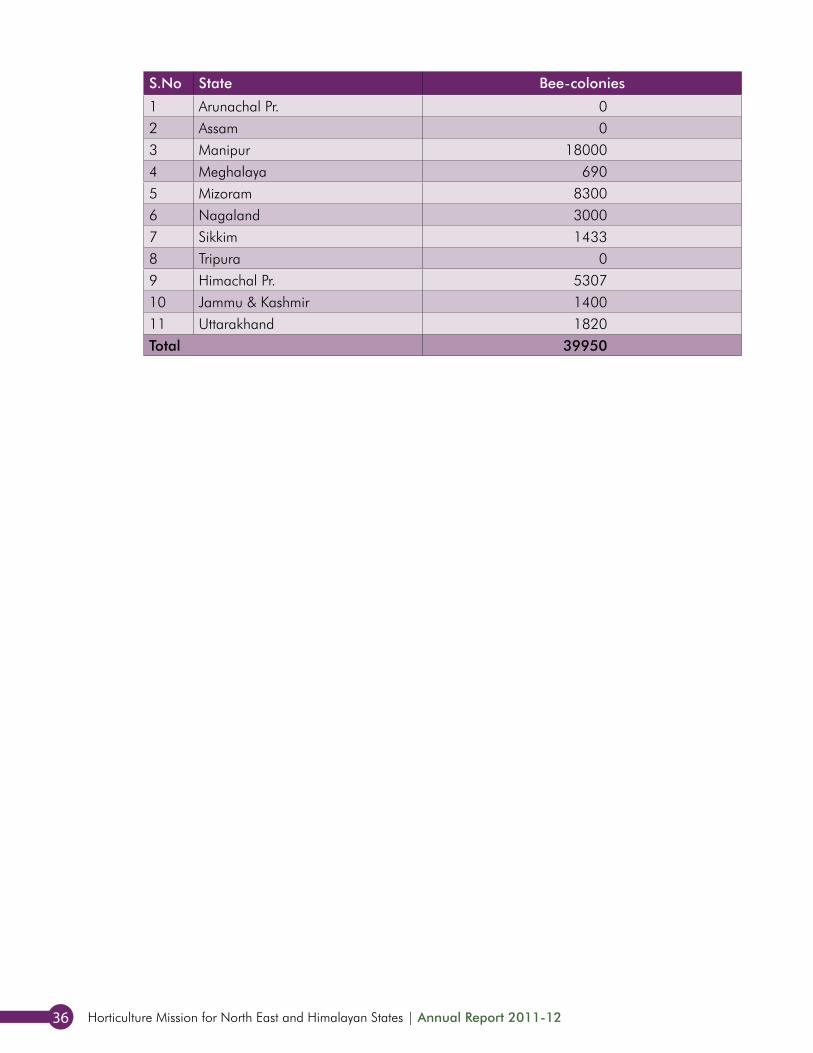
Pollination support for Bee-Keeping In order to maximize horticulture / agriculture production, honey bee is used as an important input. As many as 22286 bee colonies have been established in different state.
Horticulture Mission for North East and Himalayan States | Annual Report 2011-1236
S.No State Bee-colonies
1 Arunachal Pr. 02 Assam 03 Manipur 180004 Meghalaya 6905 Mizoram 83006 Nagaland 30007 Sikkim 14338 Tripura 09 Himachal Pr. 530710 Jammu & Kashmir 140011 Uttarakhand 1820Total 39950
Chapter 5Mission III During 2011-12 (SFAC)
Chap t e r 5 Mission III During 2011-12 (SFAC)
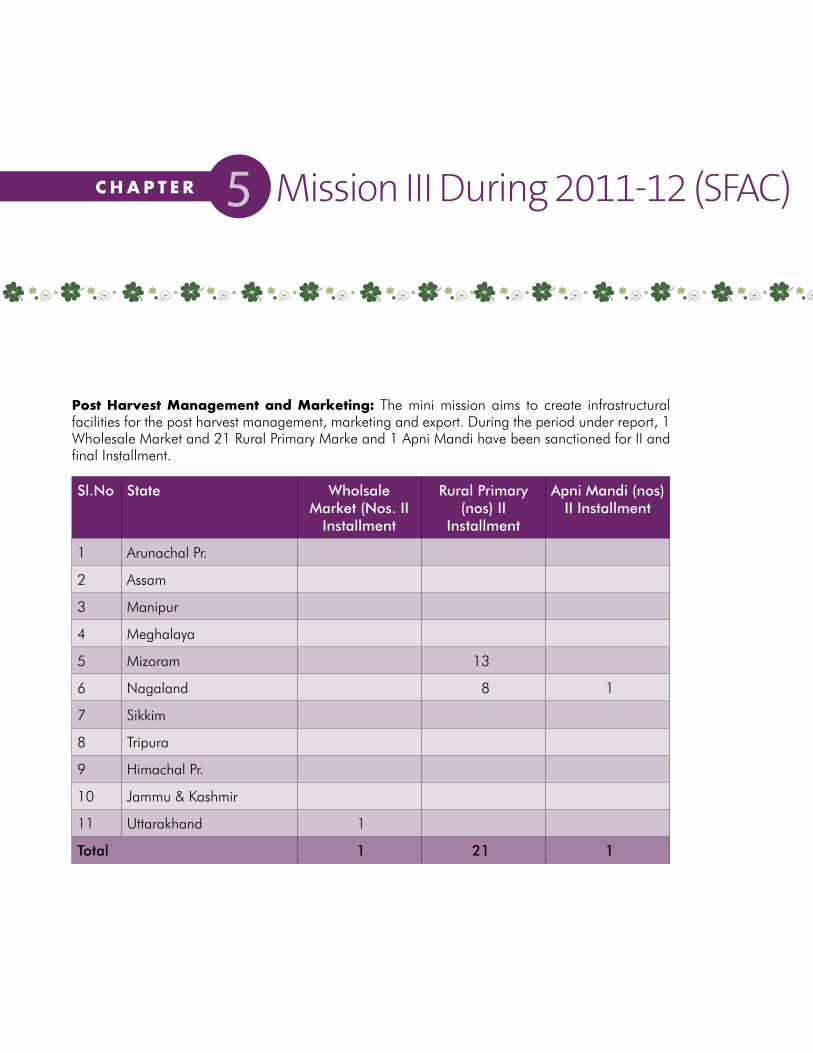
Post Harvest Management and Marketing: The mini mission aims to create infrastructural facilities for the post harvest management, marketing and export. During the period under report, 1 Wholesale Market and 21 Rural Primary Marke and 1 Apni Mandi have been sanctioned for II and final Installment.
Sl.No State Wholsale Market (Nos. II
Installment
Rural Primary (nos) II
Installment
Apni Mandi (nos) II Installment
1 Arunachal Pr.
2 Assam
3 Manipur
4 Meghalaya
5 Mizoram 13
6 Nagaland 8 1
7 Sikkim
8 Tripura
9 Himachal Pr.
10 Jammu & Kashmir
11 Uttarakhand 1
Total 1 21 1

Chapter 6Mini Mission IV During 2011-12
Chap t e r 6 Mini Mission IV During 2011-12
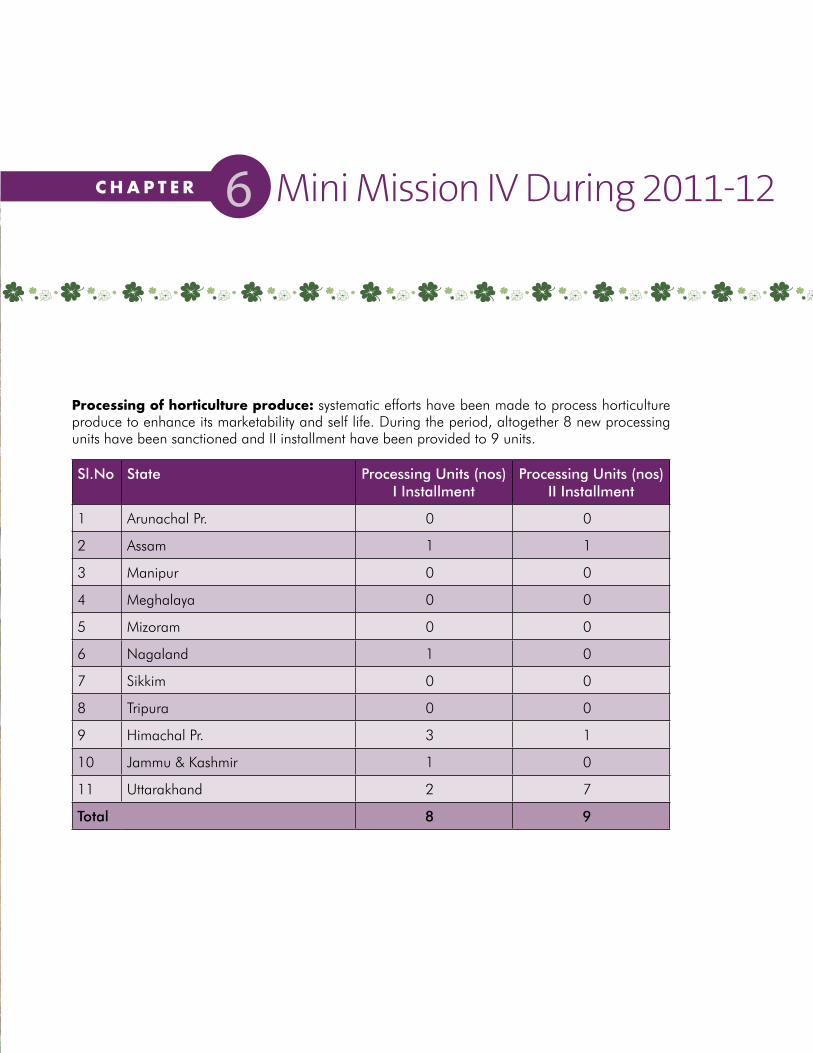
Processing of horticulture produce: systematic efforts have been made to process horticulture produce to enhance its marketability and self life. During the period, altogether 8 new processing units have been sanctioned and II installment have been provided to 9 units.
Sl.No State Processing Units (nos) I Installment
Processing Units (nos) II Installment
1 Arunachal Pr. 0 0
2 Assam 1 1
3 Manipur 0 0
4 Meghalaya 0 0
5 Mizoram 0 0
6 Nagaland 1 0
7 Sikkim 0 0
8 Tripura 0 0
9 Himachal Pr. 3 1
10 Jammu & Kashmir 1 0
11 Uttarakhand 2 7
Total 8 9
Success Stories
Sikkim 47
S u C C E S S S T O R I E S Sikkim
136
TECHNOLOGY MISSION FOR INTEGRATED DEVELOPMENT OF HORTICULTURE
ANNUAL REPORT 2006–07
TECHNOLOGY MISSION FOR INTEGRATED DEVELOPMENT OF HORTICULTURE
ANNUAL REPORT 2008–09
SIKKIM
SUCCESS STORIES
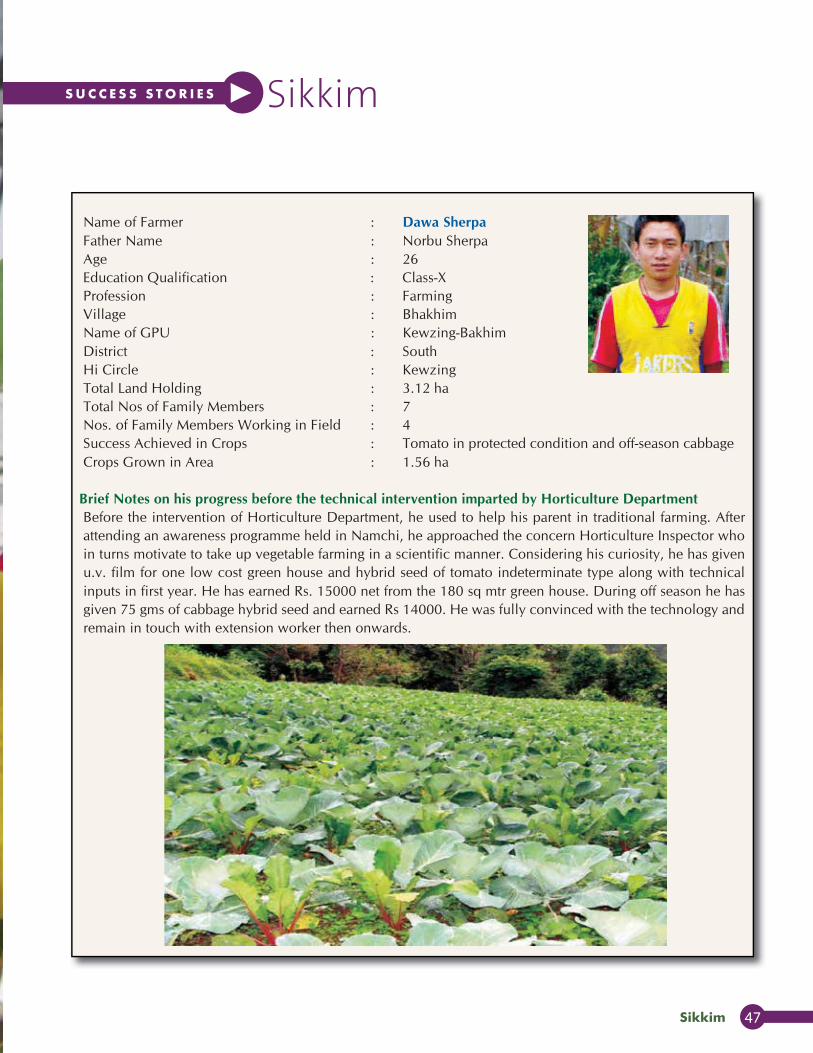
Name of Farmer : Dawa SherpaFather Name : Norbu SherpaAge : 26Education Qualification : Class-XProfession : FarmingVillage : BhakhimName of GPU : Kewzing-BakhimDistrict : SouthHi Circle : KewzingTotal Land Holding : 3.12 haTotal Nos of Family Members : 7Nos. of Family Members Working in Field : 4Success Achieved in Crops : Tomato in protected condition and off-season cabbageCrops Grown in Area : 1.56 ha
Brief Notes on his progress before the technical intervention imparted by Horticulture DepartmentBefore the intervention of Horticulture Department, he used to help his parent in traditional farming. Afterattending an awareness programme held in Namchi, he approached the concern Horticulture Inspector whoin turns motivate to take up vegetable farming in a scientific manner. Considering his curiosity, he has givenu.v. film for one low cost green house and hybrid seed of tomato indeterminate type along with technicalinputs in first year. He has earned Rs. 15000 net from the 180 sq mtr green house. During off season he hasgiven 75 gms of cabbage hybrid seed and earned Rs 14000. He was fully convinced with the technology andremain in touch with extension worker then onwards.
Horticulture Mission for North East and Himalayan States | Annual Report 2011-1248
S u C C E S S S T O R I E S
ANNUAL REPORT 2008–09
137
SUCCESS STORIES - SIKKIM
SUCCESS STORIES
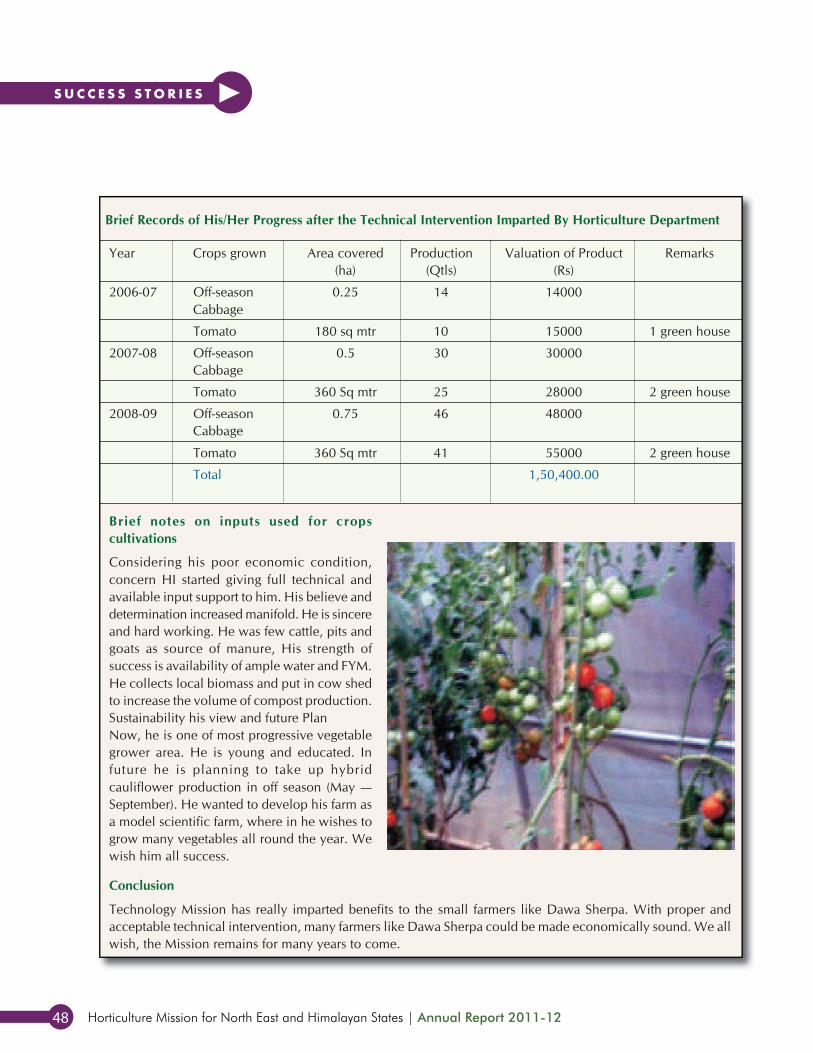
Brief Records of His/Her Progress after the Technical Intervention Imparted By Horticulture Department
Year Crops grown Area covered Production Valuation of Product Remarks(ha) (Qtls) (Rs)
2006-07 Off-season 0.25 14 14000Cabbage
Tomato 180 sq mtr 10 15000 1 green house
2007-08 Off-season 0.5 30 30000Cabbage
Tomato 360 Sq mtr 25 28000 2 green house
2008-09 Off-season 0.75 46 48000Cabbage
Tomato 360 Sq mtr 41 55000 2 green house
Total 1,50,400.00
Brief notes on inputs used for cropscultivations
Considering his poor economic condition,concern HI started giving full technical andavailable input support to him. His believe anddetermination increased manifold. He is sincereand hard working. He was few cattle, pits andgoats as source of manure, His strength ofsuccess is availability of ample water and FYM.He collects local biomass and put in cow shedto increase the volume of compost production.Sustainability his view and future PlanNow, he is one of most progressive vegetablegrower area. He is young and educated. Infuture he is planning to take up hybridcauliflower production in off season (May —September). He wanted to develop his farm asa model scientific farm, where in he wishes togrow many vegetables all round the year. Wewish him all success.
Conclusion
Technology Mission has really imparted benefits to the small farmers like Dawa Sherpa. With proper andacceptable technical intervention, many farmers like Dawa Sherpa could be made economically sound. We allwish, the Mission remains for many years to come.

Sikkim 49
S u C C E S S S T O R I E S
138
TECHNOLOGY MISSION FOR INTEGRATED DEVELOPMENT OF HORTICULTURE
ANNUAL REPORT 2006–07
TECHNOLOGY MISSION FOR INTEGRATED DEVELOPMENT OF HORTICULTURE
ANNUAL REPORT 2008–09
SUCCESS STORIES
Name of Farmer : Dhanapati SharmaFather Name : Khara Nanda SharmaAge : 47 YearsEducation Qualification : Class VIIProfession : FarmingVillage : DongName of GPU : Poklok-DenchungDistrict : SouthHi Circle : PoklokTotal Land Holding : 2.3 HaTotal Nos of Family Members : 6Nos. of Family Members Working in Field : 3Success Achieved in Crops : Off-season Tomato, Cherry pepper, Rabi Vegetables &
BananaCrops Grown in Area : 2.10 ha
History Told about Pre TM Period
Before the year 2001-02, he used to grow only maize crop in his entire field during kharif. In rest of the seasonfield used to remain, wherein, cattle and goats of the villages used to pasture on it. He had no any source ofincome and was living in pathetic condition. He had to work as labourers to earn daily wages. He attendedfirst awareness programme held at namchi. Immediately, next day, he approached in the office of Joint DirectorSouth, who has given lots of idea to earn livelihood through farming. He also instructed the concern DeputyDirector and field staff to provide all possible supports. He has been invited to attend various trainings sessionand also sent to HTC Puna for training. As a result he is doing scientific cultivation of cherry pepper, tomatoand rabi vegetable and earning his livelihood.
Brief Records of his Progress after the Technical Intervention By Horticulture Department
Years Crops grown Area covered Production Valuation of product Remarks(Ha) (Qtls) (Rs)
2007-08 Tomato 0.50 250 325000
Cherry pepper 0.25 35 28000
Rabi vegetable 1.00 55 61000
2008-09 Tomato 0.50 275 412500
Cherry pepper 0.25 36 29050
Rabi vegetables 1.25 65 45800
Total 901350
Horticulture Mission for North East and Himalayan States | Annual Report 2011-1250
S u C C E S S S T O R I E S
ANNUAL REPORT 2008–09
139
SUCCESS STORIES - SIKKIM
SUCCESS STORIES
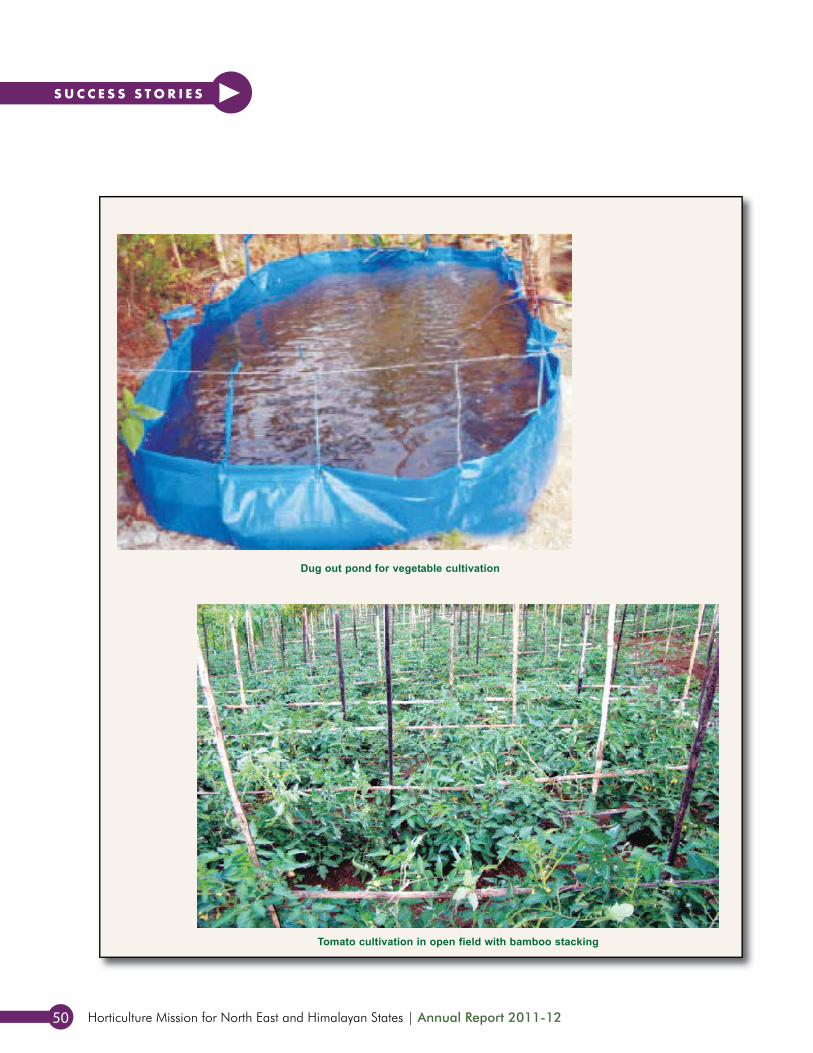
Dug out pond for vegetable cultivation
Tomato cultivation in open field with bamboo stacking
Sikkim 51
S u C C E S S S T O R I E S
140
TECHNOLOGY MISSION FOR INTEGRATED DEVELOPMENT OF HORTICULTURE
ANNUAL REPORT 2006–07
TECHNOLOGY MISSION FOR INTEGRATED DEVELOPMENT OF HORTICULTURE
ANNUAL REPORT 2008–09
SUCCESS STORIES
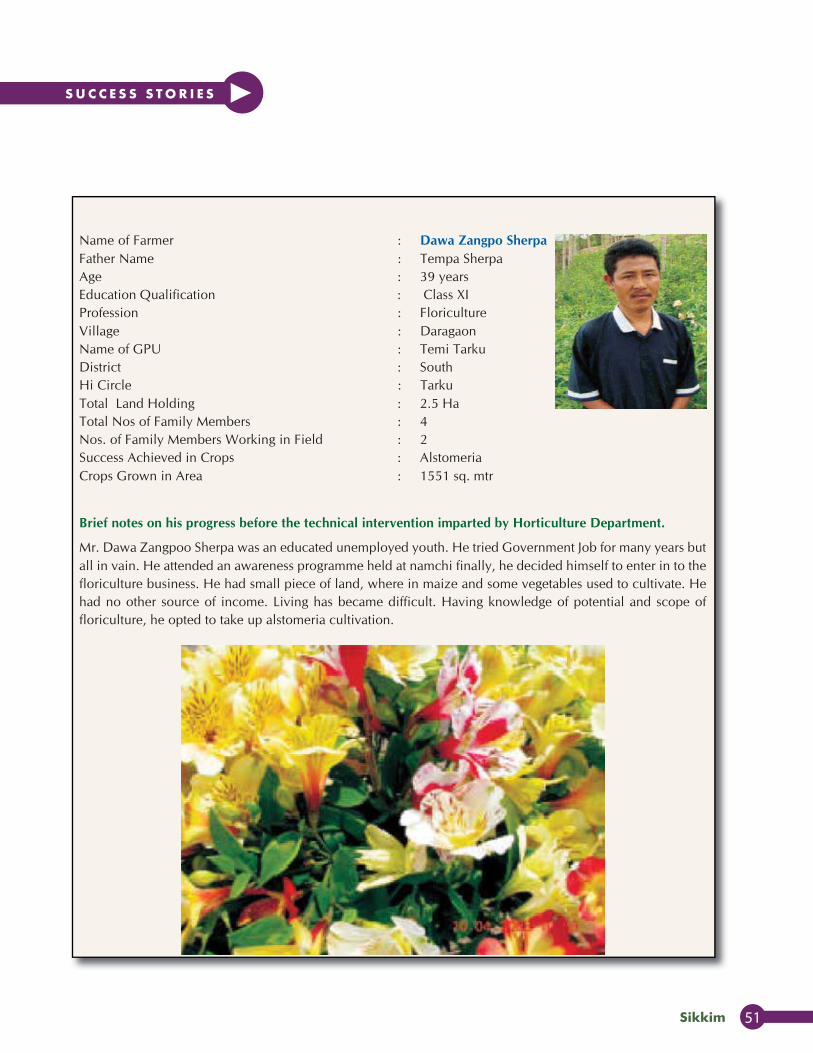
Name of Farmer : Dawa Zangpo SherpaFather Name : Tempa SherpaAge : 39 yearsEducation Qualification : Class XIProfession : FloricultureVillage : DaragaonName of GPU : Temi TarkuDistrict : SouthHi Circle : TarkuTotal Land Holding : 2.5 HaTotal Nos of Family Members : 4Nos. of Family Members Working in Field : 2Success Achieved in Crops : AlstomeriaCrops Grown in Area : 1551 sq. mtr
Brief notes on his progress before the technical intervention imparted by Horticulture Department.
Mr. Dawa Zangpoo Sherpa was an educated unemployed youth. He tried Government Job for many years butall in vain. He attended an awareness programme held at namchi finally, he decided himself to enter in to thefloriculture business. He had small piece of land, where in maize and some vegetables used to cultivate. Hehad no other source of income. Living has became difficult. Having knowledge of potential and scope offloriculture, he opted to take up alstomeria cultivation.
Horticulture Mission for North East and Himalayan States | Annual Report 2011-1252
S u C C E S S S T O R I E S
ANNUAL REPORT 2008–09
141
SUCCESS STORIES - SIKKIM
SUCCESS STORIES
How to success achieved
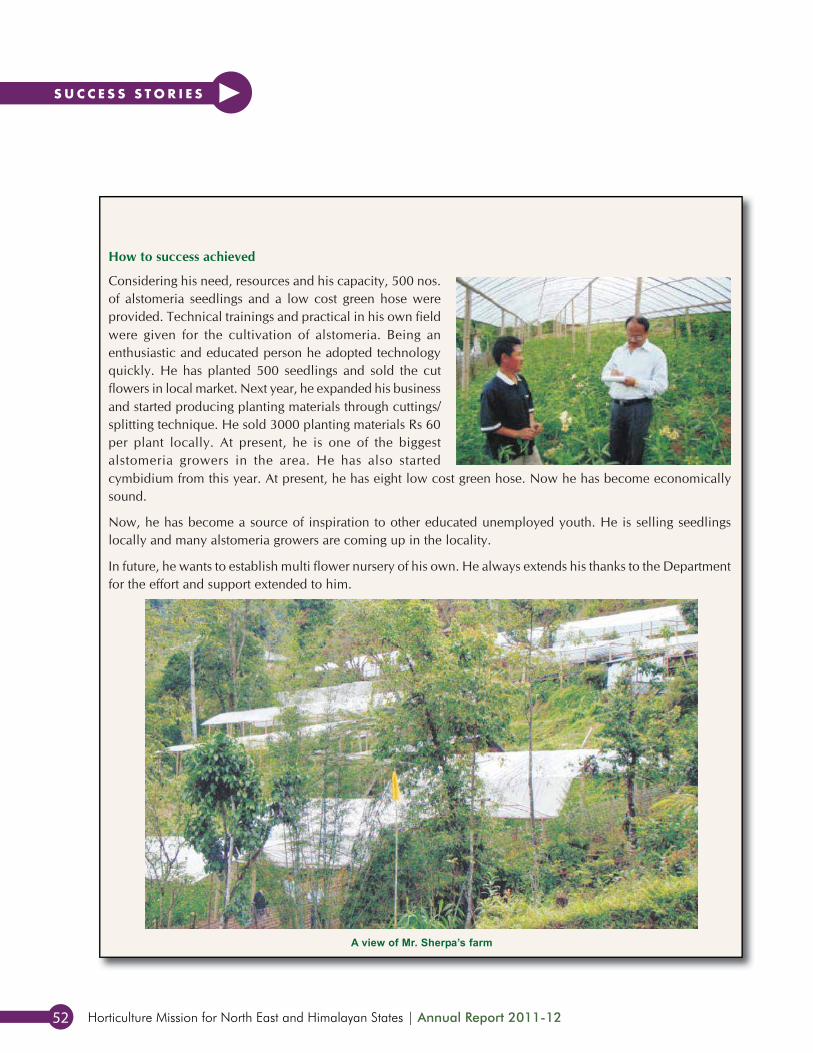
Considering his need, resources and his capacity, 500 nos.of alstomeria seedlings and a low cost green hose wereprovided. Technical trainings and practical in his own fieldwere given for the cultivation of alstomeria. Being anenthusiastic and educated person he adopted technologyquickly. He has planted 500 seedlings and sold the cutflowers in local market. Next year, he expanded his businessand started producing planting materials through cuttings/splitting technique. He sold 3000 planting materials Rs 60per plant locally. At present, he is one of the biggestalstomeria growers in the area. He has also startedcymbidium from this year. At present, he has eight low cost green hose. Now he has become economicallysound.
Now, he has become a source of inspiration to other educated unemployed youth. He is selling seedlingslocally and many alstomeria growers are coming up in the locality.
In future, he wants to establish multi flower nursery of his own. He always extends his thanks to the Departmentfor the effort and support extended to him.
A view of Mr. Sherpa’s farm
Sikkim 53
S u C C E S S S T O R I E S
142
TECHNOLOGY MISSION FOR INTEGRATED DEVELOPMENT OF HORTICULTURE
ANNUAL REPORT 2006–07
TECHNOLOGY MISSION FOR INTEGRATED DEVELOPMENT OF HORTICULTURE
ANNUAL REPORT 2008–09
SUCCESS STORIES
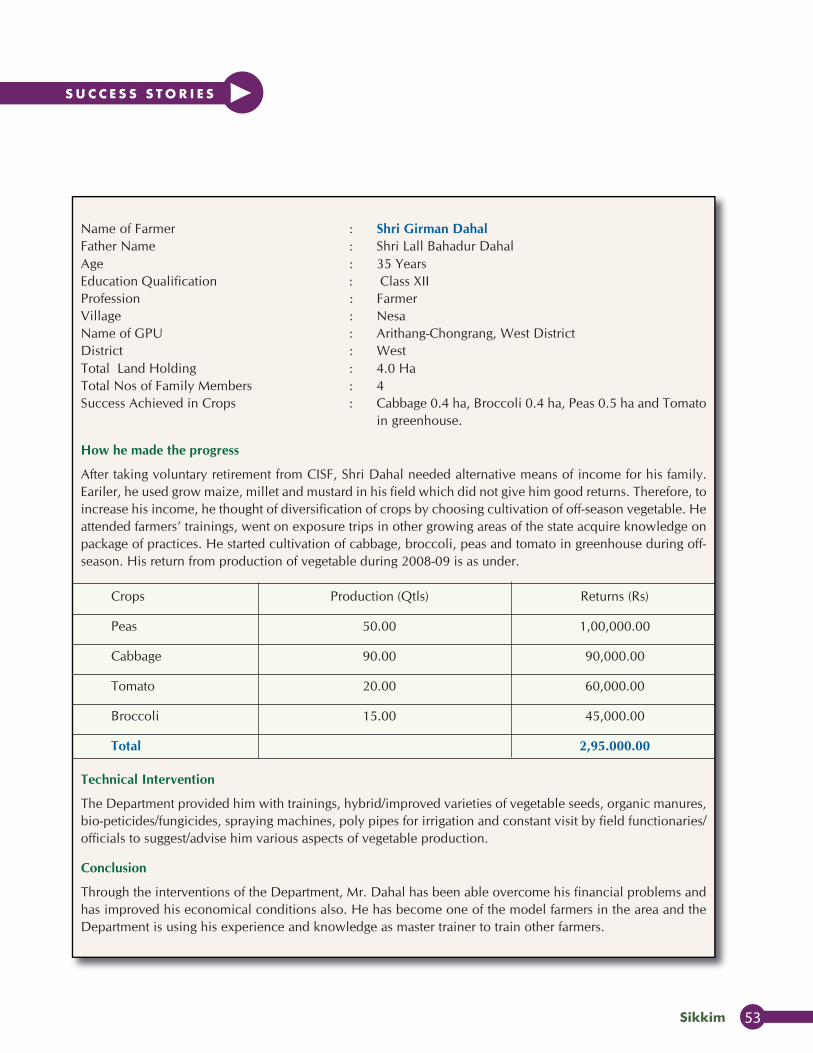
Name of Farmer : Shri Girman DahalFather Name : Shri Lall Bahadur DahalAge : 35 YearsEducation Qualification : Class XIIProfession : FarmerVillage : NesaName of GPU : Arithang-Chongrang, West DistrictDistrict : WestTotal Land Holding : 4.0 HaTotal Nos of Family Members : 4Success Achieved in Crops : Cabbage 0.4 ha, Broccoli 0.4 ha, Peas 0.5 ha and Tomato
in greenhouse.
How he made the progress
After taking voluntary retirement from CISF, Shri Dahal needed alternative means of income for his family.Eariler, he used grow maize, millet and mustard in his field which did not give him good returns. Therefore, toincrease his income, he thought of diversification of crops by choosing cultivation of off-season vegetable. Heattended farmers’ trainings, went on exposure trips in other growing areas of the state acquire knowledge onpackage of practices. He started cultivation of cabbage, broccoli, peas and tomato in greenhouse during off-season. His return from production of vegetable during 2008-09 is as under.
Crops Production (Qtls) Returns (Rs)
Peas 50.00 1,00,000.00
Cabbage 90.00 90,000.00
Tomato 20.00 60,000.00
Broccoli 15.00 45,000.00
Total 2,95.000.00
Technical Intervention
The Department provided him with trainings, hybrid/improved varieties of vegetable seeds, organic manures,bio-peticides/fungicides, spraying machines, poly pipes for irrigation and constant visit by field functionaries/officials to suggest/advise him various aspects of vegetable production.
Conclusion
Through the interventions of the Department, Mr. Dahal has been able overcome his financial problems andhas improved his economical conditions also. He has become one of the model farmers in the area and theDepartment is using his experience and knowledge as master trainer to train other farmers.

Horticulture Mission for North East and Himalayan States | Annual Report 2011-1254
S u C C E S S S T O R I E S
ANNUAL REPORT 2008–09
143
SUCCESS STORIES - SIKKIM
SUCCESS STORIES
Name of Farmer : Shri Laxmi BistaAge : 33 yearEducation Qualification : GraduateProfession : FarmerVillage : HeeGram Panchayat Unit : Hee Patal, West DistrictTotal Land Holding : 5.5 haTotal Nos of Family Members : 4Crops Grown in Area : Large cardamom nursery; 1.5 ha
How he made the progress
After graduation, instead of seeking for white collar job, he approached the officials of the Horticulture Departmentfor suggesting him to take up suitable crops for better earning. The department official visited his field andconsidering all the factors came to the conculsion that establishment of nursery for large cardamom was foundto the best options. Mr. Bista was provided with all the assistance under technology Mission for establishmentof cardamom nursery under Private Sector. During 2008-09, he sold 3 lakh number of quality seedlings of largecardamom @ Rs 2.00 per seedlings thereby earning Rs. 6.00 lakh. He was very much happy to receive such ahuge amount. Now he is determined to take up other horticultural activities also as he is convinced thathorticultural crops are the most beneficial to the farmers.
Jammu & Kashmir 55
S u C C E S S S T O R I E S Jammu & Kashmir
150
TECHNOLOGY MISSION FOR INTEGRATED DEVELOPMENT OF HORTICULTURE
ANNUAL REPORT 2006–07
TECHNOLOGY MISSION FOR INTEGRATED DEVELOPMENT OF HORTICULTURE
ANNUAL REPORT 2008–09
JAMMU & KASHMIR
SUCCESS STORIES
SELF HELP GROUP OF LADIES TRAINED IN FRUIT AND VEGETABLE PROCESSINGFour ladies of village Kultoora (Handwara) District Kupwara were trained in fruit and vegetable processing in2007-08. They established an unit, registered it with District Industries Kupwara as Malik Enterprises. Procuredtomato fruit from their own village in 2008-09, made tomato purie from it and earned Rs. 80000. The target forthe year 2009-10 has been fixed at Rs 5.00 lakh.
CONVENRSION OF LAND UNDER CANNABIS (BUNG) INTO APPLE ORCHARDS INDISTRICT SHOPIAN
140 hectares of land under cultivation of cannabis (bung) at village Melhur (Zainapora) District Shopian hasbeen converted into Apple orchards during 2008-09 after motivating the land owners by the field functionariesof the department.
CREATION OF IRRIGATION INFRASTRUCTURE BY LAYING PIPE SYSTEMOne four inch dia-pipe system has been laid in village Tulran (Imam Sahib) District Shopian during 2006-07.The source of water lying in deep gorge has been trapped into the pipe system. This has irrigated 250 Kanals oforchard area located at Kerewa. The irrigation system so installed has improved quality of fruit during 2007-08and 2008-09. This achievement has become an eye opener to visitors.
INDUCING FRUIT BEARING IN OLIVE ORCHARD LOCATED AT CHENANI UDHAMPUR1.5 hactares of land was brought under olive plantation at Chenani in 1992. Due to lack of irrigation facilitiesthe orchard did not bear any fruit. One water storage tank has ben constructed in the orchard during 2005-06,since then the orchard has been bearing olive fruit regularly.
Horticulture Mission for North East and Himalayan States | Annual Report 2011-1256
S u C C E S S S T O R I E S
ANNUAL REPORT 2008–09
151
SUCCESS STORIES - JAMMU & KASHMIR
SUCCESS STORIES
ESTABLISHMENT OF TWO FRUIT PLANT NURSERIES UNDER PRIVATE SECTOR INDISTRICT SHOPIAN FOR EMPLOYMENT GENERATION
Year establishment : 2005-06
Area covered : 0.2 hectare each
Expenditure incurred on input material : Rs. 33820 and Rs. 33840
Kind/No. of plants produced : Apple = 9200 Nos. and 10100 Nos.
Income generated : Rs. 184000 and Rs 202000
manipur 57
S u C C E S S S T O R I E S ManipurANNUAL REPORT 2008–09
125
SUCCESS STORIES - MANIUR
MANIPUR
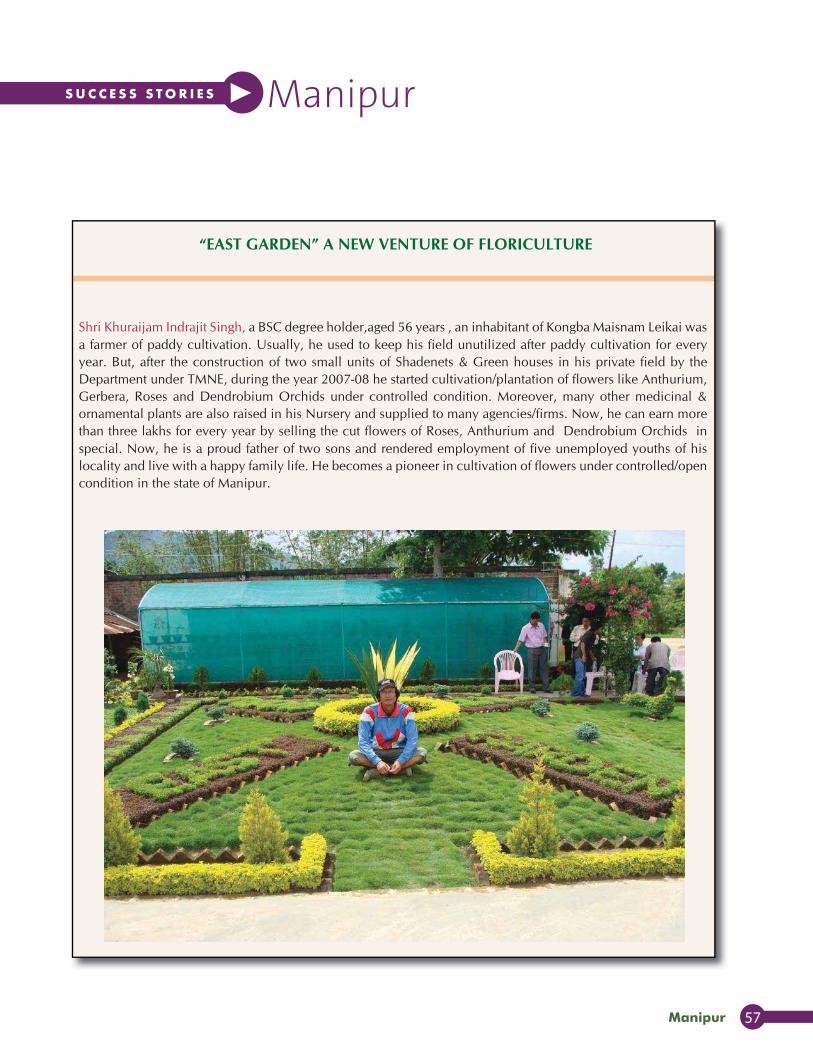
“EAST GARDEN” A NEW VENTURE OF FLORICULTURE
SUCCESS STORIES
Shri Khuraijam Indrajit Singh, a BSC degree holder,aged 56 years , an inhabitant of Kongba Maisnam Leikai wasa farmer of paddy cultivation. Usually, he used to keep his field unutilized after paddy cultivation for everyyear. But, after the construction of two small units of Shadenets & Green houses in his private field by theDepartment under TMNE, during the year 2007-08 he started cultivation/plantation of flowers like Anthurium,Gerbera, Roses and Dendrobium Orchids under controlled condition. Moreover, many other medicinal &ornamental plants are also raised in his Nursery and supplied to many agencies/firms. Now, he can earn morethan three lakhs for every year by selling the cut flowers of Roses, Anthurium and Dendrobium Orchids inspecial. Now, he is a proud father of two sons and rendered employment of five unemployed youths of hislocality and live with a happy family life. He becomes a pioneer in cultivation of flowers under controlled/opencondition in the state of Manipur.
Horticulture Mission for North East and Himalayan States | Annual Report 2011-1258
S u C C E S S S T O R I E S
126
TECHNOLOGY MISSION FOR INTEGRATED DEVELOPMENT OF HORTICULTURE
ANNUAL REPORT 2006–07
TECHNOLOGY MISSION FOR INTEGRATED DEVELOPMENT OF HORTICULTURE
ANNUAL REPORT 2008–09
SUCCESS STORIES
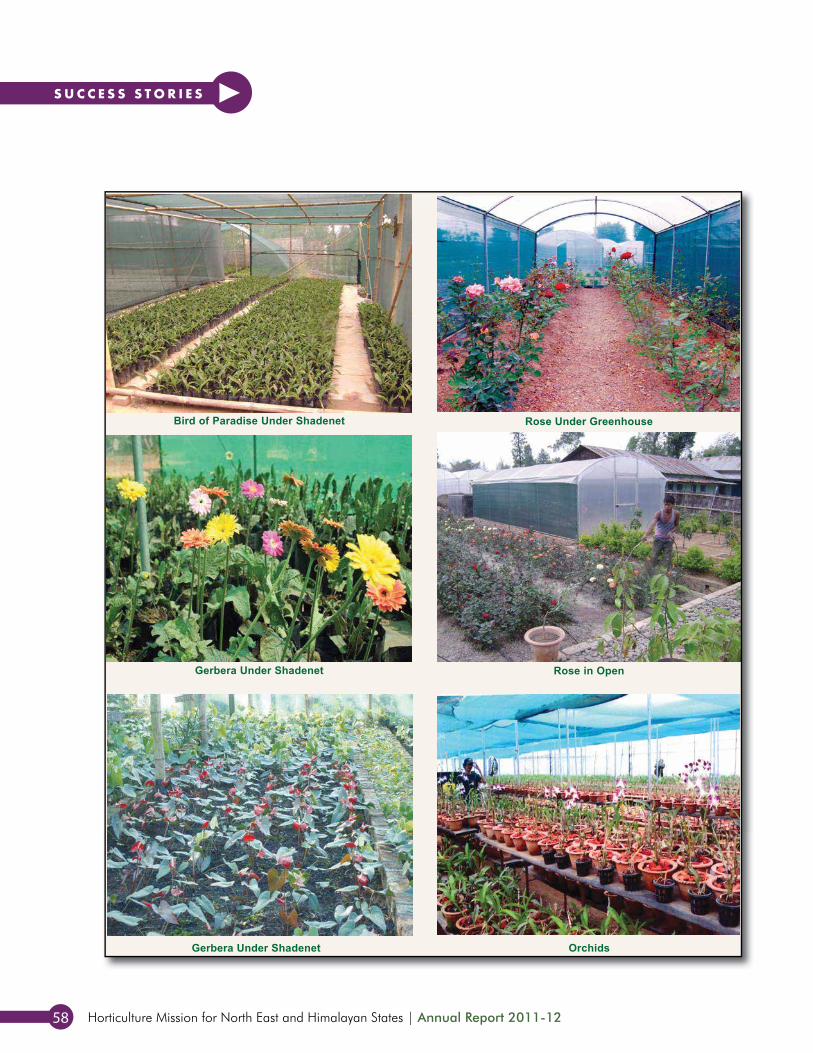
Bird of Paradise Under Shadenet Rose Under Greenhouse
Rose in OpenGerbera Under Shadenet
Gerbera Under Shadenet Orchids
manipur 59
S u C C E S S S T O R I E SANNUAL REPORT 2008–09
127
SUCCESS STORIES - MANIUR
SUCCESS STORIES
VEGETABLE
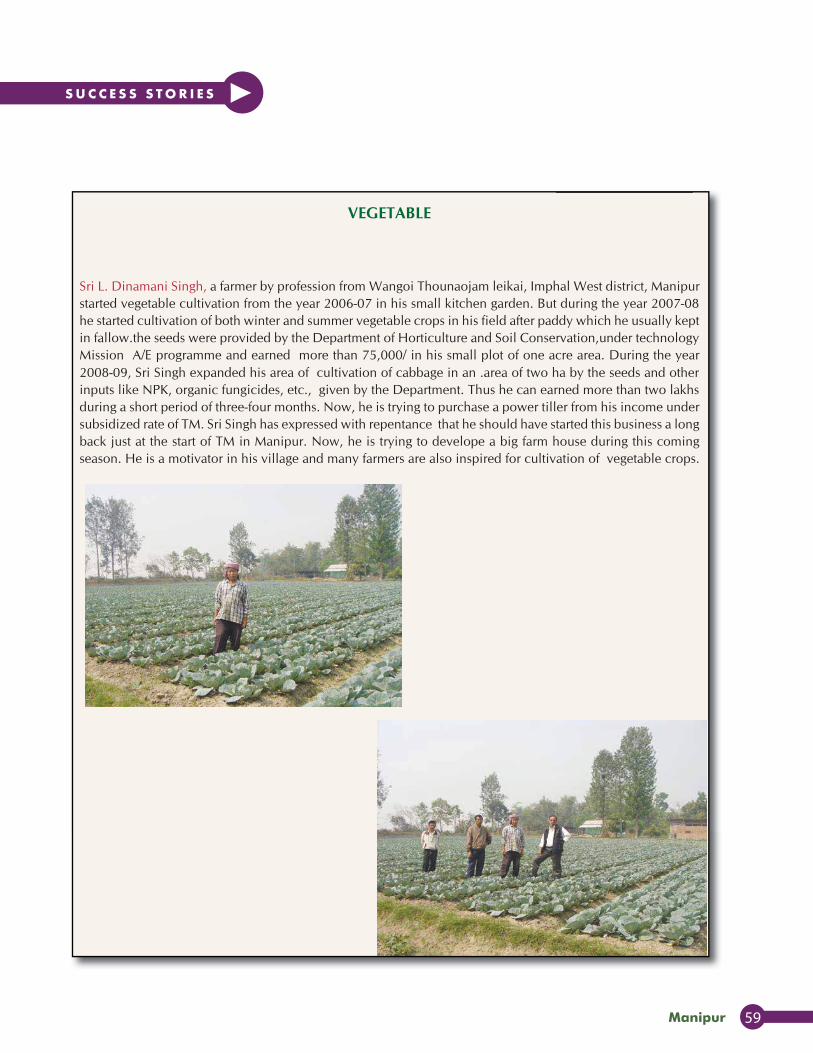
Sri L. Dinamani Singh, a farmer by profession from Wangoi Thounaojam leikai, Imphal West district, Manipurstarted vegetable cultivation from the year 2006-07 in his small kitchen garden. But during the year 2007-08he started cultivation of both winter and summer vegetable crops in his field after paddy which he usually keptin fallow.the seeds were provided by the Department of Horticulture and Soil Conservation,under technologyMission A/E programme and earned more than 75,000/ in his small plot of one acre area. During the year2008-09, Sri Singh expanded his area of cultivation of cabbage in an .area of two ha by the seeds and otherinputs like NPK, organic fungicides, etc., given by the Department. Thus he can earned more than two lakhsduring a short period of three-four months. Now, he is trying to purchase a power tiller from his income undersubsidized rate of TM. Sri Singh has expressed with repentance that he should have started this business a longback just at the start of TM in Manipur. Now, he is trying to develope a big farm house during this comingseason. He is a motivator in his village and many farmers are also inspired for cultivation of vegetable crops.
Horticulture Mission for North East and Himalayan States | Annual Report 2011-1260
S u C C E S S S T O R I E S
128
TECHNOLOGY MISSION FOR INTEGRATED DEVELOPMENT OF HORTICULTURE
ANNUAL REPORT 2006–07
TECHNOLOGY MISSION FOR INTEGRATED DEVELOPMENT OF HORTICULTURE
ANNUAL REPORT 2008–09
SUCCESS STORIES
VEGETABLE
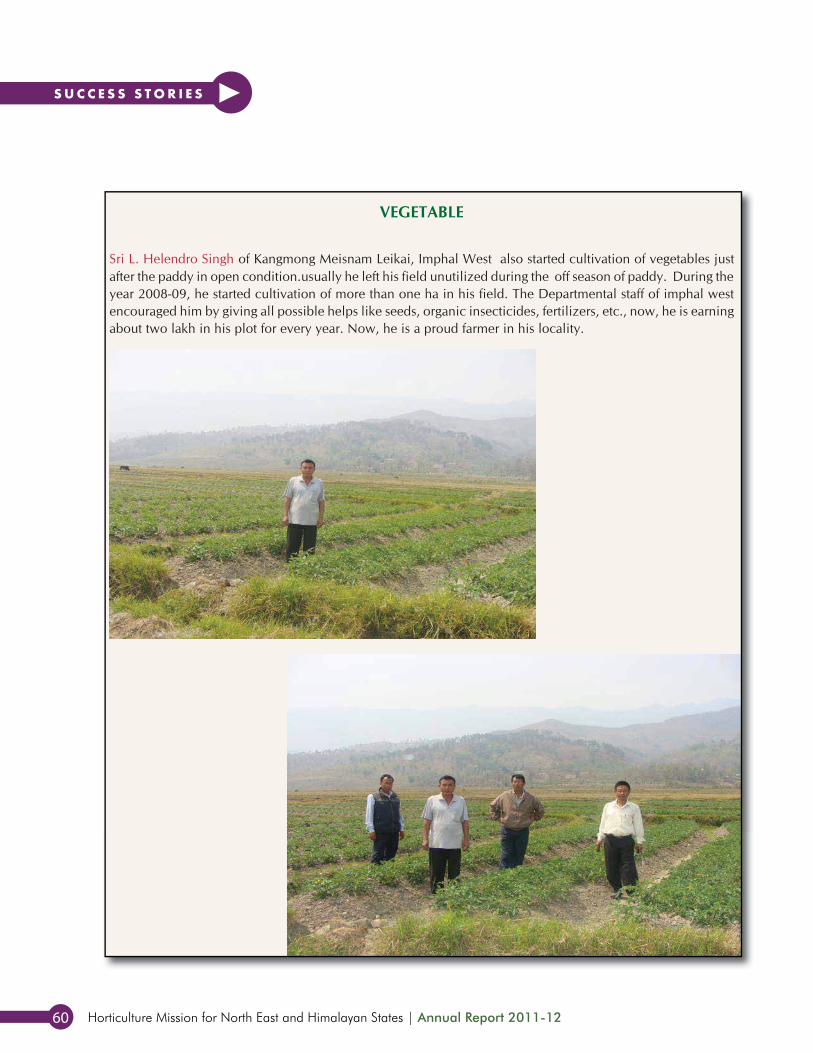
Sri L. Helendro Singh of Kangmong Meisnam Leikai, Imphal West also started cultivation of vegetables justafter the paddy in open condition.usually he left his field unutilized during the off season of paddy. During theyear 2008-09, he started cultivation of more than one ha in his field. The Departmental staff of imphal westencouraged him by giving all possible helps like seeds, organic insecticides, fertilizers, etc., now, he is earningabout two lakh in his plot for every year. Now, he is a proud farmer in his locality.
assam 61
S u C C E S S S T O R I E S AssamANNUAL REPORT 2008–09
117
SUCCESS STORIES - ASSAM
ASSAM
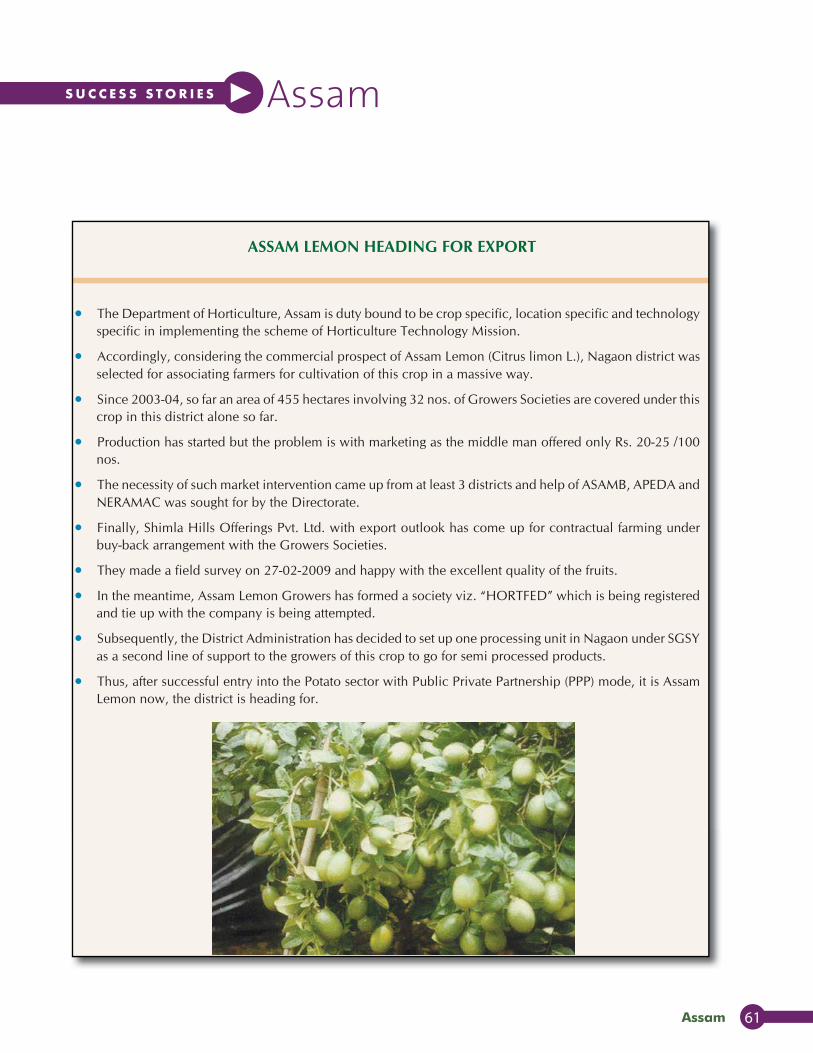
ASSAM LEMON HEADING FOR EXPORT
SUCCESS STORIES
• The Department of Horticulture, Assam is duty bound to be crop specific, location specific and technologyspecific in implementing the scheme of Horticulture Technology Mission.
• Accordingly, considering the commercial prospect of Assam Lemon (Citrus limon L.), Nagaon district wasselected for associating farmers for cultivation of this crop in a massive way.
• Since 2003-04, so far an area of 455 hectares involving 32 nos. of Growers Societies are covered under thiscrop in this district alone so far.
• Production has started but the problem is with marketing as the middle man offered only Rs. 20-25 /100nos.
• The necessity of such market intervention came up from at least 3 districts and help of ASAMB, APEDA andNERAMAC was sought for by the Directorate.
• Finally, Shimla Hills Offerings Pvt. Ltd. with export outlook has come up for contractual farming underbuy-back arrangement with the Growers Societies.
• They made a field survey on 27-02-2009 and happy with the excellent quality of the fruits.
• In the meantime, Assam Lemon Growers has formed a society viz. “HORTFED” which is being registeredand tie up with the company is being attempted.
• Subsequently, the District Administration has decided to set up one processing unit in Nagaon under SGSYas a second line of support to the growers of this crop to go for semi processed products.
• Thus, after successful entry into the Potato sector with Public Private Partnership (PPP) mode, it is AssamLemon now, the district is heading for.
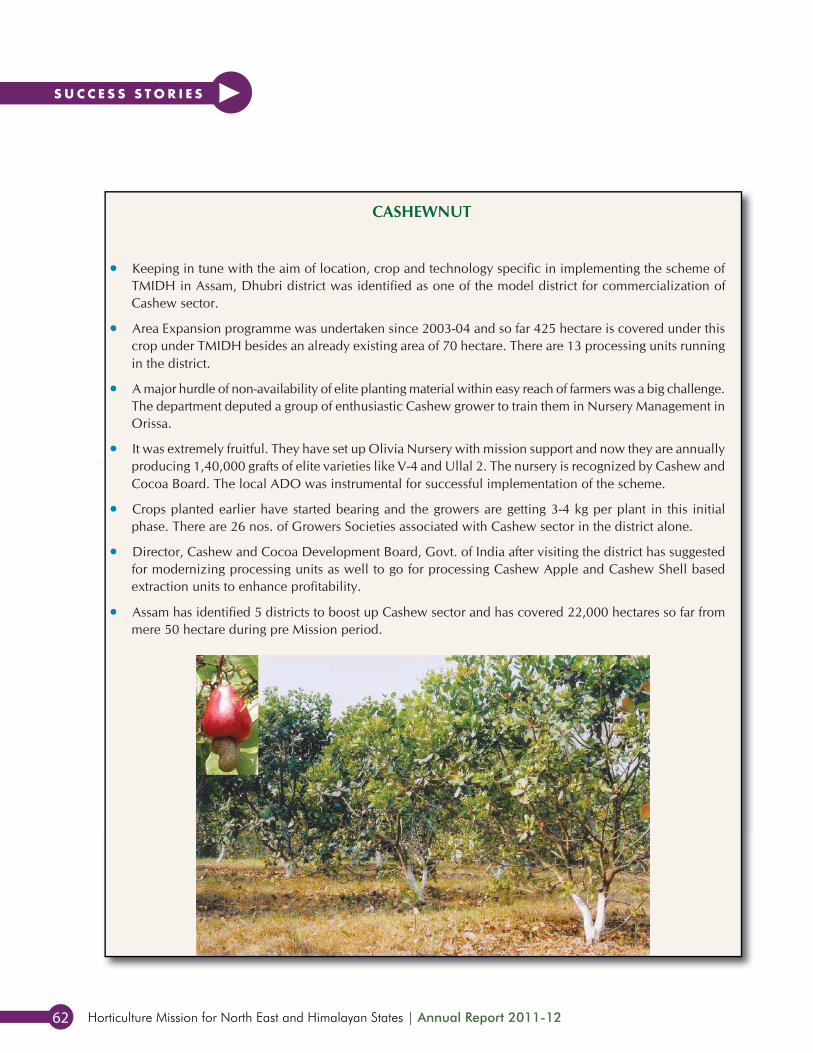
Horticulture Mission for North East and Himalayan States | Annual Report 2011-1262
S u C C E S S S T O R I E S
118
TECHNOLOGY MISSION FOR INTEGRATED DEVELOPMENT OF HORTICULTURE
ANNUAL REPORT 2006–07
TECHNOLOGY MISSION FOR INTEGRATED DEVELOPMENT OF HORTICULTURE
ANNUAL REPORT 2008–09
SUCCESS STORIES
• Keeping in tune with the aim of location, crop and technology specific in implementing the scheme ofTMIDH in Assam, Dhubri district was identified as one of the model district for commercialization ofCashew sector.
• Area Expansion programme was undertaken since 2003-04 and so far 425 hectare is covered under thiscrop under TMIDH besides an already existing area of 70 hectare. There are 13 processing units runningin the district.
• A major hurdle of non-availability of elite planting material within easy reach of farmers was a big challenge.The department deputed a group of enthusiastic Cashew grower to train them in Nursery Management inOrissa.
• It was extremely fruitful. They have set up Olivia Nursery with mission support and now they are annuallyproducing 1,40,000 grafts of elite varieties like V-4 and Ullal 2. The nursery is recognized by Cashew andCocoa Board. The local ADO was instrumental for successful implementation of the scheme.
• Crops planted earlier have started bearing and the growers are getting 3-4 kg per plant in this initialphase. There are 26 nos. of Growers Societies associated with Cashew sector in the district alone.
• Director, Cashew and Cocoa Development Board, Govt. of India after visiting the district has suggestedfor modernizing processing units as well to go for processing Cashew Apple and Cashew Shell basedextraction units to enhance profitability.
• Assam has identified 5 districts to boost up Cashew sector and has covered 22,000 hectares so far frommere 50 hectare during pre Mission period.
CASHEWNUT
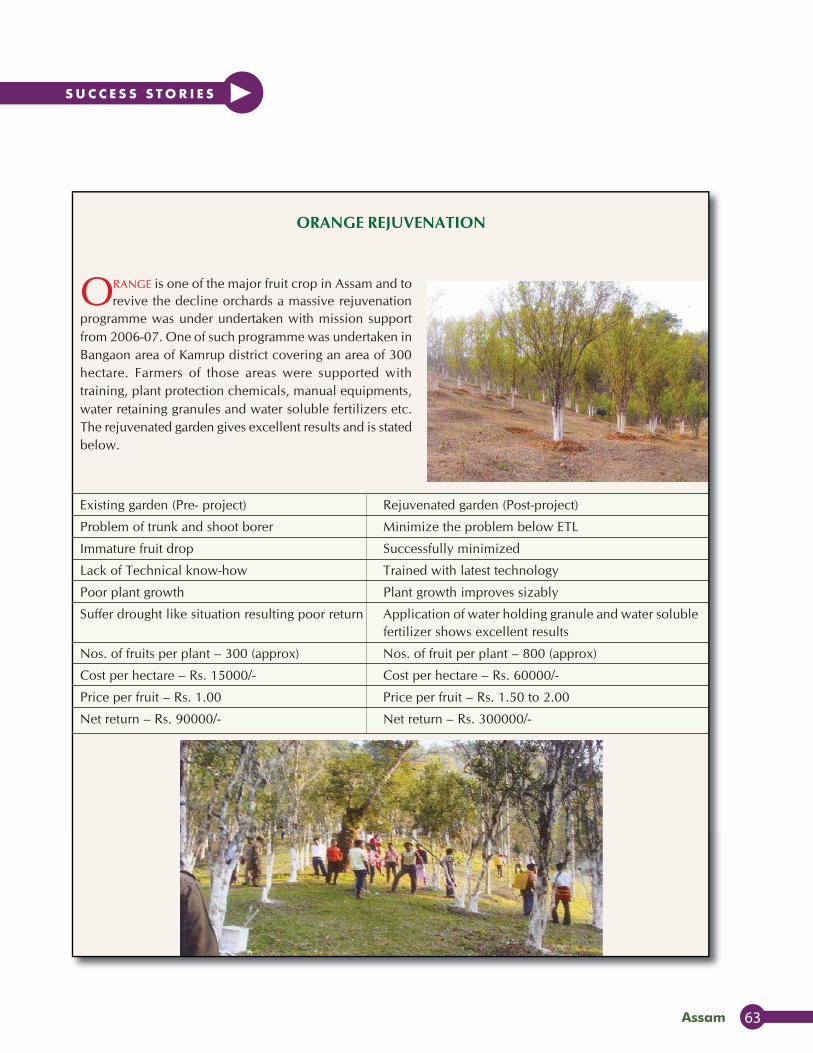
assam 63
S u C C E S S S T O R I E S
ANNUAL REPORT 2008–09
119
SUCCESS STORIES - ASSAM
SUCCESS STORIES
ORANGE REJUVENATION
ORANGE is one of the major fruit crop in Assam and torevive the decline orchards a massive rejuvenation
programme was under undertaken with mission supportfrom 2006-07. One of such programme was undertaken inBangaon area of Kamrup district covering an area of 300hectare. Farmers of those areas were supported withtraining, plant protection chemicals, manual equipments,water retaining granules and water soluble fertilizers etc.The rejuvenated garden gives excellent results and is statedbelow.
Existing garden (Pre- project) Rejuvenated garden (Post-project)
Problem of trunk and shoot borer Minimize the problem below ETL
Immature fruit drop Successfully minimized
Lack of Technical know-how Trained with latest technology
Poor plant growth Plant growth improves sizably
Suffer drought like situation resulting poor return Application of water holding granule and water solublefertilizer shows excellent results
Nos. of fruits per plant – 300 (approx) Nos. of fruit per plant – 800 (approx)
Cost per hectare – Rs. 15000/- Cost per hectare – Rs. 60000/-
Price per fruit – Rs. 1.00 Price per fruit – Rs. 1.50 to 2.00
Net return – Rs. 90000/- Net return – Rs. 300000/-
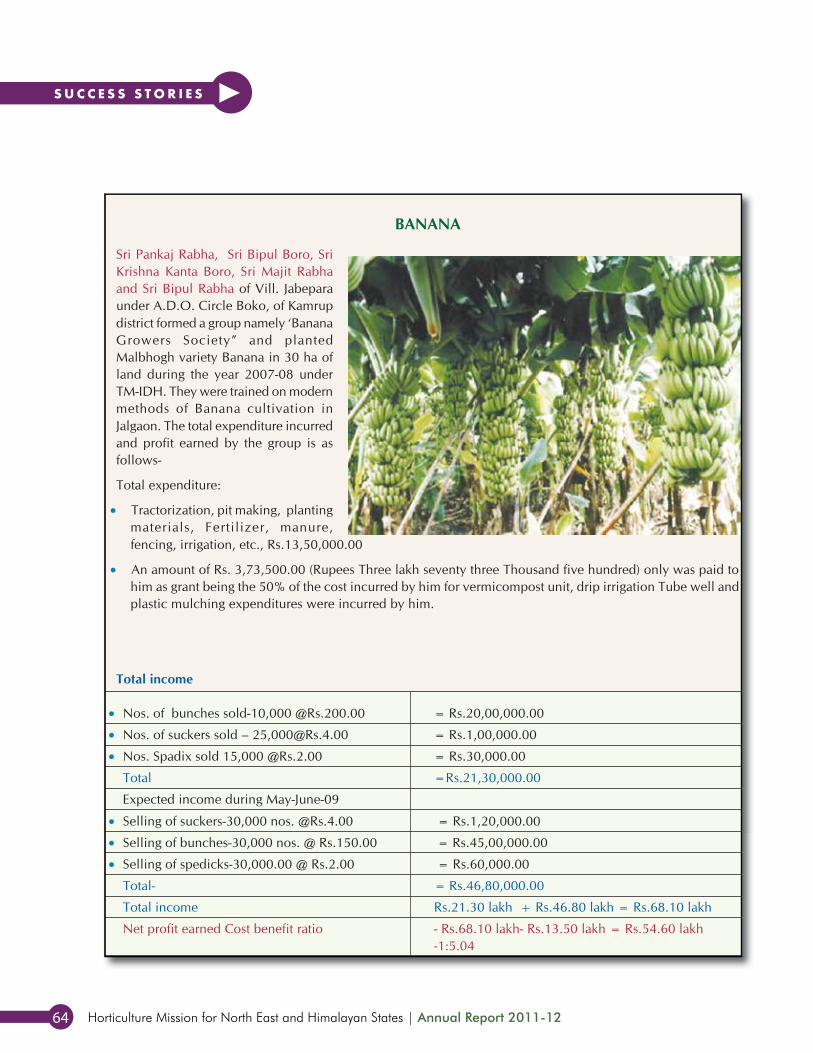
Horticulture Mission for North East and Himalayan States | Annual Report 2011-1264
S u C C E S S S T O R I E S
120
TECHNOLOGY MISSION FOR INTEGRATED DEVELOPMENT OF HORTICULTURE
ANNUAL REPORT 2006–07
TECHNOLOGY MISSION FOR INTEGRATED DEVELOPMENT OF HORTICULTURE
ANNUAL REPORT 2008–09
SUCCESS STORIES
BANANA
Sri Pankaj Rabha, Sri Bipul Boro, SriKrishna Kanta Boro, Sri Majit Rabhaand Sri Bipul Rabha of Vill. Jabeparaunder A.D.O. Circle Boko, of Kamrupdistrict formed a group namely ‘BananaGrowers Society” and plantedMalbhogh variety Banana in 30 ha ofland during the year 2007-08 underTM-IDH. They were trained on modernmethods of Banana cultivation inJalgaon. The total expenditure incurredand profit earned by the group is asfollows-
Total expenditure:
• Tractorization, pit making, plantingmaterials, Fertilizer, manure,fencing, irrigation, etc., Rs.13,50,000.00
• An amount of Rs. 3,73,500.00 (Rupees Three lakh seventy three Thousand five hundred) only was paid tohim as grant being the 50% of the cost incurred by him for vermicompost unit, drip irrigation Tube well andplastic mulching expenditures were incurred by him.
Total income
• Nos. of bunches sold-10,000 @Rs.200.00 = Rs.20,00,000.00
• Nos. of suckers sold – 25,[email protected] = Rs.1,00,000.00
• Nos. Spadix sold 15,000 @Rs.2.00 = Rs.30,000.00
Total =Rs.21,30,000.00
Expected income during May-June-09
• Selling of suckers-30,000 nos. @Rs.4.00 = Rs.1,20,000.00
• Selling of bunches-30,000 nos. @ Rs.150.00 = Rs.45,00,000.00
• Selling of spedicks-30,000.00 @ Rs.2.00 = Rs.60,000.00
Total- = Rs.46,80,000.00
Total income Rs.21.30 lakh + Rs.46.80 lakh = Rs.68.10 lakh
Net profit earned Cost benefit ratio - Rs.68.10 lakh- Rs.13.50 lakh = Rs.54.60 lakh-1:5.04
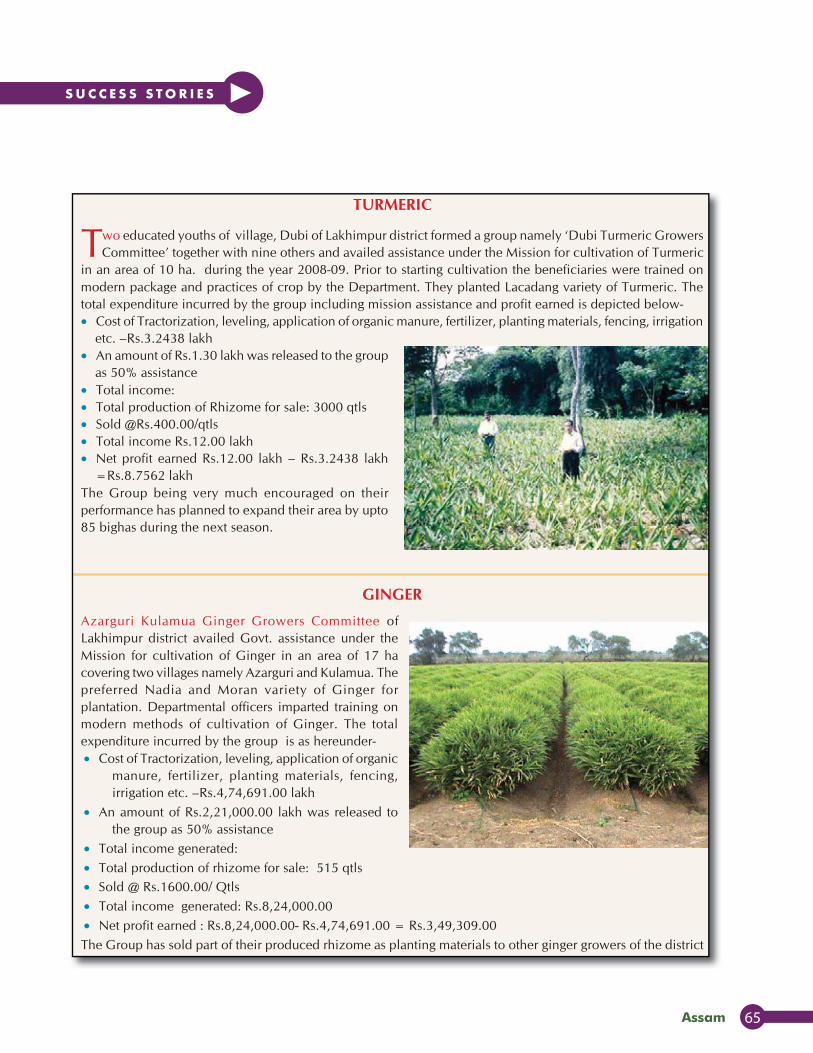
assam 65
S u C C E S S S T O R I E SANNUAL REPORT 2008–09
121
SUCCESS STORIES - ASSAM
SUCCESS STORIES
TURMERIC
Two educated youths of village, Dubi of Lakhimpur district formed a group namely ‘Dubi Turmeric GrowersCommittee’ together with nine others and availed assistance under the Mission for cultivation of Turmeric
in an area of 10 ha. during the year 2008-09. Prior to starting cultivation the beneficiaries were trained onmodern package and practices of crop by the Department. They planted Lacadang variety of Turmeric. Thetotal expenditure incurred by the group including mission assistance and profit earned is depicted below-• Cost of Tractorization, leveling, application of organic manure, fertilizer, planting materials, fencing, irrigation
etc. –Rs.3.2438 lakh• An amount of Rs.1.30 lakh was released to the group
as 50% assistance• Total income:• Total production of Rhizome for sale: 3000 qtls• Sold @Rs.400.00/qtls• Total income Rs.12.00 lakh• Net profit earned Rs.12.00 lakh – Rs.3.2438 lakh
=Rs.8.7562 lakhThe Group being very much encouraged on theirperformance has planned to expand their area by upto85 bighas during the next season.
GINGER
Azarguri Kulamua Ginger Growers Committee ofLakhimpur district availed Govt. assistance under theMission for cultivation of Ginger in an area of 17 hacovering two villages namely Azarguri and Kulamua. Thepreferred Nadia and Moran variety of Ginger forplantation. Departmental officers imparted training onmodern methods of cultivation of Ginger. The totalexpenditure incurred by the group is as hereunder-• Cost of Tractorization, leveling, application of organic
manure, fertilizer, planting materials, fencing,irrigation etc. –Rs.4,74,691.00 lakh
• An amount of Rs.2,21,000.00 lakh was released tothe group as 50% assistance
• Total income generated:• Total production of rhizome for sale: 515 qtls• Sold @ Rs.1600.00/ Qtls• Total income generated: Rs.8,24,000.00• Net profit earned : Rs.8,24,000.00- Rs.4,74,691.00 = Rs.3,49,309.00The Group has sold part of their produced rhizome as planting materials to other ginger growers of the district
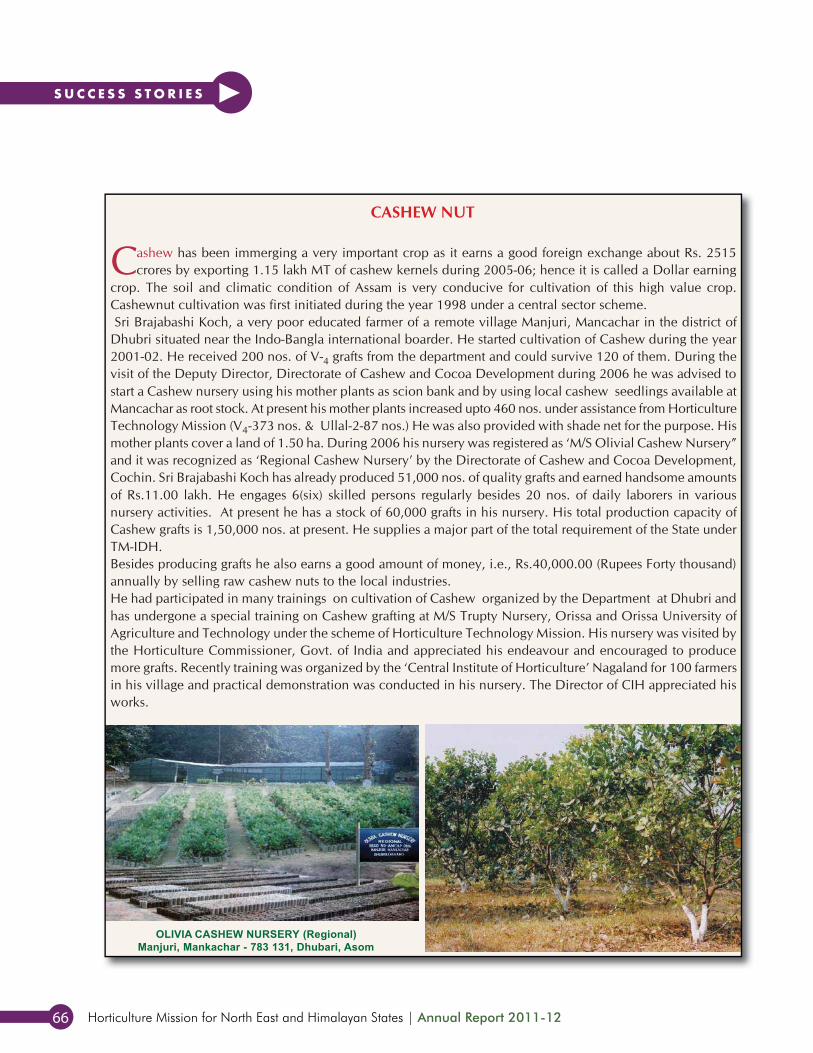
Horticulture Mission for North East and Himalayan States | Annual Report 2011-1266
S u C C E S S S T O R I E S
122
TECHNOLOGY MISSION FOR INTEGRATED DEVELOPMENT OF HORTICULTURE
ANNUAL REPORT 2006–07
TECHNOLOGY MISSION FOR INTEGRATED DEVELOPMENT OF HORTICULTURE
ANNUAL REPORT 2008–09
SUCCESS STORIES
CASHEW NUT
Cashew has been immerging a very important crop as it earns a good foreign exchange about Rs. 2515crores by exporting 1.15 lakh MT of cashew kernels during 2005-06; hence it is called a Dollar earning
crop. The soil and climatic condition of Assam is very conducive for cultivation of this high value crop.Cashewnut cultivation was first initiated during the year 1998 under a central sector scheme.Sri Brajabashi Koch, a very poor educated farmer of a remote village Manjuri, Mancachar in the district of
Dhubri situated near the Indo-Bangla international boarder. He started cultivation of Cashew during the year2001-02. He received 200 nos. of V-4 grafts from the department and could survive 120 of them. During thevisit of the Deputy Director, Directorate of Cashew and Cocoa Development during 2006 he was advised tostart a Cashew nursery using his mother plants as scion bank and by using local cashew seedlings available atMancachar as root stock. At present his mother plants increased upto 460 nos. under assistance from HorticultureTechnology Mission (V4-373 nos. & Ullal-2-87 nos.) He was also provided with shade net for the purpose. Hismother plants cover a land of 1.50 ha. During 2006 his nursery was registered as ‘M/S Olivial Cashew Nursery”and it was recognized as ‘Regional Cashew Nursery’ by the Directorate of Cashew and Cocoa Development,Cochin. Sri Brajabashi Koch has already produced 51,000 nos. of quality grafts and earned handsome amountsof Rs.11.00 lakh. He engages 6(six) skilled persons regularly besides 20 nos. of daily laborers in variousnursery activities. At present he has a stock of 60,000 grafts in his nursery. His total production capacity ofCashew grafts is 1,50,000 nos. at present. He supplies a major part of the total requirement of the State underTM-IDH.Besides producing grafts he also earns a good amount of money, i.e., Rs.40,000.00 (Rupees Forty thousand)annually by selling raw cashew nuts to the local industries.He had participated in many trainings on cultivation of Cashew organized by the Department at Dhubri andhas undergone a special training on Cashew grafting at M/S Trupty Nursery, Orissa and Orissa University ofAgriculture and Technology under the scheme of Horticulture Technology Mission. His nursery was visited bythe Horticulture Commissioner, Govt. of India and appreciated his endeavour and encouraged to producemore grafts. Recently training was organized by the ‘Central Institute of Horticulture’ Nagaland for 100 farmersin his village and practical demonstration was conducted in his nursery. The Director of CIH appreciated hisworks.
OLIVIA CASHEW NURSERY (Regional)Manjuri, Mankachar - 783 131, Dhubari, Asom
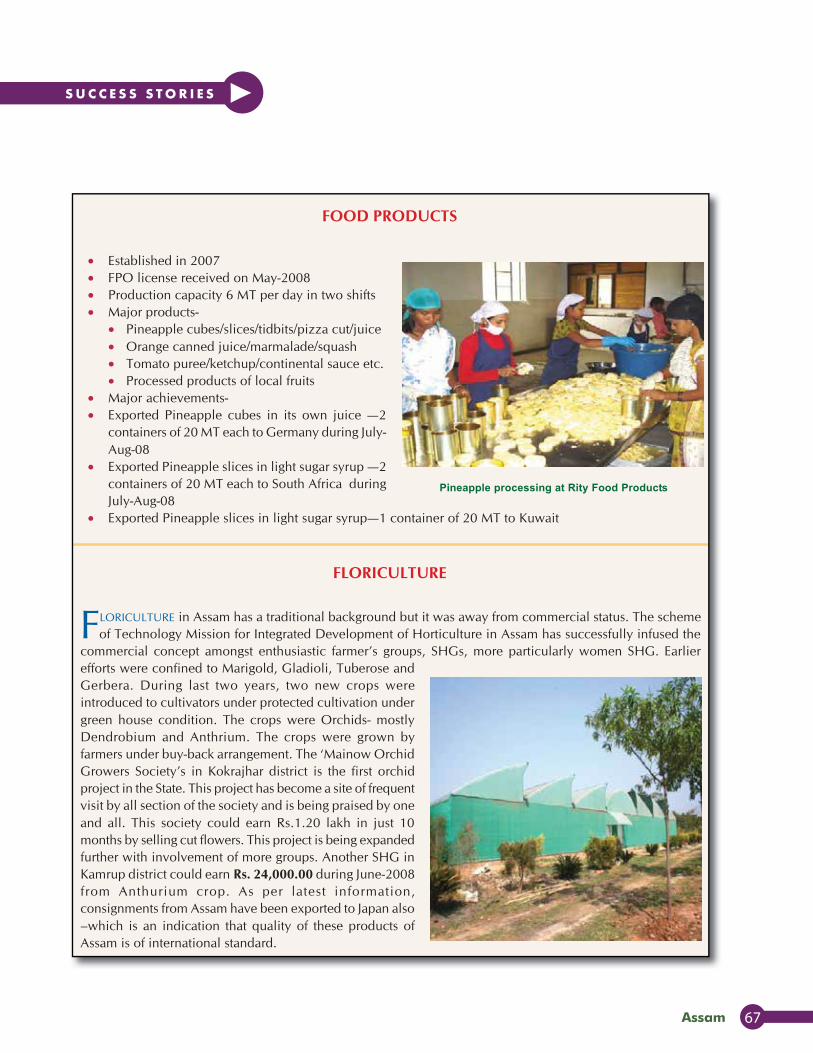
assam 67
S u C C E S S S T O R I E SANNUAL REPORT 2008–09
123
SUCCESS STORIES - ASSAM
SUCCESS STORIES
FOOD PRODUCTS
• Established in 2007• FPO license received on May-2008• Production capacity 6 MT per day in two shifts• Major products-
• Pineapple cubes/slices/tidbits/pizza cut/juice• Orange canned juice/marmalade/squash• Tomato puree/ketchup/continental sauce etc.• Processed products of local fruits
• Major achievements-• Exported Pineapple cubes in its own juice —2
containers of 20 MT each to Germany during July-Aug-08
• Exported Pineapple slices in light sugar syrup —2containers of 20 MT each to South Africa duringJuly-Aug-08
• Exported Pineapple slices in light sugar syrup—1 container of 20 MT to Kuwait
Pineapple processing at Rity Food Products
FLORICULTURE
FLORICULTURE in Assam has a traditional background but it was away from commercial status. The schemeof Technology Mission for Integrated Development of Horticulture in Assam has successfully infused the
commercial concept amongst enthusiastic farmer’s groups, SHGs, more particularly women SHG. Earlierefforts were confined to Marigold, Gladioli, Tuberose andGerbera. During last two years, two new crops wereintroduced to cultivators under protected cultivation undergreen house condition. The crops were Orchids- mostlyDendrobium and Anthrium. The crops were grown byfarmers under buy-back arrangement. The ‘Mainow OrchidGrowers Society’s in Kokrajhar district is the first orchidproject in the State. This project has become a site of frequentvisit by all section of the society and is being praised by oneand all. This society could earn Rs.1.20 lakh in just 10months by selling cut flowers. This project is being expandedfurther with involvement of more groups. Another SHG inKamrup district could earn Rs. 24,000.00 during June-2008from Anthurium crop. As per latest information,consignments from Assam have been exported to Japan also–which is an indication that quality of these products ofAssam is of international standard.
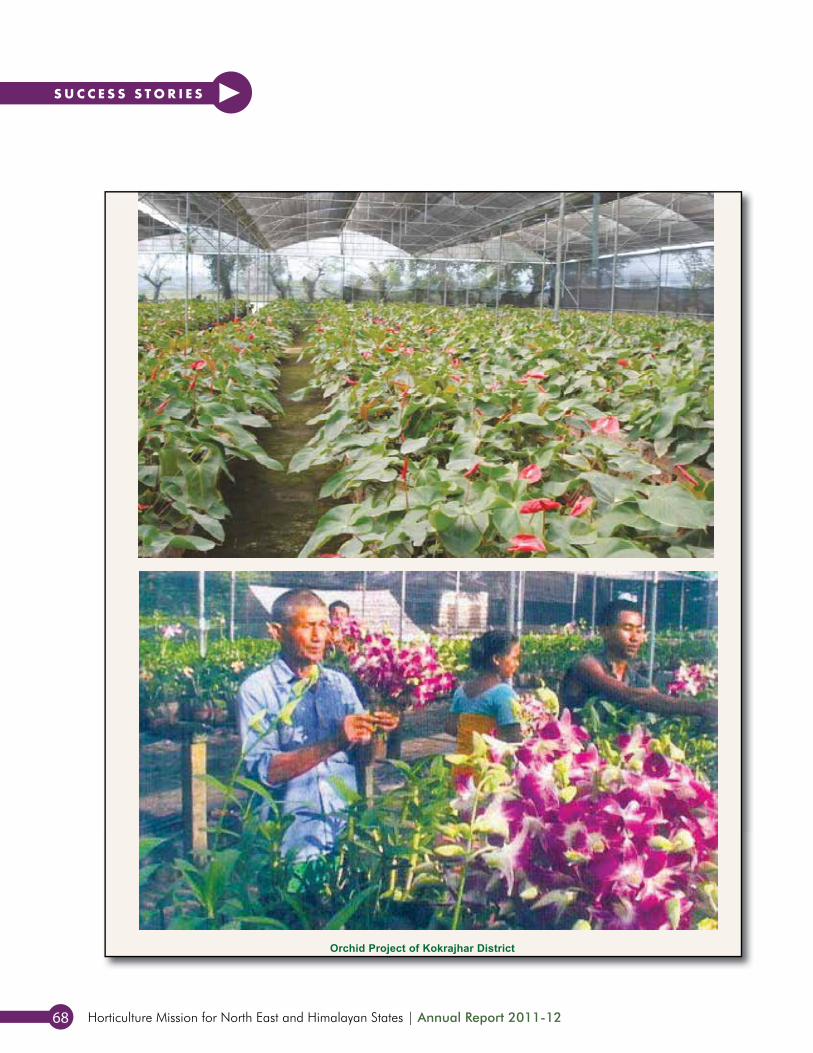
Horticulture Mission for North East and Himalayan States | Annual Report 2011-1268
S u C C E S S S T O R I E S
124
TECHNOLOGY MISSION FOR INTEGRATED DEVELOPMENT OF HORTICULTURE
ANNUAL REPORT 2006–07
TECHNOLOGY MISSION FOR INTEGRATED DEVELOPMENT OF HORTICULTURE
ANNUAL REPORT 2008–09
SUCCESS STORIES
Orchid Project of Kokrajhar District
Annexures

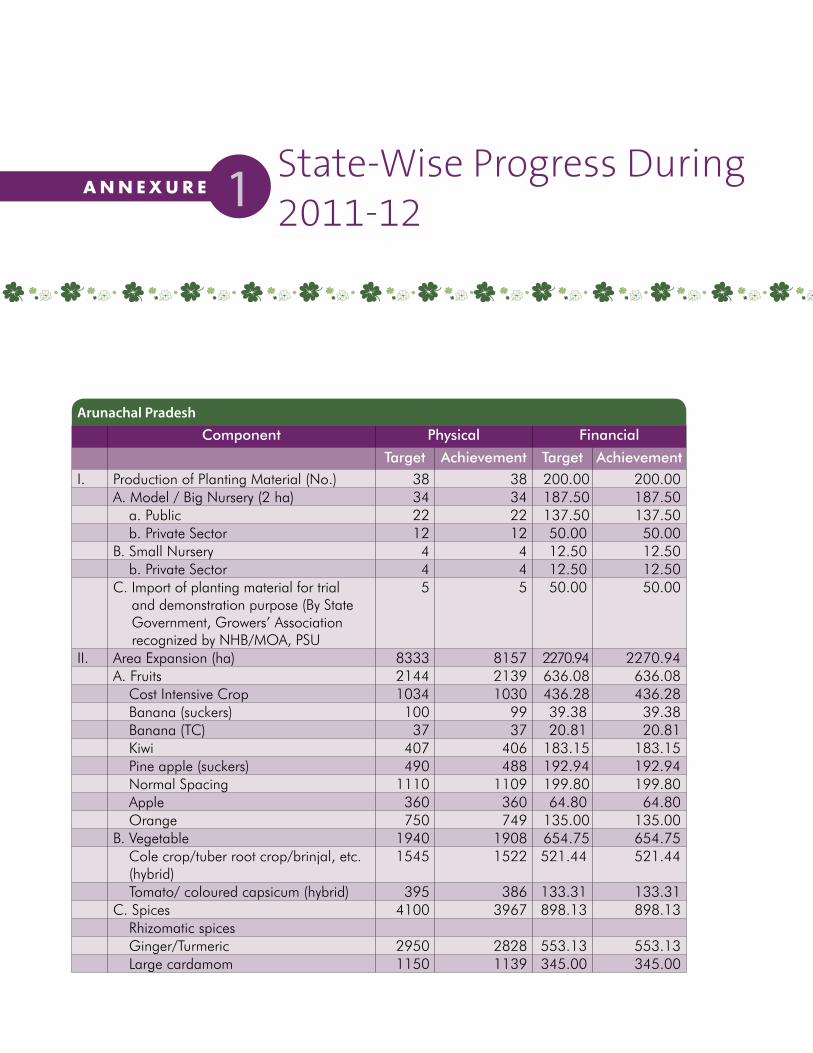
State-Wise Progress During 2011-121A N N E x u R E
Component Physical Financial
Target Achievement Target AchievementI. Production of Planting Material (No.) 38 38 200.00 200.00
A. Model / Big Nursery (2 ha) 34 34 187.50 187.50a. Public 22 22 137.50 137.50b. Private Sector 12 12 50.00 50.00
B. Small Nursery 4 4 12.50 12.50b. Private Sector 4 4 12.50 12.50
C. Import of planting material for trial and demonstration purpose (By State Government, Growers’ Association recognized by NHB/MOA, PSU
5 5 50.00 50.00
II. Area Expansion (ha) 8333 8157 2270.94 2270.94A. Fruits 2144 2139 636.08 636.08
Cost Intensive Crop 1034 1030 436.28 436.28Banana (suckers) 100 99 39.38 39.38Banana (TC) 37 37 20.81 20.81Kiwi 407 406 183.15 183.15Pine apple (suckers) 490 488 192.94 192.94Normal Spacing 1110 1109 199.80 199.80Apple 360 360 64.80 64.80Orange 750 749 135.00 135.00
B. Vegetable 1940 1908 654.75 654.75Cole crop/tuber root crop/brinjal, etc. (hybrid)
1545 1522 521.44 521.44
Tomato/ coloured capsicum (hybrid) 395 386 133.31 133.31C. Spices 4100 3967 898.13 898.13
Rhizomatic spicesGinger/Turmeric 2950 2828 553.13 553.13Large cardamom 1150 1139 345.00 345.00
Arunachal Pradesh
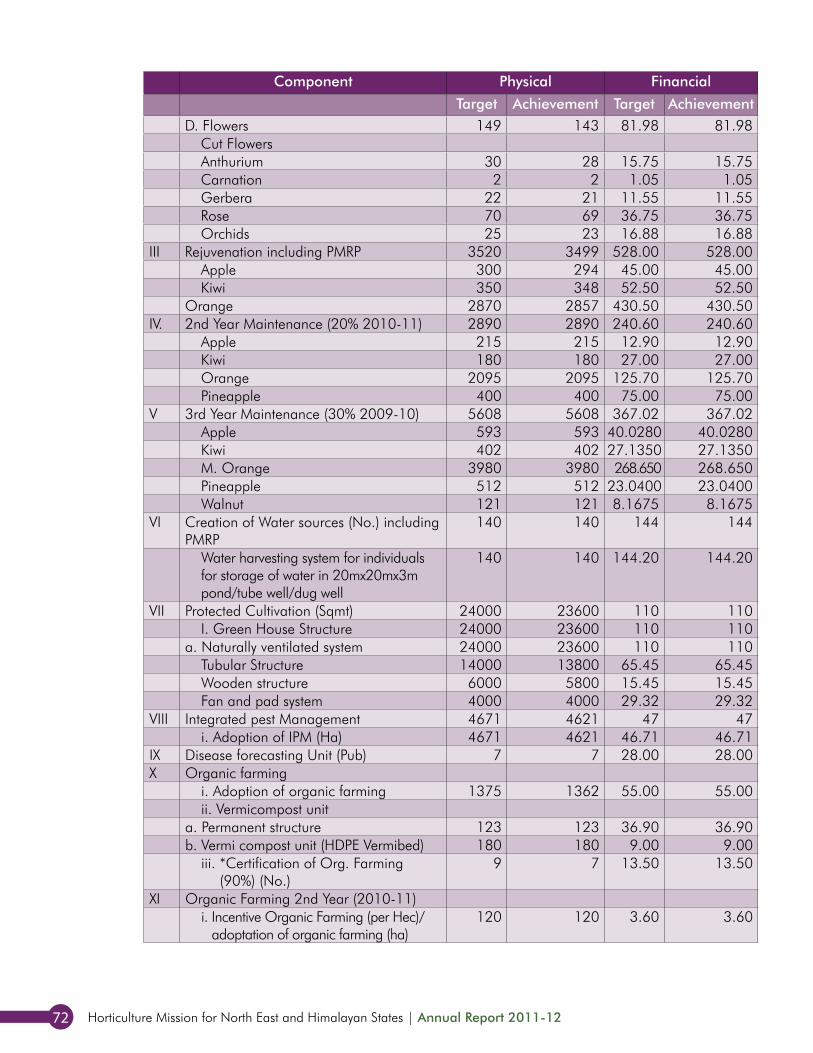
Horticulture Mission for North East and Himalayan States | Annual Report 2011-1272
Component Physical Financial
Target Achievement Target AchievementD. Flowers 149 143 81.98 81.98
Cut FlowersAnthurium 30 28 15.75 15.75Carnation 2 2 1.05 1.05Gerbera 22 21 11.55 11.55Rose 70 69 36.75 36.75Orchids 25 23 16.88 16.88
III Rejuvenation including PMRP 3520 3499 528.00 528.00Apple 300 294 45.00 45.00Kiwi 350 348 52.50 52.50
Orange 2870 2857 430.50 430.50IV. 2nd Year Maintenance (20% 2010-11) 2890 2890 240.60 240.60
Apple 215 215 12.90 12.90Kiwi 180 180 27.00 27.00Orange 2095 2095 125.70 125.70Pineapple 400 400 75.00 75.00
V 3rd Year Maintenance (30% 2009-10) 5608 5608 367.02 367.02Apple 593 593 40.0280 40.0280Kiwi 402 402 27.1350 27.1350M. Orange 3980 3980 268.650 268.650Pineapple 512 512 23.0400 23.0400Walnut 121 121 8.1675 8.1675
VI Creation of Water sources (No.) including PMRP
140 140 144 144
Water harvesting system for individuals for storage of water in 20mx20mx3m pond/tube well/dug well
140 140 144.20 144.20
VII Protected Cultivation (Sqmt) 24000 23600 110 110I. Green House Structure 24000 23600 110 110
a. Naturally ventilated system 24000 23600 110 110Tubular Structure 14000 13800 65.45 65.45Wooden structure 6000 5800 15.45 15.45Fan and pad system 4000 4000 29.32 29.32
VIII Integrated pest Management 4671 4621 47 47i. Adoption of IPM (Ha) 4671 4621 46.71 46.71
IX Disease forecasting Unit (Pub) 7 7 28.00 28.00X Organic farming
i. Adoption of organic farming 1375 1362 55.00 55.00ii. Vermicompost unit
a. Permanent structure 123 123 36.90 36.90b. Vermi compost unit (HDPE Vermibed) 180 180 9.00 9.00
iii. *Certification of Org. Farming (90%) (No.)
9 7 13.50 13.50
XI Organic Farming 2nd Year (2010-11)i. Incentive Organic Farming (per Hec)/
adoptation of organic farming (ha)120 120 3.60 3.60
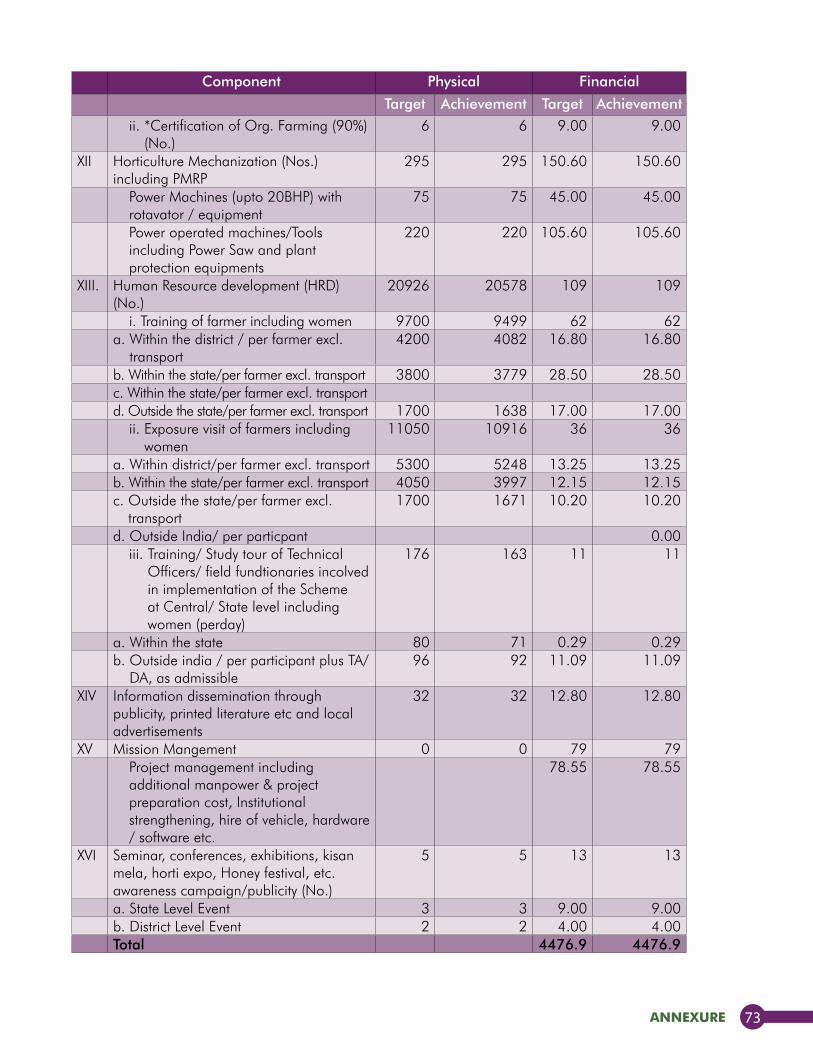
annexure 73
Component Physical Financial
Target Achievement Target Achievementii. *Certification of Org. Farming (90%)
(No.)6 6 9.00 9.00
XII Horticulture Mechanization (Nos.) including PMRP
295 295 150.60 150.60
Power Machines (upto 20BHP) with rotavator / equipment
75 75 45.00 45.00
Power operated machines/Tools including Power Saw and plant protection equipments
220 220 105.60 105.60
XIII. Human Resource development (HRD) (No.)
20926 20578 109 109
i. Training of farmer including women 9700 9499 62 62a. Within the district / per farmer excl.
transport4200 4082 16.80 16.80
b. Within the state/per farmer excl. transport 3800 3779 28.50 28.50c. Within the state/per farmer excl. transportd. Outside the state/per farmer excl. transport 1700 1638 17.00 17.00
ii. Exposure visit of farmers including women
11050 10916 36 36
a. Within district/per farmer excl. transport 5300 5248 13.25 13.25b. Within the state/per farmer excl. transport 4050 3997 12.15 12.15c. Outside the state/per farmer excl.
transport1700 1671 10.20 10.20
d. Outside India/ per particpant 0.00iii. Training/ Study tour of Technical
Officers/ field fundtionaries incolved in implementation of the Scheme at Central/ State level including women (perday)
176 163 11 11
a. Within the state 80 71 0.29 0.29b. Outside india / per participant plus TA/
DA, as admissible96 92 11.09 11.09
XIV Information dissemination through publicity, printed literature etc and local advertisements
32 32 12.80 12.80
XV Mission Mangement 0 0 79 79Project management including additional manpower & project preparation cost, Institutional strengthening, hire of vehicle, hardware / software etc.
78.55 78.55
XVI Seminar, conferences, exhibitions, kisan mela, horti expo, Honey festival, etc. awareness campaign/publicity (No.)
5 5 13 13
a. State Level Event 3 3 9.00 9.00b. District Level Event 2 2 4.00 4.00Total 4476.9 4476.9
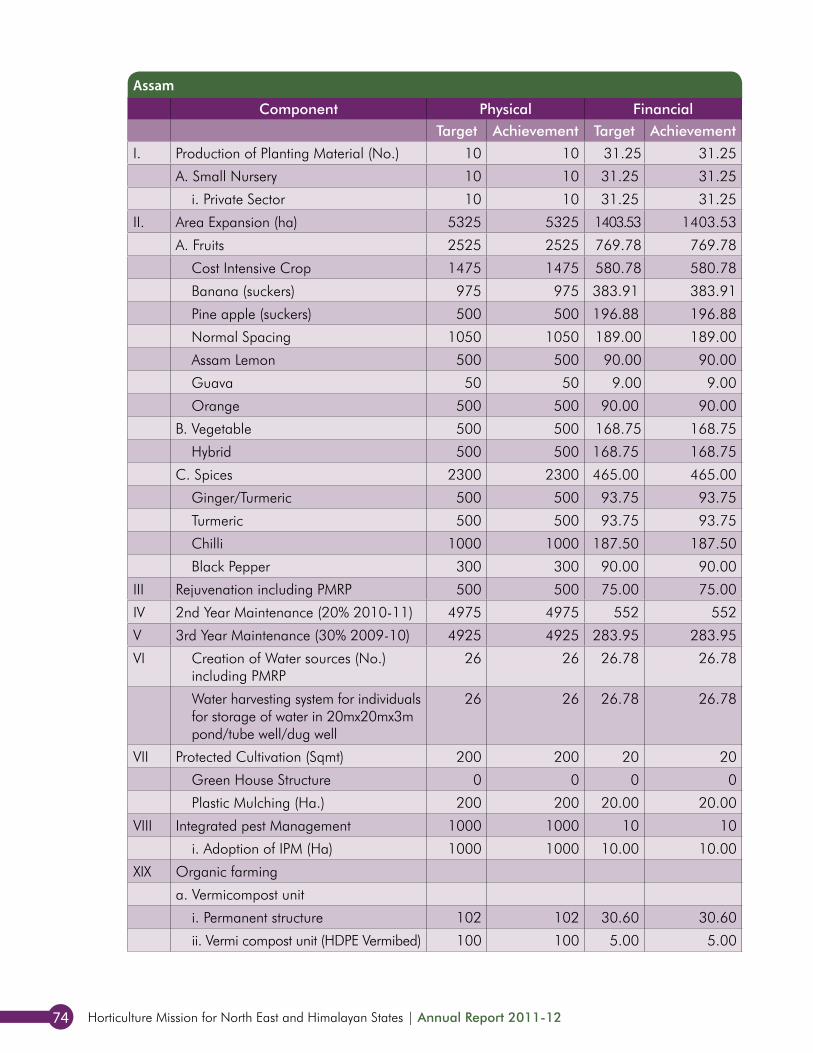
Horticulture Mission for North East and Himalayan States | Annual Report 2011-1274
Component Physical FinancialTarget Achievement Target Achievement
I. Production of Planting Material (No.) 10 10 31.25 31.25
A. Small Nursery 10 10 31.25 31.25
i. Private Sector 10 10 31.25 31.25
II. Area Expansion (ha) 5325 5325 1403.53 1403.53
A. Fruits 2525 2525 769.78 769.78
Cost Intensive Crop 1475 1475 580.78 580.78
Banana (suckers) 975 975 383.91 383.91
Pine apple (suckers) 500 500 196.88 196.88
Normal Spacing 1050 1050 189.00 189.00
Assam Lemon 500 500 90.00 90.00
Guava 50 50 9.00 9.00
Orange 500 500 90.00 90.00
B. Vegetable 500 500 168.75 168.75
Hybrid 500 500 168.75 168.75
C. Spices 2300 2300 465.00 465.00
Ginger/Turmeric 500 500 93.75 93.75
Turmeric 500 500 93.75 93.75
Chilli 1000 1000 187.50 187.50
Black Pepper 300 300 90.00 90.00
III Rejuvenation including PMRP 500 500 75.00 75.00
IV 2nd Year Maintenance (20% 2010-11) 4975 4975 552 552
V 3rd Year Maintenance (30% 2009-10) 4925 4925 283.95 283.95
VI Creation of Water sources (No.) including PMRP
26 26 26.78 26.78
Water harvesting system for individuals for storage of water in 20mx20mx3m pond/tube well/dug well
26 26 26.78 26.78
VII Protected Cultivation (Sqmt) 200 200 20 20
Green House Structure 0 0 0 0
Plastic Mulching (Ha.) 200 200 20.00 20.00
VIII Integrated pest Management 1000 1000 10 10
i. Adoption of IPM (Ha) 1000 1000 10.00 10.00
XIX Organic farming
a. Vermicompost unit
i. Permanent structure 102 102 30.60 30.60
ii. Vermi compost unit (HDPE Vermibed) 100 100 5.00 5.00
Assam
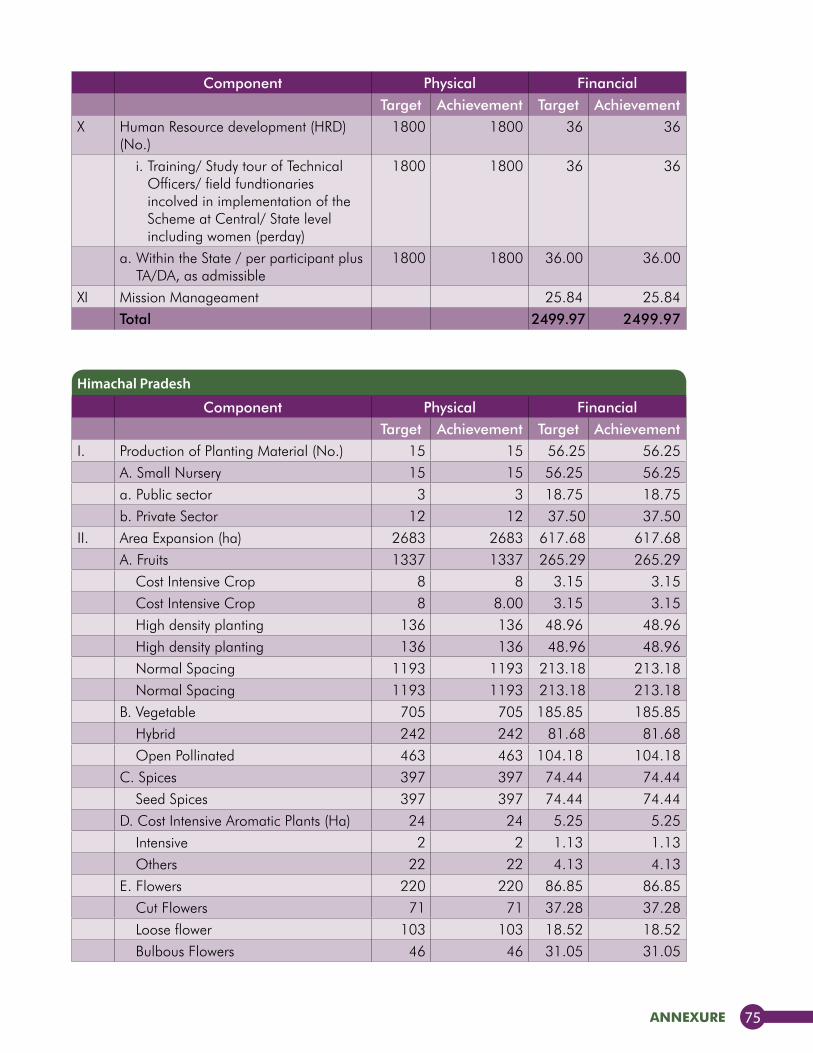
annexure 75
Himachal Pradesh
Component Physical FinancialTarget Achievement Target Achievement
X Human Resource development (HRD) (No.)
1800 1800 36 36
i. Training/ Study tour of Technical Officers/ field fundtionaries incolved in implementation of the Scheme at Central/ State level including women (perday)
1800 1800 36 36
a. Within the State / per participant plus TA/DA, as admissible
1800 1800 36.00 36.00
XI Mission Manageament 25.84 25.84Total 2499.97 2499.97
Component Physical FinancialTarget Achievement Target Achievement
I. Production of Planting Material (No.) 15 15 56.25 56.25A. Small Nursery 15 15 56.25 56.25a. Public sector 3 3 18.75 18.75b. Private Sector 12 12 37.50 37.50
II. Area Expansion (ha) 2683 2683 617.68 617.68A. Fruits 1337 1337 265.29 265.29
Cost Intensive Crop 8 8 3.15 3.15Cost Intensive Crop 8 8.00 3.15 3.15High density planting 136 136 48.96 48.96High density planting 136 136 48.96 48.96Normal Spacing 1193 1193 213.18 213.18Normal Spacing 1193 1193 213.18 213.18
B. Vegetable 705 705 185.85 185.85Hybrid 242 242 81.68 81.68Open Pollinated 463 463 104.18 104.18
C. Spices 397 397 74.44 74.44Seed Spices 397 397 74.44 74.44
D. Cost Intensive Aromatic Plants (Ha) 24 24 5.25 5.25Intensive 2 2 1.13 1.13Others 22 22 4.13 4.13
E. Flowers 220 220 86.85 86.85Cut Flowers 71 71 37.28 37.28Loose flower 103 103 18.52 18.52Bulbous Flowers 46 46 31.05 31.05
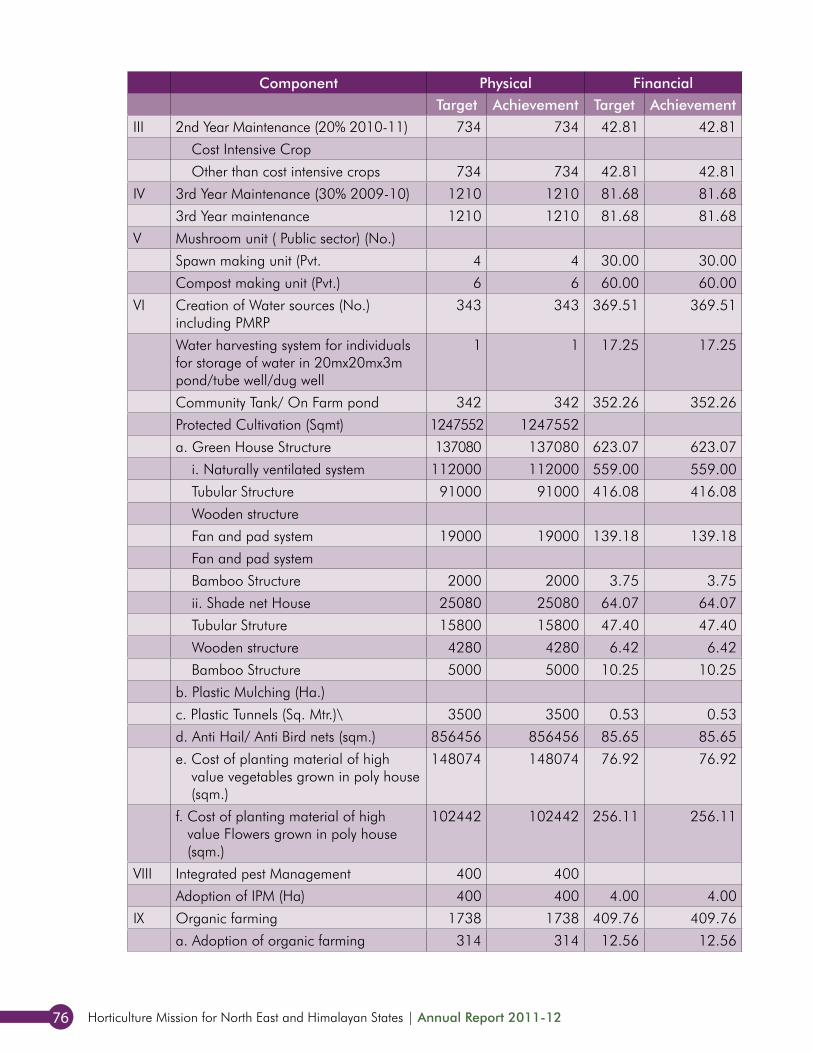
Horticulture Mission for North East and Himalayan States | Annual Report 2011-1276
Component Physical FinancialTarget Achievement Target Achievement
III 2nd Year Maintenance (20% 2010-11) 734 734 42.81 42.81
Cost Intensive Crop
Other than cost intensive crops 734 734 42.81 42.81
IV 3rd Year Maintenance (30% 2009-10) 1210 1210 81.68 81.68
3rd Year maintenance 1210 1210 81.68 81.68
V Mushroom unit ( Public sector) (No.)
Spawn making unit (Pvt. 4 4 30.00 30.00
Compost making unit (Pvt.) 6 6 60.00 60.00
VI Creation of Water sources (No.) including PMRP
343 343 369.51 369.51
Water harvesting system for individuals for storage of water in 20mx20mx3m pond/tube well/dug well
1 1 17.25 17.25
Community Tank/ On Farm pond 342 342 352.26 352.26
Protected Cultivation (Sqmt) 1247552 1247552
a. Green House Structure 137080 137080 623.07 623.07
i. Naturally ventilated system 112000 112000 559.00 559.00
Tubular Structure 91000 91000 416.08 416.08
Wooden structure
Fan and pad system 19000 19000 139.18 139.18
Fan and pad system
Bamboo Structure 2000 2000 3.75 3.75
ii. Shade net House 25080 25080 64.07 64.07
Tubular Struture 15800 15800 47.40 47.40
Wooden structure 4280 4280 6.42 6.42
Bamboo Structure 5000 5000 10.25 10.25
b. Plastic Mulching (Ha.)
c. Plastic Tunnels (Sq. Mtr.)\ 3500 3500 0.53 0.53
d. Anti Hail/ Anti Bird nets (sqm.) 856456 856456 85.65 85.65
e. Cost of planting material of high value vegetables grown in poly house (sqm.)
148074 148074 76.92 76.92
f. Cost of planting material of high value Flowers grown in poly house (sqm.)
102442 102442 256.11 256.11
VIII Integrated pest Management 400 400
Adoption of IPM (Ha) 400 400 4.00 4.00
IX Organic farming 1738 1738 409.76 409.76
a. Adoption of organic farming 314 314 12.56 12.56
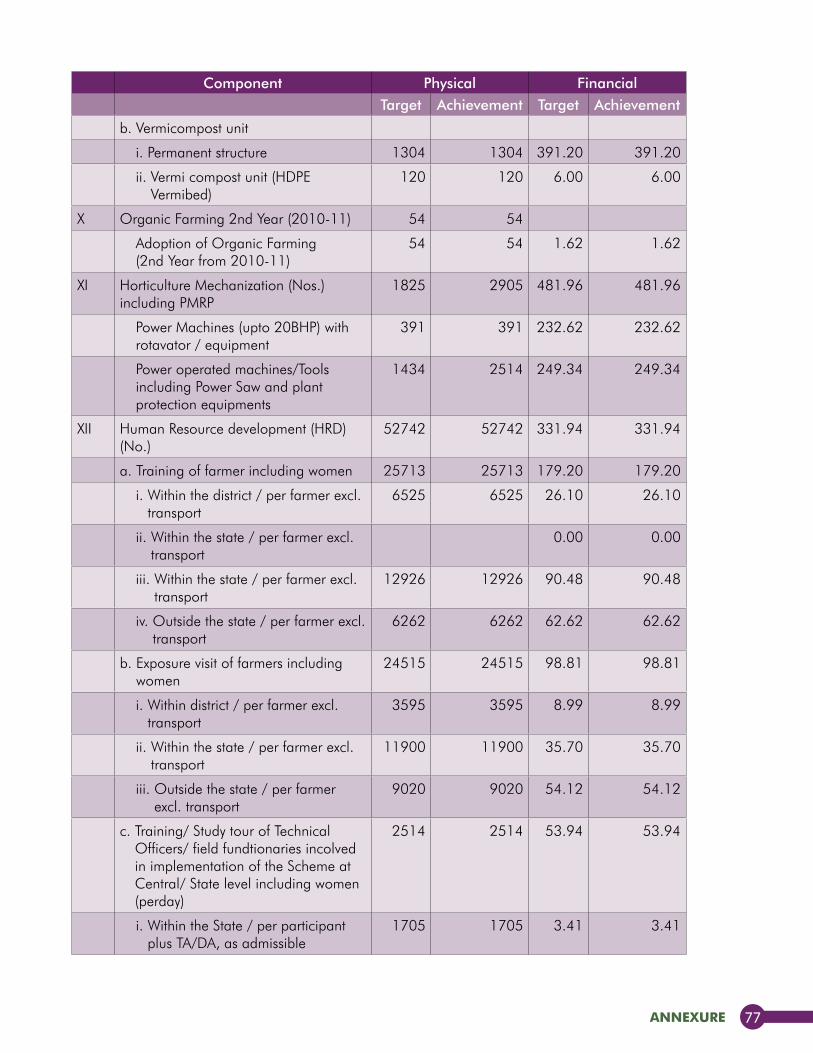
annexure 77
Component Physical FinancialTarget Achievement Target Achievement
b. Vermicompost unit
i. Permanent structure 1304 1304 391.20 391.20
ii. Vermi compost unit (HDPE Vermibed)
120 120 6.00 6.00
X Organic Farming 2nd Year (2010-11) 54 54
Adoption of Organic Farming (2nd Year from 2010-11)
54 54 1.62 1.62
XI Horticulture Mechanization (Nos.) including PMRP
1825 2905 481.96 481.96
Power Machines (upto 20BHP) with rotavator / equipment
391 391 232.62 232.62
Power operated machines/Tools including Power Saw and plant protection equipments
1434 2514 249.34 249.34
XII Human Resource development (HRD) (No.)
52742 52742 331.94 331.94
a. Training of farmer including women 25713 25713 179.20 179.20
i. Within the district / per farmer excl. transport
6525 6525 26.10 26.10
ii. Within the state / per farmer excl. transport
0.00 0.00
iii. Within the state / per farmer excl. transport
12926 12926 90.48 90.48
iv. Outside the state / per farmer excl. transport
6262 6262 62.62 62.62
b. Exposure visit of farmers including women
24515 24515 98.81 98.81
i. Within district / per farmer excl. transport
3595 3595 8.99 8.99
ii. Within the state / per farmer excl. transport
11900 11900 35.70 35.70
iii. Outside the state / per farmer excl. transport
9020 9020 54.12 54.12
c. Training/ Study tour of Technical Officers/ field fundtionaries incolved in implementation of the Scheme at Central/ State level including women (perday)
2514 2514 53.94 53.94
i. Within the State / per participant plus TA/DA, as admissible
1705 1705 3.41 3.41
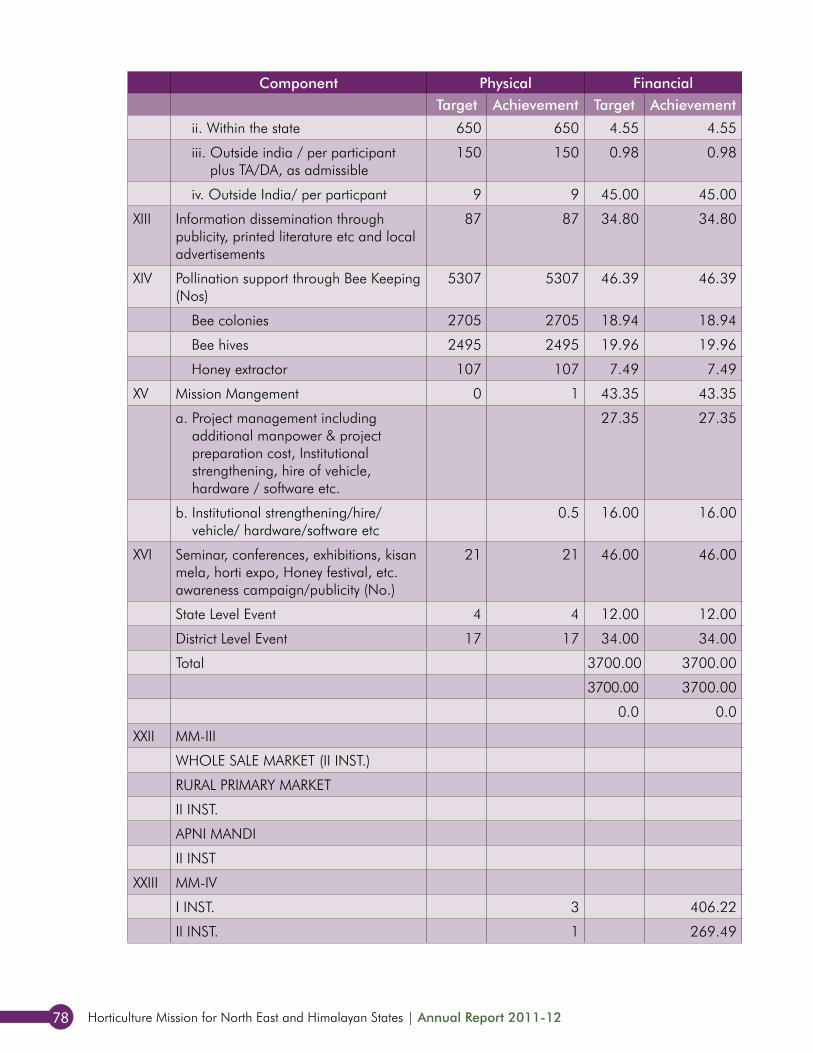
Horticulture Mission for North East and Himalayan States | Annual Report 2011-1278
Component Physical FinancialTarget Achievement Target Achievement
ii. Within the state 650 650 4.55 4.55
iii. Outside india / per participant plus TA/DA, as admissible
150 150 0.98 0.98
iv. Outside India/ per particpant 9 9 45.00 45.00
XIII Information dissemination through publicity, printed literature etc and local advertisements
87 87 34.80 34.80
XIV Pollination support through Bee Keeping (Nos)
5307 5307 46.39 46.39
Bee colonies 2705 2705 18.94 18.94
Bee hives 2495 2495 19.96 19.96
Honey extractor 107 107 7.49 7.49
XV Mission Mangement 0 1 43.35 43.35
a. Project management including additional manpower & project preparation cost, Institutional strengthening, hire of vehicle, hardware / software etc.
27.35 27.35
b. Institutional strengthening/hire/ vehicle/ hardware/software etc
0.5 16.00 16.00
XVI Seminar, conferences, exhibitions, kisan mela, horti expo, Honey festival, etc. awareness campaign/publicity (No.)
21 21 46.00 46.00
State Level Event 4 4 12.00 12.00
District Level Event 17 17 34.00 34.00
Total 3700.00 3700.00
3700.00 3700.00
0.0 0.0
XXII MM-III
WHOLE SALE MARKET (II INST.)
RURAL PRIMARY MARKET
II INST.
APNI MANDI
II INST
XXIII MM-IV
I INST. 3 406.22
II INST. 1 269.49
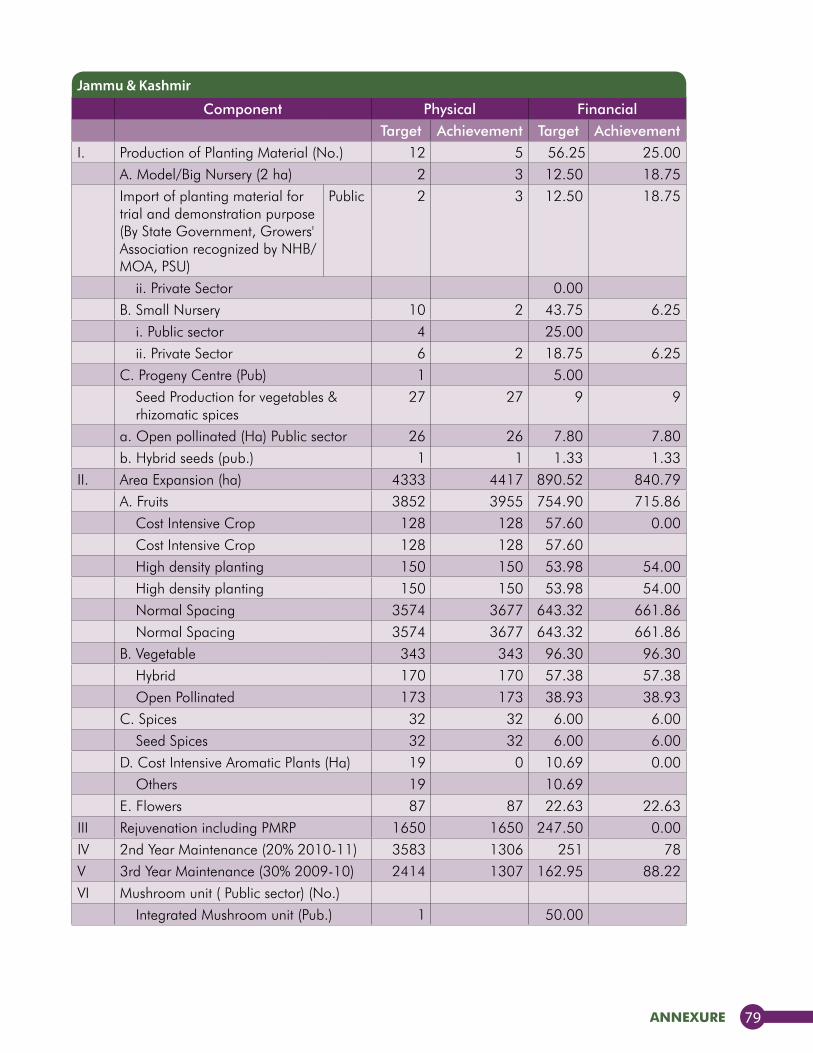
annexure 79
Component Physical FinancialTarget Achievement Target Achievement
I. Production of Planting Material (No.) 12 5 56.25 25.00A. Model/Big Nursery (2 ha) 2 3 12.50 18.75Import of planting material for trial and demonstration purpose (By State Government, Growers' Association recognized by NHB/MOA, PSU)
Public 2 3 12.50 18.75
ii. Private Sector 0.00B. Small Nursery 10 2 43.75 6.25
i. Public sector 4 25.00ii. Private Sector 6 2 18.75 6.25
C. Progeny Centre (Pub) 1 5.00Seed Production for vegetables & rhizomatic spices
27 27 9 9
a. Open pollinated (Ha) Public sector 26 26 7.80 7.80b. Hybrid seeds (pub.) 1 1 1.33 1.33
II. Area Expansion (ha) 4333 4417 890.52 840.79A. Fruits 3852 3955 754.90 715.86
Cost Intensive Crop 128 128 57.60 0.00Cost Intensive Crop 128 128 57.60High density planting 150 150 53.98 54.00High density planting 150 150 53.98 54.00Normal Spacing 3574 3677 643.32 661.86Normal Spacing 3574 3677 643.32 661.86
B. Vegetable 343 343 96.30 96.30Hybrid 170 170 57.38 57.38Open Pollinated 173 173 38.93 38.93
C. Spices 32 32 6.00 6.00Seed Spices 32 32 6.00 6.00
D. Cost Intensive Aromatic Plants (Ha) 19 0 10.69 0.00Others 19 10.69
E. Flowers 87 87 22.63 22.63III Rejuvenation including PMRP 1650 1650 247.50 0.00IV 2nd Year Maintenance (20% 2010-11) 3583 1306 251 78V 3rd Year Maintenance (30% 2009-10) 2414 1307 162.95 88.22VI Mushroom unit ( Public sector) (No.)
Integrated Mushroom unit (Pub.) 1 50.00
Jammu & Kashmir
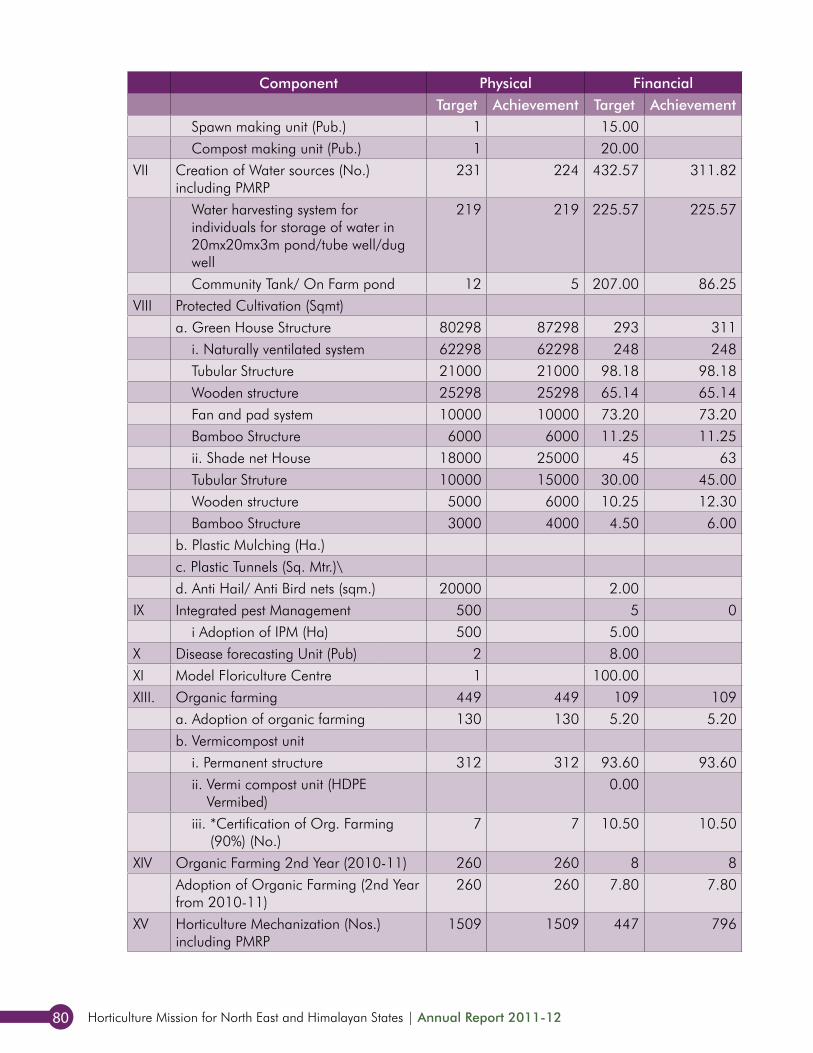
Horticulture Mission for North East and Himalayan States | Annual Report 2011-1280
Component Physical FinancialTarget Achievement Target Achievement
Spawn making unit (Pub.) 1 15.00Compost making unit (Pub.) 1 20.00
VII Creation of Water sources (No.) including PMRP
231 224 432.57 311.82
Water harvesting system for individuals for storage of water in 20mx20mx3m pond/tube well/dug well
219 219 225.57 225.57
Community Tank/ On Farm pond 12 5 207.00 86.25VIII Protected Cultivation (Sqmt)
a. Green House Structure 80298 87298 293 311i. Naturally ventilated system 62298 62298 248 248Tubular Structure 21000 21000 98.18 98.18Wooden structure 25298 25298 65.14 65.14Fan and pad system 10000 10000 73.20 73.20Bamboo Structure 6000 6000 11.25 11.25ii. Shade net House 18000 25000 45 63Tubular Struture 10000 15000 30.00 45.00Wooden structure 5000 6000 10.25 12.30Bamboo Structure 3000 4000 4.50 6.00
b. Plastic Mulching (Ha.)c. Plastic Tunnels (Sq. Mtr.)\d. Anti Hail/ Anti Bird nets (sqm.) 20000 2.00
IX Integrated pest Management 500 5 0i Adoption of IPM (Ha) 500 5.00
X Disease forecasting Unit (Pub) 2 8.00XI Model Floriculture Centre 1 100.00XIII. Organic farming 449 449 109 109
a. Adoption of organic farming 130 130 5.20 5.20b. Vermicompost unit
i. Permanent structure 312 312 93.60 93.60ii. Vermi compost unit (HDPE
Vermibed)0.00
iii. *Certification of Org. Farming (90%) (No.)
7 7 10.50 10.50
XIV Organic Farming 2nd Year (2010-11) 260 260 8 8Adoption of Organic Farming (2nd Year from 2010-11)
260 260 7.80 7.80
XV Horticulture Mechanization (Nos.) including PMRP
1509 1509 447 796
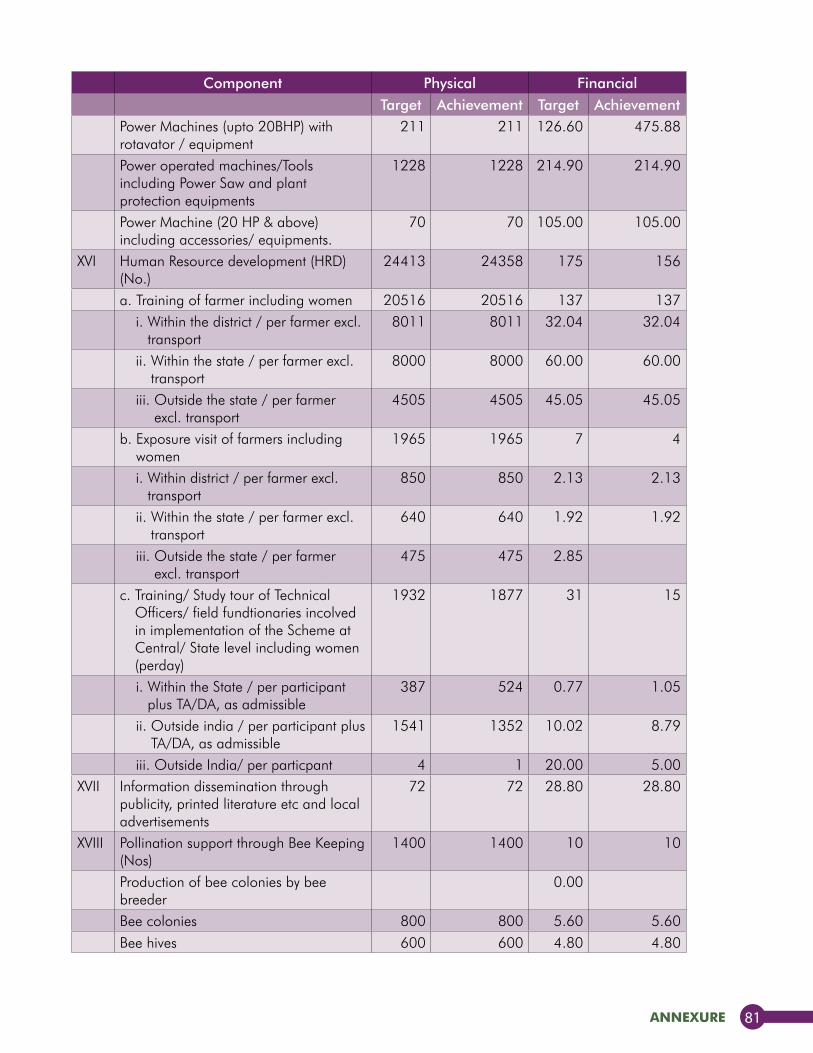
annexure 81
Component Physical FinancialTarget Achievement Target Achievement
Power Machines (upto 20BHP) with rotavator / equipment
211 211 126.60 475.88
Power operated machines/Tools including Power Saw and plant protection equipments
1228 1228 214.90 214.90
Power Machine (20 HP & above) including accessories/ equipments.
70 70 105.00 105.00
XVI Human Resource development (HRD) (No.)
24413 24358 175 156
a. Training of farmer including women 20516 20516 137 137i. Within the district / per farmer excl.
transport8011 8011 32.04 32.04
ii. Within the state / per farmer excl. transport
8000 8000 60.00 60.00
iii. Outside the state / per farmer excl. transport
4505 4505 45.05 45.05
b. Exposure visit of farmers including women
1965 1965 7 4
i. Within district / per farmer excl. transport
850 850 2.13 2.13
ii. Within the state / per farmer excl. transport
640 640 1.92 1.92
iii. Outside the state / per farmer excl. transport
475 475 2.85
c. Training/ Study tour of Technical Officers/ field fundtionaries incolved in implementation of the Scheme at Central/ State level including women (perday)
1932 1877 31 15
i. Within the State / per participant plus TA/DA, as admissible
387 524 0.77 1.05
ii. Outside india / per participant plus TA/DA, as admissible
1541 1352 10.02 8.79
iii. Outside India/ per particpant 4 1 20.00 5.00XVII Information dissemination through
publicity, printed literature etc and local advertisements
72 72 28.80 28.80
XVIII Pollination support through Bee Keeping (Nos)
1400 1400 10 10
Production of bee colonies by bee breeder
0.00
Bee colonies 800 800 5.60 5.60Bee hives 600 600 4.80 4.80
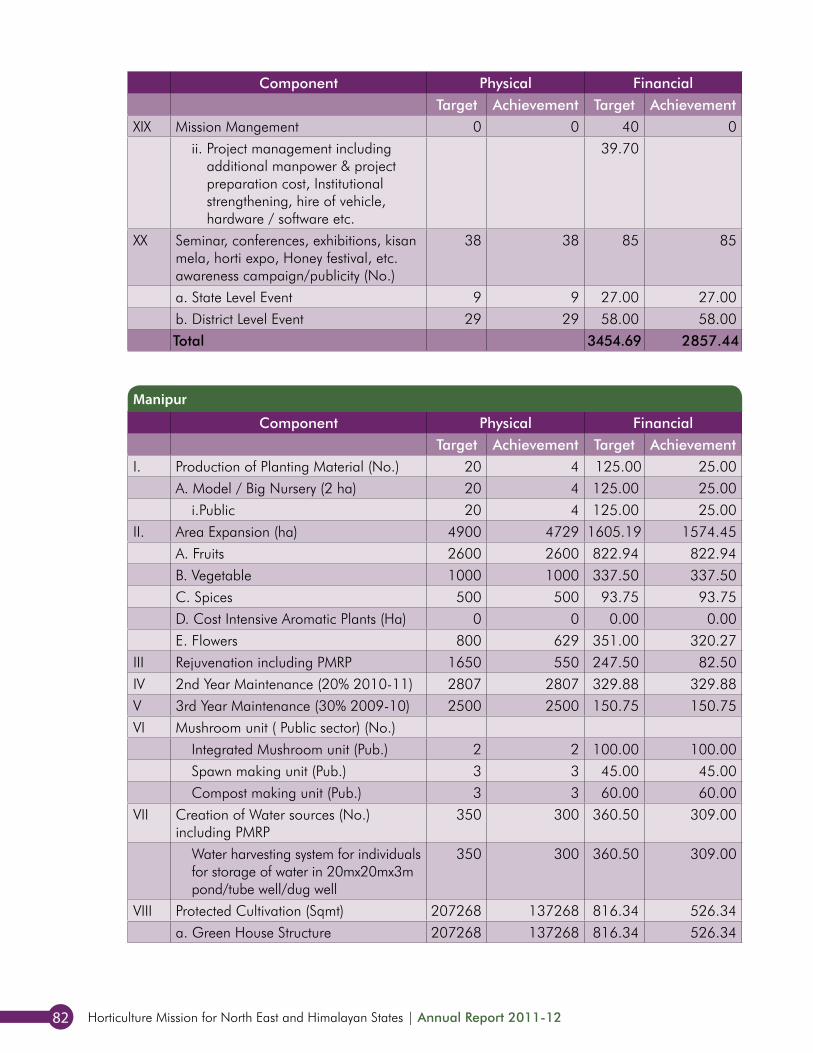
Horticulture Mission for North East and Himalayan States | Annual Report 2011-1282
Component Physical FinancialTarget Achievement Target Achievement
XIX Mission Mangement 0 0 40 0ii. Project management including
additional manpower & project preparation cost, Institutional strengthening, hire of vehicle, hardware / software etc.
39.70
XX Seminar, conferences, exhibitions, kisan mela, horti expo, Honey festival, etc. awareness campaign/publicity (No.)
38 38 85 85
a. State Level Event 9 9 27.00 27.00b. District Level Event 29 29 58.00 58.00Total 3454.69 2857.44
Component Physical FinancialTarget Achievement Target Achievement
I. Production of Planting Material (No.) 20 4 125.00 25.00A. Model / Big Nursery (2 ha) 20 4 125.00 25.00
i.Public 20 4 125.00 25.00II. Area Expansion (ha) 4900 4729 1605.19 1574.45
A. Fruits 2600 2600 822.94 822.94B. Vegetable 1000 1000 337.50 337.50C. Spices 500 500 93.75 93.75D. Cost Intensive Aromatic Plants (Ha) 0 0 0.00 0.00E. Flowers 800 629 351.00 320.27
III Rejuvenation including PMRP 1650 550 247.50 82.50IV 2nd Year Maintenance (20% 2010-11) 2807 2807 329.88 329.88V 3rd Year Maintenance (30% 2009-10) 2500 2500 150.75 150.75VI Mushroom unit ( Public sector) (No.)
Integrated Mushroom unit (Pub.) 2 2 100.00 100.00Spawn making unit (Pub.) 3 3 45.00 45.00Compost making unit (Pub.) 3 3 60.00 60.00
VII Creation of Water sources (No.) including PMRP
350 300 360.50 309.00
Water harvesting system for individuals for storage of water in 20mx20mx3m pond/tube well/dug well
350 300 360.50 309.00
VIII Protected Cultivation (Sqmt) 207268 137268 816.34 526.34a. Green House Structure 207268 137268 816.34 526.34
Manipur
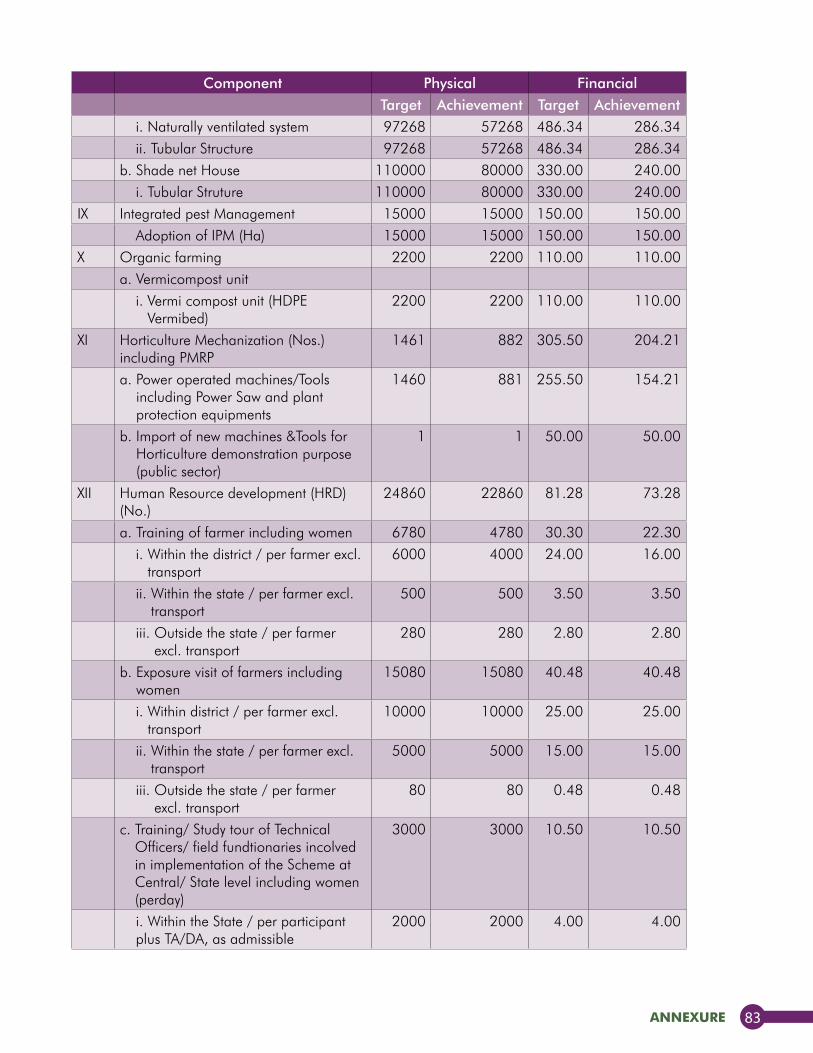
annexure 83
Component Physical FinancialTarget Achievement Target Achievement
i. Naturally ventilated system 97268 57268 486.34 286.34ii. Tubular Structure 97268 57268 486.34 286.34
b. Shade net House 110000 80000 330.00 240.00i. Tubular Struture 110000 80000 330.00 240.00
IX Integrated pest Management 15000 15000 150.00 150.00Adoption of IPM (Ha) 15000 15000 150.00 150.00
X Organic farming 2200 2200 110.00 110.00a. Vermicompost unit
i. Vermi compost unit (HDPE Vermibed)
2200 2200 110.00 110.00
XI Horticulture Mechanization (Nos.) including PMRP
1461 882 305.50 204.21
a. Power operated machines/Tools including Power Saw and plant protection equipments
1460 881 255.50 154.21
b. Import of new machines &Tools for Horticulture demonstration purpose (public sector)
1 1 50.00 50.00
XII Human Resource development (HRD) (No.)
24860 22860 81.28 73.28
a. Training of farmer including women 6780 4780 30.30 22.30i. Within the district / per farmer excl.
transport6000 4000 24.00 16.00
ii. Within the state / per farmer excl. transport
500 500 3.50 3.50
iii. Outside the state / per farmer excl. transport
280 280 2.80 2.80
b. Exposure visit of farmers including women
15080 15080 40.48 40.48
i. Within district / per farmer excl. transport
10000 10000 25.00 25.00
ii. Within the state / per farmer excl. transport
5000 5000 15.00 15.00
iii. Outside the state / per farmer excl. transport
80 80 0.48 0.48
c. Training/ Study tour of Technical Officers/ field fundtionaries incolved in implementation of the Scheme at Central/ State level including women (perday)
3000 3000 10.50 10.50
i. Within the State / per participant plus TA/DA, as admissible
2000 2000 4.00 4.00
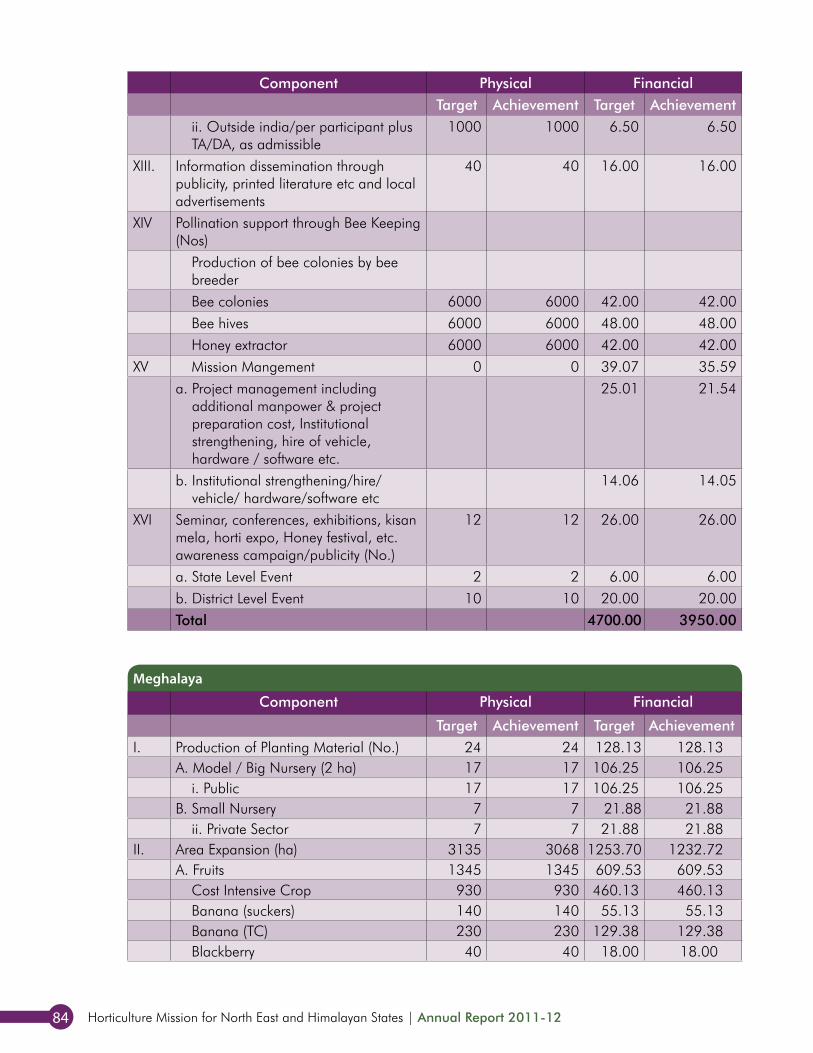
Horticulture Mission for North East and Himalayan States | Annual Report 2011-1284
Component Physical FinancialTarget Achievement Target Achievement
ii. Outside india/per participant plus TA/DA, as admissible
1000 1000 6.50 6.50
XIII. Information dissemination through publicity, printed literature etc and local advertisements
40 40 16.00 16.00
XIV Pollination support through Bee Keeping (Nos)
Production of bee colonies by bee breederBee colonies 6000 6000 42.00 42.00Bee hives 6000 6000 48.00 48.00Honey extractor 6000 6000 42.00 42.00
XV Mission Mangement 0 0 39.07 35.59a. Project management including
additional manpower & project preparation cost, Institutional strengthening, hire of vehicle, hardware / software etc.
25.01 21.54
b. Institutional strengthening/hire/ vehicle/ hardware/software etc
14.06 14.05
XVI Seminar, conferences, exhibitions, kisan mela, horti expo, Honey festival, etc. awareness campaign/publicity (No.)
12 12 26.00 26.00
a. State Level Event 2 2 6.00 6.00b. District Level Event 10 10 20.00 20.00Total 4700.00 3950.00
Component Physical Financial
Target Achievement Target AchievementI. Production of Planting Material (No.) 24 24 128.13 128.13
A. Model / Big Nursery (2 ha) 17 17 106.25 106.25i. Public 17 17 106.25 106.25
B. Small Nursery 7 7 21.88 21.88ii. Private Sector 7 7 21.88 21.88
II. Area Expansion (ha) 3135 3068 1253.70 1232.72A. Fruits 1345 1345 609.53 609.53
Cost Intensive Crop 930 930 460.13 460.13Banana (suckers) 140 140 55.13 55.13Banana (TC) 230 230 129.38 129.38Blackberry 40 40 18.00 18.00
Meghalaya
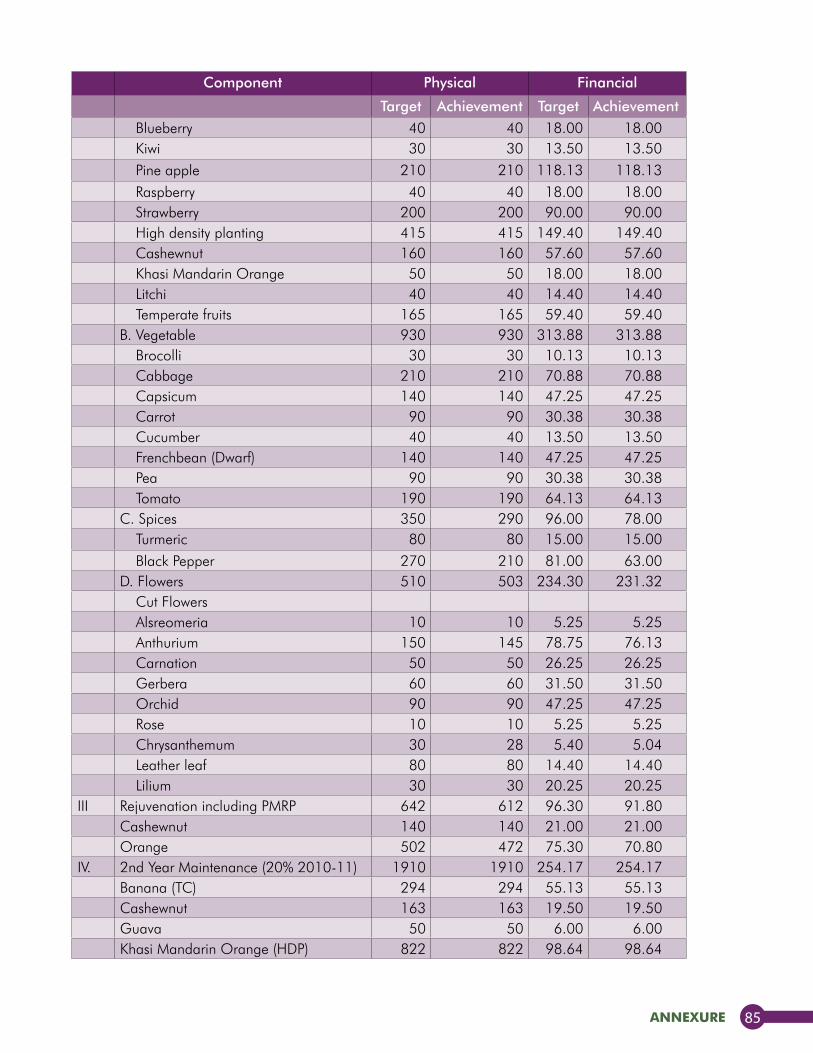
annexure 85
Component Physical Financial
Target Achievement Target AchievementBlueberry 40 40 18.00 18.00Kiwi 30 30 13.50 13.50Pine apple 210 210 118.13 118.13Raspberry 40 40 18.00 18.00Strawberry 200 200 90.00 90.00High density planting 415 415 149.40 149.40Cashewnut 160 160 57.60 57.60Khasi Mandarin Orange 50 50 18.00 18.00Litchi 40 40 14.40 14.40Temperate fruits 165 165 59.40 59.40
B. Vegetable 930 930 313.88 313.88Brocolli 30 30 10.13 10.13Cabbage 210 210 70.88 70.88Capsicum 140 140 47.25 47.25Carrot 90 90 30.38 30.38Cucumber 40 40 13.50 13.50Frenchbean (Dwarf) 140 140 47.25 47.25Pea 90 90 30.38 30.38Tomato 190 190 64.13 64.13
C. Spices 350 290 96.00 78.00Turmeric 80 80 15.00 15.00Black Pepper 270 210 81.00 63.00
D. Flowers 510 503 234.30 231.32Cut FlowersAlsreomeria 10 10 5.25 5.25Anthurium 150 145 78.75 76.13Carnation 50 50 26.25 26.25Gerbera 60 60 31.50 31.50Orchid 90 90 47.25 47.25Rose 10 10 5.25 5.25Chrysanthemum 30 28 5.40 5.04Leather leaf 80 80 14.40 14.40Lilium 30 30 20.25 20.25
III Rejuvenation including PMRP 642 612 96.30 91.80Cashewnut 140 140 21.00 21.00Orange 502 472 75.30 70.80
IV. 2nd Year Maintenance (20% 2010-11) 1910 1910 254.17 254.17Banana (TC) 294 294 55.13 55.13Cashewnut 163 163 19.50 19.50Guava 50 50 6.00 6.00Khasi Mandarin Orange (HDP) 822 822 98.64 98.64
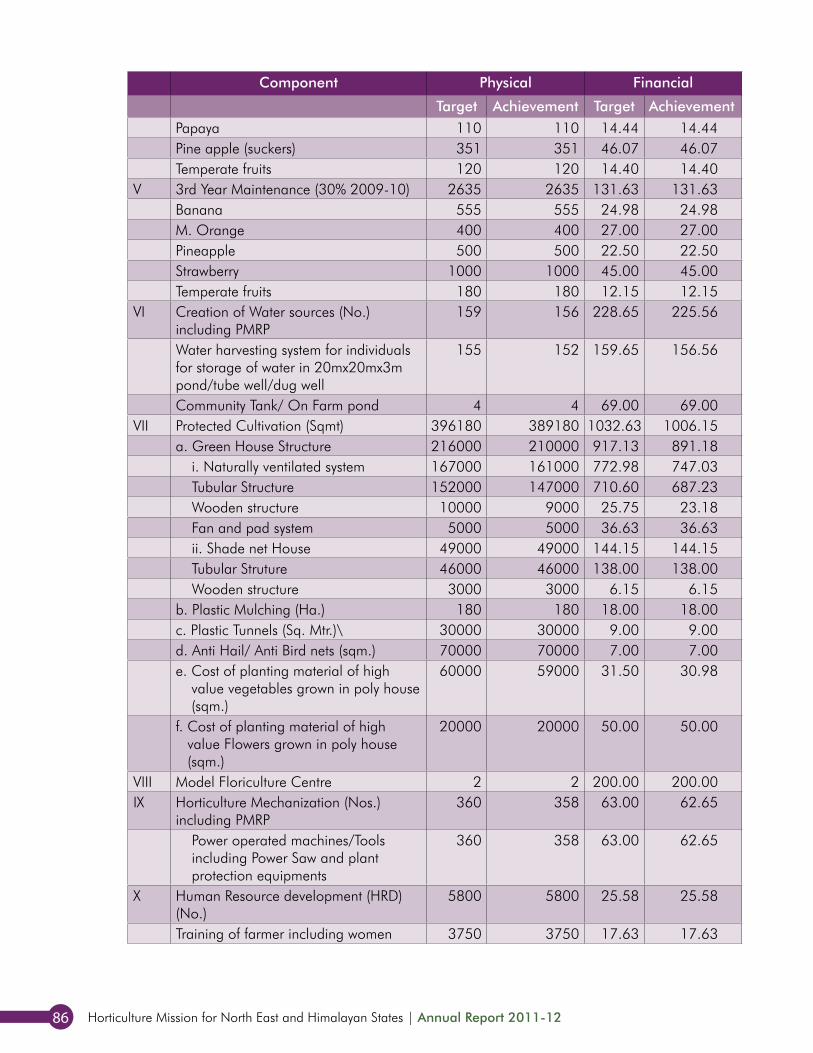
Horticulture Mission for North East and Himalayan States | Annual Report 2011-1286
Component Physical Financial
Target Achievement Target AchievementPapaya 110 110 14.44 14.44Pine apple (suckers) 351 351 46.07 46.07Temperate fruits 120 120 14.40 14.40
V 3rd Year Maintenance (30% 2009-10) 2635 2635 131.63 131.63Banana 555 555 24.98 24.98M. Orange 400 400 27.00 27.00Pineapple 500 500 22.50 22.50Strawberry 1000 1000 45.00 45.00Temperate fruits 180 180 12.15 12.15
VI Creation of Water sources (No.) including PMRP
159 156 228.65 225.56
Water harvesting system for individuals for storage of water in 20mx20mx3m pond/tube well/dug well
155 152 159.65 156.56
Community Tank/ On Farm pond 4 4 69.00 69.00VII Protected Cultivation (Sqmt) 396180 389180 1032.63 1006.15
a. Green House Structure 216000 210000 917.13 891.18i. Naturally ventilated system 167000 161000 772.98 747.03Tubular Structure 152000 147000 710.60 687.23Wooden structure 10000 9000 25.75 23.18Fan and pad system 5000 5000 36.63 36.63ii. Shade net House 49000 49000 144.15 144.15Tubular Struture 46000 46000 138.00 138.00Wooden structure 3000 3000 6.15 6.15
b. Plastic Mulching (Ha.) 180 180 18.00 18.00c. Plastic Tunnels (Sq. Mtr.)\ 30000 30000 9.00 9.00d. Anti Hail/ Anti Bird nets (sqm.) 70000 70000 7.00 7.00e. Cost of planting material of high
value vegetables grown in poly house (sqm.)
60000 59000 31.50 30.98
f. Cost of planting material of high value Flowers grown in poly house (sqm.)
20000 20000 50.00 50.00
VIII Model Floriculture Centre 2 2 200.00 200.00IX Horticulture Mechanization (Nos.)
including PMRP360 358 63.00 62.65
Power operated machines/Tools including Power Saw and plant protection equipments
360 358 63.00 62.65
X Human Resource development (HRD) (No.)
5800 5800 25.58 25.58
Training of farmer including women 3750 3750 17.63 17.63

annexure 87
Component Physical Financial
Target Achievement Target AchievementWithin the district / per farmer excl. transport
3000 3000 12.00 12.00
Within the state / per farmer excl. transport
750 750 5.63 5.63
Exposure visit of farmers including women
1450 1450 4.05 4.05
Within district / per farmer excl. transport
600 600 1.50 1.50
Within the state / per farmer excl. transport
850 850 2.55 2.55
Training/ Study tour of Technical Officers/ field fundtionaries incolved in implementation of the Scheme at Central/ State level including women (perday)
600 600 3.90 3.90
Outside india / per participant plus TA/DA, as admissible
600 600 3.90 3.90
XI Information dissemination through publicity, printed literature etc and local advertisements
21 21 8.40 8.40
XIII. Pollination support through Bee Keeping (Nos)
690 690 8.30 8.30
Production of bee colonies by bee breederBee colonies 320 320 2.24 2.24Bee hives 320 320 2.56 2.56Honey extractor 50 50 3.50 3.50
XIII Mission Mangement 0 0 34.53 34.43State & District Mission Offices and implementing agencies for administrative expenses,field consultant,project preparation, computerisation contingency etc.
29.53 29.43
Institutional strengthening/hire/ vehicle/ hardware/software etc
5.00 5.00
XIV. Seminar, conferences, exhibitions, kisan mela, horti expo, Honey festival, etc. awareness campaign/publicity (No.)
16 16 35.00 35.00
a. State Level Event 3 3 9.00 9.00b. District Level Event 13 13 26.00 26.00Total 3500.00 3444.50
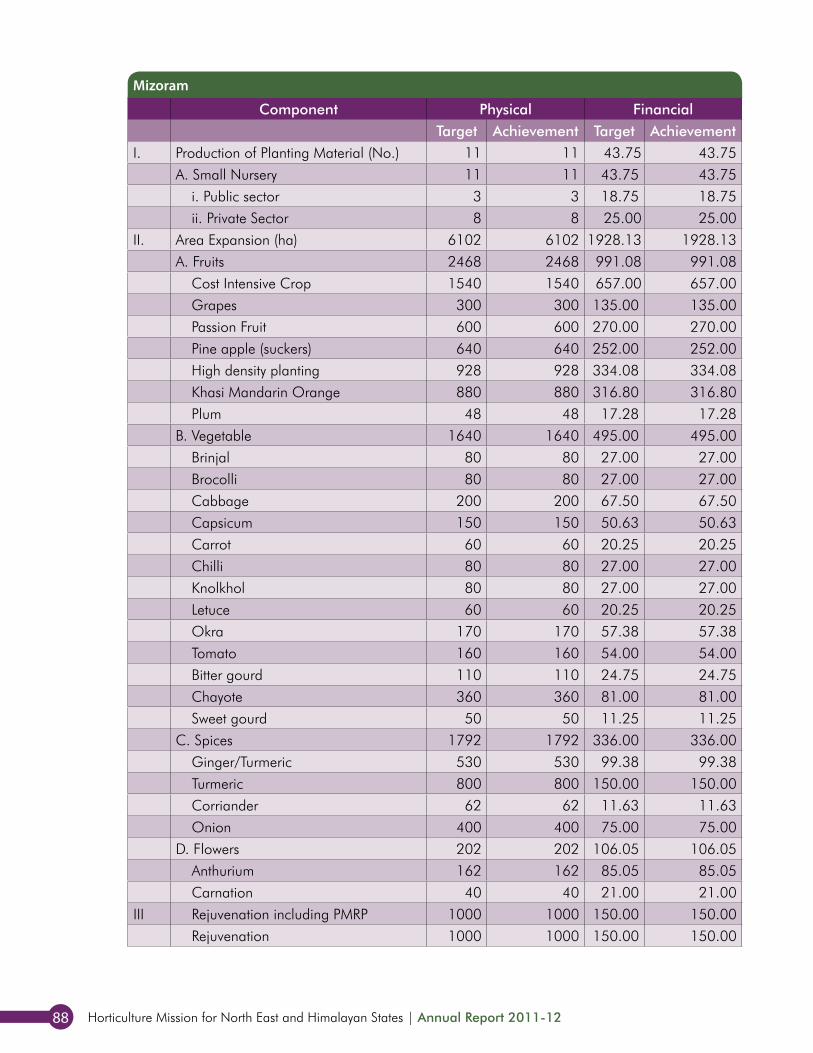
Horticulture Mission for North East and Himalayan States | Annual Report 2011-1288
Component Physical FinancialTarget Achievement Target Achievement
I. Production of Planting Material (No.) 11 11 43.75 43.75A. Small Nursery 11 11 43.75 43.75
i. Public sector 3 3 18.75 18.75ii. Private Sector 8 8 25.00 25.00
II. Area Expansion (ha) 6102 6102 1928.13 1928.13A. Fruits 2468 2468 991.08 991.08
Cost Intensive Crop 1540 1540 657.00 657.00Grapes 300 300 135.00 135.00Passion Fruit 600 600 270.00 270.00Pine apple (suckers) 640 640 252.00 252.00High density planting 928 928 334.08 334.08Khasi Mandarin Orange 880 880 316.80 316.80Plum 48 48 17.28 17.28
B. Vegetable 1640 1640 495.00 495.00Brinjal 80 80 27.00 27.00Brocolli 80 80 27.00 27.00Cabbage 200 200 67.50 67.50Capsicum 150 150 50.63 50.63Carrot 60 60 20.25 20.25Chilli 80 80 27.00 27.00Knolkhol 80 80 27.00 27.00Letuce 60 60 20.25 20.25Okra 170 170 57.38 57.38Tomato 160 160 54.00 54.00Bitter gourd 110 110 24.75 24.75Chayote 360 360 81.00 81.00Sweet gourd 50 50 11.25 11.25
C. Spices 1792 1792 336.00 336.00Ginger/Turmeric 530 530 99.38 99.38Turmeric 800 800 150.00 150.00Corriander 62 62 11.63 11.63Onion 400 400 75.00 75.00
D. Flowers 202 202 106.05 106.05Anthurium 162 162 85.05 85.05Carnation 40 40 21.00 21.00
III Rejuvenation including PMRP 1000 1000 150.00 150.00Rejuvenation 1000 1000 150.00 150.00
Mizoram
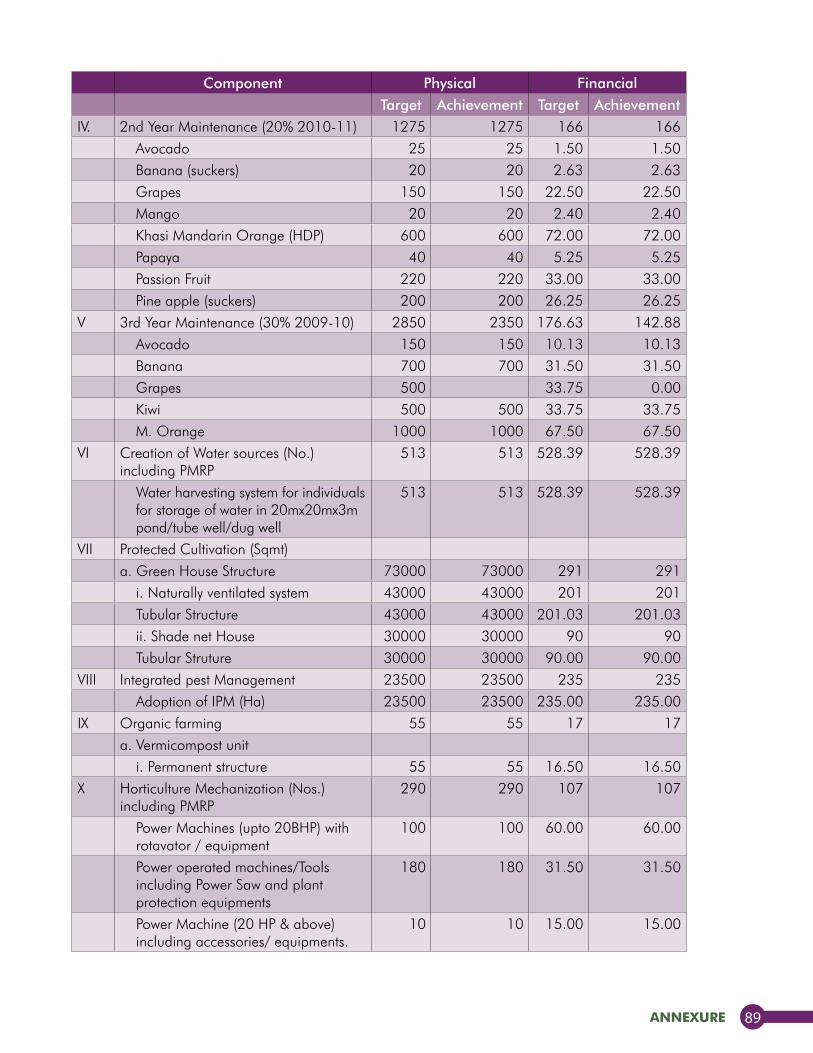
annexure 89
Component Physical FinancialTarget Achievement Target Achievement
IV. 2nd Year Maintenance (20% 2010-11) 1275 1275 166 166Avocado 25 25 1.50 1.50Banana (suckers) 20 20 2.63 2.63Grapes 150 150 22.50 22.50Mango 20 20 2.40 2.40Khasi Mandarin Orange (HDP) 600 600 72.00 72.00Papaya 40 40 5.25 5.25Passion Fruit 220 220 33.00 33.00Pine apple (suckers) 200 200 26.25 26.25
V 3rd Year Maintenance (30% 2009-10) 2850 2350 176.63 142.88Avocado 150 150 10.13 10.13Banana 700 700 31.50 31.50Grapes 500 33.75 0.00Kiwi 500 500 33.75 33.75M. Orange 1000 1000 67.50 67.50
VI Creation of Water sources (No.) including PMRP
513 513 528.39 528.39
Water harvesting system for individuals for storage of water in 20mx20mx3m pond/tube well/dug well
513 513 528.39 528.39
VII Protected Cultivation (Sqmt)a. Green House Structure 73000 73000 291 291
i. Naturally ventilated system 43000 43000 201 201Tubular Structure 43000 43000 201.03 201.03ii. Shade net House 30000 30000 90 90Tubular Struture 30000 30000 90.00 90.00
VIII Integrated pest Management 23500 23500 235 235Adoption of IPM (Ha) 23500 23500 235.00 235.00
IX Organic farming 55 55 17 17a. Vermicompost unit
i. Permanent structure 55 55 16.50 16.50X Horticulture Mechanization (Nos.)
including PMRP290 290 107 107
Power Machines (upto 20BHP) with rotavator / equipment
100 100 60.00 60.00
Power operated machines/Tools including Power Saw and plant protection equipments
180 180 31.50 31.50
Power Machine (20 HP & above) including accessories/ equipments.
10 10 15.00 15.00
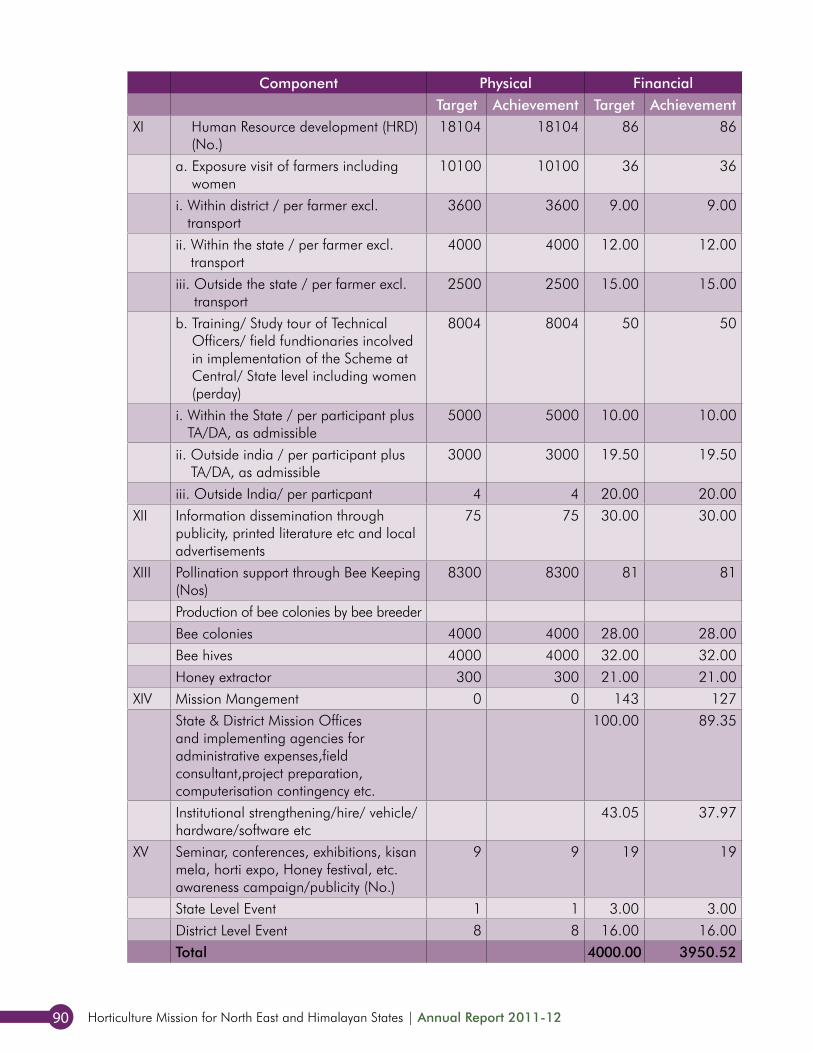
Horticulture Mission for North East and Himalayan States | Annual Report 2011-1290
Component Physical FinancialTarget Achievement Target Achievement
XI Human Resource development (HRD) (No.)
18104 18104 86 86
a. Exposure visit of farmers including women
10100 10100 36 36
i. Within district / per farmer excl. transport
3600 3600 9.00 9.00
ii. Within the state / per farmer excl. transport
4000 4000 12.00 12.00
iii. Outside the state / per farmer excl. transport
2500 2500 15.00 15.00
b. Training/ Study tour of Technical Officers/ field fundtionaries incolved in implementation of the Scheme at Central/ State level including women (perday)
8004 8004 50 50
i. Within the State / per participant plus TA/DA, as admissible
5000 5000 10.00 10.00
ii. Outside india / per participant plus TA/DA, as admissible
3000 3000 19.50 19.50
iii. Outside India/ per particpant 4 4 20.00 20.00XII Information dissemination through
publicity, printed literature etc and local advertisements
75 75 30.00 30.00
XIII Pollination support through Bee Keeping (Nos)
8300 8300 81 81
Production of bee colonies by bee breederBee colonies 4000 4000 28.00 28.00Bee hives 4000 4000 32.00 32.00Honey extractor 300 300 21.00 21.00
XIV Mission Mangement 0 0 143 127State & District Mission Offices and implementing agencies for administrative expenses,field consultant,project preparation, computerisation contingency etc.
100.00 89.35
Institutional strengthening/hire/ vehicle/ hardware/software etc
43.05 37.97
XV Seminar, conferences, exhibitions, kisan mela, horti expo, Honey festival, etc. awareness campaign/publicity (No.)
9 9 19 19
State Level Event 1 1 3.00 3.00District Level Event 8 8 16.00 16.00Total 4000.00 3950.52
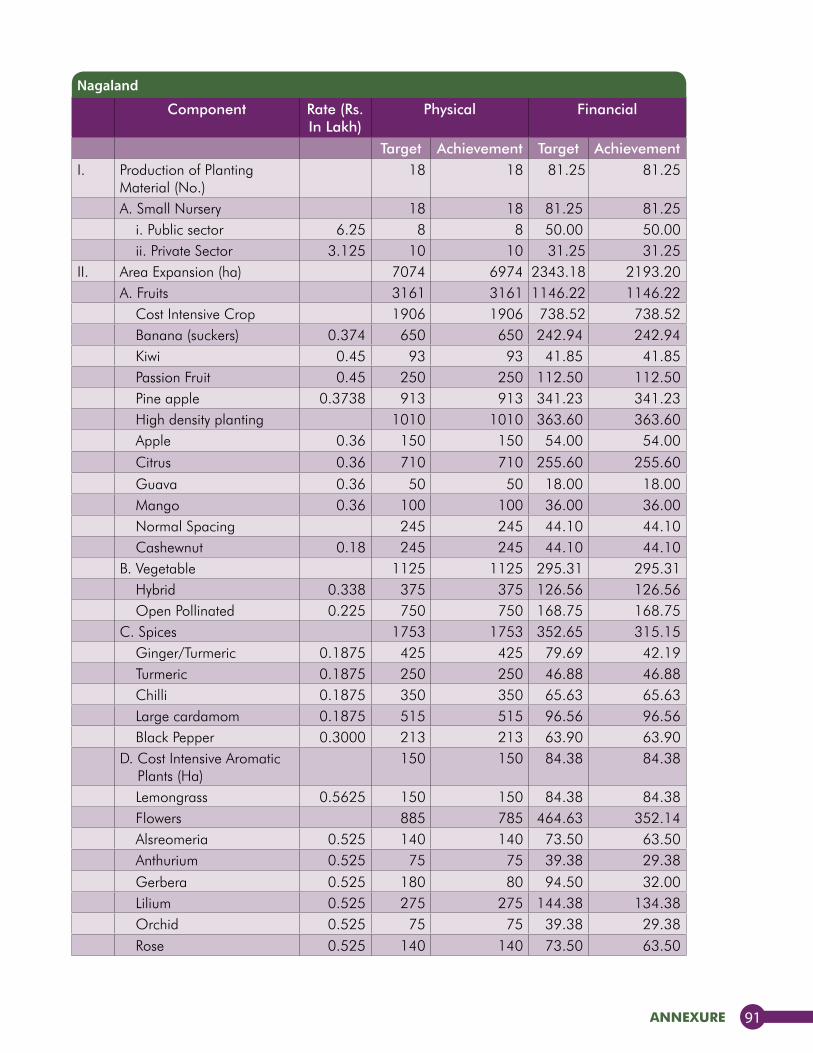
annexure 91
Component Rate (Rs. In Lakh)
Physical Financial
Target Achievement Target AchievementI. Production of Planting
Material (No.)18 18 81.25 81.25
A. Small Nursery 18 18 81.25 81.25i. Public sector 6.25 8 8 50.00 50.00ii. Private Sector 3.125 10 10 31.25 31.25
II. Area Expansion (ha) 7074 6974 2343.18 2193.20A. Fruits 3161 3161 1146.22 1146.22
Cost Intensive Crop 1906 1906 738.52 738.52Banana (suckers) 0.374 650 650 242.94 242.94Kiwi 0.45 93 93 41.85 41.85Passion Fruit 0.45 250 250 112.50 112.50Pine apple 0.3738 913 913 341.23 341.23High density planting 1010 1010 363.60 363.60Apple 0.36 150 150 54.00 54.00Citrus 0.36 710 710 255.60 255.60Guava 0.36 50 50 18.00 18.00Mango 0.36 100 100 36.00 36.00Normal Spacing 245 245 44.10 44.10Cashewnut 0.18 245 245 44.10 44.10
B. Vegetable 1125 1125 295.31 295.31Hybrid 0.338 375 375 126.56 126.56Open Pollinated 0.225 750 750 168.75 168.75
C. Spices 1753 1753 352.65 315.15Ginger/Turmeric 0.1875 425 425 79.69 42.19Turmeric 0.1875 250 250 46.88 46.88Chilli 0.1875 350 350 65.63 65.63Large cardamom 0.1875 515 515 96.56 96.56Black Pepper 0.3000 213 213 63.90 63.90
D. Cost Intensive Aromatic Plants (Ha)
150 150 84.38 84.38
Lemongrass 0.5625 150 150 84.38 84.38Flowers 885 785 464.63 352.14Alsreomeria 0.525 140 140 73.50 63.50Anthurium 0.525 75 75 39.38 29.38Gerbera 0.525 180 80 94.50 32.00Lilium 0.525 275 275 144.38 134.38Orchid 0.525 75 75 39.38 29.38Rose 0.525 140 140 73.50 63.50
Nagaland
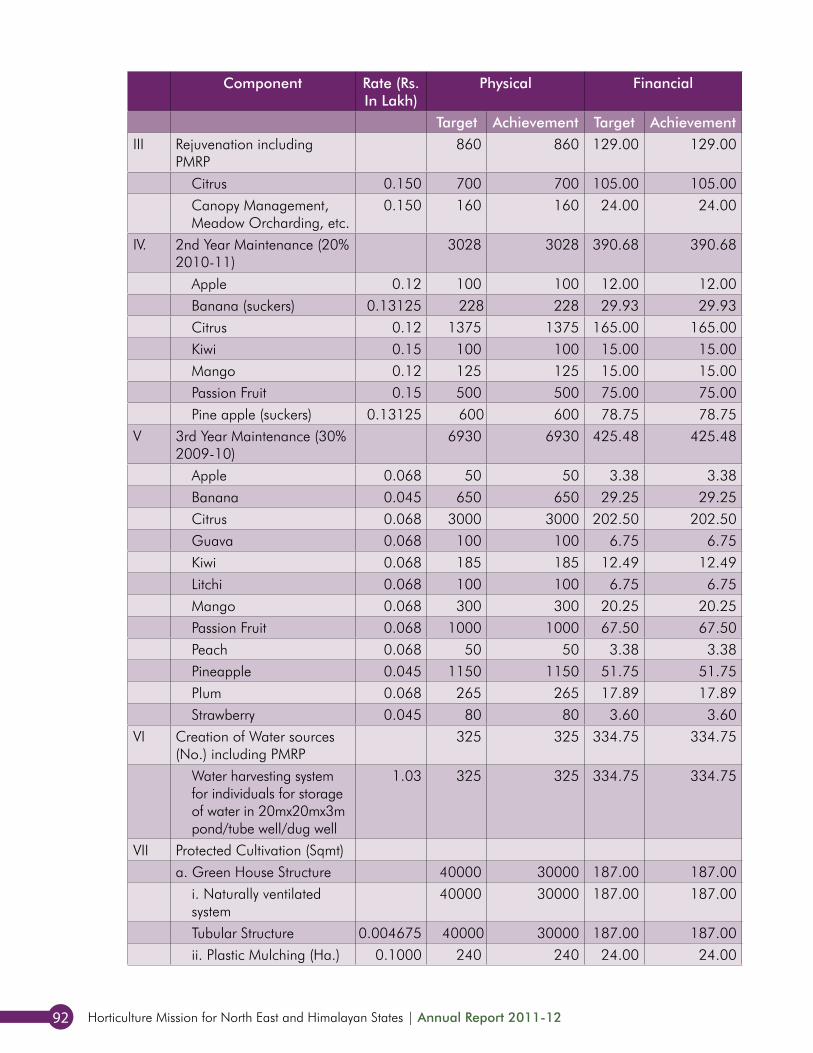
Horticulture Mission for North East and Himalayan States | Annual Report 2011-1292
Component Rate (Rs. In Lakh)
Physical Financial
Target Achievement Target AchievementIII Rejuvenation including
PMRP860 860 129.00 129.00
Citrus 0.150 700 700 105.00 105.00Canopy Management, Meadow Orcharding, etc.
0.150 160 160 24.00 24.00
IV. 2nd Year Maintenance (20% 2010-11)
3028 3028 390.68 390.68
Apple 0.12 100 100 12.00 12.00Banana (suckers) 0.13125 228 228 29.93 29.93Citrus 0.12 1375 1375 165.00 165.00Kiwi 0.15 100 100 15.00 15.00Mango 0.12 125 125 15.00 15.00Passion Fruit 0.15 500 500 75.00 75.00Pine apple (suckers) 0.13125 600 600 78.75 78.75
V 3rd Year Maintenance (30% 2009-10)
6930 6930 425.48 425.48
Apple 0.068 50 50 3.38 3.38Banana 0.045 650 650 29.25 29.25Citrus 0.068 3000 3000 202.50 202.50Guava 0.068 100 100 6.75 6.75Kiwi 0.068 185 185 12.49 12.49Litchi 0.068 100 100 6.75 6.75Mango 0.068 300 300 20.25 20.25Passion Fruit 0.068 1000 1000 67.50 67.50Peach 0.068 50 50 3.38 3.38Pineapple 0.045 1150 1150 51.75 51.75Plum 0.068 265 265 17.89 17.89Strawberry 0.045 80 80 3.60 3.60
VI Creation of Water sources (No.) including PMRP
325 325 334.75 334.75
Water harvesting system for individuals for storage of water in 20mx20mx3m pond/tube well/dug well
1.03 325 325 334.75 334.75
VII Protected Cultivation (Sqmt)a. Green House Structure 40000 30000 187.00 187.00
i. Naturally ventilated system
40000 30000 187.00 187.00
Tubular Structure 0.004675 40000 30000 187.00 187.00ii. Plastic Mulching (Ha.) 0.1000 240 240 24.00 24.00

annexure 93
Component Rate (Rs. In Lakh)
Physical Financial
Target Achievement Target AchievementVIII Integrated pest
Management 7510 7510 75.10 75.10
Adoption of IPM (Ha) 0.01 7510 7510 75.10 75.10IX Integrated Nutrient
Management (Ha)0.01 8800 8800 88.00 88.00
X Organic farminga. Vermicompost unit
i. Vermi compost unit (HDPE Vermibed)
0.05 200 200 10.00 10.00
XI Organic Farming 2nd Year (2010-11)
Adoption of Organic Farming (2nd Year from 2010-11)
0.03 1100 1100 33.00 33.00
Adoption of Organic Farming (1st Year from 2010-11)
0.04 2000 2000 80.00 80.00
Organic Certification (2nd Year from 2010-11)
1.5 5 5 7.50 7.50
Organic Certification (1st Year from 2010-11)
1.5 5 5 7.50 7.50
XII Horticulture Mechanization (Nos.) including PMRP
340 340 177.50 177.50
Power Machines (upto 20BHP) with rotavator / equipment
0.600 75 75 45.00 45.00
Power operated machines/Tools including Power Saw and plant protection equipments
0.175 200 200 35.00 35.00
Power Machine (20 HP & above) including accessories/ equipments.
1.50 65 65 97.50 97.50
XIII Human Resource development (HRD) (No.)
9803 9803 65.45 65.45
a. Training of farmer including women
5500 5500 35.50 35.50
i. Within the district / per farmer excl. transport
0.004 2500 2500 10.00 10.00
ii. Within the state / per farmer excl. transport
0.007 1500 1500 10.50 10.50
iii. Outside the state / per farmer excl. transport
0.010 1500 1500 15.00 15.00
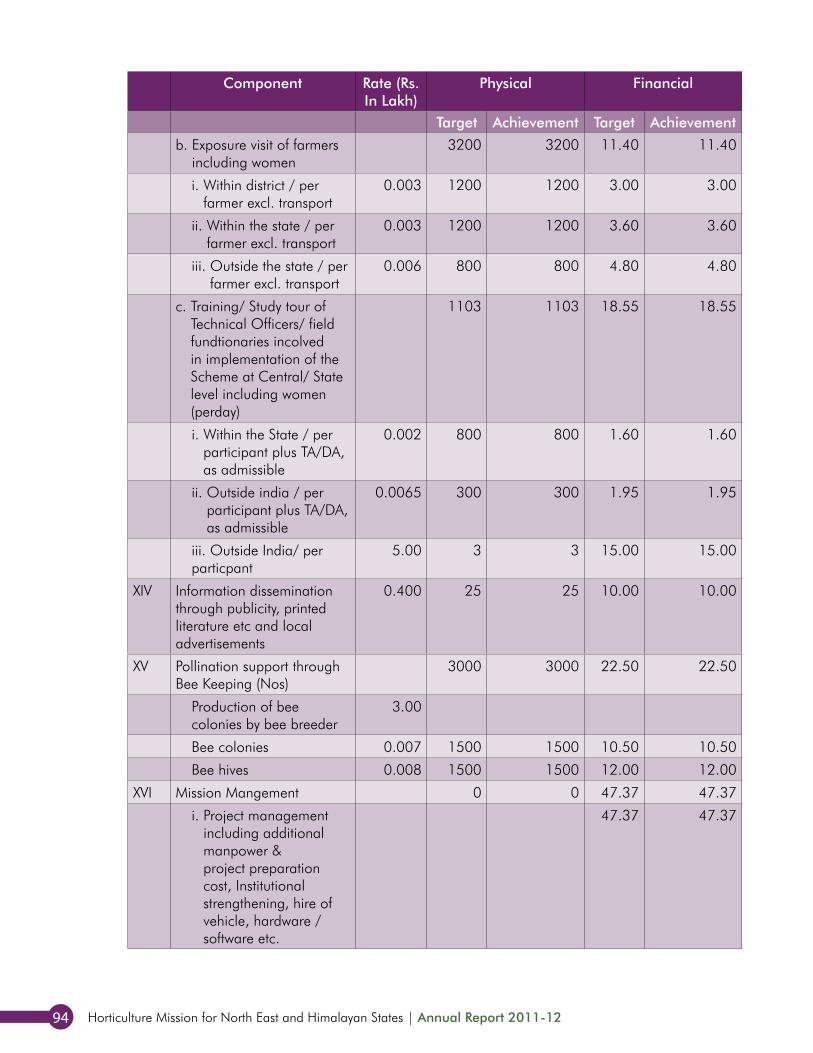
Horticulture Mission for North East and Himalayan States | Annual Report 2011-1294
Component Rate (Rs. In Lakh)
Physical Financial
Target Achievement Target Achievement
b. Exposure visit of farmers including women
3200 3200 11.40 11.40
i. Within district / per farmer excl. transport
0.003 1200 1200 3.00 3.00
ii. Within the state / per farmer excl. transport
0.003 1200 1200 3.60 3.60
iii. Outside the state / per farmer excl. transport
0.006 800 800 4.80 4.80
c. Training/ Study tour of Technical Officers/ field fundtionaries incolved in implementation of the Scheme at Central/ State level including women (perday)
1103 1103 18.55 18.55
i. Within the State / per participant plus TA/DA, as admissible
0.002 800 800 1.60 1.60
ii. Outside india / per participant plus TA/DA, as admissible
0.0065 300 300 1.95 1.95
iii. Outside India/ per particpant
5.00 3 3 15.00 15.00
XIV Information dissemination through publicity, printed literature etc and local advertisements
0.400 25 25 10.00 10.00
XV Pollination support through Bee Keeping (Nos)
3000 3000 22.50 22.50
Production of bee colonies by bee breeder
3.00
Bee colonies 0.007 1500 1500 10.50 10.50
Bee hives 0.008 1500 1500 12.00 12.00
XVI Mission Mangement 0 0 47.37 47.37
i. Project management including additional manpower & project preparation cost, Institutional strengthening, hire of vehicle, hardware / software etc.
47.37 47.37
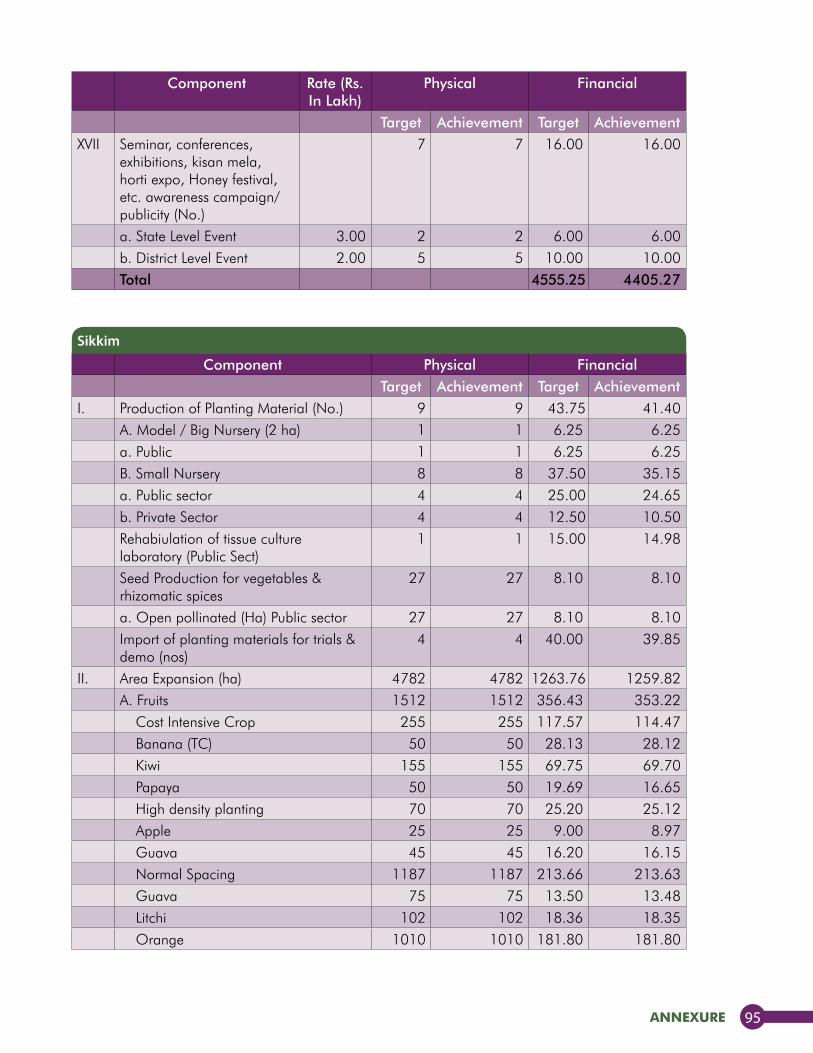
annexure 95
Component Rate (Rs. In Lakh)
Physical Financial
Target Achievement Target AchievementXVII Seminar, conferences,
exhibitions, kisan mela, horti expo, Honey festival, etc. awareness campaign/publicity (No.)
7 7 16.00 16.00
a. State Level Event 3.00 2 2 6.00 6.00b. District Level Event 2.00 5 5 10.00 10.00Total 4555.25 4405.27
Component Physical FinancialTarget Achievement Target Achievement
I. Production of Planting Material (No.) 9 9 43.75 41.40A. Model / Big Nursery (2 ha) 1 1 6.25 6.25a. Public 1 1 6.25 6.25B. Small Nursery 8 8 37.50 35.15a. Public sector 4 4 25.00 24.65b. Private Sector 4 4 12.50 10.50Rehabiulation of tissue culture laboratory (Public Sect)
1 1 15.00 14.98
Seed Production for vegetables & rhizomatic spices
27 27 8.10 8.10
a. Open pollinated (Ha) Public sector 27 27 8.10 8.10Import of planting materials for trials & demo (nos)
4 4 40.00 39.85
II. Area Expansion (ha) 4782 4782 1263.76 1259.82A. Fruits 1512 1512 356.43 353.22
Cost Intensive Crop 255 255 117.57 114.47Banana (TC) 50 50 28.13 28.12Kiwi 155 155 69.75 69.70Papaya 50 50 19.69 16.65High density planting 70 70 25.20 25.12Apple 25 25 9.00 8.97Guava 45 45 16.20 16.15Normal Spacing 1187 1187 213.66 213.63Guava 75 75 13.50 13.48Litchi 102 102 18.36 18.35Orange 1010 1010 181.80 181.80
Sikkim
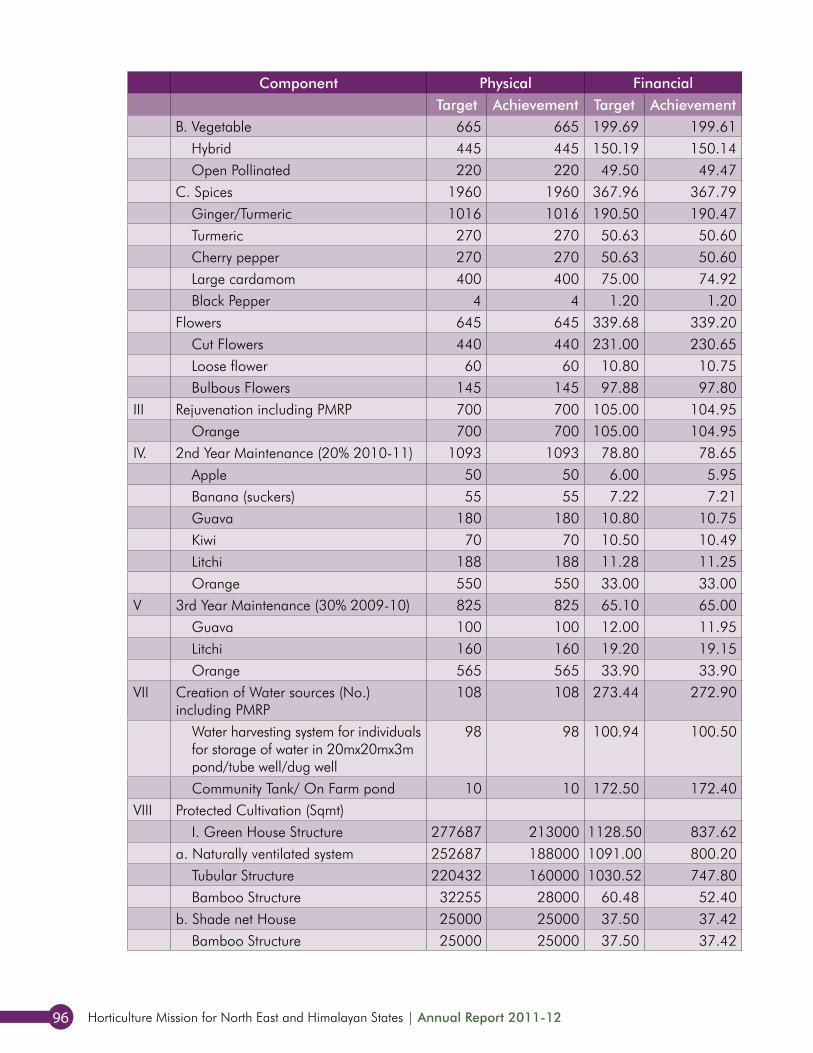
Horticulture Mission for North East and Himalayan States | Annual Report 2011-1296
Component Physical FinancialTarget Achievement Target Achievement
B. Vegetable 665 665 199.69 199.61Hybrid 445 445 150.19 150.14Open Pollinated 220 220 49.50 49.47
C. Spices 1960 1960 367.96 367.79Ginger/Turmeric 1016 1016 190.50 190.47Turmeric 270 270 50.63 50.60Cherry pepper 270 270 50.63 50.60Large cardamom 400 400 75.00 74.92Black Pepper 4 4 1.20 1.20
Flowers 645 645 339.68 339.20Cut Flowers 440 440 231.00 230.65Loose flower 60 60 10.80 10.75Bulbous Flowers 145 145 97.88 97.80
III Rejuvenation including PMRP 700 700 105.00 104.95Orange 700 700 105.00 104.95
IV. 2nd Year Maintenance (20% 2010-11) 1093 1093 78.80 78.65Apple 50 50 6.00 5.95Banana (suckers) 55 55 7.22 7.21Guava 180 180 10.80 10.75Kiwi 70 70 10.50 10.49Litchi 188 188 11.28 11.25Orange 550 550 33.00 33.00
V 3rd Year Maintenance (30% 2009-10) 825 825 65.10 65.00Guava 100 100 12.00 11.95Litchi 160 160 19.20 19.15Orange 565 565 33.90 33.90
VII Creation of Water sources (No.) including PMRP
108 108 273.44 272.90
Water harvesting system for individuals for storage of water in 20mx20mx3m pond/tube well/dug well
98 98 100.94 100.50
Community Tank/ On Farm pond 10 10 172.50 172.40VIII Protected Cultivation (Sqmt)
I. Green House Structure 277687 213000 1128.50 837.62a. Naturally ventilated system 252687 188000 1091.00 800.20
Tubular Structure 220432 160000 1030.52 747.80Bamboo Structure 32255 28000 60.48 52.40
b. Shade net House 25000 25000 37.50 37.42Bamboo Structure 25000 25000 37.50 37.42
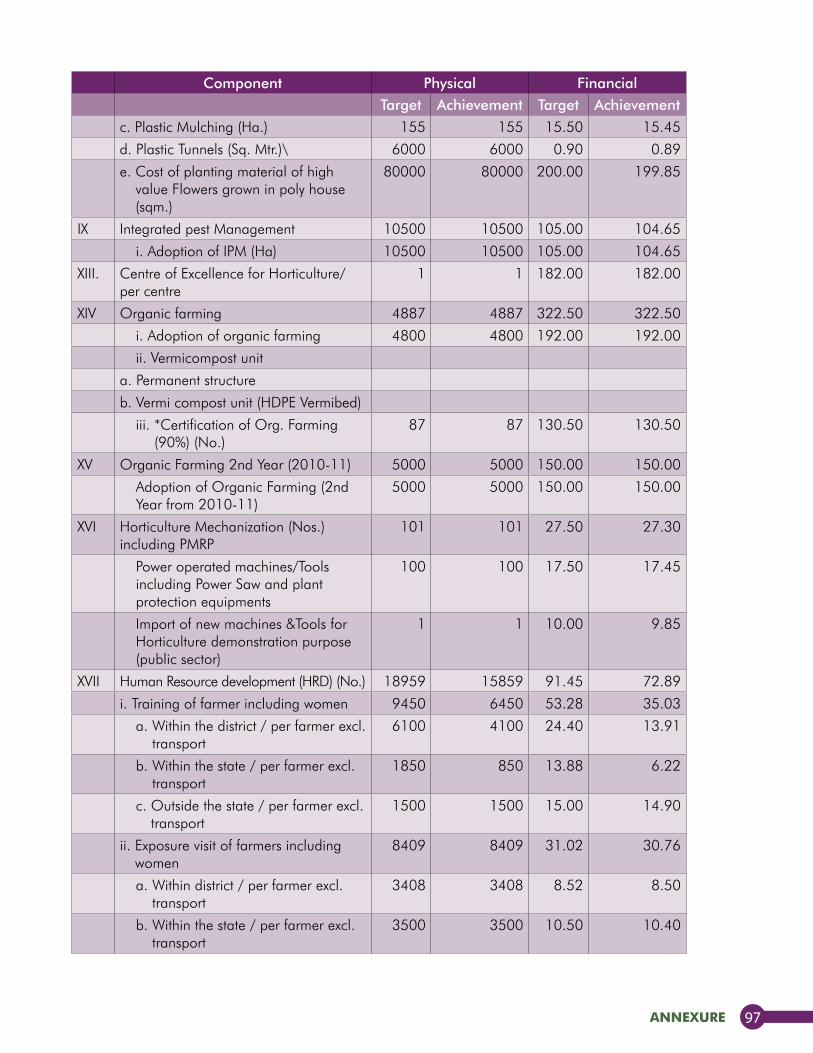
annexure 97
Component Physical FinancialTarget Achievement Target Achievement
c. Plastic Mulching (Ha.) 155 155 15.50 15.45
d. Plastic Tunnels (Sq. Mtr.)\ 6000 6000 0.90 0.89
e. Cost of planting material of high value Flowers grown in poly house (sqm.)
80000 80000 200.00 199.85
IX Integrated pest Management 10500 10500 105.00 104.65
i. Adoption of IPM (Ha) 10500 10500 105.00 104.65
XIII. Centre of Excellence for Horticulture/ per centre
1 1 182.00 182.00
XIV Organic farming 4887 4887 322.50 322.50
i. Adoption of organic farming 4800 4800 192.00 192.00
ii. Vermicompost unit
a. Permanent structure
b. Vermi compost unit (HDPE Vermibed)
iii. *Certification of Org. Farming (90%) (No.)
87 87 130.50 130.50
XV Organic Farming 2nd Year (2010-11) 5000 5000 150.00 150.00
Adoption of Organic Farming (2nd Year from 2010-11)
5000 5000 150.00 150.00
XVI Horticulture Mechanization (Nos.) including PMRP
101 101 27.50 27.30
Power operated machines/Tools including Power Saw and plant protection equipments
100 100 17.50 17.45
Import of new machines &Tools for Horticulture demonstration purpose (public sector)
1 1 10.00 9.85
XVII Human Resource development (HRD) (No.) 18959 15859 91.45 72.89
i. Training of farmer including women 9450 6450 53.28 35.03
a. Within the district / per farmer excl. transport
6100 4100 24.40 13.91
b. Within the state / per farmer excl. transport
1850 850 13.88 6.22
c. Outside the state / per farmer excl. transport
1500 1500 15.00 14.90
ii. Exposure visit of farmers including women
8409 8409 31.02 30.76
a. Within district / per farmer excl. transport
3408 3408 8.52 8.50
b. Within the state / per farmer excl. transport
3500 3500 10.50 10.40
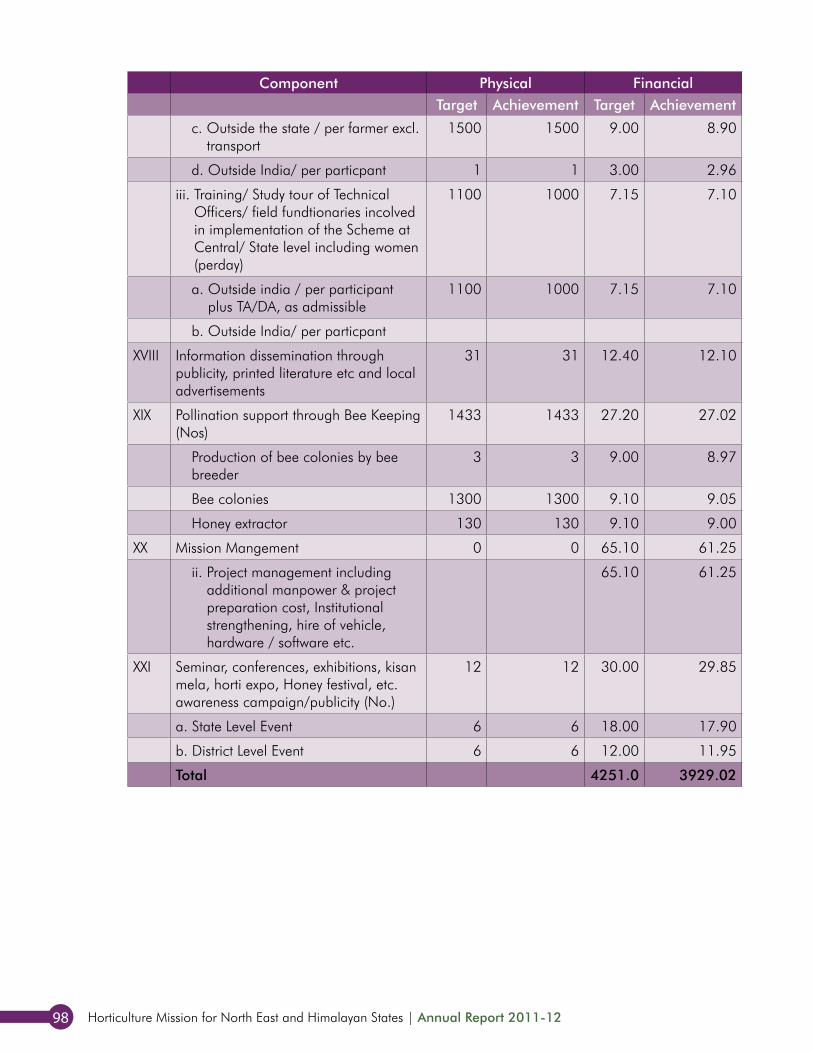
Horticulture Mission for North East and Himalayan States | Annual Report 2011-1298
Component Physical FinancialTarget Achievement Target Achievement
c. Outside the state / per farmer excl. transport
1500 1500 9.00 8.90
d. Outside India/ per particpant 1 1 3.00 2.96
iii. Training/ Study tour of Technical Officers/ field fundtionaries incolved in implementation of the Scheme at Central/ State level including women (perday)
1100 1000 7.15 7.10
a. Outside india / per participant plus TA/DA, as admissible
1100 1000 7.15 7.10
b. Outside India/ per particpant
XVIII Information dissemination through publicity, printed literature etc and local advertisements
31 31 12.40 12.10
XIX Pollination support through Bee Keeping (Nos)
1433 1433 27.20 27.02
Production of bee colonies by bee breeder
3 3 9.00 8.97
Bee colonies 1300 1300 9.10 9.05
Honey extractor 130 130 9.10 9.00
XX Mission Mangement 0 0 65.10 61.25
ii. Project management including additional manpower & project preparation cost, Institutional strengthening, hire of vehicle, hardware / software etc.
65.10 61.25
XXI Seminar, conferences, exhibitions, kisan mela, horti expo, Honey festival, etc. awareness campaign/publicity (No.)
12 12 30.00 29.85
a. State Level Event 6 6 18.00 17.90
b. District Level Event 6 6 12.00 11.95
Total 4251.0 3929.02
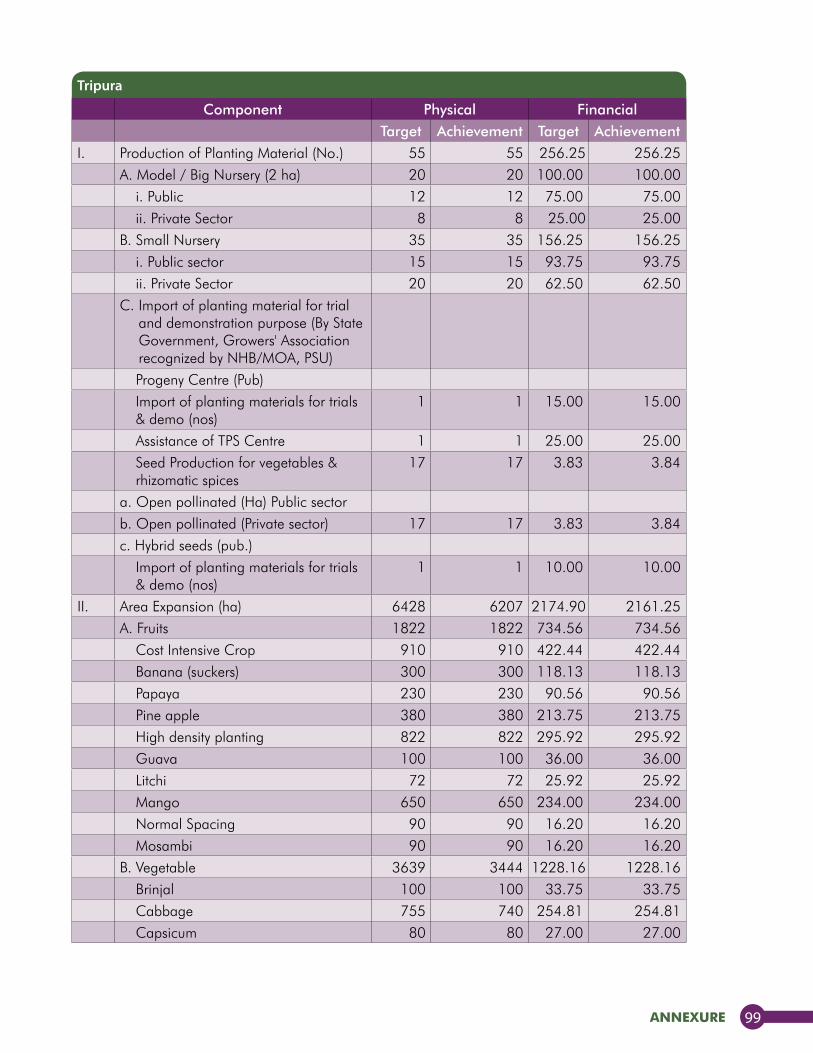
annexure 99
Component Physical FinancialTarget Achievement Target Achievement
I. Production of Planting Material (No.) 55 55 256.25 256.25A. Model / Big Nursery (2 ha) 20 20 100.00 100.00
i. Public 12 12 75.00 75.00ii. Private Sector 8 8 25.00 25.00
B. Small Nursery 35 35 156.25 156.25i. Public sector 15 15 93.75 93.75ii. Private Sector 20 20 62.50 62.50
C. Import of planting material for trial and demonstration purpose (By State Government, Growers' Association recognized by NHB/MOA, PSU)Progeny Centre (Pub)Import of planting materials for trials & demo (nos)
1 1 15.00 15.00
Assistance of TPS Centre 1 1 25.00 25.00Seed Production for vegetables & rhizomatic spices
17 17 3.83 3.84
a. Open pollinated (Ha) Public sectorb. Open pollinated (Private sector) 17 17 3.83 3.84c. Hybrid seeds (pub.)
Import of planting materials for trials & demo (nos)
1 1 10.00 10.00
II. Area Expansion (ha) 6428 6207 2174.90 2161.25A. Fruits 1822 1822 734.56 734.56
Cost Intensive Crop 910 910 422.44 422.44Banana (suckers) 300 300 118.13 118.13Papaya 230 230 90.56 90.56Pine apple 380 380 213.75 213.75High density planting 822 822 295.92 295.92Guava 100 100 36.00 36.00Litchi 72 72 25.92 25.92Mango 650 650 234.00 234.00Normal Spacing 90 90 16.20 16.20Mosambi 90 90 16.20 16.20
B. Vegetable 3639 3444 1228.16 1228.16Brinjal 100 100 33.75 33.75Cabbage 755 740 254.81 254.81Capsicum 80 80 27.00 27.00
Tripura
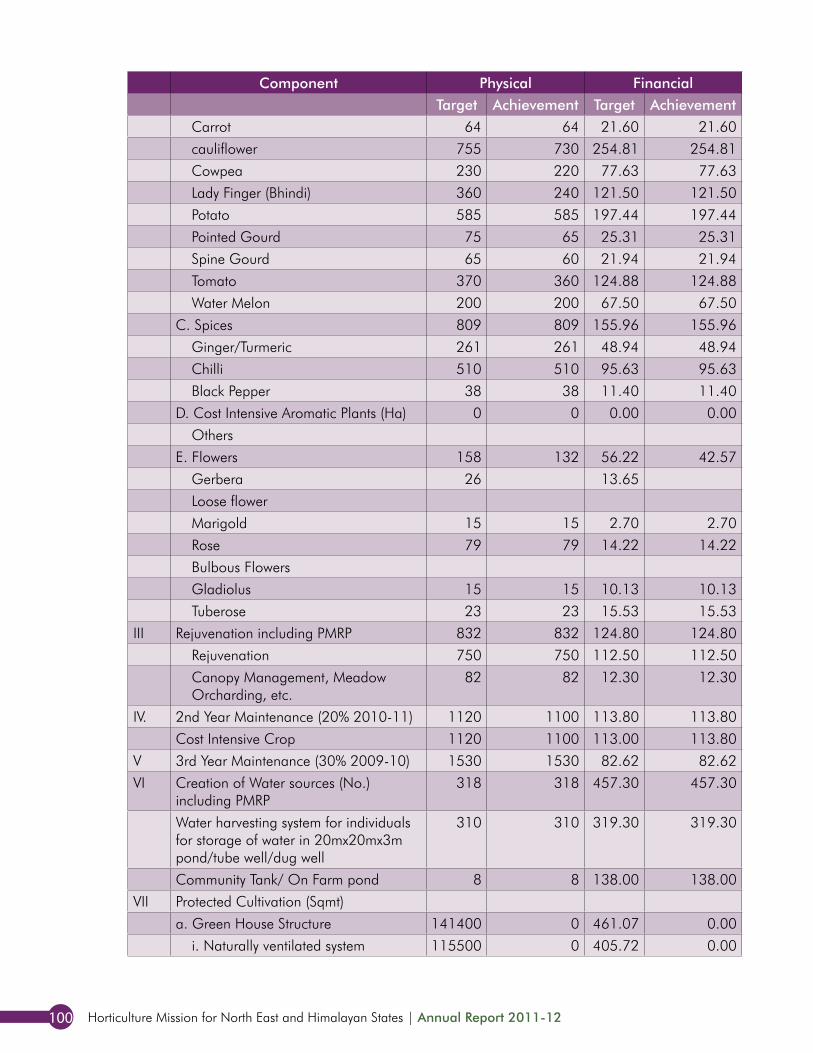
Horticulture Mission for North East and Himalayan States | Annual Report 2011-12100
Component Physical FinancialTarget Achievement Target Achievement
Carrot 64 64 21.60 21.60
cauliflower 755 730 254.81 254.81
Cowpea 230 220 77.63 77.63
Lady Finger (Bhindi) 360 240 121.50 121.50
Potato 585 585 197.44 197.44
Pointed Gourd 75 65 25.31 25.31
Spine Gourd 65 60 21.94 21.94
Tomato 370 360 124.88 124.88
Water Melon 200 200 67.50 67.50
C. Spices 809 809 155.96 155.96
Ginger/Turmeric 261 261 48.94 48.94
Chilli 510 510 95.63 95.63
Black Pepper 38 38 11.40 11.40
D. Cost Intensive Aromatic Plants (Ha) 0 0 0.00 0.00
Others
E. Flowers 158 132 56.22 42.57
Gerbera 26 13.65
Loose flower
Marigold 15 15 2.70 2.70
Rose 79 79 14.22 14.22
Bulbous Flowers
Gladiolus 15 15 10.13 10.13
Tuberose 23 23 15.53 15.53
III Rejuvenation including PMRP 832 832 124.80 124.80
Rejuvenation 750 750 112.50 112.50
Canopy Management, Meadow Orcharding, etc.
82 82 12.30 12.30
IV. 2nd Year Maintenance (20% 2010-11) 1120 1100 113.80 113.80
Cost Intensive Crop 1120 1100 113.00 113.80
V 3rd Year Maintenance (30% 2009-10) 1530 1530 82.62 82.62
VI Creation of Water sources (No.) including PMRP
318 318 457.30 457.30
Water harvesting system for individuals for storage of water in 20mx20mx3m pond/tube well/dug well
310 310 319.30 319.30
Community Tank/ On Farm pond 8 8 138.00 138.00
VII Protected Cultivation (Sqmt)
a. Green House Structure 141400 0 461.07 0.00
i. Naturally ventilated system 115500 0 405.72 0.00
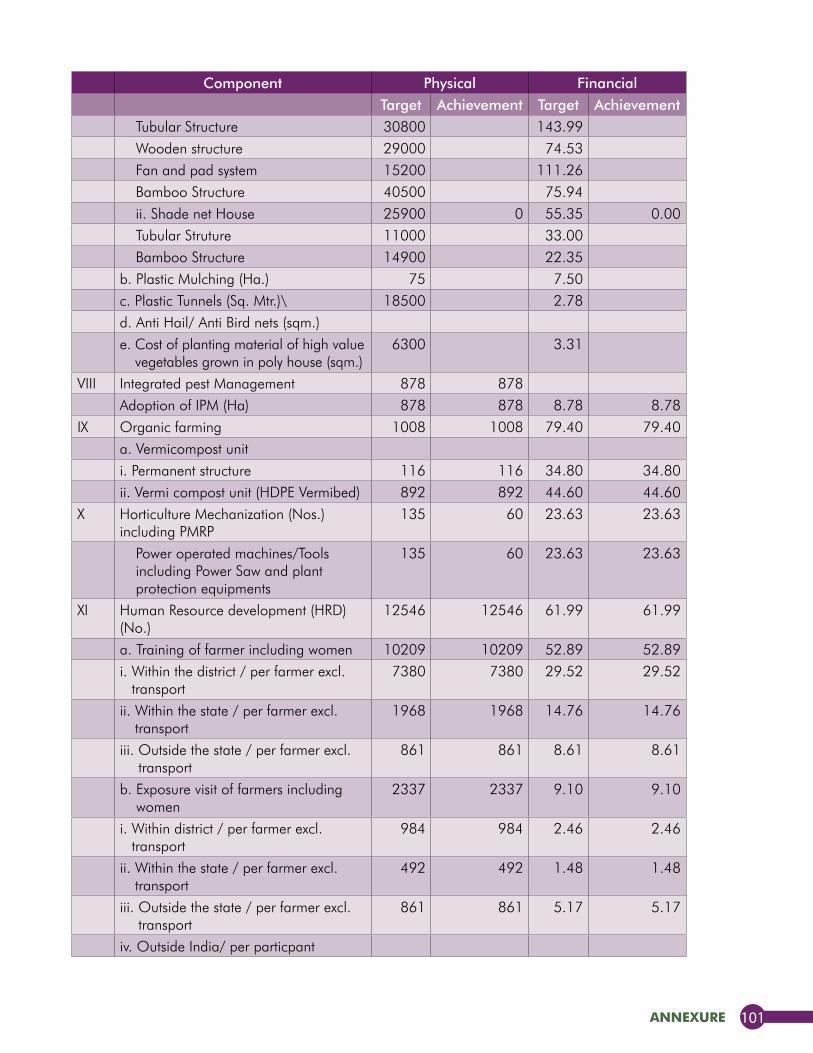
annexure 101
Component Physical FinancialTarget Achievement Target Achievement
Tubular Structure 30800 143.99Wooden structure 29000 74.53Fan and pad system 15200 111.26Bamboo Structure 40500 75.94ii. Shade net House 25900 0 55.35 0.00Tubular Struture 11000 33.00Bamboo Structure 14900 22.35
b. Plastic Mulching (Ha.) 75 7.50c. Plastic Tunnels (Sq. Mtr.)\ 18500 2.78d. Anti Hail/ Anti Bird nets (sqm.)e. Cost of planting material of high value
vegetables grown in poly house (sqm.)6300 3.31
VIII Integrated pest Management 878 878Adoption of IPM (Ha) 878 878 8.78 8.78
IX Organic farming 1008 1008 79.40 79.40a. Vermicompost uniti. Permanent structure 116 116 34.80 34.80ii. Vermi compost unit (HDPE Vermibed) 892 892 44.60 44.60
X Horticulture Mechanization (Nos.) including PMRP
135 60 23.63 23.63
Power operated machines/Tools including Power Saw and plant protection equipments
135 60 23.63 23.63
XI Human Resource development (HRD) (No.)
12546 12546 61.99 61.99
a. Training of farmer including women 10209 10209 52.89 52.89i. Within the district / per farmer excl.
transport7380 7380 29.52 29.52
ii. Within the state / per farmer excl. transport
1968 1968 14.76 14.76
iii. Outside the state / per farmer excl. transport
861 861 8.61 8.61
b. Exposure visit of farmers including women
2337 2337 9.10 9.10
i. Within district / per farmer excl. transport
984 984 2.46 2.46
ii. Within the state / per farmer excl. transport
492 492 1.48 1.48
iii. Outside the state / per farmer excl. transport
861 861 5.17 5.17
iv. Outside India/ per particpant

Horticulture Mission for North East and Himalayan States | Annual Report 2011-12102
Component Physical FinancialTarget Achievement Target Achievement
XII Mission Mangement 0 0 45.83 20.00Project management including additional manpower & project preparation cost, Institutional strengthening, hire of vehicle, hardware / software etc.
45.83 20.00
XIII Seminar, conferences, exhibitions, kisan mela, horti expo, Honey festival, etc. awareness campaign/publicity (No.)
6 5 14.00 11.00
a. State Level Event 2 2 6.00 5.00b. District Level Event 4 3 8.00 6.00Total 3971.8 3454.7
Component Rate (Rs. In Lakh)
Physical Financial
Target Achievement Target AchievementI. Production of Planting
Material (No.)2 27 12.50 193.50
A. Model / Big Nursery (2 ha)
2 8 12.50 144.00
i. Public 6.25 8 144.00ii. Private Sector 3.125 2 0 12.50
B. Small Nursery 0 19 0.00 49.50i. Public sector 6.25 0 14 0.00 42.00ii. Private Sector 3.125 5 0.00 7.50Seed Production for vegetables & rhizomatic spices
a. Open pollinated (Ha) Public sector
0.30 3 1 0.90 0.25
II. Area Expansion (ha) 5550 3533 1579.04 1079.92A. Fruits 2364 1997 772.38 650.93
High density planting 1927 1620 693.72 583.11Apple 0.36 550 434 198.00 156.07Anola 0.36 129 122 46.44 43.75Citrus 0.36 182 187 65.52 67.19Guava 0.36 194 187 69.84 67.28Litchi 0.36 150 143 54.00 51.51Mango 0.36 517 466 186.12 167.92
Uttarakhand
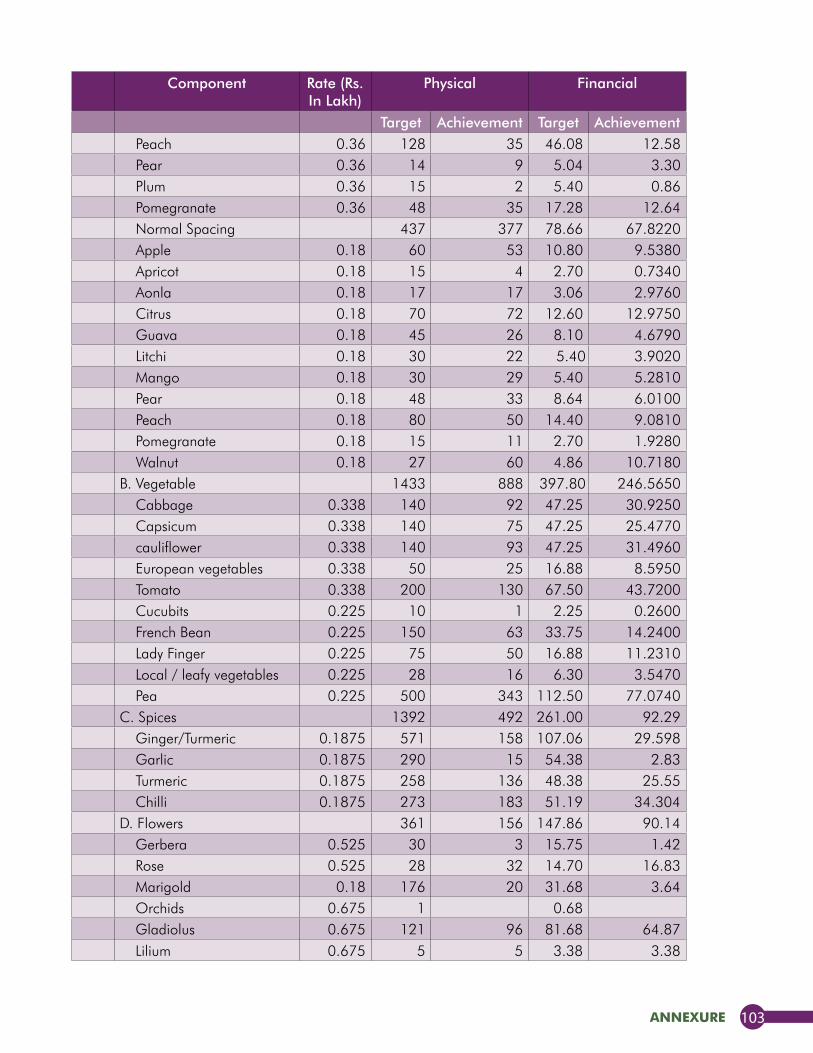
annexure 103
Component Rate (Rs. In Lakh)
Physical Financial
Target Achievement Target AchievementPeach 0.36 128 35 46.08 12.58Pear 0.36 14 9 5.04 3.30Plum 0.36 15 2 5.40 0.86Pomegranate 0.36 48 35 17.28 12.64Normal Spacing 437 377 78.66 67.8220Apple 0.18 60 53 10.80 9.5380Apricot 0.18 15 4 2.70 0.7340Aonla 0.18 17 17 3.06 2.9760Citrus 0.18 70 72 12.60 12.9750Guava 0.18 45 26 8.10 4.6790Litchi 0.18 30 22 5.40 3.9020Mango 0.18 30 29 5.40 5.2810Pear 0.18 48 33 8.64 6.0100Peach 0.18 80 50 14.40 9.0810Pomegranate 0.18 15 11 2.70 1.9280Walnut 0.18 27 60 4.86 10.7180
B. Vegetable 1433 888 397.80 246.5650Cabbage 0.338 140 92 47.25 30.9250Capsicum 0.338 140 75 47.25 25.4770cauliflower 0.338 140 93 47.25 31.4960European vegetables 0.338 50 25 16.88 8.5950Tomato 0.338 200 130 67.50 43.7200Cucubits 0.225 10 1 2.25 0.2600French Bean 0.225 150 63 33.75 14.2400Lady Finger 0.225 75 50 16.88 11.2310Local / leafy vegetables 0.225 28 16 6.30 3.5470Pea 0.225 500 343 112.50 77.0740
C. Spices 1392 492 261.00 92.29Ginger/Turmeric 0.1875 571 158 107.06 29.598Garlic 0.1875 290 15 54.38 2.83Turmeric 0.1875 258 136 48.38 25.55Chilli 0.1875 273 183 51.19 34.304
D. Flowers 361 156 147.86 90.14Gerbera 0.525 30 3 15.75 1.42Rose 0.525 28 32 14.70 16.83Marigold 0.18 176 20 31.68 3.64Orchids 0.675 1 0.68Gladiolus 0.675 121 96 81.68 64.87Lilium 0.675 5 5 3.38 3.38
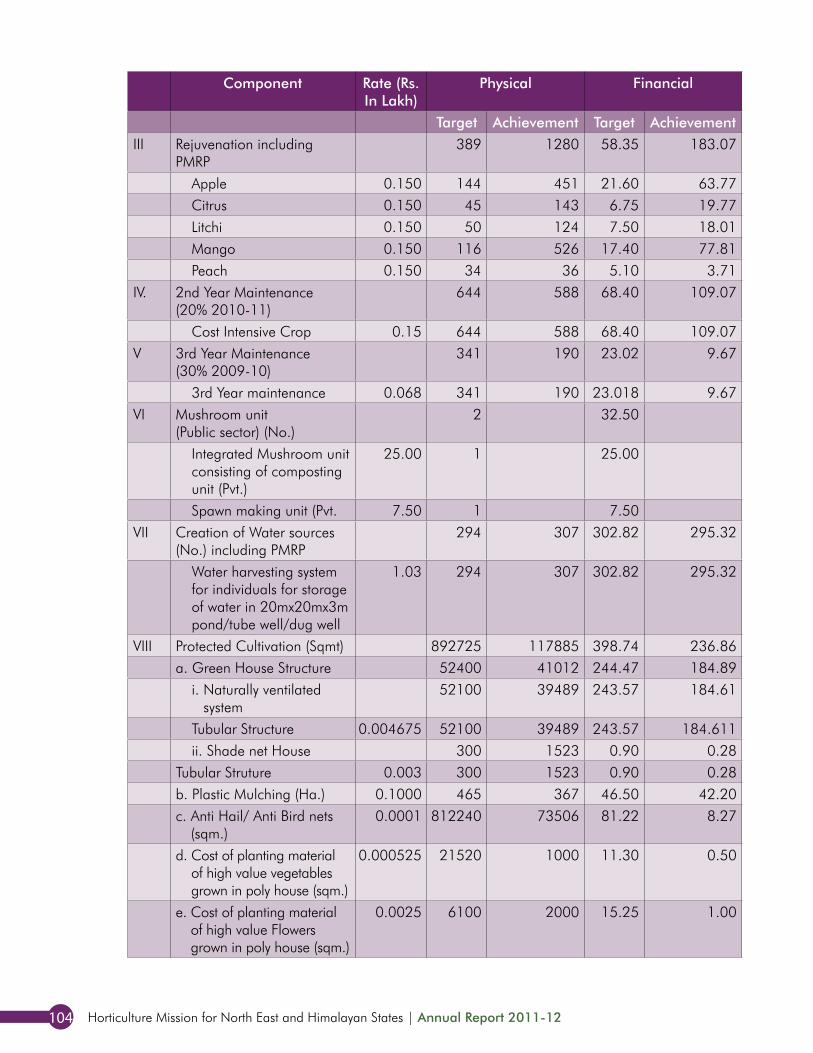
Horticulture Mission for North East and Himalayan States | Annual Report 2011-12104
Component Rate (Rs. In Lakh)
Physical Financial
Target Achievement Target AchievementIII Rejuvenation including
PMRP389 1280 58.35 183.07
Apple 0.150 144 451 21.60 63.77Citrus 0.150 45 143 6.75 19.77Litchi 0.150 50 124 7.50 18.01Mango 0.150 116 526 17.40 77.81Peach 0.150 34 36 5.10 3.71
IV. 2nd Year Maintenance (20% 2010-11)
644 588 68.40 109.07
Cost Intensive Crop 0.15 644 588 68.40 109.07V 3rd Year Maintenance
(30% 2009-10)341 190 23.02 9.67
3rd Year maintenance 0.068 341 190 23.018 9.67VI Mushroom unit
(Public sector) (No.)2 32.50
Integrated Mushroom unit consisting of composting unit (Pvt.)
25.00 1 25.00
Spawn making unit (Pvt. 7.50 1 7.50VII Creation of Water sources
(No.) including PMRP294 307 302.82 295.32
Water harvesting system for individuals for storage of water in 20mx20mx3m pond/tube well/dug well
1.03 294 307 302.82 295.32
VIII Protected Cultivation (Sqmt) 892725 117885 398.74 236.86a. Green House Structure 52400 41012 244.47 184.89
i. Naturally ventilated system
52100 39489 243.57 184.61
Tubular Structure 0.004675 52100 39489 243.57 184.611ii. Shade net House 300 1523 0.90 0.28
Tubular Struture 0.003 300 1523 0.90 0.28b. Plastic Mulching (Ha.) 0.1000 465 367 46.50 42.20c. Anti Hail/ Anti Bird nets
(sqm.)0.0001 812240 73506 81.22 8.27
d. Cost of planting material of high value vegetables grown in poly house (sqm.)
0.000525 21520 1000 11.30 0.50
e. Cost of planting material of high value Flowers grown in poly house (sqm.)
0.0025 6100 2000 15.25 1.00
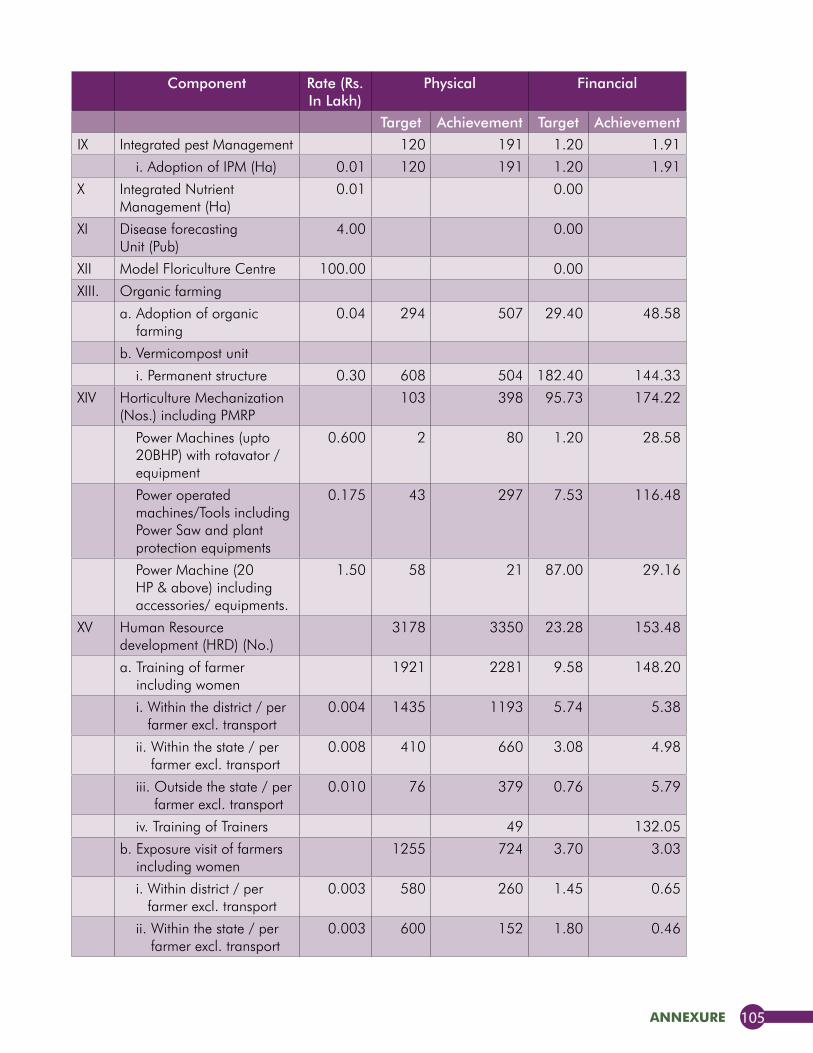
annexure 105
Component Rate (Rs. In Lakh)
Physical Financial
Target Achievement Target Achievement
IX Integrated pest Management 120 191 1.20 1.91
i. Adoption of IPM (Ha) 0.01 120 191 1.20 1.91
X Integrated Nutrient Management (Ha)
0.01 0.00
XI Disease forecasting Unit (Pub)
4.00 0.00
XII Model Floriculture Centre 100.00 0.00
XIII. Organic farming
a. Adoption of organic farming
0.04 294 507 29.40 48.58
b. Vermicompost unit
i. Permanent structure 0.30 608 504 182.40 144.33
XIV Horticulture Mechanization (Nos.) including PMRP
103 398 95.73 174.22
Power Machines (upto 20BHP) with rotavator / equipment
0.600 2 80 1.20 28.58
Power operated machines/Tools including Power Saw and plant protection equipments
0.175 43 297 7.53 116.48
Power Machine (20 HP & above) including accessories/ equipments.
1.50 58 21 87.00 29.16
XV Human Resource development (HRD) (No.)
3178 3350 23.28 153.48
a. Training of farmer including women
1921 2281 9.58 148.20
i. Within the district / per farmer excl. transport
0.004 1435 1193 5.74 5.38
ii. Within the state / per farmer excl. transport
0.008 410 660 3.08 4.98
iii. Outside the state / per farmer excl. transport
0.010 76 379 0.76 5.79
iv. Training of Trainers 49 132.05
b. Exposure visit of farmers including women
1255 724 3.70 3.03
i. Within district / per farmer excl. transport
0.003 580 260 1.45 0.65
ii. Within the state / per farmer excl. transport
0.003 600 152 1.80 0.46
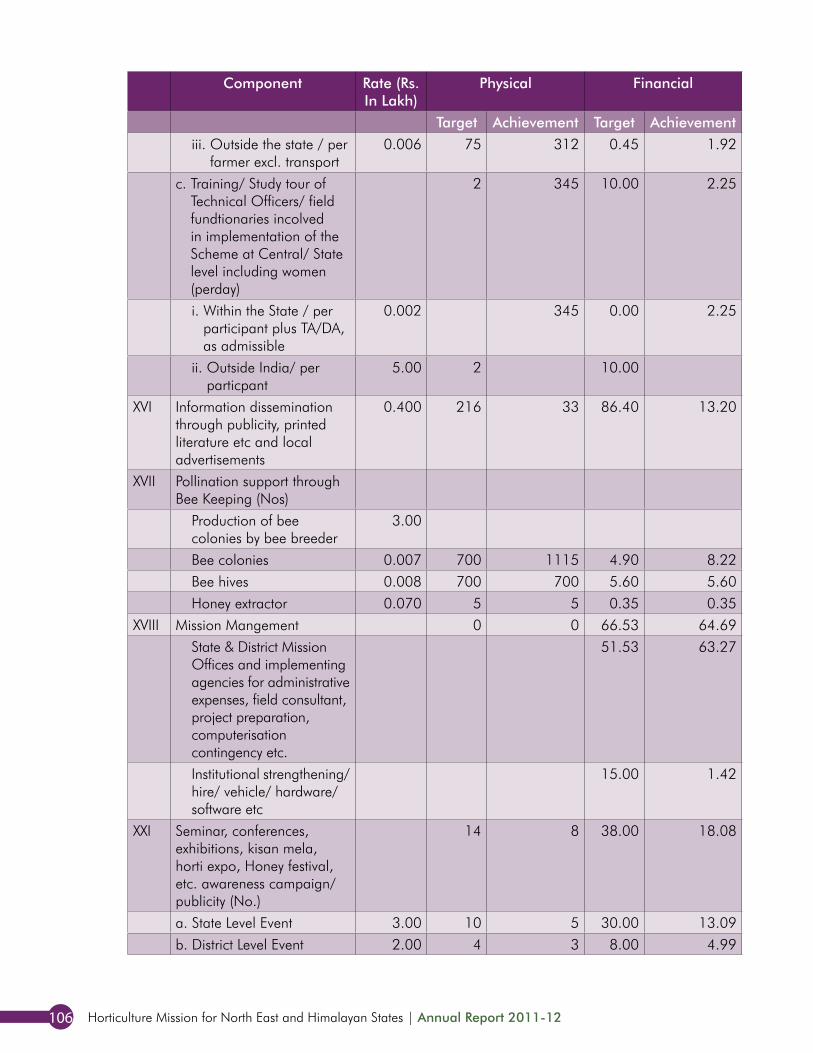
Horticulture Mission for North East and Himalayan States | Annual Report 2011-12106
Component Rate (Rs. In Lakh)
Physical Financial
Target Achievement Target Achievementiii. Outside the state / per
farmer excl. transport0.006 75 312 0.45 1.92
c. Training/ Study tour of Technical Officers/ field fundtionaries incolved in implementation of the Scheme at Central/ State level including women (perday)
2 345 10.00 2.25
i. Within the State / per participant plus TA/DA, as admissible
0.002 345 0.00 2.25
ii. Outside India/ per particpant
5.00 2 10.00
XVI Information dissemination through publicity, printed literature etc and local advertisements
0.400 216 33 86.40 13.20
XVII Pollination support through Bee Keeping (Nos)
Production of bee colonies by bee breeder
3.00
Bee colonies 0.007 700 1115 4.90 8.22Bee hives 0.008 700 700 5.60 5.60Honey extractor 0.070 5 5 0.35 0.35
XVIII Mission Mangement 0 0 66.53 64.69State & District Mission Offices and implementing agencies for administrative expenses, field consultant, project preparation, computerisation contingency etc.
51.53 63.27
Institutional strengthening/hire/ vehicle/ hardware/software etc
15.00 1.42
XXI Seminar, conferences, exhibitions, kisan mela, horti expo, Honey festival, etc. awareness campaign/publicity (No.)
14 8 38.00 18.08
a. State Level Event 3.00 10 5 30.00 13.09b. District Level Event 2.00 4 3 8.00 4.99
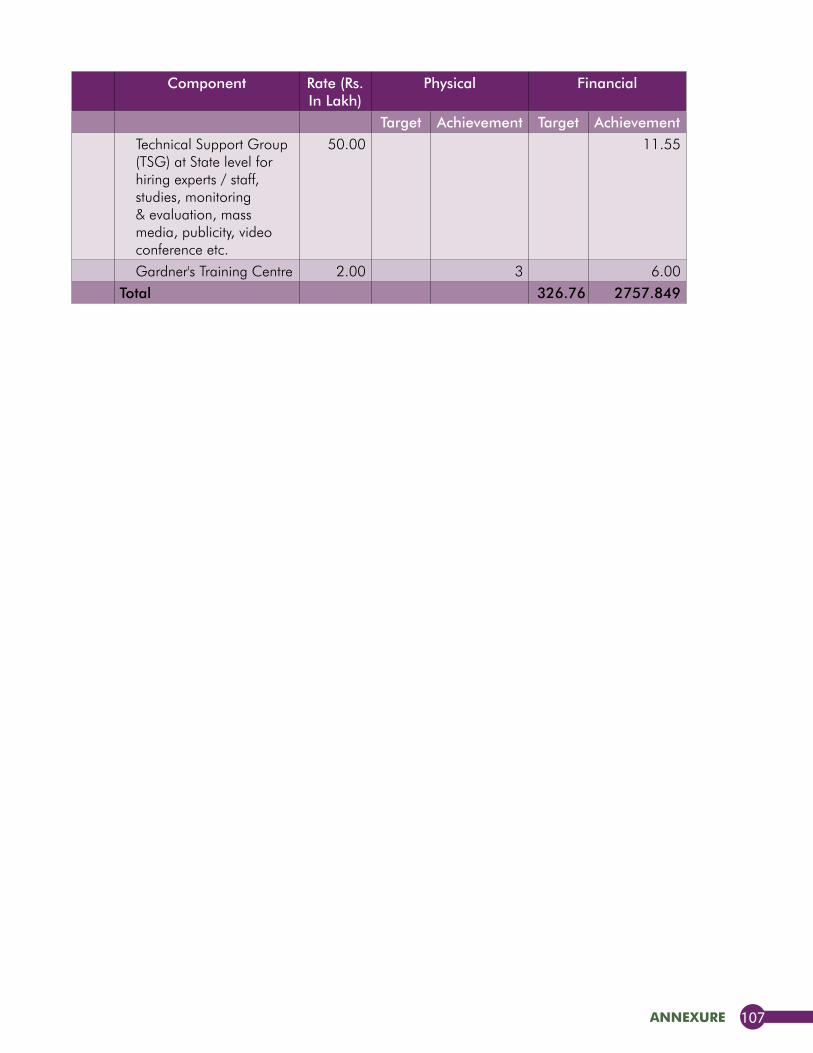
annexure 107
Component Rate (Rs. In Lakh)
Physical Financial
Target Achievement Target AchievementTechnical Support Group (TSG) at State level for hiring experts / staff, studies, monitoring & evaluation, mass media, publicity, video conference etc.
50.00 11.55
Gardner's Training Centre 2.00 3 6.00Total 326.76 2757.849
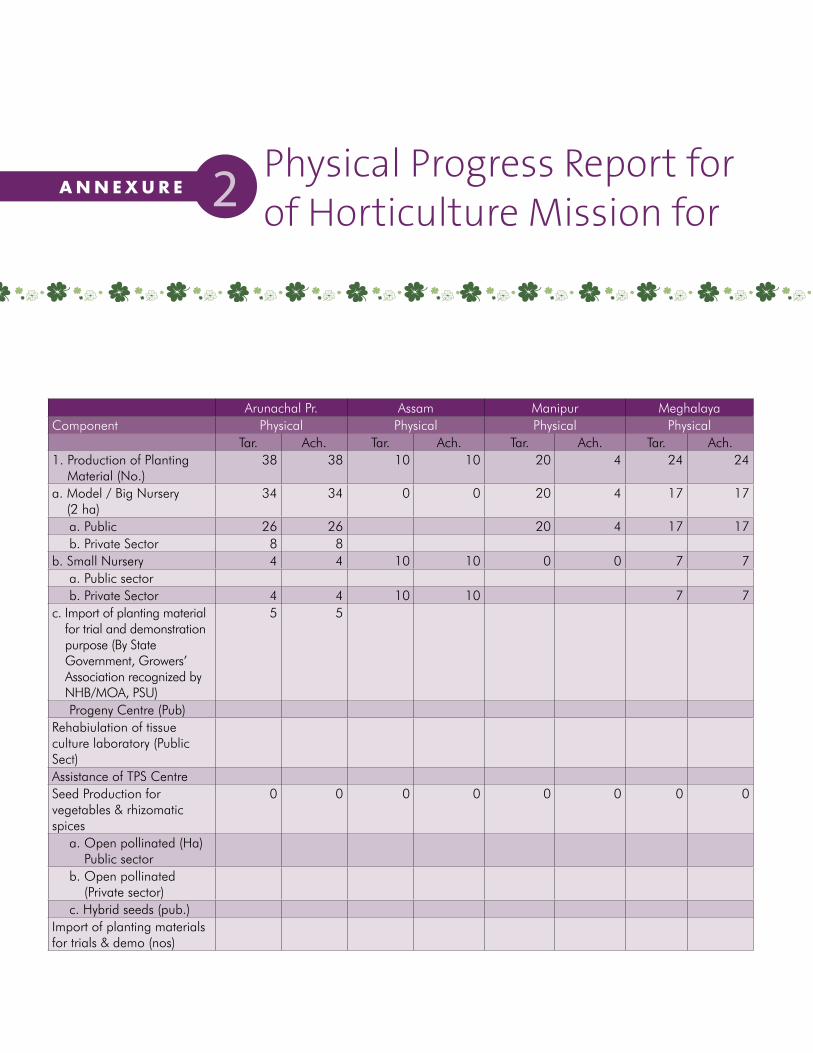
Physical Progress Report for the year 2011-12 under MM-II of Horticulture Mission for NE and Himalayan States2A N N E x u R E
Arunachal Pr. Assam Manipur Meghalaya Mizoram Nagaland Sikkim Tripura North EastComponent Physical Physical Physical Physical Physical Physical Physical Physical Physical
Tar. Ach. Tar. Ach. Tar. Ach. Tar. Ach. Tar. Ach. Tar. Ach. Tar. Ach. Tar. Ach. Tar. Ach.1. Production of Planting
Material (No.)38 38 10 10 20 4 24 24 11 11 18 18 9 9 55 55 185 169
a. Model / Big Nursery (2 ha)
34 34 0 0 20 4 17 17 0 0 0 0 1 1 20 20 92 76
a. Public 26 26 20 4 17 17 1 1 12 12 76 60 b. Private Sector 8 8 8 8 16 16b. Small Nursery 4 4 10 10 0 0 7 7 11 11 18 18 8 8 35 35 93 93 a. Public sector 3 3 8 8 4 4 15 15 30 30 b. Private Sector 4 4 10 10 7 7 8 8 10 10 4 4 20 20 63 63c. Import of planting material
for trial and demonstration purpose (By State Government, Growers’ Association recognized by NHB/MOA, PSU)
5 5 5 5
Progeny Centre (Pub) 0 0Rehabiulation of tissue culture laboratory (Public Sect)
1 1 1 1 2 2
Assistance of TPS Centre 1 1 1 1Seed Production for vegetables & rhizomatic spices
0 0 0 0 0 0 0 0 0 0 0 0 27 27 17 17 44 44
a. Open pollinated (Ha) Public sector
27 27 27 27
b. Open pollinated (Private sector)
17 17 17 17
c. Hybrid seeds (pub.) 0 0Import of planting materials for trials & demo (nos)
4 4 1 1 5 5
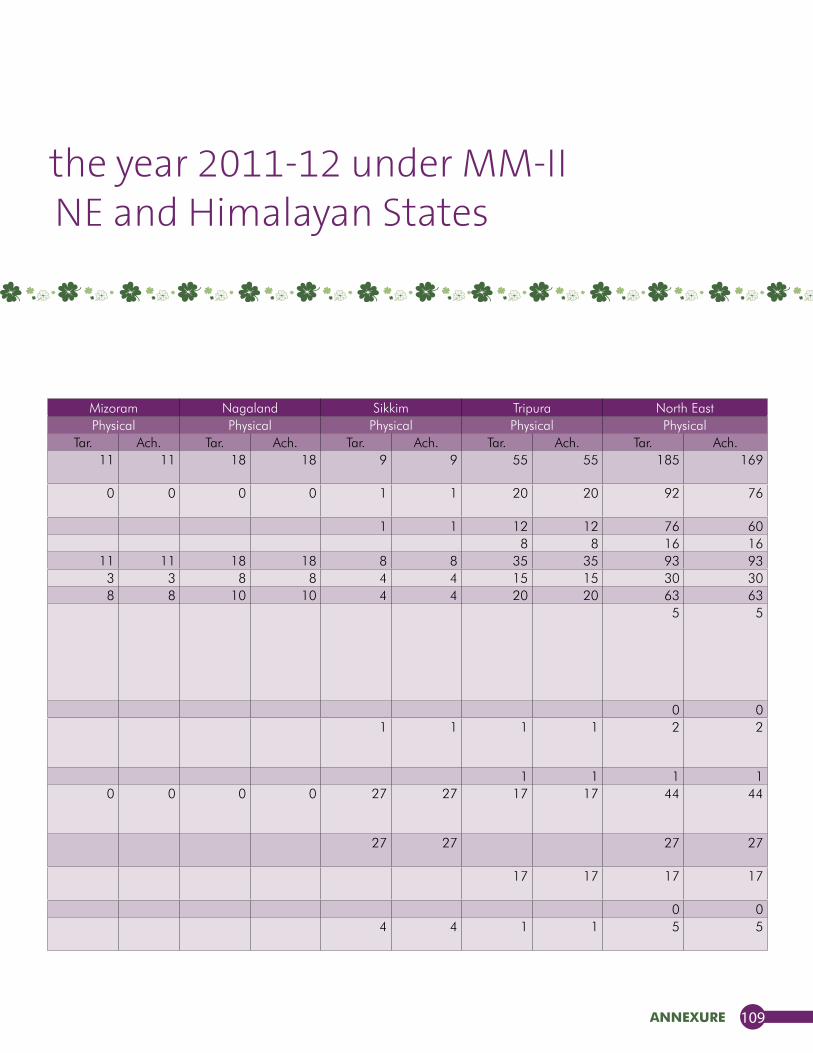
annexure 109
Physical Progress Report for the year 2011-12 under MM-II of Horticulture Mission for NE and Himalayan States
Arunachal Pr. Assam Manipur Meghalaya Mizoram Nagaland Sikkim Tripura North EastComponent Physical Physical Physical Physical Physical Physical Physical Physical Physical
Tar. Ach. Tar. Ach. Tar. Ach. Tar. Ach. Tar. Ach. Tar. Ach. Tar. Ach. Tar. Ach. Tar. Ach.1. Production of Planting
Material (No.)38 38 10 10 20 4 24 24 11 11 18 18 9 9 55 55 185 169
a. Model / Big Nursery (2 ha)
34 34 0 0 20 4 17 17 0 0 0 0 1 1 20 20 92 76
a. Public 26 26 20 4 17 17 1 1 12 12 76 60 b. Private Sector 8 8 8 8 16 16b. Small Nursery 4 4 10 10 0 0 7 7 11 11 18 18 8 8 35 35 93 93 a. Public sector 3 3 8 8 4 4 15 15 30 30 b. Private Sector 4 4 10 10 7 7 8 8 10 10 4 4 20 20 63 63c. Import of planting material
for trial and demonstration purpose (By State Government, Growers’ Association recognized by NHB/MOA, PSU)
5 5 5 5
Progeny Centre (Pub) 0 0Rehabiulation of tissue culture laboratory (Public Sect)
1 1 1 1 2 2
Assistance of TPS Centre 1 1 1 1Seed Production for vegetables & rhizomatic spices
0 0 0 0 0 0 0 0 0 0 0 0 27 27 17 17 44 44
a. Open pollinated (Ha) Public sector
27 27 27 27
b. Open pollinated (Private sector)
17 17 17 17
c. Hybrid seeds (pub.) 0 0Import of planting materials for trials & demo (nos)
4 4 1 1 5 5
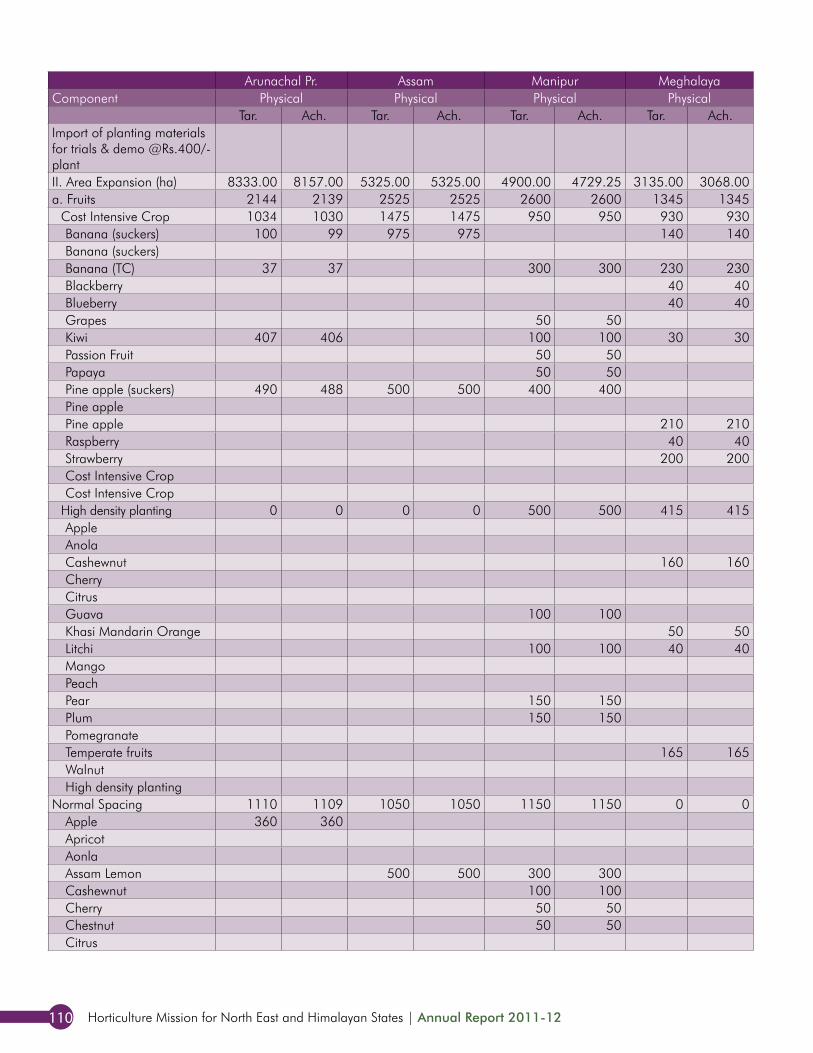
Horticulture Mission for North East and Himalayan States | Annual Report 2011-12110
Arunachal Pr. Assam Manipur Meghalaya Mizoram Nagaland Sikkim Tripura North EastComponent Physical Physical Physical Physical Physical Physical Physical Physical Physical
Tar. Ach. Tar. Ach. Tar. Ach. Tar. Ach. Tar. Ach. Tar. Ach. Tar. Ach. Tar. Ach. Tar. Ach.Import of planting materials for trials & demo @Rs.400/- plant
0 0
II. Area Expansion (ha) 8333.00 8157.00 5325.00 5325.00 4900.00 4729.25 3135.00 3068.00 6102.00 6102.00 7074.00 6974.00 4782.00 4782.00 6428.00 6207.00 46079.00 45344.25a. Fruits 2144 2139 2525 2525 2600 2600 1345 1345 2468 2468 3161 3161 1512 1512 1822 1822 17577 17572 Cost Intensive Crop 1034 1030 1475 1475 950 950 930 930 1540 1540 1906 1906 255 255 910 910 9000 8996 Banana (suckers) 100 99 975 975 140 140 300 300 1515 1514 Banana (suckers) 650 650 650 650 Banana (TC) 37 37 300 300 230 230 50 50 617 617 Blackberry 40 40 40 40 Blueberry 40 40 40 40 Grapes 50 50 300 300 350 350 Kiwi 407 406 100 100 30 30 93 93 155 155 785 784 Passion Fruit 50 50 600 600 250 250 900 900 Papaya 50 50 50 50 230 230 330 330 Pine apple (suckers) 490 488 500 500 400 400 640 640 2030 2028 Pine apple 913 913 913 913 Pine apple 210 210 380 380 590 590 Raspberry 40 40 40 40 Strawberry 200 200 200 200 Cost Intensive Crop 0 0 Cost Intensive Crop 0 0 High density planting 0 0 0 0 500 500 415 415 928 928 1010 1010 70 70 822 822 3745 3745 Apple 150 150 25 25 175 175 Anola 0 0 Cashewnut 160 160 160 160 Cherry 0 0 Citrus 710 710 710 710 Guava 100 100 50 50 45 45 100 100 295 295 Khasi Mandarin Orange 50 50 880 880 930 930 Litchi 100 100 40 40 72 72 212 212 Mango 100 100 650 650 750 750 Peach 0 0 Pear 150 150 150 150 Plum 150 150 48 48 198 198 Pomegranate 0 0 Temperate fruits 165 165 165 165 Walnut 0 0 High density planting 0 0Normal Spacing 1110 1109 1050 1050 1150 1150 0 0 0 0 245 245 1187 1187 90 90 4832 4831 Apple 360 360 360 360 Apricot 0 0 Aonla 0 0 Assam Lemon 500 500 300 300 800 800 Cashewnut 100 100 245 245 345 345 Cherry 50 50 50 50 Chestnut 50 50 50 50 Citrus 0 0

annexure 111
Arunachal Pr. Assam Manipur Meghalaya Mizoram Nagaland Sikkim Tripura North EastComponent Physical Physical Physical Physical Physical Physical Physical Physical Physical
Tar. Ach. Tar. Ach. Tar. Ach. Tar. Ach. Tar. Ach. Tar. Ach. Tar. Ach. Tar. Ach. Tar. Ach.Import of planting materials for trials & demo @Rs.400/- plant
0 0
II. Area Expansion (ha) 8333.00 8157.00 5325.00 5325.00 4900.00 4729.25 3135.00 3068.00 6102.00 6102.00 7074.00 6974.00 4782.00 4782.00 6428.00 6207.00 46079.00 45344.25a. Fruits 2144 2139 2525 2525 2600 2600 1345 1345 2468 2468 3161 3161 1512 1512 1822 1822 17577 17572 Cost Intensive Crop 1034 1030 1475 1475 950 950 930 930 1540 1540 1906 1906 255 255 910 910 9000 8996 Banana (suckers) 100 99 975 975 140 140 300 300 1515 1514 Banana (suckers) 650 650 650 650 Banana (TC) 37 37 300 300 230 230 50 50 617 617 Blackberry 40 40 40 40 Blueberry 40 40 40 40 Grapes 50 50 300 300 350 350 Kiwi 407 406 100 100 30 30 93 93 155 155 785 784 Passion Fruit 50 50 600 600 250 250 900 900 Papaya 50 50 50 50 230 230 330 330 Pine apple (suckers) 490 488 500 500 400 400 640 640 2030 2028 Pine apple 913 913 913 913 Pine apple 210 210 380 380 590 590 Raspberry 40 40 40 40 Strawberry 200 200 200 200 Cost Intensive Crop 0 0 Cost Intensive Crop 0 0 High density planting 0 0 0 0 500 500 415 415 928 928 1010 1010 70 70 822 822 3745 3745 Apple 150 150 25 25 175 175 Anola 0 0 Cashewnut 160 160 160 160 Cherry 0 0 Citrus 710 710 710 710 Guava 100 100 50 50 45 45 100 100 295 295 Khasi Mandarin Orange 50 50 880 880 930 930 Litchi 100 100 40 40 72 72 212 212 Mango 100 100 650 650 750 750 Peach 0 0 Pear 150 150 150 150 Plum 150 150 48 48 198 198 Pomegranate 0 0 Temperate fruits 165 165 165 165 Walnut 0 0 High density planting 0 0Normal Spacing 1110 1109 1050 1050 1150 1150 0 0 0 0 245 245 1187 1187 90 90 4832 4831 Apple 360 360 360 360 Apricot 0 0 Aonla 0 0 Assam Lemon 500 500 300 300 800 800 Cashewnut 100 100 245 245 345 345 Cherry 50 50 50 50 Chestnut 50 50 50 50 Citrus 0 0
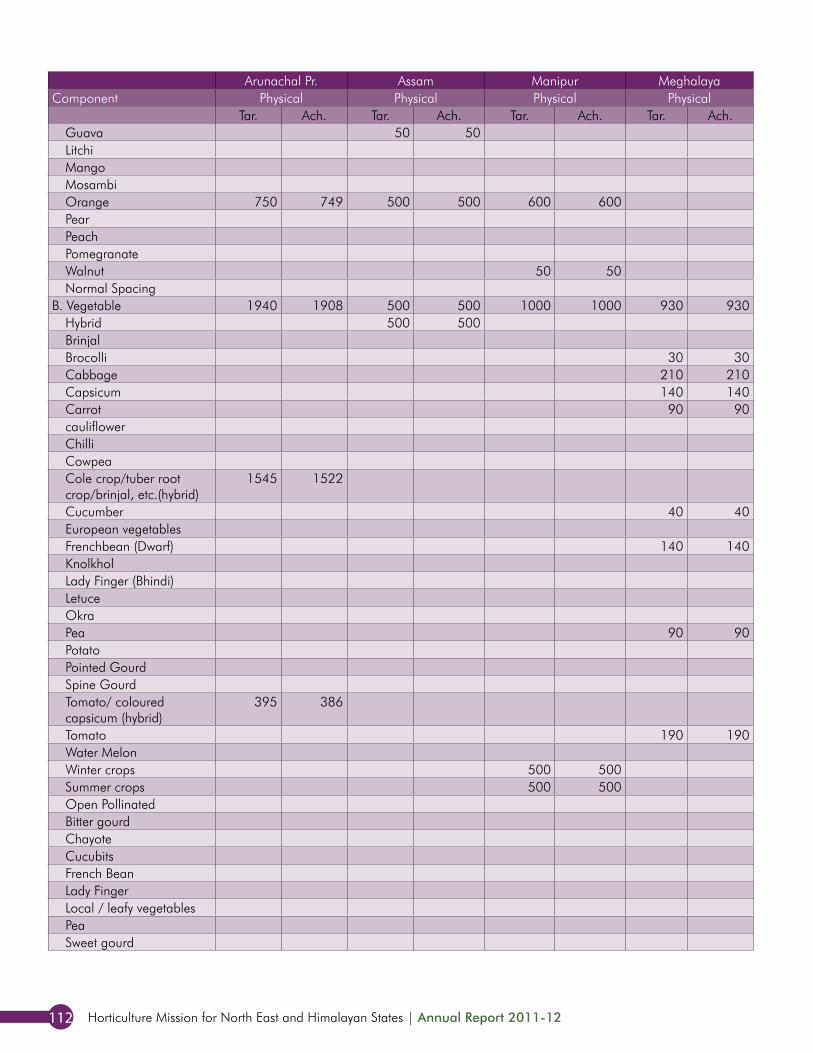
Horticulture Mission for North East and Himalayan States | Annual Report 2011-12112
Arunachal Pr. Assam Manipur Meghalaya Mizoram Nagaland Sikkim Tripura North EastComponent Physical Physical Physical Physical Physical Physical Physical Physical Physical
Tar. Ach. Tar. Ach. Tar. Ach. Tar. Ach. Tar. Ach. Tar. Ach. Tar. Ach. Tar. Ach. Tar. Ach. Guava 50 50 75 75 125 125 Litchi 102 102 102 102 Mango 0 0 Mosambi 90 90 90 90 Orange 750 749 500 500 600 600 1010 1010 2860 2859 Pear 0 0 Peach 0 0 Pomegranate 0 0 Walnut 50 50 50 50 Normal Spacing 0 0B. Vegetable 1940 1908 500 500 1000 1000 930 930 1640 1640 1125 1125 665 665 3639 3444 11439 11212
Hybrid 500 500 375 375 445 445 1320 1320Brinjal 80 80 100 100 180 180Brocolli 30 30 80 80 110 110Cabbage 210 210 200 200 755 740 1165 1150Capsicum 140 140 150 150 80 80 370 370Carrot 90 90 60 60 64 64 214 214cauliflower 755 730 755 730Chilli 80 80 80 80Cowpea 230 220 230 220Cole crop/tuber root crop/brinjal, etc.(hybrid)
1545 1522 1545 1522
Cucumber 40 40 40 40European vegetables 0 0Frenchbean (Dwarf) 140 140 140 140Knolkhol 80 80 80 80Lady Finger (Bhindi) 360 240 360 240Letuce 60 60 60 60Okra 170 170 170 170Pea 90 90 90 90Potato 585 585 585 585Pointed Gourd 75 65 75 65Spine Gourd 65 60 65 60Tomato/ coloured capsicum (hybrid)
395 386 395 386
Tomato 190 190 160 160 370 360 720 710Water Melon 200 200 200 200Winter crops 500 500 500 500Summer crops 500 500 500 500Open Pollinated 750 750 220 220 970 970Bitter gourd 110 110 110 110Chayote 360 360 360 360Cucubits 0 0French Bean 0 0Lady Finger 0 0Local / leafy vegetables 0 0Pea 0 0Sweet gourd 50 50 50 50
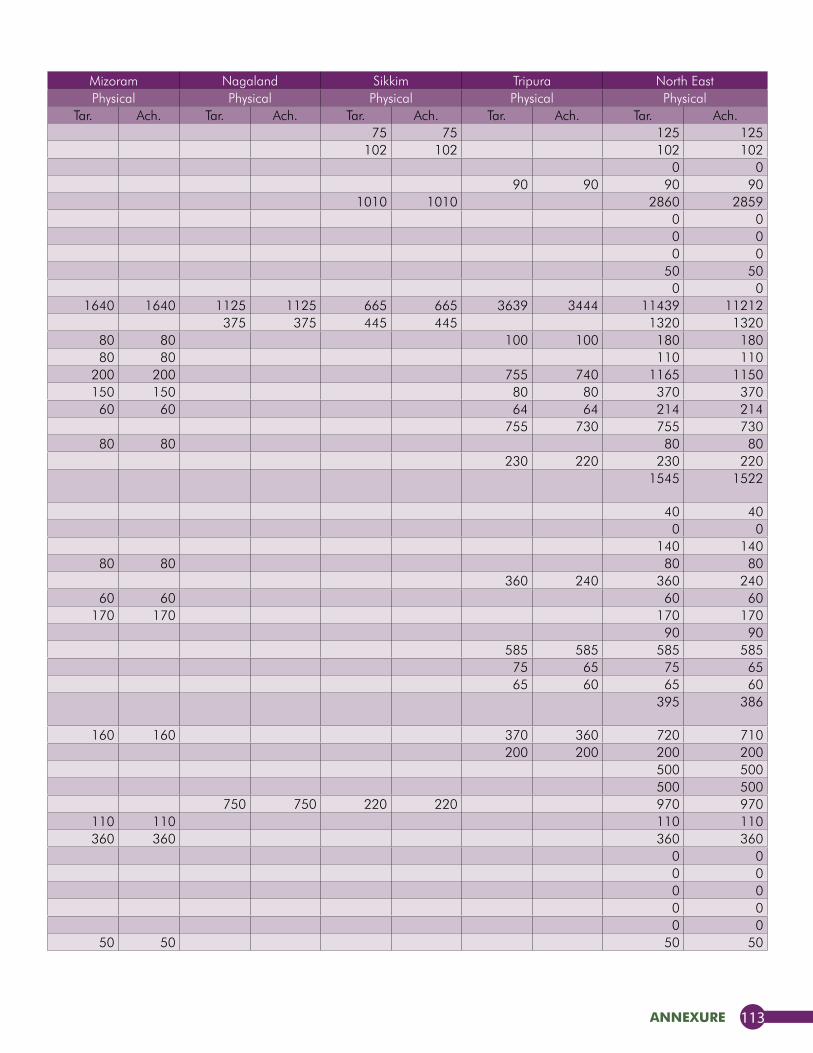
annexure 113
Arunachal Pr. Assam Manipur Meghalaya Mizoram Nagaland Sikkim Tripura North EastComponent Physical Physical Physical Physical Physical Physical Physical Physical Physical
Tar. Ach. Tar. Ach. Tar. Ach. Tar. Ach. Tar. Ach. Tar. Ach. Tar. Ach. Tar. Ach. Tar. Ach. Guava 50 50 75 75 125 125 Litchi 102 102 102 102 Mango 0 0 Mosambi 90 90 90 90 Orange 750 749 500 500 600 600 1010 1010 2860 2859 Pear 0 0 Peach 0 0 Pomegranate 0 0 Walnut 50 50 50 50 Normal Spacing 0 0B. Vegetable 1940 1908 500 500 1000 1000 930 930 1640 1640 1125 1125 665 665 3639 3444 11439 11212
Hybrid 500 500 375 375 445 445 1320 1320Brinjal 80 80 100 100 180 180Brocolli 30 30 80 80 110 110Cabbage 210 210 200 200 755 740 1165 1150Capsicum 140 140 150 150 80 80 370 370Carrot 90 90 60 60 64 64 214 214cauliflower 755 730 755 730Chilli 80 80 80 80Cowpea 230 220 230 220Cole crop/tuber root crop/brinjal, etc.(hybrid)
1545 1522 1545 1522
Cucumber 40 40 40 40European vegetables 0 0Frenchbean (Dwarf) 140 140 140 140Knolkhol 80 80 80 80Lady Finger (Bhindi) 360 240 360 240Letuce 60 60 60 60Okra 170 170 170 170Pea 90 90 90 90Potato 585 585 585 585Pointed Gourd 75 65 75 65Spine Gourd 65 60 65 60Tomato/ coloured capsicum (hybrid)
395 386 395 386
Tomato 190 190 160 160 370 360 720 710Water Melon 200 200 200 200Winter crops 500 500 500 500Summer crops 500 500 500 500Open Pollinated 750 750 220 220 970 970Bitter gourd 110 110 110 110Chayote 360 360 360 360Cucubits 0 0French Bean 0 0Lady Finger 0 0Local / leafy vegetables 0 0Pea 0 0Sweet gourd 50 50 50 50
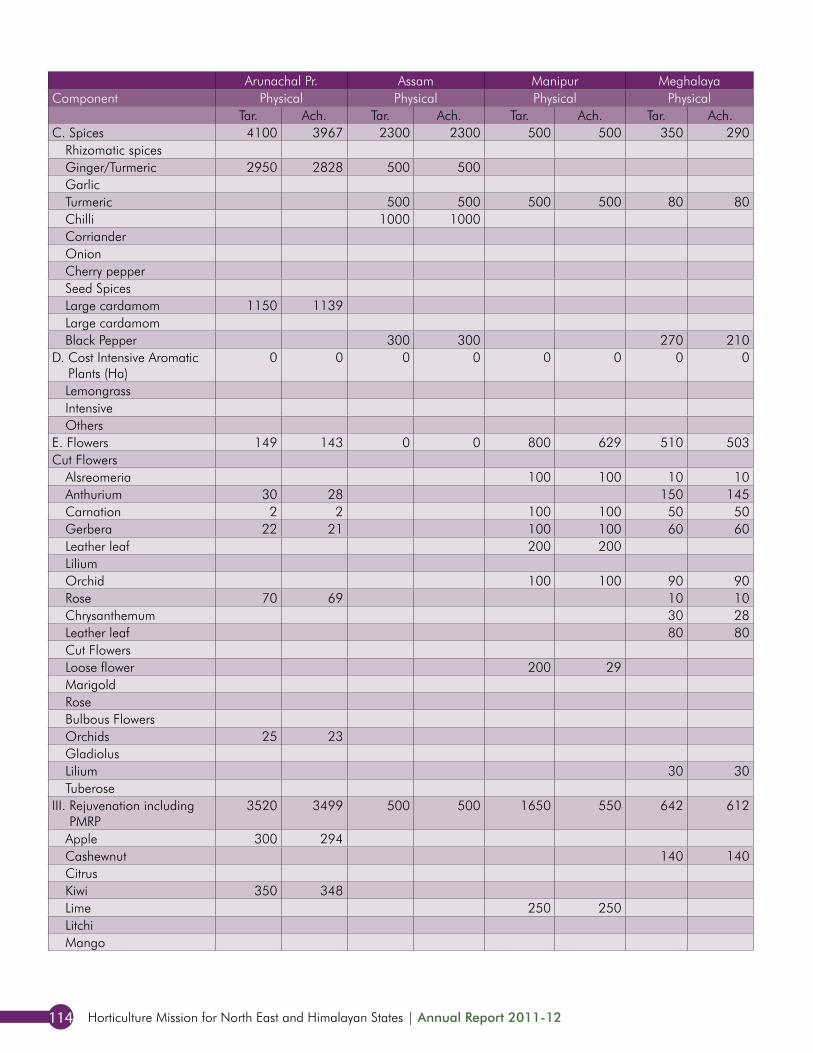
Horticulture Mission for North East and Himalayan States | Annual Report 2011-12114
Arunachal Pr. Assam Manipur Meghalaya Mizoram Nagaland Sikkim Tripura North EastComponent Physical Physical Physical Physical Physical Physical Physical Physical Physical
Tar. Ach. Tar. Ach. Tar. Ach. Tar. Ach. Tar. Ach. Tar. Ach. Tar. Ach. Tar. Ach. Tar. Ach.C. Spices 4100 3967 2300 2300 500 500 350 290 1792 1792 1753 1753 1960 1960 809 809 13564 13371
Rhizomatic spices 0 0Ginger/Turmeric 2950 2828 500 500 530 530 425 425 1016 1016 261 261 5682 5560Garlic 0 0Turmeric 500 500 500 500 80 80 800 800 250 250 270 270 2400 2400Chilli 1000 1000 350 350 510 510 1860 1860Corriander 62 62 62 62Onion 400 400 400 400Cherry pepper 270 270 270 270Seed Spices 0 0Large cardamom 1150 1139 1150 1139Large cardamom 515 515 400 400 915 915Black Pepper 300 300 270 210 213 213 4 4 38 38 825 765
D. Cost Intensive Aromatic Plants (Ha)
0 0 0 0 0 0 0 0 0 0 150 150 0 0 0 0 150 150
Lemongrass 150 150 150 150Intensive 0 0Others 0 0
E. Flowers 149 143 0 0 800 629 510 503 202 202 885 785 645 645 158 132 3349 3039Cut Flowers 440 440 440 440
Alsreomeria 100 100 10 10 140 140 250 250Anthurium 30 28 150 145 162 162 75 75 417 410Carnation 2 2 100 100 50 50 40 40 192 192Gerbera 22 21 100 100 60 60 180 80 26 388 261Leather leaf 200 200 200 200Lilium 275 275 275 275Orchid 100 100 90 90 75 75 265 265Rose 70 69 10 10 140 140 220 219Chrysanthemum 30 28 30 28Leather leaf 80 80 80 80Cut Flowers 0 0Loose flower 200 29 60 60 260 89Marigold 15 15 15 15Rose 79 79 79 79Bulbous Flowers 145 145 145 145Orchids 25 23 25 23Gladiolus 15 15 15 15Lilium 30 30 30 30Tuberose 23 23 23 23
III. Rejuvenation including PMRP
3520 3499 500 500 1650 550 642 612 1000 1000 860 860 700 700 832 832 9704 8553
Apple 300 294 300 294Cashewnut 140 140 140 140Citrus 700 700 700 700Kiwi 350 348 350 348Lime 250 250 250 250Litchi 0 0Mango 0 0

annexure 115
Arunachal Pr. Assam Manipur Meghalaya Mizoram Nagaland Sikkim Tripura North EastComponent Physical Physical Physical Physical Physical Physical Physical Physical Physical
Tar. Ach. Tar. Ach. Tar. Ach. Tar. Ach. Tar. Ach. Tar. Ach. Tar. Ach. Tar. Ach. Tar. Ach.C. Spices 4100 3967 2300 2300 500 500 350 290 1792 1792 1753 1753 1960 1960 809 809 13564 13371
Rhizomatic spices 0 0Ginger/Turmeric 2950 2828 500 500 530 530 425 425 1016 1016 261 261 5682 5560Garlic 0 0Turmeric 500 500 500 500 80 80 800 800 250 250 270 270 2400 2400Chilli 1000 1000 350 350 510 510 1860 1860Corriander 62 62 62 62Onion 400 400 400 400Cherry pepper 270 270 270 270Seed Spices 0 0Large cardamom 1150 1139 1150 1139Large cardamom 515 515 400 400 915 915Black Pepper 300 300 270 210 213 213 4 4 38 38 825 765
D. Cost Intensive Aromatic Plants (Ha)
0 0 0 0 0 0 0 0 0 0 150 150 0 0 0 0 150 150
Lemongrass 150 150 150 150Intensive 0 0Others 0 0
E. Flowers 149 143 0 0 800 629 510 503 202 202 885 785 645 645 158 132 3349 3039Cut Flowers 440 440 440 440
Alsreomeria 100 100 10 10 140 140 250 250Anthurium 30 28 150 145 162 162 75 75 417 410Carnation 2 2 100 100 50 50 40 40 192 192Gerbera 22 21 100 100 60 60 180 80 26 388 261Leather leaf 200 200 200 200Lilium 275 275 275 275Orchid 100 100 90 90 75 75 265 265Rose 70 69 10 10 140 140 220 219Chrysanthemum 30 28 30 28Leather leaf 80 80 80 80Cut Flowers 0 0Loose flower 200 29 60 60 260 89Marigold 15 15 15 15Rose 79 79 79 79Bulbous Flowers 145 145 145 145Orchids 25 23 25 23Gladiolus 15 15 15 15Lilium 30 30 30 30Tuberose 23 23 23 23
III. Rejuvenation including PMRP
3520 3499 500 500 1650 550 642 612 1000 1000 860 860 700 700 832 832 9704 8553
Apple 300 294 300 294Cashewnut 140 140 140 140Citrus 700 700 700 700Kiwi 350 348 350 348Lime 250 250 250 250Litchi 0 0Mango 0 0
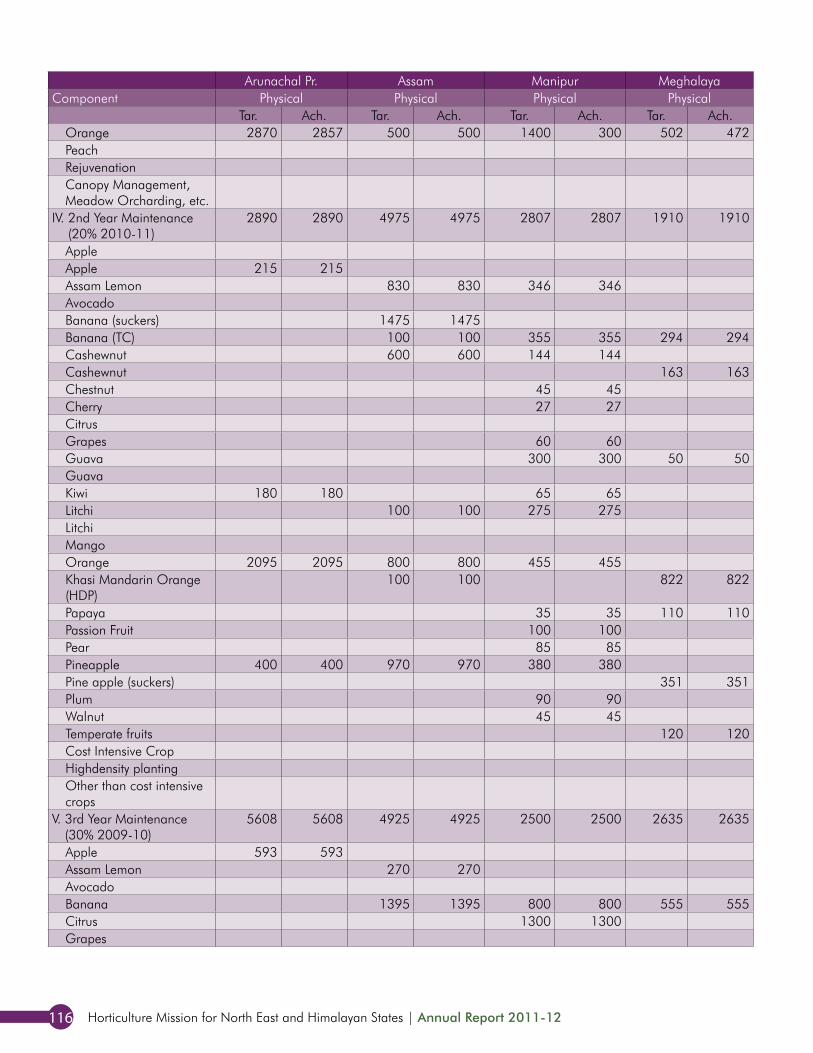
Horticulture Mission for North East and Himalayan States | Annual Report 2011-12116
Arunachal Pr. Assam Manipur Meghalaya Mizoram Nagaland Sikkim Tripura North EastComponent Physical Physical Physical Physical Physical Physical Physical Physical Physical
Tar. Ach. Tar. Ach. Tar. Ach. Tar. Ach. Tar. Ach. Tar. Ach. Tar. Ach. Tar. Ach. Tar. Ach.Orange 2870 2857 500 500 1400 300 502 472 700 700 5972 4829Peach 0 0Rejuvenation 1000 1000 750 750 1750 1750Canopy Management, Meadow Orcharding, etc.
160 160 82 82 242 242
IV. 2nd Year Maintenance (20% 2010-11)
2890 2890 4975 4975 2807 2807 1910 1910 1275 1275 3028 3028 1093 1093 1394 1100 19372 19078
Apple 100 100 50 50 150 150Apple 215 215 215 215Assam Lemon 830 830 346 346 1176 1176Avocado 25 25 25 25Banana (suckers) 1475 1475 20 20 228 228 55 55 1778 1778Banana (TC) 100 100 355 355 294 294 749 749Cashewnut 600 600 144 144 744 744Cashewnut 163 163 163 163Chestnut 45 45 45 45Cherry 27 27 27 27Citrus 1375 1375 1375 1375Grapes 60 60 150 150 210 210Guava 300 300 50 50 350 350Guava 180 180 180 180Kiwi 180 180 65 65 100 100 70 70 415 415Litchi 100 100 275 275 375 375Litchi 188 188 188 188Mango 20 20 125 125 145 145Orange 2095 2095 800 800 455 455 550 550 3900 3900Khasi Mandarin Orange (HDP)
100 100 822 822 600 600 1522 1522
Papaya 35 35 110 110 40 40 185 185Passion Fruit 100 100 220 220 500 500 820 820Pear 85 85 85 85Pineapple 400 400 970 970 380 380 1750 1750Pine apple (suckers) 351 351 200 200 600 600 1151 1151Plum 90 90 90 90Walnut 45 45 45 45Temperate fruits 120 120 120 120Cost Intensive Crop 1394 1100 1394 1100Highdensity planting 0 0Other than cost intensive crops
0 0
V. 3rd Year Maintenance (30% 2009-10)
5608 5608 4925 4925 2500 2500 2635 2635 2850 2350 6930 6930 825 825 1530 1530 27803 27303
Apple 593 593 50 50 643 643Assam Lemon 270 270 270 270Avocado 150 150 150 150Banana 1395 1395 800 800 555 555 700 700 650 650 4100 4100Citrus 1300 1300 3000 3000 4300 4300Grapes 500 500 0
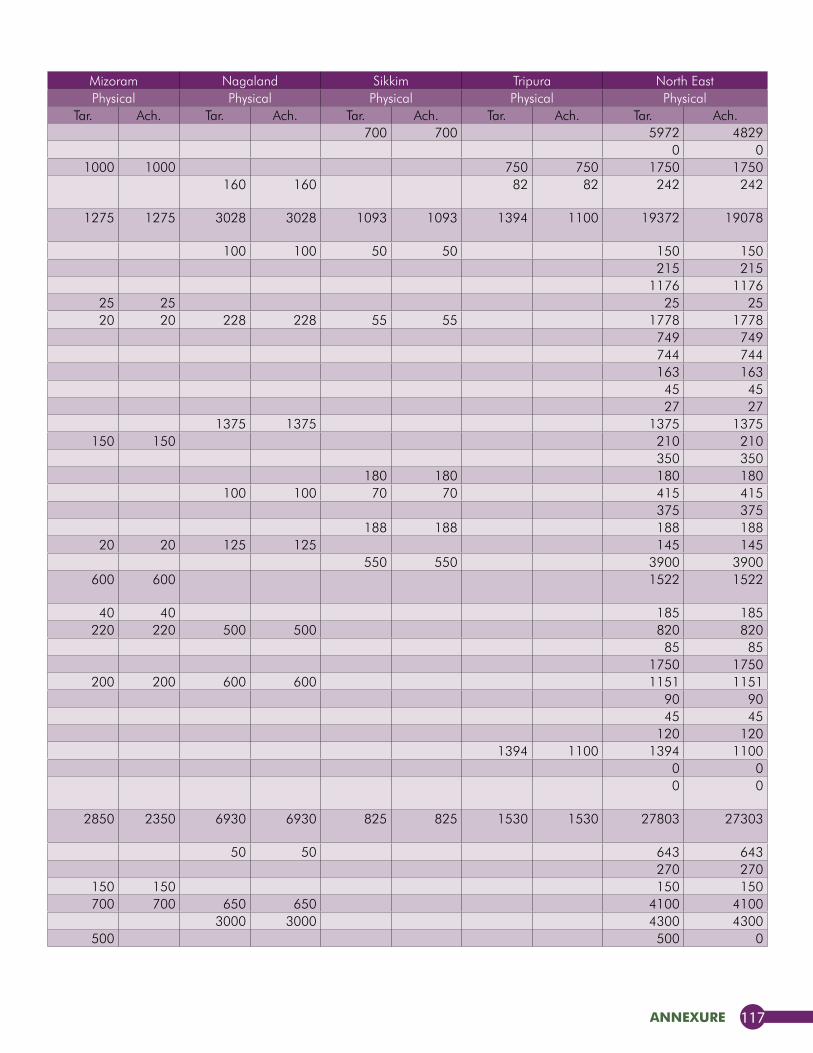
annexure 117
Arunachal Pr. Assam Manipur Meghalaya Mizoram Nagaland Sikkim Tripura North EastComponent Physical Physical Physical Physical Physical Physical Physical Physical Physical
Tar. Ach. Tar. Ach. Tar. Ach. Tar. Ach. Tar. Ach. Tar. Ach. Tar. Ach. Tar. Ach. Tar. Ach.Orange 2870 2857 500 500 1400 300 502 472 700 700 5972 4829Peach 0 0Rejuvenation 1000 1000 750 750 1750 1750Canopy Management, Meadow Orcharding, etc.
160 160 82 82 242 242
IV. 2nd Year Maintenance (20% 2010-11)
2890 2890 4975 4975 2807 2807 1910 1910 1275 1275 3028 3028 1093 1093 1394 1100 19372 19078
Apple 100 100 50 50 150 150Apple 215 215 215 215Assam Lemon 830 830 346 346 1176 1176Avocado 25 25 25 25Banana (suckers) 1475 1475 20 20 228 228 55 55 1778 1778Banana (TC) 100 100 355 355 294 294 749 749Cashewnut 600 600 144 144 744 744Cashewnut 163 163 163 163Chestnut 45 45 45 45Cherry 27 27 27 27Citrus 1375 1375 1375 1375Grapes 60 60 150 150 210 210Guava 300 300 50 50 350 350Guava 180 180 180 180Kiwi 180 180 65 65 100 100 70 70 415 415Litchi 100 100 275 275 375 375Litchi 188 188 188 188Mango 20 20 125 125 145 145Orange 2095 2095 800 800 455 455 550 550 3900 3900Khasi Mandarin Orange (HDP)
100 100 822 822 600 600 1522 1522
Papaya 35 35 110 110 40 40 185 185Passion Fruit 100 100 220 220 500 500 820 820Pear 85 85 85 85Pineapple 400 400 970 970 380 380 1750 1750Pine apple (suckers) 351 351 200 200 600 600 1151 1151Plum 90 90 90 90Walnut 45 45 45 45Temperate fruits 120 120 120 120Cost Intensive Crop 1394 1100 1394 1100Highdensity planting 0 0Other than cost intensive crops
0 0
V. 3rd Year Maintenance (30% 2009-10)
5608 5608 4925 4925 2500 2500 2635 2635 2850 2350 6930 6930 825 825 1530 1530 27803 27303
Apple 593 593 50 50 643 643Assam Lemon 270 270 270 270Avocado 150 150 150 150Banana 1395 1395 800 800 555 555 700 700 650 650 4100 4100Citrus 1300 1300 3000 3000 4300 4300Grapes 500 500 0
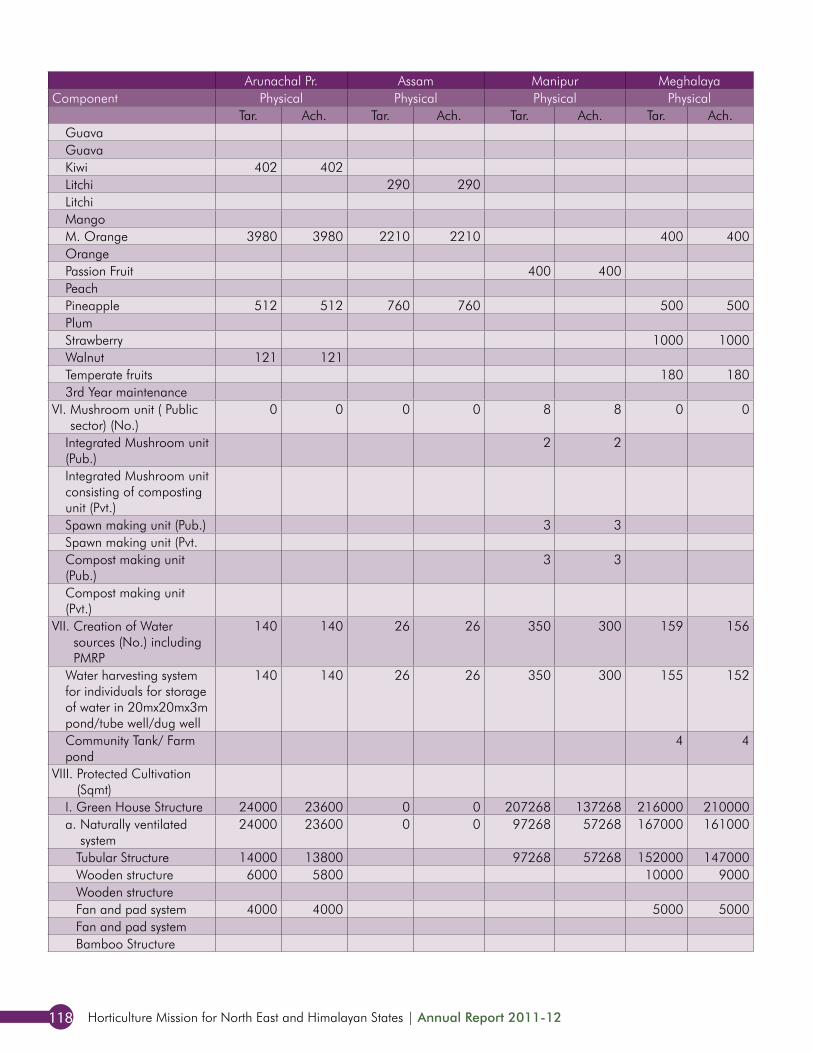
Horticulture Mission for North East and Himalayan States | Annual Report 2011-12118
Arunachal Pr. Assam Manipur Meghalaya Mizoram Nagaland Sikkim Tripura North EastComponent Physical Physical Physical Physical Physical Physical Physical Physical Physical
Tar. Ach. Tar. Ach. Tar. Ach. Tar. Ach. Tar. Ach. Tar. Ach. Tar. Ach. Tar. Ach. Tar. Ach.Guava 100 100 100 100Guava 100 100 100 100Kiwi 402 402 500 500 185 185 1087 1087Litchi 290 290 100 100 390 390Litchi 160 160 160 160Mango 300 300 300 300M. Orange 3980 3980 2210 2210 400 400 1000 1000 7590 7590Orange 565 565 565 565Passion Fruit 400 400 1000 1000 1400 1400Peach 50 50 50 50Pineapple 512 512 760 760 500 500 1150 1150 2922 2922Plum 265 265 265 265Strawberry 1000 1000 80 80 1080 1080Walnut 121 121 121 121Temperate fruits 180 180 180 1803rd Year maintenance 1530 1530 1530 1530
VI. Mushroom unit ( Public sector) (No.)
0 0 0 0 8 8 0 0 0 0 0 0 0 0 0 0 8 8
Integrated Mushroom unit (Pub.)
2 2 2 2
Integrated Mushroom unit consisting of composting unit (Pvt.)
0 0
Spawn making unit (Pub.) 3 3 3 3Spawn making unit (Pvt. 0 0Compost making unit (Pub.)
3 3 3 3
Compost making unit (Pvt.)
0 0
VII. Creation of Water sources (No.) including PMRP
140 140 26 26 350 300 159 156 513 513 325 325 108 108 318 318 1939 1886
Water harvesting system for individuals for storage of water in 20mx20mx3m pond/tube well/dug well
140 140 26 26 350 300 155 152 513 513 325 325 98 98 310 310 1917 1864
Community Tank/ Farm pond
4 4 10 10 8 8 22 22
VIII. Protected Cultivation (Sqmt)
I. Green House Structure 24000 23600 0 0 207268 137268 216000 210000 73000 73000 40000 30000 277687 213000 141400 0 979355 686868a. Naturally ventilated
system24000 23600 0 0 97268 57268 167000 161000 43000 43000 40000 30000 252687 188000 115500 0 739455 502868
Tubular Structure 14000 13800 97268 57268 152000 147000 43000 43000 40000 30000 220432 160000 30800 597500 451068Wooden structure 6000 5800 10000 9000 16000 14800Wooden structure 29000 29000 0Fan and pad system 4000 4000 5000 5000 9000 9000Fan and pad system 15200 15200 0Bamboo Structure 32255 28000 40500 72755 28000
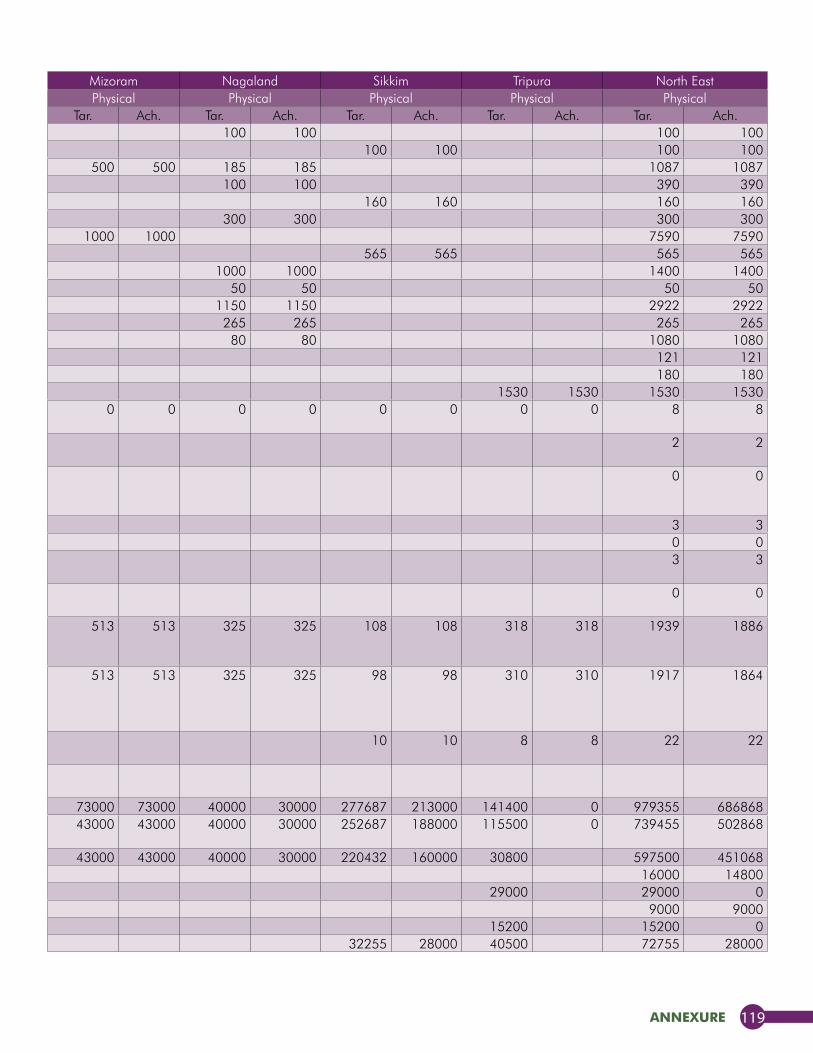
annexure 119
Arunachal Pr. Assam Manipur Meghalaya Mizoram Nagaland Sikkim Tripura North EastComponent Physical Physical Physical Physical Physical Physical Physical Physical Physical
Tar. Ach. Tar. Ach. Tar. Ach. Tar. Ach. Tar. Ach. Tar. Ach. Tar. Ach. Tar. Ach. Tar. Ach.Guava 100 100 100 100Guava 100 100 100 100Kiwi 402 402 500 500 185 185 1087 1087Litchi 290 290 100 100 390 390Litchi 160 160 160 160Mango 300 300 300 300M. Orange 3980 3980 2210 2210 400 400 1000 1000 7590 7590Orange 565 565 565 565Passion Fruit 400 400 1000 1000 1400 1400Peach 50 50 50 50Pineapple 512 512 760 760 500 500 1150 1150 2922 2922Plum 265 265 265 265Strawberry 1000 1000 80 80 1080 1080Walnut 121 121 121 121Temperate fruits 180 180 180 1803rd Year maintenance 1530 1530 1530 1530
VI. Mushroom unit ( Public sector) (No.)
0 0 0 0 8 8 0 0 0 0 0 0 0 0 0 0 8 8
Integrated Mushroom unit (Pub.)
2 2 2 2
Integrated Mushroom unit consisting of composting unit (Pvt.)
0 0
Spawn making unit (Pub.) 3 3 3 3Spawn making unit (Pvt. 0 0Compost making unit (Pub.)
3 3 3 3
Compost making unit (Pvt.)
0 0
VII. Creation of Water sources (No.) including PMRP
140 140 26 26 350 300 159 156 513 513 325 325 108 108 318 318 1939 1886
Water harvesting system for individuals for storage of water in 20mx20mx3m pond/tube well/dug well
140 140 26 26 350 300 155 152 513 513 325 325 98 98 310 310 1917 1864
Community Tank/ Farm pond
4 4 10 10 8 8 22 22
VIII. Protected Cultivation (Sqmt)
I. Green House Structure 24000 23600 0 0 207268 137268 216000 210000 73000 73000 40000 30000 277687 213000 141400 0 979355 686868a. Naturally ventilated
system24000 23600 0 0 97268 57268 167000 161000 43000 43000 40000 30000 252687 188000 115500 0 739455 502868
Tubular Structure 14000 13800 97268 57268 152000 147000 43000 43000 40000 30000 220432 160000 30800 597500 451068Wooden structure 6000 5800 10000 9000 16000 14800Wooden structure 29000 29000 0Fan and pad system 4000 4000 5000 5000 9000 9000Fan and pad system 15200 15200 0Bamboo Structure 32255 28000 40500 72755 28000
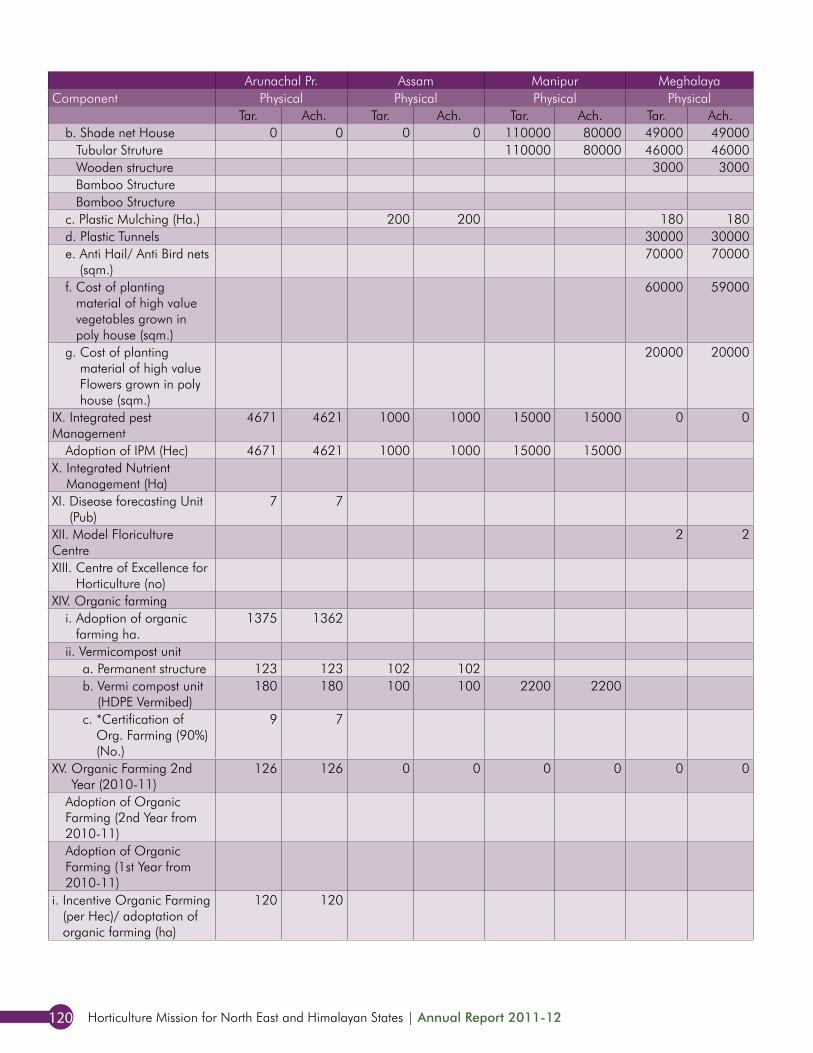
Horticulture Mission for North East and Himalayan States | Annual Report 2011-12120
Arunachal Pr. Assam Manipur Meghalaya Mizoram Nagaland Sikkim Tripura North EastComponent Physical Physical Physical Physical Physical Physical Physical Physical Physical
Tar. Ach. Tar. Ach. Tar. Ach. Tar. Ach. Tar. Ach. Tar. Ach. Tar. Ach. Tar. Ach. Tar. Ach.b. Shade net House 0 0 0 0 110000 80000 49000 49000 30000 30000 0 0 25000 25000 25900 0 239900 184000
Tubular Struture 110000 80000 46000 46000 30000 30000 11000 197000 156000Wooden structure 3000 3000 3000 3000Bamboo Structure 0 0Bamboo Structure 25000 25000 14900 39900 25000
c. Plastic Mulching (Ha.) 200 200 180 180 240 240 155 155 75 850 775d. Plastic Tunnels 30000 30000 6000 6000 18500 54500 36000e. Anti Hail/ Anti Bird nets
(sqm.)70000 70000 70000 70000
f. Cost of planting material of high value vegetables grown in poly house (sqm.)
60000 59000 6300 66300 59000
g. Cost of planting material of high value Flowers grown in poly house (sqm.)
20000 20000 80000 80000 100000 100000
IX. Integrated pest Management
4671 4621 1000 1000 15000 15000 0 0 23500 23500 7510 7510 10500 10500 878 878 63059 63009
Adoption of IPM (Hec) 4671 4621 1000 1000 15000 15000 23500 23500 7510 7510 10500 10500 878 878 63059 63009X. Integrated Nutrient
Management (Ha)8800 8800 8800 8800
XI. Disease forecasting Unit (Pub)
7 7 7 7
XII. Model Floriculture Centre
2 2 2 2
XIII. Centre of Excellence for Horticulture (no)
1 1 1 1
XIV. Organic farmingi. Adoption of organic
farming ha.1375 1362 4800 4800 6175 6162
ii. Vermicompost unita. Permanent structure 123 123 102 102 55 55 116 116 396 396b. Vermi compost unit
(HDPE Vermibed)180 180 100 100 2200 2200 200 200 892 892 3572 3572
c. *Certification of Org. Farming (90%) (No.)
9 7 87 87 96 94
XV. Organic Farming 2nd Year (2010-11)
126 126 0 0 0 0 0 0 0 0 3110 3110 5000 5000 0 0 8236 8236
Adoption of Organic Farming (2nd Year from 2010-11)
1100 1100 5000 5000 6100 6100
Adoption of Organic Farming (1st Year from 2010-11)
2000 2000 2000 2000
i. Incentive Organic Farming (per Hec)/ adoptation of organic farming (ha)
120 120 120 120
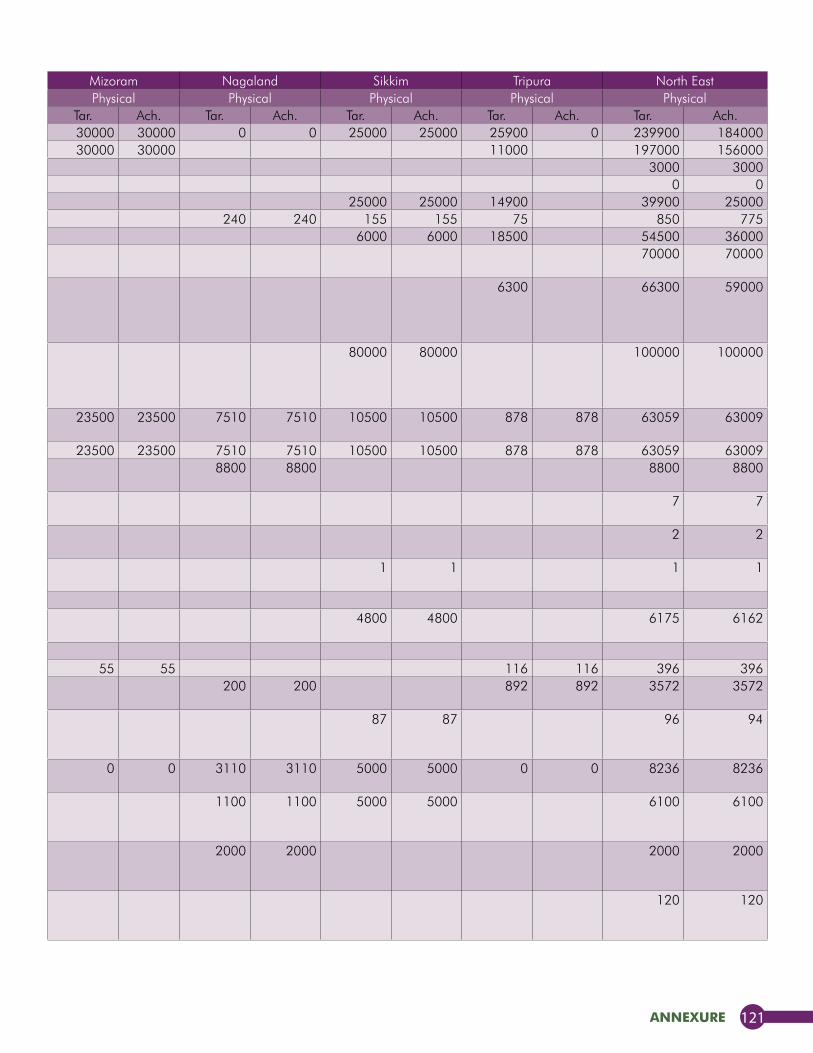
annexure 121
Arunachal Pr. Assam Manipur Meghalaya Mizoram Nagaland Sikkim Tripura North EastComponent Physical Physical Physical Physical Physical Physical Physical Physical Physical
Tar. Ach. Tar. Ach. Tar. Ach. Tar. Ach. Tar. Ach. Tar. Ach. Tar. Ach. Tar. Ach. Tar. Ach.b. Shade net House 0 0 0 0 110000 80000 49000 49000 30000 30000 0 0 25000 25000 25900 0 239900 184000
Tubular Struture 110000 80000 46000 46000 30000 30000 11000 197000 156000Wooden structure 3000 3000 3000 3000Bamboo Structure 0 0Bamboo Structure 25000 25000 14900 39900 25000
c. Plastic Mulching (Ha.) 200 200 180 180 240 240 155 155 75 850 775d. Plastic Tunnels 30000 30000 6000 6000 18500 54500 36000e. Anti Hail/ Anti Bird nets
(sqm.)70000 70000 70000 70000
f. Cost of planting material of high value vegetables grown in poly house (sqm.)
60000 59000 6300 66300 59000
g. Cost of planting material of high value Flowers grown in poly house (sqm.)
20000 20000 80000 80000 100000 100000
IX. Integrated pest Management
4671 4621 1000 1000 15000 15000 0 0 23500 23500 7510 7510 10500 10500 878 878 63059 63009
Adoption of IPM (Hec) 4671 4621 1000 1000 15000 15000 23500 23500 7510 7510 10500 10500 878 878 63059 63009X. Integrated Nutrient
Management (Ha)8800 8800 8800 8800
XI. Disease forecasting Unit (Pub)
7 7 7 7
XII. Model Floriculture Centre
2 2 2 2
XIII. Centre of Excellence for Horticulture (no)
1 1 1 1
XIV. Organic farmingi. Adoption of organic
farming ha.1375 1362 4800 4800 6175 6162
ii. Vermicompost unita. Permanent structure 123 123 102 102 55 55 116 116 396 396b. Vermi compost unit
(HDPE Vermibed)180 180 100 100 2200 2200 200 200 892 892 3572 3572
c. *Certification of Org. Farming (90%) (No.)
9 7 87 87 96 94
XV. Organic Farming 2nd Year (2010-11)
126 126 0 0 0 0 0 0 0 0 3110 3110 5000 5000 0 0 8236 8236
Adoption of Organic Farming (2nd Year from 2010-11)
1100 1100 5000 5000 6100 6100
Adoption of Organic Farming (1st Year from 2010-11)
2000 2000 2000 2000
i. Incentive Organic Farming (per Hec)/ adoptation of organic farming (ha)
120 120 120 120
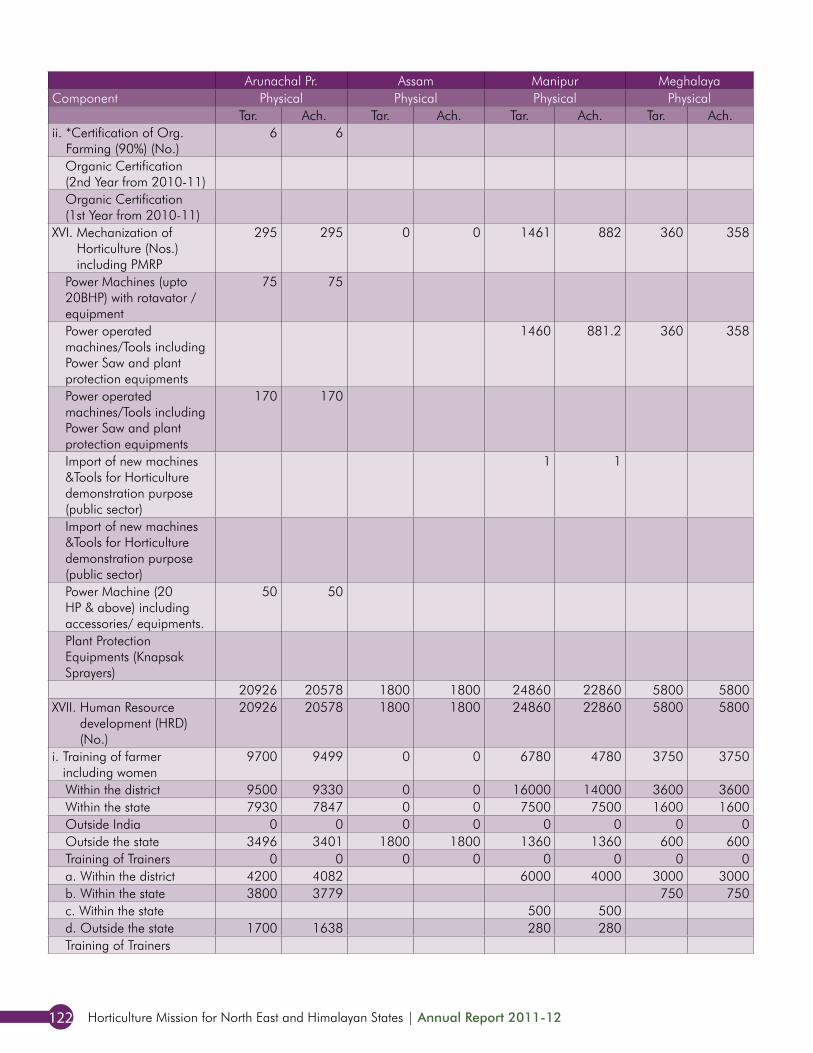
Horticulture Mission for North East and Himalayan States | Annual Report 2011-12122
Arunachal Pr. Assam Manipur Meghalaya Mizoram Nagaland Sikkim Tripura North EastComponent Physical Physical Physical Physical Physical Physical Physical Physical Physical
Tar. Ach. Tar. Ach. Tar. Ach. Tar. Ach. Tar. Ach. Tar. Ach. Tar. Ach. Tar. Ach. Tar. Ach.ii. *Certification of Org.
Farming (90%) (No.)6 6 6 6
Organic Certification (2nd Year from 2010-11)
5 5 5 5
Organic Certification (1st Year from 2010-11)
5 5 5 5
XVI. Mechanization of Horticulture (Nos.) including PMRP
295 295 0 0 1461 882 360 358 290 290 2285 2285 101 101 135 60 4927 4271
Power Machines (upto 20BHP) with rotavator / equipment
75 75 100 100 75 75 250 250
Power operated machines/Tools including Power Saw and plant protection equipments
1460 881.2 360 358 180 180 200 200 100 100 135 60 2435 1779
Power operated machines/Tools including Power Saw and plant protection equipments
170 170 170 170
Import of new machines &Tools for Horticulture demonstration purpose (public sector)
1 1 1 1
Import of new machines &Tools for Horticulture demonstration purpose (public sector)
1 1 1 1
Power Machine (20 HP & above) including accessories/ equipments.
50 50 10 10 65 65 125 125
Plant Protection Equipments (Knapsak Sprayers)
1945 1945 1945 1945
20926 20578 1800 1800 24860 22860 5800 5800 18104 18104 9803 9803 18959 15759 12546 12546 112797 107249XVII. Human Resource
development (HRD) (No.)
20926 20578 1800 1800 24860 22860 5800 5800 18104 18104 9803 9803 18959 15759 12546 12546 112797 107249
i. Training of farmer including women
9700 9499 0 0 6780 4780 3750 3750 0 0 5500 5500 9450 6350 10209 10209 45389 40088
Within the district 9500 9330 0 0 16000 14000 3600 3600 3600 3600 3700 3700 9508 7508 8364 8364 54272 50102Within the state 7930 7847 0 0 7500 7500 1600 1600 9000 9000 3500 3500 5350 4350 2460 2460 37340 36257Outside India 0 0 0 0 0 0 0 0 4 4 3 3 1 1 0 0 7 7Outside the state 3496 3401 1800 1800 1360 1360 600 600 5500 5500 2600 2600 4100 3900 1722 1722 21178 20883Training of Trainers 0 0 0 0 0 0 0 0 0 0 0 0 0 0 0 0 0 0a. Within the district 4200 4082 6000 4000 3000 3000 2500 2500 6100 4100 7380 7380 29180 25062b. Within the state 3800 3779 750 750 1850 850 1968 1968 8368 7347c. Within the state 500 500 1500 1500 2000 2000d. Outside the state 1700 1638 280 280 1500 1500 1500 1400 861 861 5841 5679Training of Trainers 0 0
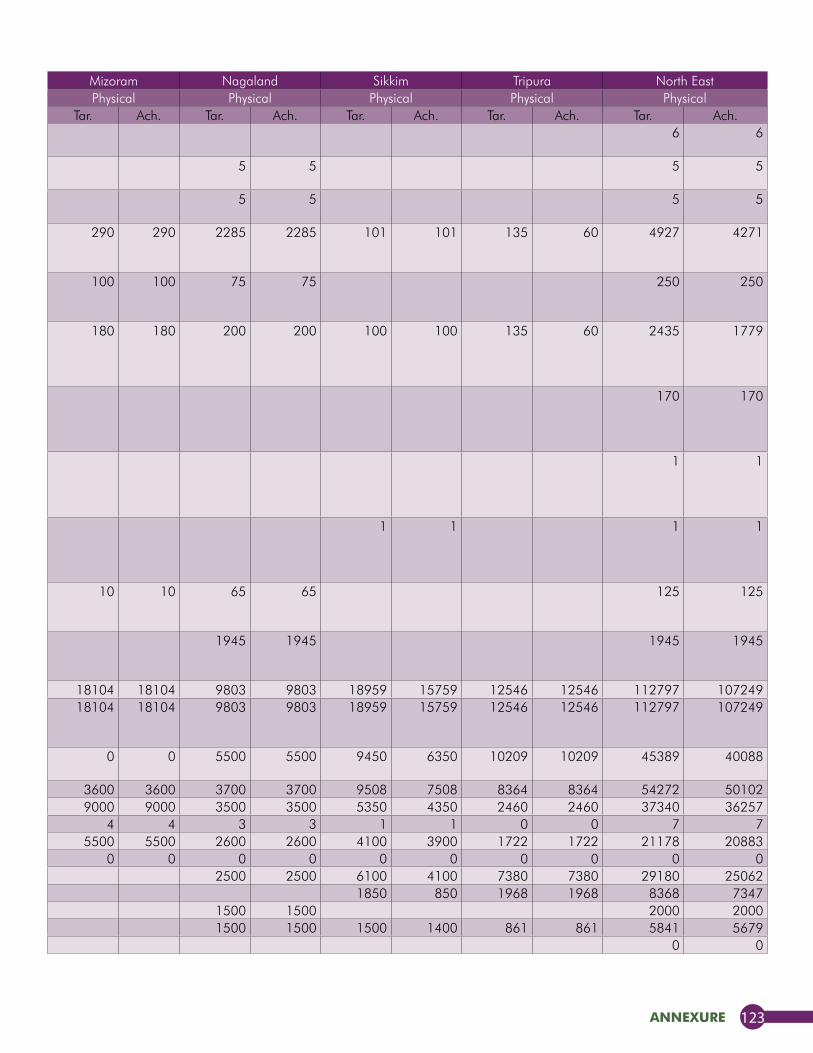
annexure 123
Arunachal Pr. Assam Manipur Meghalaya Mizoram Nagaland Sikkim Tripura North EastComponent Physical Physical Physical Physical Physical Physical Physical Physical Physical
Tar. Ach. Tar. Ach. Tar. Ach. Tar. Ach. Tar. Ach. Tar. Ach. Tar. Ach. Tar. Ach. Tar. Ach.ii. *Certification of Org.
Farming (90%) (No.)6 6 6 6
Organic Certification (2nd Year from 2010-11)
5 5 5 5
Organic Certification (1st Year from 2010-11)
5 5 5 5
XVI. Mechanization of Horticulture (Nos.) including PMRP
295 295 0 0 1461 882 360 358 290 290 2285 2285 101 101 135 60 4927 4271
Power Machines (upto 20BHP) with rotavator / equipment
75 75 100 100 75 75 250 250
Power operated machines/Tools including Power Saw and plant protection equipments
1460 881.2 360 358 180 180 200 200 100 100 135 60 2435 1779
Power operated machines/Tools including Power Saw and plant protection equipments
170 170 170 170
Import of new machines &Tools for Horticulture demonstration purpose (public sector)
1 1 1 1
Import of new machines &Tools for Horticulture demonstration purpose (public sector)
1 1 1 1
Power Machine (20 HP & above) including accessories/ equipments.
50 50 10 10 65 65 125 125
Plant Protection Equipments (Knapsak Sprayers)
1945 1945 1945 1945
20926 20578 1800 1800 24860 22860 5800 5800 18104 18104 9803 9803 18959 15759 12546 12546 112797 107249XVII. Human Resource
development (HRD) (No.)
20926 20578 1800 1800 24860 22860 5800 5800 18104 18104 9803 9803 18959 15759 12546 12546 112797 107249
i. Training of farmer including women
9700 9499 0 0 6780 4780 3750 3750 0 0 5500 5500 9450 6350 10209 10209 45389 40088
Within the district 9500 9330 0 0 16000 14000 3600 3600 3600 3600 3700 3700 9508 7508 8364 8364 54272 50102Within the state 7930 7847 0 0 7500 7500 1600 1600 9000 9000 3500 3500 5350 4350 2460 2460 37340 36257Outside India 0 0 0 0 0 0 0 0 4 4 3 3 1 1 0 0 7 7Outside the state 3496 3401 1800 1800 1360 1360 600 600 5500 5500 2600 2600 4100 3900 1722 1722 21178 20883Training of Trainers 0 0 0 0 0 0 0 0 0 0 0 0 0 0 0 0 0 0a. Within the district 4200 4082 6000 4000 3000 3000 2500 2500 6100 4100 7380 7380 29180 25062b. Within the state 3800 3779 750 750 1850 850 1968 1968 8368 7347c. Within the state 500 500 1500 1500 2000 2000d. Outside the state 1700 1638 280 280 1500 1500 1500 1400 861 861 5841 5679Training of Trainers 0 0
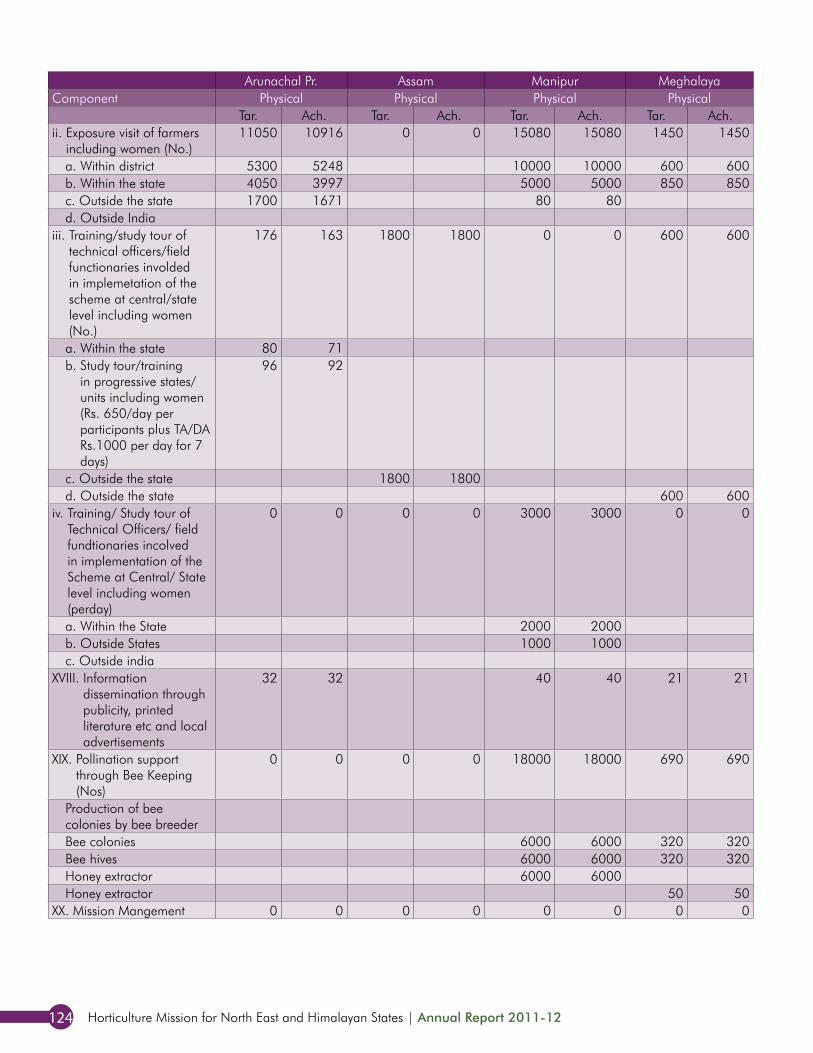
Horticulture Mission for North East and Himalayan States | Annual Report 2011-12124
Arunachal Pr. Assam Manipur Meghalaya Mizoram Nagaland Sikkim Tripura North EastComponent Physical Physical Physical Physical Physical Physical Physical Physical Physical
Tar. Ach. Tar. Ach. Tar. Ach. Tar. Ach. Tar. Ach. Tar. Ach. Tar. Ach. Tar. Ach. Tar. Ach.ii. Exposure visit of farmers
including women (No.)11050 10916 0 0 15080 15080 1450 1450 10100 10100 3200 3200 8409 8409 2337 2337 51625 51491
a. Within district 5300 5248 10000 10000 600 600 3600 3600 1200 1200 3408 3408 984 984 25092 25040b. Within the state 4050 3997 5000 5000 850 850 4000 4000 1200 1200 3500 3500 492 492 19092 19039c. Outside the state 1700 1671 80 80 2500 2500 800 800 1500 1500 861 861 7441 7412d. Outside India 1 1
iii. Training/study tour of technical officers/field functionaries involded in implemetation of the scheme at central/state level including women (No.)
176 163 1800 1800 0 0 600 600 0 0 0 0 0 0 0 0 2576 2563
a. Within the state 80 71 80 71b. Study tour/training
in progressive states/units including women (Rs. 650/day per participants plus TA/DA Rs.1000 per day for 7 days)
96 92 96 92
c. Outside the state 1800 1800 1800 1800d. Outside the state 600 600 600 600
iv. Training/ Study tour of Technical Officers/ field fundtionaries incolved in implementation of the Scheme at Central/ State level including women (perday)
0 0 0 0 3000 3000 0 0 8004 8004 1103 1103 1100 1000 0 0 13207 13107
a. Within the State 2000 2000 5000 5000 800 800 7800 7800b. Outside States 1000 1000 3000 3000 300 300 1100 1000 5400 5300c. Outside india 4 4 3 3 7 7
XVIII. Information dissemination through publicity, printed literature etc and local advertisements
32 32 40 40 21 21 75 75 25 25 31 31 224 224
XIX. Pollination support through Bee Keeping (Nos)
0 0 0 0 18000 18000 690 690 8300 8300 3000 3000 1433 1433 0 0 31423 31423
Production of bee colonies by bee breeder
3 3 3 3
Bee colonies 6000 6000 320 320 4000 4000 1500 1500 1300 1300 13120 13120Bee hives 6000 6000 320 320 4000 4000 1500 1500 11820 11820Honey extractor 6000 6000 6000 6000Honey extractor 50 50 300 300 130 130 480 480
XX. Mission Mangement 0 0 0 0 0 0 0 0 0 0 0 0 0 0 0 0 0 0
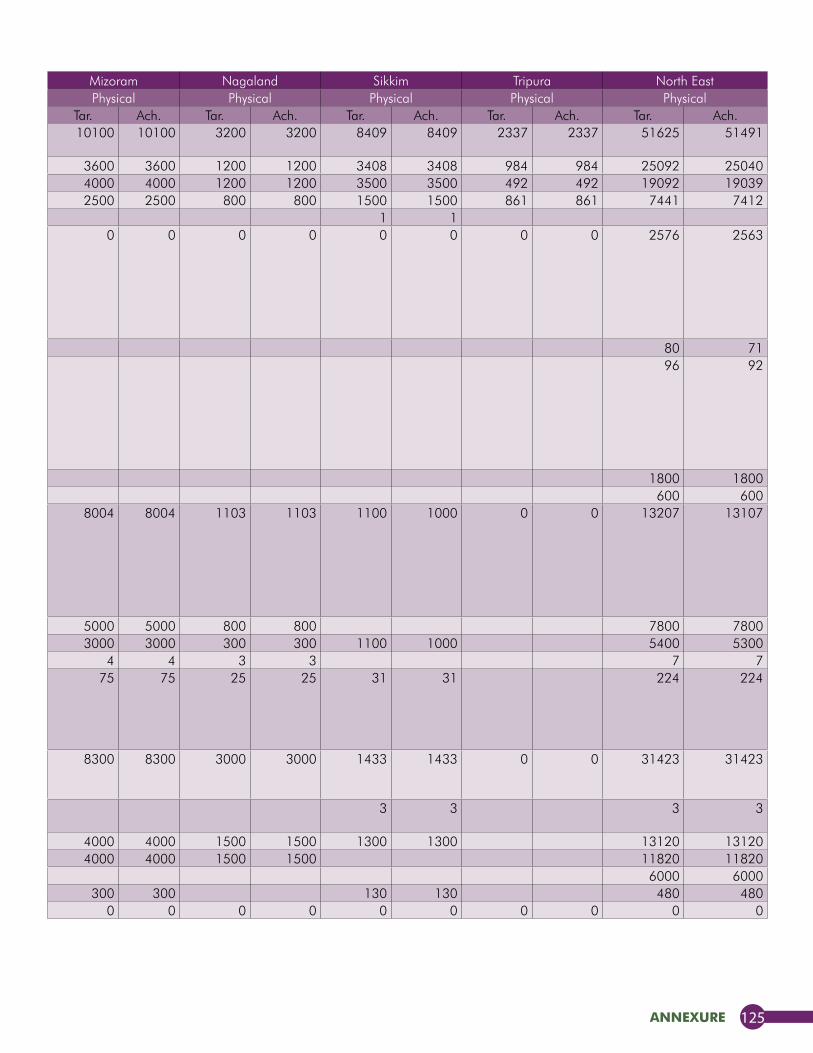
annexure 125
Arunachal Pr. Assam Manipur Meghalaya Mizoram Nagaland Sikkim Tripura North EastComponent Physical Physical Physical Physical Physical Physical Physical Physical Physical
Tar. Ach. Tar. Ach. Tar. Ach. Tar. Ach. Tar. Ach. Tar. Ach. Tar. Ach. Tar. Ach. Tar. Ach.ii. Exposure visit of farmers
including women (No.)11050 10916 0 0 15080 15080 1450 1450 10100 10100 3200 3200 8409 8409 2337 2337 51625 51491
a. Within district 5300 5248 10000 10000 600 600 3600 3600 1200 1200 3408 3408 984 984 25092 25040b. Within the state 4050 3997 5000 5000 850 850 4000 4000 1200 1200 3500 3500 492 492 19092 19039c. Outside the state 1700 1671 80 80 2500 2500 800 800 1500 1500 861 861 7441 7412d. Outside India 1 1
iii. Training/study tour of technical officers/field functionaries involded in implemetation of the scheme at central/state level including women (No.)
176 163 1800 1800 0 0 600 600 0 0 0 0 0 0 0 0 2576 2563
a. Within the state 80 71 80 71b. Study tour/training
in progressive states/units including women (Rs. 650/day per participants plus TA/DA Rs.1000 per day for 7 days)
96 92 96 92
c. Outside the state 1800 1800 1800 1800d. Outside the state 600 600 600 600
iv. Training/ Study tour of Technical Officers/ field fundtionaries incolved in implementation of the Scheme at Central/ State level including women (perday)
0 0 0 0 3000 3000 0 0 8004 8004 1103 1103 1100 1000 0 0 13207 13107
a. Within the State 2000 2000 5000 5000 800 800 7800 7800b. Outside States 1000 1000 3000 3000 300 300 1100 1000 5400 5300c. Outside india 4 4 3 3 7 7
XVIII. Information dissemination through publicity, printed literature etc and local advertisements
32 32 40 40 21 21 75 75 25 25 31 31 224 224
XIX. Pollination support through Bee Keeping (Nos)
0 0 0 0 18000 18000 690 690 8300 8300 3000 3000 1433 1433 0 0 31423 31423
Production of bee colonies by bee breeder
3 3 3 3
Bee colonies 6000 6000 320 320 4000 4000 1500 1500 1300 1300 13120 13120Bee hives 6000 6000 320 320 4000 4000 1500 1500 11820 11820Honey extractor 6000 6000 6000 6000Honey extractor 50 50 300 300 130 130 480 480
XX. Mission Mangement 0 0 0 0 0 0 0 0 0 0 0 0 0 0 0 0 0 0
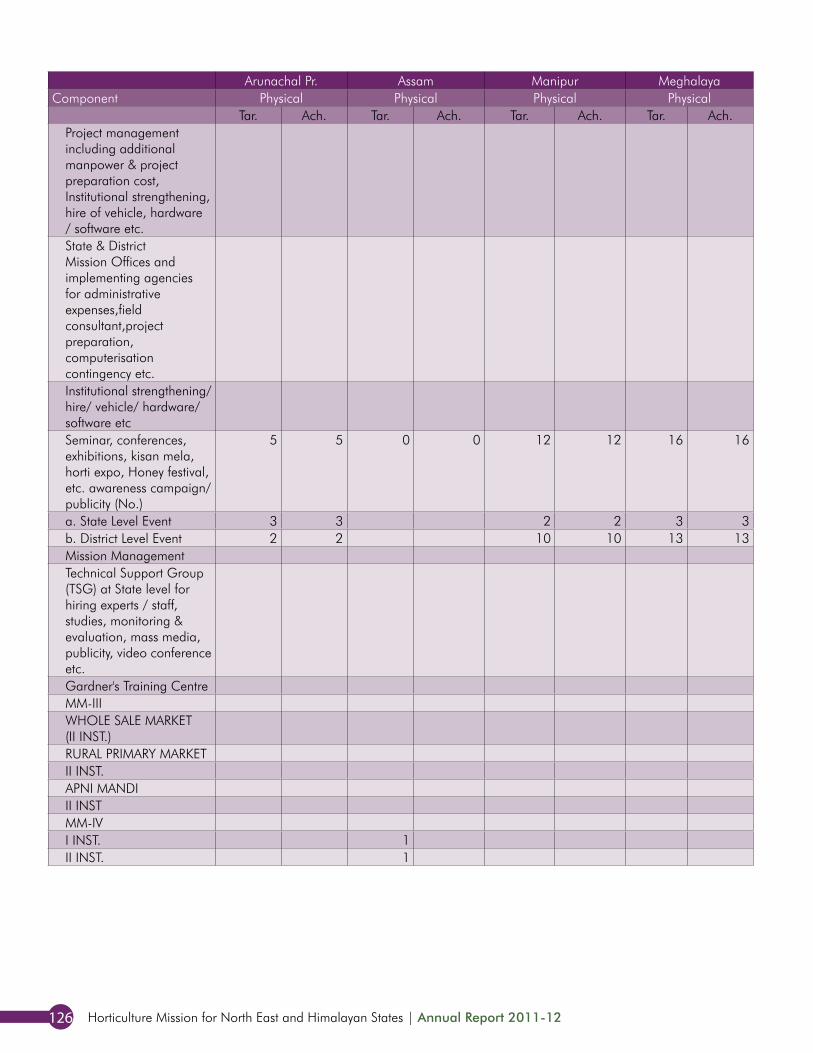
Horticulture Mission for North East and Himalayan States | Annual Report 2011-12126
Arunachal Pr. Assam Manipur Meghalaya Mizoram Nagaland Sikkim Tripura North EastComponent Physical Physical Physical Physical Physical Physical Physical Physical Physical
Tar. Ach. Tar. Ach. Tar. Ach. Tar. Ach. Tar. Ach. Tar. Ach. Tar. Ach. Tar. Ach. Tar. Ach.Project management including additional manpower & project preparation cost, Institutional strengthening, hire of vehicle, hardware / software etc.
0 0
State & District Mission Offices and implementing agencies for administrative expenses,field consultant,project preparation, computerisation contingency etc.
0 0
Institutional strengthening/hire/ vehicle/ hardware/software etc
0 0
Seminar, conferences, exhibitions, kisan mela, horti expo, Honey festival, etc. awareness campaign/publicity (No.)
5 5 0 0 12 12 16 16 9 9 7 7 12 12 6 5 67 66
a. State Level Event 3 3 2 2 3 3 1 1 2 2 6 6 2 2 19 19b. District Level Event 2 2 10 10 13 13 8 8 5 5 6 6 4 3 48 47Mission ManagementTechnical Support Group (TSG) at State level for hiring experts / staff, studies, monitoring & evaluation, mass media, publicity, video conference etc.Gardner's Training CentreMM-IIIWHOLE SALE MARKET (II INST.)RURAL PRIMARY MARKETII INST. 13 8 0 21APNI MANDIII INST 1 0 1MM-IV I INST. 1 1 0 2II INST. 1 0 1
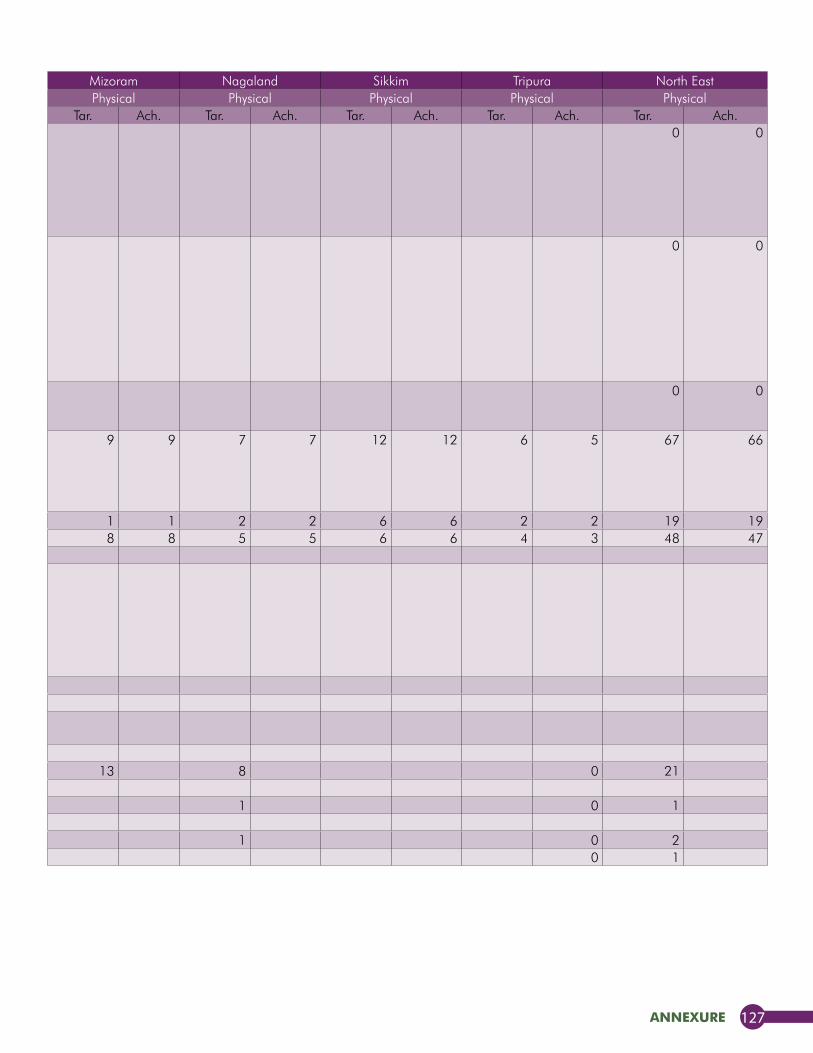
annexure 127
Arunachal Pr. Assam Manipur Meghalaya Mizoram Nagaland Sikkim Tripura North EastComponent Physical Physical Physical Physical Physical Physical Physical Physical Physical
Tar. Ach. Tar. Ach. Tar. Ach. Tar. Ach. Tar. Ach. Tar. Ach. Tar. Ach. Tar. Ach. Tar. Ach.Project management including additional manpower & project preparation cost, Institutional strengthening, hire of vehicle, hardware / software etc.
0 0
State & District Mission Offices and implementing agencies for administrative expenses,field consultant,project preparation, computerisation contingency etc.
0 0
Institutional strengthening/hire/ vehicle/ hardware/software etc
0 0
Seminar, conferences, exhibitions, kisan mela, horti expo, Honey festival, etc. awareness campaign/publicity (No.)
5 5 0 0 12 12 16 16 9 9 7 7 12 12 6 5 67 66
a. State Level Event 3 3 2 2 3 3 1 1 2 2 6 6 2 2 19 19b. District Level Event 2 2 10 10 13 13 8 8 5 5 6 6 4 3 48 47Mission ManagementTechnical Support Group (TSG) at State level for hiring experts / staff, studies, monitoring & evaluation, mass media, publicity, video conference etc.Gardner's Training CentreMM-IIIWHOLE SALE MARKET (II INST.)RURAL PRIMARY MARKETII INST. 13 8 0 21APNI MANDIII INST 1 0 1MM-IV I INST. 1 1 0 2II INST. 1 0 1
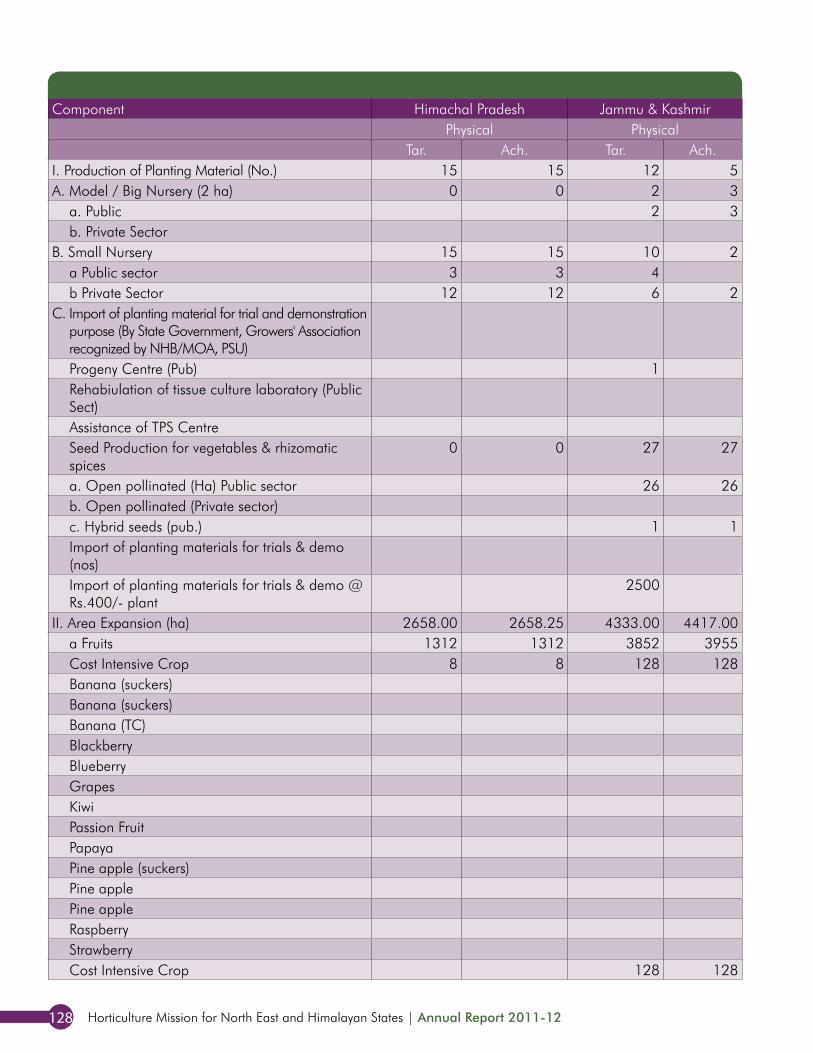
Horticulture Mission for North East and Himalayan States | Annual Report 2011-12128
Component Himachal Pradesh Jammu & Kashmir Uttarakhand Himalayan States Total NER + HSPhysical Physical Physical Physical Physical
Tar. Ach. Tar. Ach. Tar. Ach. Tar. Ach. Tar. Ach.I. Production of Planting Material (No.) 15 15 12 5 2 27 29 47 214 216A. Model / Big Nursery (2 ha) 0 0 2 3 2 8 4 11 96 87
a. Public 2 3 8 2 11 78 71b. Private Sector 2 2 0 18 16
B. Small Nursery 15 15 10 2 19 25 36 118 129a Public sector 3 3 4 14 7 17 37 47b Private Sector 12 12 6 2 5 18 19 81 82
C. Import of planting material for trial and demonstration purpose (By State Government, Growers' Association recognized by NHB/MOA, PSU)
0 0 5 5
Progeny Centre (Pub) 1 1 0 1 0Rehabiulation of tissue culture laboratory (Public Sect)
0 0 2 2
Assistance of TPS Centre 0 0 1 1Seed Production for vegetables & rhizomatic spices
0 0 27 27 3 1 30 28 74 72
a. Open pollinated (Ha) Public sector 26 26 3 1 29 27 56 54b. Open pollinated (Private sector) 0 0 17 17c. Hybrid seeds (pub.) 1 1 1 1 1 1Import of planting materials for trials & demo (nos)
0 0 5 5
Import of planting materials for trials & demo @Rs.400/- plant
2500 2500 0 2500 0
II. Area Expansion (ha) 2658.00 2658.25 4333.00 4417.00 5550.00 3533.00 12541.00 10608.25 58620 55953a Fruits 1312 1312 3852 3955 2364 1997 7528 7264 25105 24836Cost Intensive Crop 8 8 128 128 0 0 136 136 9136 9132Banana (suckers) 0 0 1515 1514Banana (suckers) 0 0 650 650Banana (TC) 0 0 617 617Blackberry 0 0 40 40Blueberry 0 0 40 40Grapes 0 0 350 350Kiwi 0 0 785 784Passion Fruit 0 0 900 900Papaya 0 0 330 330Pine apple (suckers) 0 0 2030 2028Pine apple 0 0 913 913Pine apple 0 0 590 590Raspberry 0 0 40 40Strawberry 0 0 200 200Cost Intensive Crop 128 128 128 128 128 128
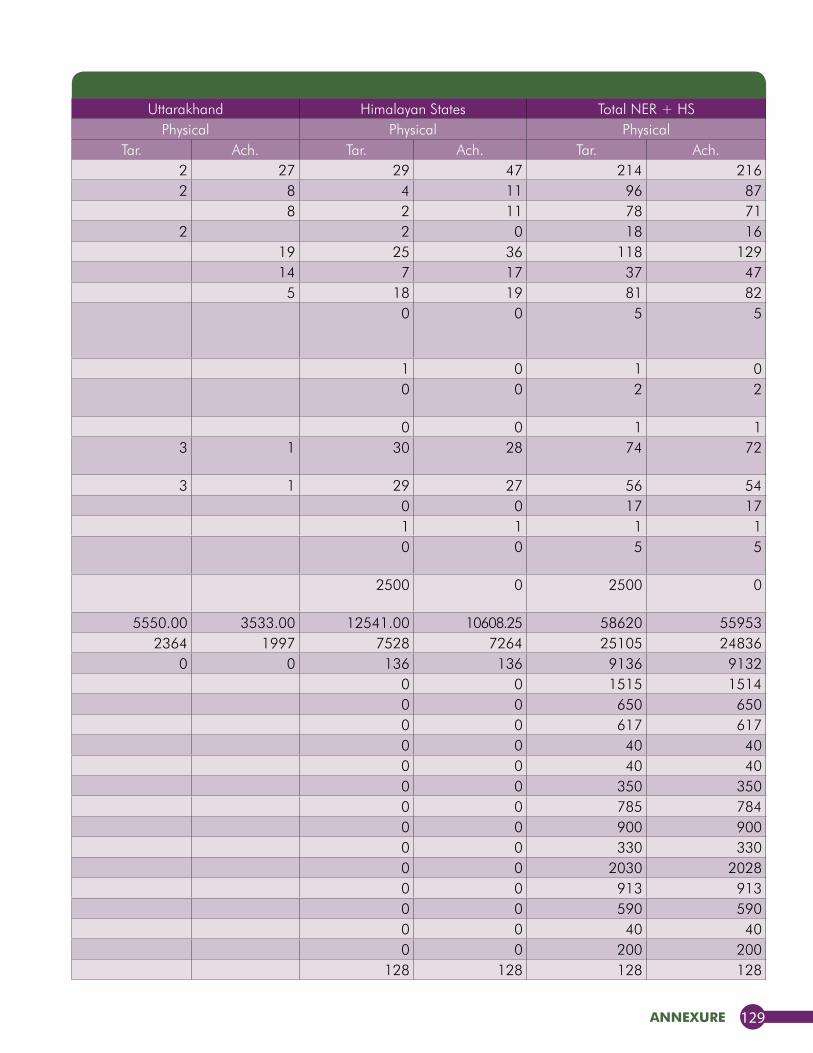
annexure 129
Component Himachal Pradesh Jammu & Kashmir Uttarakhand Himalayan States Total NER + HSPhysical Physical Physical Physical Physical
Tar. Ach. Tar. Ach. Tar. Ach. Tar. Ach. Tar. Ach.I. Production of Planting Material (No.) 15 15 12 5 2 27 29 47 214 216A. Model / Big Nursery (2 ha) 0 0 2 3 2 8 4 11 96 87
a. Public 2 3 8 2 11 78 71b. Private Sector 2 2 0 18 16
B. Small Nursery 15 15 10 2 19 25 36 118 129a Public sector 3 3 4 14 7 17 37 47b Private Sector 12 12 6 2 5 18 19 81 82
C. Import of planting material for trial and demonstration purpose (By State Government, Growers' Association recognized by NHB/MOA, PSU)
0 0 5 5
Progeny Centre (Pub) 1 1 0 1 0Rehabiulation of tissue culture laboratory (Public Sect)
0 0 2 2
Assistance of TPS Centre 0 0 1 1Seed Production for vegetables & rhizomatic spices
0 0 27 27 3 1 30 28 74 72
a. Open pollinated (Ha) Public sector 26 26 3 1 29 27 56 54b. Open pollinated (Private sector) 0 0 17 17c. Hybrid seeds (pub.) 1 1 1 1 1 1Import of planting materials for trials & demo (nos)
0 0 5 5
Import of planting materials for trials & demo @Rs.400/- plant
2500 2500 0 2500 0
II. Area Expansion (ha) 2658.00 2658.25 4333.00 4417.00 5550.00 3533.00 12541.00 10608.25 58620 55953a Fruits 1312 1312 3852 3955 2364 1997 7528 7264 25105 24836Cost Intensive Crop 8 8 128 128 0 0 136 136 9136 9132Banana (suckers) 0 0 1515 1514Banana (suckers) 0 0 650 650Banana (TC) 0 0 617 617Blackberry 0 0 40 40Blueberry 0 0 40 40Grapes 0 0 350 350Kiwi 0 0 785 784Passion Fruit 0 0 900 900Papaya 0 0 330 330Pine apple (suckers) 0 0 2030 2028Pine apple 0 0 913 913Pine apple 0 0 590 590Raspberry 0 0 40 40Strawberry 0 0 200 200Cost Intensive Crop 128 128 128 128 128 128
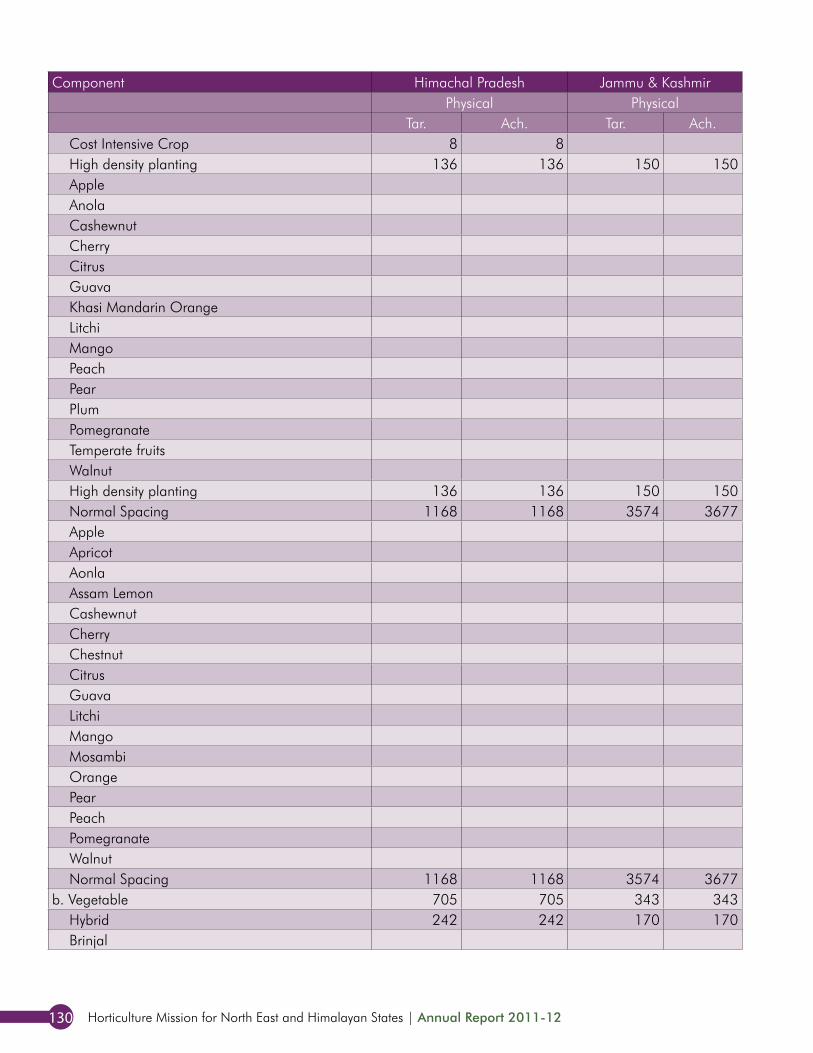
Horticulture Mission for North East and Himalayan States | Annual Report 2011-12130
Component Himachal Pradesh Jammu & Kashmir Uttarakhand Himalayan States Total NER + HSPhysical Physical Physical Physical Physical
Tar. Ach. Tar. Ach. Tar. Ach. Tar. Ach. Tar. Ach.Cost Intensive Crop 8 8 8 8.25 8 8High density planting 136 136 150 150 1927 1620 2213 1906 5958 5651Apple 550 434 550 434 725 609Anola 129 122 129 122 129 122Cashewnut 0 0 160 160Cherry 0 0 0 0Citrus 182 187 182 187 892 897Guava 194 187 194 187 489 482Khasi Mandarin Orange 0 0 930 930Litchi 150 143 150 143 362 355Mango 517 466 517 466 1267 1216Peach 128 35 128 35 128 35Pear 14 9 14 9 164 159Plum 15 2 15 2 213 200Pomegranate 48 35 48 35 48 35Temperate fruits 0 0 165 165Walnut 0 0 0 0High density planting 136 136 150 150 286 286 286 286Normal Spacing 1168 1168 3574 3677 437 377 5179 5222 10011 10053Apple 60 53 60 53 420 413Apricot 15 4 15 4 15 4Aonla 17 17 17 17 17 17Assam Lemon 0 0 800 800Cashewnut 0 0 345 345Cherry 0 0 50 50Chestnut 0 0 50 50Citrus 70 72 70 72 70 72Guava 45 26 45 26 170 151Litchi 30 22 30 22 132 124Mango 30 29 30 29 30 29Mosambi 0 0 90 90Orange 0 0 2860 2859Pear 48 33 48 33 48 33Peach 80 50 80 50 80 50Pomegranate 15 11 15 11 15 11Walnut 27 60 27 60 77 110Normal Spacing 1168 1168 3574 3677 4742 4845 4742 4845
b. Vegetable 705 705 343 343 1433 888 2481 1936 13920 13148Hybrid 242 242 170 170 412 412 1732 1732Brinjal 0 0 180 180
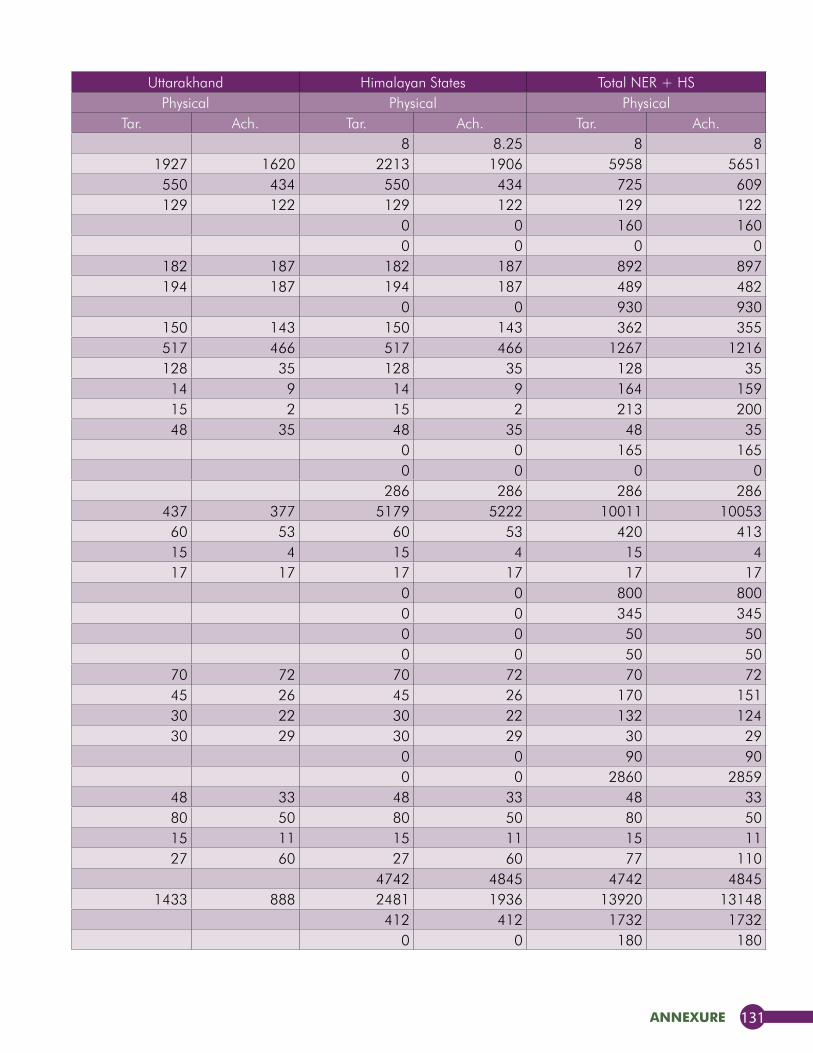
annexure 131
Component Himachal Pradesh Jammu & Kashmir Uttarakhand Himalayan States Total NER + HSPhysical Physical Physical Physical Physical
Tar. Ach. Tar. Ach. Tar. Ach. Tar. Ach. Tar. Ach.Cost Intensive Crop 8 8 8 8.25 8 8High density planting 136 136 150 150 1927 1620 2213 1906 5958 5651Apple 550 434 550 434 725 609Anola 129 122 129 122 129 122Cashewnut 0 0 160 160Cherry 0 0 0 0Citrus 182 187 182 187 892 897Guava 194 187 194 187 489 482Khasi Mandarin Orange 0 0 930 930Litchi 150 143 150 143 362 355Mango 517 466 517 466 1267 1216Peach 128 35 128 35 128 35Pear 14 9 14 9 164 159Plum 15 2 15 2 213 200Pomegranate 48 35 48 35 48 35Temperate fruits 0 0 165 165Walnut 0 0 0 0High density planting 136 136 150 150 286 286 286 286Normal Spacing 1168 1168 3574 3677 437 377 5179 5222 10011 10053Apple 60 53 60 53 420 413Apricot 15 4 15 4 15 4Aonla 17 17 17 17 17 17Assam Lemon 0 0 800 800Cashewnut 0 0 345 345Cherry 0 0 50 50Chestnut 0 0 50 50Citrus 70 72 70 72 70 72Guava 45 26 45 26 170 151Litchi 30 22 30 22 132 124Mango 30 29 30 29 30 29Mosambi 0 0 90 90Orange 0 0 2860 2859Pear 48 33 48 33 48 33Peach 80 50 80 50 80 50Pomegranate 15 11 15 11 15 11Walnut 27 60 27 60 77 110Normal Spacing 1168 1168 3574 3677 4742 4845 4742 4845
b. Vegetable 705 705 343 343 1433 888 2481 1936 13920 13148Hybrid 242 242 170 170 412 412 1732 1732Brinjal 0 0 180 180
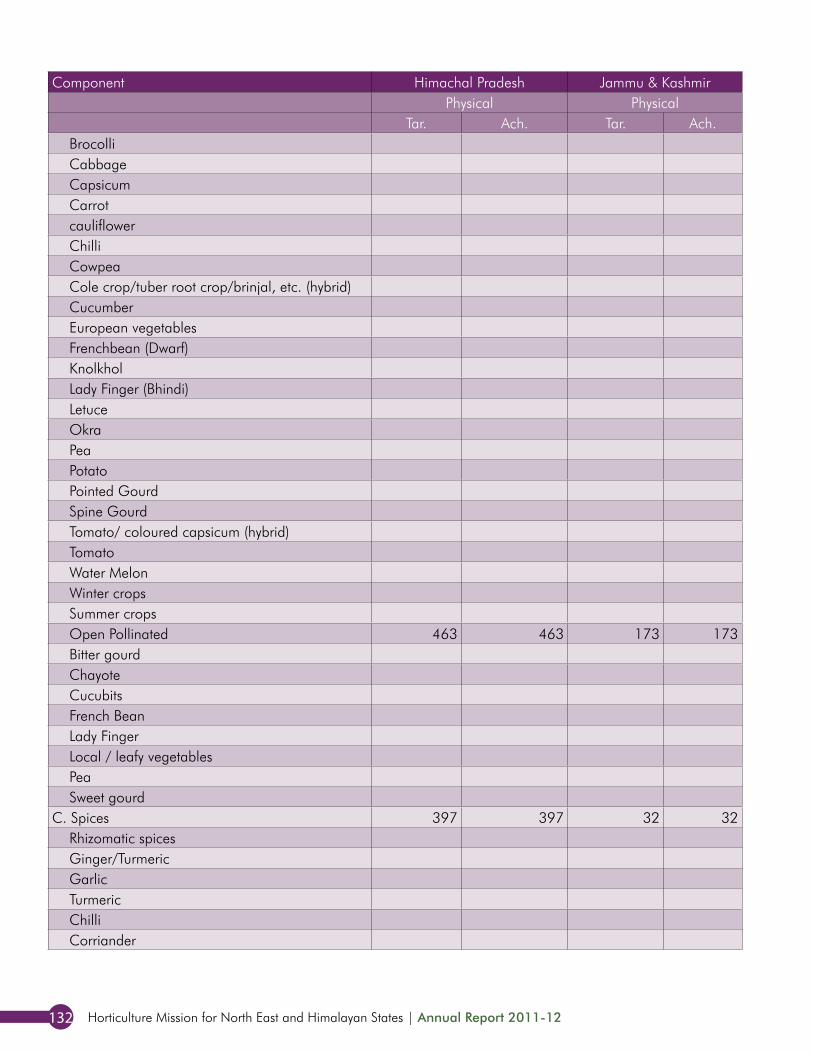
Horticulture Mission for North East and Himalayan States | Annual Report 2011-12132
Component Himachal Pradesh Jammu & Kashmir Uttarakhand Himalayan States Total NER + HSPhysical Physical Physical Physical Physical
Tar. Ach. Tar. Ach. Tar. Ach. Tar. Ach. Tar. Ach.Brocolli 0 0 110 110Cabbage 140 92 140 92 1305 1242Capsicum 140 75 140 75 510 445Carrot 0 0 214 214cauliflower 140 93 140 93 895 823Chilli 0 0 80 80Cowpea 0 0 230 220Cole crop/tuber root crop/brinjal, etc. (hybrid) 0 0 1545 1522Cucumber 0 0 40 40European vegetables 50 25 50 25 50 25Frenchbean (Dwarf) 0 0 140 140Knolkhol 0 0 80 80Lady Finger (Bhindi) 0 0 360 240Letuce 0 0 60 60Okra 0 0 170 170Pea 0 0 90 90Potato 0 0 585 585Pointed Gourd 0 0 75 65Spine Gourd 0 0 65 60Tomato/ coloured capsicum (hybrid) 0 0 395 386Tomato 200 130 200 130 920 840Water Melon 0 0 200 200Winter crops 0 0 500 500Summer crops 0 0 500 500Open Pollinated 463 463 173 173 636 636 1606 1606Bitter gourd 0 0 110 110Chayote 0 0 360 360Cucubits 10 1 10 1 10 1French Bean 150 63 150 63 150 63Lady Finger 75 50 75 50 75 50Local / leafy vegetables 28 16 28 16 28 16Pea 500 343 500 343 500 343Sweet gourd 0 0 50 50
C. Spices 397 397 32 32 1392 492 1821 921 15385 14292Rhizomatic spices 0 0 0 0Ginger/Turmeric 571 158 571 158 6253 5718Garlic 290 15 290 15 290 15Turmeric 258 136 258 136 2658 2536Chilli 273 183 273 183 2133 2043Corriander 0 0 62 62
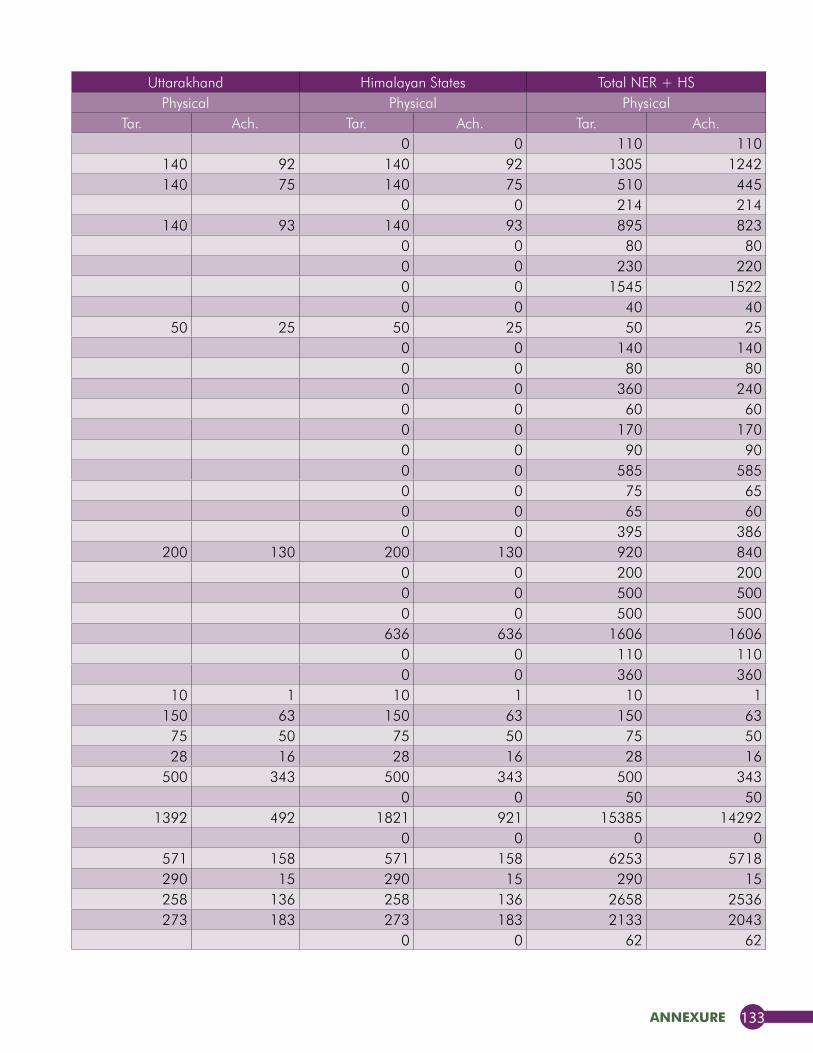
annexure 133
Component Himachal Pradesh Jammu & Kashmir Uttarakhand Himalayan States Total NER + HSPhysical Physical Physical Physical Physical
Tar. Ach. Tar. Ach. Tar. Ach. Tar. Ach. Tar. Ach.Brocolli 0 0 110 110Cabbage 140 92 140 92 1305 1242Capsicum 140 75 140 75 510 445Carrot 0 0 214 214cauliflower 140 93 140 93 895 823Chilli 0 0 80 80Cowpea 0 0 230 220Cole crop/tuber root crop/brinjal, etc. (hybrid) 0 0 1545 1522Cucumber 0 0 40 40European vegetables 50 25 50 25 50 25Frenchbean (Dwarf) 0 0 140 140Knolkhol 0 0 80 80Lady Finger (Bhindi) 0 0 360 240Letuce 0 0 60 60Okra 0 0 170 170Pea 0 0 90 90Potato 0 0 585 585Pointed Gourd 0 0 75 65Spine Gourd 0 0 65 60Tomato/ coloured capsicum (hybrid) 0 0 395 386Tomato 200 130 200 130 920 840Water Melon 0 0 200 200Winter crops 0 0 500 500Summer crops 0 0 500 500Open Pollinated 463 463 173 173 636 636 1606 1606Bitter gourd 0 0 110 110Chayote 0 0 360 360Cucubits 10 1 10 1 10 1French Bean 150 63 150 63 150 63Lady Finger 75 50 75 50 75 50Local / leafy vegetables 28 16 28 16 28 16Pea 500 343 500 343 500 343Sweet gourd 0 0 50 50
C. Spices 397 397 32 32 1392 492 1821 921 15385 14292Rhizomatic spices 0 0 0 0Ginger/Turmeric 571 158 571 158 6253 5718Garlic 290 15 290 15 290 15Turmeric 258 136 258 136 2658 2536Chilli 273 183 273 183 2133 2043Corriander 0 0 62 62
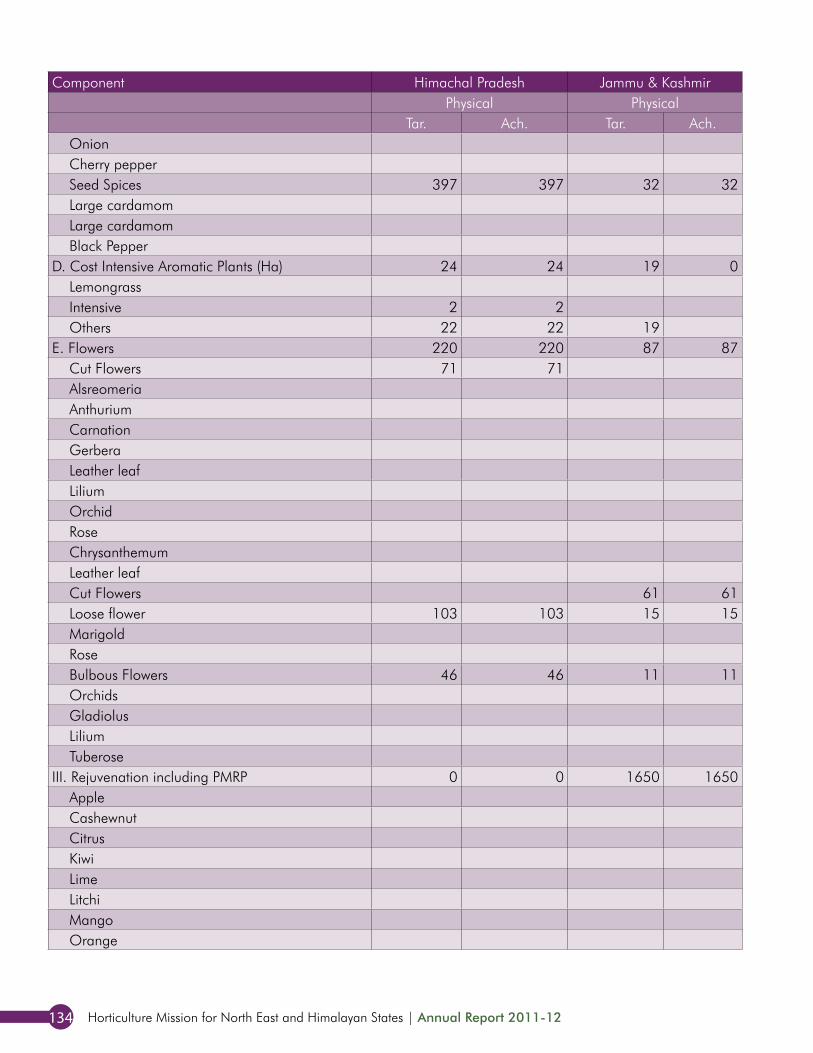
Horticulture Mission for North East and Himalayan States | Annual Report 2011-12134
Component Himachal Pradesh Jammu & Kashmir Uttarakhand Himalayan States Total NER + HSPhysical Physical Physical Physical Physical
Tar. Ach. Tar. Ach. Tar. Ach. Tar. Ach. Tar. Ach.Onion 0 0 400 400Cherry pepper 0 0 270 270Seed Spices 397 397 32 32 429 429 429 429Large cardamom 0 0 1150 1139Large cardamom 0 0 915 915Black Pepper 0 0 825 765
D. Cost Intensive Aromatic Plants (Ha) 24 24 19 0 0 0 43 24 193 174Lemongrass 0 0 150 150Intensive 2 2 2 2 2 2Others 22 22 19 41 22 41 22
E. Flowers 220 220 87 87 361 156 668 463 4017 3502Cut Flowers 71 71 71 71 511 511Alsreomeria 0 0 250 250Anthurium 0 0 417 410Carnation 0 0 192 192Gerbera 30 3 30 3 418 264Leather leaf 0 0 200 200Lilium 0 0 275 275Orchid 0 0 265 265Rose 28 32 28 32 248 251Chrysanthemum 0 0 30 28Leather leaf 0 0 80 80Cut Flowers 61 61 61 61 61 61Loose flower 103 103 15 15 118 118 378 207Marigold 176 20 176 20 191 35Rose 0 0 79 79Bulbous Flowers 46 46 11 11 57 57 202 202Orchids 1 1 0 26 23Gladiolus 121 96 121 96 136 111Lilium 5 5 5 5 35 35Tuberose 0 0 23 23
III. Rejuvenation including PMRP 0 0 1650 1650 389 1280 2039 2930 11743 11483Apple 144 451 144 451 444 745Cashewnut 0 0 140 140Citrus 45 143 45 143 745 843Kiwi 0 0 350 348Lime 0 0 250 250Litchi 50 124 50 124 50 124Mango 116 526 116 526 116 526Orange 0 0 5972 4829
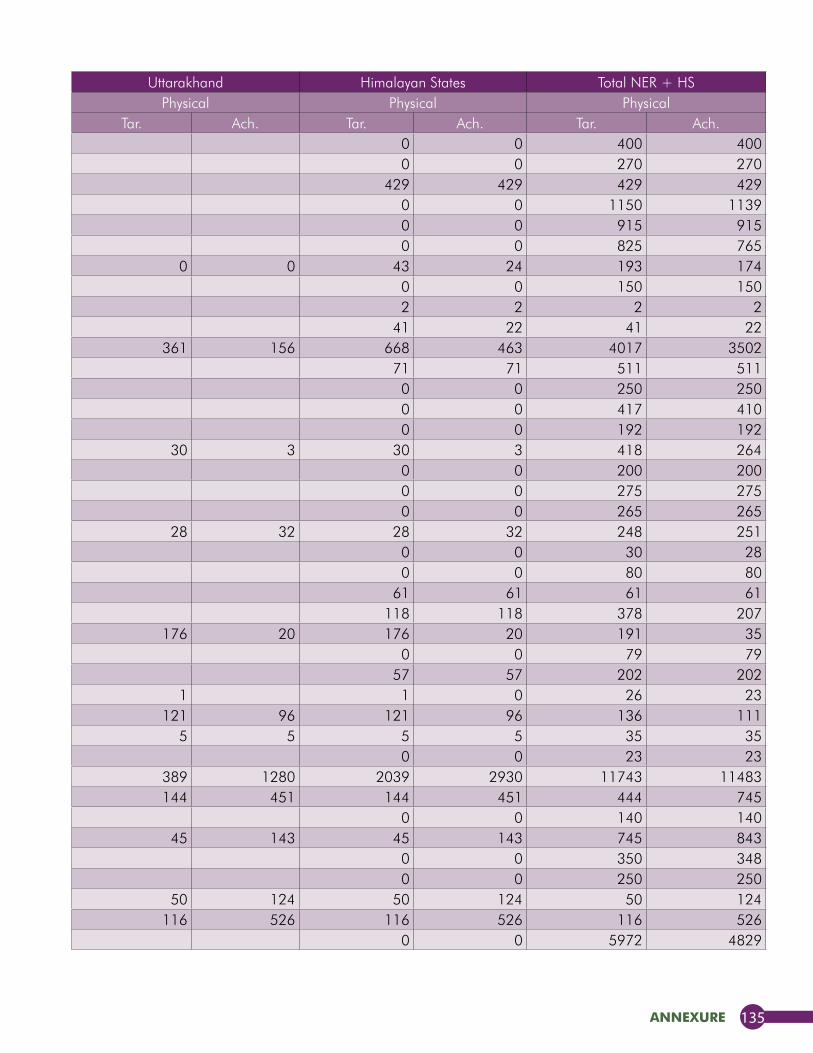
annexure 135
Component Himachal Pradesh Jammu & Kashmir Uttarakhand Himalayan States Total NER + HSPhysical Physical Physical Physical Physical
Tar. Ach. Tar. Ach. Tar. Ach. Tar. Ach. Tar. Ach.Onion 0 0 400 400Cherry pepper 0 0 270 270Seed Spices 397 397 32 32 429 429 429 429Large cardamom 0 0 1150 1139Large cardamom 0 0 915 915Black Pepper 0 0 825 765
D. Cost Intensive Aromatic Plants (Ha) 24 24 19 0 0 0 43 24 193 174Lemongrass 0 0 150 150Intensive 2 2 2 2 2 2Others 22 22 19 41 22 41 22
E. Flowers 220 220 87 87 361 156 668 463 4017 3502Cut Flowers 71 71 71 71 511 511Alsreomeria 0 0 250 250Anthurium 0 0 417 410Carnation 0 0 192 192Gerbera 30 3 30 3 418 264Leather leaf 0 0 200 200Lilium 0 0 275 275Orchid 0 0 265 265Rose 28 32 28 32 248 251Chrysanthemum 0 0 30 28Leather leaf 0 0 80 80Cut Flowers 61 61 61 61 61 61Loose flower 103 103 15 15 118 118 378 207Marigold 176 20 176 20 191 35Rose 0 0 79 79Bulbous Flowers 46 46 11 11 57 57 202 202Orchids 1 1 0 26 23Gladiolus 121 96 121 96 136 111Lilium 5 5 5 5 35 35Tuberose 0 0 23 23
III. Rejuvenation including PMRP 0 0 1650 1650 389 1280 2039 2930 11743 11483Apple 144 451 144 451 444 745Cashewnut 0 0 140 140Citrus 45 143 45 143 745 843Kiwi 0 0 350 348Lime 0 0 250 250Litchi 50 124 50 124 50 124Mango 116 526 116 526 116 526Orange 0 0 5972 4829
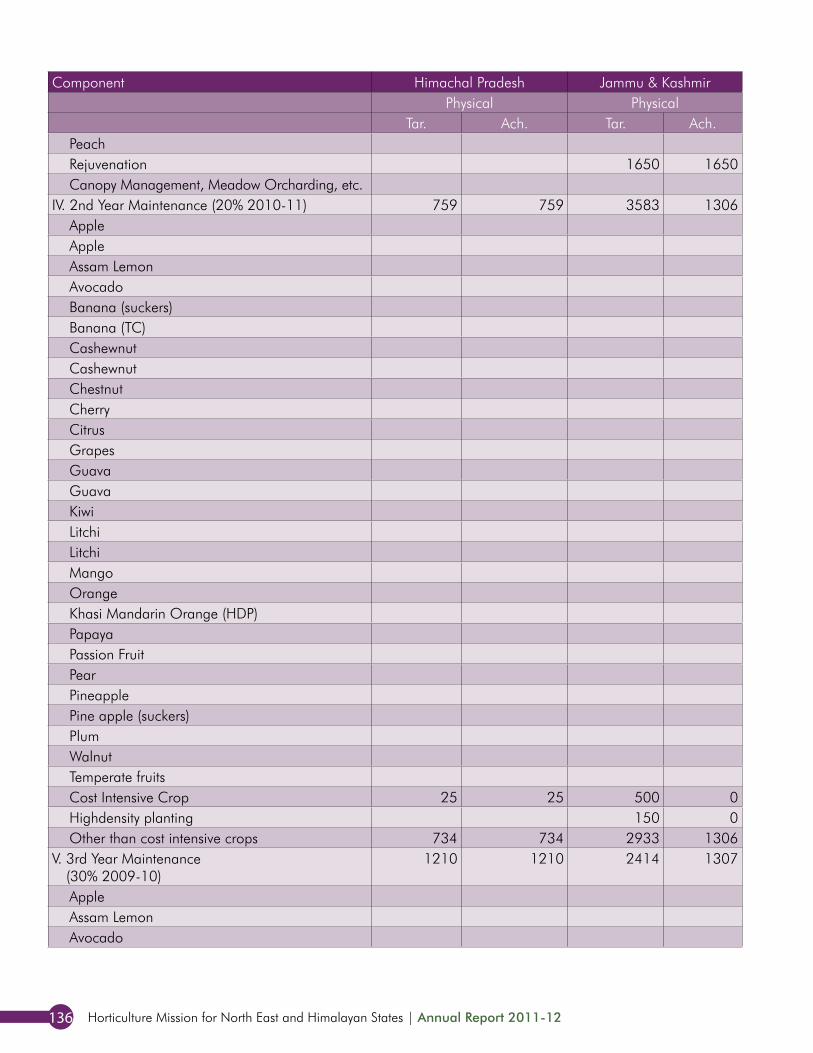
Horticulture Mission for North East and Himalayan States | Annual Report 2011-12136
Component Himachal Pradesh Jammu & Kashmir Uttarakhand Himalayan States Total NER + HSPhysical Physical Physical Physical Physical
Tar. Ach. Tar. Ach. Tar. Ach. Tar. Ach. Tar. Ach.Peach 34 36 34 36 34 36Rejuvenation 1650 1650 1650 1650 3400 3400Canopy Management, Meadow Orcharding, etc. 0 0 242 242
IV. 2nd Year Maintenance (20% 2010-11) 759 759 3583 1306 644 588 4986 2653 24358 21731Apple 0 0 150 150Apple 0 0 215 215Assam Lemon 0 0 1176 1176Avocado 0 0 25 25Banana (suckers) 0 0 1778 1778Banana (TC) 0 0 749 749Cashewnut 0 0 744 744Cashewnut 0 0 163 163Chestnut 0 0 45 45Cherry 0 0 27 27Citrus 0 0 1375 1375Grapes 0 0 210 210Guava 0 0 350 350Guava 0 0 180 180Kiwi 0 0 415 415Litchi 0 0 375 375Litchi 0 0 188 188Mango 0 0 145 145Orange 0 0 3900 3900Khasi Mandarin Orange (HDP) 0 0 1522 1522Papaya 0 0 185 185Passion Fruit 0 0 820 820Pear 0 0 85 85Pineapple 0 0 1750 1750Pine apple (suckers) 0 0 1151 1151Plum 0 0 90 90Walnut 0 0 45 45Temperate fruits 0 0 120 120Cost Intensive Crop 25 25 500 0 644 588 1169 613 2563 1713Highdensity planting 150 0 150 0 150 0Other than cost intensive crops 734 734 2933 1306 3667 2040 3667 2040
V. 3rd Year Maintenance (30% 2009-10)
1210 1210 2414 1307 341 190 3965 2707 31768 30010
Apple 0 0 643 643Assam Lemon 0 0 270 270Avocado 0 0 150 150
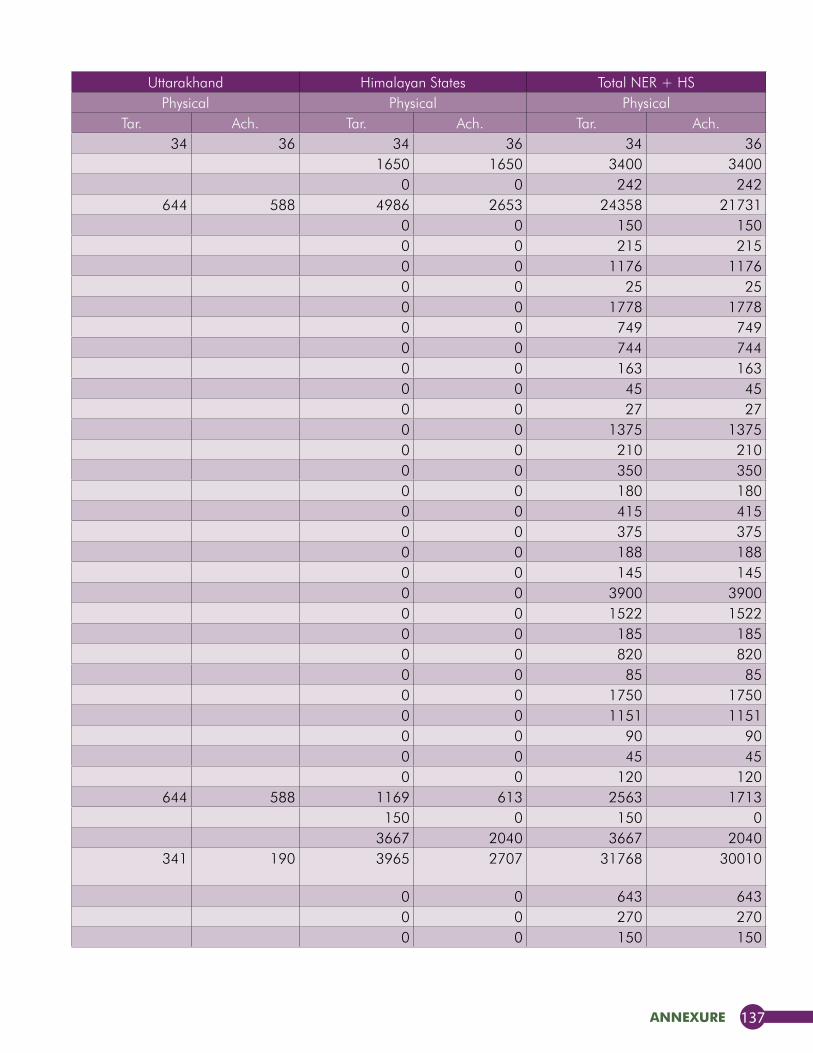
annexure 137
Component Himachal Pradesh Jammu & Kashmir Uttarakhand Himalayan States Total NER + HSPhysical Physical Physical Physical Physical
Tar. Ach. Tar. Ach. Tar. Ach. Tar. Ach. Tar. Ach.Peach 34 36 34 36 34 36Rejuvenation 1650 1650 1650 1650 3400 3400Canopy Management, Meadow Orcharding, etc. 0 0 242 242
IV. 2nd Year Maintenance (20% 2010-11) 759 759 3583 1306 644 588 4986 2653 24358 21731Apple 0 0 150 150Apple 0 0 215 215Assam Lemon 0 0 1176 1176Avocado 0 0 25 25Banana (suckers) 0 0 1778 1778Banana (TC) 0 0 749 749Cashewnut 0 0 744 744Cashewnut 0 0 163 163Chestnut 0 0 45 45Cherry 0 0 27 27Citrus 0 0 1375 1375Grapes 0 0 210 210Guava 0 0 350 350Guava 0 0 180 180Kiwi 0 0 415 415Litchi 0 0 375 375Litchi 0 0 188 188Mango 0 0 145 145Orange 0 0 3900 3900Khasi Mandarin Orange (HDP) 0 0 1522 1522Papaya 0 0 185 185Passion Fruit 0 0 820 820Pear 0 0 85 85Pineapple 0 0 1750 1750Pine apple (suckers) 0 0 1151 1151Plum 0 0 90 90Walnut 0 0 45 45Temperate fruits 0 0 120 120Cost Intensive Crop 25 25 500 0 644 588 1169 613 2563 1713Highdensity planting 150 0 150 0 150 0Other than cost intensive crops 734 734 2933 1306 3667 2040 3667 2040
V. 3rd Year Maintenance (30% 2009-10)
1210 1210 2414 1307 341 190 3965 2707 31768 30010
Apple 0 0 643 643Assam Lemon 0 0 270 270Avocado 0 0 150 150
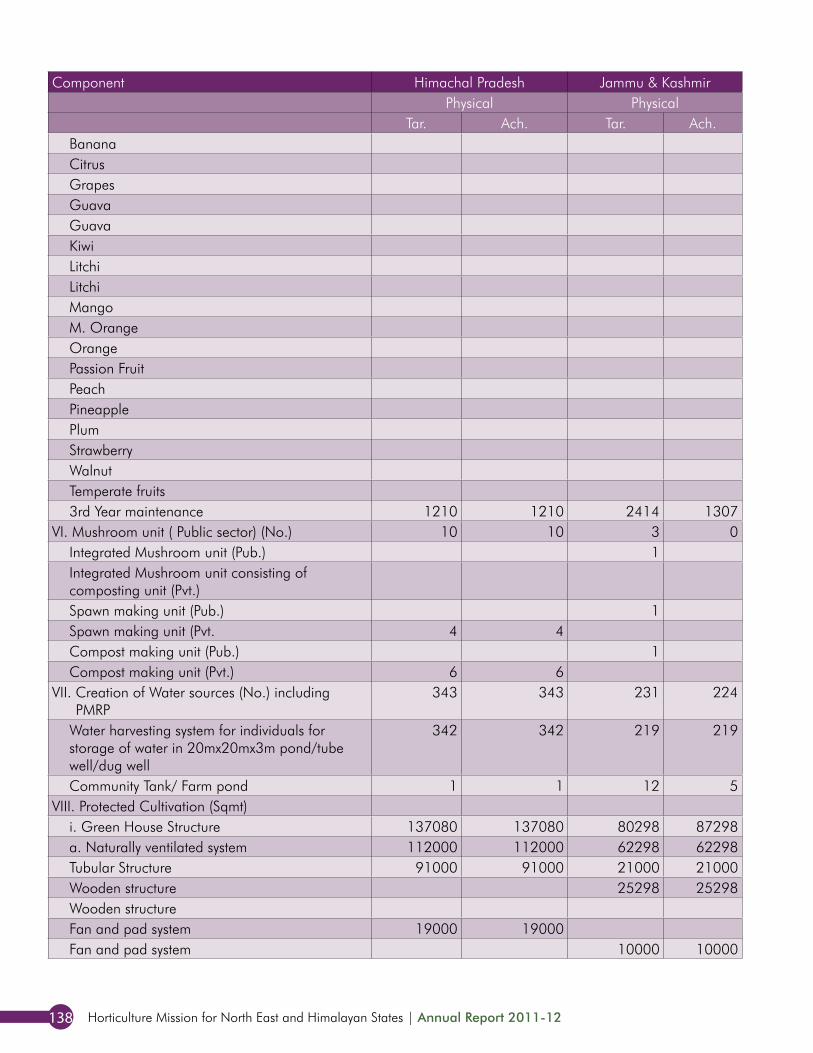
Horticulture Mission for North East and Himalayan States | Annual Report 2011-12138
Component Himachal Pradesh Jammu & Kashmir Uttarakhand Himalayan States Total NER + HSPhysical Physical Physical Physical Physical
Tar. Ach. Tar. Ach. Tar. Ach. Tar. Ach. Tar. Ach.Banana 0 0 4100 4100Citrus 0 0 4300 4300Grapes 0 0 500 0Guava 0 0 100 100Guava 0 0 100 100Kiwi 0 0 1087 1087Litchi 0 0 390 390Litchi 0 0 160 160Mango 0 0 300 300M. Orange 0 0 7590 7590Orange 0 0 565 565Passion Fruit 0 0 1400 1400Peach 0 0 50 50Pineapple 0 0 2922 2922Plum 0 0 265 265Strawberry 0 0 1080 1080Walnut 0 0 121 121Temperate fruits 0 0 180 1803rd Year maintenance 1210 1210 2414 1307 341 190 3965 2707 5495 4237
VI. Mushroom unit ( Public sector) (No.) 10 10 3 0 2 0 15 10 23 18Integrated Mushroom unit (Pub.) 1 1 0 3 2Integrated Mushroom unit consisting of composting unit (Pvt.)
1 1 0 1 0
Spawn making unit (Pub.) 1 1 0 4 3Spawn making unit (Pvt. 4 4 1 5 4 5 4Compost making unit (Pub.) 1 1 0 4 3Compost making unit (Pvt.) 6 6 6 6 6 6
VII. Creation of Water sources (No.) including PMRP
343 343 231 224 294 307 868 874 2807 2760
Water harvesting system for individuals for storage of water in 20mx20mx3m pond/tube well/dug well
342 342 219 219 294 307 855 868 2772 2732
Community Tank/ Farm pond 1 1 12 5 13 6 35 28VIII. Protected Cultivation (Sqmt)
i. Green House Structure 137080 137080 80298 87298 52400 41012 269778 265390 1249133 952258a. Naturally ventilated system 112000 112000 62298 62298 52100 39489 226398 213787 965853 716655Tubular Structure 91000 91000 21000 21000 52100 39489 164100 151489 761600 602557Wooden structure 25298 25298 25298 25298 41298 40098Wooden structure 0 0 29000 0Fan and pad system 19000 19000 19000 19000 28000 28000Fan and pad system 10000 10000 10000 10000 25200 10000

annexure 139
Component Himachal Pradesh Jammu & Kashmir Uttarakhand Himalayan States Total NER + HSPhysical Physical Physical Physical Physical
Tar. Ach. Tar. Ach. Tar. Ach. Tar. Ach. Tar. Ach.Banana 0 0 4100 4100Citrus 0 0 4300 4300Grapes 0 0 500 0Guava 0 0 100 100Guava 0 0 100 100Kiwi 0 0 1087 1087Litchi 0 0 390 390Litchi 0 0 160 160Mango 0 0 300 300M. Orange 0 0 7590 7590Orange 0 0 565 565Passion Fruit 0 0 1400 1400Peach 0 0 50 50Pineapple 0 0 2922 2922Plum 0 0 265 265Strawberry 0 0 1080 1080Walnut 0 0 121 121Temperate fruits 0 0 180 1803rd Year maintenance 1210 1210 2414 1307 341 190 3965 2707 5495 4237
VI. Mushroom unit ( Public sector) (No.) 10 10 3 0 2 0 15 10 23 18Integrated Mushroom unit (Pub.) 1 1 0 3 2Integrated Mushroom unit consisting of composting unit (Pvt.)
1 1 0 1 0
Spawn making unit (Pub.) 1 1 0 4 3Spawn making unit (Pvt. 4 4 1 5 4 5 4Compost making unit (Pub.) 1 1 0 4 3Compost making unit (Pvt.) 6 6 6 6 6 6
VII. Creation of Water sources (No.) including PMRP
343 343 231 224 294 307 868 874 2807 2760
Water harvesting system for individuals for storage of water in 20mx20mx3m pond/tube well/dug well
342 342 219 219 294 307 855 868 2772 2732
Community Tank/ Farm pond 1 1 12 5 13 6 35 28VIII. Protected Cultivation (Sqmt)
i. Green House Structure 137080 137080 80298 87298 52400 41012 269778 265390 1249133 952258a. Naturally ventilated system 112000 112000 62298 62298 52100 39489 226398 213787 965853 716655Tubular Structure 91000 91000 21000 21000 52100 39489 164100 151489 761600 602557Wooden structure 25298 25298 25298 25298 41298 40098Wooden structure 0 0 29000 0Fan and pad system 19000 19000 19000 19000 28000 28000Fan and pad system 10000 10000 10000 10000 25200 10000
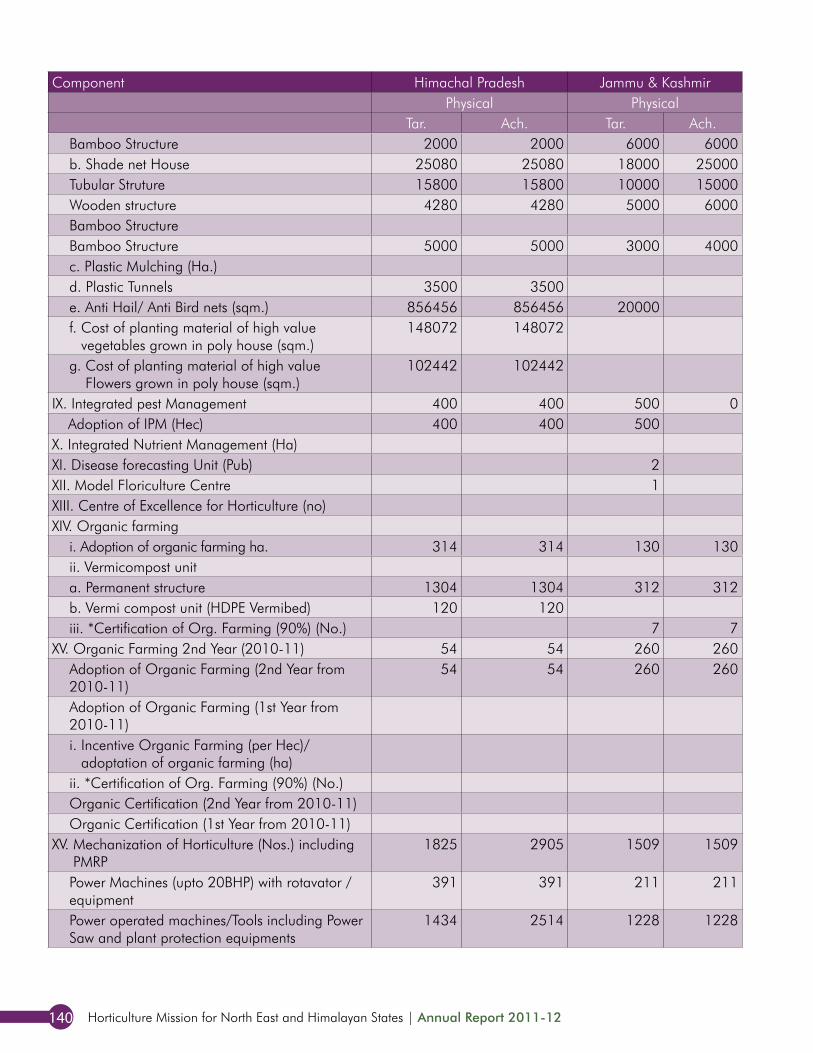
Horticulture Mission for North East and Himalayan States | Annual Report 2011-12140
Component Himachal Pradesh Jammu & Kashmir Uttarakhand Himalayan States Total NER + HSPhysical Physical Physical Physical Physical
Tar. Ach. Tar. Ach. Tar. Ach. Tar. Ach. Tar. Ach.Bamboo Structure 2000 2000 6000 6000 8000 8000 80755 36000b. Shade net House 25080 25080 18000 25000 300 1523 43380 51603 283280 235603Tubular Struture 15800 15800 10000 15000 300 1523 26100 32323 223100 188323Wooden structure 4280 4280 5000 6000 9280 10280 12280 13280Bamboo Structure 0 0 0 0Bamboo Structure 5000 5000 3000 4000 8000 9000 47900 34000c. Plastic Mulching (Ha.) 465 367 465 367 1315 1142d. Plastic Tunnels 3500 3500 3500 3500 58000 39500e. Anti Hail/ Anti Bird nets (sqm.) 856456 856456 20000 812240 73506 1688696 929962 1758696 999962f. Cost of planting material of high value
vegetables grown in poly house (sqm.)148072 148072 21520 1000 169592 149072 235892 208072
g. Cost of planting material of high value Flowers grown in poly house (sqm.)
102442 102442 6100 2000 108542 104442 208542 204442
IX. Integrated pest Management 400 400 500 0 120 191 1020 591 64079 63600Adoption of IPM (Hec) 400 400 500 120 191 1020 591 64079 63600
X. Integrated Nutrient Management (Ha) 0 0 8800 8800XI. Disease forecasting Unit (Pub) 2 2 0 9 7XII. Model Floriculture Centre 1 1 0 3 2XIII. Centre of Excellence for Horticulture (no) 0 0 1 1XIV. Organic farming
i. Adoption of organic farming ha. 314 314 130 130 294 507 738 951 6913 7113ii. Vermicompost unita. Permanent structure 1304 1304 312 312 608 504 2224 2120 2620 2516b. Vermi compost unit (HDPE Vermibed) 120 120 120 120 3692 3692iii. *Certification of Org. Farming (90%) (No.) 7 7 7 7 103 101
XV. Organic Farming 2nd Year (2010-11) 54 54 260 260 0 0 314 314 8550 8550Adoption of Organic Farming (2nd Year from 2010-11)
54 54 260 260 314 314 6414 6414
Adoption of Organic Farming (1st Year from 2010-11)
0 0 2000 2000
i. Incentive Organic Farming (per Hec)/ adoptation of organic farming (ha)
0 0 120 120
ii. *Certification of Org. Farming (90%) (No.) 0 0 6 6Organic Certification (2nd Year from 2010-11) 0 0 5 5Organic Certification (1st Year from 2010-11) 0 0 5 5
XV. Mechanization of Horticulture (Nos.) including PMRP
1825 2905 1509 1509 103 398 3437 4812 8364 9083
Power Machines (upto 20BHP) with rotavator / equipment
391 391 211 211 2 80 604 682 854 932
Power operated machines/Tools including Power Saw and plant protection equipments
1434 2514 1228 1228 43 297 2705 4039 5140 5818
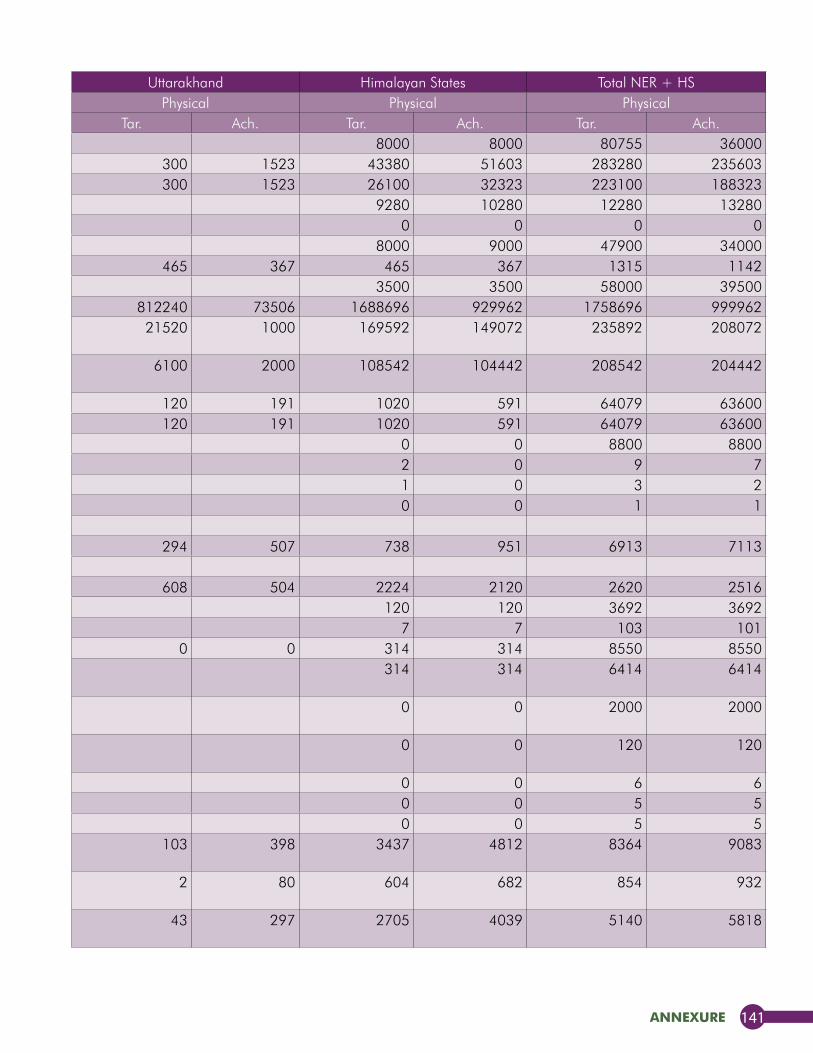
annexure 141
Component Himachal Pradesh Jammu & Kashmir Uttarakhand Himalayan States Total NER + HSPhysical Physical Physical Physical Physical
Tar. Ach. Tar. Ach. Tar. Ach. Tar. Ach. Tar. Ach.Bamboo Structure 2000 2000 6000 6000 8000 8000 80755 36000b. Shade net House 25080 25080 18000 25000 300 1523 43380 51603 283280 235603Tubular Struture 15800 15800 10000 15000 300 1523 26100 32323 223100 188323Wooden structure 4280 4280 5000 6000 9280 10280 12280 13280Bamboo Structure 0 0 0 0Bamboo Structure 5000 5000 3000 4000 8000 9000 47900 34000c. Plastic Mulching (Ha.) 465 367 465 367 1315 1142d. Plastic Tunnels 3500 3500 3500 3500 58000 39500e. Anti Hail/ Anti Bird nets (sqm.) 856456 856456 20000 812240 73506 1688696 929962 1758696 999962f. Cost of planting material of high value
vegetables grown in poly house (sqm.)148072 148072 21520 1000 169592 149072 235892 208072
g. Cost of planting material of high value Flowers grown in poly house (sqm.)
102442 102442 6100 2000 108542 104442 208542 204442
IX. Integrated pest Management 400 400 500 0 120 191 1020 591 64079 63600Adoption of IPM (Hec) 400 400 500 120 191 1020 591 64079 63600
X. Integrated Nutrient Management (Ha) 0 0 8800 8800XI. Disease forecasting Unit (Pub) 2 2 0 9 7XII. Model Floriculture Centre 1 1 0 3 2XIII. Centre of Excellence for Horticulture (no) 0 0 1 1XIV. Organic farming
i. Adoption of organic farming ha. 314 314 130 130 294 507 738 951 6913 7113ii. Vermicompost unita. Permanent structure 1304 1304 312 312 608 504 2224 2120 2620 2516b. Vermi compost unit (HDPE Vermibed) 120 120 120 120 3692 3692iii. *Certification of Org. Farming (90%) (No.) 7 7 7 7 103 101
XV. Organic Farming 2nd Year (2010-11) 54 54 260 260 0 0 314 314 8550 8550Adoption of Organic Farming (2nd Year from 2010-11)
54 54 260 260 314 314 6414 6414
Adoption of Organic Farming (1st Year from 2010-11)
0 0 2000 2000
i. Incentive Organic Farming (per Hec)/ adoptation of organic farming (ha)
0 0 120 120
ii. *Certification of Org. Farming (90%) (No.) 0 0 6 6Organic Certification (2nd Year from 2010-11) 0 0 5 5Organic Certification (1st Year from 2010-11) 0 0 5 5
XV. Mechanization of Horticulture (Nos.) including PMRP
1825 2905 1509 1509 103 398 3437 4812 8364 9083
Power Machines (upto 20BHP) with rotavator / equipment
391 391 211 211 2 80 604 682 854 932
Power operated machines/Tools including Power Saw and plant protection equipments
1434 2514 1228 1228 43 297 2705 4039 5140 5818
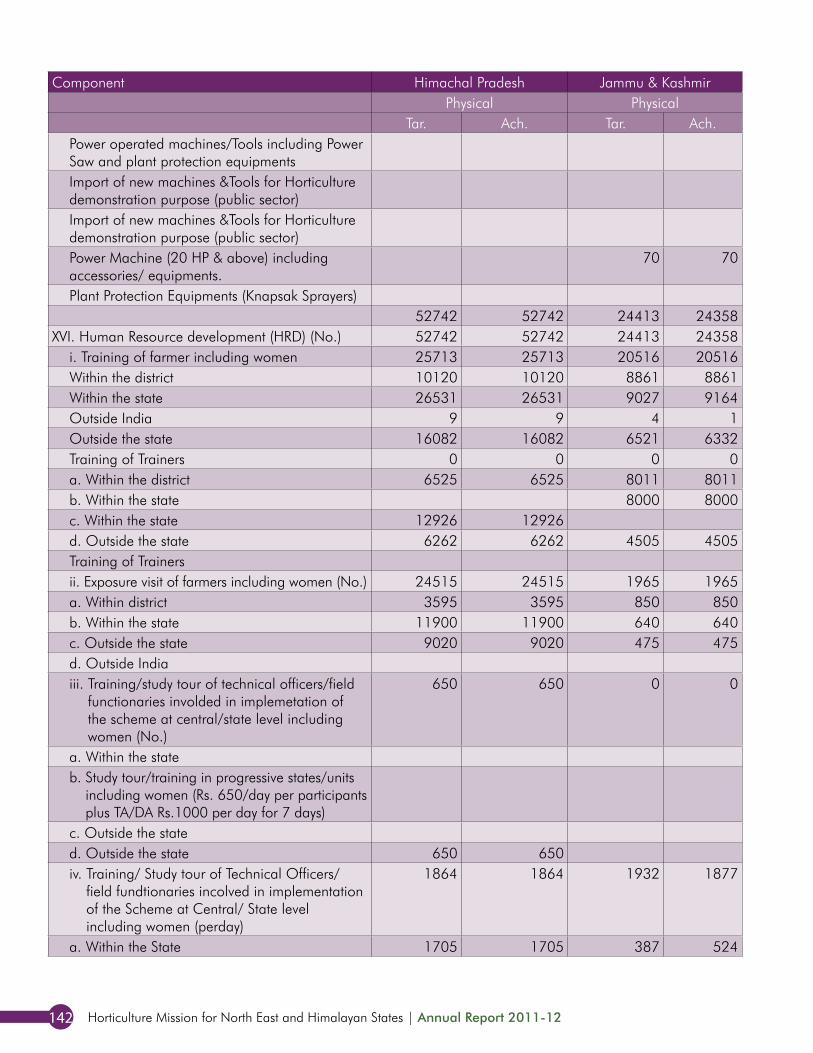
Horticulture Mission for North East and Himalayan States | Annual Report 2011-12142
Component Himachal Pradesh Jammu & Kashmir Uttarakhand Himalayan States Total NER + HSPhysical Physical Physical Physical Physical
Tar. Ach. Tar. Ach. Tar. Ach. Tar. Ach. Tar. Ach.Power operated machines/Tools including Power Saw and plant protection equipments
0 0 170 170
Import of new machines &Tools for Horticulture demonstration purpose (public sector)
0 0 1 1
Import of new machines &Tools for Horticulture demonstration purpose (public sector)
0 0 1 1
Power Machine (20 HP & above) including accessories/ equipments.
70 70 58 21 128 91 253 216
Plant Protection Equipments (Knapsak Sprayers) 1945 194552742 52742 24413 24358 3178 3350 80333 80450 193130 187699
XVI. Human Resource development (HRD) (No.) 52742 52742 24413 24358 3178 3350 80333 80450 193130 187699i. Training of farmer including women 25713 25713 20516 20516 1921 2281 48150 48510 93539 88598Within the district 10120 10120 8861 8861 2015 1453 20996 20434 75268 70536Within the state 26531 26531 9027 9164 1010 1157 36568 36852 74004 73201Outside India 9 9 4 1 2 0 15 10 22 17Outside the state 16082 16082 6521 6332 151 691 22754 23105 43836 43896Training of Trainers 0 0 0 0 0 49 0 49 0 49a. Within the district 6525 6525 8011 8011 1435 1193 15971 15729 45151 40791b. Within the state 8000 8000 410 660 8410 8660 16778 16007c. Within the state 12926 12926 12926 12926 14926 14926d. Outside the state 6262 6262 4505 4505 76 379 10843 11146 16684 16825Training of Trainers 49 0 49 0 49ii. Exposure visit of farmers including women (No.) 24515 24515 1965 1965 1255 724 27735 27204 79360 78695a. Within district 3595 3595 850 850 580 260 5025 4705 30117 29745b. Within the state 11900 11900 640 640 600 152 13140 12692 32232 31731c. Outside the state 9020 9020 475 475 75 312 9570 9807 17011 17219d. Outside Indiaiii. Training/study tour of technical officers/field
functionaries involded in implemetation of the scheme at central/state level including women (No.)
650 650 0 0 0 0 650 650 3226 3213
a. Within the state 0 0 80 71b. Study tour/training in progressive states/units
including women (Rs. 650/day per participants plus TA/DA Rs.1000 per day for 7 days)
0 0 96 92
c. Outside the state 0 0 1800 1800d. Outside the state 650 650 650 650 1250 1250iv. Training/ Study tour of Technical Officers/
field fundtionaries incolved in implementation of the Scheme at Central/ State level including women (perday)
1864 1864 1932 1877 2 345 3798 4086 17005 17193
a. Within the State 1705 1705 387 524 345 2092 2574 9892 10374
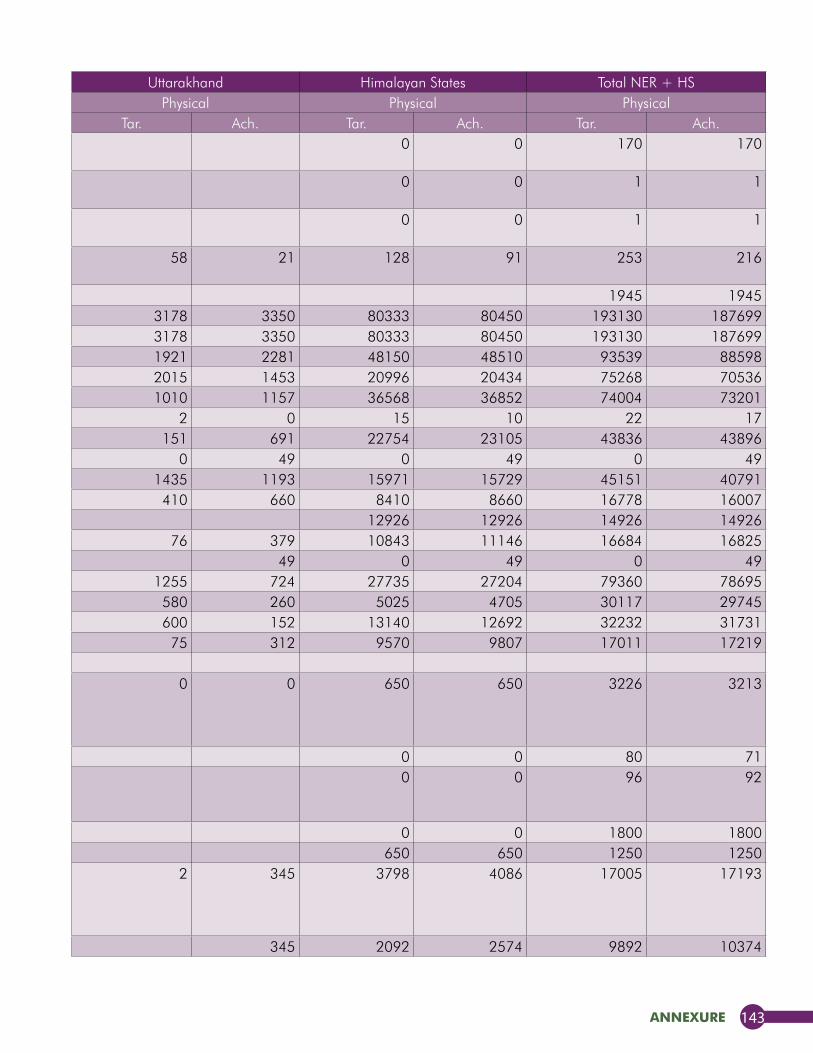
annexure 143
Component Himachal Pradesh Jammu & Kashmir Uttarakhand Himalayan States Total NER + HSPhysical Physical Physical Physical Physical
Tar. Ach. Tar. Ach. Tar. Ach. Tar. Ach. Tar. Ach.Power operated machines/Tools including Power Saw and plant protection equipments
0 0 170 170
Import of new machines &Tools for Horticulture demonstration purpose (public sector)
0 0 1 1
Import of new machines &Tools for Horticulture demonstration purpose (public sector)
0 0 1 1
Power Machine (20 HP & above) including accessories/ equipments.
70 70 58 21 128 91 253 216
Plant Protection Equipments (Knapsak Sprayers) 1945 194552742 52742 24413 24358 3178 3350 80333 80450 193130 187699
XVI. Human Resource development (HRD) (No.) 52742 52742 24413 24358 3178 3350 80333 80450 193130 187699i. Training of farmer including women 25713 25713 20516 20516 1921 2281 48150 48510 93539 88598Within the district 10120 10120 8861 8861 2015 1453 20996 20434 75268 70536Within the state 26531 26531 9027 9164 1010 1157 36568 36852 74004 73201Outside India 9 9 4 1 2 0 15 10 22 17Outside the state 16082 16082 6521 6332 151 691 22754 23105 43836 43896Training of Trainers 0 0 0 0 0 49 0 49 0 49a. Within the district 6525 6525 8011 8011 1435 1193 15971 15729 45151 40791b. Within the state 8000 8000 410 660 8410 8660 16778 16007c. Within the state 12926 12926 12926 12926 14926 14926d. Outside the state 6262 6262 4505 4505 76 379 10843 11146 16684 16825Training of Trainers 49 0 49 0 49ii. Exposure visit of farmers including women (No.) 24515 24515 1965 1965 1255 724 27735 27204 79360 78695a. Within district 3595 3595 850 850 580 260 5025 4705 30117 29745b. Within the state 11900 11900 640 640 600 152 13140 12692 32232 31731c. Outside the state 9020 9020 475 475 75 312 9570 9807 17011 17219d. Outside Indiaiii. Training/study tour of technical officers/field
functionaries involded in implemetation of the scheme at central/state level including women (No.)
650 650 0 0 0 0 650 650 3226 3213
a. Within the state 0 0 80 71b. Study tour/training in progressive states/units
including women (Rs. 650/day per participants plus TA/DA Rs.1000 per day for 7 days)
0 0 96 92
c. Outside the state 0 0 1800 1800d. Outside the state 650 650 650 650 1250 1250iv. Training/ Study tour of Technical Officers/
field fundtionaries incolved in implementation of the Scheme at Central/ State level including women (perday)
1864 1864 1932 1877 2 345 3798 4086 17005 17193
a. Within the State 1705 1705 387 524 345 2092 2574 9892 10374
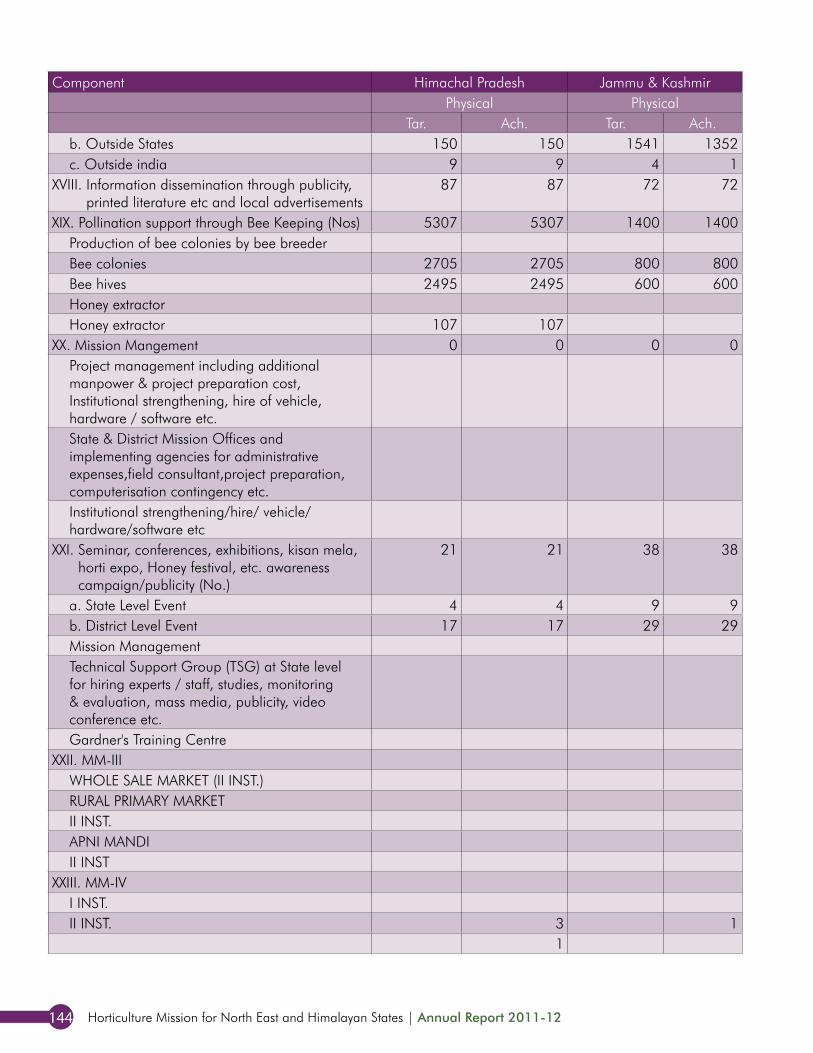
Horticulture Mission for North East and Himalayan States | Annual Report 2011-12144
Component Himachal Pradesh Jammu & Kashmir Uttarakhand Himalayan States Total NER + HSPhysical Physical Physical Physical Physical
Tar. Ach. Tar. Ach. Tar. Ach. Tar. Ach. Tar. Ach.b. Outside States 150 150 1541 1352 1691 1502 7091 6802c. Outside india 9 9 4 1 2 15 10 22 17
XVIII. Information dissemination through publicity, printed literature etc and local advertisements
87 87 72 72 216 33 375 192 599 416
XIX. Pollination support through Bee Keeping (Nos) 5307 5307 1400 1400 1405 1820 8112 8527 39535 39950Production of bee colonies by bee breeder 0 0 3 3Bee colonies 2705 2705 800 800 700 1115 4205 4620 17325 17740Bee hives 2495 2495 600 600 700 700 3795 3795 15615 15615Honey extractor 0 0 6000 6000Honey extractor 107 107 5 5 112 112 592 592
XX. Mission Mangement 0 0 0 0 0 0 0 0Project management including additional manpower & project preparation cost, Institutional strengthening, hire of vehicle, hardware / software etc.
0 0 0 0
State & District Mission Offices and implementing agencies for administrative expenses,field consultant,project preparation, computerisation contingency etc.
0 0 0 0
Institutional strengthening/hire/ vehicle/ hardware/software etc
0 0 0 0
XXI. Seminar, conferences, exhibitions, kisan mela, horti expo, Honey festival, etc. awareness campaign/publicity (No.)
21 21 38 38 14 11 73 70 140 136
a. State Level Event 4 4 9 9 10 8 23 21 42 40b. District Level Event 17 17 29 29 4 3 50 49 98 96Mission ManagementTechnical Support Group (TSG) at State level for hiring experts / staff, studies, monitoring & evaluation, mass media, publicity, video conference etc.Gardner's Training Centre
XXII. MM-IIIWHOLE SALE MARKET (II INST.)RURAL PRIMARY MARKET 1 0 1 1II INST.APNI MANDI 21II INST
XXIII. MM-IV 1I INST.II INST. 3 1 2 0 6 8
1 7 0 8 9
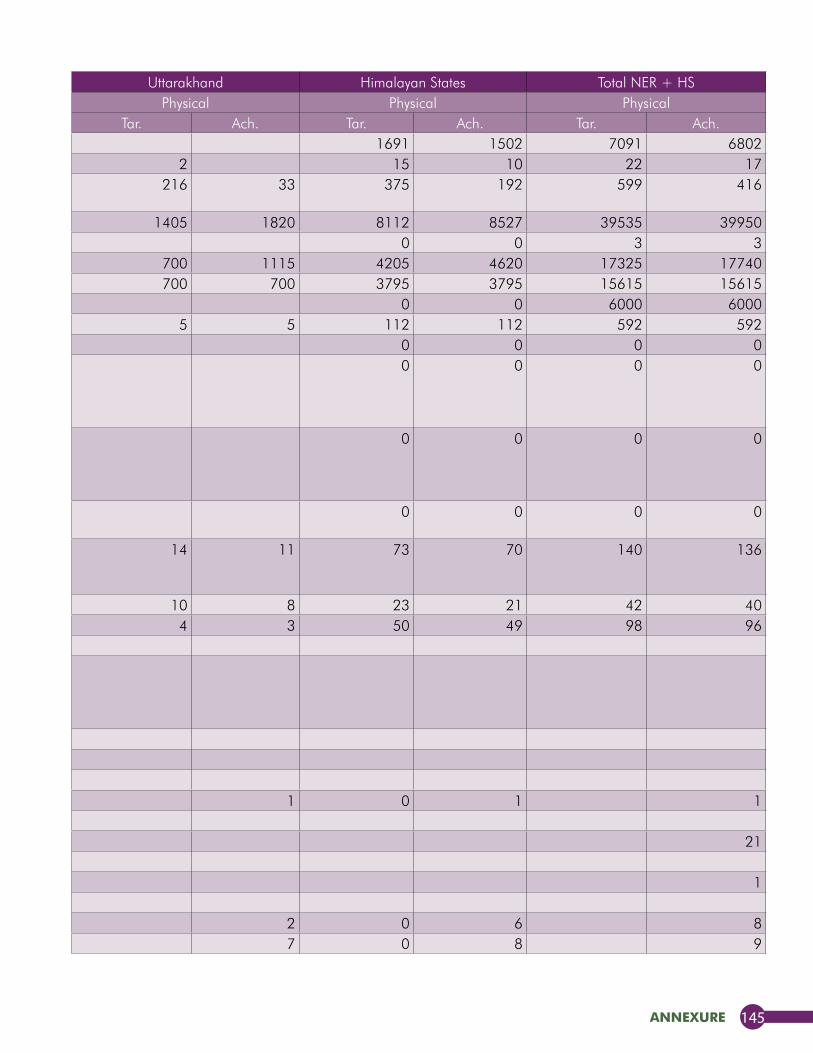
annexure 145
Component Himachal Pradesh Jammu & Kashmir Uttarakhand Himalayan States Total NER + HSPhysical Physical Physical Physical Physical
Tar. Ach. Tar. Ach. Tar. Ach. Tar. Ach. Tar. Ach.b. Outside States 150 150 1541 1352 1691 1502 7091 6802c. Outside india 9 9 4 1 2 15 10 22 17
XVIII. Information dissemination through publicity, printed literature etc and local advertisements
87 87 72 72 216 33 375 192 599 416
XIX. Pollination support through Bee Keeping (Nos) 5307 5307 1400 1400 1405 1820 8112 8527 39535 39950Production of bee colonies by bee breeder 0 0 3 3Bee colonies 2705 2705 800 800 700 1115 4205 4620 17325 17740Bee hives 2495 2495 600 600 700 700 3795 3795 15615 15615Honey extractor 0 0 6000 6000Honey extractor 107 107 5 5 112 112 592 592
XX. Mission Mangement 0 0 0 0 0 0 0 0Project management including additional manpower & project preparation cost, Institutional strengthening, hire of vehicle, hardware / software etc.
0 0 0 0
State & District Mission Offices and implementing agencies for administrative expenses,field consultant,project preparation, computerisation contingency etc.
0 0 0 0
Institutional strengthening/hire/ vehicle/ hardware/software etc
0 0 0 0
XXI. Seminar, conferences, exhibitions, kisan mela, horti expo, Honey festival, etc. awareness campaign/publicity (No.)
21 21 38 38 14 11 73 70 140 136
a. State Level Event 4 4 9 9 10 8 23 21 42 40b. District Level Event 17 17 29 29 4 3 50 49 98 96Mission ManagementTechnical Support Group (TSG) at State level for hiring experts / staff, studies, monitoring & evaluation, mass media, publicity, video conference etc.Gardner's Training Centre
XXII. MM-IIIWHOLE SALE MARKET (II INST.)RURAL PRIMARY MARKET 1 0 1 1II INST.APNI MANDI 21II INST
XXIII. MM-IV 1I INST.II INST. 3 1 2 0 6 8
1 7 0 8 9
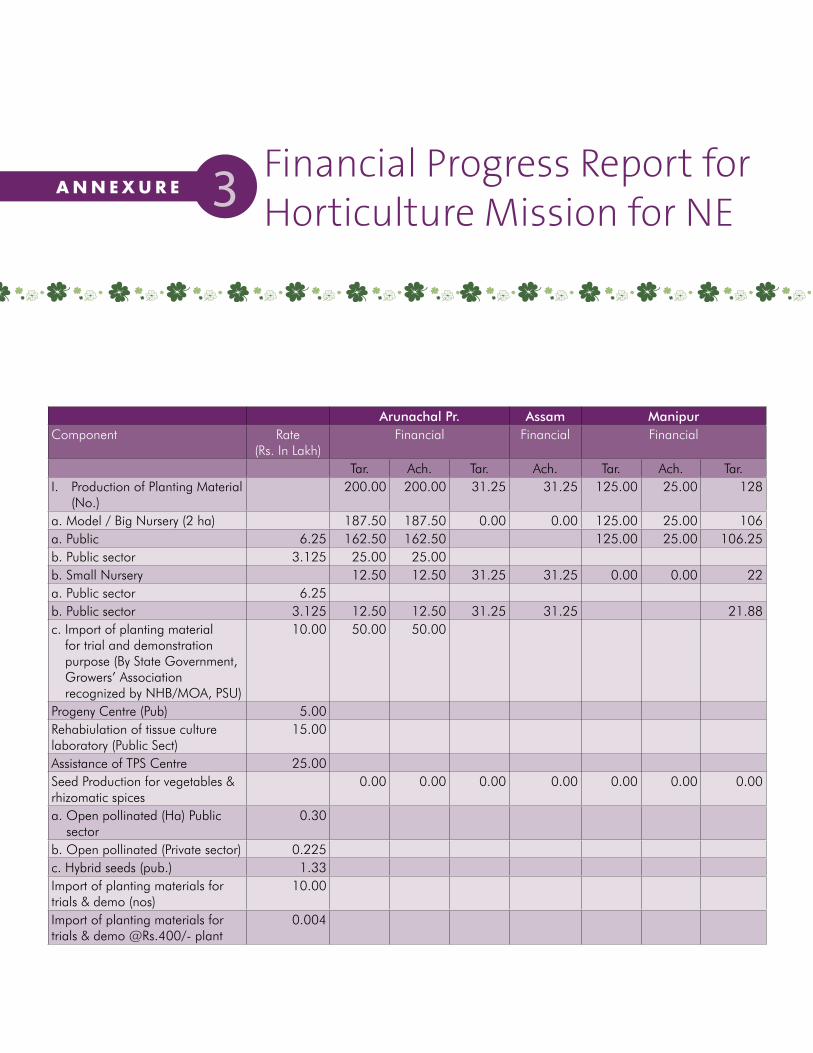
3A N N E x u R EFinancial Progress Report for the year 2011-12 under MM-II of Horticulture Mission for NE and Himalayan States
Arunachal Pr. Assam Manipur Meghalaya Mizoram Nagaland Sikkim Tripura North EastComponent Rate
(Rs. In Lakh)Financial Financial Financial Financial Financial Financial Financial Financial Financial
Tar. Ach. Tar. Ach. Tar. Ach. Tar. Ach. Tar. Ach. Tar. Ach. Tar. Ach. Tar. Ach. Tar. Ach.I. Production of Planting Material
(No.)200.00 200.00 31.25 31.25 125.00 25.00 128 128.13 43.75 43.75 81.25 81.25 43.75 41.75 256.25 256.25 909 807
a. Model / Big Nursery (2 ha) 187.50 187.50 0.00 0.00 125.00 25.00 106 106.25 0.00 0.00 0.00 0.00 6.25 6.25 100.00 100.00 525 425a. Public 6.25 162.50 162.50 125.00 25.00 106.25 106.25 0.00 6.25 6.25 75.00 75.00 475.00 375.00b. Public sector 3.125 25.00 25.00 25.00 25.00 50.00 50.00b. Small Nursery 12.50 12.50 31.25 31.25 0.00 0.00 22 21.88 43.75 43.75 81.25 81.25 37.50 35.50 156.25 156.25 384 382a. Public sector 6.25 18.75 18.75 50.00 50.00 25.00 25.00 93.75 93.75 187.50 187.50b. Public sector 3.125 12.50 12.50 31.25 31.25 21.88 21.88 25.00 25.00 31.25 31.25 12.50 10.50 62.50 62.50 196.88 194.88c. Import of planting material
for trial and demonstration purpose (By State Government, Growers’ Association recognized by NHB/MOA, PSU)
10.00 50.00 50.00 50.00 50.00
Progeny Centre (Pub) 5.00 0.00 0.00Rehabiulation of tissue culture laboratory (Public Sect)
15.00 15.00 15.00 15.00 15.00 30.00 30.00
Assistance of TPS Centre 25.00 25.00 25.00 25.00 25.00Seed Production for vegetables & rhizomatic spices
0.00 0.00 0.00 0.00 0.00 0.00 0.00 0.00 0.00 0.00 0.00 0.00 8.10 8.10 4 4 12 12
a. Open pollinated (Ha) Public sector
0.30 8.10 8.10 8.10 8.10
b. Open pollinated (Private sector) 0.225 3.83 3.84 3.83 3.84c. Hybrid seeds (pub.) 1.33 0.00 0.00Import of planting materials for trials & demo (nos)
10.00 40.00 39.85 10.00 10.00 50.00 49.85
Import of planting materials for trials & demo @Rs.400/- plant
0.004 0.00 0.00
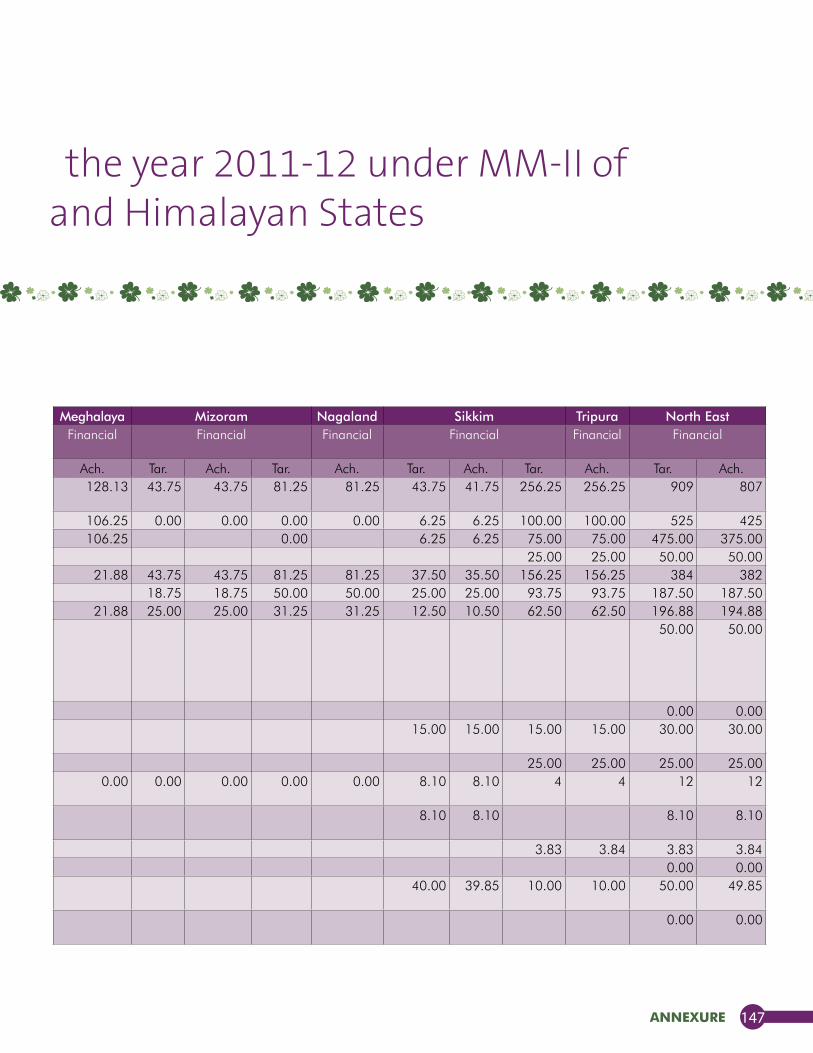
annexure 147
Financial Progress Report for the year 2011-12 under MM-II of Horticulture Mission for NE and Himalayan States
Arunachal Pr. Assam Manipur Meghalaya Mizoram Nagaland Sikkim Tripura North EastComponent Rate
(Rs. In Lakh)Financial Financial Financial Financial Financial Financial Financial Financial Financial
Tar. Ach. Tar. Ach. Tar. Ach. Tar. Ach. Tar. Ach. Tar. Ach. Tar. Ach. Tar. Ach. Tar. Ach.I. Production of Planting Material
(No.)200.00 200.00 31.25 31.25 125.00 25.00 128 128.13 43.75 43.75 81.25 81.25 43.75 41.75 256.25 256.25 909 807
a. Model / Big Nursery (2 ha) 187.50 187.50 0.00 0.00 125.00 25.00 106 106.25 0.00 0.00 0.00 0.00 6.25 6.25 100.00 100.00 525 425a. Public 6.25 162.50 162.50 125.00 25.00 106.25 106.25 0.00 6.25 6.25 75.00 75.00 475.00 375.00b. Public sector 3.125 25.00 25.00 25.00 25.00 50.00 50.00b. Small Nursery 12.50 12.50 31.25 31.25 0.00 0.00 22 21.88 43.75 43.75 81.25 81.25 37.50 35.50 156.25 156.25 384 382a. Public sector 6.25 18.75 18.75 50.00 50.00 25.00 25.00 93.75 93.75 187.50 187.50b. Public sector 3.125 12.50 12.50 31.25 31.25 21.88 21.88 25.00 25.00 31.25 31.25 12.50 10.50 62.50 62.50 196.88 194.88c. Import of planting material
for trial and demonstration purpose (By State Government, Growers’ Association recognized by NHB/MOA, PSU)
10.00 50.00 50.00 50.00 50.00
Progeny Centre (Pub) 5.00 0.00 0.00Rehabiulation of tissue culture laboratory (Public Sect)
15.00 15.00 15.00 15.00 15.00 30.00 30.00
Assistance of TPS Centre 25.00 25.00 25.00 25.00 25.00Seed Production for vegetables & rhizomatic spices
0.00 0.00 0.00 0.00 0.00 0.00 0.00 0.00 0.00 0.00 0.00 0.00 8.10 8.10 4 4 12 12
a. Open pollinated (Ha) Public sector
0.30 8.10 8.10 8.10 8.10
b. Open pollinated (Private sector) 0.225 3.83 3.84 3.83 3.84c. Hybrid seeds (pub.) 1.33 0.00 0.00Import of planting materials for trials & demo (nos)
10.00 40.00 39.85 10.00 10.00 50.00 49.85
Import of planting materials for trials & demo @Rs.400/- plant
0.004 0.00 0.00
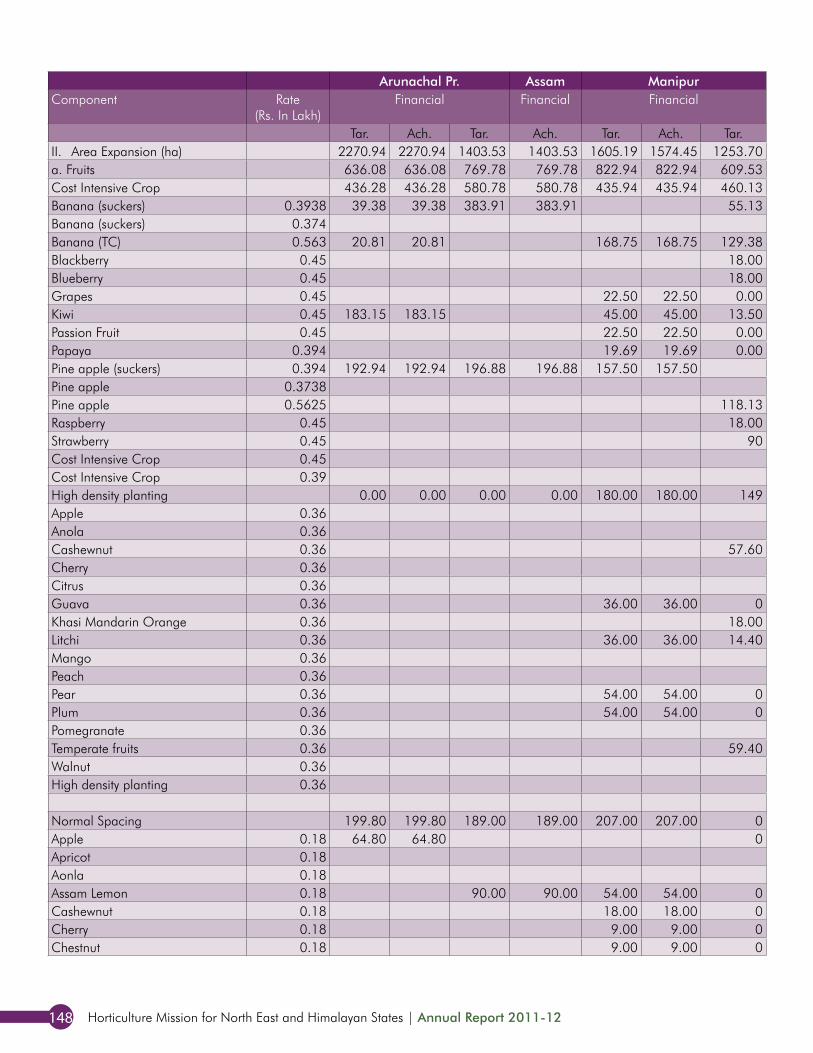
Horticulture Mission for North East and Himalayan States | Annual Report 2011-12148
Arunachal Pr. Assam Manipur Meghalaya Mizoram Nagaland Sikkim Tripura North EastComponent Rate
(Rs. In Lakh)Financial Financial Financial Financial Financial Financial Financial Financial Financial
Tar. Ach. Tar. Ach. Tar. Ach. Tar. Ach. Tar. Ach. Tar. Ach. Tar. Ach. Tar. Ach. Tar. Ach.II. Area Expansion (ha) 2270.94 2270.94 1403.53 1403.53 1605.19 1574.45 1253.70 1233 1928.13 1928.13 2343.18 2280.68 1263.76 1259.82 2174.90 2161.25 14243 14112a. Fruits 636.08 636.08 769.78 769.78 822.94 822.94 609.53 609.53 991.08 991.08 1146.22 1146.22 356.43 353.22 734.56 734.56 6067 6063Cost Intensive Crop 436.28 436.28 580.78 580.78 435.94 435.94 460.13 460 657.00 657.00 738.52 738.52 117.57 114.47 422.44 422.44 3849 3846Banana (suckers) 0.3938 39.38 39.38 383.91 383.91 55.13 55.13 0.00 118.13 118.13 596.54 596.54Banana (suckers) 0.374 242.94 242.94 242.94 242.94Banana (TC) 0.563 20.81 20.81 168.75 168.75 129.38 129.38 0.00 28.13 28.12 347.07 347.06Blackberry 0.45 18.00 18.00 0.00 18.00 18.00Blueberry 0.45 18.00 18.00 0.00 18.00 18.00Grapes 0.45 22.50 22.50 0.00 135.00 135.00 157.50 157.50Kiwi 0.45 183.15 183.15 45.00 45.00 13.50 13.50 0.00 41.85 41.85 69.75 69.70 353.25 353.20Passion Fruit 0.45 22.50 22.50 0.00 270.00 270.00 112.50 112.50 405.00 405.00Papaya 0.394 19.69 19.69 0.00 0.00 19.69 16.65 90.56 90.56 129.94 126.90Pine apple (suckers) 0.394 192.94 192.94 196.88 196.88 157.50 157.50 252.00 252.00 799.32 799.32Pine apple 0.3738 341.23 341.23 341.23 341.23Pine apple 0.5625 118.13 118.13 213.75 213.75 331.88 331.88Raspberry 0.45 18.00 18.00 0.00 0.00 18.00 18.00Strawberry 0.45 90 90.00 0.00 0.00 90.00 90.00Cost Intensive Crop 0.45 0.00 0.00Cost Intensive Crop 0.39 0.00 0.00High density planting 0.00 0.00 0.00 0.00 180.00 180.00 149 149 334.08 334.08 363.60 363.60 25.20 25.12 295.92 295.92 1348 1348Apple 0.36 54.00 54.00 9.00 8.97 0.00 63.00 62.97Anola 0.36 0.00 0.00Cashewnut 0.36 57.60 57.60 0.00 0.00 0.00 57.60 57.60Cherry 0.36 0.00 0.00Citrus 0.36 255.60 255.60 0.00 0.00 255.60 255.60Guava 0.36 36.00 36.00 0 0.00 18.00 18.00 16.20 16.15 36.00 36.00 106.20 106.15Khasi Mandarin Orange 0.36 18.00 18.00 316.80 316.80 0.00 0.00 334.80 334.80Litchi 0.36 36.00 36.00 14.40 14.40 0.00 0.00 25.92 25.92 76.32 76.32Mango 0.36 0.00 36.00 36.00 0.00 234.00 234.00 270.00 270.00Peach 0.36 0.00 0.00Pear 0.36 54.00 54.00 0 0.00 0.00 0.00 54.00 54.00Plum 0.36 54.00 54.00 0 17.28 17.28 0.00 0.00 71.28 71.28Pomegranate 0.36 0.00 0.00Temperate fruits 0.36 59.40 59.40 0.00 0.00 0.00 59.40 59.40Walnut 0.36 0.00 0.00High density planting 0.36 0.00 0.00 0.00 0.00 0.00
Normal Spacing 199.80 199.80 189.00 189.00 207.00 207.00 0 0 0.00 0.00 44.10 44.10 213.66 213.63 16.20 16.20 870 870Apple 0.18 64.80 64.80 0 0.00 0.00 0.00 64.80 64.80Apricot 0.18 0.00 0.00Aonla 0.18 0.00 0.00Assam Lemon 0.18 90.00 90.00 54.00 54.00 0 0.00 0.00 0.00 144.00 144.00Cashewnut 0.18 18.00 18.00 0 0.00 44.10 44.10 0.00 0.00 62.10 62.10Cherry 0.18 9.00 9.00 0 0.00 0.00 0.00 9.00 9.00Chestnut 0.18 9.00 9.00 0 0.00 0.00 0.00 9.00 9.00
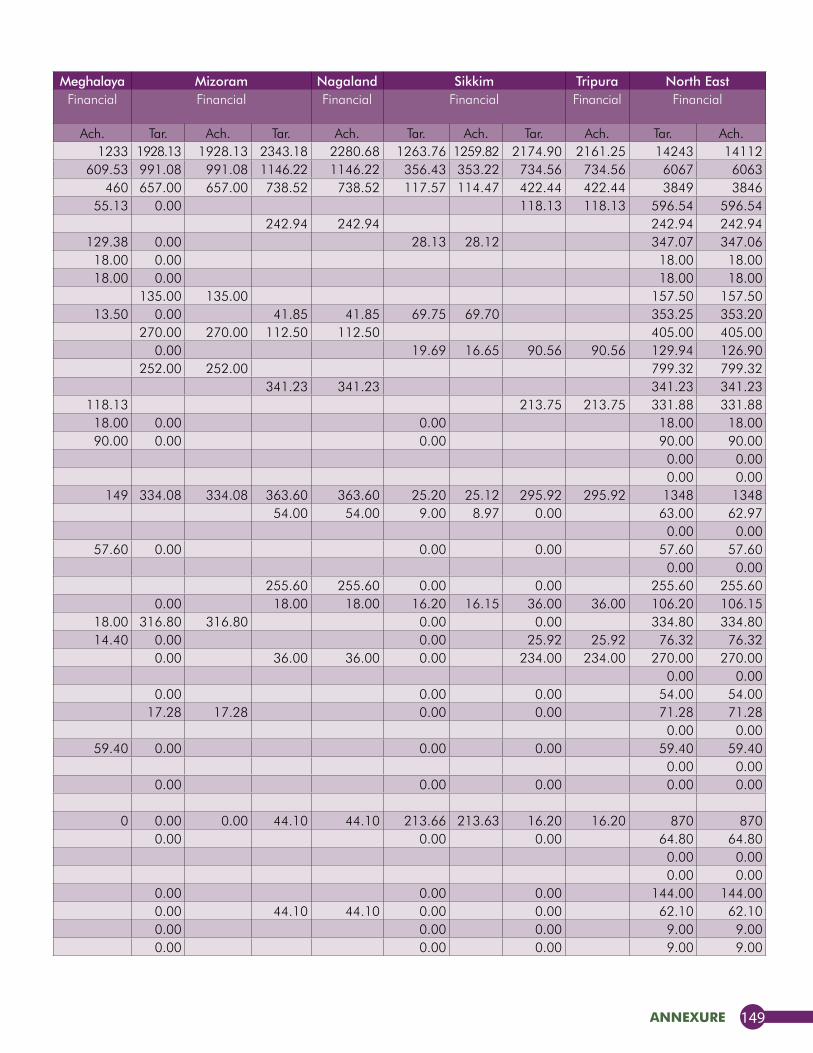
annexure 149
Arunachal Pr. Assam Manipur Meghalaya Mizoram Nagaland Sikkim Tripura North EastComponent Rate
(Rs. In Lakh)Financial Financial Financial Financial Financial Financial Financial Financial Financial
Tar. Ach. Tar. Ach. Tar. Ach. Tar. Ach. Tar. Ach. Tar. Ach. Tar. Ach. Tar. Ach. Tar. Ach.II. Area Expansion (ha) 2270.94 2270.94 1403.53 1403.53 1605.19 1574.45 1253.70 1233 1928.13 1928.13 2343.18 2280.68 1263.76 1259.82 2174.90 2161.25 14243 14112a. Fruits 636.08 636.08 769.78 769.78 822.94 822.94 609.53 609.53 991.08 991.08 1146.22 1146.22 356.43 353.22 734.56 734.56 6067 6063Cost Intensive Crop 436.28 436.28 580.78 580.78 435.94 435.94 460.13 460 657.00 657.00 738.52 738.52 117.57 114.47 422.44 422.44 3849 3846Banana (suckers) 0.3938 39.38 39.38 383.91 383.91 55.13 55.13 0.00 118.13 118.13 596.54 596.54Banana (suckers) 0.374 242.94 242.94 242.94 242.94Banana (TC) 0.563 20.81 20.81 168.75 168.75 129.38 129.38 0.00 28.13 28.12 347.07 347.06Blackberry 0.45 18.00 18.00 0.00 18.00 18.00Blueberry 0.45 18.00 18.00 0.00 18.00 18.00Grapes 0.45 22.50 22.50 0.00 135.00 135.00 157.50 157.50Kiwi 0.45 183.15 183.15 45.00 45.00 13.50 13.50 0.00 41.85 41.85 69.75 69.70 353.25 353.20Passion Fruit 0.45 22.50 22.50 0.00 270.00 270.00 112.50 112.50 405.00 405.00Papaya 0.394 19.69 19.69 0.00 0.00 19.69 16.65 90.56 90.56 129.94 126.90Pine apple (suckers) 0.394 192.94 192.94 196.88 196.88 157.50 157.50 252.00 252.00 799.32 799.32Pine apple 0.3738 341.23 341.23 341.23 341.23Pine apple 0.5625 118.13 118.13 213.75 213.75 331.88 331.88Raspberry 0.45 18.00 18.00 0.00 0.00 18.00 18.00Strawberry 0.45 90 90.00 0.00 0.00 90.00 90.00Cost Intensive Crop 0.45 0.00 0.00Cost Intensive Crop 0.39 0.00 0.00High density planting 0.00 0.00 0.00 0.00 180.00 180.00 149 149 334.08 334.08 363.60 363.60 25.20 25.12 295.92 295.92 1348 1348Apple 0.36 54.00 54.00 9.00 8.97 0.00 63.00 62.97Anola 0.36 0.00 0.00Cashewnut 0.36 57.60 57.60 0.00 0.00 0.00 57.60 57.60Cherry 0.36 0.00 0.00Citrus 0.36 255.60 255.60 0.00 0.00 255.60 255.60Guava 0.36 36.00 36.00 0 0.00 18.00 18.00 16.20 16.15 36.00 36.00 106.20 106.15Khasi Mandarin Orange 0.36 18.00 18.00 316.80 316.80 0.00 0.00 334.80 334.80Litchi 0.36 36.00 36.00 14.40 14.40 0.00 0.00 25.92 25.92 76.32 76.32Mango 0.36 0.00 36.00 36.00 0.00 234.00 234.00 270.00 270.00Peach 0.36 0.00 0.00Pear 0.36 54.00 54.00 0 0.00 0.00 0.00 54.00 54.00Plum 0.36 54.00 54.00 0 17.28 17.28 0.00 0.00 71.28 71.28Pomegranate 0.36 0.00 0.00Temperate fruits 0.36 59.40 59.40 0.00 0.00 0.00 59.40 59.40Walnut 0.36 0.00 0.00High density planting 0.36 0.00 0.00 0.00 0.00 0.00
Normal Spacing 199.80 199.80 189.00 189.00 207.00 207.00 0 0 0.00 0.00 44.10 44.10 213.66 213.63 16.20 16.20 870 870Apple 0.18 64.80 64.80 0 0.00 0.00 0.00 64.80 64.80Apricot 0.18 0.00 0.00Aonla 0.18 0.00 0.00Assam Lemon 0.18 90.00 90.00 54.00 54.00 0 0.00 0.00 0.00 144.00 144.00Cashewnut 0.18 18.00 18.00 0 0.00 44.10 44.10 0.00 0.00 62.10 62.10Cherry 0.18 9.00 9.00 0 0.00 0.00 0.00 9.00 9.00Chestnut 0.18 9.00 9.00 0 0.00 0.00 0.00 9.00 9.00
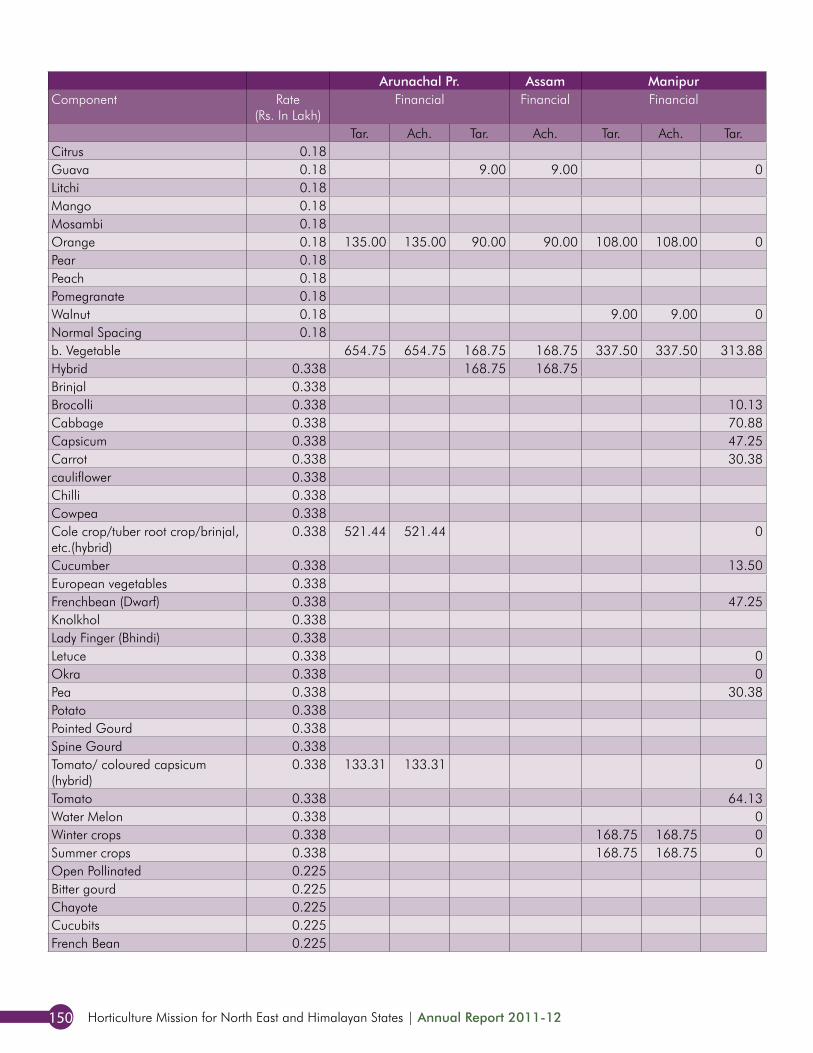
Horticulture Mission for North East and Himalayan States | Annual Report 2011-12150
Arunachal Pr. Assam Manipur Meghalaya Mizoram Nagaland Sikkim Tripura North EastComponent Rate
(Rs. In Lakh)Financial Financial Financial Financial Financial Financial Financial Financial Financial
Tar. Ach. Tar. Ach. Tar. Ach. Tar. Ach. Tar. Ach. Tar. Ach. Tar. Ach. Tar. Ach. Tar. Ach.Citrus 0.18 0.00 0.00Guava 0.18 9.00 9.00 0 0.00 13.50 13.48 0.00 22.50 22.48Litchi 0.18 18.36 18.35 18.36 18.35Mango 0.18 0.00 0.00Mosambi 0.18 16.20 16.20 16.20 16.20Orange 0.18 135.00 135.00 90.00 90.00 108.00 108.00 0 0.00 181.80 181.80 514.80 514.80Pear 0.18 0.00 0.00Peach 0.18 0.00 0.00Pomegranate 0.18 0.00 0.00Walnut 0.18 9.00 9.00 0 0.00 0.00 9.00 9.00Normal Spacing 0.18 0.00 0.00b. Vegetable 654.75 654.75 168.75 168.75 337.50 337.50 313.88 313.88 495.00 495.00 295.31 295.31 199.69 199.61 1228.16 1228.16 3693.04 3692.96Hybrid 0.338 168.75 168.75 126.56 126.56 150.19 150.14 0.00 445.50 445.45Brinjal 0.338 27.00 27.00 33.75 33.75 60.75 60.75Brocolli 0.338 10.13 10.13 27.00 27.00 0.00 37.13 37.13Cabbage 0.338 70.88 70.88 67.50 67.50 254.81 254.81 393.19 393.19Capsicum 0.338 47.25 47.25 50.63 50.63 27.00 27.00 124.88 124.88Carrot 0.338 30.38 30.38 20.25 20.25 21.60 21.60 72.23 72.23cauliflower 0.338 254.81 254.81 254.81 254.81Chilli 0.338 27.00 27.00 0.00 27.00 27.00Cowpea 0.338 77.63 77.63 77.63 77.63Cole crop/tuber root crop/brinjal, etc.(hybrid)
0.338 521.44 521.44 0 0.00 0.00 521.44 521.44
Cucumber 0.338 13.50 13.50 0.00 0.00 13.50 13.50European vegetables 0.338 0.00 0.00Frenchbean (Dwarf) 0.338 47.25 47.25 0.00 0.00 47.25 47.25Knolkhol 0.338 27.00 27.00 0.00 27.00 27.00Lady Finger (Bhindi) 0.338 121.50 121.50 121.50 121.50Letuce 0.338 0 20.25 20.25 0.00 20.25 20.25Okra 0.338 0 57.38 57.38 0.00 57.38 57.38Pea 0.338 30.38 30.38 0.00 0.00 30.38 30.38Potato 0.338 197.44 197.44 197.44 197.44Pointed Gourd 0.338 25.31 25.31 25.31 25.31Spine Gourd 0.338 21.94 21.94 21.94 21.94Tomato/ coloured capsicum (hybrid)
0.338 133.31 133.31 0 0.00 0.00 133.31 133.31
Tomato 0.338 64.13 64.13 54.00 54.00 124.88 124.88 243.01 243.01Water Melon 0.338 0 67.50 67.50 67.50 67.50Winter crops 0.338 168.75 168.75 0 0.00 0.00 168.75 168.75Summer crops 0.338 168.75 168.75 0 0.00 0.00 168.75 168.75Open Pollinated 0.225 168.75 168.75 49.50 49.47 0.00 218.25 218.22Bitter gourd 0.225 24.75 24.75 0.00 24.75 24.75Chayote 0.225 81.00 81.00 0.00 81.00 81.00Cucubits 0.225 0.00 0.00French Bean 0.225 0.00 0.00
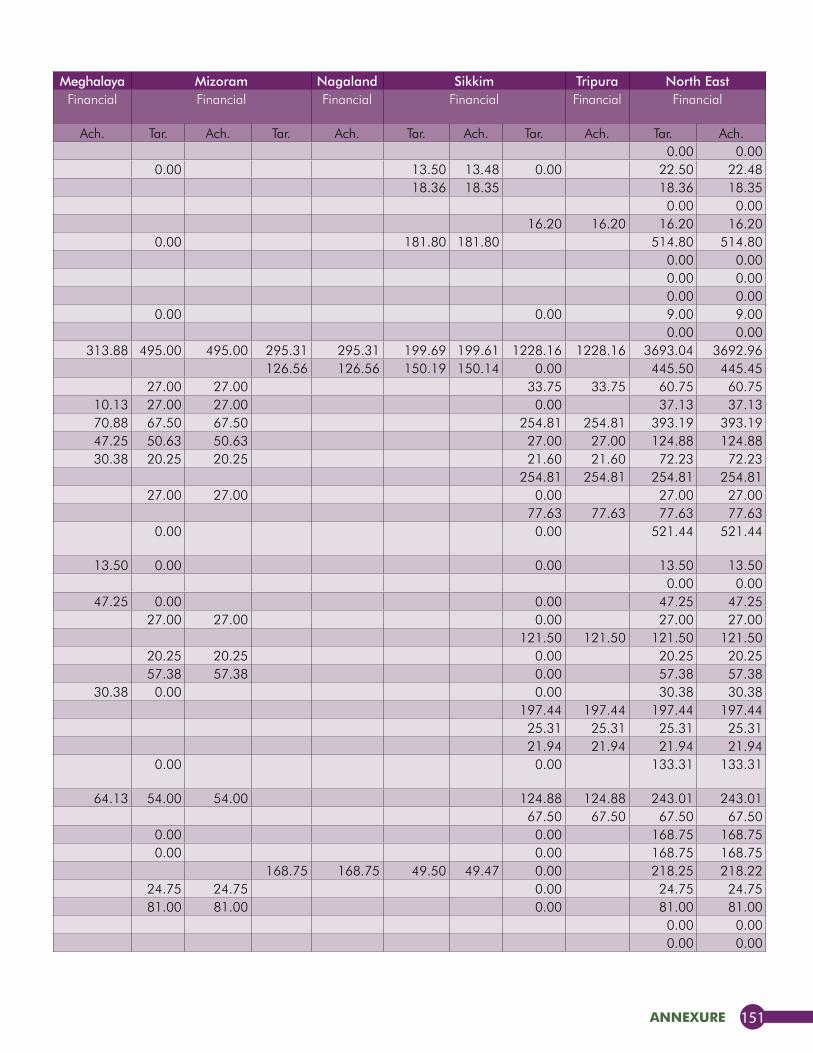
annexure 151
Arunachal Pr. Assam Manipur Meghalaya Mizoram Nagaland Sikkim Tripura North EastComponent Rate
(Rs. In Lakh)Financial Financial Financial Financial Financial Financial Financial Financial Financial
Tar. Ach. Tar. Ach. Tar. Ach. Tar. Ach. Tar. Ach. Tar. Ach. Tar. Ach. Tar. Ach. Tar. Ach.Citrus 0.18 0.00 0.00Guava 0.18 9.00 9.00 0 0.00 13.50 13.48 0.00 22.50 22.48Litchi 0.18 18.36 18.35 18.36 18.35Mango 0.18 0.00 0.00Mosambi 0.18 16.20 16.20 16.20 16.20Orange 0.18 135.00 135.00 90.00 90.00 108.00 108.00 0 0.00 181.80 181.80 514.80 514.80Pear 0.18 0.00 0.00Peach 0.18 0.00 0.00Pomegranate 0.18 0.00 0.00Walnut 0.18 9.00 9.00 0 0.00 0.00 9.00 9.00Normal Spacing 0.18 0.00 0.00b. Vegetable 654.75 654.75 168.75 168.75 337.50 337.50 313.88 313.88 495.00 495.00 295.31 295.31 199.69 199.61 1228.16 1228.16 3693.04 3692.96Hybrid 0.338 168.75 168.75 126.56 126.56 150.19 150.14 0.00 445.50 445.45Brinjal 0.338 27.00 27.00 33.75 33.75 60.75 60.75Brocolli 0.338 10.13 10.13 27.00 27.00 0.00 37.13 37.13Cabbage 0.338 70.88 70.88 67.50 67.50 254.81 254.81 393.19 393.19Capsicum 0.338 47.25 47.25 50.63 50.63 27.00 27.00 124.88 124.88Carrot 0.338 30.38 30.38 20.25 20.25 21.60 21.60 72.23 72.23cauliflower 0.338 254.81 254.81 254.81 254.81Chilli 0.338 27.00 27.00 0.00 27.00 27.00Cowpea 0.338 77.63 77.63 77.63 77.63Cole crop/tuber root crop/brinjal, etc.(hybrid)
0.338 521.44 521.44 0 0.00 0.00 521.44 521.44
Cucumber 0.338 13.50 13.50 0.00 0.00 13.50 13.50European vegetables 0.338 0.00 0.00Frenchbean (Dwarf) 0.338 47.25 47.25 0.00 0.00 47.25 47.25Knolkhol 0.338 27.00 27.00 0.00 27.00 27.00Lady Finger (Bhindi) 0.338 121.50 121.50 121.50 121.50Letuce 0.338 0 20.25 20.25 0.00 20.25 20.25Okra 0.338 0 57.38 57.38 0.00 57.38 57.38Pea 0.338 30.38 30.38 0.00 0.00 30.38 30.38Potato 0.338 197.44 197.44 197.44 197.44Pointed Gourd 0.338 25.31 25.31 25.31 25.31Spine Gourd 0.338 21.94 21.94 21.94 21.94Tomato/ coloured capsicum (hybrid)
0.338 133.31 133.31 0 0.00 0.00 133.31 133.31
Tomato 0.338 64.13 64.13 54.00 54.00 124.88 124.88 243.01 243.01Water Melon 0.338 0 67.50 67.50 67.50 67.50Winter crops 0.338 168.75 168.75 0 0.00 0.00 168.75 168.75Summer crops 0.338 168.75 168.75 0 0.00 0.00 168.75 168.75Open Pollinated 0.225 168.75 168.75 49.50 49.47 0.00 218.25 218.22Bitter gourd 0.225 24.75 24.75 0.00 24.75 24.75Chayote 0.225 81.00 81.00 0.00 81.00 81.00Cucubits 0.225 0.00 0.00French Bean 0.225 0.00 0.00
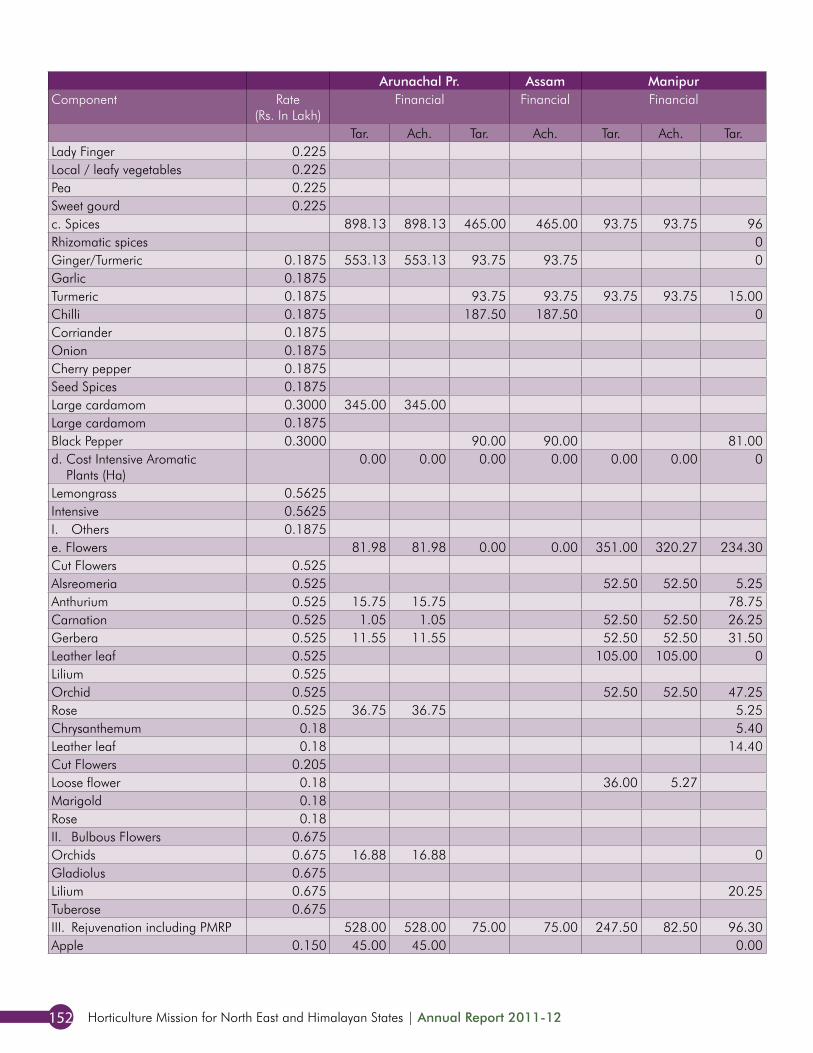
Horticulture Mission for North East and Himalayan States | Annual Report 2011-12152
Arunachal Pr. Assam Manipur Meghalaya Mizoram Nagaland Sikkim Tripura North EastComponent Rate
(Rs. In Lakh)Financial Financial Financial Financial Financial Financial Financial Financial Financial
Tar. Ach. Tar. Ach. Tar. Ach. Tar. Ach. Tar. Ach. Tar. Ach. Tar. Ach. Tar. Ach. Tar. Ach.Lady Finger 0.225 0.00 0.00Local / leafy vegetables 0.225 0.00 0.00Pea 0.225 0.00 0.00Sweet gourd 0.225 11.25 11.25 0.00 11.25 11.25c. Spices 898.13 898.13 465.00 465.00 93.75 93.75 96 78 336.00 336.00 352.65 352.65 367.96 367.79 155.96 155.96 2765 2747Rhizomatic spices 0 0.00 0.00 0.00 0.00Ginger/Turmeric 0.1875 553.13 553.13 93.75 93.75 0 99.38 99.38 79.69 79.69 190.50 190.47 48.94 48.94 1065.38 1065.35Garlic 0.1875 0.00 0.00Turmeric 0.1875 93.75 93.75 93.75 93.75 15.00 15.00 150.00 150.00 46.88 46.88 50.63 50.60 0.00 450.00 449.98Chilli 0.1875 187.50 187.50 0 0.00 0.00 65.63 65.63 95.63 95.63 348.75 348.75Corriander 0.1875 11.63 11.63 0.00 11.63 11.63Onion 0.1875 75.00 75.00 0.00 75.00 75.00Cherry pepper 0.1875 50.63 50.60 0.00 50.63 50.60Seed Spices 0.1875 0.00 0.00Large cardamom 0.3000 345.00 345.00 345.00 345.00Large cardamom 0.1875 96.56 96.56 75.00 74.92 0.00 171.56 171.48Black Pepper 0.3000 90.00 90.00 81.00 63.00 63.90 63.90 1.20 1.20 11.40 11.40 247.50 229.50d. Cost Intensive Aromatic
Plants (Ha)0.00 0.00 0.00 0.00 0.00 0.00 0 0 0.00 0.00 84.38 84.38 0.00 0.00 0.00 0.00 84 84
Lemongrass 0.5625 84.38 84.38 0.00 84.38 84.38Intensive 0.5625 0.00 0.00I. Others 0.1875 0.00 0.00 0.00e. Flowers 81.98 81.98 0.00 0.00 351.00 320.27 234.30 231.32 106.05 106.05 464.63 402.13 339.68 339.20 56.22 42.57 1633.86 1523.51Cut Flowers 0.525 231.00 230.65 0.00 231.00 230.65Alsreomeria 0.525 52.50 52.50 5.25 5.25 0.00 73.50 73.50 0.00 131.25 131.25Anthurium 0.525 15.75 15.75 78.75 76.13 85.05 85.05 39.38 39.38 218.93 216.30Carnation 0.525 1.05 1.05 52.50 52.50 26.25 26.25 21.00 21.00 0.00 0.00 0.00 100.80 100.80Gerbera 0.525 11.55 11.55 52.50 52.50 31.50 31.50 0.00 94.50 32.00 13.65 203.70 127.55Leather leaf 0.525 105.00 105.00 0 0.00 0.00 0.00 105.00 105.00Lilium 0.525 144.38 144.38 0.00 144.38 144.38Orchid 0.525 52.50 52.50 47.25 47.25 0.00 39.38 39.38 139.13 139.13Rose 0.525 36.75 36.75 5.25 5.25 0.00 73.50 73.50 0.00 115.50 115.50Chrysanthemum 0.18 5.40 5.04 0.00 0.00 0.00 5.40 5.04Leather leaf 0.18 14.40 14.40 0.00 0.00 0.00 14.40 14.40Cut Flowers 0.205 0.00 0.00 0.00Loose flower 0.18 36.00 5.27 0.00 0.00 10.80 10.75 0.00 46.80 16.02Marigold 0.18 2.70 2.70 2.70 2.70Rose 0.18 0.00 14.22 14.22 14.22 14.22II. Bulbous Flowers 0.675 0.00 0.00 97.88 97.80 0.00 97.88 97.80Orchids 0.675 16.88 16.88 0 0.00 0.00 0.00 16.88 16.88Gladiolus 0.675 10.13 10.13 10.13 10.13Lilium 0.675 20.25 20.25 0.00 0.00 0.00 20.25 20.25Tuberose 0.675 15.53 15.53 15.53 15.53III. Rejuvenation including PMRP 528.00 528.00 75.00 75.00 247.50 82.50 96.30 91.80 150.00 150.00 129.00 129.00 105.00 104.95 124.80 124.80 1455.60 1286.05Apple 0.150 45.00 45.00 0.00 0.00 0.00 0.00 45.00 45.00
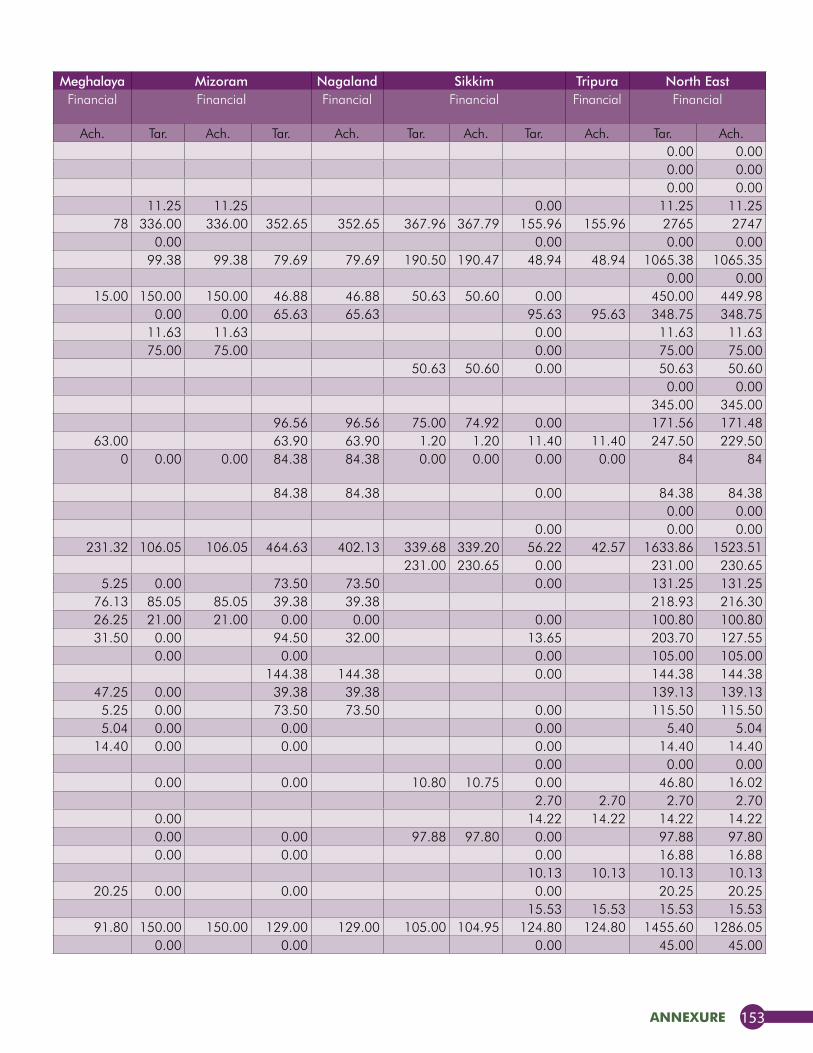
annexure 153
Arunachal Pr. Assam Manipur Meghalaya Mizoram Nagaland Sikkim Tripura North EastComponent Rate
(Rs. In Lakh)Financial Financial Financial Financial Financial Financial Financial Financial Financial
Tar. Ach. Tar. Ach. Tar. Ach. Tar. Ach. Tar. Ach. Tar. Ach. Tar. Ach. Tar. Ach. Tar. Ach.Lady Finger 0.225 0.00 0.00Local / leafy vegetables 0.225 0.00 0.00Pea 0.225 0.00 0.00Sweet gourd 0.225 11.25 11.25 0.00 11.25 11.25c. Spices 898.13 898.13 465.00 465.00 93.75 93.75 96 78 336.00 336.00 352.65 352.65 367.96 367.79 155.96 155.96 2765 2747Rhizomatic spices 0 0.00 0.00 0.00 0.00Ginger/Turmeric 0.1875 553.13 553.13 93.75 93.75 0 99.38 99.38 79.69 79.69 190.50 190.47 48.94 48.94 1065.38 1065.35Garlic 0.1875 0.00 0.00Turmeric 0.1875 93.75 93.75 93.75 93.75 15.00 15.00 150.00 150.00 46.88 46.88 50.63 50.60 0.00 450.00 449.98Chilli 0.1875 187.50 187.50 0 0.00 0.00 65.63 65.63 95.63 95.63 348.75 348.75Corriander 0.1875 11.63 11.63 0.00 11.63 11.63Onion 0.1875 75.00 75.00 0.00 75.00 75.00Cherry pepper 0.1875 50.63 50.60 0.00 50.63 50.60Seed Spices 0.1875 0.00 0.00Large cardamom 0.3000 345.00 345.00 345.00 345.00Large cardamom 0.1875 96.56 96.56 75.00 74.92 0.00 171.56 171.48Black Pepper 0.3000 90.00 90.00 81.00 63.00 63.90 63.90 1.20 1.20 11.40 11.40 247.50 229.50d. Cost Intensive Aromatic
Plants (Ha)0.00 0.00 0.00 0.00 0.00 0.00 0 0 0.00 0.00 84.38 84.38 0.00 0.00 0.00 0.00 84 84
Lemongrass 0.5625 84.38 84.38 0.00 84.38 84.38Intensive 0.5625 0.00 0.00I. Others 0.1875 0.00 0.00 0.00e. Flowers 81.98 81.98 0.00 0.00 351.00 320.27 234.30 231.32 106.05 106.05 464.63 402.13 339.68 339.20 56.22 42.57 1633.86 1523.51Cut Flowers 0.525 231.00 230.65 0.00 231.00 230.65Alsreomeria 0.525 52.50 52.50 5.25 5.25 0.00 73.50 73.50 0.00 131.25 131.25Anthurium 0.525 15.75 15.75 78.75 76.13 85.05 85.05 39.38 39.38 218.93 216.30Carnation 0.525 1.05 1.05 52.50 52.50 26.25 26.25 21.00 21.00 0.00 0.00 0.00 100.80 100.80Gerbera 0.525 11.55 11.55 52.50 52.50 31.50 31.50 0.00 94.50 32.00 13.65 203.70 127.55Leather leaf 0.525 105.00 105.00 0 0.00 0.00 0.00 105.00 105.00Lilium 0.525 144.38 144.38 0.00 144.38 144.38Orchid 0.525 52.50 52.50 47.25 47.25 0.00 39.38 39.38 139.13 139.13Rose 0.525 36.75 36.75 5.25 5.25 0.00 73.50 73.50 0.00 115.50 115.50Chrysanthemum 0.18 5.40 5.04 0.00 0.00 0.00 5.40 5.04Leather leaf 0.18 14.40 14.40 0.00 0.00 0.00 14.40 14.40Cut Flowers 0.205 0.00 0.00 0.00Loose flower 0.18 36.00 5.27 0.00 0.00 10.80 10.75 0.00 46.80 16.02Marigold 0.18 2.70 2.70 2.70 2.70Rose 0.18 0.00 14.22 14.22 14.22 14.22II. Bulbous Flowers 0.675 0.00 0.00 97.88 97.80 0.00 97.88 97.80Orchids 0.675 16.88 16.88 0 0.00 0.00 0.00 16.88 16.88Gladiolus 0.675 10.13 10.13 10.13 10.13Lilium 0.675 20.25 20.25 0.00 0.00 0.00 20.25 20.25Tuberose 0.675 15.53 15.53 15.53 15.53III. Rejuvenation including PMRP 528.00 528.00 75.00 75.00 247.50 82.50 96.30 91.80 150.00 150.00 129.00 129.00 105.00 104.95 124.80 124.80 1455.60 1286.05Apple 0.150 45.00 45.00 0.00 0.00 0.00 0.00 45.00 45.00
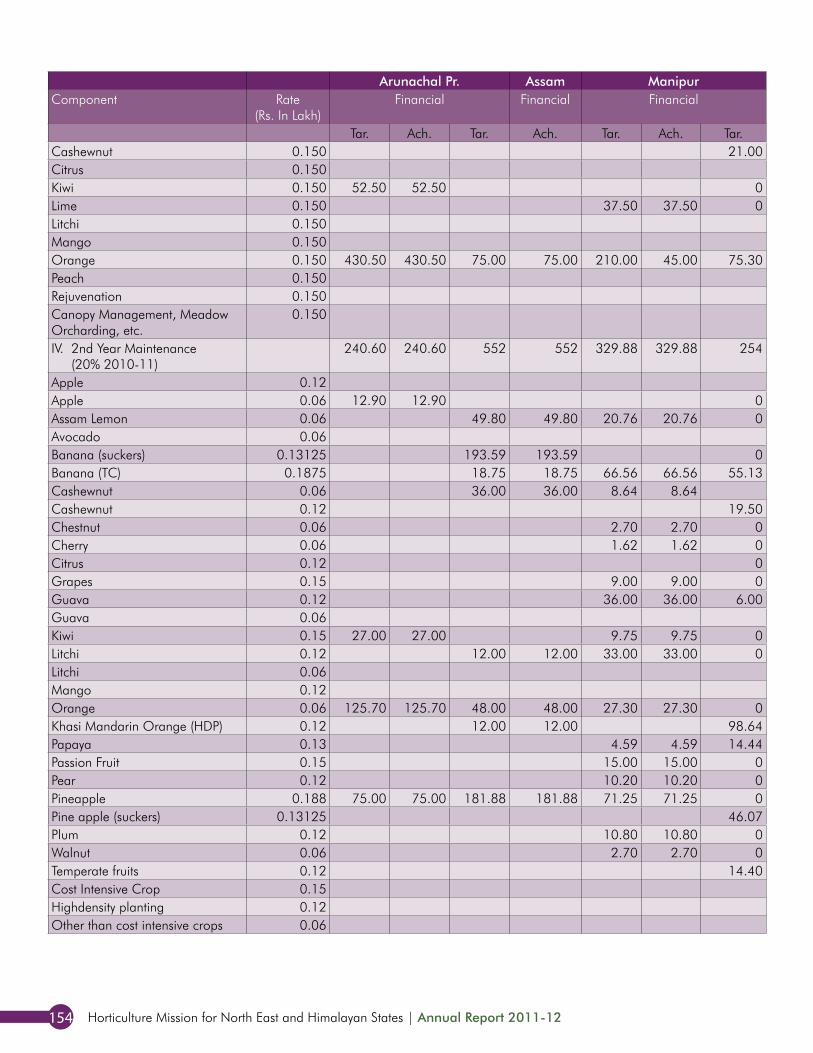
Horticulture Mission for North East and Himalayan States | Annual Report 2011-12154
Arunachal Pr. Assam Manipur Meghalaya Mizoram Nagaland Sikkim Tripura North EastComponent Rate
(Rs. In Lakh)Financial Financial Financial Financial Financial Financial Financial Financial Financial
Tar. Ach. Tar. Ach. Tar. Ach. Tar. Ach. Tar. Ach. Tar. Ach. Tar. Ach. Tar. Ach. Tar. Ach.Cashewnut 0.150 21.00 21.00 0.00 0.00 0.00 21.00 21.00Citrus 0.150 105.00 105.00 0.00 105.00 105.00Kiwi 0.150 52.50 52.50 0 0.00 0.00 0.00 52.50 52.50Lime 0.150 37.50 37.50 0 0.00 0.00 0.00 37.50 37.50Litchi 0.150 0.00 0.00Mango 0.150 0.00 0.00Orange 0.150 430.50 430.50 75.00 75.00 210.00 45.00 75.30 70.80 0.00 0.00 105.00 104.95 0.00 895.80 726.25Peach 0.150 0.00 0.00Rejuvenation 0.150 150.00 150.00 0.00 112.50 112.50 262.50 262.50Canopy Management, Meadow Orcharding, etc.
0.150 24.00 24.00 12.30 12.30 36.30 36.30
IV. 2nd Year Maintenance (20% 2010-11)
240.60 240.60 552 552 329.88 329.88 254 254 166 166 391 391 78.80 78.65 142 114 2154 2125
Apple 0.12 12.00 12.00 6.00 5.95 18.00 17.95Apple 0.06 12.90 12.90 0 0.00 0.00 12.90 12.90Assam Lemon 0.06 49.80 49.80 20.76 20.76 0 0.00 0.00 70.56 70.56Avocado 0.06 1.50 1.50 0.00 1.50 1.50Banana (suckers) 0.13125 193.59 193.59 0 2.63 2.63 29.93 29.93 7.22 7.21 233.36 233.35Banana (TC) 0.1875 18.75 18.75 66.56 66.56 55.13 55.13 0.00 0.00 140.44 140.44Cashewnut 0.06 36.00 36.00 8.64 8.64 0.00 0.00 44.64 44.64Cashewnut 0.12 19.50 19.50 0.00 0.00 19.50 19.50Chestnut 0.06 2.70 2.70 0 0.00 0.00 2.70 2.70Cherry 0.06 1.62 1.62 0 0.00 0.00 1.62 1.62Citrus 0.12 0 0.00 165.00 165.00 165.00 165.00Grapes 0.15 9.00 9.00 0 22.50 22.50 0.00 31.50 31.50Guava 0.12 36.00 36.00 6.00 6.00 0.00 0.00 42.00 42.00Guava 0.06 10.80 10.75 10.80 10.75Kiwi 0.15 27.00 27.00 9.75 9.75 0 0.00 15.00 15.00 10.50 10.49 62.25 62.24Litchi 0.12 12.00 12.00 33.00 33.00 0 0.00 0.00 45.00 45.00Litchi 0.06 11.28 11.25 11.28 11.25Mango 0.12 2.40 2.40 15.00 15.00 17.40 17.40Orange 0.06 125.70 125.70 48.00 48.00 27.30 27.30 0 0.00 0.00 33.00 33.00 234.00 234.00Khasi Mandarin Orange (HDP) 0.12 12.00 12.00 98.64 98.64 72.00 72.00 0.00 182.64 182.64Papaya 0.13 4.59 4.59 14.44 14.44 5.25 5.25 0.00 24.28 24.28Passion Fruit 0.15 15.00 15.00 0 33.00 33.00 75.00 75.00 123.00 123.00Pear 0.12 10.20 10.20 0 0.00 0.00 10.20 10.20Pineapple 0.188 75.00 75.00 181.88 181.88 71.25 71.25 0 0.00 0.00 328.13 328.13Pine apple (suckers) 0.13125 46.07 46.07 26.25 26.25 78.75 78.75 151.07 151.07Plum 0.12 10.80 10.80 0 0.00 0.00 10.80 10.80Walnut 0.06 2.70 2.70 0 0.00 0.00 2.70 2.70Temperate fruits 0.12 14.40 14.40 0.00 0.00 14.40 14.40Cost Intensive Crop 0.15 142.05 113.80 142.05 113.80Highdensity planting 0.12 0.00 0.00Other than cost intensive crops 0.06 0.00 0.00
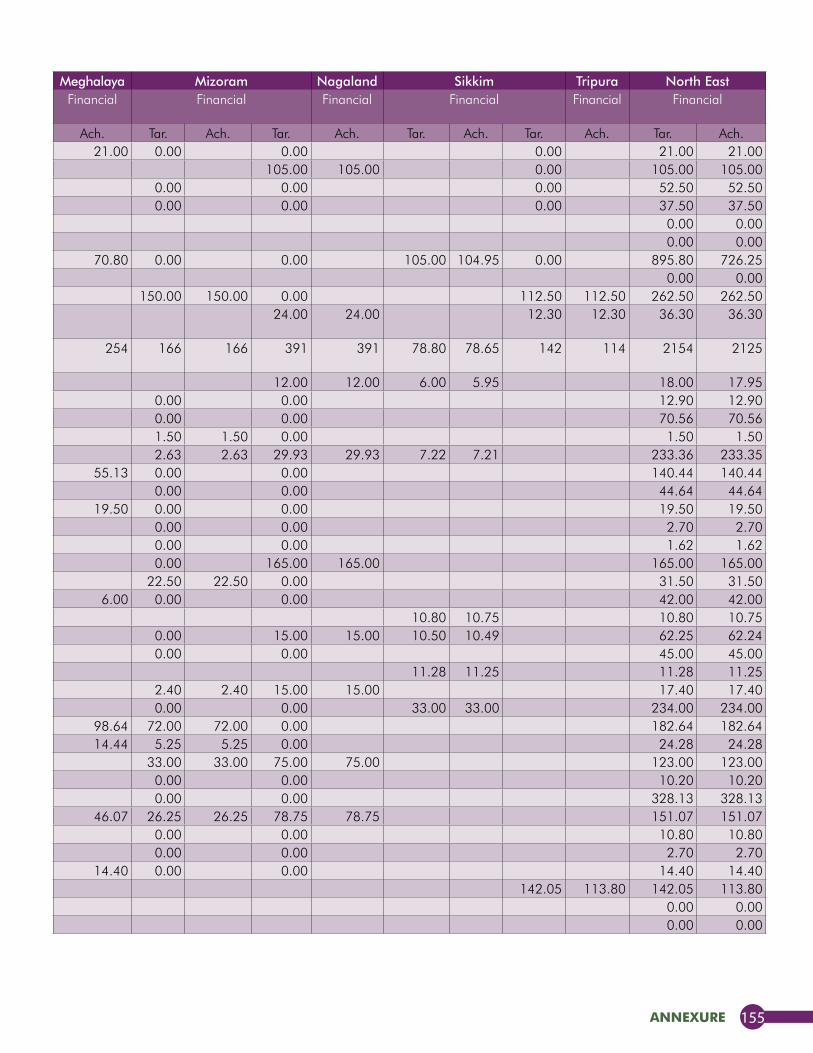
annexure 155
Arunachal Pr. Assam Manipur Meghalaya Mizoram Nagaland Sikkim Tripura North EastComponent Rate
(Rs. In Lakh)Financial Financial Financial Financial Financial Financial Financial Financial Financial
Tar. Ach. Tar. Ach. Tar. Ach. Tar. Ach. Tar. Ach. Tar. Ach. Tar. Ach. Tar. Ach. Tar. Ach.Cashewnut 0.150 21.00 21.00 0.00 0.00 0.00 21.00 21.00Citrus 0.150 105.00 105.00 0.00 105.00 105.00Kiwi 0.150 52.50 52.50 0 0.00 0.00 0.00 52.50 52.50Lime 0.150 37.50 37.50 0 0.00 0.00 0.00 37.50 37.50Litchi 0.150 0.00 0.00Mango 0.150 0.00 0.00Orange 0.150 430.50 430.50 75.00 75.00 210.00 45.00 75.30 70.80 0.00 0.00 105.00 104.95 0.00 895.80 726.25Peach 0.150 0.00 0.00Rejuvenation 0.150 150.00 150.00 0.00 112.50 112.50 262.50 262.50Canopy Management, Meadow Orcharding, etc.
0.150 24.00 24.00 12.30 12.30 36.30 36.30
IV. 2nd Year Maintenance (20% 2010-11)
240.60 240.60 552 552 329.88 329.88 254 254 166 166 391 391 78.80 78.65 142 114 2154 2125
Apple 0.12 12.00 12.00 6.00 5.95 18.00 17.95Apple 0.06 12.90 12.90 0 0.00 0.00 12.90 12.90Assam Lemon 0.06 49.80 49.80 20.76 20.76 0 0.00 0.00 70.56 70.56Avocado 0.06 1.50 1.50 0.00 1.50 1.50Banana (suckers) 0.13125 193.59 193.59 0 2.63 2.63 29.93 29.93 7.22 7.21 233.36 233.35Banana (TC) 0.1875 18.75 18.75 66.56 66.56 55.13 55.13 0.00 0.00 140.44 140.44Cashewnut 0.06 36.00 36.00 8.64 8.64 0.00 0.00 44.64 44.64Cashewnut 0.12 19.50 19.50 0.00 0.00 19.50 19.50Chestnut 0.06 2.70 2.70 0 0.00 0.00 2.70 2.70Cherry 0.06 1.62 1.62 0 0.00 0.00 1.62 1.62Citrus 0.12 0 0.00 165.00 165.00 165.00 165.00Grapes 0.15 9.00 9.00 0 22.50 22.50 0.00 31.50 31.50Guava 0.12 36.00 36.00 6.00 6.00 0.00 0.00 42.00 42.00Guava 0.06 10.80 10.75 10.80 10.75Kiwi 0.15 27.00 27.00 9.75 9.75 0 0.00 15.00 15.00 10.50 10.49 62.25 62.24Litchi 0.12 12.00 12.00 33.00 33.00 0 0.00 0.00 45.00 45.00Litchi 0.06 11.28 11.25 11.28 11.25Mango 0.12 2.40 2.40 15.00 15.00 17.40 17.40Orange 0.06 125.70 125.70 48.00 48.00 27.30 27.30 0 0.00 0.00 33.00 33.00 234.00 234.00Khasi Mandarin Orange (HDP) 0.12 12.00 12.00 98.64 98.64 72.00 72.00 0.00 182.64 182.64Papaya 0.13 4.59 4.59 14.44 14.44 5.25 5.25 0.00 24.28 24.28Passion Fruit 0.15 15.00 15.00 0 33.00 33.00 75.00 75.00 123.00 123.00Pear 0.12 10.20 10.20 0 0.00 0.00 10.20 10.20Pineapple 0.188 75.00 75.00 181.88 181.88 71.25 71.25 0 0.00 0.00 328.13 328.13Pine apple (suckers) 0.13125 46.07 46.07 26.25 26.25 78.75 78.75 151.07 151.07Plum 0.12 10.80 10.80 0 0.00 0.00 10.80 10.80Walnut 0.06 2.70 2.70 0 0.00 0.00 2.70 2.70Temperate fruits 0.12 14.40 14.40 0.00 0.00 14.40 14.40Cost Intensive Crop 0.15 142.05 113.80 142.05 113.80Highdensity planting 0.12 0.00 0.00Other than cost intensive crops 0.06 0.00 0.00
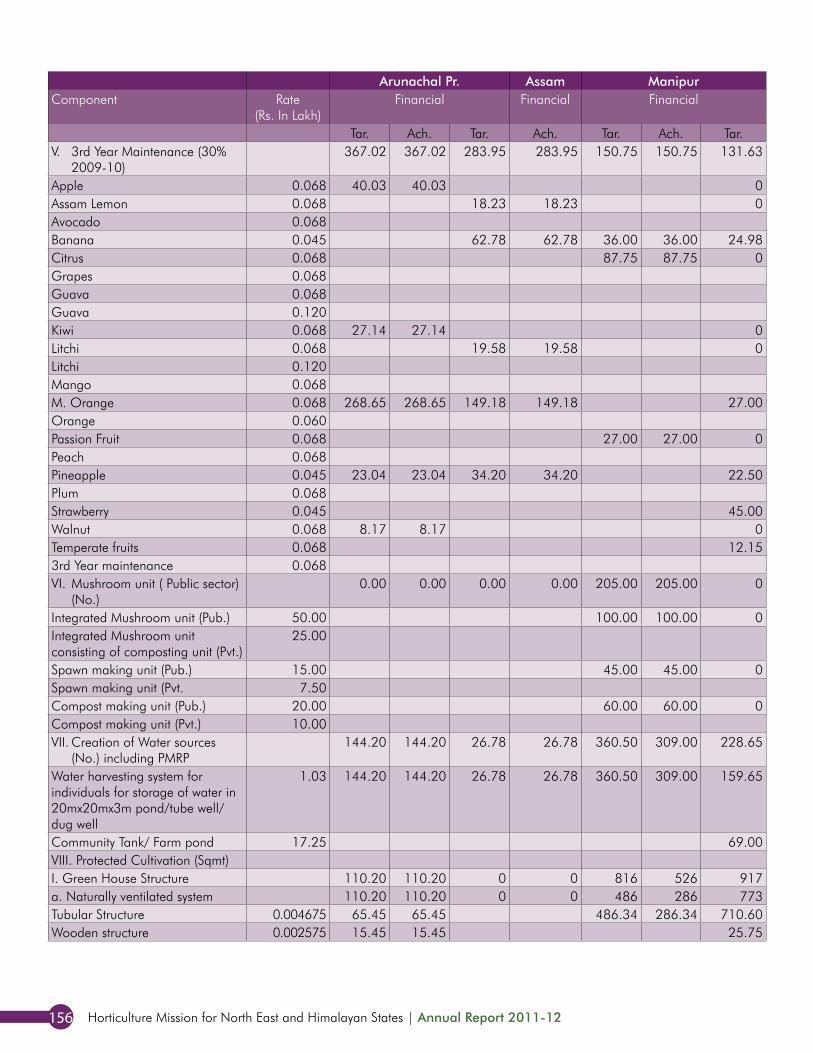
Horticulture Mission for North East and Himalayan States | Annual Report 2011-12156
Arunachal Pr. Assam Manipur Meghalaya Mizoram Nagaland Sikkim Tripura North EastComponent Rate
(Rs. In Lakh)Financial Financial Financial Financial Financial Financial Financial Financial Financial
Tar. Ach. Tar. Ach. Tar. Ach. Tar. Ach. Tar. Ach. Tar. Ach. Tar. Ach. Tar. Ach. Tar. Ach.V. 3rd Year Maintenance (30%
2009-10)367.02 367.02 283.95 283.95 150.75 150.75 131.63 131.63 176.63 142.88 425.48 425.48 65.10 65.00 82.62 82.62 1683 1649
Apple 0.068 40.03 40.03 0 0.00 3.38 3.38 43.40 43.40Assam Lemon 0.068 18.23 18.23 0 0.00 0.00 18.23 18.23Avocado 0.068 10.13 10.13 0.00 10.13 10.13Banana 0.045 62.78 62.78 36.00 36.00 24.98 24.98 31.50 31.50 29.25 29.25 184.50 184.50Citrus 0.068 87.75 87.75 0 0.00 202.50 202.50 290.25 290.25Grapes 0.068 33.75 0.00 0.00 33.75 0.00Guava 0.068 0.00 6.75 6.75 6.75 6.75Guava 0.120 0.00 12.00 11.95 12.00 11.95Kiwi 0.068 27.14 27.14 0 33.75 33.75 12.49 12.49 73.37 73.37Litchi 0.068 19.58 19.58 0 0.00 0.00 6.75 6.75 26.33 26.33Litchi 0.120 19.20 19.15 19.20 19.15Mango 0.068 20.25 20.25 20.25 20.25M. Orange 0.068 268.65 268.65 149.18 149.18 27.00 27.00 67.50 67.50 0.00 512.33 512.33Orange 0.060 0.00 33.90 33.90 33.90 33.90Passion Fruit 0.068 27.00 27.00 0 0.00 67.50 67.50 94.50 94.50Peach 0.068 3.38 3.38 3.38 3.38Pineapple 0.045 23.04 23.04 34.20 34.20 22.50 22.50 0.00 51.75 51.75 131.49 131.49Plum 0.068 17.89 17.89 17.89 17.89Strawberry 0.045 45.00 45.00 0.00 3.60 3.60 48.60 48.60Walnut 0.068 8.17 8.17 0 0.00 0.00 8.17 8.17Temperate fruits 0.068 12.15 12.15 0.00 0.00 12.15 12.153rd Year maintenance 0.068 82.62 82.62 82.62 82.62VI. Mushroom unit ( Public sector)
(No.)0.00 0.00 0.00 0.00 205.00 205.00 0 0 0.00 0.00 0.00 0.00 0.00 0.00 0.00 0.00 205 205
Integrated Mushroom unit (Pub.) 50.00 100.00 100.00 0 0.00 0.00 0.00 100.00 100.00Integrated Mushroom unit consisting of composting unit (Pvt.)
25.00 0.00 0.00
Spawn making unit (Pub.) 15.00 45.00 45.00 0 0.00 0.00 0.00 45.00 45.00Spawn making unit (Pvt. 7.50 0.00 0.00Compost making unit (Pub.) 20.00 60.00 60.00 0 0.00 0.00 0.00 60.00 60.00Compost making unit (Pvt.) 10.00 0.00 0.00VII. Creation of Water sources
(No.) including PMRP144.20 144.20 26.78 26.78 360.50 309.00 228.65 225.56 528.39 528.39 334.75 334.75 273.44 272.90 457.30 457.30 2354 2299
Water harvesting system for individuals for storage of water in 20mx20mx3m pond/tube well/dug well
1.03 144.20 144.20 26.78 26.78 360.50 309.00 159.65 156.56 528.39 528.39 334.75 334.75 100.94 100.50 319.30 319.30 1974.51 1919.48
Community Tank/ Farm pond 17.25 69.00 69.00 172.50 172.40 138.00 138.00 379.50 379.40VIII. Protected Cultivation (Sqmt)I. Green House Structure 110.20 110.20 0 0 816 526 917 891 291 291 187 140 1128.50 837.62 461 0 3911 2797a. Naturally ventilated system 110.20 110.20 0 0 486 286 773 747 201 201 187 140 1091.00 800.20 406 0 3254 2285Tubular Structure 0.004675 65.45 65.45 486.34 286.34 710.60 687.23 201.03 201.03 187.00 140.25 1030.52 747.80 143.99 2824.92 2128.09Wooden structure 0.002575 15.45 15.45 25.75 23.18 41.20 38.63
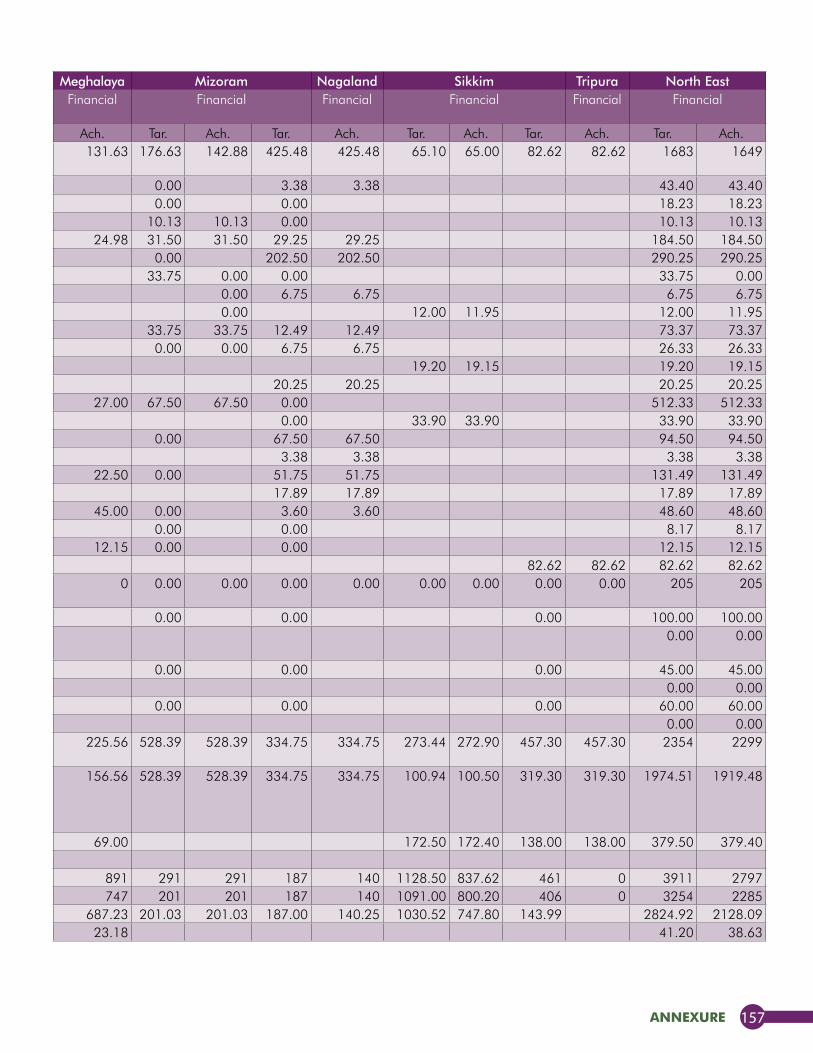
annexure 157
Arunachal Pr. Assam Manipur Meghalaya Mizoram Nagaland Sikkim Tripura North EastComponent Rate
(Rs. In Lakh)Financial Financial Financial Financial Financial Financial Financial Financial Financial
Tar. Ach. Tar. Ach. Tar. Ach. Tar. Ach. Tar. Ach. Tar. Ach. Tar. Ach. Tar. Ach. Tar. Ach.V. 3rd Year Maintenance (30%
2009-10)367.02 367.02 283.95 283.95 150.75 150.75 131.63 131.63 176.63 142.88 425.48 425.48 65.10 65.00 82.62 82.62 1683 1649
Apple 0.068 40.03 40.03 0 0.00 3.38 3.38 43.40 43.40Assam Lemon 0.068 18.23 18.23 0 0.00 0.00 18.23 18.23Avocado 0.068 10.13 10.13 0.00 10.13 10.13Banana 0.045 62.78 62.78 36.00 36.00 24.98 24.98 31.50 31.50 29.25 29.25 184.50 184.50Citrus 0.068 87.75 87.75 0 0.00 202.50 202.50 290.25 290.25Grapes 0.068 33.75 0.00 0.00 33.75 0.00Guava 0.068 0.00 6.75 6.75 6.75 6.75Guava 0.120 0.00 12.00 11.95 12.00 11.95Kiwi 0.068 27.14 27.14 0 33.75 33.75 12.49 12.49 73.37 73.37Litchi 0.068 19.58 19.58 0 0.00 0.00 6.75 6.75 26.33 26.33Litchi 0.120 19.20 19.15 19.20 19.15Mango 0.068 20.25 20.25 20.25 20.25M. Orange 0.068 268.65 268.65 149.18 149.18 27.00 27.00 67.50 67.50 0.00 512.33 512.33Orange 0.060 0.00 33.90 33.90 33.90 33.90Passion Fruit 0.068 27.00 27.00 0 0.00 67.50 67.50 94.50 94.50Peach 0.068 3.38 3.38 3.38 3.38Pineapple 0.045 23.04 23.04 34.20 34.20 22.50 22.50 0.00 51.75 51.75 131.49 131.49Plum 0.068 17.89 17.89 17.89 17.89Strawberry 0.045 45.00 45.00 0.00 3.60 3.60 48.60 48.60Walnut 0.068 8.17 8.17 0 0.00 0.00 8.17 8.17Temperate fruits 0.068 12.15 12.15 0.00 0.00 12.15 12.153rd Year maintenance 0.068 82.62 82.62 82.62 82.62VI. Mushroom unit ( Public sector)
(No.)0.00 0.00 0.00 0.00 205.00 205.00 0 0 0.00 0.00 0.00 0.00 0.00 0.00 0.00 0.00 205 205
Integrated Mushroom unit (Pub.) 50.00 100.00 100.00 0 0.00 0.00 0.00 100.00 100.00Integrated Mushroom unit consisting of composting unit (Pvt.)
25.00 0.00 0.00
Spawn making unit (Pub.) 15.00 45.00 45.00 0 0.00 0.00 0.00 45.00 45.00Spawn making unit (Pvt. 7.50 0.00 0.00Compost making unit (Pub.) 20.00 60.00 60.00 0 0.00 0.00 0.00 60.00 60.00Compost making unit (Pvt.) 10.00 0.00 0.00VII. Creation of Water sources
(No.) including PMRP144.20 144.20 26.78 26.78 360.50 309.00 228.65 225.56 528.39 528.39 334.75 334.75 273.44 272.90 457.30 457.30 2354 2299
Water harvesting system for individuals for storage of water in 20mx20mx3m pond/tube well/dug well
1.03 144.20 144.20 26.78 26.78 360.50 309.00 159.65 156.56 528.39 528.39 334.75 334.75 100.94 100.50 319.30 319.30 1974.51 1919.48
Community Tank/ Farm pond 17.25 69.00 69.00 172.50 172.40 138.00 138.00 379.50 379.40VIII. Protected Cultivation (Sqmt)I. Green House Structure 110.20 110.20 0 0 816 526 917 891 291 291 187 140 1128.50 837.62 461 0 3911 2797a. Naturally ventilated system 110.20 110.20 0 0 486 286 773 747 201 201 187 140 1091.00 800.20 406 0 3254 2285Tubular Structure 0.004675 65.45 65.45 486.34 286.34 710.60 687.23 201.03 201.03 187.00 140.25 1030.52 747.80 143.99 2824.92 2128.09Wooden structure 0.002575 15.45 15.45 25.75 23.18 41.20 38.63
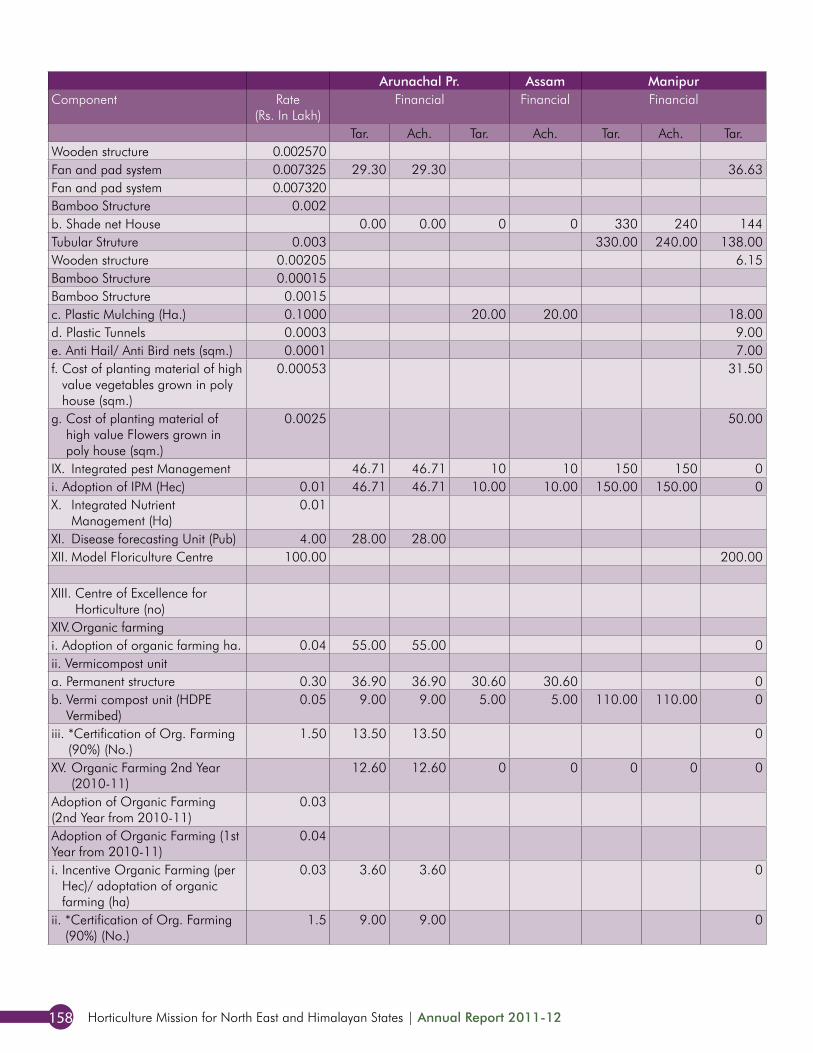
Horticulture Mission for North East and Himalayan States | Annual Report 2011-12158
Arunachal Pr. Assam Manipur Meghalaya Mizoram Nagaland Sikkim Tripura North EastComponent Rate
(Rs. In Lakh)Financial Financial Financial Financial Financial Financial Financial Financial Financial
Tar. Ach. Tar. Ach. Tar. Ach. Tar. Ach. Tar. Ach. Tar. Ach. Tar. Ach. Tar. Ach. Tar. Ach.Wooden structure 0.002570 74.53 74.53 0.00Fan and pad system 0.007325 29.30 29.30 36.63 36.63 65.93 65.93Fan and pad system 0.007320 111.26 111.26 0.00Bamboo Structure 0.002 60.48 52.40 75.94 136.42 52.40b. Shade net House 0.00 0.00 0 0 330 240 144 144 90 90 0 0 37.50 37.42 55 0 657 512Tubular Struture 0.003 330.00 240.00 138.00 138.00 90.00 90.00 33.00 591.00 468.00Wooden structure 0.00205 6.15 6.15 6.15 6.15Bamboo Structure 0.00015 0.00 0.00Bamboo Structure 0.0015 37.50 37.42 22.35 59.85 37.42c. Plastic Mulching (Ha.) 0.1000 20.00 20.00 18.00 18.00 24.00 24.00 15.50 15.45 7.50 85.00 77.45d. Plastic Tunnels 0.0003 9.00 9.00 0.90 0.89 2.78 12.68 9.89e. Anti Hail/ Anti Bird nets (sqm.) 0.0001 7.00 7.00 7.00 7.00f. Cost of planting material of high
value vegetables grown in poly house (sqm.)
0.00053 31.50 30.98 3.31 34.81 30.98
g. Cost of planting material of high value Flowers grown in poly house (sqm.)
0.0025 50.00 50.00 200.00 199.85 250.00 249.85
IX. Integrated pest Management 46.71 46.71 10 10 150 150 0 0 235 235 75 75 105.00 104.65 9 9 631 630i. Adoption of IPM (Hec) 0.01 46.71 46.71 10.00 10.00 150.00 150.00 0 235.00 235.00 75.10 75.10 105.00 104.65 8.78 8.78 630.59 630.24X. Integrated Nutrient
Management (Ha)0.01 88.00 88.00 88.00 88.00
XI. Disease forecasting Unit (Pub) 4.00 28.00 28.00 28.00 28.00XII. Model Floriculture Centre 100.00 200.00 200.00 200.00 200.00
XIII. Centre of Excellence for Horticulture (no)
182.00 182.00 182.00 182.00
XIV. Organic farmingi. Adoption of organic farming ha. 0.04 55.00 55.00 0 192.00 192.00 247.00 247.00ii. Vermicompost unita. Permanent structure 0.30 36.90 36.90 30.60 30.60 0 16.50 16.50 34.80 34.80 118.80 118.80b. Vermi compost unit (HDPE
Vermibed)0.05 9.00 9.00 5.00 5.00 110.00 110.00 0 10.00 10.00 44.60 44.60 178.60 178.60
iii. *Certification of Org. Farming (90%) (No.)
1.50 13.50 13.50 0 130.50 130.50 144.00 144.00
XV. Organic Farming 2nd Year (2010-11)
12.60 12.60 0 0 0 0 0 0 0 0 128 128 150.00 150.00 0 0 291 291
Adoption of Organic Farming (2nd Year from 2010-11)
0.03 33.00 33.00 150.00 150.00 183.00 183.00
Adoption of Organic Farming (1st Year from 2010-11)
0.04 80.00 80.00 0.00 80.00 80.00
i. Incentive Organic Farming (per Hec)/ adoptation of organic farming (ha)
0.03 3.60 3.60 0 0.00 0.00 0.00 0.00 3.60 3.60
ii. *Certification of Org. Farming (90%) (No.)
1.5 9.00 9.00 0 0.00 0.00 0.00 0.00 9.00 9.00
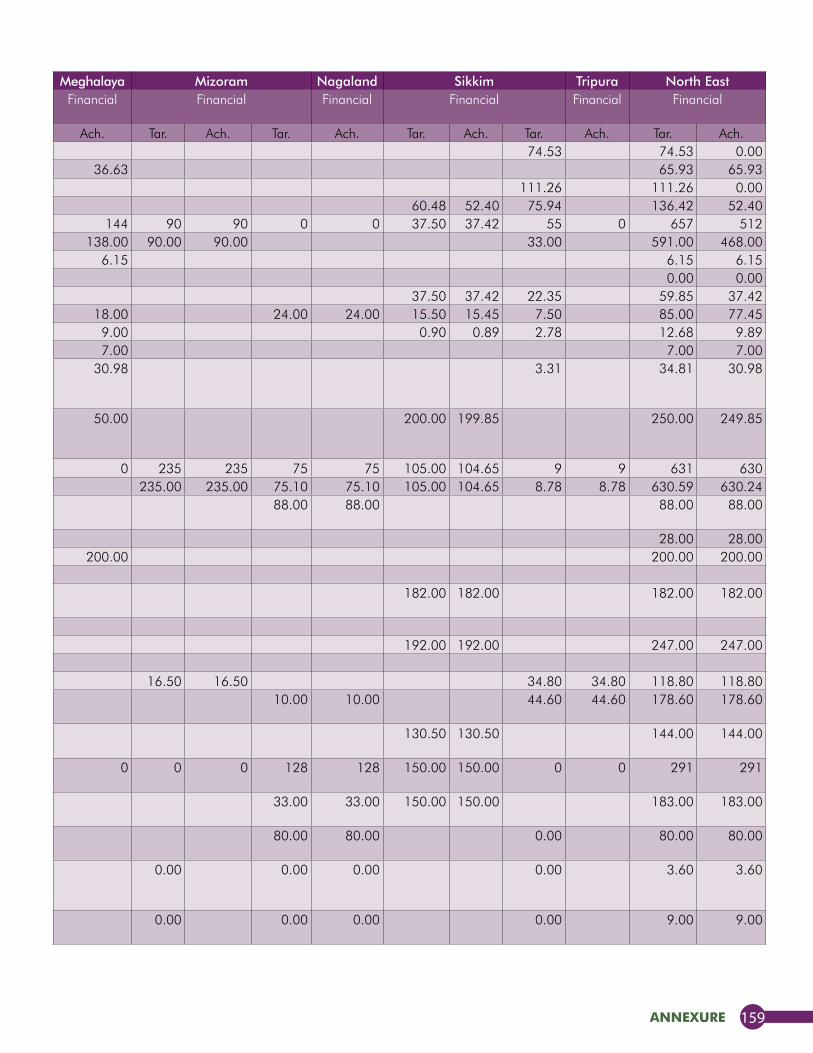
annexure 159
Arunachal Pr. Assam Manipur Meghalaya Mizoram Nagaland Sikkim Tripura North EastComponent Rate
(Rs. In Lakh)Financial Financial Financial Financial Financial Financial Financial Financial Financial
Tar. Ach. Tar. Ach. Tar. Ach. Tar. Ach. Tar. Ach. Tar. Ach. Tar. Ach. Tar. Ach. Tar. Ach.Wooden structure 0.002570 74.53 74.53 0.00Fan and pad system 0.007325 29.30 29.30 36.63 36.63 65.93 65.93Fan and pad system 0.007320 111.26 111.26 0.00Bamboo Structure 0.002 60.48 52.40 75.94 136.42 52.40b. Shade net House 0.00 0.00 0 0 330 240 144 144 90 90 0 0 37.50 37.42 55 0 657 512Tubular Struture 0.003 330.00 240.00 138.00 138.00 90.00 90.00 33.00 591.00 468.00Wooden structure 0.00205 6.15 6.15 6.15 6.15Bamboo Structure 0.00015 0.00 0.00Bamboo Structure 0.0015 37.50 37.42 22.35 59.85 37.42c. Plastic Mulching (Ha.) 0.1000 20.00 20.00 18.00 18.00 24.00 24.00 15.50 15.45 7.50 85.00 77.45d. Plastic Tunnels 0.0003 9.00 9.00 0.90 0.89 2.78 12.68 9.89e. Anti Hail/ Anti Bird nets (sqm.) 0.0001 7.00 7.00 7.00 7.00f. Cost of planting material of high
value vegetables grown in poly house (sqm.)
0.00053 31.50 30.98 3.31 34.81 30.98
g. Cost of planting material of high value Flowers grown in poly house (sqm.)
0.0025 50.00 50.00 200.00 199.85 250.00 249.85
IX. Integrated pest Management 46.71 46.71 10 10 150 150 0 0 235 235 75 75 105.00 104.65 9 9 631 630i. Adoption of IPM (Hec) 0.01 46.71 46.71 10.00 10.00 150.00 150.00 0 235.00 235.00 75.10 75.10 105.00 104.65 8.78 8.78 630.59 630.24X. Integrated Nutrient
Management (Ha)0.01 88.00 88.00 88.00 88.00
XI. Disease forecasting Unit (Pub) 4.00 28.00 28.00 28.00 28.00XII. Model Floriculture Centre 100.00 200.00 200.00 200.00 200.00
XIII. Centre of Excellence for Horticulture (no)
182.00 182.00 182.00 182.00
XIV. Organic farmingi. Adoption of organic farming ha. 0.04 55.00 55.00 0 192.00 192.00 247.00 247.00ii. Vermicompost unita. Permanent structure 0.30 36.90 36.90 30.60 30.60 0 16.50 16.50 34.80 34.80 118.80 118.80b. Vermi compost unit (HDPE
Vermibed)0.05 9.00 9.00 5.00 5.00 110.00 110.00 0 10.00 10.00 44.60 44.60 178.60 178.60
iii. *Certification of Org. Farming (90%) (No.)
1.50 13.50 13.50 0 130.50 130.50 144.00 144.00
XV. Organic Farming 2nd Year (2010-11)
12.60 12.60 0 0 0 0 0 0 0 0 128 128 150.00 150.00 0 0 291 291
Adoption of Organic Farming (2nd Year from 2010-11)
0.03 33.00 33.00 150.00 150.00 183.00 183.00
Adoption of Organic Farming (1st Year from 2010-11)
0.04 80.00 80.00 0.00 80.00 80.00
i. Incentive Organic Farming (per Hec)/ adoptation of organic farming (ha)
0.03 3.60 3.60 0 0.00 0.00 0.00 0.00 3.60 3.60
ii. *Certification of Org. Farming (90%) (No.)
1.5 9.00 9.00 0 0.00 0.00 0.00 0.00 9.00 9.00
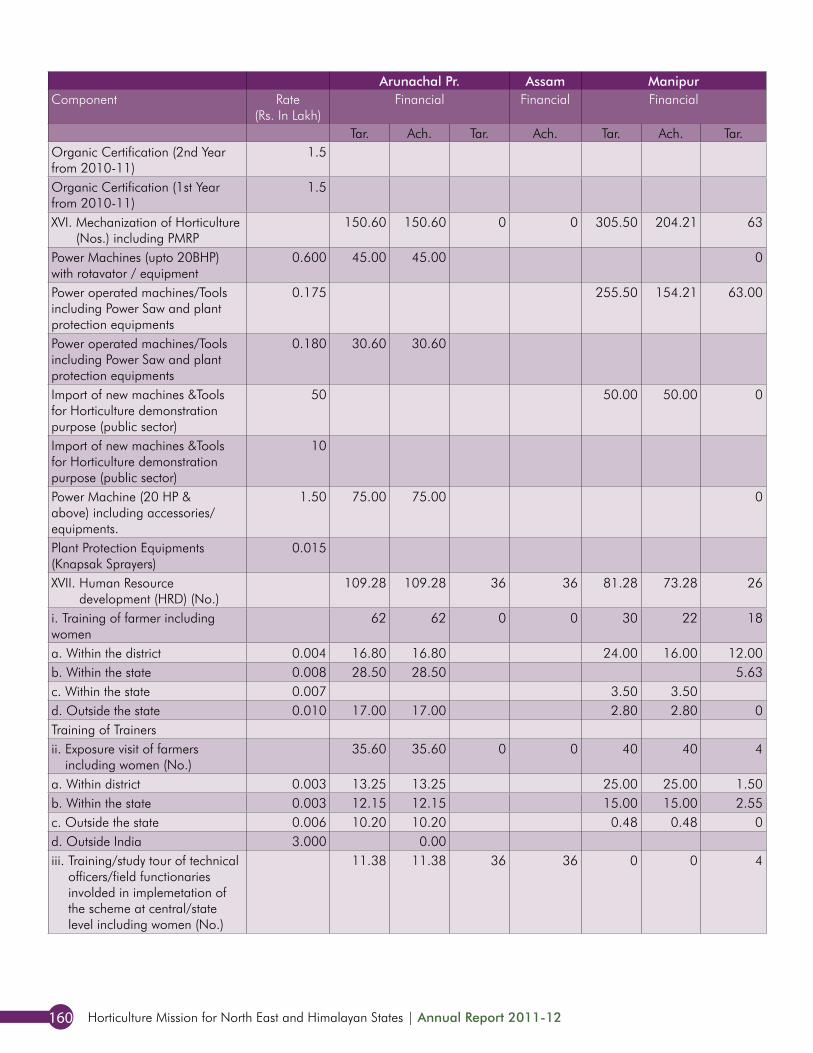
Horticulture Mission for North East and Himalayan States | Annual Report 2011-12160
Arunachal Pr. Assam Manipur Meghalaya Mizoram Nagaland Sikkim Tripura North EastComponent Rate
(Rs. In Lakh)Financial Financial Financial Financial Financial Financial Financial Financial Financial
Tar. Ach. Tar. Ach. Tar. Ach. Tar. Ach. Tar. Ach. Tar. Ach. Tar. Ach. Tar. Ach. Tar. Ach.Organic Certification (2nd Year from 2010-11)
1.5 7.50 7.50 0.00 7.50 7.50
Organic Certification (1st Year from 2010-11)
1.5 7.50 7.50 0.00 7.50 7.50
XVI. Mechanization of Horticulture (Nos.) including PMRP
150.60 150.60 0 0 305.50 204.21 63 63 107 107 207 207 27.50 27.30 24 24 883 782
Power Machines (upto 20BHP) with rotavator / equipment
0.600 45.00 45.00 0 60.00 60.00 45.00 45.00 0.00 150.00 150.00
Power operated machines/Tools including Power Saw and plant protection equipments
0.175 255.50 154.21 63.00 62.65 31.50 31.50 35.00 35.00 17.50 17.45 23.63 23.63 426.13 324.44
Power operated machines/Tools including Power Saw and plant protection equipments
0.180 30.60 30.60 30.60 30.60
Import of new machines &Tools for Horticulture demonstration purpose (public sector)
50 50.00 50.00 0 0.00 0.00 0.00 50.00 50.00
Import of new machines &Tools for Horticulture demonstration purpose (public sector)
10 10.00 9.85 0.00 10.00 9.85
Power Machine (20 HP & above) including accessories/ equipments.
1.50 75.00 75.00 0 15.00 15.00 97.50 97.50 0.00 187.50 187.50
Plant Protection Equipments (Knapsak Sprayers)
0.015 29.18 29.18 29.18 29.18
XVII. Human Resource development (HRD) (No.)
109.28 109.28 36 36 81.28 73.28 26 26 86 86 65 65 91.45 72.89 62 62 554 527
i. Training of farmer including women
62 62 0 0 30 22 18 18 0 0 36 36 53 35 53 53 252 226
a. Within the district 0.004 16.80 16.80 24.00 16.00 12.00 12.00 0.00 10.00 10.00 24.40 13.91 29.52 29.52 116.72 98.23b. Within the state 0.008 28.50 28.50 5.63 5.63 0.00 0.00 13.88 6.22 14.76 14.76 62.76 55.11c. Within the state 0.007 3.50 3.50 10.50 10.50 0.00 0.00 14.00 14.00d. Outside the state 0.010 17.00 17.00 2.80 2.80 0 0.00 15.00 15.00 15.00 14.90 8.61 8.61 58.41 58.31Training of Trainers 0.00 0.00ii. Exposure visit of farmers
including women (No.)35.60 35.60 0 0 40 40 4 4 36 36 11 11 31.02 30.76 9 9 165 164
a. Within district 0.003 13.25 13.25 25.00 25.00 1.50 1.50 9.00 9.00 3.00 3.00 8.52 8.50 2.46 2.46 62.73 62.71b. Within the state 0.003 12.15 12.15 15.00 15.00 2.55 2.55 12.00 12.00 3.60 3.60 10.50 10.40 1.48 1.48 57.28 57.18c. Outside the state 0.006 10.20 10.20 0.48 0.48 0 15.00 15.00 4.80 4.80 9.00 8.90 5.17 5.17 44.65 44.55d. Outside India 3.000 0.00 3.00 2.96iii. Training/study tour of technical
officers/field functionaries involded in implemetation of the scheme at central/state level including women (No.)
11.38 11.38 36 36 0 0 4 4 0 0 0 0 0.00 0.00 0 0 51 51
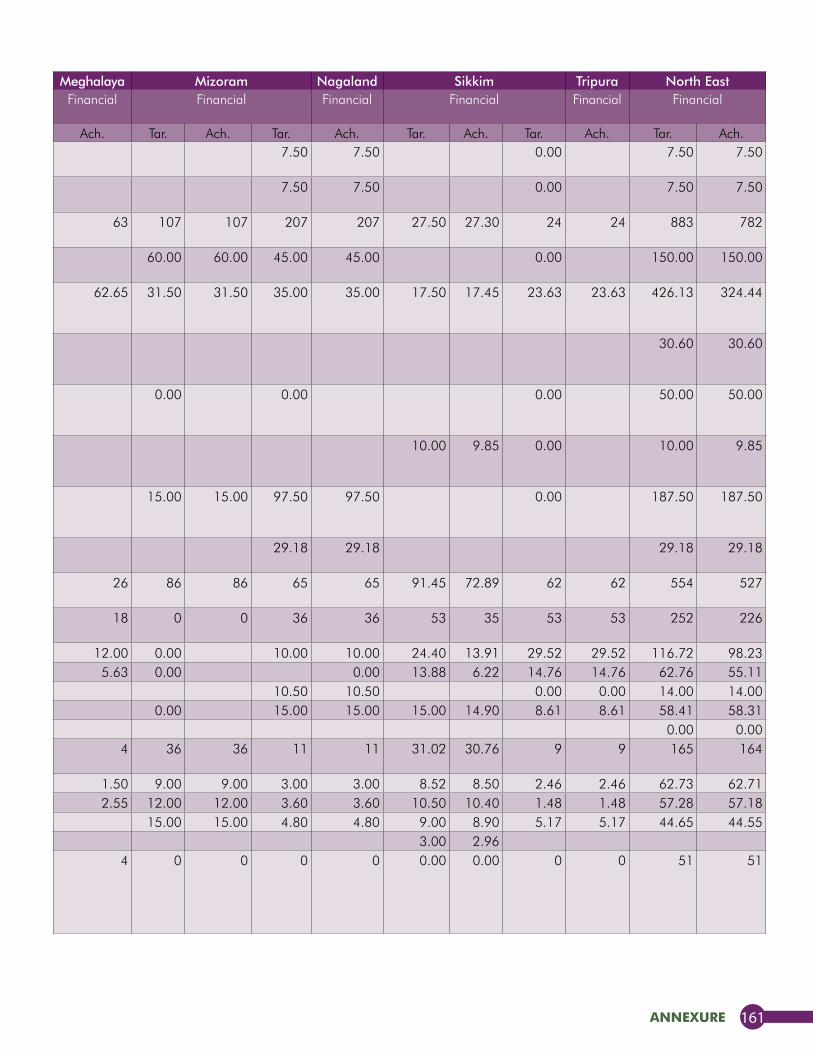
annexure 161
Arunachal Pr. Assam Manipur Meghalaya Mizoram Nagaland Sikkim Tripura North EastComponent Rate
(Rs. In Lakh)Financial Financial Financial Financial Financial Financial Financial Financial Financial
Tar. Ach. Tar. Ach. Tar. Ach. Tar. Ach. Tar. Ach. Tar. Ach. Tar. Ach. Tar. Ach. Tar. Ach.Organic Certification (2nd Year from 2010-11)
1.5 7.50 7.50 0.00 7.50 7.50
Organic Certification (1st Year from 2010-11)
1.5 7.50 7.50 0.00 7.50 7.50
XVI. Mechanization of Horticulture (Nos.) including PMRP
150.60 150.60 0 0 305.50 204.21 63 63 107 107 207 207 27.50 27.30 24 24 883 782
Power Machines (upto 20BHP) with rotavator / equipment
0.600 45.00 45.00 0 60.00 60.00 45.00 45.00 0.00 150.00 150.00
Power operated machines/Tools including Power Saw and plant protection equipments
0.175 255.50 154.21 63.00 62.65 31.50 31.50 35.00 35.00 17.50 17.45 23.63 23.63 426.13 324.44
Power operated machines/Tools including Power Saw and plant protection equipments
0.180 30.60 30.60 30.60 30.60
Import of new machines &Tools for Horticulture demonstration purpose (public sector)
50 50.00 50.00 0 0.00 0.00 0.00 50.00 50.00
Import of new machines &Tools for Horticulture demonstration purpose (public sector)
10 10.00 9.85 0.00 10.00 9.85
Power Machine (20 HP & above) including accessories/ equipments.
1.50 75.00 75.00 0 15.00 15.00 97.50 97.50 0.00 187.50 187.50
Plant Protection Equipments (Knapsak Sprayers)
0.015 29.18 29.18 29.18 29.18
XVII. Human Resource development (HRD) (No.)
109.28 109.28 36 36 81.28 73.28 26 26 86 86 65 65 91.45 72.89 62 62 554 527
i. Training of farmer including women
62 62 0 0 30 22 18 18 0 0 36 36 53 35 53 53 252 226
a. Within the district 0.004 16.80 16.80 24.00 16.00 12.00 12.00 0.00 10.00 10.00 24.40 13.91 29.52 29.52 116.72 98.23b. Within the state 0.008 28.50 28.50 5.63 5.63 0.00 0.00 13.88 6.22 14.76 14.76 62.76 55.11c. Within the state 0.007 3.50 3.50 10.50 10.50 0.00 0.00 14.00 14.00d. Outside the state 0.010 17.00 17.00 2.80 2.80 0 0.00 15.00 15.00 15.00 14.90 8.61 8.61 58.41 58.31Training of Trainers 0.00 0.00ii. Exposure visit of farmers
including women (No.)35.60 35.60 0 0 40 40 4 4 36 36 11 11 31.02 30.76 9 9 165 164
a. Within district 0.003 13.25 13.25 25.00 25.00 1.50 1.50 9.00 9.00 3.00 3.00 8.52 8.50 2.46 2.46 62.73 62.71b. Within the state 0.003 12.15 12.15 15.00 15.00 2.55 2.55 12.00 12.00 3.60 3.60 10.50 10.40 1.48 1.48 57.28 57.18c. Outside the state 0.006 10.20 10.20 0.48 0.48 0 15.00 15.00 4.80 4.80 9.00 8.90 5.17 5.17 44.65 44.55d. Outside India 3.000 0.00 3.00 2.96iii. Training/study tour of technical
officers/field functionaries involded in implemetation of the scheme at central/state level including women (No.)
11.38 11.38 36 36 0 0 4 4 0 0 0 0 0.00 0.00 0 0 51 51
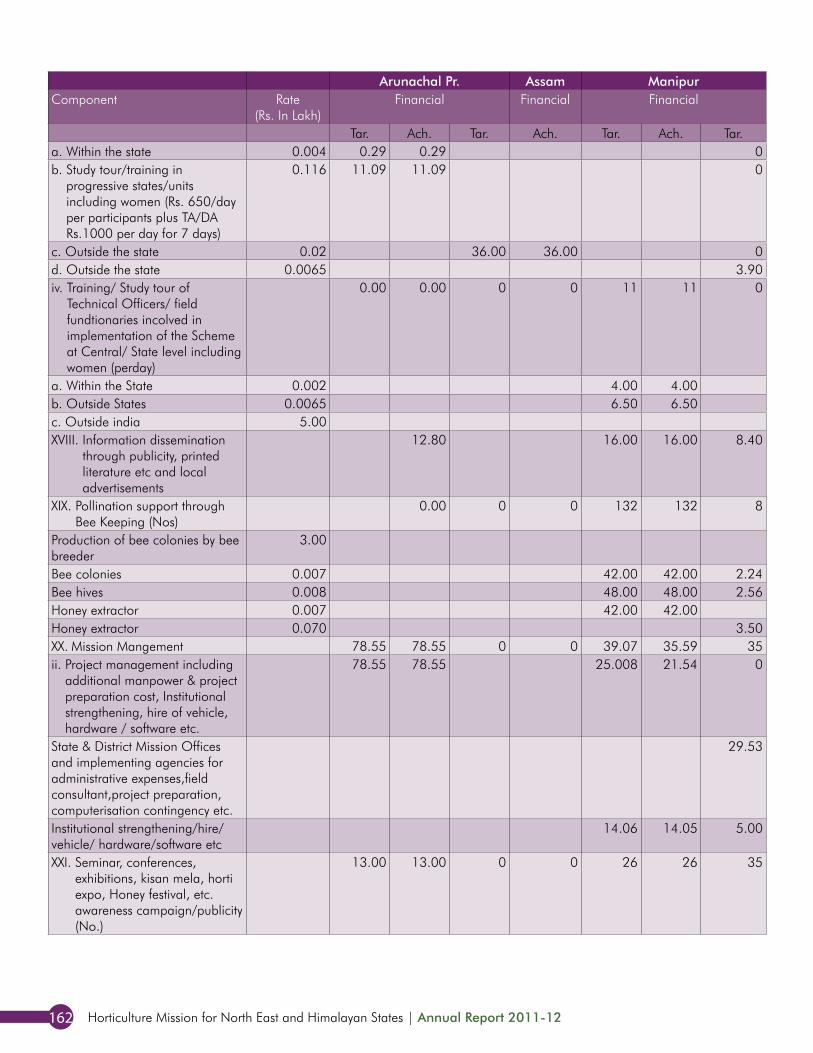
Horticulture Mission for North East and Himalayan States | Annual Report 2011-12162
Arunachal Pr. Assam Manipur Meghalaya Mizoram Nagaland Sikkim Tripura North EastComponent Rate
(Rs. In Lakh)Financial Financial Financial Financial Financial Financial Financial Financial Financial
Tar. Ach. Tar. Ach. Tar. Ach. Tar. Ach. Tar. Ach. Tar. Ach. Tar. Ach. Tar. Ach. Tar. Ach.a. Within the state 0.004 0.29 0.29 0 0.00 0.00 0.00 0.29 0.29b. Study tour/training in
progressive states/units including women (Rs. 650/day per participants plus TA/DA Rs.1000 per day for 7 days)
0.116 11.09 11.09 0 0.00 0.00 0.00 11.09 11.09
c. Outside the state 0.02 36.00 36.00 0 0.00 0.00 0.00 36.00 36.00d. Outside the state 0.0065 3.90 3.90 0.00 0.00 0.00 3.90 3.90iv. Training/ Study tour of
Technical Officers/ field fundtionaries incolved in implementation of the Scheme at Central/ State level including women (perday)
0.00 0.00 0 0 11 11 0 0 50 50 19 19 7.15 7.10 0 0 86 86
a. Within the State 0.002 4.00 4.00 10.00 10.00 1.60 1.60 0.00 15.60 15.60b. Outside States 0.0065 6.50 6.50 19.50 19.50 1.95 1.95 7.15 7.10 0.00 35.10 35.05c. Outside india 5.00 20.00 20.00 15.00 15.00 0.00 35.00 35.00XVIII. Information dissemination
through publicity, printed literature etc and local advertisements
12.80 16.00 16.00 8.40 8.40 30.00 30.00 10.00 10.00 12.40 12.10 0.00 89.60 89.30
XIX. Pollination support through Bee Keeping (Nos)
0.00 0 0 132 132 8 8 81 81 23 23 27.20 27.02 0 0 271 271
Production of bee colonies by bee breeder
3.00 9.00 8.97 0.00 9.00 8.97
Bee colonies 0.007 42.00 42.00 2.24 2.24 28.00 28.00 10.50 10.50 9.10 9.05 0.00 91.84 91.79Bee hives 0.008 48.00 48.00 2.56 2.56 32.00 32.00 12.00 12.00 0.00 94.56 94.56Honey extractor 0.007 42.00 42.00 0.00 0.00 0.00 42.00 42.00Honey extractor 0.070 3.50 3.50 21.00 21.00 0.00 9.10 9.00 0.00 33.60 33.50XX. Mission Mangement 78.55 78.55 0 0 39.07 35.59 35 34 143 127 49 49 65.10 61.25 46 20 455 406ii. Project management including
additional manpower & project preparation cost, Institutional strengthening, hire of vehicle, hardware / software etc.
78.55 78.55 25.008 21.54 0 0.00 49.19 49.19 65.10 61.25 45.83 20.00 263.68 230.53
State & District Mission Offices and implementing agencies for administrative expenses,field consultant,project preparation, computerisation contingency etc.
29.53 29.43 100.00 89.35 0.00 0.00 129.53 118.78
Institutional strengthening/hire/ vehicle/ hardware/software etc
14.06 14.05 5.00 5.00 43.05 37.97 0.00 0.00 62.11 57.02
XXI. Seminar, conferences, exhibitions, kisan mela, horti expo, Honey festival, etc. awareness campaign/publicity (No.)
13.00 13.00 0 0 26 26 35 35 19 19 16 16 30.00 29.85 14 11 153 150
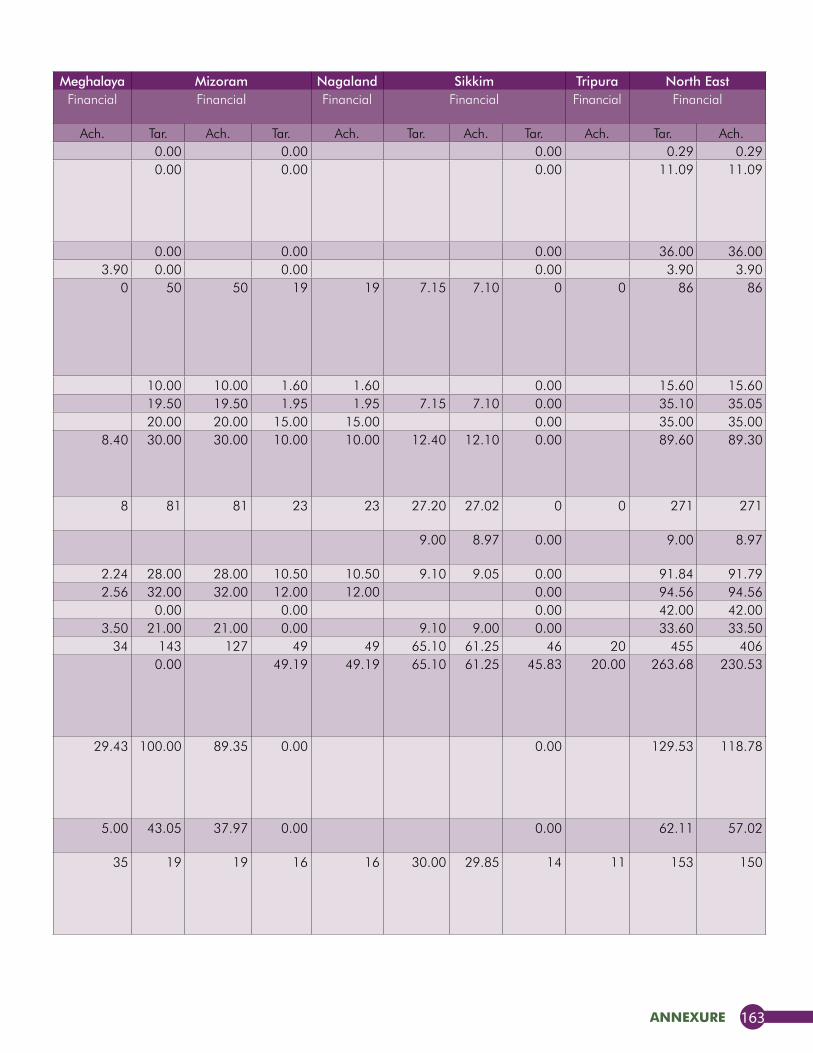
annexure 163
Arunachal Pr. Assam Manipur Meghalaya Mizoram Nagaland Sikkim Tripura North EastComponent Rate
(Rs. In Lakh)Financial Financial Financial Financial Financial Financial Financial Financial Financial
Tar. Ach. Tar. Ach. Tar. Ach. Tar. Ach. Tar. Ach. Tar. Ach. Tar. Ach. Tar. Ach. Tar. Ach.a. Within the state 0.004 0.29 0.29 0 0.00 0.00 0.00 0.29 0.29b. Study tour/training in
progressive states/units including women (Rs. 650/day per participants plus TA/DA Rs.1000 per day for 7 days)
0.116 11.09 11.09 0 0.00 0.00 0.00 11.09 11.09
c. Outside the state 0.02 36.00 36.00 0 0.00 0.00 0.00 36.00 36.00d. Outside the state 0.0065 3.90 3.90 0.00 0.00 0.00 3.90 3.90iv. Training/ Study tour of
Technical Officers/ field fundtionaries incolved in implementation of the Scheme at Central/ State level including women (perday)
0.00 0.00 0 0 11 11 0 0 50 50 19 19 7.15 7.10 0 0 86 86
a. Within the State 0.002 4.00 4.00 10.00 10.00 1.60 1.60 0.00 15.60 15.60b. Outside States 0.0065 6.50 6.50 19.50 19.50 1.95 1.95 7.15 7.10 0.00 35.10 35.05c. Outside india 5.00 20.00 20.00 15.00 15.00 0.00 35.00 35.00XVIII. Information dissemination
through publicity, printed literature etc and local advertisements
12.80 16.00 16.00 8.40 8.40 30.00 30.00 10.00 10.00 12.40 12.10 0.00 89.60 89.30
XIX. Pollination support through Bee Keeping (Nos)
0.00 0 0 132 132 8 8 81 81 23 23 27.20 27.02 0 0 271 271
Production of bee colonies by bee breeder
3.00 9.00 8.97 0.00 9.00 8.97
Bee colonies 0.007 42.00 42.00 2.24 2.24 28.00 28.00 10.50 10.50 9.10 9.05 0.00 91.84 91.79Bee hives 0.008 48.00 48.00 2.56 2.56 32.00 32.00 12.00 12.00 0.00 94.56 94.56Honey extractor 0.007 42.00 42.00 0.00 0.00 0.00 42.00 42.00Honey extractor 0.070 3.50 3.50 21.00 21.00 0.00 9.10 9.00 0.00 33.60 33.50XX. Mission Mangement 78.55 78.55 0 0 39.07 35.59 35 34 143 127 49 49 65.10 61.25 46 20 455 406ii. Project management including
additional manpower & project preparation cost, Institutional strengthening, hire of vehicle, hardware / software etc.
78.55 78.55 25.008 21.54 0 0.00 49.19 49.19 65.10 61.25 45.83 20.00 263.68 230.53
State & District Mission Offices and implementing agencies for administrative expenses,field consultant,project preparation, computerisation contingency etc.
29.53 29.43 100.00 89.35 0.00 0.00 129.53 118.78
Institutional strengthening/hire/ vehicle/ hardware/software etc
14.06 14.05 5.00 5.00 43.05 37.97 0.00 0.00 62.11 57.02
XXI. Seminar, conferences, exhibitions, kisan mela, horti expo, Honey festival, etc. awareness campaign/publicity (No.)
13.00 13.00 0 0 26 26 35 35 19 19 16 16 30.00 29.85 14 11 153 150
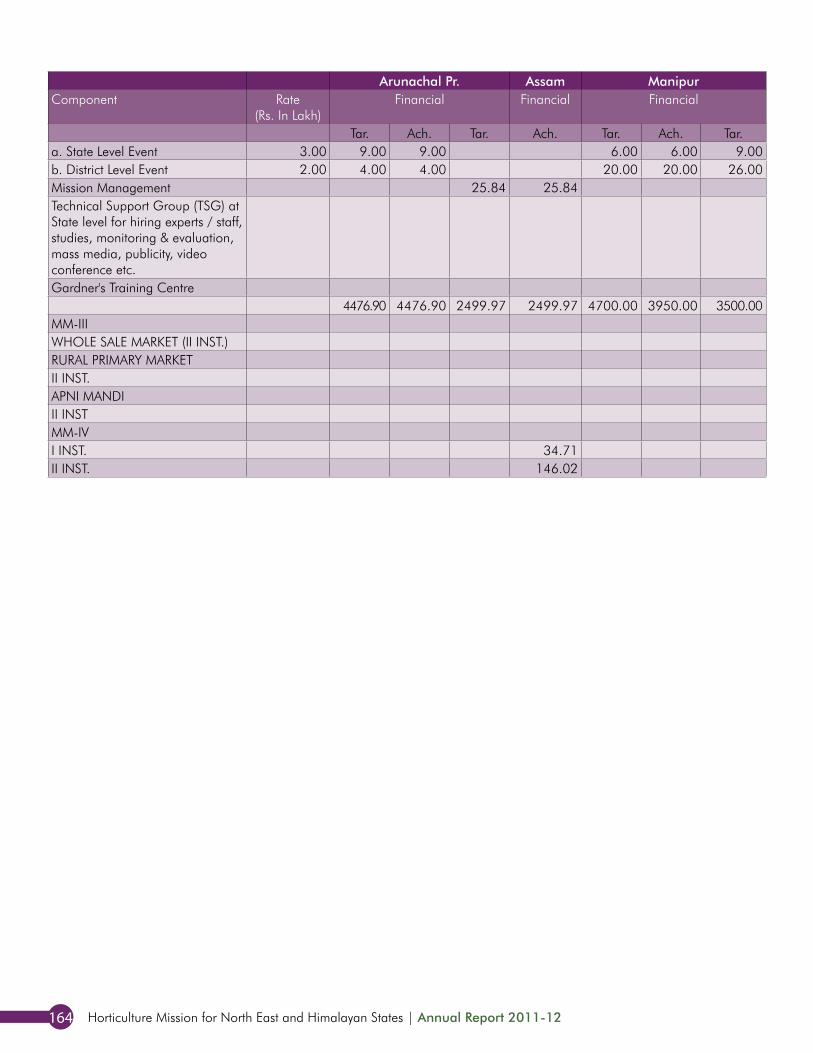
Horticulture Mission for North East and Himalayan States | Annual Report 2011-12164
Arunachal Pr. Assam Manipur Meghalaya Mizoram Nagaland Sikkim Tripura North EastComponent Rate
(Rs. In Lakh)Financial Financial Financial Financial Financial Financial Financial Financial Financial
Tar. Ach. Tar. Ach. Tar. Ach. Tar. Ach. Tar. Ach. Tar. Ach. Tar. Ach. Tar. Ach. Tar. Ach.a. State Level Event 3.00 9.00 9.00 6.00 6.00 9.00 9.00 3.00 3.00 6.00 6.00 18.00 17.90 6.00 5.00 57.00 55.90b. District Level Event 2.00 4.00 4.00 20.00 20.00 26.00 26.00 16.00 16.00 10.00 10.00 12.00 11.95 8.00 6.00 96.00 93.95Mission Management 25.84 25.84Technical Support Group (TSG) at State level for hiring experts / staff, studies, monitoring & evaluation, mass media, publicity, video conference etc.Gardner's Training Centre
4476.90 4476.90 2499.97 2499.97 4700.00 3950.00 3500.00 3444.50 4000.00 3950.52 4586.25 4477.00 4250.99 3929.39 4000.03 3454.66 31985.29 30154.13MM-IIIWHOLE SALE MARKET (II INST.)RURAL PRIMARY MARKETII INST. 48.75 30.00 78.75APNI MANDIII INST 3.75 3.75MM-IV I INST. 34.71 14.11 48.82II INST. 146.02 0.00 146.02
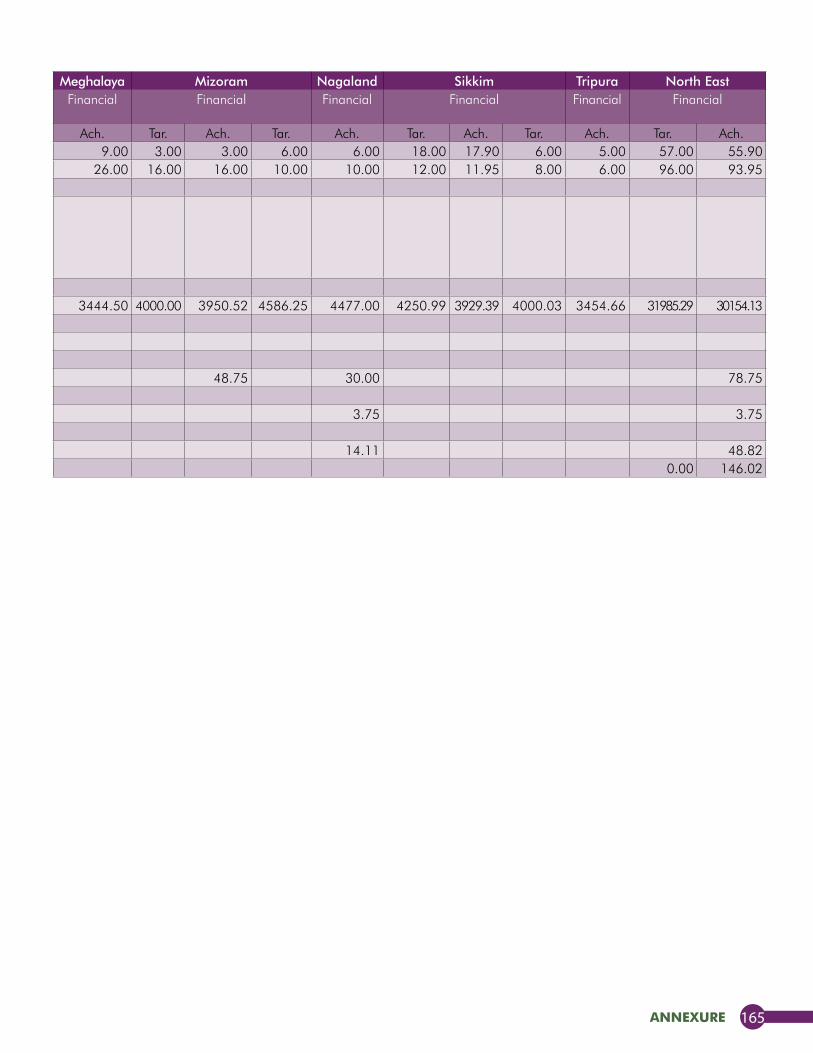
annexure 165
Arunachal Pr. Assam Manipur Meghalaya Mizoram Nagaland Sikkim Tripura North EastComponent Rate
(Rs. In Lakh)Financial Financial Financial Financial Financial Financial Financial Financial Financial
Tar. Ach. Tar. Ach. Tar. Ach. Tar. Ach. Tar. Ach. Tar. Ach. Tar. Ach. Tar. Ach. Tar. Ach.a. State Level Event 3.00 9.00 9.00 6.00 6.00 9.00 9.00 3.00 3.00 6.00 6.00 18.00 17.90 6.00 5.00 57.00 55.90b. District Level Event 2.00 4.00 4.00 20.00 20.00 26.00 26.00 16.00 16.00 10.00 10.00 12.00 11.95 8.00 6.00 96.00 93.95Mission Management 25.84 25.84Technical Support Group (TSG) at State level for hiring experts / staff, studies, monitoring & evaluation, mass media, publicity, video conference etc.Gardner's Training Centre
4476.90 4476.90 2499.97 2499.97 4700.00 3950.00 3500.00 3444.50 4000.00 3950.52 4586.25 4477.00 4250.99 3929.39 4000.03 3454.66 31985.29 30154.13MM-IIIWHOLE SALE MARKET (II INST.)RURAL PRIMARY MARKETII INST. 48.75 30.00 78.75APNI MANDIII INST 3.75 3.75MM-IV I INST. 34.71 14.11 48.82II INST. 146.02 0.00 146.02
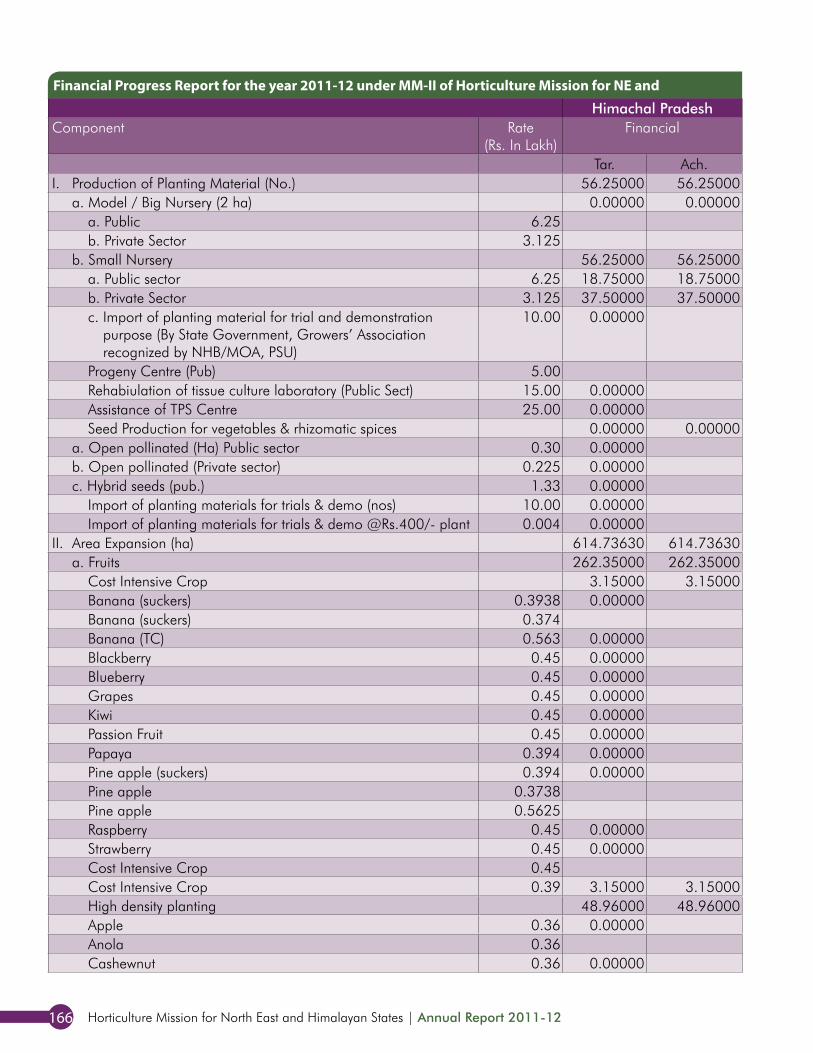
Horticulture Mission for North East and Himalayan States | Annual Report 2011-12166
Himachal Pradesh Jammu & Kashmir Uttarakhand Himalayan States Total NER + HSComponent Rate
(Rs. In Lakh)Financial Financial Financial Financial Financial
Tar. Ach. Tar. Ach. Tar. Ach. Tar. Ach. Tar. Ach.I. Production of Planting Material (No.) 56.25000 56.25000 56.25 25.00 12.500 193.500 125 275 1034.38 1082.13
a. Model / Big Nursery (2 ha) 0.00000 0.00000 12.50 18.75 12.500 144.000 25 163 550.00 587.75a. Public 6.25 12.50 18.75 144.000 12.5 162.75 487.50 537.75b. Private Sector 3.125 0.00 12.500 12.5 0 62.50 50.00
b. Small Nursery 56.25000 56.25000 43.75 6.25 49.500 100 112 484.38 494.38a. Public sector 6.25 18.75000 18.75000 25.00 42.000 43.75 60.75 231.25 248.25b. Private Sector 3.125 37.50000 37.50000 18.75 6.25 7.500 56.25 51.25 253.13 246.13c. Import of planting material for trial and demonstration
purpose (By State Government, Growers’ Association recognized by NHB/MOA, PSU)
10.00 0.00000 0.00 0 0 50.00 50.00
Progeny Centre (Pub) 5.00 5.00 5 0 5.00 0.00Rehabiulation of tissue culture laboratory (Public Sect) 15.00 0.00000 0.00 0 0 30.00 30.00Assistance of TPS Centre 25.00 0.00000 0.00 0 0 25.00 25.00Seed Production for vegetables & rhizomatic spices 0.00000 0.00000 9 9 0.900 0.250 10 9 22 21
a. Open pollinated (Ha) Public sector 0.30 0.00000 7.80 7.80 0.900 0.250 8.7 8.05 16.80 16.15b. Open pollinated (Private sector) 0.225 0.00000 0.00 0 0 3.83 3.84c. Hybrid seeds (pub.) 1.33 0.00000 1.33 1.33 1.33 1.33 1.33 1.33
Import of planting materials for trials & demo (nos) 10.00 0.00000 0.00 0 0 50.00 49.85Import of planting materials for trials & demo @Rs.400/- plant 0.004 0.00000 10.00 10 0 10.00 0.00
II. Area Expansion (ha) 614.73630 614.73630 890.52 840.79 1579.04 1079.887 3084 2535 17327.62 16646.94a. Fruits 262.35000 262.35000 754.90 715.86 772.380 650.922 1790 1629 7856.25 7692.54
Cost Intensive Crop 3.15000 3.15000 57.60 0.00 0.000 0.000 61 3 3909.41 3848.71Banana (suckers) 0.3938 0.00000 0.00 0 0 596.54 596.54Banana (suckers) 0.374 0 0 242.94 242.94Banana (TC) 0.563 0.00000 0.00 0 0 347.07 347.06Blackberry 0.45 0.00000 0.00 0 0 18.00 18.00Blueberry 0.45 0.00000 0.00 0 0 18.00 18.00Grapes 0.45 0.00000 0.00 0 0 157.50 157.50Kiwi 0.45 0.00000 0.00 0 0 353.25 353.20Passion Fruit 0.45 0.00000 0.00 0 0 405.00 405.00Papaya 0.394 0.00000 0.00 0 0 129.94 126.90Pine apple (suckers) 0.394 0.00000 0.00 0 0 799.32 799.32Pine apple 0.3738 0 0 341.23 341.23Pine apple 0.5625 0 0 331.88 331.88Raspberry 0.45 0.00000 0.00 0 0 18.00 18.00Strawberry 0.45 0.00000 0.00 0 0 90.00 90.00Cost Intensive Crop 0.45 57.60 57.6 0 57.60 0.00Cost Intensive Crop 0.39 3.15000 3.15000 3.15 3.15 3.15 3.15High density planting 48.96000 48.96000 53.98 54.00 693.720 583.100 797 686 2144.86 2034.18Apple 0.36 0.00000 0.00 198.000 156.070 198 156.07 261.00 219.04Anola 0.36 46.440 43.750 46.44 43.75 46.44 43.75Cashewnut 0.36 0.00000 0.00 0 0 57.60 57.60
Financial Progress Report for the year 2011-12 under MM-II of Horticulture Mission for NE and
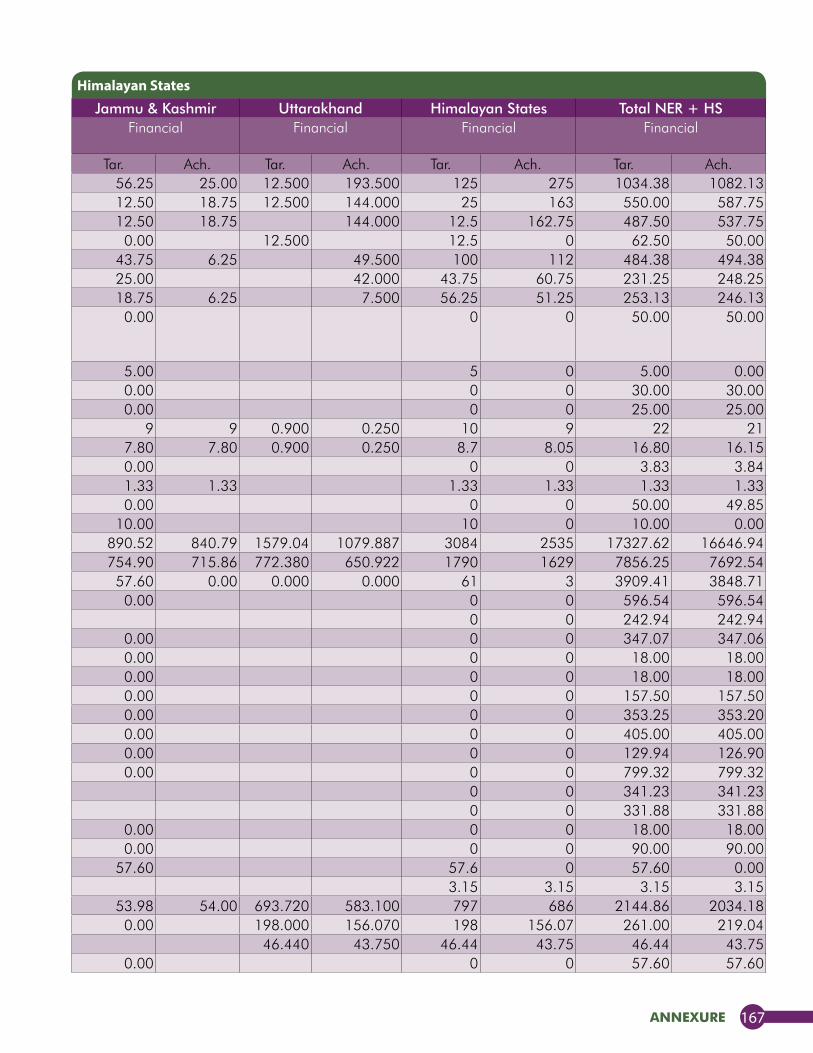
annexure 167
Himachal Pradesh Jammu & Kashmir Uttarakhand Himalayan States Total NER + HSComponent Rate
(Rs. In Lakh)Financial Financial Financial Financial Financial
Tar. Ach. Tar. Ach. Tar. Ach. Tar. Ach. Tar. Ach.I. Production of Planting Material (No.) 56.25000 56.25000 56.25 25.00 12.500 193.500 125 275 1034.38 1082.13
a. Model / Big Nursery (2 ha) 0.00000 0.00000 12.50 18.75 12.500 144.000 25 163 550.00 587.75a. Public 6.25 12.50 18.75 144.000 12.5 162.75 487.50 537.75b. Private Sector 3.125 0.00 12.500 12.5 0 62.50 50.00
b. Small Nursery 56.25000 56.25000 43.75 6.25 49.500 100 112 484.38 494.38a. Public sector 6.25 18.75000 18.75000 25.00 42.000 43.75 60.75 231.25 248.25b. Private Sector 3.125 37.50000 37.50000 18.75 6.25 7.500 56.25 51.25 253.13 246.13c. Import of planting material for trial and demonstration
purpose (By State Government, Growers’ Association recognized by NHB/MOA, PSU)
10.00 0.00000 0.00 0 0 50.00 50.00
Progeny Centre (Pub) 5.00 5.00 5 0 5.00 0.00Rehabiulation of tissue culture laboratory (Public Sect) 15.00 0.00000 0.00 0 0 30.00 30.00Assistance of TPS Centre 25.00 0.00000 0.00 0 0 25.00 25.00Seed Production for vegetables & rhizomatic spices 0.00000 0.00000 9 9 0.900 0.250 10 9 22 21
a. Open pollinated (Ha) Public sector 0.30 0.00000 7.80 7.80 0.900 0.250 8.7 8.05 16.80 16.15b. Open pollinated (Private sector) 0.225 0.00000 0.00 0 0 3.83 3.84c. Hybrid seeds (pub.) 1.33 0.00000 1.33 1.33 1.33 1.33 1.33 1.33
Import of planting materials for trials & demo (nos) 10.00 0.00000 0.00 0 0 50.00 49.85Import of planting materials for trials & demo @Rs.400/- plant 0.004 0.00000 10.00 10 0 10.00 0.00
II. Area Expansion (ha) 614.73630 614.73630 890.52 840.79 1579.04 1079.887 3084 2535 17327.62 16646.94a. Fruits 262.35000 262.35000 754.90 715.86 772.380 650.922 1790 1629 7856.25 7692.54
Cost Intensive Crop 3.15000 3.15000 57.60 0.00 0.000 0.000 61 3 3909.41 3848.71Banana (suckers) 0.3938 0.00000 0.00 0 0 596.54 596.54Banana (suckers) 0.374 0 0 242.94 242.94Banana (TC) 0.563 0.00000 0.00 0 0 347.07 347.06Blackberry 0.45 0.00000 0.00 0 0 18.00 18.00Blueberry 0.45 0.00000 0.00 0 0 18.00 18.00Grapes 0.45 0.00000 0.00 0 0 157.50 157.50Kiwi 0.45 0.00000 0.00 0 0 353.25 353.20Passion Fruit 0.45 0.00000 0.00 0 0 405.00 405.00Papaya 0.394 0.00000 0.00 0 0 129.94 126.90Pine apple (suckers) 0.394 0.00000 0.00 0 0 799.32 799.32Pine apple 0.3738 0 0 341.23 341.23Pine apple 0.5625 0 0 331.88 331.88Raspberry 0.45 0.00000 0.00 0 0 18.00 18.00Strawberry 0.45 0.00000 0.00 0 0 90.00 90.00Cost Intensive Crop 0.45 57.60 57.6 0 57.60 0.00Cost Intensive Crop 0.39 3.15000 3.15000 3.15 3.15 3.15 3.15High density planting 48.96000 48.96000 53.98 54.00 693.720 583.100 797 686 2144.86 2034.18Apple 0.36 0.00000 0.00 198.000 156.070 198 156.07 261.00 219.04Anola 0.36 46.440 43.750 46.44 43.75 46.44 43.75Cashewnut 0.36 0.00000 0.00 0 0 57.60 57.60
Himalayan States
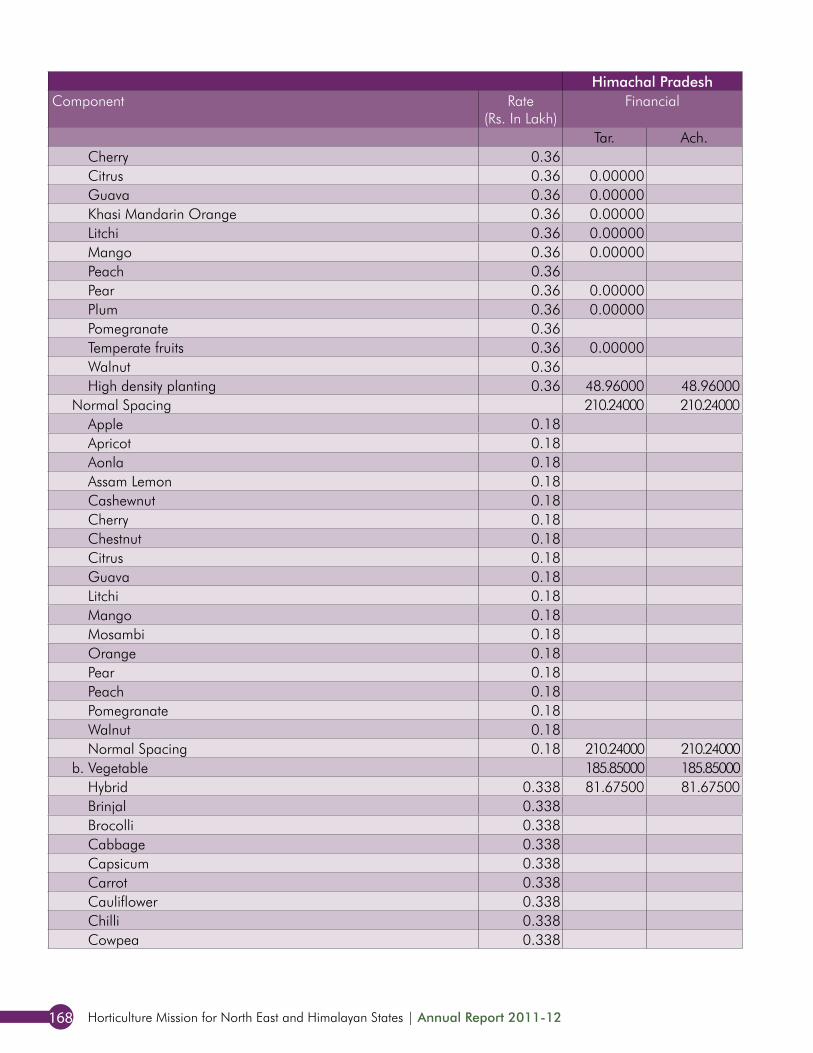
Horticulture Mission for North East and Himalayan States | Annual Report 2011-12168
Himachal Pradesh Jammu & Kashmir Uttarakhand Himalayan States Total NER + HSComponent Rate
(Rs. In Lakh)Financial Financial Financial Financial Financial
Tar. Ach. Tar. Ach. Tar. Ach. Tar. Ach. Tar. Ach.Cherry 0.36 0 0 0.00 0.00Citrus 0.36 0.00000 0.00 65.520 67.190 65.52 67.19 321.12 322.79Guava 0.36 0.00000 0.00 69.840 67.280 69.84 67.28 176.04 173.43Khasi Mandarin Orange 0.36 0.00000 0.00 0 0 334.80 334.80Litchi 0.36 0.00000 0.00 54.000 51.510 54 51.51 130.32 127.83Mango 0.36 0.00000 0.00 186.120 167.920 186.12 167.92 456.12 437.92Peach 0.36 46.080 12.580 46.08 12.58 46.08 12.58Pear 0.36 0.00000 0.00 5.040 3.300 5.04 3.3 59.04 57.30Plum 0.36 0.00000 0.00 5.400 0.860 5.4 0.86 76.68 72.14Pomegranate 0.36 17.280 12.640 17.28 12.64 17.28 12.64Temperate fruits 0.36 0.00000 0.00 0 0 59.40 59.40Walnut 0.36 0 0 0.00 0.00High density planting 0.36 48.96000 48.96000 53.98 54.00 102.94 102.96 102.94 102.96
Normal Spacing 210.24000 210.24000 643.32 661.86 78.660 67.822 932 940 1801.98 1809.65Apple 0.18 0.00 10.800 9.538 10.8 9.538 75.60 74.34Apricot 0.18 2.700 0.734 2.7 0.734 2.70 0.73Aonla 0.18 3.060 2.976 3.06 2.976 3.06 2.98Assam Lemon 0.18 0.00 0 0 144.00 144.00Cashewnut 0.18 0.00 0 0 62.10 62.10Cherry 0.18 0.00 0 0 9.00 9.00Chestnut 0.18 0.00 0 0 9.00 9.00Citrus 0.18 12.600 12.975 12.6 12.975 12.60 12.98Guava 0.18 0.00 8.100 4.679 8.1 4.679 30.60 27.16Litchi 0.18 5.400 3.902 5.4 3.902 23.76 22.25Mango 0.18 5.400 5.281 5.4 5.281 5.40 5.28Mosambi 0.18 0.00 0 0 16.20 16.20Orange 0.18 0.00 0 0 514.80 514.80Pear 0.18 8.640 6.010 8.64 6.01 8.64 6.01Peach 0.18 14.400 9.081 14.4 9.081 14.40 9.08Pomegranate 0.18 2.700 1.928 2.7 1.928 2.70 1.93Walnut 0.18 0.00 4.860 10.718 4.86 10.718 13.86 19.72Normal Spacing 0.18 210.24000 210.24000 643.32 661.86 853.56 872.1 853.56 872.10
b. Vegetable 185.85000 185.85000 96.30 96.30 397.800 246.565 679.95 528.72 4372.99 4221.68Hybrid 0.338 81.67500 81.67500 57.38 57.38 139.05 139.05 584.55 584.50Brinjal 0.338 0.00 0 0 60.75 60.75Brocolli 0.338 0.00 0 0 37.13 37.13Cabbage 0.338 0.00 47.250 30.925 47.25 30.925 440.44 424.11Capsicum 0.338 0.00 47.250 25.477 47.25 25.477 172.13 150.35Carrot 0.338 0.00 0 0 72.23 72.23Cauliflower 0.338 0.00 47.250 31.496 47.25 31.496 302.06 286.31Chilli 0.338 0.00 0 0 27.00 27.00Cowpea 0.338 0.00 0 0 77.63 77.63
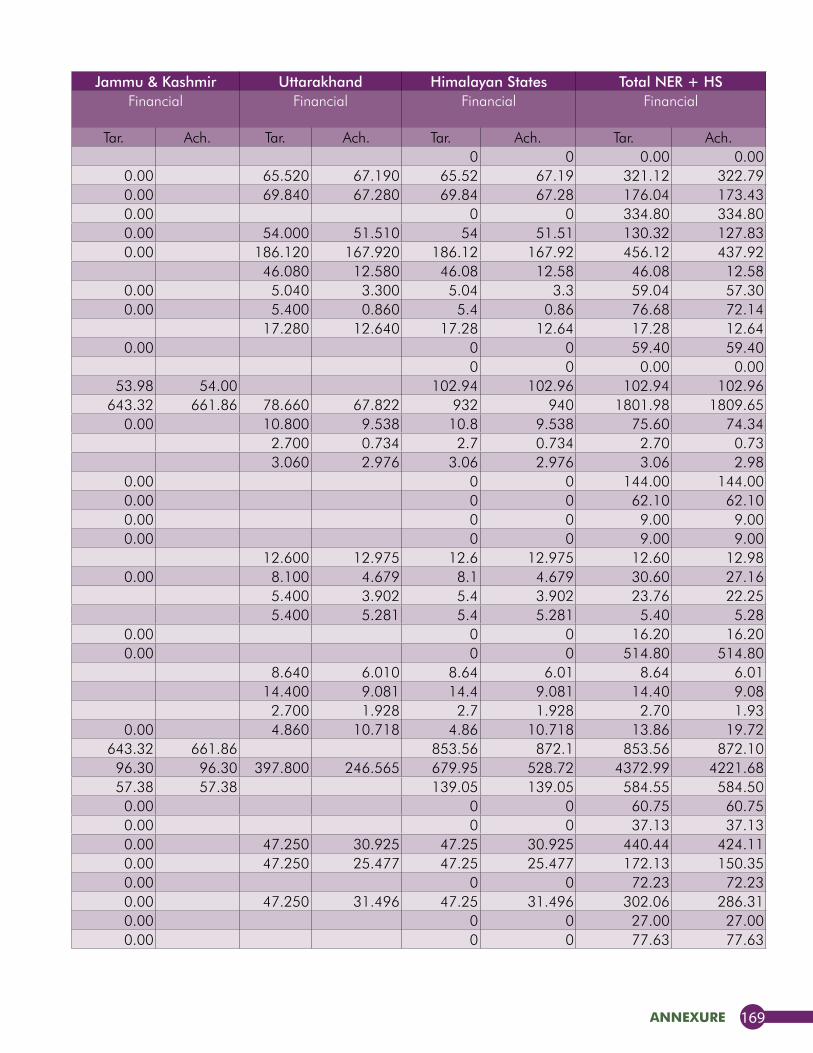
annexure 169
Himachal Pradesh Jammu & Kashmir Uttarakhand Himalayan States Total NER + HSComponent Rate
(Rs. In Lakh)Financial Financial Financial Financial Financial
Tar. Ach. Tar. Ach. Tar. Ach. Tar. Ach. Tar. Ach.Cherry 0.36 0 0 0.00 0.00Citrus 0.36 0.00000 0.00 65.520 67.190 65.52 67.19 321.12 322.79Guava 0.36 0.00000 0.00 69.840 67.280 69.84 67.28 176.04 173.43Khasi Mandarin Orange 0.36 0.00000 0.00 0 0 334.80 334.80Litchi 0.36 0.00000 0.00 54.000 51.510 54 51.51 130.32 127.83Mango 0.36 0.00000 0.00 186.120 167.920 186.12 167.92 456.12 437.92Peach 0.36 46.080 12.580 46.08 12.58 46.08 12.58Pear 0.36 0.00000 0.00 5.040 3.300 5.04 3.3 59.04 57.30Plum 0.36 0.00000 0.00 5.400 0.860 5.4 0.86 76.68 72.14Pomegranate 0.36 17.280 12.640 17.28 12.64 17.28 12.64Temperate fruits 0.36 0.00000 0.00 0 0 59.40 59.40Walnut 0.36 0 0 0.00 0.00High density planting 0.36 48.96000 48.96000 53.98 54.00 102.94 102.96 102.94 102.96
Normal Spacing 210.24000 210.24000 643.32 661.86 78.660 67.822 932 940 1801.98 1809.65Apple 0.18 0.00 10.800 9.538 10.8 9.538 75.60 74.34Apricot 0.18 2.700 0.734 2.7 0.734 2.70 0.73Aonla 0.18 3.060 2.976 3.06 2.976 3.06 2.98Assam Lemon 0.18 0.00 0 0 144.00 144.00Cashewnut 0.18 0.00 0 0 62.10 62.10Cherry 0.18 0.00 0 0 9.00 9.00Chestnut 0.18 0.00 0 0 9.00 9.00Citrus 0.18 12.600 12.975 12.6 12.975 12.60 12.98Guava 0.18 0.00 8.100 4.679 8.1 4.679 30.60 27.16Litchi 0.18 5.400 3.902 5.4 3.902 23.76 22.25Mango 0.18 5.400 5.281 5.4 5.281 5.40 5.28Mosambi 0.18 0.00 0 0 16.20 16.20Orange 0.18 0.00 0 0 514.80 514.80Pear 0.18 8.640 6.010 8.64 6.01 8.64 6.01Peach 0.18 14.400 9.081 14.4 9.081 14.40 9.08Pomegranate 0.18 2.700 1.928 2.7 1.928 2.70 1.93Walnut 0.18 0.00 4.860 10.718 4.86 10.718 13.86 19.72Normal Spacing 0.18 210.24000 210.24000 643.32 661.86 853.56 872.1 853.56 872.10
b. Vegetable 185.85000 185.85000 96.30 96.30 397.800 246.565 679.95 528.72 4372.99 4221.68Hybrid 0.338 81.67500 81.67500 57.38 57.38 139.05 139.05 584.55 584.50Brinjal 0.338 0.00 0 0 60.75 60.75Brocolli 0.338 0.00 0 0 37.13 37.13Cabbage 0.338 0.00 47.250 30.925 47.25 30.925 440.44 424.11Capsicum 0.338 0.00 47.250 25.477 47.25 25.477 172.13 150.35Carrot 0.338 0.00 0 0 72.23 72.23Cauliflower 0.338 0.00 47.250 31.496 47.25 31.496 302.06 286.31Chilli 0.338 0.00 0 0 27.00 27.00Cowpea 0.338 0.00 0 0 77.63 77.63
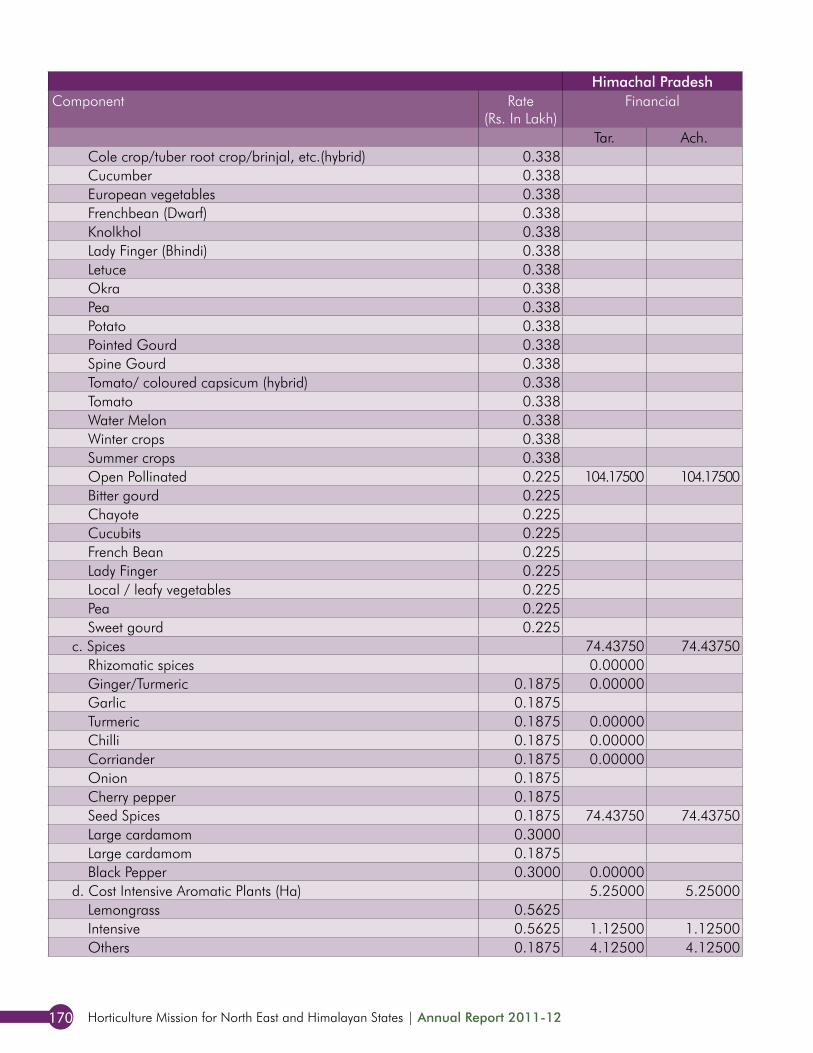
Horticulture Mission for North East and Himalayan States | Annual Report 2011-12170
Himachal Pradesh Jammu & Kashmir Uttarakhand Himalayan States Total NER + HSComponent Rate
(Rs. In Lakh)Financial Financial Financial Financial Financial
Tar. Ach. Tar. Ach. Tar. Ach. Tar. Ach. Tar. Ach.Cole crop/tuber root crop/brinjal, etc.(hybrid) 0.338 0.00 0 0 521.44 521.44Cucumber 0.338 0.00 0 0 13.50 13.50European vegetables 0.338 16.875 8.595 16.875 8.595 16.88 8.60Frenchbean (Dwarf) 0.338 0.00 0 0 47.25 47.25Knolkhol 0.338 0.00 0 0 27.00 27.00Lady Finger (Bhindi) 0.338 0.00 0 0 121.50 121.50Letuce 0.338 0.00 0 0 20.25 20.25Okra 0.338 0.00 0 0 57.38 57.38Pea 0.338 0.00 0 0 30.38 30.38Potato 0.338 0.00 0 0 197.44 197.44Pointed Gourd 0.338 0.00 0 0 25.31 25.31Spine Gourd 0.338 0.00 0 0 21.94 21.94Tomato/ coloured capsicum (hybrid) 0.338 0.00 0 0 133.31 133.31Tomato 0.338 0.00 67.500 43.720 67.5 43.72 310.51 286.73Water Melon 0.338 0.00 0 0 67.50 67.50Winter crops 0.338 0.00 0 0 168.75 168.75Summer crops 0.338 0.00 0 0 168.75 168.75Open Pollinated 0.225 104.17500 104.17500 38.93 38.93 143.1 143.1 361.35 361.32Bitter gourd 0.225 0.00 0 0 24.75 24.75Chayote 0.225 0.00 0 0 81.00 81.00Cucubits 0.225 2.250 0.260 2.25 0.26 2.25 0.26French Bean 0.225 33.750 14.240 33.75 14.24 33.75 14.24Lady Finger 0.225 16.875 11.231 16.875 11.231 16.88 11.23Local / leafy vegetables 0.225 6.300 3.547 6.3 3.547 6.30 3.55Pea 0.225 112.500 77.074 112.5 77.074 112.50 77.07Sweet gourd 0.225 0.00 0 0 11.25 11.25
c. Spices 74.43750 74.43750 6.00 6.00 261.000 92.265 341 173 3106.88 2919.98Rhizomatic spices 0.00000 0.00 0 0 0.00 0.00Ginger/Turmeric 0.1875 0.00000 0.00 107.063 29.598 107.0625 29.598 1172.44 1094.94Garlic 0.1875 54.375 2.813 54.375 2.8125 54.38 2.81Turmeric 0.1875 0.00000 0.00 48.375 25.550 48.375 25.55 498.38 475.53Chilli 0.1875 0.00000 0.00 51.188 34.304 51.1875 34.304 399.94 383.05Corriander 0.1875 0.00000 0.00 0 0 11.63 11.63Onion 0.1875 0.00 0 0 75.00 75.00Cherry pepper 0.1875 0.00 0 0 50.63 50.60Seed Spices 0.1875 74.43750 74.43750 6.00 6.00 80.4375 80.4375 80.44 80.44Large cardamom 0.3000 0 0 345.00 345.00Large cardamom 0.1875 0.00 0 0 171.56 171.48Black Pepper 0.3000 0.00000 0.00 0 0 247.50 229.50
d. Cost Intensive Aromatic Plants (Ha) 5.25000 5.25000 10.69 0.00 0.000 0.000 16 5 100.31 89.63Lemongrass 0.5625 0.00 0 0 84.38 84.38Intensive 0.5625 1.12500 1.12500 0.00 1.125 1.125 1.13 1.13Others 0.1875 4.12500 4.12500 10.69 14.8106 4.125 14.81 4.13
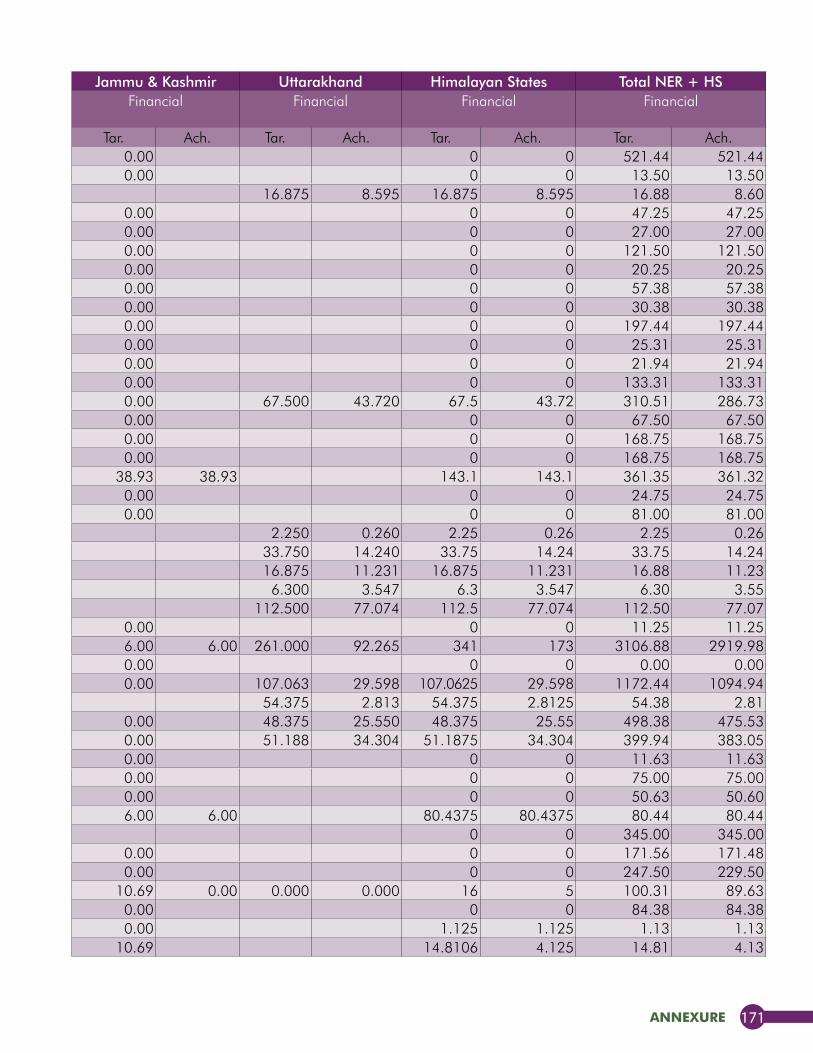
annexure 171
Himachal Pradesh Jammu & Kashmir Uttarakhand Himalayan States Total NER + HSComponent Rate
(Rs. In Lakh)Financial Financial Financial Financial Financial
Tar. Ach. Tar. Ach. Tar. Ach. Tar. Ach. Tar. Ach.Cole crop/tuber root crop/brinjal, etc.(hybrid) 0.338 0.00 0 0 521.44 521.44Cucumber 0.338 0.00 0 0 13.50 13.50European vegetables 0.338 16.875 8.595 16.875 8.595 16.88 8.60Frenchbean (Dwarf) 0.338 0.00 0 0 47.25 47.25Knolkhol 0.338 0.00 0 0 27.00 27.00Lady Finger (Bhindi) 0.338 0.00 0 0 121.50 121.50Letuce 0.338 0.00 0 0 20.25 20.25Okra 0.338 0.00 0 0 57.38 57.38Pea 0.338 0.00 0 0 30.38 30.38Potato 0.338 0.00 0 0 197.44 197.44Pointed Gourd 0.338 0.00 0 0 25.31 25.31Spine Gourd 0.338 0.00 0 0 21.94 21.94Tomato/ coloured capsicum (hybrid) 0.338 0.00 0 0 133.31 133.31Tomato 0.338 0.00 67.500 43.720 67.5 43.72 310.51 286.73Water Melon 0.338 0.00 0 0 67.50 67.50Winter crops 0.338 0.00 0 0 168.75 168.75Summer crops 0.338 0.00 0 0 168.75 168.75Open Pollinated 0.225 104.17500 104.17500 38.93 38.93 143.1 143.1 361.35 361.32Bitter gourd 0.225 0.00 0 0 24.75 24.75Chayote 0.225 0.00 0 0 81.00 81.00Cucubits 0.225 2.250 0.260 2.25 0.26 2.25 0.26French Bean 0.225 33.750 14.240 33.75 14.24 33.75 14.24Lady Finger 0.225 16.875 11.231 16.875 11.231 16.88 11.23Local / leafy vegetables 0.225 6.300 3.547 6.3 3.547 6.30 3.55Pea 0.225 112.500 77.074 112.5 77.074 112.50 77.07Sweet gourd 0.225 0.00 0 0 11.25 11.25
c. Spices 74.43750 74.43750 6.00 6.00 261.000 92.265 341 173 3106.88 2919.98Rhizomatic spices 0.00000 0.00 0 0 0.00 0.00Ginger/Turmeric 0.1875 0.00000 0.00 107.063 29.598 107.0625 29.598 1172.44 1094.94Garlic 0.1875 54.375 2.813 54.375 2.8125 54.38 2.81Turmeric 0.1875 0.00000 0.00 48.375 25.550 48.375 25.55 498.38 475.53Chilli 0.1875 0.00000 0.00 51.188 34.304 51.1875 34.304 399.94 383.05Corriander 0.1875 0.00000 0.00 0 0 11.63 11.63Onion 0.1875 0.00 0 0 75.00 75.00Cherry pepper 0.1875 0.00 0 0 50.63 50.60Seed Spices 0.1875 74.43750 74.43750 6.00 6.00 80.4375 80.4375 80.44 80.44Large cardamom 0.3000 0 0 345.00 345.00Large cardamom 0.1875 0.00 0 0 171.56 171.48Black Pepper 0.3000 0.00000 0.00 0 0 247.50 229.50
d. Cost Intensive Aromatic Plants (Ha) 5.25000 5.25000 10.69 0.00 0.000 0.000 16 5 100.31 89.63Lemongrass 0.5625 0.00 0 0 84.38 84.38Intensive 0.5625 1.12500 1.12500 0.00 1.125 1.125 1.13 1.13Others 0.1875 4.12500 4.12500 10.69 14.8106 4.125 14.81 4.13
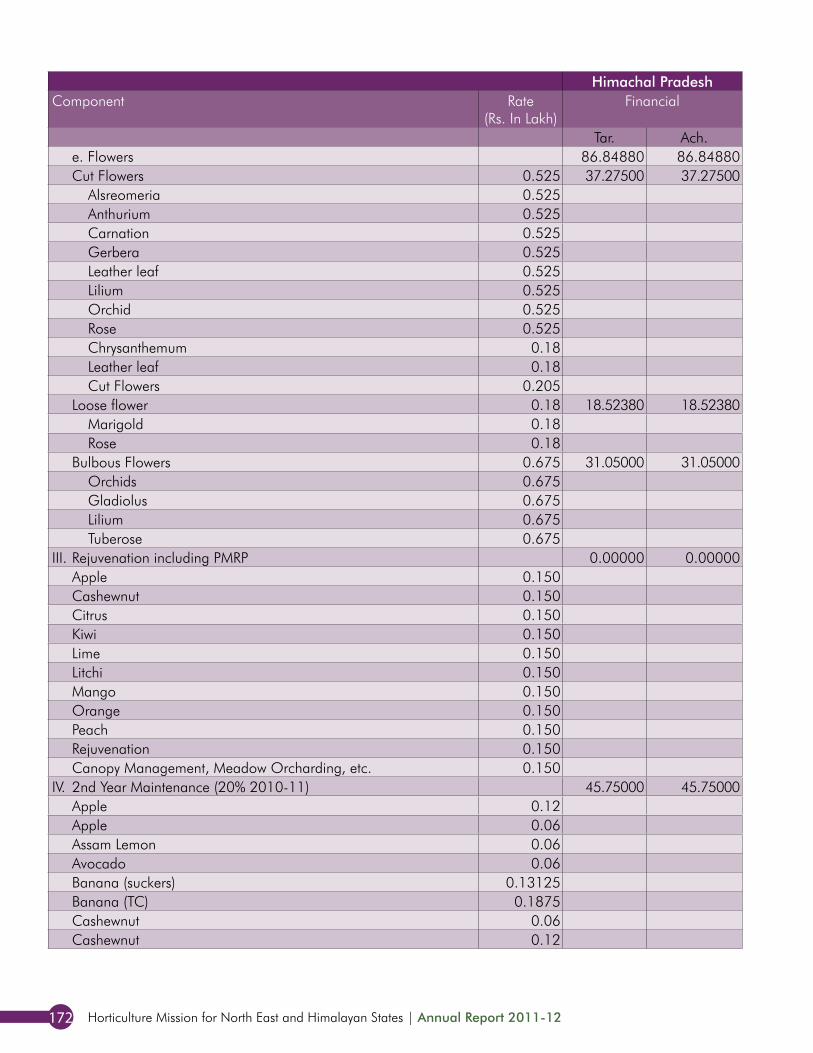
Horticulture Mission for North East and Himalayan States | Annual Report 2011-12172
Himachal Pradesh Jammu & Kashmir Uttarakhand Himalayan States Total NER + HSComponent Rate
(Rs. In Lakh)Financial Financial Financial Financial Financial
Tar. Ach. Tar. Ach. Tar. Ach. Tar. Ach. Tar. Ach.e. Flowers 86.84880 86.84880 22.63 22.63 147.855 90.135 257.33 199.61 1891.19 1723.12Cut Flowers 0.525 37.27500 37.27500 0.00 37.275 37.275 268.28 267.93
Alsreomeria 0.525 0.00 0 0 131.25 131.25Anthurium 0.525 0.00 0 0 218.93 216.30Carnation 0.525 0.00 0 0 100.80 100.80Gerbera 0.525 0.00 15.750 1.420 15.75 1.42 219.45 128.97Leather leaf 0.525 0.00 0 0 105.00 105.00Lilium 0.525 0.00 0 0 144.38 144.38Orchid 0.525 0.00 0 0 139.13 139.13Rose 0.525 0.00 14.700 16.830 14.7 16.83 130.20 132.33Chrysanthemum 0.18 0.00 0 0 5.40 5.04Leather leaf 0.18 0.00 0 0 14.40 14.40Cut Flowers 0.205 12.51 12.51 12.505 12.505 12.51 12.51
Loose flower 0.18 18.52380 18.52380 2.70 2.70 21.2238 21.2238 68.02 37.24Marigold 0.18 0.00 31.680 3.640 31.68 3.64 34.38 6.34Rose 0.18 0.00 0 0 14.22 14.22
Bulbous Flowers 0.675 31.05000 31.05000 7.43 7.43 38.475 38.475 136.36 136.28Orchids 0.675 0.00 0.675 0.675 0 17.56 16.88Gladiolus 0.675 0.00 81.675 64.870 81.675 64.87 91.80 75.00Lilium 0.675 0.00 3.375 3.375 3.375 3.375 23.63 23.63Tuberose 0.675 0.00 0 0 15.53 15.53
III. Rejuvenation including PMRP 0.00000 0.00000 247.50 0.00 58.350 183.070 305.85 183.07 1761.45 1469.12Apple 0.150 0.00 21.600 63.770 21.6 63.77 66.60 108.77Cashewnut 0.150 0.00 0 0 21.00 21.00Citrus 0.150 0.00 6.750 19.770 6.75 19.77 111.75 124.77Kiwi 0.150 0.00 0 0 52.50 52.50Lime 0.150 0.00 0 0 37.50 37.50Litchi 0.150 7.500 18.010 7.5 18.01 7.50 18.01Mango 0.150 17.400 77.810 17.4 77.81 17.40 77.81Orange 0.150 0 0 895.80 726.25Peach 0.150 5.100 3.710 5.1 3.71 5.10 3.71Rejuvenation 0.150 247.50 247.5 0 510.00 262.50Canopy Management, Meadow Orcharding, etc. 0.150 0 0 36.30 36.30
IV. 2nd Year Maintenance (20% 2010-11) 45.75000 45.75000 251 78 68.400 109.070 365 233 2519 2358Apple 0.12 0 0 18.00 17.95Apple 0.06 0 0 12.90 12.90Assam Lemon 0.06 0 0 70.56 70.56Avocado 0.06 0 0 1.50 1.50Banana (suckers) 0.13125 0 0 233.36 233.35Banana (TC) 0.1875 0 0 140.44 140.44Cashewnut 0.06 0 0 44.64 44.64Cashewnut 0.12 0 0 19.50 19.50
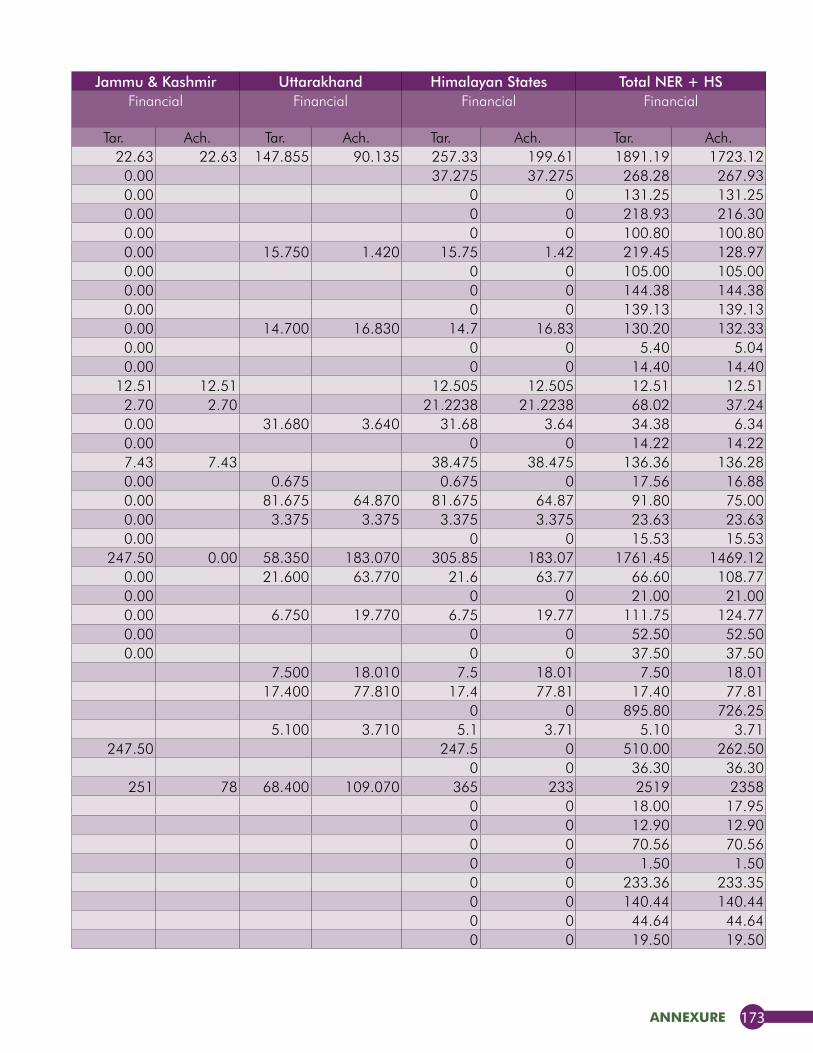
annexure 173
Himachal Pradesh Jammu & Kashmir Uttarakhand Himalayan States Total NER + HSComponent Rate
(Rs. In Lakh)Financial Financial Financial Financial Financial
Tar. Ach. Tar. Ach. Tar. Ach. Tar. Ach. Tar. Ach.e. Flowers 86.84880 86.84880 22.63 22.63 147.855 90.135 257.33 199.61 1891.19 1723.12Cut Flowers 0.525 37.27500 37.27500 0.00 37.275 37.275 268.28 267.93
Alsreomeria 0.525 0.00 0 0 131.25 131.25Anthurium 0.525 0.00 0 0 218.93 216.30Carnation 0.525 0.00 0 0 100.80 100.80Gerbera 0.525 0.00 15.750 1.420 15.75 1.42 219.45 128.97Leather leaf 0.525 0.00 0 0 105.00 105.00Lilium 0.525 0.00 0 0 144.38 144.38Orchid 0.525 0.00 0 0 139.13 139.13Rose 0.525 0.00 14.700 16.830 14.7 16.83 130.20 132.33Chrysanthemum 0.18 0.00 0 0 5.40 5.04Leather leaf 0.18 0.00 0 0 14.40 14.40Cut Flowers 0.205 12.51 12.51 12.505 12.505 12.51 12.51
Loose flower 0.18 18.52380 18.52380 2.70 2.70 21.2238 21.2238 68.02 37.24Marigold 0.18 0.00 31.680 3.640 31.68 3.64 34.38 6.34Rose 0.18 0.00 0 0 14.22 14.22
Bulbous Flowers 0.675 31.05000 31.05000 7.43 7.43 38.475 38.475 136.36 136.28Orchids 0.675 0.00 0.675 0.675 0 17.56 16.88Gladiolus 0.675 0.00 81.675 64.870 81.675 64.87 91.80 75.00Lilium 0.675 0.00 3.375 3.375 3.375 3.375 23.63 23.63Tuberose 0.675 0.00 0 0 15.53 15.53
III. Rejuvenation including PMRP 0.00000 0.00000 247.50 0.00 58.350 183.070 305.85 183.07 1761.45 1469.12Apple 0.150 0.00 21.600 63.770 21.6 63.77 66.60 108.77Cashewnut 0.150 0.00 0 0 21.00 21.00Citrus 0.150 0.00 6.750 19.770 6.75 19.77 111.75 124.77Kiwi 0.150 0.00 0 0 52.50 52.50Lime 0.150 0.00 0 0 37.50 37.50Litchi 0.150 7.500 18.010 7.5 18.01 7.50 18.01Mango 0.150 17.400 77.810 17.4 77.81 17.40 77.81Orange 0.150 0 0 895.80 726.25Peach 0.150 5.100 3.710 5.1 3.71 5.10 3.71Rejuvenation 0.150 247.50 247.5 0 510.00 262.50Canopy Management, Meadow Orcharding, etc. 0.150 0 0 36.30 36.30
IV. 2nd Year Maintenance (20% 2010-11) 45.75000 45.75000 251 78 68.400 109.070 365 233 2519 2358Apple 0.12 0 0 18.00 17.95Apple 0.06 0 0 12.90 12.90Assam Lemon 0.06 0 0 70.56 70.56Avocado 0.06 0 0 1.50 1.50Banana (suckers) 0.13125 0 0 233.36 233.35Banana (TC) 0.1875 0 0 140.44 140.44Cashewnut 0.06 0 0 44.64 44.64Cashewnut 0.12 0 0 19.50 19.50
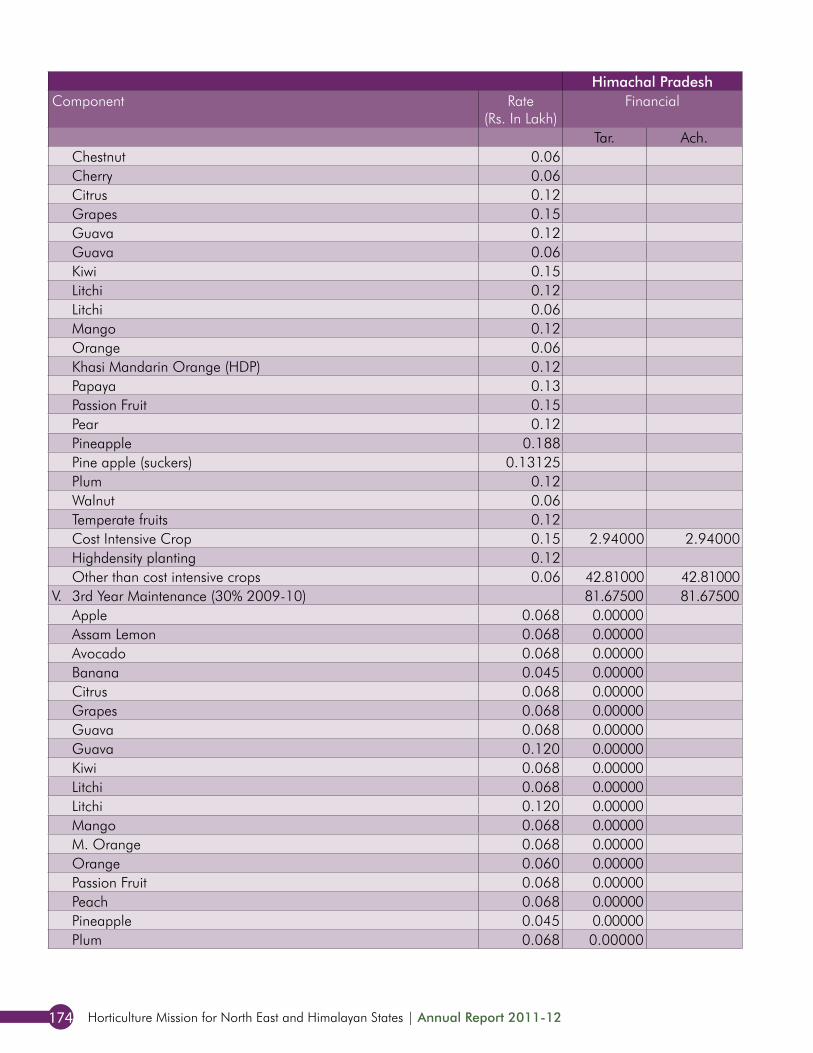
Horticulture Mission for North East and Himalayan States | Annual Report 2011-12174
Himachal Pradesh Jammu & Kashmir Uttarakhand Himalayan States Total NER + HSComponent Rate
(Rs. In Lakh)Financial Financial Financial Financial Financial
Tar. Ach. Tar. Ach. Tar. Ach. Tar. Ach. Tar. Ach.Chestnut 0.06 0 0 2.70 2.70Cherry 0.06 0 0 1.62 1.62Citrus 0.12 0 0 165.00 165.00Grapes 0.15 0 0 31.50 31.50Guava 0.12 0 0 42.00 42.00Guava 0.06 0 0 10.80 10.75Kiwi 0.15 0 0 62.25 62.24Litchi 0.12 0 0 45.00 45.00Litchi 0.06 0 0 11.28 11.25Mango 0.12 0 0 17.40 17.40Orange 0.06 0 0 234.00 234.00Khasi Mandarin Orange (HDP) 0.12 0 0 182.64 182.64Papaya 0.13 0 0 24.28 24.28Passion Fruit 0.15 0 0 123.00 123.00Pear 0.12 0 0 10.20 10.20Pineapple 0.188 0 0 328.13 328.13Pine apple (suckers) 0.13125 0 0 151.07 151.07Plum 0.12 0 0 10.80 10.80Walnut 0.06 0 0 2.70 2.70Temperate fruits 0.12 0 0 14.40 14.40Cost Intensive Crop 0.15 2.94000 2.94000 75.00 0.00 68.400 109.070 146.34 112.01 288.39 225.81Highdensity planting 0.12 0 0 0.00 0.00Other than cost intensive crops 0.06 42.81000 42.81000 175.98 78.36 218.79 121.17 218.79 121.17
V. 3rd Year Maintenance (30% 2009-10) 81.67500 81.67500 162.95 88.22 23.018 9.670 268 180 1950.80 1828.88Apple 0.068 0.00000 0 0 43.40 43.40Assam Lemon 0.068 0.00000 0 0 18.23 18.23Avocado 0.068 0.00000 0 0 10.13 10.13Banana 0.045 0.00000 0 0 184.50 184.50Citrus 0.068 0.00000 0 0 290.25 290.25Grapes 0.068 0.00000 0 0 33.75 0.00Guava 0.068 0.00000 0 0 6.75 6.75Guava 0.120 0.00000 0 0 12.00 11.95Kiwi 0.068 0.00000 0 0 73.37 73.37Litchi 0.068 0.00000 0 0 26.33 26.33Litchi 0.120 0.00000 0 0 19.20 19.15Mango 0.068 0.00000 0 0 20.25 20.25M. Orange 0.068 0.00000 0 0 512.33 512.33Orange 0.060 0.00000 0 0 33.90 33.90Passion Fruit 0.068 0.00000 0 0 94.50 94.50Peach 0.068 0.00000 0 0 3.38 3.38Pineapple 0.045 0.00000 0 0 131.49 131.49Plum 0.068 0.00000 0 0 17.89 17.89

annexure 175
Himachal Pradesh Jammu & Kashmir Uttarakhand Himalayan States Total NER + HSComponent Rate
(Rs. In Lakh)Financial Financial Financial Financial Financial
Tar. Ach. Tar. Ach. Tar. Ach. Tar. Ach. Tar. Ach.Chestnut 0.06 0 0 2.70 2.70Cherry 0.06 0 0 1.62 1.62Citrus 0.12 0 0 165.00 165.00Grapes 0.15 0 0 31.50 31.50Guava 0.12 0 0 42.00 42.00Guava 0.06 0 0 10.80 10.75Kiwi 0.15 0 0 62.25 62.24Litchi 0.12 0 0 45.00 45.00Litchi 0.06 0 0 11.28 11.25Mango 0.12 0 0 17.40 17.40Orange 0.06 0 0 234.00 234.00Khasi Mandarin Orange (HDP) 0.12 0 0 182.64 182.64Papaya 0.13 0 0 24.28 24.28Passion Fruit 0.15 0 0 123.00 123.00Pear 0.12 0 0 10.20 10.20Pineapple 0.188 0 0 328.13 328.13Pine apple (suckers) 0.13125 0 0 151.07 151.07Plum 0.12 0 0 10.80 10.80Walnut 0.06 0 0 2.70 2.70Temperate fruits 0.12 0 0 14.40 14.40Cost Intensive Crop 0.15 2.94000 2.94000 75.00 0.00 68.400 109.070 146.34 112.01 288.39 225.81Highdensity planting 0.12 0 0 0.00 0.00Other than cost intensive crops 0.06 42.81000 42.81000 175.98 78.36 218.79 121.17 218.79 121.17
V. 3rd Year Maintenance (30% 2009-10) 81.67500 81.67500 162.95 88.22 23.018 9.670 268 180 1950.80 1828.88Apple 0.068 0.00000 0 0 43.40 43.40Assam Lemon 0.068 0.00000 0 0 18.23 18.23Avocado 0.068 0.00000 0 0 10.13 10.13Banana 0.045 0.00000 0 0 184.50 184.50Citrus 0.068 0.00000 0 0 290.25 290.25Grapes 0.068 0.00000 0 0 33.75 0.00Guava 0.068 0.00000 0 0 6.75 6.75Guava 0.120 0.00000 0 0 12.00 11.95Kiwi 0.068 0.00000 0 0 73.37 73.37Litchi 0.068 0.00000 0 0 26.33 26.33Litchi 0.120 0.00000 0 0 19.20 19.15Mango 0.068 0.00000 0 0 20.25 20.25M. Orange 0.068 0.00000 0 0 512.33 512.33Orange 0.060 0.00000 0 0 33.90 33.90Passion Fruit 0.068 0.00000 0 0 94.50 94.50Peach 0.068 0.00000 0 0 3.38 3.38Pineapple 0.045 0.00000 0 0 131.49 131.49Plum 0.068 0.00000 0 0 17.89 17.89
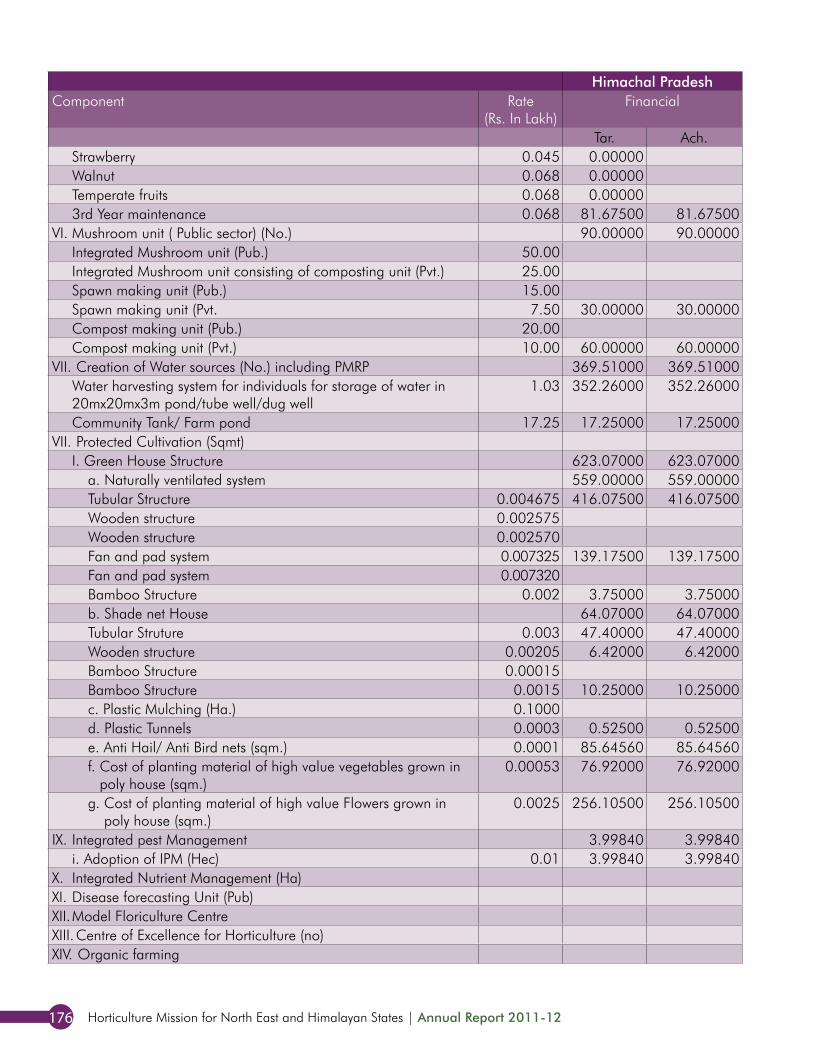
Horticulture Mission for North East and Himalayan States | Annual Report 2011-12176
Himachal Pradesh Jammu & Kashmir Uttarakhand Himalayan States Total NER + HSComponent Rate
(Rs. In Lakh)Financial Financial Financial Financial Financial
Tar. Ach. Tar. Ach. Tar. Ach. Tar. Ach. Tar. Ach.Strawberry 0.045 0.00000 0 0 48.60 48.60Walnut 0.068 0.00000 0 0 8.17 8.17Temperate fruits 0.068 0.00000 0 0 12.15 12.153rd Year maintenance 0.068 81.67500 81.67500 162.95 88.22 23.018 9.670 267.6375 179.5675 350.26 262.19
VI. Mushroom unit ( Public sector) (No.) 90.00000 90.00000 85.00 0.00 32.500 0.000 208 90 412.50 295.00Integrated Mushroom unit (Pub.) 50.00 50.00 50 0 150.00 100.00Integrated Mushroom unit consisting of composting unit (Pvt.) 25.00 25.000 25 0 25.00 0.00Spawn making unit (Pub.) 15.00 15.00 15 0 60.00 45.00Spawn making unit (Pvt. 7.50 30.00000 30.00000 0.00 7.500 37.5 30 37.50 30.00Compost making unit (Pub.) 20.00 20.00 20 0 80.00 60.00Compost making unit (Pvt.) 10.00 60.00000 60.00000 0.00 60 60 60.00 60.00
VII. Creation of Water sources (No.) including PMRP 369.51000 369.51000 432.57 311.82 302.820 295.320 1105 977 3458.91 3275.53Water harvesting system for individuals for storage of water in 20mx20mx3m pond/tube well/dug well
1.03 352.26000 352.26000 225.57 225.57 302.820 295.320 880.65 873.15 2855.16 2792.63
Community Tank/ Farm pond 17.25 17.25000 17.25000 207.00 86.25 224.25 103.5 603.75 482.90VII. Protected Cultivation (Sqmt)
I. Green House Structure 623.07000 623.07000 293 311 244.468 184.891 1160 1119 5071 3916a. Naturally ventilated system 559.00000 559.00000 248 248 243.568 184.611 1050 991 4305 3276Tubular Structure 0.004675 416.07500 416.07500 98.18 98.18 243.568 184.611 757.8175 698.861 3582.74 2826.95Wooden structure 0.002575 65.14 65.14 65.14235 65.14235 106.34 103.77Wooden structure 0.002570 0.00 0 0 74.53 0.00Fan and pad system 0.007325 139.17500 139.17500 0.00 139.175 139.175 205.10 205.10Fan and pad system 0.007320 73.20 73.20 73.2 73.2 184.46 73.20Bamboo Structure 0.002 3.75000 3.75000 11.25 11.25 15 15 151.42 67.40b. Shade net House 64.07000 64.07000 45 63 0.900 0.280 110 128 767 639Tubular Struture 0.003 47.40000 47.40000 30.00 45.00 0.900 0.280 78.3 92.68 669.30 560.68Wooden structure 0.00205 6.42000 6.42000 10.25 12.30 16.67 18.72 22.82 24.87Bamboo Structure 0.00015 0 0 0.00 0.00Bamboo Structure 0.0015 10.25000 10.25000 4.50 6.00 14.75 16.25 74.60 53.67c. Plastic Mulching (Ha.) 0.1000 46.500 42.200 46.5 42.2 131.50 119.65d. Plastic Tunnels 0.0003 0.52500 0.52500 0.525 0.525 13.20 10.42e. Anti Hail/ Anti Bird nets (sqm.) 0.0001 85.64560 85.64560 2.00 81.224 8.270 168.8696 93.9156 175.87 100.92f. Cost of planting material of high value vegetables grown in
poly house (sqm.)0.00053 76.92000 76.92000 11.298 0.500 88.218 77.42 123.03 108.40
g. Cost of planting material of high value Flowers grown in poly house (sqm.)
0.0025 256.10500 256.10500 15.250 1.000 271.355 257.105 521.36 506.96
IX. Integrated pest Management 3.99840 3.99840 5 0 1.200 1.910 10 6 641 636i. Adoption of IPM (Hec) 0.01 3.99840 3.99840 5.00 1.200 1.910 10.1984 5.9084 640.79 636.15
X. Integrated Nutrient Management (Ha) 0.00 0 0 88.00 88.00XI. Disease forecasting Unit (Pub) 8.00 8 0 36.00 28.00XII. Model Floriculture Centre 100.00 100 0 300.00 200.00XIII. Centre of Excellence for Horticulture (no) 0.00 0 0 182.00 182.00XIV. Organic farming
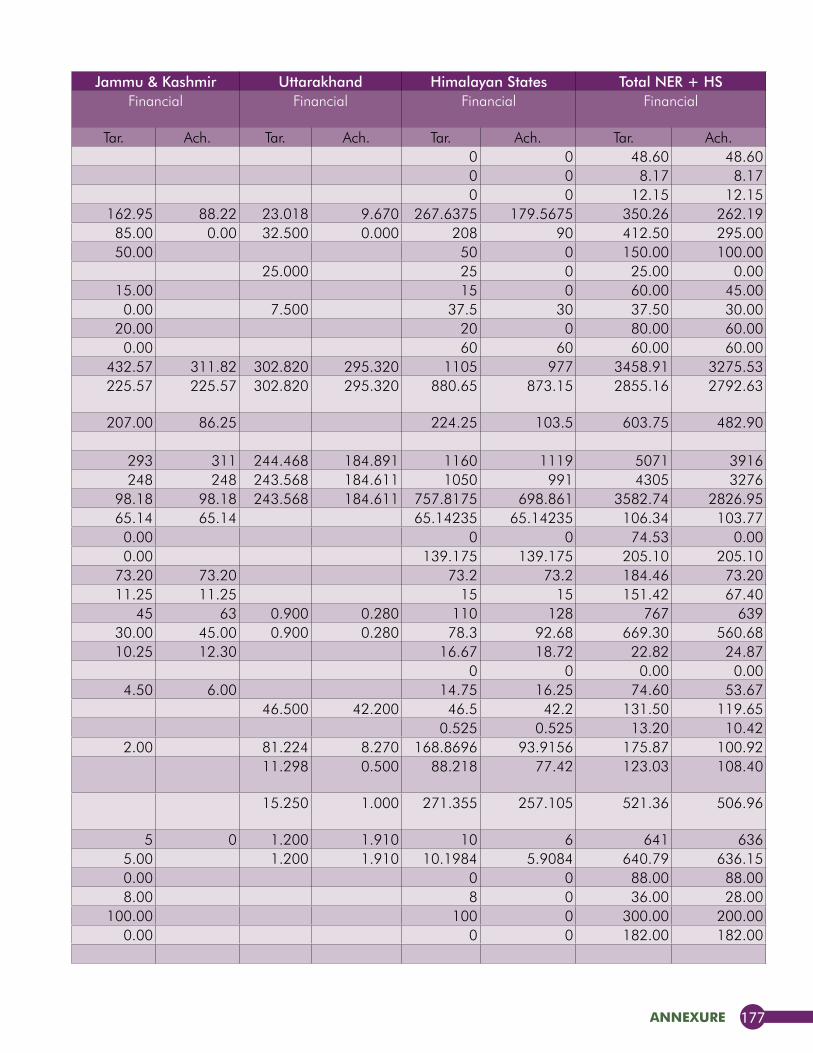
annexure 177
Himachal Pradesh Jammu & Kashmir Uttarakhand Himalayan States Total NER + HSComponent Rate
(Rs. In Lakh)Financial Financial Financial Financial Financial
Tar. Ach. Tar. Ach. Tar. Ach. Tar. Ach. Tar. Ach.Strawberry 0.045 0.00000 0 0 48.60 48.60Walnut 0.068 0.00000 0 0 8.17 8.17Temperate fruits 0.068 0.00000 0 0 12.15 12.153rd Year maintenance 0.068 81.67500 81.67500 162.95 88.22 23.018 9.670 267.6375 179.5675 350.26 262.19
VI. Mushroom unit ( Public sector) (No.) 90.00000 90.00000 85.00 0.00 32.500 0.000 208 90 412.50 295.00Integrated Mushroom unit (Pub.) 50.00 50.00 50 0 150.00 100.00Integrated Mushroom unit consisting of composting unit (Pvt.) 25.00 25.000 25 0 25.00 0.00Spawn making unit (Pub.) 15.00 15.00 15 0 60.00 45.00Spawn making unit (Pvt. 7.50 30.00000 30.00000 0.00 7.500 37.5 30 37.50 30.00Compost making unit (Pub.) 20.00 20.00 20 0 80.00 60.00Compost making unit (Pvt.) 10.00 60.00000 60.00000 0.00 60 60 60.00 60.00
VII. Creation of Water sources (No.) including PMRP 369.51000 369.51000 432.57 311.82 302.820 295.320 1105 977 3458.91 3275.53Water harvesting system for individuals for storage of water in 20mx20mx3m pond/tube well/dug well
1.03 352.26000 352.26000 225.57 225.57 302.820 295.320 880.65 873.15 2855.16 2792.63
Community Tank/ Farm pond 17.25 17.25000 17.25000 207.00 86.25 224.25 103.5 603.75 482.90VII. Protected Cultivation (Sqmt)
I. Green House Structure 623.07000 623.07000 293 311 244.468 184.891 1160 1119 5071 3916a. Naturally ventilated system 559.00000 559.00000 248 248 243.568 184.611 1050 991 4305 3276Tubular Structure 0.004675 416.07500 416.07500 98.18 98.18 243.568 184.611 757.8175 698.861 3582.74 2826.95Wooden structure 0.002575 65.14 65.14 65.14235 65.14235 106.34 103.77Wooden structure 0.002570 0.00 0 0 74.53 0.00Fan and pad system 0.007325 139.17500 139.17500 0.00 139.175 139.175 205.10 205.10Fan and pad system 0.007320 73.20 73.20 73.2 73.2 184.46 73.20Bamboo Structure 0.002 3.75000 3.75000 11.25 11.25 15 15 151.42 67.40b. Shade net House 64.07000 64.07000 45 63 0.900 0.280 110 128 767 639Tubular Struture 0.003 47.40000 47.40000 30.00 45.00 0.900 0.280 78.3 92.68 669.30 560.68Wooden structure 0.00205 6.42000 6.42000 10.25 12.30 16.67 18.72 22.82 24.87Bamboo Structure 0.00015 0 0 0.00 0.00Bamboo Structure 0.0015 10.25000 10.25000 4.50 6.00 14.75 16.25 74.60 53.67c. Plastic Mulching (Ha.) 0.1000 46.500 42.200 46.5 42.2 131.50 119.65d. Plastic Tunnels 0.0003 0.52500 0.52500 0.525 0.525 13.20 10.42e. Anti Hail/ Anti Bird nets (sqm.) 0.0001 85.64560 85.64560 2.00 81.224 8.270 168.8696 93.9156 175.87 100.92f. Cost of planting material of high value vegetables grown in
poly house (sqm.)0.00053 76.92000 76.92000 11.298 0.500 88.218 77.42 123.03 108.40
g. Cost of planting material of high value Flowers grown in poly house (sqm.)
0.0025 256.10500 256.10500 15.250 1.000 271.355 257.105 521.36 506.96
IX. Integrated pest Management 3.99840 3.99840 5 0 1.200 1.910 10 6 641 636i. Adoption of IPM (Hec) 0.01 3.99840 3.99840 5.00 1.200 1.910 10.1984 5.9084 640.79 636.15
X. Integrated Nutrient Management (Ha) 0.00 0 0 88.00 88.00XI. Disease forecasting Unit (Pub) 8.00 8 0 36.00 28.00XII. Model Floriculture Centre 100.00 100 0 300.00 200.00XIII. Centre of Excellence for Horticulture (no) 0.00 0 0 182.00 182.00XIV. Organic farming
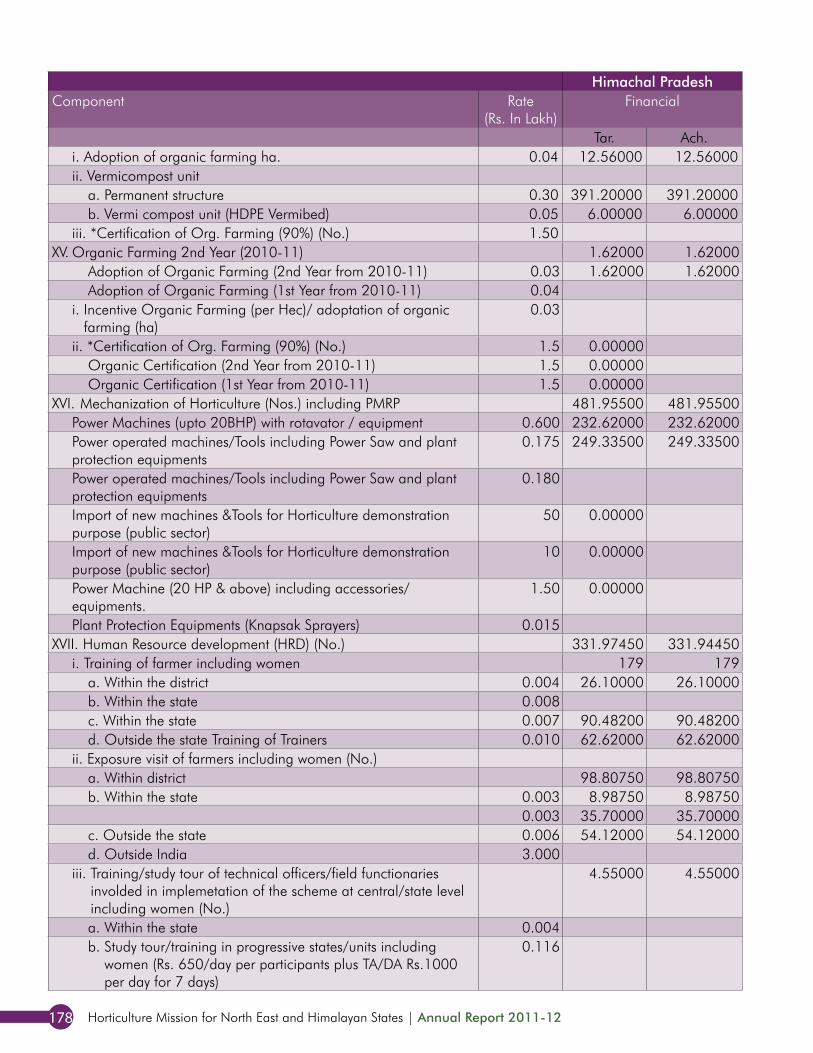
Horticulture Mission for North East and Himalayan States | Annual Report 2011-12178
Himachal Pradesh Jammu & Kashmir Uttarakhand Himalayan States Total NER + HSComponent Rate
(Rs. In Lakh)Financial Financial Financial Financial Financial
Tar. Ach. Tar. Ach. Tar. Ach. Tar. Ach. Tar. Ach.i. Adoption of organic farming ha. 0.04 12.56000 12.56000 5.20 5.20 29.400 48.580 47.16 66.34 294.16 313.34ii. Vermicompost unit
a. Permanent structure 0.30 391.20000 391.20000 93.60 93.60 182.400 144.330 667.2 629.13 786.00 747.93b. Vermi compost unit (HDPE Vermibed) 0.05 6.00000 6.00000 0.00 6 6 184.60 184.60
iii. *Certification of Org. Farming (90%) (No.) 1.50 10.50 10.50 10.5 10.5 154.50 154.50XV. Organic Farming 2nd Year (2010-11) 1.62000 1.62000 8 8 0.000 0.000 9 9 300 300
Adoption of Organic Farming (2nd Year from 2010-11) 0.03 1.62000 1.62000 7.80 7.80 9.42 9.42 192.42 192.42Adoption of Organic Farming (1st Year from 2010-11) 0.04 0.00 0 0 80.00 80.00
i. Incentive Organic Farming (per Hec)/ adoptation of organic farming (ha)
0.03 0.00 0 0 3.60 3.60
ii. *Certification of Org. Farming (90%) (No.) 1.5 0.00000 0.00 0 0 9.00 9.00Organic Certification (2nd Year from 2010-11) 1.5 0.00000 0.00 0 0 7.50 7.50Organic Certification (1st Year from 2010-11) 1.5 0.00000 0.00 0 0 7.50 7.50
XVI. Mechanization of Horticulture (Nos.) including PMRP 481.95500 481.95500 447 796 95.725 174.220 1024 1452 1908 2234Power Machines (upto 20BHP) with rotavator / equipment 0.600 232.62000 232.62000 126.60 475.88 1.200 28.580 360.42 737.075 510.42 887.08Power operated machines/Tools including Power Saw and plant protection equipments
0.175 249.33500 249.33500 214.90 214.90 7.525 116.480 471.76 580.715 897.89 905.15
Power operated machines/Tools including Power Saw and plant protection equipments
0.180 0 0 30.60 30.60
Import of new machines &Tools for Horticulture demonstration purpose (public sector)
50 0.00000 0.00 0 0 50.00 50.00
Import of new machines &Tools for Horticulture demonstration purpose (public sector)
10 0.00000 0.00 0 0 10.00 9.85
Power Machine (20 HP & above) including accessories/ equipments.
1.50 0.00000 105.00 105.00 87.000 29.160 192 134.16 379.50 321.66
Plant Protection Equipments (Knapsak Sprayers) 0.015 0 0 29.18 29.18XVII. Human Resource development (HRD) (No.) 331.97450 331.94450 175 156 23.275 153.480 530 641 1084 1168
i. Training of farmer including women 179 179 137 137 10 148 326 464 578 690a. Within the district 0.004 26.10000 26.10000 32.04 32.04 5.740 5.380 63.884 63.524 180.60 161.75b. Within the state 0.008 60.00 60.00 3.075 4.980 63.075 64.98 125.84 120.09c. Within the state 0.007 90.48200 90.48200 0.00 90.482 90.482 104.48 104.48d. Outside the state Training of Trainers 0.010 62.62000 62.62000 45.05 45.05 0.760 5.790 108.43 113.46 166.84 171.77
ii. Exposure visit of farmers including women (No.) 132.050 0 132.05 0.00 132.05a. Within district 98.80750 98.80750 7 4 3.700 3.030 109 106 274 270b. Within the state 0.003 8.98750 8.98750 2.13 2.13 1.450 0.650 12.5625 11.7625 75.29 74.47
0.003 35.70000 35.70000 1.92 1.92 1.800 0.460 39.42 38.08 96.70 95.26c. Outside the state 0.006 54.12000 54.12000 2.85 0.450 1.920 57.42 56.04 102.07 100.59d. Outside India 3.000
iii. Training/study tour of technical officers/field functionaries involded in implemetation of the scheme at central/state level including women (No.)
4.55000 4.55000 0 0 0.000 0.000 5 5 56 56
a. Within the state 0.004 0.00 0 0 0.29 0.29b. Study tour/training in progressive states/units including
women (Rs. 650/day per participants plus TA/DA Rs.1000 per day for 7 days)
0.116 0.00 0 0 11.09 11.09
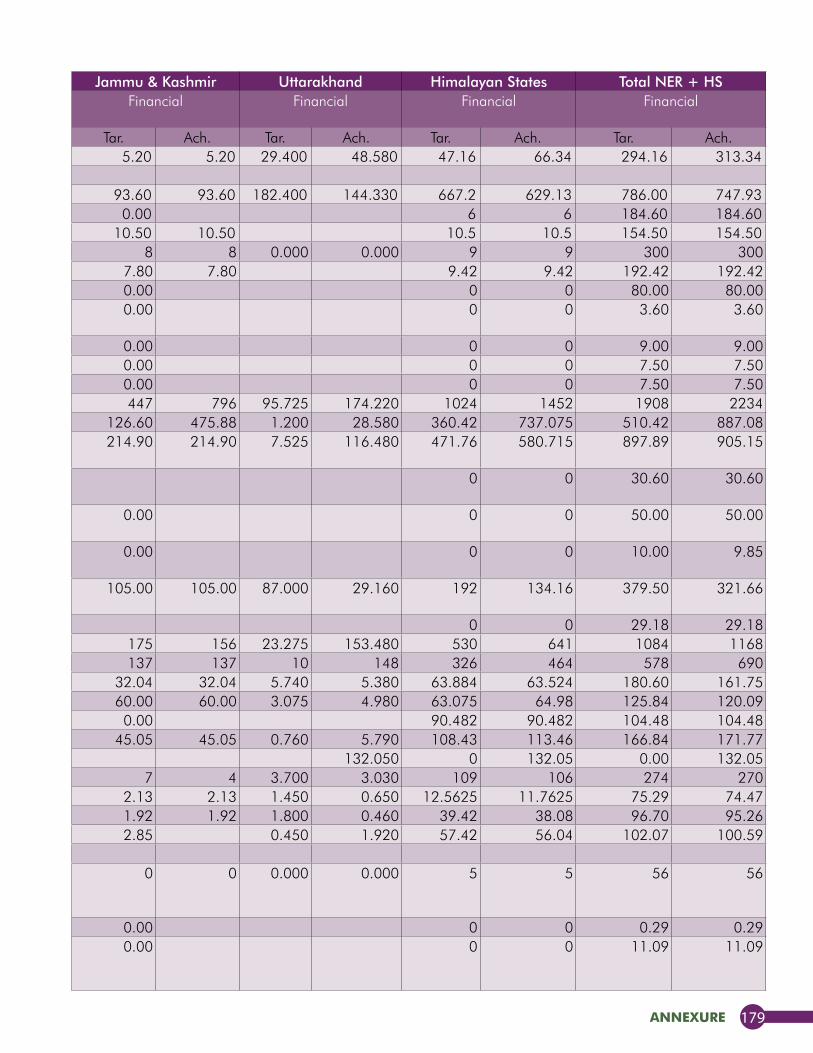
annexure 179
Himachal Pradesh Jammu & Kashmir Uttarakhand Himalayan States Total NER + HSComponent Rate
(Rs. In Lakh)Financial Financial Financial Financial Financial
Tar. Ach. Tar. Ach. Tar. Ach. Tar. Ach. Tar. Ach.i. Adoption of organic farming ha. 0.04 12.56000 12.56000 5.20 5.20 29.400 48.580 47.16 66.34 294.16 313.34ii. Vermicompost unit
a. Permanent structure 0.30 391.20000 391.20000 93.60 93.60 182.400 144.330 667.2 629.13 786.00 747.93b. Vermi compost unit (HDPE Vermibed) 0.05 6.00000 6.00000 0.00 6 6 184.60 184.60
iii. *Certification of Org. Farming (90%) (No.) 1.50 10.50 10.50 10.5 10.5 154.50 154.50XV. Organic Farming 2nd Year (2010-11) 1.62000 1.62000 8 8 0.000 0.000 9 9 300 300
Adoption of Organic Farming (2nd Year from 2010-11) 0.03 1.62000 1.62000 7.80 7.80 9.42 9.42 192.42 192.42Adoption of Organic Farming (1st Year from 2010-11) 0.04 0.00 0 0 80.00 80.00
i. Incentive Organic Farming (per Hec)/ adoptation of organic farming (ha)
0.03 0.00 0 0 3.60 3.60
ii. *Certification of Org. Farming (90%) (No.) 1.5 0.00000 0.00 0 0 9.00 9.00Organic Certification (2nd Year from 2010-11) 1.5 0.00000 0.00 0 0 7.50 7.50Organic Certification (1st Year from 2010-11) 1.5 0.00000 0.00 0 0 7.50 7.50
XVI. Mechanization of Horticulture (Nos.) including PMRP 481.95500 481.95500 447 796 95.725 174.220 1024 1452 1908 2234Power Machines (upto 20BHP) with rotavator / equipment 0.600 232.62000 232.62000 126.60 475.88 1.200 28.580 360.42 737.075 510.42 887.08Power operated machines/Tools including Power Saw and plant protection equipments
0.175 249.33500 249.33500 214.90 214.90 7.525 116.480 471.76 580.715 897.89 905.15
Power operated machines/Tools including Power Saw and plant protection equipments
0.180 0 0 30.60 30.60
Import of new machines &Tools for Horticulture demonstration purpose (public sector)
50 0.00000 0.00 0 0 50.00 50.00
Import of new machines &Tools for Horticulture demonstration purpose (public sector)
10 0.00000 0.00 0 0 10.00 9.85
Power Machine (20 HP & above) including accessories/ equipments.
1.50 0.00000 105.00 105.00 87.000 29.160 192 134.16 379.50 321.66
Plant Protection Equipments (Knapsak Sprayers) 0.015 0 0 29.18 29.18XVII. Human Resource development (HRD) (No.) 331.97450 331.94450 175 156 23.275 153.480 530 641 1084 1168
i. Training of farmer including women 179 179 137 137 10 148 326 464 578 690a. Within the district 0.004 26.10000 26.10000 32.04 32.04 5.740 5.380 63.884 63.524 180.60 161.75b. Within the state 0.008 60.00 60.00 3.075 4.980 63.075 64.98 125.84 120.09c. Within the state 0.007 90.48200 90.48200 0.00 90.482 90.482 104.48 104.48d. Outside the state Training of Trainers 0.010 62.62000 62.62000 45.05 45.05 0.760 5.790 108.43 113.46 166.84 171.77
ii. Exposure visit of farmers including women (No.) 132.050 0 132.05 0.00 132.05a. Within district 98.80750 98.80750 7 4 3.700 3.030 109 106 274 270b. Within the state 0.003 8.98750 8.98750 2.13 2.13 1.450 0.650 12.5625 11.7625 75.29 74.47
0.003 35.70000 35.70000 1.92 1.92 1.800 0.460 39.42 38.08 96.70 95.26c. Outside the state 0.006 54.12000 54.12000 2.85 0.450 1.920 57.42 56.04 102.07 100.59d. Outside India 3.000
iii. Training/study tour of technical officers/field functionaries involded in implemetation of the scheme at central/state level including women (No.)
4.55000 4.55000 0 0 0.000 0.000 5 5 56 56
a. Within the state 0.004 0.00 0 0 0.29 0.29b. Study tour/training in progressive states/units including
women (Rs. 650/day per participants plus TA/DA Rs.1000 per day for 7 days)
0.116 0.00 0 0 11.09 11.09

Horticulture Mission for North East and Himalayan States | Annual Report 2011-12180
Himachal Pradesh Jammu & Kashmir Uttarakhand Himalayan States Total NER + HSComponent Rate
(Rs. In Lakh)Financial Financial Financial Financial Financial
Tar. Ach. Tar. Ach. Tar. Ach. Tar. Ach. Tar. Ach.c. Outside the state 0.02 0.00 0 0 36.00 36.00d. Outside the state 0.0065 4.55000 4.55000 0.00 4.55 4.55 8.45 8.45
iv. Training/ Study tour of Technical Officers/ field fundtionaries incolved in implementation of the Scheme at Central/ State level including women (perday)
49.41500 49.38500 31 15 10.000 2.250 90 66 176 152
a. Within the State 0.002 3.41000 3.41000 0.77 1.05 2.250 4.184 6.708 19.78 22.31b. Outside States 0.0065 0.97500 0.97500 10.02 8.79 10.9915 9.763 46.09 44.81c. Outside india 5.00 45.00000 45.00000 20.00 5.00 10.000 75 50 110.00 85.00
XVIII. Information dissemination through publicity, printed literature etc and local advertisements
34.80000 28.80 28.80 86.400 13.200 150 76.8 239.60 166.10
XIX. Pollination support through Bee Keeping (Nos) 46.38500 46.38500 10 10 10.850 14.170 68 71 339 342Production of bee colonies by bee breeder 3.00 0.00 0 0 9.00 8.97Bee colonies 0.007 18.93500 18.93500 5.60 5.60 4.900 8.220 29.435 32.755 121.28 124.55Bee hives 0.008 19.96000 19.96000 4.80 4.80 5.600 5.600 30.36 30.36 124.92 124.92Honey extractor 0.007 0.00000 0.00 0 0 42.00 42.00Honey extractor 0.070 7.49000 7.49000 0.00 0.350 0.350 7.84 7.84 41.44 41.34
XX. Mission Mangement 43.35270 43.35270 40 0 66.530 64.690 150 108 605 514ii. Project management including additional manpower & project
preparation cost, Institutional strengthening, hire of vehicle, hardware / software etc.
27.35270 27.35270 39.70 67.0527 27.3527 330.73 257.88
State & District Mission Offices and implementing agencies for administrative expenses,field consultant,project preparation, computerisation contingency etc.
0.00 51.530 63.270 51.53 63.27 181.06 182.05
Institutional strengthening/hire/ vehicle/ hardware/software etc 16.00000 16.00000 0.00 15.000 1.420 31 17.42 93.11 74.44XXI. Seminar, conferences, exhibitions, kisan mela, horti expo,
Honey festival, etc. awareness campaign/publicity (No.)46.00000 46.00000 85 85 38.000 18.080 169 149 322 299
a. State Level Event 3.00 12.00000 12.00000 27.00 27.00 30.000 13.090 69 52.09 126.00 107.99b. District Level Event 2.00 34.00000 34.00000 58.00 58.00 8.000 4.990 100 96.99 196.00 190.94Mission ManagementTechnical Support Group (TSG) at State level for hiring experts / staff, studies, monitoring & evaluation, mass media, publicity, video conference etc.
50.00 11.55
Gardner's Training Centre 2.00 6.003700.03 3700.00 3454.69 2857.44 3010.04 2757.84 10164.73 9297.73 42150.02 39451.86
XXII. MM-IIIWHOLE SALE MARKET (II INST.) 199.18 199.18 198.18RURAL PRIMARY MARKETII INST. 78.75APNI MANDIII INST 3.75
XXIII. MM-IV I INST. 406.22 53.40 96.12 0 555.74 604.56II INST. 269.49 1339.45 0 1608.94 1754.96
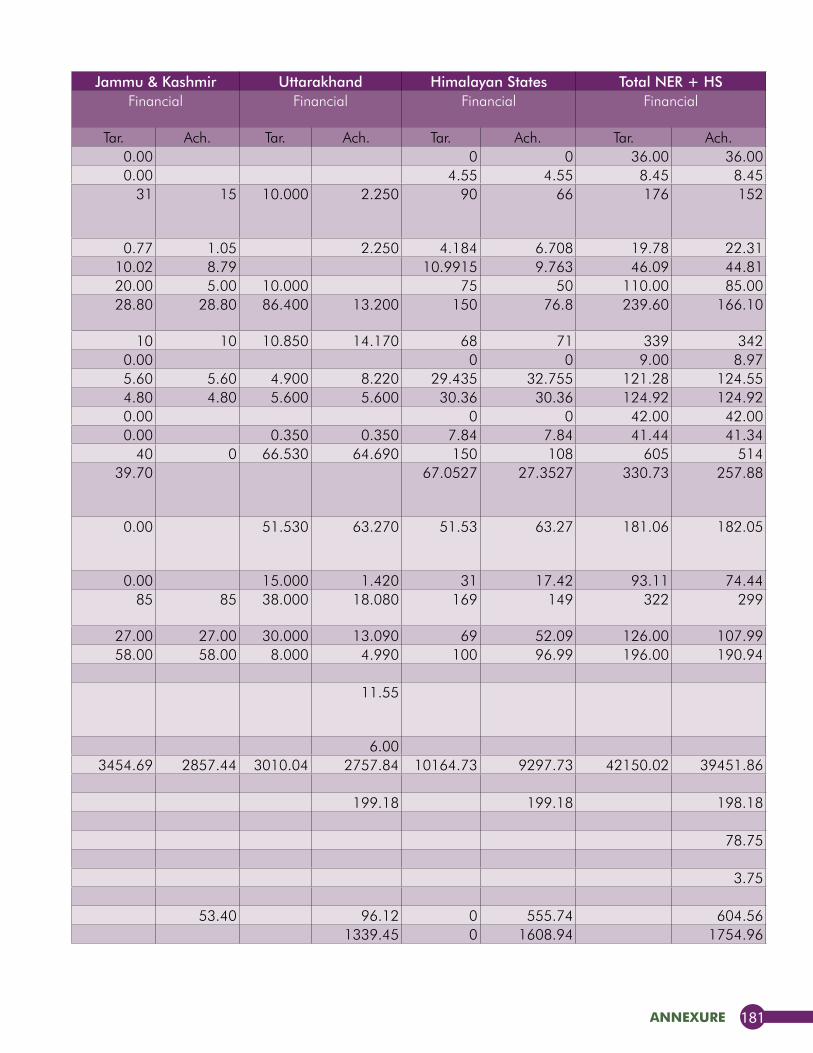
annexure 181
Himachal Pradesh Jammu & Kashmir Uttarakhand Himalayan States Total NER + HSComponent Rate
(Rs. In Lakh)Financial Financial Financial Financial Financial
Tar. Ach. Tar. Ach. Tar. Ach. Tar. Ach. Tar. Ach.c. Outside the state 0.02 0.00 0 0 36.00 36.00d. Outside the state 0.0065 4.55000 4.55000 0.00 4.55 4.55 8.45 8.45
iv. Training/ Study tour of Technical Officers/ field fundtionaries incolved in implementation of the Scheme at Central/ State level including women (perday)
49.41500 49.38500 31 15 10.000 2.250 90 66 176 152
a. Within the State 0.002 3.41000 3.41000 0.77 1.05 2.250 4.184 6.708 19.78 22.31b. Outside States 0.0065 0.97500 0.97500 10.02 8.79 10.9915 9.763 46.09 44.81c. Outside india 5.00 45.00000 45.00000 20.00 5.00 10.000 75 50 110.00 85.00
XVIII. Information dissemination through publicity, printed literature etc and local advertisements
34.80000 28.80 28.80 86.400 13.200 150 76.8 239.60 166.10
XIX. Pollination support through Bee Keeping (Nos) 46.38500 46.38500 10 10 10.850 14.170 68 71 339 342Production of bee colonies by bee breeder 3.00 0.00 0 0 9.00 8.97Bee colonies 0.007 18.93500 18.93500 5.60 5.60 4.900 8.220 29.435 32.755 121.28 124.55Bee hives 0.008 19.96000 19.96000 4.80 4.80 5.600 5.600 30.36 30.36 124.92 124.92Honey extractor 0.007 0.00000 0.00 0 0 42.00 42.00Honey extractor 0.070 7.49000 7.49000 0.00 0.350 0.350 7.84 7.84 41.44 41.34
XX. Mission Mangement 43.35270 43.35270 40 0 66.530 64.690 150 108 605 514ii. Project management including additional manpower & project
preparation cost, Institutional strengthening, hire of vehicle, hardware / software etc.
27.35270 27.35270 39.70 67.0527 27.3527 330.73 257.88
State & District Mission Offices and implementing agencies for administrative expenses,field consultant,project preparation, computerisation contingency etc.
0.00 51.530 63.270 51.53 63.27 181.06 182.05
Institutional strengthening/hire/ vehicle/ hardware/software etc 16.00000 16.00000 0.00 15.000 1.420 31 17.42 93.11 74.44XXI. Seminar, conferences, exhibitions, kisan mela, horti expo,
Honey festival, etc. awareness campaign/publicity (No.)46.00000 46.00000 85 85 38.000 18.080 169 149 322 299
a. State Level Event 3.00 12.00000 12.00000 27.00 27.00 30.000 13.090 69 52.09 126.00 107.99b. District Level Event 2.00 34.00000 34.00000 58.00 58.00 8.000 4.990 100 96.99 196.00 190.94Mission ManagementTechnical Support Group (TSG) at State level for hiring experts / staff, studies, monitoring & evaluation, mass media, publicity, video conference etc.
50.00 11.55
Gardner's Training Centre 2.00 6.003700.03 3700.00 3454.69 2857.44 3010.04 2757.84 10164.73 9297.73 42150.02 39451.86
XXII. MM-IIIWHOLE SALE MARKET (II INST.) 199.18 199.18 198.18RURAL PRIMARY MARKETII INST. 78.75APNI MANDIII INST 3.75
XXIII. MM-IV I INST. 406.22 53.40 96.12 0 555.74 604.56II INST. 269.49 1339.45 0 1608.94 1754.96
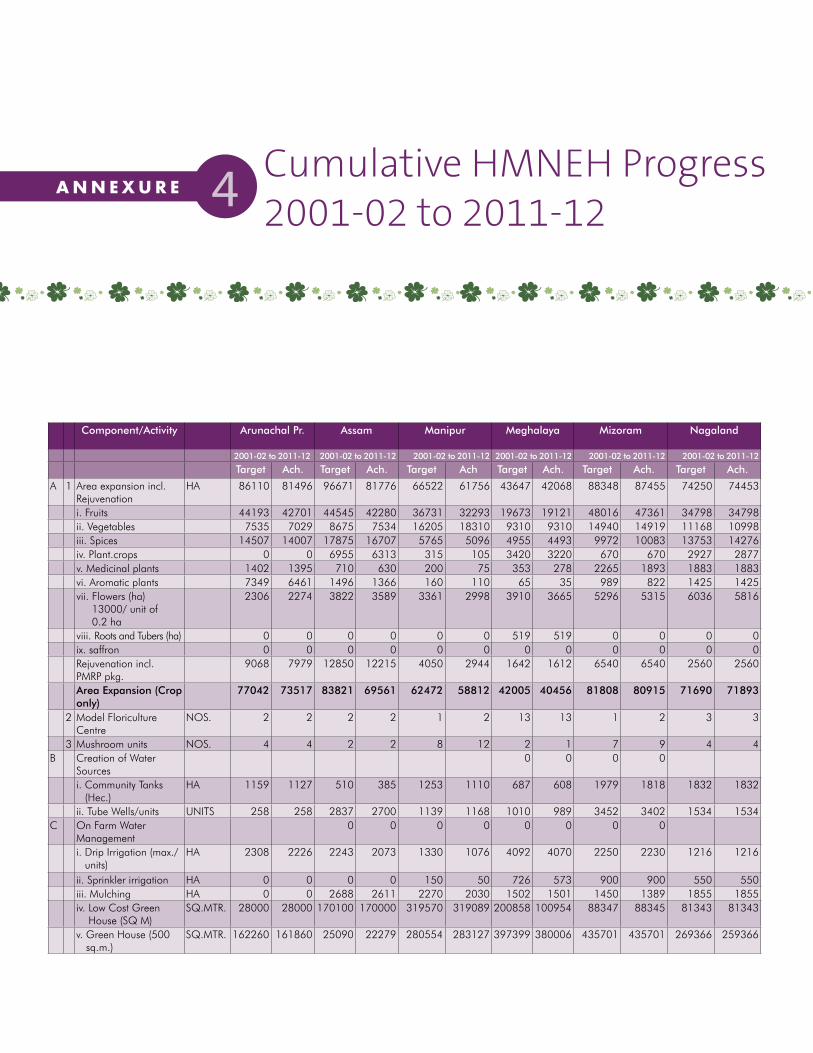
Cumulative HMNEH Progress 2001-02 to 2011-124A N N E x u R E
Component/Activity Arunachal Pr. Assam Manipur Meghalaya Mizoram Nagaland
2001-02 to 2011-12 2001-02 to 2011-12 2001-02 to 2011-12 2001-02 to 2011-12 2001-02 to 2011-12 2001-02 to 2011-12
Target Ach. Target Ach. Target Ach Target Ach. Target Ach. Target Ach.
A 1 Area expansion incl. Rejuvenation
HA 86110 81496 96671 81776 66522 61756 43647 42068 88348 87455 74250 74453
i. Fruits 44193 42701 44545 42280 36731 32293 19673 19121 48016 47361 34798 34798ii. Vegetables 7535 7029 8675 7534 16205 18310 9310 9310 14940 14919 11168 10998iii. Spices 14507 14007 17875 16707 5765 5096 4955 4493 9972 10083 13753 14276iv. Plant.crops 0 0 6955 6313 315 105 3420 3220 670 670 2927 2877v. Medicinal plants 1402 1395 710 630 200 75 353 278 2265 1893 1883 1883vi. Aromatic plants 7349 6461 1496 1366 160 110 65 35 989 822 1425 1425vii. Flowers (ha)
13000/ unit of 0.2 ha
2306 2274 3822 3589 3361 2998 3910 3665 5296 5315 6036 5816
viii. Roots and Tubers (ha) 0 0 0 0 0 0 519 519 0 0 0 0ix. saffron 0 0 0 0 0 0 0 0 0 0 0 0Rejuvenation incl. PMRP pkg.
9068 7979 12850 12215 4050 2944 1642 1612 6540 6540 2560 2560
Area Expansion (Crop only)
77042 73517 83821 69561 62472 58812 42005 40456 81808 80915 71690 71893
2 Model Floriculture Centre
NOS. 2 2 2 2 1 2 13 13 1 2 3 3
3 Mushroom units NOS. 4 4 2 2 8 12 2 1 7 9 4 4B Creation of Water
Sources0 0 0 0
i. Community Tanks (Hec.)
HA 1159 1127 510 385 1253 1110 687 608 1979 1818 1832 1832
ii. Tube Wells/units UNITS 258 258 2837 2700 1139 1168 1010 989 3452 3402 1534 1534C On Farm Water
Management0 0 0 0 0 0 0 0
i. Drip Irrigation (max./units)
HA 2308 2226 2243 2073 1330 1076 4092 4070 2250 2230 1216 1216
ii. Sprinkler irrigation HA 0 0 0 0 150 50 726 573 900 900 550 550iii. Mulching HA 0 0 2688 2611 2270 2030 1502 1501 1450 1389 1855 1855iv. Low Cost Green
House (SQ M)SQ.MTR. 28000 28000 170100 170000 319570 319089 200858 100954 88347 88345 81343 81343
v. Green House (500 sq.m.)
SQ.MTR. 162260 161860 25090 22279 280554 283127 397399 380006 435701 435701 269366 259366
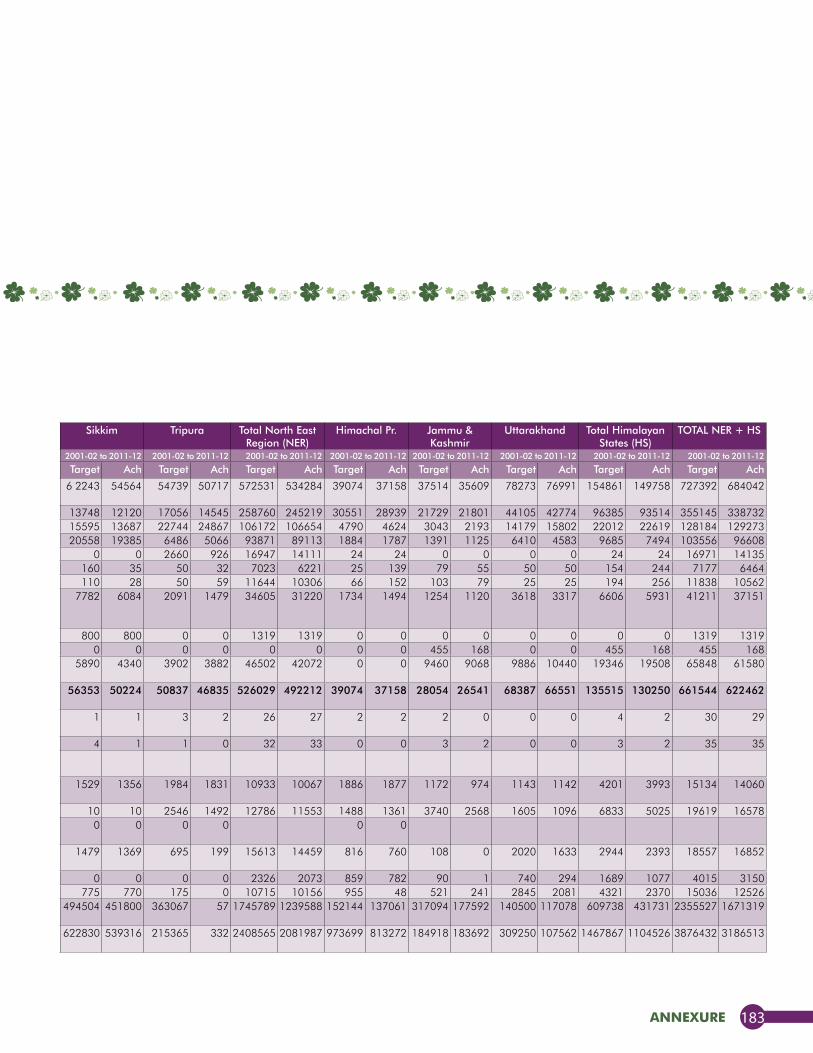
annexure 183
Sikkim Tripura Total North East Region (NER)
Himachal Pr. Jammu & Kashmir
Uttarakhand Total Himalayan States (HS)
TOTAL NER + HS
2001-02 to 2011-12 2001-02 to 2011-12 2001-02 to 2011-12 2001-02 to 2011-12 2001-02 to 2011-12 2001-02 to 2011-12 2001-02 to 2011-12 2001-02 to 2011-12
Target Ach Target Ach Target Ach Target Ach Target Ach Target Ach Target Ach Target Ach
6 2243 54564 54739 50717 572531 534284 39074 37158 37514 35609 78273 76991 154861 149758 727392 684042
13748 12120 17056 14545 258760 245219 30551 28939 21729 21801 44105 42774 96385 93514 355145 33873215595 13687 22744 24867 106172 106654 4790 4624 3043 2193 14179 15802 22012 22619 128184 12927320558 19385 6486 5066 93871 89113 1884 1787 1391 1125 6410 4583 9685 7494 103556 96608
0 0 2660 926 16947 14111 24 24 0 0 0 0 24 24 16971 14135160 35 50 32 7023 6221 25 139 79 55 50 50 154 244 7177 6464110 28 50 59 11644 10306 66 152 103 79 25 25 194 256 11838 10562
7782 6084 2091 1479 34605 31220 1734 1494 1254 1120 3618 3317 6606 5931 41211 37151
800 800 0 0 1319 1319 0 0 0 0 0 0 0 0 1319 13190 0 0 0 0 0 0 0 455 168 0 0 455 168 455 168
5890 4340 3902 3882 46502 42072 0 0 9460 9068 9886 10440 19346 19508 65848 61580
56353 50224 50837 46835 526029 492212 39074 37158 28054 26541 68387 66551 135515 130250 661544 622462
1 1 3 2 26 27 2 2 2 0 0 0 4 2 30 29
4 1 1 0 32 33 0 0 3 2 0 0 3 2 35 35
1529 1356 1984 1831 10933 10067 1886 1877 1172 974 1143 1142 4201 3993 15134 14060
10 10 2546 1492 12786 11553 1488 1361 3740 2568 1605 1096 6833 5025 19619 165780 0 0 0 0 0
1479 1369 695 199 15613 14459 816 760 108 0 2020 1633 2944 2393 18557 16852
0 0 0 0 2326 2073 859 782 90 1 740 294 1689 1077 4015 3150775 770 175 0 10715 10156 955 48 521 241 2845 2081 4321 2370 15036 12526
494504 451800 363067 57 1745789 1239588 152144 137061 317094 177592 140500 117078 609738 431731 2355527 1671319
622830 539316 215365 332 2408565 2081987 973699 813272 184918 183692 309250 107562 1467867 1104526 3876432 3186513
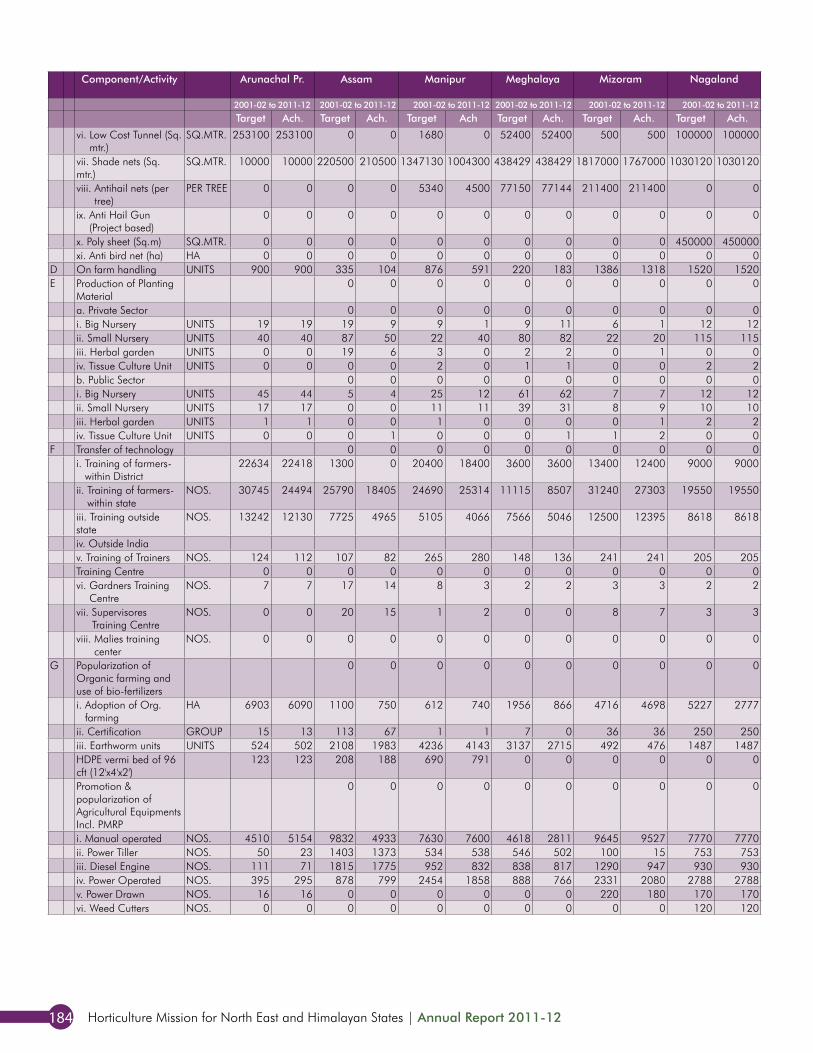
Horticulture Mission for North East and Himalayan States | Annual Report 2011-12184
Component/Activity Arunachal Pr. Assam Manipur Meghalaya Mizoram Nagaland
2001-02 to 2011-12 2001-02 to 2011-12 2001-02 to 2011-12 2001-02 to 2011-12 2001-02 to 2011-12 2001-02 to 2011-12
Target Ach. Target Ach. Target Ach Target Ach. Target Ach. Target Ach.
vi. Low Cost Tunnel (Sq. mtr.)
SQ.MTR. 253100 253100 0 0 1680 0 52400 52400 500 500 100000 100000
vii. Shade nets (Sq. mtr.)
SQ.MTR. 10000 10000 220500 210500 1347130 1004300 438429 438429 1817000 1767000 1030120 1030120
viii. Antihail nets (per tree)
PER TREE 0 0 0 0 5340 4500 77150 77144 211400 211400 0 0
ix. Anti Hail Gun (Project based)
0 0 0 0 0 0 0 0 0 0 0 0
x. Poly sheet (Sq.m) SQ.MTR. 0 0 0 0 0 0 0 0 0 0 450000 450000xi. Anti bird net (ha) HA 0 0 0 0 0 0 0 0 0 0 0 0
D On farm handling UNITS 900 900 335 104 876 591 220 183 1386 1318 1520 1520E Production of Planting
Material0 0 0 0 0 0 0 0 0 0
a. Private Sector 0 0 0 0 0 0 0 0 0 0i. Big Nursery UNITS 19 19 19 9 9 1 9 11 6 1 12 12ii. Small Nursery UNITS 40 40 87 50 22 40 80 82 22 20 115 115iii. Herbal garden UNITS 0 0 19 6 3 0 2 2 0 1 0 0iv. Tissue Culture Unit UNITS 0 0 0 0 2 0 1 1 0 0 2 2b. Public Sector 0 0 0 0 0 0 0 0 0 0i. Big Nursery UNITS 45 44 5 4 25 12 61 62 7 7 12 12ii. Small Nursery UNITS 17 17 0 0 11 11 39 31 8 9 10 10iii. Herbal garden UNITS 1 1 0 0 1 0 0 0 0 1 2 2iv. Tissue Culture Unit UNITS 0 0 0 1 0 0 0 1 1 2 0 0
F Transfer of technology 0 0 0 0 0 0 0 0 0 0i. Training of farmers-
within District22634 22418 1300 0 20400 18400 3600 3600 13400 12400 9000 9000
ii. Training of farmers-within state
NOS. 30745 24494 25790 18405 24690 25314 11115 8507 31240 27303 19550 19550
iii. Training outside state
NOS. 13242 12130 7725 4965 5105 4066 7566 5046 12500 12395 8618 8618
iv. Outside Indiav. Training of Trainers NOS. 124 112 107 82 265 280 148 136 241 241 205 205Training Centre 0 0 0 0 0 0 0 0 0 0 0 0vi. Gardners Training
CentreNOS. 7 7 17 14 8 3 2 2 3 3 2 2
vii. Supervisores Training Centre
NOS. 0 0 20 15 1 2 0 0 8 7 3 3
viii. Malies training center
NOS. 0 0 0 0 0 0 0 0 0 0 0 0
G Popularization of Organic farming and use of bio-fertilizers
0 0 0 0 0 0 0 0 0 0
i. Adoption of Org.farming
HA 6903 6090 1100 750 612 740 1956 866 4716 4698 5227 2777
ii. Certification GROUP 15 13 113 67 1 1 7 0 36 36 250 250iii. Earthworm units UNITS 524 502 2108 1983 4236 4143 3137 2715 492 476 1487 1487HDPE vermi bed of 96 cft (12'x4'x2')
123 123 208 188 690 791 0 0 0 0 0 0
Promotion & popularization of Agricultural Equipments Incl. PMRP
0 0 0 0 0 0 0 0 0 0
i. Manual operated NOS. 4510 5154 9832 4933 7630 7600 4618 2811 9645 9527 7770 7770ii. Power Tiller NOS. 50 23 1403 1373 534 538 546 502 100 15 753 753iii. Diesel Engine NOS. 111 71 1815 1775 952 832 838 817 1290 947 930 930iv. Power Operated NOS. 395 295 878 799 2454 1858 888 766 2331 2080 2788 2788v. Power Drawn NOS. 16 16 0 0 0 0 0 0 220 180 170 170vi. Weed Cutters NOS. 0 0 0 0 0 0 0 0 0 0 120 120
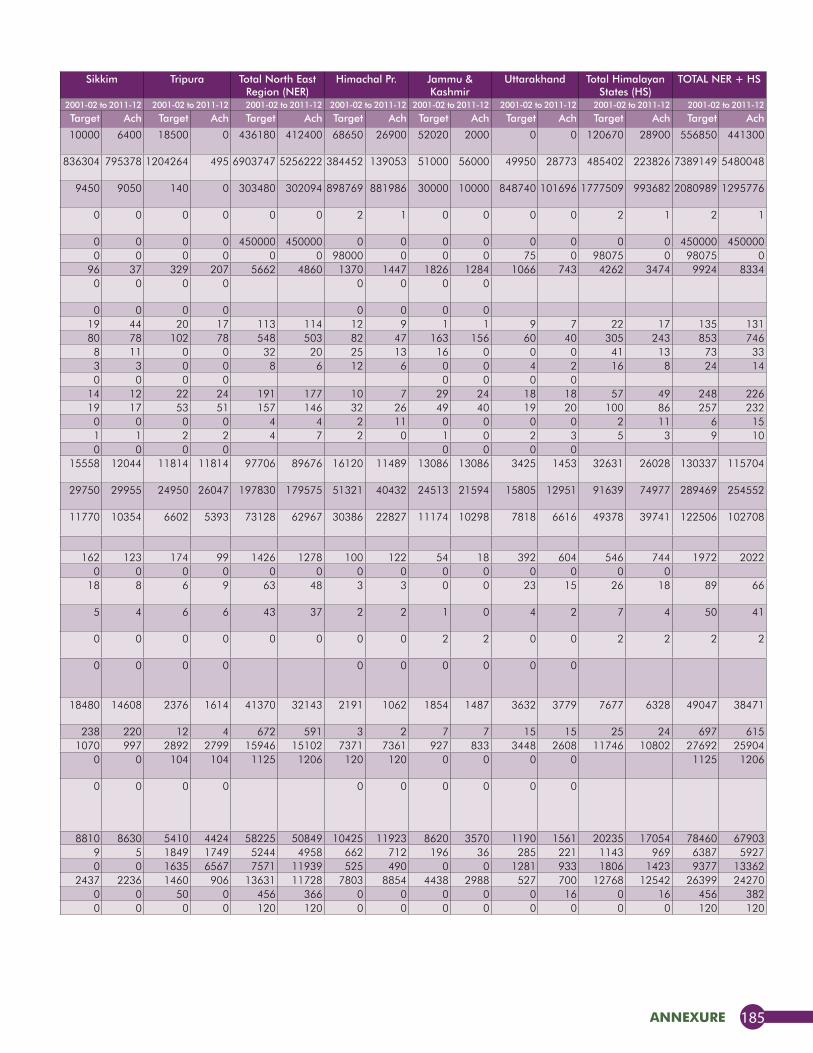
annexure 185
Sikkim Tripura Total North East Region (NER)
Himachal Pr. Jammu & Kashmir
Uttarakhand Total Himalayan States (HS)
TOTAL NER + HS
2001-02 to 2011-12 2001-02 to 2011-12 2001-02 to 2011-12 2001-02 to 2011-12 2001-02 to 2011-12 2001-02 to 2011-12 2001-02 to 2011-12 2001-02 to 2011-12
Target Ach Target Ach Target Ach Target Ach Target Ach Target Ach Target Ach Target Ach
10000 6400 18500 0 436180 412400 68650 26900 52020 2000 0 0 120670 28900 556850 441300
836304 795378 1204264 495 6903747 5256222 384452 139053 51000 56000 49950 28773 485402 223826 7389149 5480048
9450 9050 140 0 303480 302094 898769 881986 30000 10000 848740 101696 1777509 993682 2080989 1295776
0 0 0 0 0 0 2 1 0 0 0 0 2 1 2 1
0 0 0 0 450000 450000 0 0 0 0 0 0 0 0 450000 4500000 0 0 0 0 0 98000 0 0 0 75 0 98075 0 98075 0
96 37 329 207 5662 4860 1370 1447 1826 1284 1066 743 4262 3474 9924 83340 0 0 0 0 0 0 0
0 0 0 0 0 0 0 019 44 20 17 113 114 12 9 1 1 9 7 22 17 135 13180 78 102 78 548 503 82 47 163 156 60 40 305 243 853 746
8 11 0 0 32 20 25 13 16 0 0 0 41 13 73 333 3 0 0 8 6 12 6 0 0 4 2 16 8 24 140 0 0 0 0 0 0 0
14 12 22 24 191 177 10 7 29 24 18 18 57 49 248 22619 17 53 51 157 146 32 26 49 40 19 20 100 86 257 232
0 0 0 0 4 4 2 11 0 0 0 0 2 11 6 151 1 2 2 4 7 2 0 1 0 2 3 5 3 9 100 0 0 0 0 0 0 0
15558 12044 11814 11814 97706 89676 16120 11489 13086 13086 3425 1453 32631 26028 130337 115704
29750 29955 24950 26047 197830 179575 51321 40432 24513 21594 15805 12951 91639 74977 289469 254552
11770 10354 6602 5393 73128 62967 30386 22827 11174 10298 7818 6616 49378 39741 122506 102708
162 123 174 99 1426 1278 100 122 54 18 392 604 546 744 1972 20220 0 0 0 0 0 0 0 0 0 0 0 0 0
18 8 6 9 63 48 3 3 0 0 23 15 26 18 89 66
5 4 6 6 43 37 2 2 1 0 4 2 7 4 50 41
0 0 0 0 0 0 0 0 2 2 0 0 2 2 2 2
0 0 0 0 0 0 0 0 0 0
18480 14608 2376 1614 41370 32143 2191 1062 1854 1487 3632 3779 7677 6328 49047 38471
238 220 12 4 672 591 3 2 7 7 15 15 25 24 697 6151070 997 2892 2799 15946 15102 7371 7361 927 833 3448 2608 11746 10802 27692 25904
0 0 104 104 1125 1206 120 120 0 0 0 0 1125 1206
0 0 0 0 0 0 0 0 0 0
8810 8630 5410 4424 58225 50849 10425 11923 8620 3570 1190 1561 20235 17054 78460 679039 5 1849 1749 5244 4958 662 712 196 36 285 221 1143 969 6387 59270 0 1635 6567 7571 11939 525 490 0 0 1281 933 1806 1423 9377 13362
2437 2236 1460 906 13631 11728 7803 8854 4438 2988 527 700 12768 12542 26399 242700 0 50 0 456 366 0 0 0 0 0 16 0 16 456 3820 0 0 0 120 120 0 0 0 0 0 0 0 0 120 120
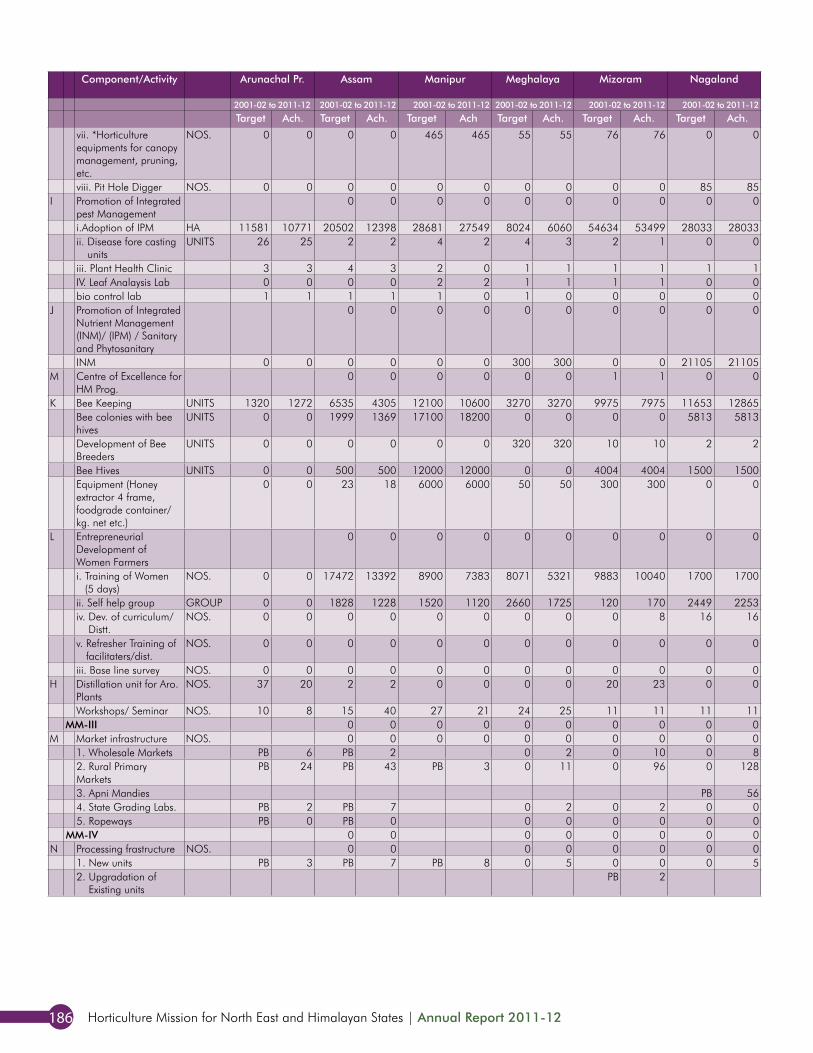
Horticulture Mission for North East and Himalayan States | Annual Report 2011-12186
Component/Activity Arunachal Pr. Assam Manipur Meghalaya Mizoram Nagaland
2001-02 to 2011-12 2001-02 to 2011-12 2001-02 to 2011-12 2001-02 to 2011-12 2001-02 to 2011-12 2001-02 to 2011-12
Target Ach. Target Ach. Target Ach Target Ach. Target Ach. Target Ach.
vii. *Horticulture equipments for canopy management, pruning, etc.
NOS. 0 0 0 0 465 465 55 55 76 76 0 0
viii. Pit Hole Digger NOS. 0 0 0 0 0 0 0 0 0 0 85 85I Promotion of Integrated
pest Management0 0 0 0 0 0 0 0 0 0
i.Adoption of IPM HA 11581 10771 20502 12398 28681 27549 8024 6060 54634 53499 28033 28033ii. Disease fore casting
unitsUNITS 26 25 2 2 4 2 4 3 2 1 0 0
iii. Plant Health Clinic 3 3 4 3 2 0 1 1 1 1 1 1IV. Leaf Analaysis Lab 0 0 0 0 2 2 1 1 1 1 0 0bio control lab 1 1 1 1 1 0 1 0 0 0 0 0
J Promotion of Integrated Nutrient Management (INM)/ (IPM) / Sanitary and Phytosanitary
0 0 0 0 0 0 0 0 0 0
INM 0 0 0 0 0 0 300 300 0 0 21105 21105M Centre of Excellence for
HM Prog.0 0 0 0 0 0 1 1 0 0
K Bee Keeping UNITS 1320 1272 6535 4305 12100 10600 3270 3270 9975 7975 11653 12865Bee colonies with bee hives
UNITS 0 0 1999 1369 17100 18200 0 0 0 0 5813 5813
Development of Bee Breeders
UNITS 0 0 0 0 0 0 320 320 10 10 2 2
Bee Hives UNITS 0 0 500 500 12000 12000 0 0 4004 4004 1500 1500Equipment (Honey extractor 4 frame, foodgrade container/kg. net etc.)
0 0 23 18 6000 6000 50 50 300 300 0 0
L Entrepreneurial Development of Women Farmers
0 0 0 0 0 0 0 0 0 0
i. Training of Women (5 days)
NOS. 0 0 17472 13392 8900 7383 8071 5321 9883 10040 1700 1700
ii. Self help group GROUP 0 0 1828 1228 1520 1120 2660 1725 120 170 2449 2253iv. Dev. of curriculum/
Distt.NOS. 0 0 0 0 0 0 0 0 0 8 16 16
v. Refresher Training of facilitaters/dist.
NOS. 0 0 0 0 0 0 0 0 0 0 0 0
iii. Base line survey NOS. 0 0 0 0 0 0 0 0 0 0 0 0H Distillation unit for Aro.
PlantsNOS. 37 20 2 2 0 0 0 0 20 23 0 0
Workshops/ Seminar NOS. 10 8 15 40 27 21 24 25 11 11 11 11MM-III 0 0 0 0 0 0 0 0 0 0
M Market infrastructure NOS. 0 0 0 0 0 0 0 0 0 01. Wholesale Markets PB 6 PB 2 0 2 0 10 0 82. Rural Primary Markets
PB 24 PB 43 PB 3 0 11 0 96 0 128
3. Apni Mandies PB 564. State Grading Labs. PB 2 PB 7 0 2 0 2 0 05. Ropeways PB 0 PB 0 0 0 0 0 0 0
MM-IV 0 0 0 0 0 0 0 0N Processing frastructure NOS. 0 0 0 0 0 0 0 0
1. New units PB 3 PB 7 PB 8 0 5 0 0 0 52. Upgradation of
Existing unitsPB 2
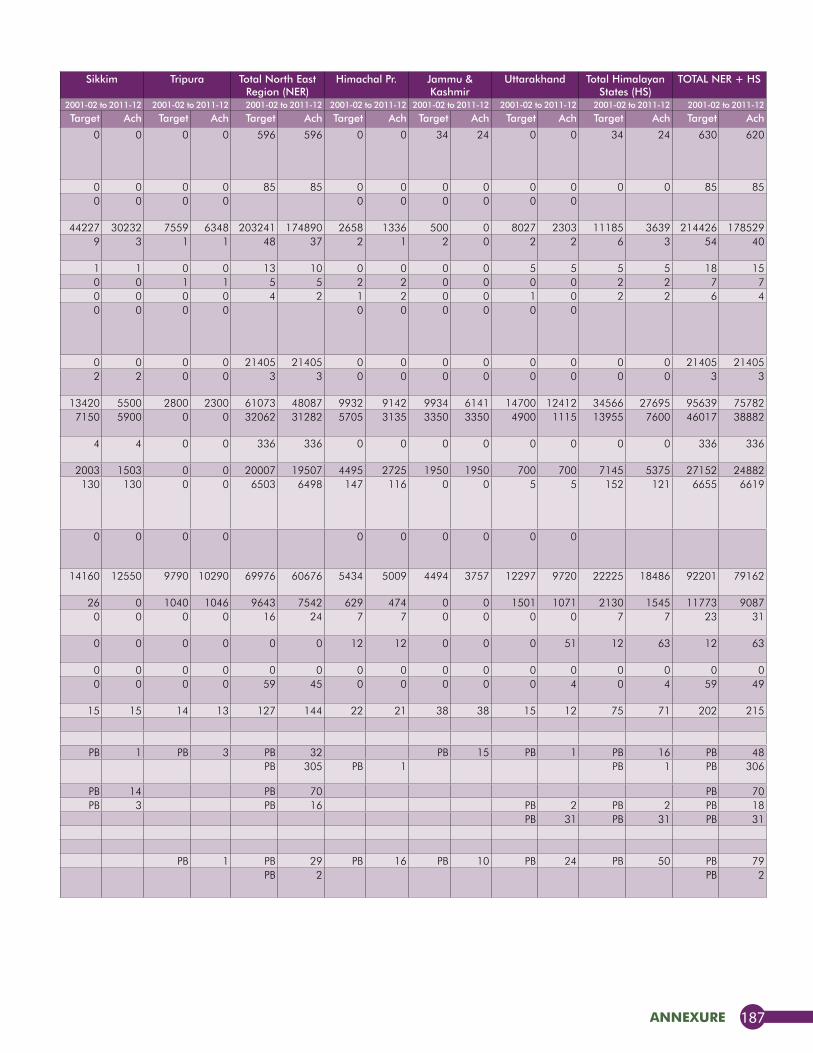
annexure 187
Sikkim Tripura Total North East Region (NER)
Himachal Pr. Jammu & Kashmir
Uttarakhand Total Himalayan States (HS)
TOTAL NER + HS
2001-02 to 2011-12 2001-02 to 2011-12 2001-02 to 2011-12 2001-02 to 2011-12 2001-02 to 2011-12 2001-02 to 2011-12 2001-02 to 2011-12 2001-02 to 2011-12
Target Ach Target Ach Target Ach Target Ach Target Ach Target Ach Target Ach Target Ach
0 0 0 0 596 596 0 0 34 24 0 0 34 24 630 620
0 0 0 0 85 85 0 0 0 0 0 0 0 0 85 850 0 0 0 0 0 0 0 0 0
44227 30232 7559 6348 203241 174890 2658 1336 500 0 8027 2303 11185 3639 214426 1785299 3 1 1 48 37 2 1 2 0 2 2 6 3 54 40
1 1 0 0 13 10 0 0 0 0 5 5 5 5 18 150 0 1 1 5 5 2 2 0 0 0 0 2 2 7 70 0 0 0 4 2 1 2 0 0 1 0 2 2 6 40 0 0 0 0 0 0 0 0 0
0 0 0 0 21405 21405 0 0 0 0 0 0 0 0 21405 214052 2 0 0 3 3 0 0 0 0 0 0 0 0 3 3
13420 5500 2800 2300 61073 48087 9932 9142 9934 6141 14700 12412 34566 27695 95639 757827150 5900 0 0 32062 31282 5705 3135 3350 3350 4900 1115 13955 7600 46017 38882
4 4 0 0 336 336 0 0 0 0 0 0 0 0 336 336
2003 1503 0 0 20007 19507 4495 2725 1950 1950 700 700 7145 5375 27152 24882130 130 0 0 6503 6498 147 116 0 0 5 5 152 121 6655 6619
0 0 0 0 0 0 0 0 0 0
14160 12550 9790 10290 69976 60676 5434 5009 4494 3757 12297 9720 22225 18486 92201 79162
26 0 1040 1046 9643 7542 629 474 0 0 1501 1071 2130 1545 11773 90870 0 0 0 16 24 7 7 0 0 0 0 7 7 23 31
0 0 0 0 0 0 12 12 0 0 0 51 12 63 12 63
0 0 0 0 0 0 0 0 0 0 0 0 0 0 0 00 0 0 0 59 45 0 0 0 0 0 4 0 4 59 49
15 15 14 13 127 144 22 21 38 38 15 12 75 71 202 215
PB 1 PB 3 PB 32 PB 15 PB 1 PB 16 PB 48PB 305 PB 1 PB 1 PB 306
PB 14 PB 70 PB 70PB 3 PB 16 PB 2 PB 2 PB 18
PB 31 PB 31 PB 31
PB 1 PB 29 PB 16 PB 10 PB 24 PB 50 PB 79PB 2 PB 2
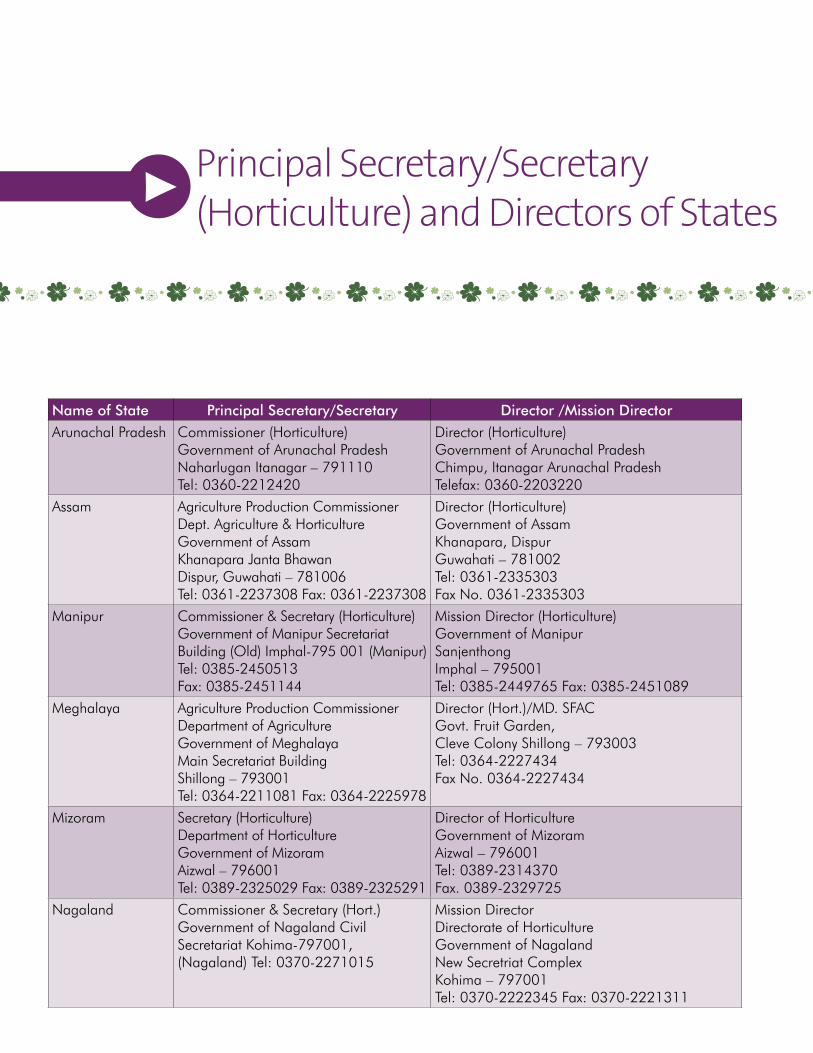
Principal Secretary/Secretary (Horticulture) and Directors of States
Name of State Principal Secretary/Secretary Director /Mission DirectorArunachal Pradesh Commissioner (Horticulture)
Government of Arunachal Pradesh Naharlugan Itanagar – 791110 Tel: 0360-2212420
Director (Horticulture) Government of Arunachal Pradesh Chimpu, Itanagar Arunachal Pradesh Telefax: 0360-2203220
Assam Agriculture Production Commissioner Dept. Agriculture & Horticulture Government of Assam Khanapara Janta Bhawan Dispur, Guwahati – 781006 Tel: 0361-2237308 Fax: 0361-2237308
Director (Horticulture) Government of Assam Khanapara, Dispur Guwahati – 781002 Tel: 0361-2335303 Fax No. 0361-2335303
Manipur Commissioner & Secretary (Horticulture) Government of Manipur Secretariat Building (Old) Imphal-795 001 (Manipur) Tel: 0385-2450513 Fax: 0385-2451144
Mission Director (Horticulture) Government of Manipur Sanjenthong Imphal – 795001 Tel: 0385-2449765 Fax: 0385-2451089
Meghalaya Agriculture Production Commissioner Department of Agriculture Government of Meghalaya Main Secretariat Building Shillong – 793001 Tel: 0364-2211081 Fax: 0364-2225978
Director (Hort.)/MD. SFAC Govt. Fruit Garden, Cleve Colony Shillong – 793003 Tel: 0364-2227434 Fax No. 0364-2227434
Mizoram Secretary (Horticulture) Department of Horticulture Government of Mizoram Aizwal – 796001 Tel: 0389-2325029 Fax: 0389-2325291
Director of Horticulture Government of Mizoram Aizwal – 796001 Tel: 0389-2314370 Fax. 0389-2329725
Nagaland Commissioner & Secretary (Hort.) Government of Nagaland Civil Secretariat Kohima-797001, (Nagaland) Tel: 0370-2271015
Mission Director Directorate of Horticulture Government of Nagaland New Secretriat Complex Kohima – 797001 Tel: 0370-2222345 Fax: 0370-2221311
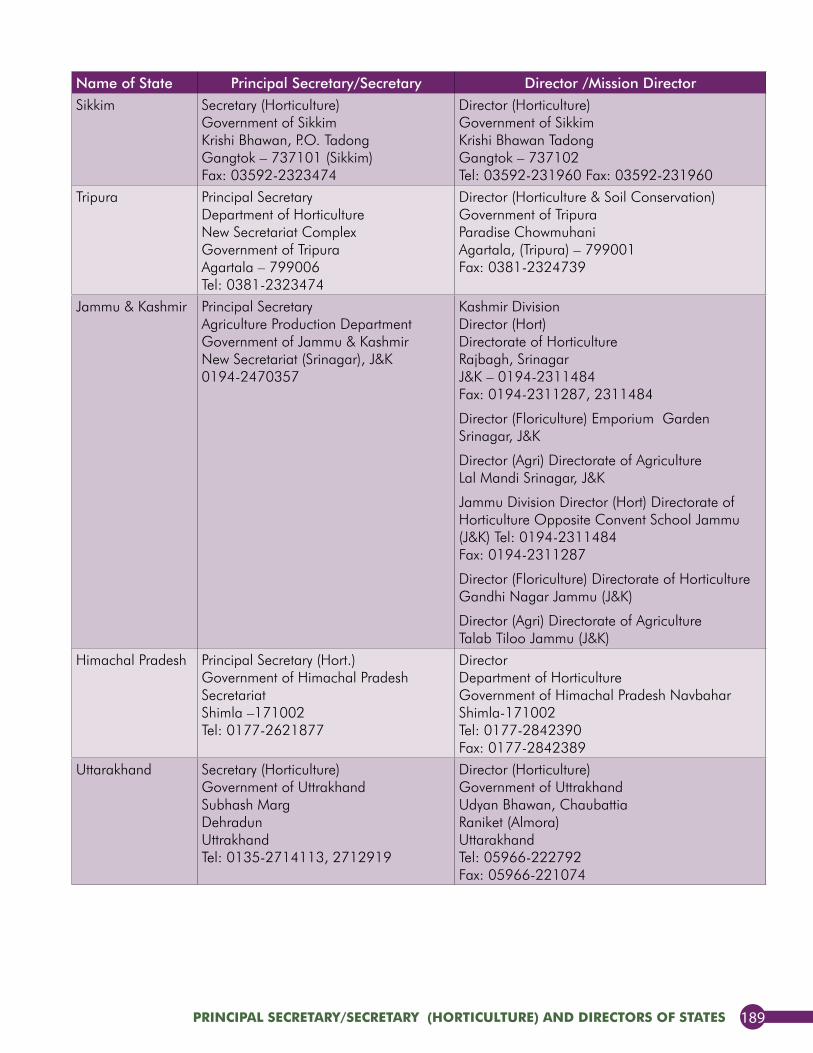
principal Secretary/Secretary (hOrticulture) anD DirectOrS Of StateS 189
Principal Secretary/Secretary (Horticulture) and Directors of States
Name of State Principal Secretary/Secretary Director /Mission DirectorSikkim Secretary (Horticulture)
Government of Sikkim Krishi Bhawan, P.O. Tadong Gangtok – 737101 (Sikkim) Fax: 03592-2323474
Director (Horticulture) Government of Sikkim Krishi Bhawan Tadong Gangtok – 737102 Tel: 03592-231960 Fax: 03592-231960
Tripura Principal Secretary Department of Horticulture New Secretariat Complex Government of Tripura Agartala – 799006 Tel: 0381-2323474
Director (Horticulture & Soil Conservation) Government of Tripura Paradise Chowmuhani Agartala, (Tripura) – 799001 Fax: 0381-2324739
Jammu & Kashmir Principal Secretary Agriculture Production Department Government of Jammu & Kashmir New Secretariat (Srinagar), J&K 0194-2470357
Kashmir Division Director (Hort) Directorate of Horticulture Rajbagh, Srinagar J&K – 0194-2311484 Fax: 0194-2311287, 2311484
Director (Floriculture) Emporium Garden Srinagar, J&K
Director (Agri) Directorate of Agriculture Lal Mandi Srinagar, J&K
Jammu Division Director (Hort) Directorate of Horticulture Opposite Convent School Jammu (J&K) Tel: 0194-2311484 Fax: 0194-2311287
Director (Floriculture) Directorate of Horticulture Gandhi Nagar Jammu (J&K)
Director (Agri) Directorate of Agriculture Talab Tiloo Jammu (J&K)
Himachal Pradesh Principal Secretary (Hort.) Government of Himachal Pradesh Secretariat Shimla –171002 Tel: 0177-2621877
Director Department of Horticulture Government of Himachal Pradesh Navbahar Shimla-171002 Tel: 0177-2842390 Fax: 0177-2842389
Uttarakhand Secretary (Horticulture) Government of Uttrakhand Subhash Marg Dehradun Uttrakhand Tel: 0135-2714113, 2712919
Director (Horticulture) Government of Uttrakhand Udyan Bhawan, Chaubattia Raniket (Almora) Uttarakhand Tel: 05966-222792 Fax: 05966-221074