Embed Size (px)
Citation preview

ix
Preface
1. This Report has been prepared for submission to the Governor
under Art icle 151 o f the Const itut ion.
2. Chapters I and II of this Report respect ive ly contain Audit
observat ions on mat ters ar ising from examinat ion o f Finance
Accounts and Appropr iat ion Accounts of the State
Government for the year ended 31 March 2008.
3. Chapter III deals with the find ings of per formance audit in
var ious departments while Chapter IV deals with the findings
of audit o f t ransact ions inc luding Public Works, Irr igat ion,
audit o f Autonomous Bodies and departmentally run
commercia l undertakings. Chapter V deals with the comment s
on internal control mechanism exist ing in selected
departments in the State.
4. The Report containing the observat ions ar is ing out of aud it o f
Statutory Corporat ions, Boards and Government Companies
and the Report containing such observat ions on Revenue
Receipts are presented separately.
5. The cases ment ioned in the Report are among those which
came to not ice in t he course o f test aud it of accounts dur ing
the year 200708 as well as those which had come to not ice in
ear lier years but could not be dealt with in previous Reports;
mat ters relat ing to the per iod subsequent to 200708 have
also been included wherever necessary.

Overview
xi
OVERVIEW
The Report includes two Chapters containing observations on Finance and Appropriation Accounts of the Government of Madhya Pradesh for the year 200708 and three others comprising four reviews, one long paragraph and 19 paragraphs dealing with the results of performance audit of selected programmes and schemes as well as audit of the financial transactions of the Government. The audit has been conducted in accordance with the Auditing Standards prescribed for the Indian Audit and Accounts Department. Audit samples have been drawn based on statistical sampling methods as well as on judgement basis. The specific audit methodology adopted for programmes and schemes has been mentioned in the reviews. The audit conclusions have been drawn and recommendations made taking into consideration the views of the Government. A summary of the important findings is given below:
1. Finances of the State Government
Revenue expenditure increased by 14 per cent while the revenue receipts registered a significant growth of 19 per cent as a result of which State Government achieved a revenue surplus of Rs.5,088 crore during 200708 as against Rs.3,331 crore during 200607. The revenue surplus of Rs.5,088 crore includes Rs.363 crore of debt relief received under DCRF to State by the GOI. During 200708, 48 per cent of the revenue (Rs.14,756 crore) came from the State's own resources. Arrear of revenue were Rs.802 crore at the end of the year 200708.
Fiscal deficit increased from Rs.2,755 crore in 200607 to Rs.2784 crore in 200708 representing 1.96 per cent of the GSDP. There was primary surplus of Rs.1,407 crore in 200708 as against primary surplus of Rs.1,274 crore in previous year. Revenue expenditure as a percentage to GSDP increased from 17.44 to 18 per cent while capital expenditure as a percentage to GSDP increased from 4.03 to 4.81 per cent during 200708. The committed expenditure on salaries, pension and interest payments constitute about 68 per cent of NPRE during 200708.
Fiscal liabilities of the State increased from Rs.53,280 crore in 200607 to Rs.55,311 crore in 200708 and their ratio to GSDP decreased from 42 to 39 per cent during the period.
Recovery of outstanding loans and advances given by the State Government as well as returns on Government's investment was meagre and the Government continued to invest in loss making corporations and companies.
(Paragraphs 1.1 to 1.12)

Audit Report (Civil) for the year ended 31 March 2008
xii
2. Allocative Priorities and Appropriation
As against the total grants/appropriations of Rs.43,500.58 crore, the actual expenditure during 200708 was Rs.36,104.87 crore resulting in savings of Rs.7,395.71 crore in 171 cases of grants/appropriations. Excess expenditure aggregating to Rs.5,161.40 crore pertaining to the years 199394 to 200607 had not been regularised (August 2008).
In 17 schemes, expenditure in each case exceeded by Rupees five crore or more and also more than 100 per cent of total provision aggregating to Rs.379.26 crore.
Supplementary provision of Rs.901.43 crore obtained in 38 cases during the year proved unnecessary.
Controlling officers under 11 Major Heads involving expenditure of Rs.2,534.78 crore, representing 7.02 per cent of the total expenditure during the year did not carry out reconciliation of expenditure figures.
In 10 cases, against the available savings of Rs.255.77 crore, Rs.286.03 crore was surrendered, resulting in injudicious excess surrender of Rs.30.26 crore.
(Paragraphs 2.1 to 2.7.7)
3. Implementation of Watershed Development Programmes
Watershed Development Programmes were taken up to obviate the drought conditions, prevention of land degradation and improving the soil fertility to achieve sustained growth in agriculture productivity. Deviations in planning of watershed projects and selection of villages under the programmes during 200308 were noticed which compromised the objectives of the programme. Components were not executed in prescribed sequence. The progress of project activities in testchecked districts was 65 percent. Due to slow progress, the projects could not be completed in time and many completed projects have not been handed over to watershed committees for operation and maintenance. Impact of the activities under the programme was not assessed to determine the extent of change in socioeconomic environment.
(Paragraph 3.1)
4. National Programme of Nutritional Support to Primary Education (Mid Day Meal)
The Mid Day Meal (MDM) scheme was launched as a centrally sponsored scheme with the objective of boosting universalisation of primary education by increasing enrolment, attendance, retention and simultaneous improvement in
Overview
xiii
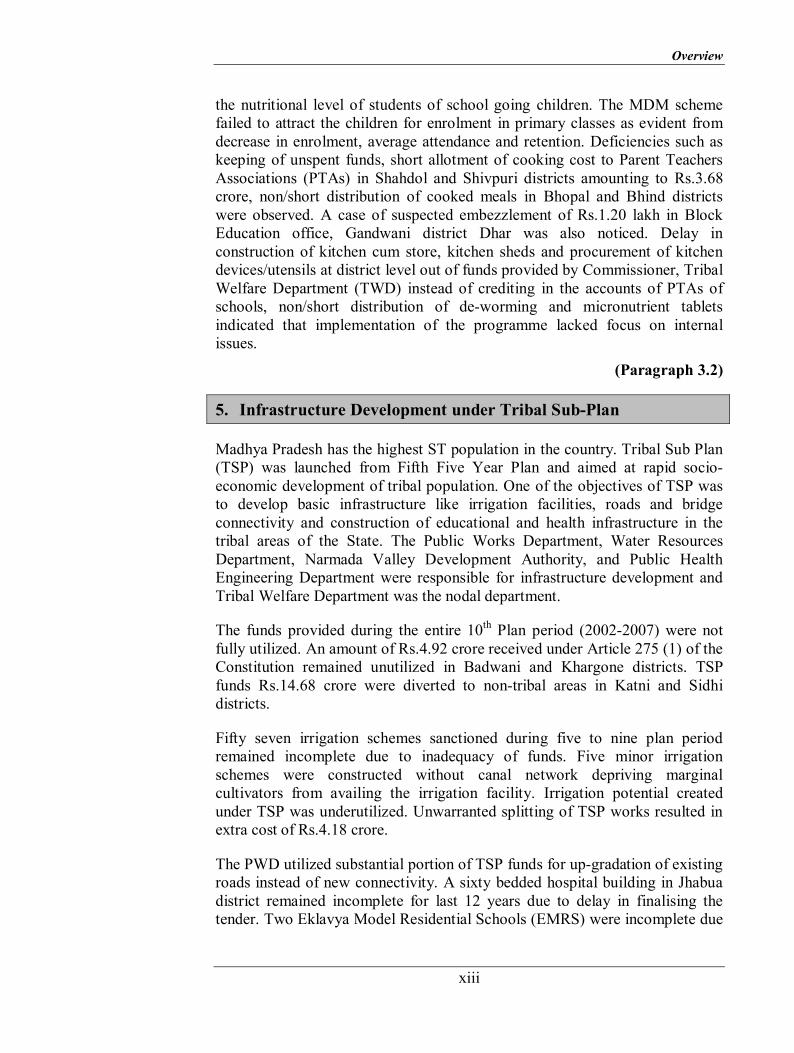
the nutritional level of students of school going children. The MDM scheme failed to attract the children for enrolment in primary classes as evident from decrease in enrolment, average attendance and retention. Deficiencies such as keeping of unspent funds, short allotment of cooking cost to Parent Teachers Associations (PTAs) in Shahdol and Shivpuri districts amounting to Rs.3.68 crore, non/short distribution of cooked meals in Bhopal and Bhind districts were observed. A case of suspected embezzlement of Rs.1.20 lakh in Block Education office, Gandwani district Dhar was also noticed. Delay in construction of kitchen cum store, kitchen sheds and procurement of kitchen devices/utensils at district level out of funds provided by Commissioner, Tribal Welfare Department (TWD) instead of crediting in the accounts of PTAs of schools, non/short distribution of deworming and micronutrient tablets indicated that implementation of the programme lacked focus on internal issues.
(Paragraph 3.2)
5. Infrastructure Development under Tribal SubPlan
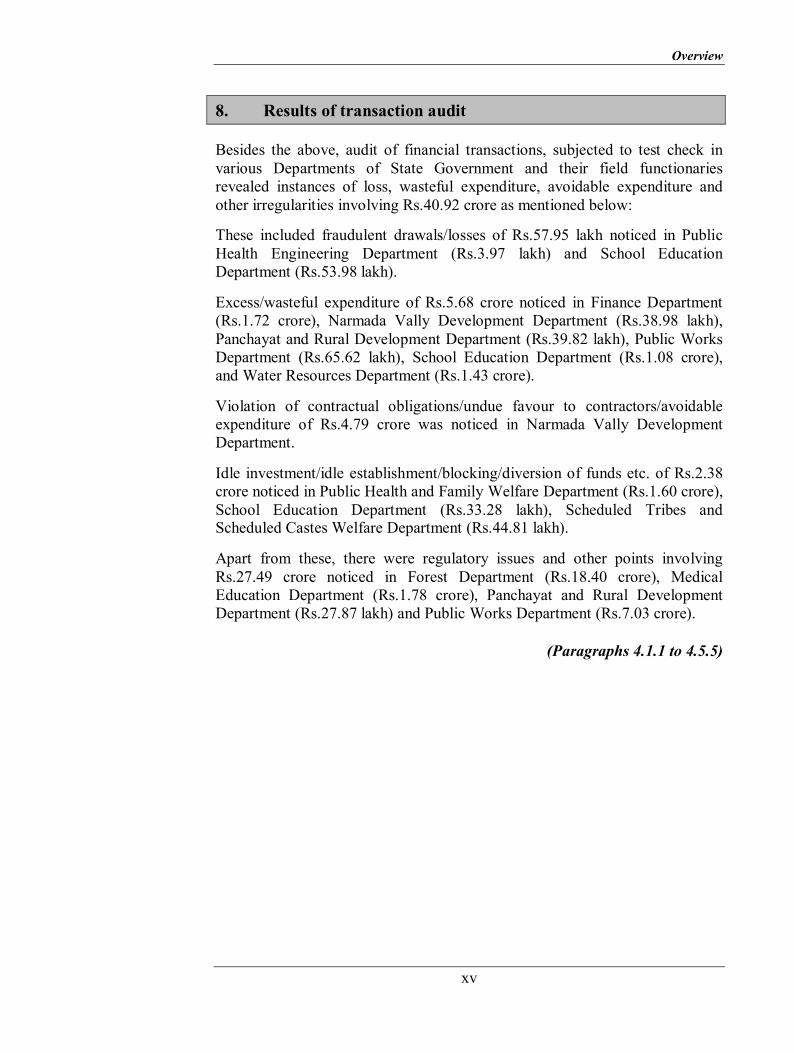
Madhya Pradesh has the highest ST population in the country. Tribal Sub Plan (TSP) was launched from Fifth Five Year Plan and aimed at rapid socio economic development of tribal population. One of the objectives of TSP was to develop basic infrastructure like irrigation facilities, roads and bridge connectivity and construction of educational and health infrastructure in the tribal areas of the State. The Public Works Department, Water Resources Department, Narmada Valley Development Authority, and Public Health Engineering Department were responsible for infrastructure development and Tribal Welfare Department was the nodal department.
The funds provided during the entire 10 th Plan period (20022007) were not fully utilized. An amount of Rs.4.92 crore received under Article 275 (1) of the Constitution remained unutilized in Badwani and Khargone districts. TSP funds Rs.14.68 crore were diverted to nontribal areas in Katni and Sidhi districts.
Fifty seven irrigation schemes sanctioned during five to nine plan period remained incomplete due to inadequacy of funds. Five minor irrigation schemes were constructed without canal network depriving marginal cultivators from availing the irrigation facility. Irrigation potential created under TSP was underutilized. Unwarranted splitting of TSP works resulted in extra cost of Rs.4.18 crore.
The PWD utilized substantial portion of TSP funds for upgradation of existing roads instead of new connectivity. A sixty bedded hospital building in Jhabua district remained incomplete for last 12 years due to delay in finalising the tender. Two Eklavya Model Residential Schools (EMRS) were incomplete due

Audit Report (Civil) for the year ended 31 March 2008
xiv
to slow progress by contractors and one additional 50 seated hostel building remained incomplete due to non availability of funds.
(Paragraph 3.3)
6. Irrigation facilities in Narmada Tapti Basin
Programme was aimed to create additional irrigation potential of 1.02 lakh hectare (ha) by constructing 434 projects during 200208. One hundred eight projects could only be completed and 0.22 lakh ha additional irrigation potential was created till March 2008. The work of 104 projects was not started. The progress of survey work was also tardy. Moreover, utilization of irrigation potential created was only 25.35 per cent. Rs 35.27 crore was spent in excess over sanctioned cost of 46 projects. Rs 39.95 crore spent on 21 projects remained blocked due to noncompletion of canal component. Rupees 32.11 crore spent on 53 projects was unfruitful due to non transfer of 837.531 ha. forestland. Forty four projects constructed at a cost of Rs 29.09 crore without canal component did not meet the objectives of the projects. Annual maintenance and repair works were not attended properly due to inadequate allotment of fund on maintenance.
(Paragraph 3.4)
7. Internal Control in Mahila Evam Bal Vikas Department
Internal Control is an integral part of an organizations operation and is the principal focus of the internal audits attention. A review of the system revealed that the internal controls in the department were weak.
The system of financial controls including preparation of budget estimates was deficient as savings were noticed each year and supplementary provisions were made without requirement. Departmental figures were not reconciled with Accountant General (A&E) figures. There were shortcomings in maintenance of cash books and other basic records. Nongazzetted employees were irregularly vested with drawing and disbursing powers. Assistance was provided to ineligible beneficiaries under Ladli Laxmi Yojna and deficiencies noticed in implementation of Local Food Model Scheme. Instead of providing weaning food to children in the age group six months to 12 months, solid food was provided. Medicine and preeducation kits were not supplied during 200608. Shortfall in providing Supplementary Nutrition to beneficiaries ranged between 37 and 53 per cent. The internal audit wing is required to plan its coverage scientifically.
(Paragraph 5.1 )
Overview
xv
8. Results of transaction audit
Besides the above, audit of financial transactions, subjected to test check in various Departments of State Government and their field functionaries revealed instances of loss, wasteful expenditure, avoidable expenditure and other irregularities involving Rs.40.92 crore as mentioned below:
These included fraudulent drawals/losses of Rs.57.95 lakh noticed in Public Health Engineering Department (Rs.3.97 lakh) and School Education Department (Rs.53.98 lakh).
Excess/wasteful expenditure of Rs.5.68 crore noticed in Finance Department (Rs.1.72 crore), Narmada Vally Development Department (Rs.38.98 lakh), Panchayat and Rural Development Department (Rs.39.82 lakh), Public Works Department (Rs.65.62 lakh), School Education Department (Rs.1.08 crore), and Water Resources Department (Rs.1.43 crore).
Violation of contractual obligations/undue favour to contractors/avoidable expenditure of Rs.4.79 crore was noticed in Narmada Vally Development Department.
Idle investment/idle establishment/blocking/diversion of funds etc. of Rs.2.38 crore noticed in Public Health and Family Welfare Department (Rs.1.60 crore), School Education Department (Rs.33.28 lakh), Scheduled Tribes and Scheduled Castes Welfare Department (Rs.44.81 lakh).
Apart from these, there were regulatory issues and other points involving Rs.27.49 crore noticed in Forest Department (Rs.18.40 crore), Medical Education Department (Rs.1.78 crore), Panchayat and Rural Development Department (Rs.27.87 lakh) and Public Works Department (Rs.7.03 crore).
(Paragraphs 4.1.1 to 4.5.5)

CHAPTER I
Finances of the State Government 1.1 Introduction
The accounts of the State Government are kept in three parts (i) Consolidated Fund, (ii) Contingency Fund and (iii) Public Account (Appendix 1.1 Part A). The Finance Accounts of the Government of Madhya Pradesh are laid out in nineteen statements, presenting receipts and expenditure, revenue as well as capital, in the Consolidated Fund, Contingency Fund and the Public Account of the State of Madhya Pradesh. The lay out of the Finance Accounts is depicted in Appendix 1.1Part B. In terms of the Madhya Pradesh Reorganization Act 2000 (No.28 of 2000) 16 1 districts of the erstwhile State of Madhya Pradesh formed the new State of Chhattisgarh on 1 November 2000. The apportionment of assets and liabilities of the composite State of Madhya Pradesh immediately prior to that date as also the other financial adjustments are being carried out in each case in accordance with the provisions of the Act 2 . The actual progress achieved in this direction is indicated in Appendix1.2. 1.1.1 Summary of Receipts and Disbursements Table1.1 summarises the finances of the Government of Madhya Pradesh for the year 200708 covering revenue receipts and expenditure, capital receipts and expenditure and public accounts receipts/disbursements as emerging from Statement1 of Finance Accounts and other detailed statements.
Table No. 1.1 : Summary of receipts and disbursements for the year 200708 (Rupees in crore)
200607 Receipts 200708 200607 Disbursements 200708 SectionA: Revenue
NonPlan Plan Total 25694.28 I. Revenue receipts 30688.74 22362.61 I. Revenue expenditure 18794.82 6806.29 25601.11 10473.13 Tax revenue 12018.18 8602.11 General services 9283.49 70.86 9354.35 2658.46 Nontax revenue 2738.19 7576.48 Social Services 4902.18 3243.28 8145.46 8088.54 Share of Union
Taxes/Duties 10202.96 4880.17 Economic Services 3287.84 3249.62 6537.46
4474.15 Grants from Govt. of India 5729.41 1303.85 Grantsinaid / Contributions 1321.31 242.53 1563.84 SectionB: Capital
9.19 II Misc. Capital Receipts 11.07 5169.94 II Capital Outlay 322.23 6510.47 6832.70 28.12 III. Recoveries of Loans
and Advances 105.24 953.07 III Loans and Advances
disbursed 708.49 446.39 1154.88
4602.97 IV Public debt receipts 3370.95 1731.53 IV Repayment of Public Debt 1677.00
32225.38 V Public account receipts 39895.93 30768.82 V Public account disbursements
39423.29
1.11 VI Inter State Settlement 1.79 1.33 VI. Inter State Settlement 2.06 68.15 VII Contingency Fund 60.00 VII Appropriation to Contingency
Fund
827.87 Opening Cash Balance 2409.77 2409.77 Closing Cash Balance 1792.45 63457.07 Total 76483.49 63457.07 Total 19825.54 13763.15 76483.49
1 Baster, Bilaspur, Dantewara, Dhamtari, Durg, JanjgirChampa, Jashpur, Kanker, Kawardha, Korba, Koria, Mahasamund, Raigarh, Raipur, Rajnandgaon and Surguja.
2 ibid

Audit Report (Civil) for the year ended 31 March 2008
2
Following are the major changes during 200708 over the previous year:
Ø Revenue Receipts have increased by Rs. 4,995 crore mainly due to increase in Share of Union Taxes and duties (Rs.2,115 crore), grants from Government of India (Rs. 1,255 crore), Tax Revenue (Rs. 1,545 crore) and Non Tax Revenue (Rs. 80 crore).
Ø Revenue expenditure increased by Rs. 3,238 crore and Capital expenditure increased by Rs.1,663 crore .
Ø The recovery of loans and advances marginally increased to Rs.105 crore during current year from Rs.28 crore in the previous year. Disbursement of loans and advances by State Government increased by Rs.202 crore mainly on account of loans under Water Supply, Sanitation, Housing and Urban Development (Rs.283 crore), Miscellaneous General Services (Rs.63 crore) and Agriculture and allied activities (Rs. 26 crore) which was partly offset by decrease in loans under energy sector (Rs.135 crore), and Transport(Rs.35 crore).
Ø Public debt receipts and repayments decreased by Rs. 1,232 crore and Rs. 55 crore respectively in 200708 over previous year. The decline in Public Debt receipts was mainly due to decline in internal debt by Rs. 1,340 crore which was partly offset by increase in loans and advances by Government of India (Rs.108 crore).
Ø Public Account Receipts and disbursements increased by Rs.7,671 crore and Rs.8,654 crore respectively in 200708 relative to previous year resulting in net decrease of Rs.983 crore in Public Account receipts.
Ø As a result of inflow/outflow of the funds stated above, the cash balances of the State at the close of 200708 decreased by Rs.617 crore over the previous year.
1.1.2 State Fiscal Position by Key Indicators
The fiscal position of the State Government as reflected by key fiscal indicators during the current year as compared to the previous year is given in Table 1.2.
Chapter I Finances of the State Government
3
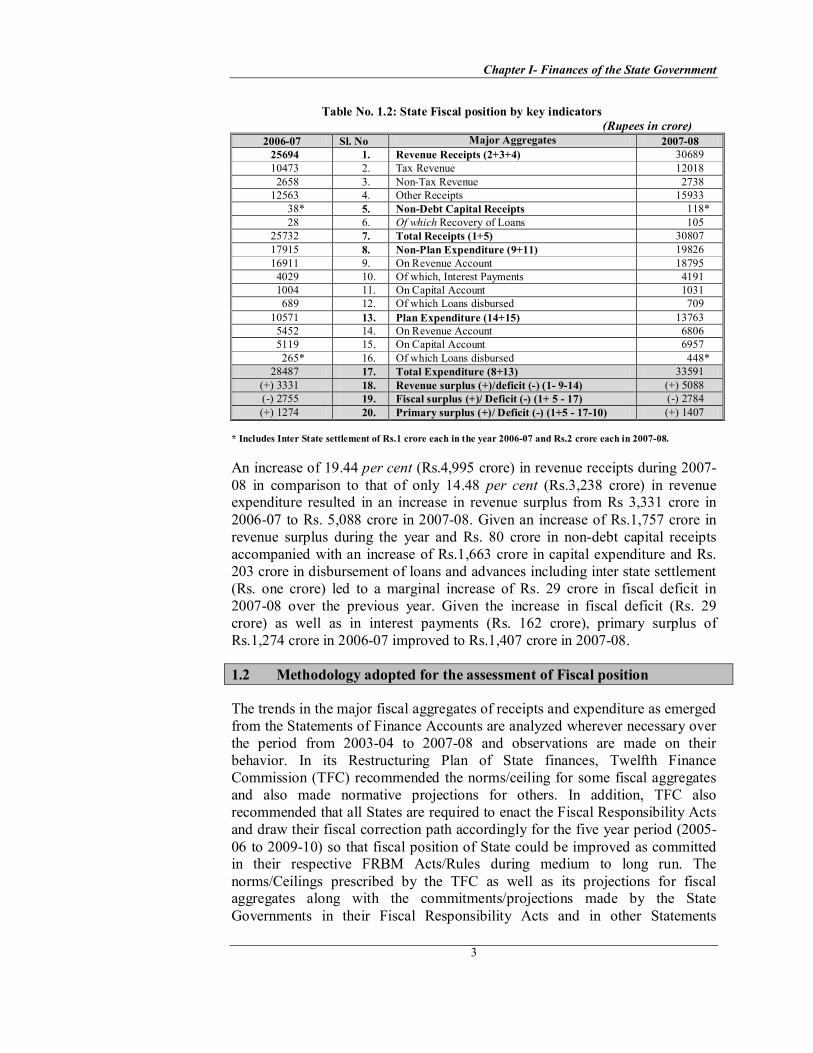
Table No. 1.2: State Fiscal position by key indicators (Rupees in crore)
200607 Sl. No Major Aggregates 200708 25694 1. Revenue Receipts (2+3+4) 30689 10473 2. Tax Revenue 12018 2658 3. NonTax Revenue 2738 12563 4. Other Receipts 15933
38* 5. NonDebt Capital Receipts 118* 28 6. Of which Recovery of Loans 105
25732 7. Total Receipts (1+5) 30807 17915 8. NonPlan Expenditure (9+11) 19826 16911 9. On Revenue Account 18795 4029 10. Of which, Interest Payments 4191 1004 11. On Capital Account 1031 689 12. Of which Loans disbursed 709
10571 13. Plan Expenditure (14+15) 13763 5452 14. On Revenue Account 6806 5119 15. On Capital Account 6957 265* 16. Of which Loans disbursed 448*
28487 17. Total Expenditure (8+13) 33591 (+) 3331 18. Revenue surplus (+)/deficit () (1 914) (+) 5088 () 2755 19. Fiscal surplus (+)/ Deficit () (1+ 5 17) () 2784 (+) 1274 20. Primary surplus (+)/ Deficit () (1+5 1710) (+) 1407
* Includes Inter State settlement of Rs.1 crore each in the year 200607 and Rs.2 crore each in 200708.
An increase of 19.44 per cent (Rs.4,995 crore) in revenue receipts during 2007 08 in comparison to that of only 14.48 per cent (Rs.3,238 crore) in revenue expenditure resulted in an increase in revenue surplus from Rs 3,331 crore in 200607 to Rs. 5,088 crore in 200708. Given an increase of Rs.1,757 crore in revenue surplus during the year and Rs. 80 crore in nondebt capital receipts accompanied with an increase of Rs.1,663 crore in capital expenditure and Rs. 203 crore in disbursement of loans and advances including inter state settlement (Rs. one crore) led to a marginal increase of Rs. 29 crore in fiscal deficit in 200708 over the previous year. Given the increase in fiscal deficit (Rs. 29 crore) as well as in interest payments (Rs. 162 crore), primary surplus of Rs.1,274 crore in 200607 improved to Rs.1,407 crore in 200708.
1.2 Methodology adopted for the assessment of Fiscal position
The trends in the major fiscal aggregates of receipts and expenditure as emerged from the Statements of Finance Accounts are analyzed wherever necessary over the period from 200304 to 200708 and observations are made on their behavior. In its Restructuring Plan of State finances, Twelfth Finance Commission (TFC) recommended the norms/ceiling for some fiscal aggregates and also made normative projections for others. In addition, TFC also recommended that all States are required to enact the Fiscal Responsibility Acts and draw their fiscal correction path accordingly for the five year period (2005 06 to 200910) so that fiscal position of State could be improved as committed in their respective FRBM Acts/Rules during medium to long run. The norms/Ceilings prescribed by the TFC as well as its projections for fiscal aggregates along with the commitments/projections made by the State Governments in their Fiscal Responsibility Acts and in other Statements

Audit Report (Civil) for the year ended 31 March 2008
4
required to be laid in the legislature under the Act are used to make qualitative assessment of the trends and pattern of major fiscal aggregates during the current year. Assuming that GSDP is the good indicator of the performance of the State’s economy, major fiscal aggregates like tax and nontax revenue, revenue and capital expenditure, internal debt and revenue and fiscal deficits have been presented as percentage to the Gross State Domestic Product (GSDP) 3 at current market prices. The buoyancy coefficients for tax revenues, nontax revenues, revenue expenditure etc, with reference to the base represented by GSDP have also been worked out to assess as to whether the mobilization of resources, pattern of expenditure etc, are keeping pace with the change in the base or these fiscal aggregates are also affected by factors other than GSDP. The new GSDP series with 19992000 as base (Table 1.3) as published by the Directorate of Economics and Statistics of the State Government have been used in estimating these percentages and buoyancy ratios.
Table No. 1.3: Gross State Domestic Product (GSDP) – Growth Trends
# GSDP estimates for the period 200307 are as revised by the Directorate of Economics & Statistics, Government of Madhya Pradesh. As a result percentage ratio/buoyancies of various parameters with reference to GSDP have also been revised.
* A Advanced estimates; QQuick estimates
The key fiscal aggregates for the purpose are grouped under four major heads: (i) Trends and composition of aggregate receipts, (ii) Application of Resources, (iii) Assets and Liabilities, and (iv) Management of Deficits. The overall financial performance of the State Government as a body corporate has been presented by the application of a set of ratios commonly adopted for the relational interpretation of fiscal aggregates. The definitions of some of the selected terms used in assessing the trends and pattern of fiscal aggregates are given in Appendix 1.1 Part C.
The summarized financial position of the Government i.e. assets and liabilities, abstracts of receipts and disbursements for the year 200708, sources and application of funds and time series data is given in Appendix 1.2, 1.4, 1.5, 1.6 and 1.11
1.2.1 The Fiscal Responsibility and Budget Management (FRBM) Act, 2005 The State Government has enacted the Madhya Pradesh Rajkoshiya Uttardayitva Avam Budget Prabandhan Adhiniyam, 2005 (Fiscal Responsibility and Budget Management (FRBM) Act 2005) which came into force from 1 st January 2006 to ensure prudence in fiscal management and fiscal stability by progressive elimination of revenue deficit, reduction in fiscal deficit, prudent
3 GSDP is defined as the total income of the State at current prices or the market value of goods and services produced using labour and all other factors of production.
Estimates 200304 200405 200506 200607 200708 Gross State Domestic Product (GSDP)# (Rupees in crore)
102839 107282 116322 128202(Q) 142204(A)
Rates of Growth GSDP (per cent) 18.43 4.32 8.43 10.21 10.92

Chapter I Finances of the State Government
5
debt management consistent with fiscal sustainability, greater transparency in fiscal operations of the Government and conduct of fiscal policy in a medium term framework and for matters connected therewith or incidental thereto. To give effect to the fiscal management objectives as laid down in the Act, and/or the rules framed (30 January 2006) there under the following fiscal targets were prescribed for the State Government:
Ø Reduce revenue deficit in each financial year so as to eliminate it by 31 st March 2009 and generate revenue surplus thereafter;
Ø Reduce fiscal deficit in each financial year so as to bring it down to not more than three per cent of GSDP by 31 st March 2009;
Ø Ensure that within a period of 10 years, i.e. as on the 31 st March 2015, total liabilities do not exceed 40 per cent of the estimated GSDP for that year; and
Ø Limit the annual incremental guarantees so as to ensure that the guarantees do not exceed 80 per cent of the total revenue receipts in the year preceding the current year.
Provided that revenue deficit and fiscal deficit may exceed the limits specified under this section due to ground(s) of shortfall in the Central tax devolutions in relation to the budgetary estimates of the Union of India and/or unforeseen demands on the finances of the State Government arising out of internal disturbance or natural calamity or such other exceptional grounds as the State Government may specify.
1.2.1.1 Roadmap to achieve the Fiscal Targets as laid down in FRBM Act/Rules
In accordance with the provisions of the FRBM Act 2005, the State Government has placed the (a) MacroEconomic framework Statement, (b) Medium Term Fiscal Policy Statement (MTFPS) and (c) Fiscal policy strategy statement along with the Budget for 200708. The actuals for 200506, RE for 200607 and BE for 200708 for select indicators were presented in MTFPS (Appendix 1.3).
In terms of an incentive scheme of TFC, a reward for fiscal performance was built into the debtwrite off package under DCRF 4 . According to the scheme, the quantum of write off of repayment of GOI loans after consolidation and reschedulement will be linked to the absolute amount by which revenue deficit is reduced in each successive year during the award period. In effect, if the revenue deficit is brought to zero, the entire repayment during the period will be written off. For States which were in revenue surplus as per the base year figure (200304) and continued to remain so in the subsequent years till the end of TFC award period, the installment of repayment due on the Central loans (after
4 In pursuance of the recommendations of the Twelfth Finance Commission (TFC) for fiscal consolidation and elimination of revenue deficit of the State. Government of India formulated a scheme “The States debt consolidation and Relief Facility (DCRF) (200506 to 200910)” under which general debt relief is provided by consolidating and rescheduling at substantially reduced rate of interest the Central loans granted to States on enacting the MPFRBM Act and debt waiver is granted based on fiscal performance, linked to the reduction of revenue deficits of State.

Audit Report (Civil) for the year ended 31 March 2008
6
consolidation and reschedulement) may be writtenoff in each year from 2005 06 onwards so long as the revenue surplus of the State does not go below the base year level in absolute terms. As a result of improved fiscal performance in terms of this criterion, the State Government received a debt waiver of Rs. 363.06 crore for the current year. The fiscal performance of the State visàvis FRBM targets and those framed in MidTerm Fiscal Policy for the year 200708 is presented in Table 1.4.
Table No. 1.4
Fiscal forecasts FRBM Targets Projection as per MTFPS Actual
Revenue Deficit ()/ Surplus (+)(Rupees in crore)
To be wiped out by 200809
(+) 2007 (+) 5088
Fiscal Deficit ()/ Surplus (+) (Rupees in crore)
To reduce to not more than 3 per cent of GSDP by 200809 (4266)
() 4655 FD to be 3.34 Per cent of GSDP
() 2,784 (1.96 per cent of GSDP)
Total Fiscal Liabilities 40 per cent of GSDP by 31 March 2015 49 per cent of GSDP 39.50 per cent of
GSDP
Outstanding Guarantees Not to exceed 80 per cent of the total RR of preceding year
73.19 per cent of RR of preceding year
3.33per cent* of RR of preceding year
*To the extent information was available in Finance Accounts.
The table reveals that the State Government had achieved revenue surplus three years ahead of the scheduled period and contained the fiscal deficit well within the limit of 3 per cent of GSDP prescribed in FRBM targets and projections as per MTFPS. The total fiscal liabilities to GSDP ratio at 39.50 per cent is within the FRBM target to be achieved by 31 st March 2015 but is significantly less than the projected 49 per cent in MTFPS. The outstanding guarantees (includes the extent to which information is depicted in Finance Accounts) during the year were only 3.33 per cent of revenue receipts of the preceding year as against the MPFPS projection of 73 per cent and the FRBM target of 80 per cent during the year.
1.2.1.2 MidTerm Review of the Fiscal Situation
In compliance with Section 11 (1) of FRBM Act 2005, the Finance Minister undertook a half yearly review in November 2007 and the outcome of the review was placed before the legislature in November 2007. The outcome of the half yearly review of trends in receipt and expenditure at the end of the second quarter showed that the total nondebt receipts and the fiscal deficit were better than the benchmarks prescribed under Rule 8 of FRBM rules January, 2006. Therefore no further corrective measures were required to be taken by the State Government.
1.3 Trends and composition of aggregate receipts
The aggregate receipts of State Government consist of revenue receipts and capital receipts. Revenue receipts consist of tax revenues, nontax revenues, State’s share of union taxes and duties and grantsinaid from the Government of India (GOI). Capital receipts consist of miscellaneous capital receipts such as

Chapter I Finances of the State Government
7
proceeds from disinvestments, recoveries of loans and advances, debt receipts from internal sources (market loans, borrowings from financial institutions/commercial banks) and loans and advances from GOI as well as accruals from Public Account. Table1.5 shows that the total receipts of the State Government for the year 200708 were Rs. 74,074 crore. Of these, the revenue receipts were Rs. 30,689 crore, constituting 41 per cent of total receipts. The balance came from capital receipts, borrowings and Public Account.
Table No. 1 5: Trends in Growth and Composition of Aggregate Receipts (Rupees in crore)
Sources of State’s Receipts 200304 200405 200506 200607 200708
I Revenue Receipts 14289 19743 20597 25694 30689 II Capital Receipts 9974 8902 8013 4641 3489 Recovery of Loans and Advances 36 53 2,852 28 105
Public Debt Receipts 9938 8849 5161 4603 3371 Miscellaneous Capital Receipts 9 11
Inter State Settlement 1 2
III Contingency Fund 1 68 IV Public Account Receipts 22285 24790 29038 32225 39896 a. Small Savings, Provident Fund etc. 1200 1810 1330 1419 1439
b. Reserve Fund 367 351 676 819 716
c. Deposits and Advances 4126 3875 4156 4436 5537
d. Suspense and Miscellaneous 12156 13436 16559 18955 23275
e. Remittances 4436 5318 6317 6596 8929 Total Receipts 46548 53436 57648 62628 74074
The total receipts of the State Government increased by 59 per cent from Rs. 46,548 crore in 200304 to Rs. 74,074 crore in 200708, of which Revenue Receipts increased by 115 per cent from Rs. 14,289 crore in 200304 to Rs. 30,689 crore in 200708. The relative share of revenue receipts in total receipts increased from 30.70 per cent in 200304 to 41.44 per cent in 200708 and the share of Capital Receipts in total receipts decreased from 21.43 per cent in 200304 to 4.71 per cent in 200708. Although the receipts under Public Account increased at an annual growth rate of 15.80 per cent during the period 200308, it's share in total receipts of the State ranged between 46 per cent in 200405 to 54 per cent during 200708.
1.3.1 Revenue receipts
Statement11 of the Finance Accounts details revenue receipts of the Government. The revenue receipts consist of its own tax and nontax revenues, Central tax transfers and grantsinaid from GOI. Overall revenue receipts, its annual rate of growth, ratio of these receipts to the GSDP and buoyancies are indicated in Table 1.6.

Audit Report (Civil) for the year ended 31 March 2008
8
Table 1.6: Revenue Receipts – Basic Parameters 200304 200405 200506 200607 200708
Revenue Receipts (RR) (Rupees in crore) 14289 19743 20597 25694 30689 Own taxes (Rupees in crore and per cent) 6789
(47.51) 7773
(39.37) 9115
(44.26) 10473 (40.76)
12018 (39.16)
NonTax Revenue (Rupees in crore and per cent) 1480 (10.36)
4462 (22.60)
2208 (10.72)
2658 (10.35)
2738 (8.92)
Own Resources (Rupees in crore and per cent) 8269 (57.87)
12235 (61.97)
11323 (54.98)
13131 (51.11)
14756 (48.08)
Central Tax Transfers (Rupees in crore and per cent)
4247 (29.72)
5077 (25.72)
6341 (30.78)
8089 (31.48)
10203 (33.25)
Grantsinaid (Rupees in crore and per cent) 1773 (12.41)
2431 (12.31)
2933 (14.24)
4474 (17.41)
5730 (18.67)
Rate of Growth of RR (per cent) 6.71 38.17 4.33 24.75 19.44 Rate of Growth of Own Resources (per cent) 6.01 47.96 ()7.45 15.97 12.38 Rate of Growth of Own tax (per cent) 10.12 14.49 17.26 14.90 14.75 RR/GSDP (per cent) 13.89 18.40 17.71 20.04 21.58 Revenue Buoyancy (ratio) 0.36 8.84 0.51 2.42 1.78 State’s own tax buoyancy (ratio) 0.55 3.35 2.05 1.46 1.35 Revenue buoyancy with reference to State’s own taxes (ratio)
0.66 2.63 0.25 1.66 1.32
GSDP Growth (percent) 18.43 4.32 8.43 10.21 10.92
REVENUE RECEIPTS FOR 200708 (Figures in per cent)
39.16
33.25
18.67
8.92
Own Taxes NonTax Revenue Central Tax Transfers Grantsinaid
General Trend The revenue receipts of the state have consistently increased at an average annual growth rate of 22.95 per cent from Rs.14,289 crore in 200304 to Rs.30,689 crore in 200708. While 48 per cent of the revenue receipts during 200708 had come from the State’s own resources comprising of tax and non tax revenue, the balance 52 per cent were contributed by central tax transfers and grantinaid together. Of the total increase of Rs.4,995 crore in revenue receipts of the state during 200708, Rs.3,370 crore (67 per cent) was contributed by central transfers and the remaining Rs.1,625 crore (33 per cent) by State’s own resources. The revenue receipts as well as the State’s own tax buoyancies have declined in 200708 as compared to the previous year primarily on account of fall in rates of growth in both revenue receipts and state’s own taxes during the current year. A steep decline by about five percentage points in rate of growth of revenue receipts along with a relative stability in growth of state’s own taxes in 200708 as compared to the previous year led to a fall in revenue buoyancy with reference to state’s own taxes in the current year.
Own Tax Revenue Tax on sales, trades etc. was the major contributor (50 per cent) of the States own tax revenue followed by state excise (15 per cent), stamps and registration

Chapter I Finances of the State Government
9
fees (13 per cent), taxes on goods and passengers (8 per cent), taxes on vehicles (6 per cent) and taxes and duties on electricity (5 per cent) during 200708. There was a growth rate of 15 per cent in taxes on sales, trades etc., 20 per cent in state excise and 22 per cent in stamps and registration fees in 200708 over previous year. The increase in receipts under taxes on Sales, trades etc. was mainly due to introduction of VAT with effect from 200607. The increase in State excise receipts was due to more receipts mainly under country fermented liquors (Rs. 150 crore) and residual head ‘other receipts (Rs.498 crore)’ which was partly offset by decrease in receipts under country spirits (Rs. 429 crore). The increase under Stamps and Registration fee was because of enhanced receipts under the heads ‘Stamps judicial’ (Rs.53 crore), ‘Stamps Nonjudicial’ (Rs.95 crore) and ‘Registration fees’ (Rs.133 crore). Table1.7 below shows the trends in the composition of tax revenue of the state during 200308.
Table No. 1.7: Tax revenue (Rupees in crore)
200304 200405 200506 200607 200708 Taxes on Sales, Trades etc 3293 3913 4508 5261 6045 State Excise 1086 1193 1370 1547 1854 Stamps and Registration fees 614 789 1009 1251 1532 Taxes on Vehicles 455 489 556 634 703 Other Taxes 1341 1389 1672 1780 1884* Total 6789 7773 9115 10473 12018
* Other taxes include Taxes on goods and passengers (Rs.916 crore), taxes and duties on electricity (Rs.626 crore), other taxes on income and expenditure (Rs.185 crore), land revenue (Rs.129 crore), other taxes and duties on commodities and services (Rs.20 crore) and hotel receipt tax (Rs.8 crore).
NonTax Revenue
Nontax revenue increased by Rs.80 crore from Rs.2,658 crore in 200607 to Rs.2,738 crore in 200708 mainly due to increase in nonferrous mining and metallurgical industries (Rs.201.48 crore), interest receipt (Rs.74.25 crore), Forestry and wildlife (Rs.72.39 crore),dividends and profit (Rs.44.79 crore), other social services (Rs.8.20 crore), cooperation (Rs.10.75 crore) and other administrative services (Rs.8.61 crore), partly offset by decrease of Rs.361.98 crore under Miscellaneous general services mainly due to booking of debt waiver of Rs.363.06 crore for the current year in comparison to Rs.726.12 crore booked in 200607 relating to 200506 and 200607. Of the nontax revenue sources, nonferrous mining and metallurgical industries (41 per cent), forestry and wild life (22 per cent), miscellaneous general services (14 per cent), and interest receipts, dividend and profits (10 per cent) were the major contributors during 200708. Moreover, the current levels of cost recovery (revenue receipts as a percentage of revenue expenditure) in supply of merit goods and services by Government were 0.38 per cent for general education, 0.19 per cent for technical education, 2.24 per cent for medical and public health, 1.68 per cent for water supply and sanitation and 9.62 per cent for housing.

Audit Report (Civil) for the year ended 31 March 2008
10
The actual receipts under state’s tax revenue and non tax revenue visàvis assessments made by TFC and State government during 200708 are given in Table1.8 below:
Table No. 1.8: Tax and Nontax receipts (Rupees in crore)
Assessments made by TFC
Projections by State Government in MTFPS Actuals
Tax Revenue 11823 11716 12018 NonTax Revenue 2646 2427 2738
Actual realization under tax revenue was higher than the assessment made by the TFC (1.65 per cent) and MTFPS (2.58 per cent) projection. Although the actual non tax revenue was also higher than the projections made by TFC and MTFPS, it occurred mainly due to contra entry of debt waiver of Rs. 363.06 crore received under DCRF as per recommendations of TFC as receipts under the head ‘Miscellaneous General Services’.
Central Tax Transfers
The central tax transfers increased by Rs. 2,114 crore in 200708 over the previous year and constituted 33 per cent of revenue receipts. The increase was mainly under Corporation Tax (Rs.714 crore), Taxes on Income other than corporation tax (Rs.640 crore), Customs Duties (Rs.351 crore), Service Tax (Rs.243 crore), and Union Excise Duties (Rs.166 crore).
Grantsinaid from Central Government
Grantsinaid increased by 28.05 per cent from Rs.4,474 crore in 200607 to Rs.5,730 crore in 200708 mainly due to increase in nonplan grants (Rs.127 crore), Grants for State Plan Schemesother grants(Rs.629 crore),Central Plan Scheme (Rs.164 crore) and for Centrally Sponsored Schemes (Rs.336 crore).
Details of Grantsinaid from GOI are given in Table 1.9.
Table No. 1.9: Grantsinaid from GOI (Rupees in crore)
200304 200405 200506 200607 200708 Grants for State plan schemes 776 1314 1,264 1983 2612 Non Plan grants 376 459 768 984 1111
Grants for Central Plan Schemes 58 59 66 57 221 Grants for Centrally Sponsored Schemes 563 599 835 1450 1786
Total 1773 2431 2933 4474 5730 Percentage of increase/decrease over previous year () 4.78 37.11 20.65 52.54 28.05
Increase in grants for State plan scheme in 200708 was mainly under block grants (Rs.423 crore) and Panchayati Raj (Rs.310 crore) partly offset by decrease of Rs.115 crore under Welfare of Scheduled TribesSpecial Central Assistance for Tribal Area sub Plan. The increase in grants for Central Plan
Chapter I Finances of the State Government
11
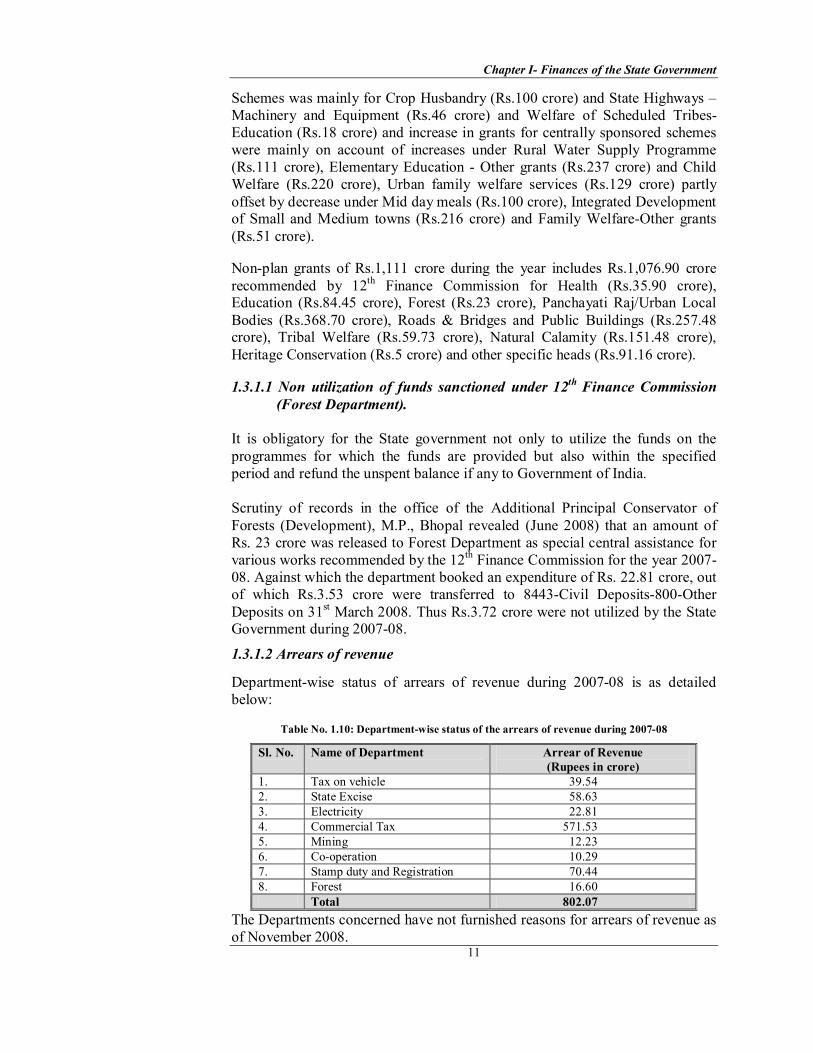
Schemes was mainly for Crop Husbandry (Rs.100 crore) and State Highways – Machinery and Equipment (Rs.46 crore) and Welfare of Scheduled Tribes Education (Rs.18 crore) and increase in grants for centrally sponsored schemes were mainly on account of increases under Rural Water Supply Programme (Rs.111 crore), Elementary Education Other grants (Rs.237 crore) and Child Welfare (Rs.220 crore), Urban family welfare services (Rs.129 crore) partly offset by decrease under Mid day meals (Rs.100 crore), Integrated Development of Small and Medium towns (Rs.216 crore) and Family WelfareOther grants (Rs.51 crore).
Nonplan grants of Rs.1,111 crore during the year includes Rs.1,076.90 crore recommended by 12 th Finance Commission for Health (Rs.35.90 crore), Education (Rs.84.45 crore), Forest (Rs.23 crore), Panchayati Raj/Urban Local Bodies (Rs.368.70 crore), Roads & Bridges and Public Buildings (Rs.257.48 crore), Tribal Welfare (Rs.59.73 crore), Natural Calamity (Rs.151.48 crore), Heritage Conservation (Rs.5 crore) and other specific heads (Rs.91.16 crore).
1.3.1.1 Non utilization of funds sanctioned under 12 th Finance Commission (Forest Department).
It is obligatory for the State government not only to utilize the funds on the programmes for which the funds are provided but also within the specified period and refund the unspent balance if any to Government of India.
Scrutiny of records in the office of the Additional Principal Conservator of Forests (Development), M.P., Bhopal revealed (June 2008) that an amount of Rs. 23 crore was released to Forest Department as special central assistance for various works recommended by the 12 th Finance Commission for the year 2007 08. Against which the department booked an expenditure of Rs. 22.81 crore, out of which Rs.3.53 crore were transferred to 8443Civil Deposits800Other Deposits on 31 st March 2008. Thus Rs.3.72 crore were not utilized by the State Government during 200708.
1.3.1.2 Arrears of revenue
Departmentwise status of arrears of revenue during 200708 is as detailed below:
Table No. 1.10: Departmentwise status of the arrears of revenue during 200708
Sl. No. Name of Department Arrear of Revenue (Rupees in crore)
1. Tax on vehicle 39.54 2. State Excise 58.63 3. Electricity 22.81 4. Commercial Tax 571.53 5. Mining 12.23 6. Cooperation 10.29 7. Stamp duty and Registration 70.44 8. Forest 16.60
Total 802.07 The Departments concerned have not furnished reasons for arrears of revenue as of November 2008.

Audit Report (Civil) for the year ended 31 March 2008
12
1.4 Application of resources
1.4.1 Growth of Expenditure
Statement 12 of the Finance Accounts depicts the detailed revenue expenditure by minor heads and capital expenditure by major heads. States raise resources to perform their sovereign functions, maintain their existing nature of delivery of social and economic services, to extend the network of these services through capital expenditure and investments and to discharge their debt service obligations. The trends in total expenditure, its annual growth rate and ratio of expenditure to the State GSDP and to revenue receipts and its buoyancy with respect to GSDP and revenue receipts during period 200308 are indicated in Table1.11.
Table No. 1.11: Total Expenditure – Basic Parameters
200304 200405 200506 200607 200708 Total expenditure (TE)* (Rupees in crore)
21648 26288 28020 28487 33591
Rate of Growth (per cent) 23.73 21.43 6.58 1.66 17.92 TE/GSDP Ratio (per cent) 21.05 24.50 24.09 22.22 23.62 RR /TE Ratio (per cent) 66.01 75.10 73.51 90.20 91.36
Buoyancy of Total Expenditure with reference to: GSDP (ratio) 1.29 4.96 0.78 0.16 1.64 RR (ratio) 3.54 0.56 1.52 0.07 0.92
* Total expenditure includes revenue expenditure, capital expenditure, loans and advances (Including Inter State settlement)
The total expenditure of the state has increased from Rs. 21,648 crore to Rs. 33,591 crore at an annual average growth rate of 11 per cent per annum during 200308. In relative terms, the capital and revenue expenditure components have increased by 155 per cent and 36 per cent respectively during the period 200308. However, in absolute terms, increases were of the order of Rs.4,154 crore in capital expenditure and Rs.6,836 crore in revenue expenditure during the period under report. These trends indicate that increase in capital and revenue expenditure was in the ratio of 1:1.6 during the last five years period. The significant increase of Rs.5,104 crore in total expenditure (17.92 per cent) during 200708 over 200607 was mainly due to increase of Rs.3,238 crore in revenue expenditure, Rs.202 crore in disbursement of loans and advances and Rs.1,663 crore in capital expenditure. The increase in capital expenditure from Rs.5,170 crore in 200607 to Rs.6,833 crore during 200708 was mainly due to increase in capital outlay on Roads and Bridges (Rs.694 crore), Irrigation and Flood control (Rs.631 crore), Water Supply and Sanitation (Rs.248 crore), Other Rural Development (Rs.90 crore), Education, Sports, Arts and Culture (Rs.78 crore) and Welfare of SC, ST and OBC (Rs.77 crore) which was partly off set by decrease in capital outlay on Power Projects (Rs.182 crore). The bifurcation of plan and nonplan capital expenditure on power projects reveals that both the plan and nonplan capital expenditure reduced by Rs. 44 crore and Rs.138 crore respectively during the current year over the previous year. The ratio of revenue receipts to total expenditure marginally increased from 90 per cent in 200607 to 91 per cent in 200708 indicating that about 91 per cent of the state’s total expenditure was met from its revenue receipts and the balance of 9 per cent was financed from nondebt capital receipts and borrowings.

Chapter I Finances of the State Government
13
Growth of Total Expenditure (Rupees in crore)
33591 28,487 28,020 26,288
21,648 25601
18,765 18,026 20,563 22,363
6833 5,170 6623 4,951 2,679
0 5,000 10,000 15,000 20,000 25,000 30,000 35,000 40,000
200304 200405 200506 200607 200708
Total expenditure (TE) Revenue expenditure Capital expenditure
Trends in Total Expenditure by Activities: In terms of the activities, total expenditure could be considered as being composed of expenditure on general services including interest payments, social and economic services, grantsinaid and loans and advances. Relative share of these components in total expenditure is indicated in Table1.12.
Table No. 1.12: Components of Expenditure – Relative Share (in per cent)
200304 200405 200506 200607 200708 General Services 30.53 28.96 27.53 30.45 28.07 Of which Interest payments 14.80 13.92 12.21 14.14 12.48 Social Services 27.05 23.22 26.03 29.13 27.65 Economic Services 38.74 31.73 39.48 32.50 36.19 Grantsinaid 2.73 3.49 3.99 4.58 4.65 Loans and Advances 0.95 12.60 2.97 3.34 3.44
The shares of General services (including Interest Payments), considered as non developmental expenditure declined from 30.53 per cent to 28.07 per cent over the period 200308 while the share of social services exhibited relative stability over the period 200308. The share of economic services indicated a marginal decline from 38.74 per cent in 200304 to 36.19 per cent in 200708 with wide inter year fluctuations. Thus development expenditure comprising of social and economic services together has increased only marginally from 61.63 per cent in 200607 to 63.84 per cent in 200708. The share of grants in aid and loans and advances indicated the increasing trends during the period 200308.
Allocative Priorities Trend of Expenditure 200708 (Figures in per cent)
36.19
28.07 4.65
27.65
3.44
General Services Economic Services Loans & Advances (Including Inter State settlement) Social services Grantsinaid
Audit Report (Civil) for the year ended 31 March 2008
14
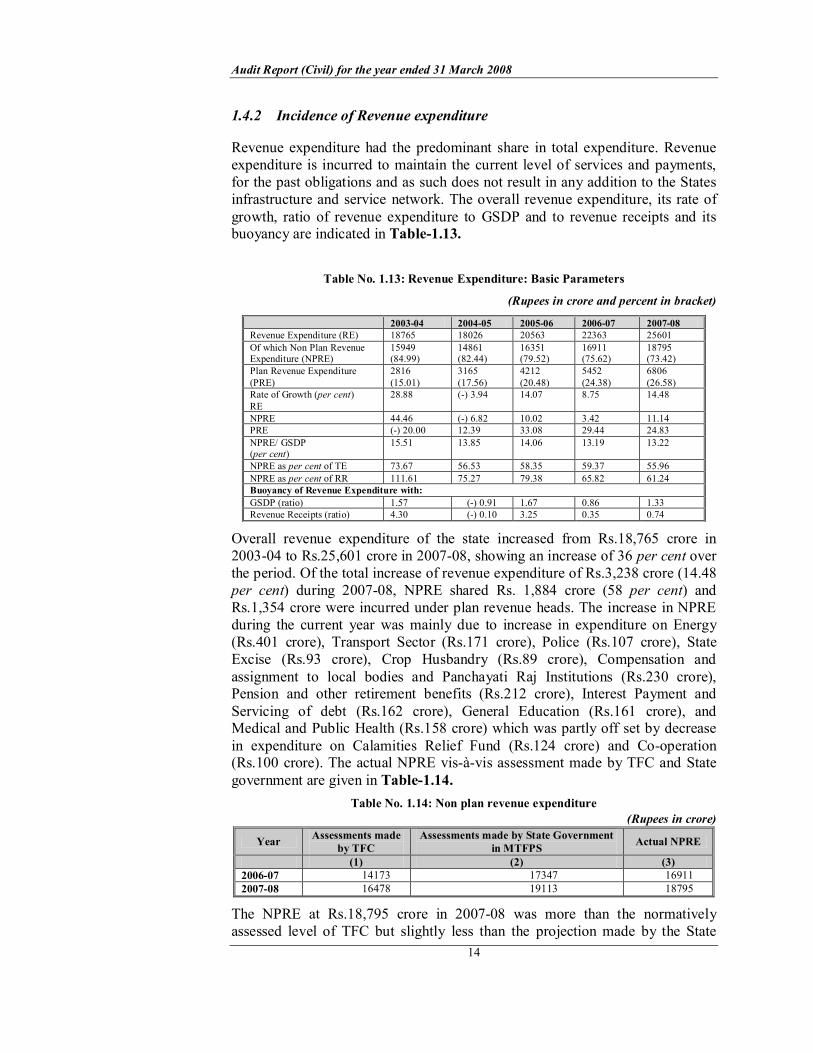
1.4.2 Incidence of Revenue expenditure
Revenue expenditure had the predominant share in total expenditure. Revenue expenditure is incurred to maintain the current level of services and payments, for the past obligations and as such does not result in any addition to the States infrastructure and service network. The overall revenue expenditure, its rate of growth, ratio of revenue expenditure to GSDP and to revenue receipts and its buoyancy are indicated in Table1.13.
Table No. 1.13: Revenue Expenditure: Basic Parameters
(Rupees in crore and percent in bracket)
200304 200405 200506 200607 200708 Revenue Expenditure (RE) 18765 18026 20563 22363 25601 Of which Non Plan Revenue Expenditure (NPRE)
15949 (84.99)
14861 (82.44)
16351 (79.52)
16911 (75.62)
18795 (73.42)
Plan Revenue Expenditure (PRE)
2816 (15.01)
3165 (17.56)
4212 (20.48)
5452 (24.38)
6806 (26.58)
Rate of Growth (per cent) RE
28.88 () 3.94 14.07 8.75 14.48
NPRE 44.46 () 6.82 10.02 3.42 11.14 PRE () 20.00 12.39 33.08 29.44 24.83 NPRE/ GSDP (per cent)
15.51 13.85 14.06 13.19 13.22
NPRE as per cent of TE 73.67 56.53 58.35 59.37 55.96 NPRE as per cent of RR 111.61 75.27 79.38 65.82 61.24 Buoyancy of Revenue Expenditure with: GSDP (ratio) 1.57 () 0.91 1.67 0.86 1.33 Revenue Receipts (ratio) 4.30 () 0.10 3.25 0.35 0.74
Overall revenue expenditure of the state increased from Rs.18,765 crore in 200304 to Rs.25,601 crore in 200708, showing an increase of 36 per cent over the period. Of the total increase of revenue expenditure of Rs.3,238 crore (14.48 per cent) during 200708, NPRE shared Rs. 1,884 crore (58 per cent) and Rs.1,354 crore were incurred under plan revenue heads. The increase in NPRE during the current year was mainly due to increase in expenditure on Energy (Rs.401 crore), Transport Sector (Rs.171 crore), Police (Rs.107 crore), State Excise (Rs.93 crore), Crop Husbandry (Rs.89 crore), Compensation and assignment to local bodies and Panchayati Raj Institutions (Rs.230 crore), Pension and other retirement benefits (Rs.212 crore), Interest Payment and Servicing of debt (Rs.162 crore), General Education (Rs.161 crore), and Medical and Public Health (Rs.158 crore) which was partly off set by decrease in expenditure on Calamities Relief Fund (Rs.124 crore) and Cooperation (Rs.100 crore). The actual NPRE visàvis assessment made by TFC and State government are given in Table1.14.
Table No. 1.14: Non plan revenue expenditure (Rupees in crore)
Year Assessments made by TFC
Assessments made by State Government in MTFPS Actual NPRE
(1) (2) (3) 200607 14173 17347 16911 200708 16478 19113 18795
The NPRE at Rs.18,795 crore in 200708 was more than the normatively assessed level of TFC but slightly less than the projection made by the State
Chapter I Finances of the State Government
15
Government in its MTFPS. Relative to the assessment made by TFC, the increase was mainly under interest payments (Rs.430 crore), general services excluded interest payment (Rs.1,201 crore), social services (Rs.159 crore) and economic service (Rs.1,563 crore).
The PRE which has consistently increased during the period 200308 has increased by 24.83 per cent during the current year. The increase in PRE in 200708 was mainly under Rural Development (Rs.552 crore), Crop Husbandry (Rs.166 crore), Welfare of Schedule Caste, Schedule Tribe and Other Backward Classes (Rs.233 crore), Nutrition (Rs.97 crore), Forestry and Wildlife (Rs.126 crore) and Social Security and Welfare (Rs.103 crore), which was partly offset by decrease in expenditure under General Education (Rs.99 crore) and Urban Development (Rs.117 crore).
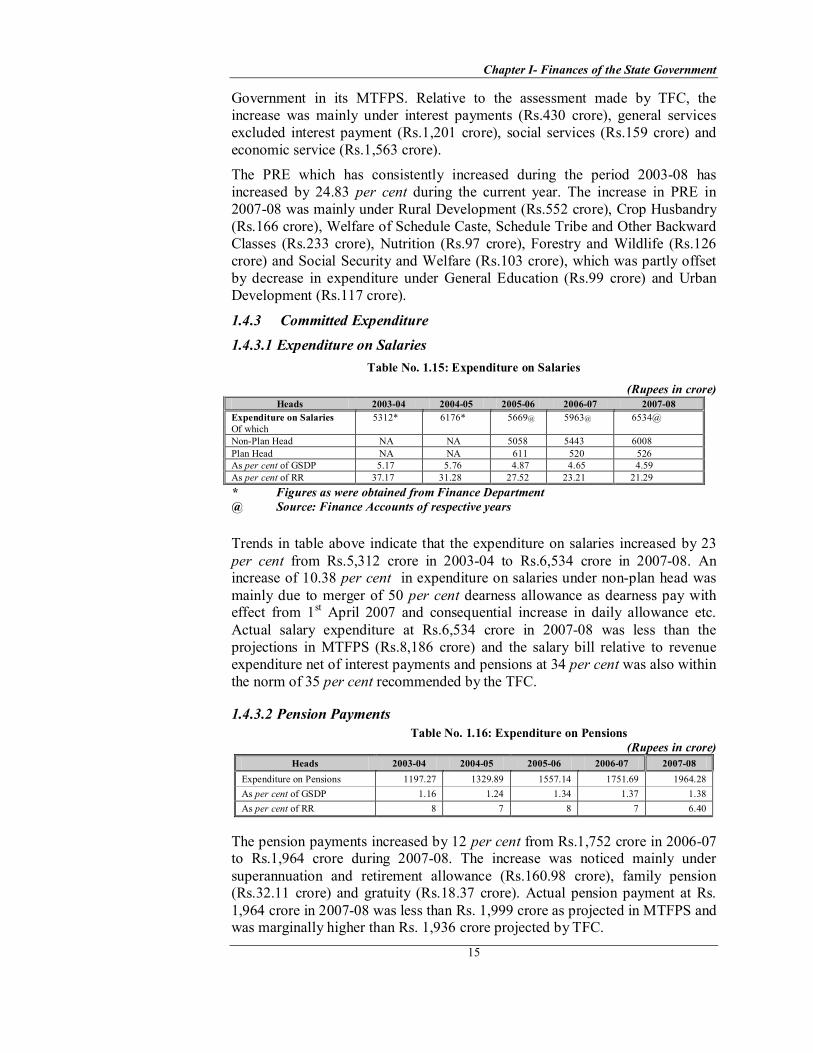
1.4.3 Committed Expenditure 1.4.3.1 Expenditure on Salaries
Table No. 1.15: Expenditure on Salaries
(Rupees in crore) Heads 200304 200405 200506 200607 200708
Expenditure on Salaries Of which
5312* 6176* 5669@ 5963@ 6534@
NonPlan Head NA NA 5058 5443 6008 Plan Head NA NA 611 520 526 As per cent of GSDP 5.17 5.76 4.87 4.65 4.59 As per cent of RR 37.17 31.28 27.52 23.21 21.29 * Figures as were obtained from Finance Department @ Source: Finance Accounts of respective years
Trends in table above indicate that the expenditure on salaries increased by 23 per cent from Rs.5,312 crore in 200304 to Rs.6,534 crore in 200708. An increase of 10.38 per cent in expenditure on salaries under nonplan head was mainly due to merger of 50 per cent dearness allowance as dearness pay with effect from 1 st April 2007 and consequential increase in daily allowance etc. Actual salary expenditure at Rs.6,534 crore in 200708 was less than the projections in MTFPS (Rs.8,186 crore) and the salary bill relative to revenue expenditure net of interest payments and pensions at 34 per cent was also within the norm of 35 per cent recommended by the TFC.
1.4.3.2 Pension Payments Table No. 1.16: Expenditure on Pensions
(Rupees in crore) Heads 200304 200405 200506 200607 200708
Expenditure on Pensions 1197.27 1329.89 1557.14 1751.69 1964.28 As per cent of GSDP 1.16 1.24 1.34 1.37 1.38 As per cent of RR 8 7 8 7 6.40
The pension payments increased by 12 per cent from Rs.1,752 crore in 200607 to Rs.1,964 crore during 200708. The increase was noticed mainly under superannuation and retirement allowance (Rs.160.98 crore), family pension (Rs.32.11 crore) and gratuity (Rs.18.37 crore). Actual pension payment at Rs. 1,964 crore in 200708 was less than Rs. 1,999 crore as projected in MTFPS and was marginally higher than Rs. 1,936 crore projected by TFC.

Audit Report (Civil) for the year ended 31 March 2008
16
1.4.3.3 Interest payments Table No. 1.17: Interest payments
Total Revenue Receipts
Interest Payments
Percentage of Interest payments with reference to
Year
(Rupees in crore) Total Revenue Receipts Revenue Expenditure 200304 14289 3206 22.43 17.08 200405 19743 3661 18.54 20.31 200506 20597 3422 16.61 16.64 200607 25694 4029 15.68 18.02 200708 30689 4191 13.66 16.37
Interest payments increased by 4.02 per cent from Rs.4,029 crore during 2006 07 to Rs.4,191 crore during 200708 and accounted for 13.66 per cent of the revenue receipts, this constituted 16.37 per cent of revenue expenditure during 200708. Interest payments during the year were on special securities issued to NSSF of the Central Government by the State Government (Rs.1,419 crore), market loans (Rs.966 crore), loans borrowed from the Central Government (Rs.694 crore), State Provident funds (Rs.533 crore), Other Internal Debt (Rs.470 crore) and other obligations (Rs.103 crore). The increase in interest payments during 200708 over previous year were mainly on Market loans (Rs.60 crore), interest on special securities issued to NSSF of Central Government (Rs. 189 crore), small saving and provident funds (Rs.39 crore) which was partly offset by decrease in interest payment on Other Internal Debt (Rs.99 crore), loans from the Central Government (Rs.23 crore) and other obligations (Rs.3 crore). It was observed that interest payments as percentage to revenue receipts during the year 200708 was 13.66 per cent which is within the norm of 15 per cent to be achieved by 200910 as per the recommendation of the TFC. Interest payments at Rs.4,191 crore paid during the year was less than the budget estimate of Rs. 4,252 crore for 200708 .
Growth of nondevelopmental expenditure (Rupees in crore)
6534
1,197 1,330 1,557 1,752 1964
3,206 3,661 3,422
4,029 4191
5,963 5,669 5,312
6,176
0
1,000
2,000
3,000
4,000
5,000
6,000
7,000
200304 200405 200506 200607 200708 Expenditure on Pension Interest Payments Expenditure on Salaries
1.4.3.4 Subsidies
Scrutiny of state budget revealed that state Government has not opened distinct object head for subsidy. The amount of subsidy is included in the object head 'grantinaid' which comprises of expenditure on infrastructure, maintenance

Chapter I Finances of the State Government
17
grants, discretionary grants, aided grants, grants for public relation tour, subsidy (Arthic sahayata) and others (which included subsidy also). As no distinct object head for subsidy has been opened in the state budget, it is not possible to segregate the actual amount of subsidy paid by the State Government. The State Government has agreed to open a distinct object head of subsidy with effect from the financial year 200910. However, the Finance Accounts for 200708 has shown payment of subsidy amounting to Rs.141 crore during 200708 (Food Storage and Warehousing; Rs.65 crore and Power; Rs.76 crore).
1.5 Expenditure by Allocative Priorities
1.5.1 Quality of Expenditure
The availability of better social and physical infrastructure in the State reflects its quality of expenditure. Therefore ratio of capital expenditure to total expenditure as well as to GSDP and proportion of revenue expenditure being spent on running efficiently and effectively the existing social and economic services would determine the quality of expenditure. Higher the ratio of these components to total expenditure and GSDP, the better is the quality of expenditure. Table1.18 gives these ratios during 200308.
Table No. 1.18: Indicators of Quality of Expenditure (Rupees in crore)
200304 200405 200506 200607 200708 Capital Expenditure 2679 4951 6623 5170 6833 Of which Salary Component 104 108 115 Revenue Expenditure 18765 18026 20563 22363 25601 Of which Social and Economic Services 11601 9641 11852 12456 14682 Social and Economic Services with (i) Salary Component (ii) NonSalary component
NA NA 4140 7712
4344 8112
4767 9915
As per cent of TE (excluding L & A) Capital Expenditure 12.49 21.55 24.36 18.78 21.07 Revenue Expenditure 87.51 78.45 75.64 81.22 78.93
As per cent of GSDP Capital Expenditure 2.61 4.61 5.69 4.03 4.81 Revenue Expenditure 18.25 16.80 17.68 17.44 18.00
The share of capital and revenue expenditure in total expenditure exhibited stability in 200405 and 200708 with inter year variations. However, within the capital expenditure, it is observed that a major portion of the total capital expenditure is shared by the plan capital expenditure during the period. During 200708, 95.23 per cent of the total capital expenditure was plan capital expenditure (Rs.6510.47 crore) which increased by Rs.1655.07 crore from the level of Rs.4855.40 crore in 200607. The major increase in 200708 was reported in Transport (Rs.651 crore), Irrigation and flood control (Rs.631 crore) and Water supply, sanitation and urban development (Rs.269 crore). Of the revenue expenditure incurred on social and economic services during 200708, 32 and 68 per cent were incurred on salary and nonsalary component respectively. While the share of salary component declined from 35 per cent in 200506 to 32 per cent in 200708, the share of non salary component has

Audit Report (Civil) for the year ended 31 March 2008
18
exhibited an increasing trend during the period. These trends seem to indicate the change in expenditure pattern and focus appears to be on the expansion of social and economic infrastructure in the State.
1.5.2 Expenditure on Social Services
Given the fact that the human development indicators such as access to basic education, health services and drinking water and sanitation facilities etc. have a strong linkage with economic progress and eradication of poverty, it would be prudent to make an assessment with regard to the expansion and efficient provision of these services in the State. Table 1.19 summarises the expenditure incurred by the State Government in expanding and strengthening of social services in the State during 200308.
Table No. 1.19: Expenditure on Social Services (Rupees in crore)
200304 200405 200506 200607 200708 Education, Sports, Art and Culture Revenue Expenditure Of which (a) Salary Component (b) NonSalary component Capital Expenditure
2355
NA NA20
2552
NA NA24
2906
1786 112042
3674
2261 141368
3768
2443 1325 146
Total 2375 2576 2948 3742 3914 Health and Family Welfare Revenue Expenditure Of which (a) Salary Component (b) NonSalary component Capital Expenditure
761
NA NA38
856
NA NA43
925
596 32964
1010
635 375 135
1139
689 450 111
Total 799 899 989 1145 1250 Water Supply, Sanitation, Housing and Urban Development Revenue Expenditure Of which (a) Salary Component (b) NonSalary component Capital Expenditure
459
NA NA 361
479
NA NA 242
556
109 447 394
902
120 782 345
895
140 755 615
Total 820 721 950 1247 1510 Other Social Services Revenue Expenditure Of which (a) Salary Component (b) NonSalary component Capital Expenditure
1747
NA NA 116
1785
NA NA 123
2271
600 1671 135
1990
235 1755 174
2343
259 2084 269
Total 1863 1908 2406 2164 2612 Total (Social Services) Revenue Expenditure Of which (a) Salary Component (b) NonSalary component Capital Expenditure
5322
NA NA 535
5672
NA NA 432
6658
3091 3567 635
7576
3251 4325 722
8145
3531 4614 1141
Total 5857 6104 7293 8298 9286

Chapter I Finances of the State Government
19
The expenditure on social services increased from Rs.5,857 crore in 200304 to Rs.9,286 crore in 200708 and it constituted 28.63 per cent of the total expenditure (excluding loan and advances) (Rs.32,434 crore) and 43.31 per cent of the development expenditure (Rs.21,441 crore) during 200708. The ‘Education, sports, art and culture’, ‘Health and family welfare’ and ‘Water supply, sanitation, housing and urban development shared 72 per cent of the total expenditure incurred on social services during 200708 as against 74 per cent in 200607.
The trend in revenue and capital expenditure on social services during the last five years 200308 revealed that the share of capital expenditure remained within the range of 7 to 12 per cent indicating the dominant share of revenue expenditure during the period. Of the revenue expenditure on social services, the nonsalary expenditure has increased by 7 per cent from Rs. 4,325 crore in 200607 to Rs.4,614 crore in 200708 and salary expenditure increased by 9 per cent from Rs.3,251 crore in 200607 to Rs.3,531 crore in 200708. As a result, the share of salary component has increased from 42.91 per cent in 200607 to 43.35 per cent in 200708 implying less expenditure on nonsalary components including maintenance indicating decline in quality of services.
Recognizing the need to improve the quality of education and health services, TFC recommended that the nonplan salary expenditure under education and health and family welfare should increase only by five to six per cent while non salary expenditure under nonplan heads should increase by 30 per cent per annum during the award period. However, trends in expenditure revealed that the nonplan salary component under education sector increased by eight per cent over 200607 while nonplan nonsalary component remained almost at the same level. Under Health and Family Welfare sector, the nonplan salary component increased by 10 per cent but the nonplan nonsalary component increased by 43 per cent in 200708 over the previous year. The expenditure pattern both in education and health sector needs correction in the ensuing years as per the norms of TFC.
1.5.3 Expenditure on Economic Services
The expenditure on economic services includes all such expenditures as to promote directly or indirectly, productive capacity within the States’ economy. Table 1.20 summarises the expenditure on economic services during 200308.

Audit Report (Civil) for the year ended 31 March 2008
20
Table No. 1.20: Expenditure on Economic Services (Rupees in crore)
200304 200405 200506 200607 200708 Agriculture, Allied Activities Revenue Expenditure Of which (a) Salary Component (b) NonSalary component Capital Expenditure Of which Salary component
1148 NA NA50
1244 NA NA59
1285 544 74138
1638 567 107147
1945 621 132464
Total 1198 1303 1323 1685 2009 Irrigation and Flood Control Revenue Expenditure Of which (a) Salary Component (b) NonSalary component Capital Expenditure Of which Salary component
270 NA NA 1081
300 NA NA 1699
327 23394
125482
341 25388
139087
394 290 104 202192
Total 1351 1999 1581 1731 2415 Power & Energy Revenue Expenditure Of which (a) Salary Component (b) NonSalary component Capital Expenditure Of which Salary component
3954 NA NA
328
1466 NA NA 1747
1983
1983 323622
682
682 108621
1084
1084 90323
Total 4282 3213 5219 1768 1987 Transport Revenue Expenditure Of which (a) Salary Component (b) NonSalarye component Capital Expenditure Of which Salary component
190 NA NA 407
140 NA NA 547
29898 200 809
43892 346 1218
609 127 482 1869
Total 597 687 1107 1656 2478
Other Economic Services Revenue Expenditure Of which (a) Salary Component (b) NonSalary component Capital Expenditure Of which Salary component
717 NA NA 241
819 NA NA 321
1301 174 1127 530
1781 181 1600 636
2505 198 2307 761
Total 958 1140 1831 2417 3266
Total (Economic Services) Revenue Expenditure Of which (a) Salary Component (b) NonSalary component Capital Expenditure Of which Salary component
6279 NA NA 2107
3969 NA NA 4373
5194 1049 4145 5867 104
4880 1093 3787 4377 108
6537 1236 5301 5618 115
Total 8386 8342 11061 9257 12155
The expenditure on economic services (Rs.12,155 crore) during 200708 accounted for 37.48 per cent of the total expenditure(excluding Loans and Advances) (Rs. 32,434 crore) and 56.69 per cent of development expenditure (Rs.21,442 crore). The expenditure on “agriculture and allied activities, irrigation and flood control, energy and transport” declined from 88.58 per cent of total expenditure on economic services in 200304 to 73.13 per cent in 2007 08.
The trends in revenue and capital expenditure on economic services during 200308 revealed that the capital expenditure has consistently increased from Rs.2,107 crore (25.13 per cent) in 200304 to Rs.5,618 crore (46.22 per cent) in 200708 with a peak level of Rs.5,867 crore (53.04 per cent) in 200506, while
Chapter I Finances of the State Government
21
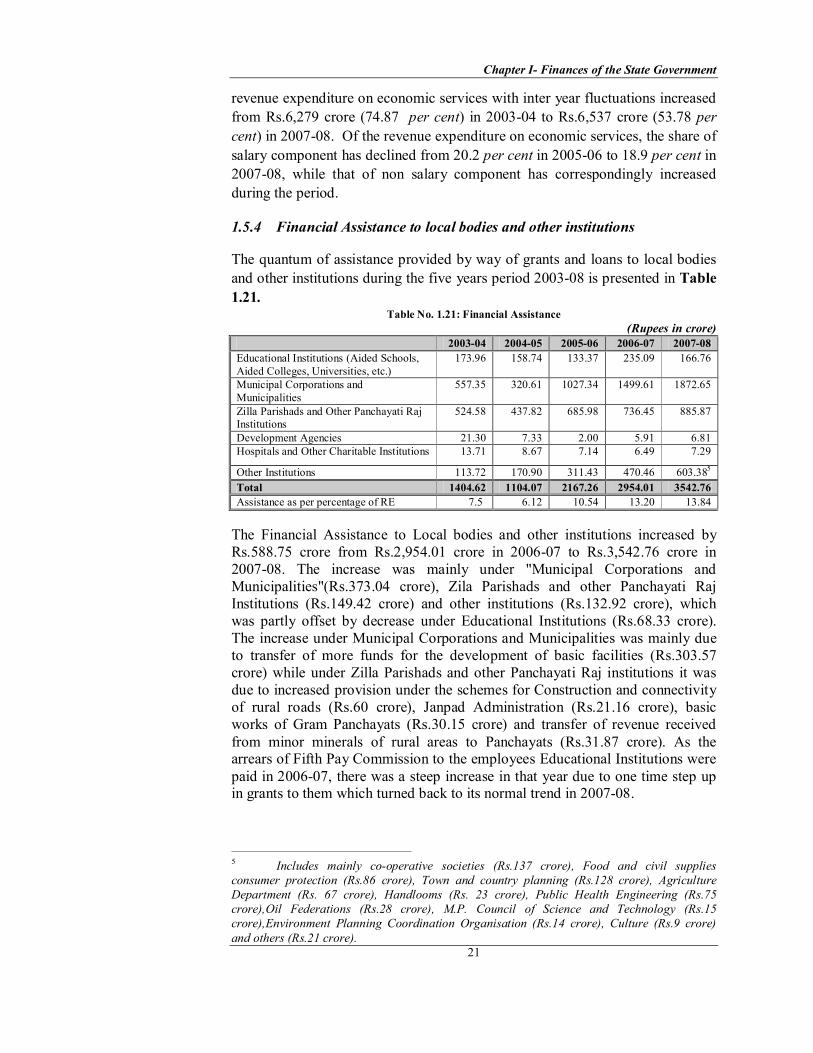
revenue expenditure on economic services with inter year fluctuations increased from Rs.6,279 crore (74.87 per cent) in 200304 to Rs.6,537 crore (53.78 per cent) in 200708. Of the revenue expenditure on economic services, the share of salary component has declined from 20.2 per cent in 200506 to 18.9 per cent in 200708, while that of non salary component has correspondingly increased during the period.
1.5.4 Financial Assistance to local bodies and other institutions
The quantum of assistance provided by way of grants and loans to local bodies and other institutions during the five years period 200308 is presented in Table 1.21.
Table No. 1.21: Financial Assistance (Rupees in crore)
200304 200405 200506 200607 200708 Educational Institutions (Aided Schools, Aided Colleges, Universities, etc.)
173.96 158.74 133.37 235.09 166.76
Municipal Corporations and Municipalities
557.35 320.61 1027.34 1499.61 1872.65
Zilla Parishads and Other Panchayati Raj Institutions
524.58 437.82 685.98 736.45 885.87
Development Agencies 21.30 7.33 2.00 5.91 6.81 Hospitals and Other Charitable Institutions 13.71 8.67 7.14 6.49 7.29
Other Institutions 113.72 170.90 311.43 470.46 603.38 5
Total 1404.62 1104.07 2167.26 2954.01 3542.76 Assistance as per percentage of RE 7.5 6.12 10.54 13.20 13.84
The Financial Assistance to Local bodies and other institutions increased by Rs.588.75 crore from Rs.2,954.01 crore in 200607 to Rs.3,542.76 crore in 200708. The increase was mainly under "Municipal Corporations and Municipalities"(Rs.373.04 crore), Zila Parishads and other Panchayati Raj Institutions (Rs.149.42 crore) and other institutions (Rs.132.92 crore), which was partly offset by decrease under Educational Institutions (Rs.68.33 crore). The increase under Municipal Corporations and Municipalities was mainly due to transfer of more funds for the development of basic facilities (Rs.303.57 crore) while under Zilla Parishads and other Panchayati Raj institutions it was due to increased provision under the schemes for Construction and connectivity of rural roads (Rs.60 crore), Janpad Administration (Rs.21.16 crore), basic works of Gram Panchayats (Rs.30.15 crore) and transfer of revenue received from minor minerals of rural areas to Panchayats (Rs.31.87 crore). As the arrears of Fifth Pay Commission to the employees Educational Institutions were paid in 200607, there was a steep increase in that year due to one time step up in grants to them which turned back to its normal trend in 200708.
5 Includes mainly cooperative societies (Rs.137 crore), Food and civil supplies consumer protection (Rs.86 crore), Town and country planning (Rs.128 crore), Agriculture Department (Rs. 67 crore), Handlooms (Rs. 23 crore), Public Health Engineering (Rs.75 crore),Oil Federations (Rs.28 crore), M.P. Council of Science and Technology (Rs.15 crore),Environment Planning Coordination Organisation (Rs.14 crore), Culture (Rs.9 crore) and others (Rs.21 crore).

Audit Report (Civil) for the year ended 31 March 2008
22
1.5.5 Delay in furnishing utilisation certificates
Utilisation Certificates (2543 nos.) in respect of Grants and Loans aggregating to Rs.4,162.28 crore paid upto 200708 were in arrears. Details of Department wise break up of outstanding utilisation certificates are given in Appendix 1.7.
1.5.6 Abstract of performance of the autonomous bodies
The audit of accounts of three autonomous bodies in the State has been entrusted to the Comptroller and Auditor General of India. The status of entrustment of audit, rendering of accounts to audit, issuance of Separate Audit Report and its placement in the Legislature is indicated in Appendix 1.8.
1.6 Misappropriations, losses, defalcations, etc
State Government reported 1007 cases of misappropriation, defalcation, etc involving Government money amounting to Rupees 7.32 crore to the end of March 2008 on which final action was pending. The Departmentwise and year wise break up of pending cases is given in Appendix 1.9.
1.6.1 Write off of losses, etc
As reported to Audit, losses amounting to Rs.0.58 crore in 68 cases were writtenoff during 200708 by the competent authorities. The departmentwise details are given in Appendix1.10.
1.7 Assets and Liabilities
In the Government accounts, comprehensive accounting of fixed assets like land and buildings owned by the Government is not done. Appendix1.4 gives an abstract of liabilities and the assets as on 31 March 2008, compared with the corresponding position on 31 March 2007. While the liabilities in this Appendix consist mainly of internal borrowings, loans and advances from the GOI, receipts from the Public Account and Reserve Funds, the assets comprise mainly the capital outlay and loans and advances given by the State Government and cash balances. Appendix1.11 depicts the time series data on State Government finances for the period 200308.
1.7.1 Financial Results of Irrigation Works
The financial results of major, medium and minor irrigation projects showed that as against the revenue expenditure of Rs.393.10 crore during the year, revenue realised (Rs. 50.82 crore) from these projects during 200708 was 12.93 per cent of revenue expenditure which was grossly inadequate even to meet the expenditure on maintenance as well as other working expenses of these projects.

Chapter I Finances of the State Government
23
1.7.2 Financial Analysis of Government Investments
1.7.2.1 Investments and returns As of 31 March 2008, Government had invested Rs.8,844.99 crore in Statutory Corporations, Rural Banks, Joint Stock Companies and Cooperatives (Table 1.22). Out of the total investment of Rs.8,844.99 crore at the end of March 2008, Rs.1,082.58 crore pertained to the composite State of Madhya Pradesh but retained in MP pending allocation between MP and Chhattisgarh State (Statutory Corporations (Rs.411 crore), Government Companies (Rs.187.04 crore), Cooperative Banks and Societies (Rs.483.01 crore) and JointStock Companies (Rs.1.53 crore). The return on this investment was 0.67 per cent in 200708 while the Government paid interest at the average rate of 7.72 per cent on its borrowings during 200708.
Of these, three Statutory Corporations and 15 Government Companies with an aggregate investment of Rs.5,585 crore up to 200708 were incurring losses and their accumulated losses amounted to Rs.4,361 crore as per the accounts furnished by these companies up to 200708 (Appendix–1.12). Major loss making units included Madhya Pradesh State Industrial Development Corporation Limited, Bhopal (Rs.634 crore), Madhya Pradesh Paschim Kshetra Vidyut Vitran Company Limited, Indore (Rs.680 crore), Madhya Pradesh Madhya Kshetra Vidyut Vitran Company Limited, Bhopal (Rs.524 crore), Madhya Pradesh Poorv Kshetra Vidyut Vitran Company Limited, Jabalpur (Rs.304 crore), Optel Telecommunication Limited, Bhopal (Rs.115 crore), Madhya Pradesh State Electricity Board, Jabalpur 6 (Rs.863 crore), Madhya Pradesh State Road Transport Corporation (Rs.781 crore), Madhya Pradesh Financial Corporation (Rs.241 crore) and Madhya Pradesh State Textile Corporation Ltd. Bhopal (Rs.95 crore).
Thus, Government needs not only to invest the high cost borrowings more judiciously to get better returns, but also address the losses on account of these sick units by their restructuring and rehabilitation and/or by considering the disinvestments of such units.
Table No. 1.22: Return on Investment
Investment at the end of the year
Return Percentage of return
Average rate of interest on government borrowing
Difference between interest rate and return
Year
(Rupees in crore) (per cent) 200304 1737.29 8.42 0.48 9.41 8.93 200405 4151.65 2.50 0.06 8.96 8.90 200506 6965.99 5.72 0.08 7.33 7.25 200607 8161.71 14.44 0.18 7.86 7.68 200708 8844.99 59.23* 0.67 7.72 7.05
* Details of dividend of Rs.48.27 crore awaited from the concerned
6 The MPSEB is still existing and its accounts upto 200506 has been finalised and accumulated loss of Rs.863 crore pertains to the period upto May 2005.
Audit Report (Civil) for the year ended 31 March 2008
24
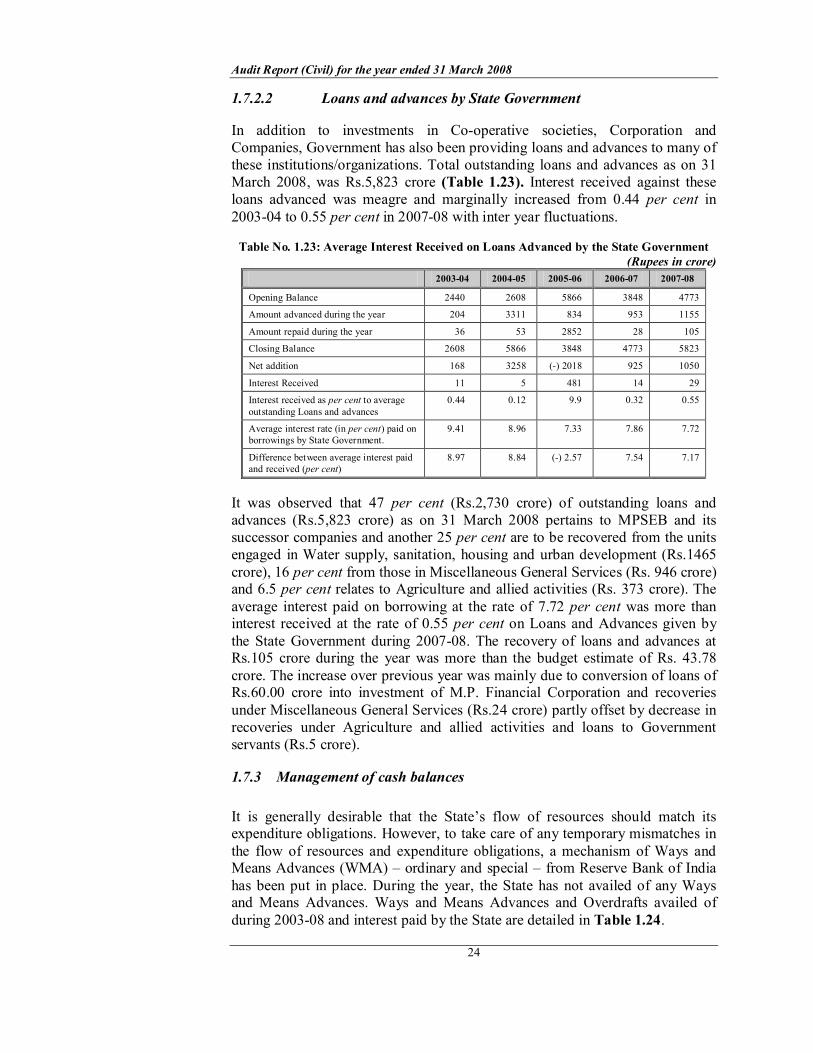
1.7.2.2 Loans and advances by State Government
In addition to investments in Cooperative societies, Corporation and Companies, Government has also been providing loans and advances to many of these institutions/organizations. Total outstanding loans and advances as on 31 March 2008, was Rs.5,823 crore (Table 1.23). Interest received against these loans advanced was meagre and marginally increased from 0.44 per cent in 200304 to 0.55 per cent in 200708 with inter year fluctuations.
Table No. 1.23: Average Interest Received on Loans Advanced by the State Government (Rupees in crore)
200304 200405 200506 200607 200708
Opening Balance 2440 2608 5866 3848 4773
Amount advanced during the year 204 3311 834 953 1155
Amount repaid during the year 36 53 2852 28 105
Closing Balance 2608 5866 3848 4773 5823
Net addition 168 3258 () 2018 925 1050
Interest Received 11 5 481 14 29
Interest received as per cent to average outstanding Loans and advances
0.44 0.12 9.9 0.32 0.55
Average interest rate (in per cent) paid on borrowings by State Government.
9.41 8.96 7.33 7.86 7.72
Difference between average interest paid and received (per cent)
8.97 8.84 () 2.57 7.54 7.17
It was observed that 47 per cent (Rs.2,730 crore) of outstanding loans and advances (Rs.5,823 crore) as on 31 March 2008 pertains to MPSEB and its successor companies and another 25 per cent are to be recovered from the units engaged in Water supply, sanitation, housing and urban development (Rs.1465 crore), 16 per cent from those in Miscellaneous General Services (Rs. 946 crore) and 6.5 per cent relates to Agriculture and allied activities (Rs. 373 crore). The average interest paid on borrowing at the rate of 7.72 per cent was more than interest received at the rate of 0.55 per cent on Loans and Advances given by the State Government during 200708. The recovery of loans and advances at Rs.105 crore during the year was more than the budget estimate of Rs. 43.78 crore. The increase over previous year was mainly due to conversion of loans of Rs.60.00 crore into investment of M.P. Financial Corporation and recoveries under Miscellaneous General Services (Rs.24 crore) partly offset by decrease in recoveries under Agriculture and allied activities and loans to Government servants (Rs.5 crore).
1.7.3 Management of cash balances
It is generally desirable that the State’s flow of resources should match its expenditure obligations. However, to take care of any temporary mismatches in the flow of resources and expenditure obligations, a mechanism of Ways and Means Advances (WMA) – ordinary and special – from Reserve Bank of India has been put in place. During the year, the State has not availed of any Ways and Means Advances. Ways and Means Advances and Overdrafts availed of during 200308 and interest paid by the State are detailed in Table 1.24.

Chapter I Finances of the State Government
25
Table No. 1.24: Ways and Means Advances and Overdrafts of the State (Rupees in crore)
200304 200405 200506 200607 200708 Ways and Means Advances Availed in the Year 5330.26 2234.74 Nil Nil Nil Outstanding WMAs, if any 266.78 Nil Nil Nil Interest Paid 14.06 3.75 Nil Nil Nil Number of Days 200 127 Nil Nil Nil Overdraft Availed in the year 1083.54 Nil Nil Nil Number of Days 60 Nil Nil Nil Interest Paid 3.41 Nil Nil Nil
It is evident that due to comfortable position of cash balances of the State it has not availed the WMA and Overdraft facilities during the last three years and nothing is outstanding on these accounts as on 31 st March 2008. The cash balances of the State Government at the end of the year have however decreased by Rs.617 crore (25 per cent) from the level of Rs.2410 crore in the previous year. The cash balance investment of the State Government on the other hand has increased from Rs.2506 crore in 200607 to Rs.2759 crore at the end of current year. The State Government has invested Rs.2759 crore in the GOI Treasury bills and securities under Cash Balance Investment Account and earned an interest of Rs.176 crore.
1.8 Undischarged Liabilities
The FRBM Act, 2005, describes "Total Liabilities" as the liabilities under the consolidated fund of the State and the Public Accounts of the State and includes risk weighted guarantee obligations of the State Government where the principal and/or interest are to be serviced out of the State Budget.
1.8.1 Fiscal Liabilities
There are two sets of liabilities namely, public debt and other liabilities. Public debt consists of internal debt of the State and loans and advances from the Central Government as reported in the Annual Financial Statements under the Consolidated Fund – Capital Accounts. It includes market loans, special securities issued by RBI and loans and advances from the Central Government. The Constitution of India provides that a State may borrow, within the territory of India, upon the security of its Consolidated Fund, within such limits, as may from time to time, be fixed by the Act of its Legislature and give guarantees within such limits as may be fixed. Other liabilities, which are a part of public account, include deposits under small savings scheme, provident funds and other deposits.
Table1.25 gives the fiscal liabilities of the State, its rate of growth, ratio of these liabilities to GSDP to revenue receipts and to own resources as also the buoyancy of fiscal liabilities with respect to these parameters.

Audit Report (Civil) for the year ended 31 March 2008
26
Table No. 1.25: Fiscal Liabilities – Basic Parameters
200304 200405 200506 200607 200708 Fiscal Liabilities 7 (Rupees in crore) 37525 44235 49173 53280 55311* Rate of Growth (per cent) 23.68 17.88 11.16 8.35 3.81 Ratio of Fiscal Liabilities to GSDP (per cent) 36.49 41.23 42.27 41.56 38.90 Revenue Receipts (per cent) 262.61 224.05 238.74 207.36 180.23 Own Resources (per cent) 453.80 361.54 434.28 405.76 374.84 Buoyancy of Fiscal Liabilities to GSDP (ratio) 1.28 4.14 1.32 0.82 0.35 Revenue Receipts (ratio) 3.53 0.47 2.58 0.34 0.20 Own Resources (ratio) 3.94 0.37 () 1.50 0.52 0.31
* Includes Rs. 662 crore not yet apportioned between Madhya Pradesh and Chhattisgarh
Overall fiscal liabilities of the state increased from Rs.37,525 crore in 200304 to Rs.55,311 crore in 200708. The growth rate was decreased to 3.81 per cent during 200708 as against 8.35 per cent in 200607. Fiscal liabilities of the State comprised Consolidated Fund liabilities and Public Account liabilities. The Consolidated Fund liabilities (Rs.42040 crore) comprised of Market loans (Rs.12646 crore), Special securities issued to NSSF (Rs 14300 crore); compensation and issue of other bonds (Rs 3263 crore); loans from NABARD (Rs 2038 crore); Loans and Advances from GOI (Rs. 8782 crore) and other loans (Rs.1011 crore). The Public Account liabilities (Rs.13271 crore) comprises of Small savings, provident funds etc. (Rs.7836 crore), Interest bearing obligations (Rs.484 crore) and non interest bearing obligations like deposits and other earmarked funds (Rs. 4951 crore). These liabilities stood at 38.90 percent of GSDP; 1.8 times the revenue receipts and 3.75 times of the State own resources as at the end of 200708. The buoyancy of these liabilities with respect to GSDP was decreased from 0.82 in 200607 to 0.35 during the year mainly due to sharp decline in their growth rate from 8.35 per cent in 2006 07 to 3.81 per cent in 200708.
7 Includes in Fiscal Liabilities all internal debt, loans and advances from GOI, small savings, provident funds etc., interest bearing obligations such as depreciation reserve fund of commercial undertakings, deposits and noninterest bearing obligations such as deposits of local fund, civil deposit and other earmarked fund.
Growth of Fiscal Liabilities visavis Revenue Receipts (Rupees in crore)
55311 53280
49173 44235
37525
30689 25694
20597 19743 14289
10000
20000
30000
40000
50000
60000
200304 200405 200506 200607 200708
Fiscal liabilities Revenue receipts

Chapter I Finances of the State Government
27
Sinking fund for amortization of all loans, including loans from bank, liabilities on account of NSS etc. has not been set up by the State Government. The State Government is of the view that except where it may be obligatory to do so, provision for amortization of loans received from the GOI should be made out of revenues only where sufficient revenue resources are available to finance such amortization arrangements. The State Government has not considered it necessary to make arrangements for amortization of any such loans inspite of having revenue surplus.
1.8.2 Status of Guarantees – Contingent liabilities
Guarantees are liabilities contingent on the Consolidated Fund of the State in case of default by the borrower for whom the guarantee has been extended.
As per Statement 6 of the Finance Accounts, the maximum amount for which guarantees were given by the State and outstanding guarantees at the end of year 200708 since 200304 is given in Table 1.26.
Table No. 1.26: Guarantees given by the Government of Madhya Pradesh (Rupees in crore)
Year Max amount guaranteed
Outstanding amount of guarantees
Percentage of maximum amount guaranteed to total revenue receipt
200304 12131.29 973.72 84.89 200405 12506.62 2016.27 63.34 200506 12636.80 613.37* 61.35 200607 12424.26 865.82* 48.35 200708 12086.00 855.73* 39.38 * To the extent information was available in the Finance Account.
The outstanding amount of guarantees is in the nature of contingent liability, which was 2.79 per cent of Revenue Receipts. Guarantees have been given by the State Government for the discharge of certain liabilities like loans raised by Statutory corporations, Government companies, Joint Stock companies, Co operative institutions, local bodies, and firms etc. Upto the year 200708 maximum amount guaranteed by the State Government was Rs.12,086 crore, out of which Rs. 856 crore was outstanding at the end of the year. Out of Rs.856 crore outstanding guarantee, Rs.97 crore were outstanding on account of interest. The State Government has constituted a Guarantee Redemption Fund and at the end of year 200708, there was closing balance of Rs.305.31 crore in Fund. The FRBM Act, 2005 prescribes the fiscal target to limit annual incremental guarantees so as to ensure that the total guarantees do not exceed 80 per cent of the total revenue receipts in the year preceding the current year. The annual incremental guarantee was within the limit fixed under FRBM Act.
As per the FRBM Act 2005, the State Government is to ensure that within a period of 10 years, i.e. as on the 31 st March 2015, total liabilities do not exceed 40 per cent of the estimated GSDP for that year. It was observed that this ratio at 39.50 per cent was already within the ceiling limit laid down in the Act for the year 2015. The ratios of total liabilities to GSDP and revenue receipts during

Audit Report (Civil) for the year ended 31 March 2008
28
the year at 39.50 per cent and 183.02 per cent respectively, were also less than the corresponding budget estimate of 48.97 and 243.93 per cent respectively.
1.9 Debt Sustainability
The debt sustainability is defined as the ability of the State to maintain a constant debtGDP ratio over a period of time and also embodies the concern about the ability to service its debt. Sustainability of debt therefore also refers to sufficiency of liquid assets to meet current or committed obligations and the capacity to keep balance between costs of additional borrowings with returns from such borrowings. It means that rise in fiscal deficit should match with the increase in capacity to service the debt. A prior condition for debt sustainability is the debt stabilization in terms of debt/GSDP ratio.
1.9.1 Debt Stabilization
A necessary condition for stability states that if the rate of growth of economy exceeds the interest rate or cost of public borrowings, the debtGSDP ratio is likely to be stable provided primary balances are either zero or positive or are moderately negative. Given the interest spread (GSDP growth rate – interest rate) and quantum spread (Debt*interest spread), debt sustainability condition states that if quantum spread together with primary deficit is zero, debtGSDP ratio would be constant or debt would stabilize eventually. On the other hand, if primary deficit together with quantum spread turns out to be negative, debt GSDP ratio would be rising and in case it is positive, debtGSDP ratio would eventually be falling. Trends in fiscal variables indicating the progress towards the debt stabilization are indicated in Table 1.27.
Table No. 1.27: Debt Sustainability–Interest Rate and GSDP Growth (in per cent)
200304 200405 200506 200607 200708 Average Interest Rate 9.41 8.96 7.33 7.86 7.72 GSDP Growth 18.43 4.32 8.43 10.21 10.92 Interest spread 9.02 () 4.64 1.10 2.35 3.20 Outstanding Liabilities as on Ist day of financial year (Rupees in crore)
30340 37525 44235 49173 53280
Quantum Spread (Rupees in crore)
2737 () 1741 487 1156 1705
Primary Deficit()/Surplus(+) (Rupees in crore)
() 4117 () 2831 () 1149 (+) 1274 (+) 1407
An analysis of primary deficit visàvis quantum spread revealed that their sums turn out to be negative during 200306 indicating rising debtGSDP ratio during the period. But in 200608, the State fiscal position has improved and achieved primary surplus of Rs.1,274 crore and Rs.1,407 crore respectively, as a result primary surplus visàvis quantum spread turns out to positive which indicated the declining trend in debtGSDP ratio which if continued would tend to stabilize the debt and eventually improve the debt sustainability of the State.
1.9.2 Sufficiency of Nondebt Receipts
Another indicator for debt stability and its sustainability is the adequacy of incremental nondebt receipts of the State to cover the incremental interest

Chapter I Finances of the State Government
29
liabilities and incremental primary expenditure. The debt sustainability could be significantly facilitated if the incremental nondebt receipts could meet the incremental interest burden and the incremental primary expenditure. The persistent negative resource gap indicates the nonsustainability of debt while the positive resource gap strengthens the capacity of the State to sustain the debt. Table 1.28 indicates the resource gap as defined for the period 200308.
Table No. 1.28: Incremental nondebt Receipts and Total Expenditure (Rupees in crore)
Incremental Period NonDebt
Receipts Primary
Expenditure Interest Payments
Total Expenditure
Resource Gap
1 2 3 4 5 (3+4) 6 (25)
200304 891 3448 704 4152 () 3261
200405 5451 4185 455 4640 811
200506 3653 1971 () 239 1732 1921
200607 2282 () 141 607 466 1816
200708 5074 4942 162 5104 () 30
During 200304 the incremental nondebt receipts were not enough even to meet the incremental requirements of the primary expenditure resulting in negative resource gap during the year. In subsequent three years (200407), non debt receipts increased and met not only the additional requirement on primary account but after meeting the incremental interest liabilities resulted in a positive resource gap indicating towards the increasing capacity of the State to sustain the debt. However, during 200708 the incremental nondebt receipts were sufficient to meet the additional requirement of primary expenditure which increased sharply during the year but not enough to meet the incremental interest liability resulting in moderate negative resource gap.
1.9.3 Net availability of funds
The debt sustainability of the State also depends on (i) the ratio of the debt redemption (Principal + Interest Payments) to total debt receipts and (ii) application of available borrowed funds. The ratio of debt redemption to debt receipts indicates the extent to which the debt receipts are used in debt redemption indicating the net availability of borrowed funds. The solution to the government debt problem lies in application of borrowed funds, i.e. these are (a) not being used for financing revenue expenditure; and (b) being used efficiently and productively for capital expenditure which either provides returns directly or results in increased productivity of the economy in general which may result in increase in government revenue.
Table1.29 below gives the position of the receipt and repayment of internal debt and other fiscal liabilities of the State as well as the net availability of the borrowed funds over the last five years.
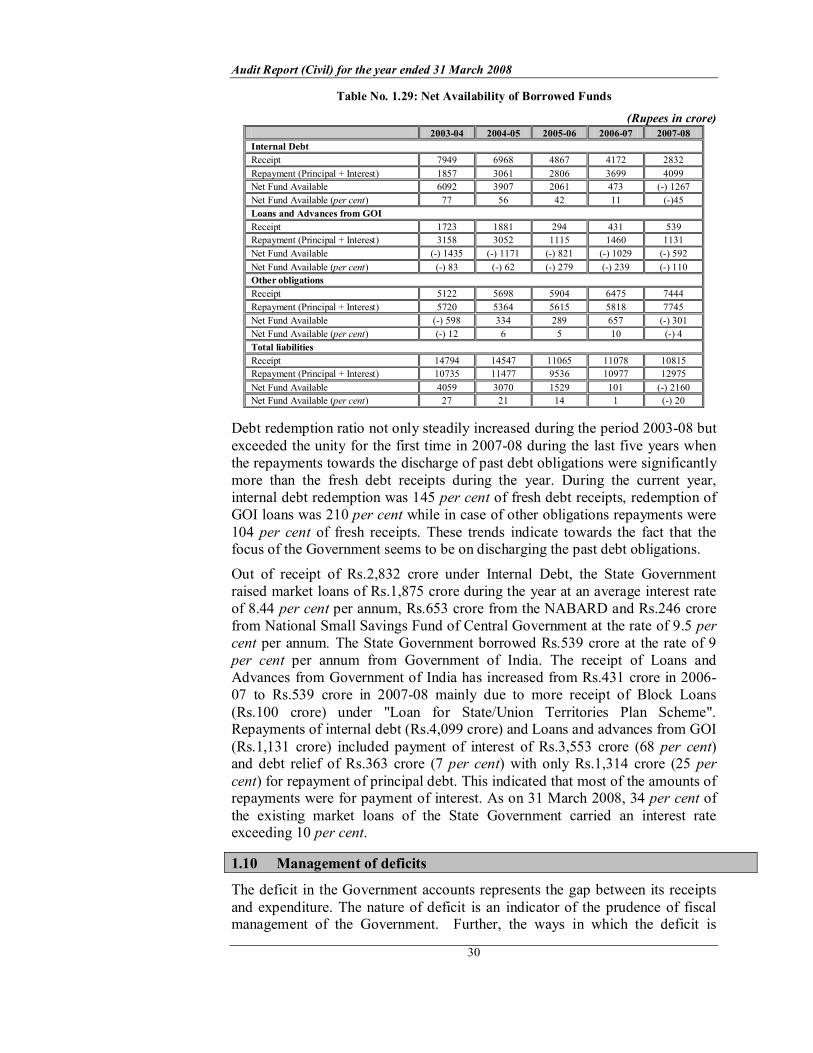
Audit Report (Civil) for the year ended 31 March 2008
30
Table No. 1.29: Net Availability of Borrowed Funds
(Rupees in crore) 200304 200405 200506 200607 200708
Internal Debt Receipt 7949 6968 4867 4172 2832 Repayment (Principal + Interest) 1857 3061 2806 3699 4099 Net Fund Available 6092 3907 2061 473 () 1267 Net Fund Available (per cent) 77 56 42 11 ()45 Loans and Advances from GOI Receipt 1723 1881 294 431 539 Repayment (Principal + Interest) 3158 3052 1115 1460 1131 Net Fund Available () 1435 () 1171 () 821 () 1029 () 592 Net Fund Available (per cent) () 83 () 62 () 279 () 239 () 110 Other obligations Receipt 5122 5698 5904 6475 7444 Repayment (Principal + Interest) 5720 5364 5615 5818 7745 Net Fund Available () 598 334 289 657 () 301 Net Fund Available (per cent) () 12 6 5 10 () 4 Total liabilities Receipt 14794 14547 11065 11078 10815 Repayment (Principal + Interest) 10735 11477 9536 10977 12975 Net Fund Available 4059 3070 1529 101 () 2160 Net Fund Available (per cent) 27 21 14 1 () 20
Debt redemption ratio not only steadily increased during the period 200308 but exceeded the unity for the first time in 200708 during the last five years when the repayments towards the discharge of past debt obligations were significantly more than the fresh debt receipts during the year. During the current year, internal debt redemption was 145 per cent of fresh debt receipts, redemption of GOI loans was 210 per cent while in case of other obligations repayments were 104 per cent of fresh receipts. These trends indicate towards the fact that the focus of the Government seems to be on discharging the past debt obligations.
Out of receipt of Rs.2,832 crore under Internal Debt, the State Government raised market loans of Rs.1,875 crore during the year at an average interest rate of 8.44 per cent per annum, Rs.653 crore from the NABARD and Rs.246 crore from National Small Savings Fund of Central Government at the rate of 9.5 per cent per annum. The State Government borrowed Rs.539 crore at the rate of 9 per cent per annum from Government of India. The receipt of Loans and Advances from Government of India has increased from Rs.431 crore in 2006 07 to Rs.539 crore in 200708 mainly due to more receipt of Block Loans (Rs.100 crore) under "Loan for State/Union Territories Plan Scheme". Repayments of internal debt (Rs.4,099 crore) and Loans and advances from GOI (Rs.1,131 crore) included payment of interest of Rs.3,553 crore (68 per cent) and debt relief of Rs.363 crore (7 per cent) with only Rs.1,314 crore (25 per cent) for repayment of principal debt. This indicated that most of the amounts of repayments were for payment of interest. As on 31 March 2008, 34 per cent of the existing market loans of the State Government carried an interest rate exceeding 10 per cent.
1.10 Management of deficits
The deficit in the Government accounts represents the gap between its receipts and expenditure. The nature of deficit is an indicator of the prudence of fiscal management of the Government. Further, the ways in which the deficit is

Chapter I Finances of the State Government
31
financed and the resources so raised are applied are important pointers to the fiscal health. The trends in fiscal parameters depicting the position of fiscal equilibrium in the State are presented in Table 1.30.
Table No. 1.30: Fiscal Imbalances: Basic Parameters
Parameters 200304 200405 200506 200607 200708 Revenue deficit ()/ Revenue Surplus (+) (Rupees in crore)
() 4476 (+) 1717 (+) 34 (+) 3331 (+) 5088
Fiscal deficit (Rupees in crore) () 7323 () 6492 () 4571 () 2755 () 2784 Primary deficit ()/Surplus (+) (Rupees in crore)
() 4117 () 2831 () 1149 (+) 1274 (+) 1407
RD ()/RS(+)/GSDP (per cent) () 4.35 (+) 1.60 (+) 0.03 (+) 2.60 (+) 3.58 FD ()/FS(+)/GSDP (per cent) () 7.12 () 6.05 () 3.93 () 2.15 () 1.96 PD ()/PS(+)/GSDP (per cent) () 4.00 () 2.64 () 0.99 (+) 0.99 (+) 0.99 RD/FD (per cent) 61.12 NA NA NA NA
4476
7323
4117
1717
6492
2831
34
4571
1149
3331
2755
1274
5088
2784
1407
10000 8000 6000 4000 2000
0 2000 4000 6000
200304 200405 200506 200607 200708
Fiscal Imbalances (Rupees in crore)
Revenue deficit ()/Surplus (+) Fiscal deficit ()/Surplus (+) Primary deficit ()/Surplus (+)
1.10.1 Trends in Deficits The revenue deficit of the State indicates the excess of its revenue expenditure over revenue receipts. The State had a revenue surplus during 200405 to 2007 08. The revenue surplus increased from Rs.3,331 crore during 200607 to Rs.5,088 crore during 200708. An increase of 19.44 per cent (Rs.4,995 crore) in revenue receipts during 200708 in comparison to that of 14.48 per cent (Rs.3238 crore) in revenue expenditure over 200607 led to the increase in revenue surplus during 200708. The improvement in revenue surplus of the State may however be seen in view of the fact that about (Rs.3370 crore) 67.5 per cent of the incremental revenue receipts of the State during 200708 (Rs 4995 crore) are contributed by the central transfers comprising of State’s share in central taxes and duties and grantsinaid from the Union of India.
The fiscal deficit defined as a gap between the total expenditure of the Government and its total resources decreased consistently from Rs.7,323 crore in 200304 to Rs.2,755 crore in 200607 but increased slightly in 200708 to Rs.2,784 crore. Despite the cushion of incremental revenue surplus of Rs.1,757 crore during the year, fiscal deficit marginally increased by Rs.29 crore mainly on account of increase in capital expenditure (Rs.1,663 crore) and disbursement of Loans and Advances (Rs.202 crore) during 200708 relative to the previous year. Given the marginal increase in fiscal deficit (Rs.29 crore) and increase in

Audit Report (Civil) for the year ended 31 March 2008
32
interest payments (Rs.162 crore), primary surplus of Rs.1,274 crore in 200607 increased to Rs.1,407 crore in 200708.
1.10.2 Quality of Deficit/Surplus The ratio of RD to FD and the decomposition of Primary deficit 8 into primary revenue deficit 9 and capital expenditure (including loans and advances) would indicate the quality of deficit in the States’ finances. The ratio of revenue deficit to fiscal deficit indicates the extent to which borrowed funds were used for current consumption. The ratio of RD to FD was 61 per cent in 200304 and thereafter the revenue deficit turned into surplus. This trajectory shows a consistent improvement in the quality of the deficit and the borrowed funds were used in activities resulting in expansion in the asset backup of the State.
The bifurcation of the factors resulting into primary deficit or surplus of the State during the period 200308 reveals (Table1.31) that except in 200304 the non debt receipt were enough to meet the primary revenue expenditure thereby generating surplus which consistently increased from Rs.5,431 crore in 200405 to Rs.9,397 crore in 200708. In other words, nondebt receipts of the State were enough to meet the primary expenditure 10 requirements in the revenue account, rather left some receipts to meet the expenditure under the capital account. The State experienced the primary deficit during 200306 when total nondebt receipts fell short of the total primary expenditure. But in 200608 the State achieved the primary surplus and the fiscal deficit was experienced mainly on account of the interest payment obligations.
Table No. 1.31: Primary deficit/surplusBifurcation of factors (Rupees in crore )
Year Nondebt receipts*
Primary revenue
expenditure
Capital expenditure
Loans and Advances*
Primary Expenditure
Nondebt Receipt visàvis Primary
Revenue expenditure
Primary deficit () /surplus (+)
1 2 3 4 5 6(3+4+5) 7 (23) 8 (26) 200304 14325 15559 2679 204 18442 () 1234 () 4117 200405 19796 14365 4951 3311 22627 5431 () 2831 200506 23449 17141 6623 834 24598 6308 () 1149 200607 25732 18334 5170 954 24458 7398 1274 200708 30807 21410 6833 1157 29400 9397 1407 * Including Inter State settlement
1.11 Fiscal Ratios
The finances of a State should be sustainable, flexible and nonvulnerable. Table1.32 below presents a summarized position of Government finances over 200308, with reference to certain key indicators that help to assess the
8 Primary deficit defined as the fiscal deficit net of interest payments indicates the extent of deficit, which is an outcome of the fiscal transactions of the State during the course of the year.
9 Primary revenue deficit defined as gap between non interest revenue expenditure of the State and its revenue receipts indicates the extent to which the revenue receipts of the State are able to meet the primary expenditure incurred under revenue account.
10 Primary expenditure of the State defined as the total expenditure net of the interest payments indicates the expenditure incurred on the transactions undertaken during the year.

Chapter I Finances of the State Government
33
adequacy and effectiveness of available resources and their applications, highlights areas of concern and captures its important facts.
Table No. 1.32: Indicators of Fiscal Health (in per cent and ratios) Fiscal Indicators 200304 200405 200506 200607 200708 I Resource Mobilization Revenue Receipt/GSDP 13.89 18.40 17.71 20.04 21.58 Revenue Buoyancy 0.36 8.84 0.51 2.42 1.78 Own Tax/GSDP 6.60 7.25 7.84 8.17 8.45 II Expenditure Management Total Expenditure/GSDP 21.05 24.50 24.09 22.22 23.62 Revenue Receipts/ Total Expenditure 66.01 75.10 73.51 90.20 91.36 Revenue Expenditure/Total Expenditure 86.68 68.57 73.39 78.51 76.22 Salary expenditure on Social and Economic Services / Revenue Expenditure
NA NA 20.13 19.42 18.62
NonSalary expenditure on Social and Economic Services / Revenue Expenditure
NA NA 37.50 36.27 38.73
Capital Expenditure/Total Expenditure 12.38 18.83 23.64 18.15 20.34 Capital Expenditure on Social and Economic Services/Total Expenditure.
12.20 18.27 23.20 17.90 20.12
Buoyancy of TE with RR 3.54 0.56 1.52 0.07 0.92 Buoyancy of RE with RR 4.30 () 0.10 3.25 0.35 0.74 III Management of Fiscal Imbalances Revenue deficit ()/ surplus (+)(Rs in crore) () 4476 (+) 1717 (+) 34 (+) 3331 (+) 5088 Fiscal deficit ()/surplus () (Rs in crore) () 7323 () 6492 () 4571 () 2755 () 2784 Primary Deficit ()/ surplus (+)(Rs in crore) () 4117 () 2831 () 1149 (+) 1274 (+) 1407 Revenue Deficit/Fiscal Deficit 61.12 NA NA NA NA IV Management of Fiscal Liabilities Fiscal Liabilities/GSDP 36.49 41.23 42.27 41.56 38.90 Fiscal Liabilities/RR 262.61 224.05 238.74 207.36 180.23 Buoyancy of FL with RR 3.53 0.47 2.58 0.34 0.20 Buoyancy of FL with Own Receipts 3.94 0.37 () 1.50 0.52 0.31 Primary deficit visàvis quantum spread (Rs in crore)
() 1380 () 4572 () 662 (+) 2430 (+) 3112
Net Funds Available 27 21 14 1 () 20 V Other Fiscal Health Indicators Return on Investment 0.48 0.06 0.08 0.18 0.67 Balance from Current Revenue (Rs in crore) () 3057 2909 2081 5294 7275 Financial Assets/Liabilities 11 0.65 0.75 0.77 0.85 0.94
The trends in ratios of revenue receipts and State’s own taxes to GSDP indicate the adequacy and accessibility of State to resources. Revenue receipts are comprised not only of the tax and nontax resources of the State but also the transfers from Union Government. The revenue receipts relative to GSDP has steadily increased during the period 200308 and reached to 21.58 per cent during the year which slightly more than the budgeted estimate of 20.8 per cent of the government for the year. The ratio of own taxes to GSDP has also consistently increased during the period 200308 and reached the level of 8.45 per cent in 200708 which was at par of budgeted estimate of the government (8.4 per cent) for the year. Various ratios concerning the expenditure management of the State indicate quality of its expenditure and sustainability of these in relation to its resource mobilization efforts. The ratio of revenue expenditure to total expenditure although declined from 87 per cent in 200304 to 76 per cent in 200708 with interyear variations but it continues to share the dominant portion of the total expenditure of the State Government. The capital expenditure relative to total expenditure had correspondingly indicated an improvement and increased from
11 Assets and some of the liabilities are yet to be apportioned and transferred to Chhattisgarh
Audit Report (Civil) for the year ended 31 March 2008
34
12 per cent in 200304 to 20 per cent in 200708 with inter year fluctuations. Increasing reliance on revenue receipts to finance the total expenditure that increased from 66 per cent in 200304 to 91 per cent during 200708 indicates decreasing dependence on borrowed funds. This is also reflected by the decreasing trend in fiscal liabilities to revenue receipts ratio during the period 200308.
The continued prevalence of revenue surplus during the last four years (2004 08), a turnaround in primary account with surplus in 200608 and a consistent decline in fiscal deficit since 200307 with marginal increase in 200708 are the pointers towards an improvement in fiscal position of the state. The positive Balance from Current Revenue (BCR) during 200408 indicates that ample funds were available for creation of assets and to meet the plan requirements of the State. The improved fiscal position along with the increasing share of capital expenditure of the State resulted in the increasing ratio of financial assets to liabilities over the period 200308.
1.12 Conclusion
The fiscal position of the State viewed in terms of the key fiscal parameters – revenue, fiscal and primary deficit/surplus – indicated somewhat mixed trends in 200708 as revenue and primary surpluses have improved while fiscal deficit marginally increased relative to the previous year. The improvement in revenue surplus of the State may however be seen in view of the fact that about 67.5 per cent of the incremental revenue receipts of the State during 200708 (Rs 4995 crore) are contributed by the central transfers comprising of State’s share in central taxes and duties and grantsinaid from the Union of India. Notwithstanding these facts, the State has achieved the revenue and fiscal deficits targets relative to GSDP laid down under the FRBM Act, 2005. The expenditure pattern of the State reveals that the revenue expenditure as a percentage to total expenditure continues to share dominant proportion of total expenditure at 76 per cent during 200708 leaving less resources for expansion of services and creation of assets. Moreover, within the revenue expenditure, NPRE at Rs.18,795 crore in 200708 was although marginally lower than Rs.19,113 crore projected by the State in its MTFPS but it remained significantly higher than the normatively assessed level by TFC (Rs. 16,478 crore) for the year. Further, three components – salary expenditure, pension payments and interest payments – constitute about 68 per cent of the NPRE during 200708 which would increase further if subsidies are added to the list for which however figures are not available as state has not opened yet a distinct head to capture the expenditure on explicit subsidies. These trends in expenditure indicate the need for change in allocative priorities. The fiscal liabilities of the state were although within ceiling prescribed by FRBM Act, 2005 but continued to increase due to inter alia persistent fiscal deficit till the current year. The increasing fiscal liabilities accompanied with negligible rate of return on government investments and inadequate recovery of interest on loans and advances however might put fiscal stress on the State in the medium to long run unless suitable measures are initiated to make the investments including loans and advances commercially viable; to compress the non plan revenue expenditure and to mobilize the additional resources both through the tax and non tax sources in ensuing years.

Chapter II Allocative Priorities and Appropriation
35
CHAPTER II
Allocative Priorities and Appropriation
2.1 Introduction
The Appropriation Accounts are prepared annually to indicate capital and revenue expenditure on various specified services visàvis those authorized by the Appropriation Act(s) in respect of both charged and voted items of budget.
Audit of Appropriation Accounts by the Comptroller and Auditor General of India seeks to ascertain whether the expenditure actually incurred under various grants is within the authorization given under the Appropriation Act by the State Legislature for that year and the expenditure required to be charged under the provisions of the Constitution is so charged. It also ascertains whether the expenditure so incurred is in conformity with the law, relevant rules, regulations and instructions.
2.2 Summary of Appropriation Accounts
The summarized position of actual expenditure during 200708 against 82 grants/ appropriations was as follows:
Table No. 2.1: Summary of Appropriation Accounts
(Rupees in crore) Nature of expenditure
Original grants/
appropriations
Supplementary grants/
appropriations
Total Actual expenditure
Saving() Excess(+)
I. Revenue 21854.50 3160.51 25015.01 21427.16 3587.85 II. Capital 6550.71 1910.05 8460.76 7170.87 1289.89
Voted
III. Loans & Advances
872.95 710.94 1583.89 1168.35 1 415.54
Total Voted
29278.16 5781.50 35059.66 29766.38 5293.28
IV. Revenue 4662.53 84.27 4746.80 4649.54 97.26 V. Capital 5.87 6.77 12.64 11.95 0.69
Charged
VI. Public Debt
3681.48 0.00 3681.48 1677.00 2004.48
Total Charged
8349.88 91.04 8440.92 6338.49 2102.43
Grand Total
37628.04 5872.54 43500.58 36104.87 2 7395.71
The overall savings of Rs.7395.71 crore was the result of savings in 171 cases of grants and appropriations.
1 Includes Rs. 2.06 crore in respect of Interstate Settlement. 2 It was gross figures without taking into account the recoveries adjusted in accounts as
reduction of expenditure under revenue expenditure: Rs. 475.59 crore and Capital expenditure: Rs. 361.53 crore.

Audit Report (Civil) for the year ended 31 March 2008
36
Detailed comments on the expenditure and budgetary control systems in the case of some testchecked grants are contained in paragraph 2.7. Scrutiny of the Appropriation Accounts 200708 revealed the following further points: 2.2.1 The actual expenditure shown under Consolidated Fund (in the table above) stands overstated to the following extent for the reasons mentioned below : Rupees 136.04 crore 3 being unspent amount was transferred to Major Head 8443Civil Deposits, 800Other Deposits. Out of total deposits, Rs 100.11 crore were credited through NIL payment vouchers. Rupees 12.02 crore (Deposits: Rs.1313.87 crore Disbursements: Rs.1301.85 crore) in respect of government institutions added to the balance of Major Head 8443 Civil Deposit, 106 Personal Deposit Account. Out of the total deposit of Rs.1313.87 crore during the year, Rs.705.97 crore were credited through NIL payment vouchers.
Genuineness of expenditure of Rs.27.91 lakh drawn on Abstract Contingent bills could not be vouchsafed, as Detailed Contingent bills were not submitted.
The savings/ excesses (Detailed Appropriation Accounts) were reported to the controlling officers requiring them to explain the significant variations. Out of total 859 subheads commented upon in Appropriation Accounts, explanation for savings/ excesses in respect of 639 Subheads (74.4 per cent) were either not received or were not to the point.
2.3 Fulfilment of Allocative Priorities
2.3.1 Appropriation by Allocative Priorities Savings in a grant or appropriation indicate that the expenditure could not be incurred as estimated and planned. It points to poor budgeting or shortfall in performance depending upon the circumstances under which and the purpose for which the grant or appropriation was provided.
Analysis of savings with reference to allocative priorities showed the following cases of substantial savings: Grant No. 06Finance
(Rupees in crore) Revenue (Voted)
Original Supplementary Total grant Actual Expenditure Saving
2643.94 111.50 2755.44 2143.81 611.63
Supplementary grant of Rs. 111.50 crore proved unnecessary as the actual expenditure was less than the original provision. Saving occurred mainly under 2070Other Administrative ServicesState Plan Scheme (Normal)Other Expenditure (Rs.495.00 crore), 2071Pension and Other Retirement Benefits
3 Revenue (voted) section: Rs.123.11 crore, and Capital (voted) section: and Rs.12.93 crore.

Chapter II Allocative Priorities and Appropriation
37
Minor Head104Madhya Pradesh (Rs.24.72 crore), Composite State of Madhya Pradesh (Rs.96.19 crore)and 2075Miscellaneous General Services Minor Head 797Transfer in Consolidated Deposit Fund (Rs.100 crore) which were partly off set by excess mainly under 2071Pension and other Retirement Benefits(Minor head 101)Composite State of Madhya Pradesh (Rs.37.15 crore) and Madhya Pradesh (Rs. 38.29 crore) and Minor Head 105Composite State of Madhya Pradesh (Rs.53.73 crore). Reasons for saving and excess have not been intimated (August 2008).
Grant No.12Energy (Rupees in crore)
Capital (Voted) Original Supplementary
Total grant Actual Expenditure Saving
1329.33 446.00 1775.33 1483.27 292.06
Supplementary grant of Rs 446.00 crore was excessive in view of final saving of Rs. 292.06 crore. Savings occurred mainly under 4801Capital Outlay on Power Projects Energy Development FundInvestment for Satpura Thermal Power Extension Unit (Rs.40 crore), Externally Aided Project (Normal) Investment for Transmission System Works ( Rs. 30.47 crore ), Strengthening of Subtransmission and Distribution System (Rs. 56.66 crore), 6801 Loans for Power ProjectsExternally Aided Projects (Normal) Strengthening of Sub transmission and Distribution System (Rs. 132.20 crore), State Plan Schemes (Normal)Rajiv Gandhi Rural Electrification Scheme (Rs.56.95 crore) and Energy Development Fund Other Loans to Electricity Board ( Rs. 37.86 crore).These savings were partly offset by excess under 4801Capital outlay on Power ProjectsState Plan Schemes (Normal)Strengthening of Sub transmission and Distribution System (Rs. 31.49 crore), and Energy Development FundInvestment for Transmission System Works (Rs.50 crore).Out of saving of Rs. 56.66 crore mentioned above savings of Rs.15.17 crore attributed to abolition of Grant in new conditions issued by the Government of India, saving of Rs. 132.20 crore was attributed to slow progress of work in implementation of the project and that of Rs.56.95 crore was due to nonreceipt of sanctions of remaining projects from the Government of India. Excess of Rs 31.49 crore and Rs. 50.00 crore above were attributed to inclusion of additional projects. Reasons for savings in other cases have not been intimated (August 2008). Grant No. 21Housing and Environment
(Rupees in crore) Revenue (Voted)
Original Supplementary Total grant Actual Expenditure Saving
121.23 324.00 445.23 162.45 282.78
Supplementary grant of Rs.324.00 crore was excessive in view of final saving of Rs.282.78 crore. Savings occurred mainly under 2217Urban Development State Plan Schemes (Normal)Grant to M.P. Development Federation for
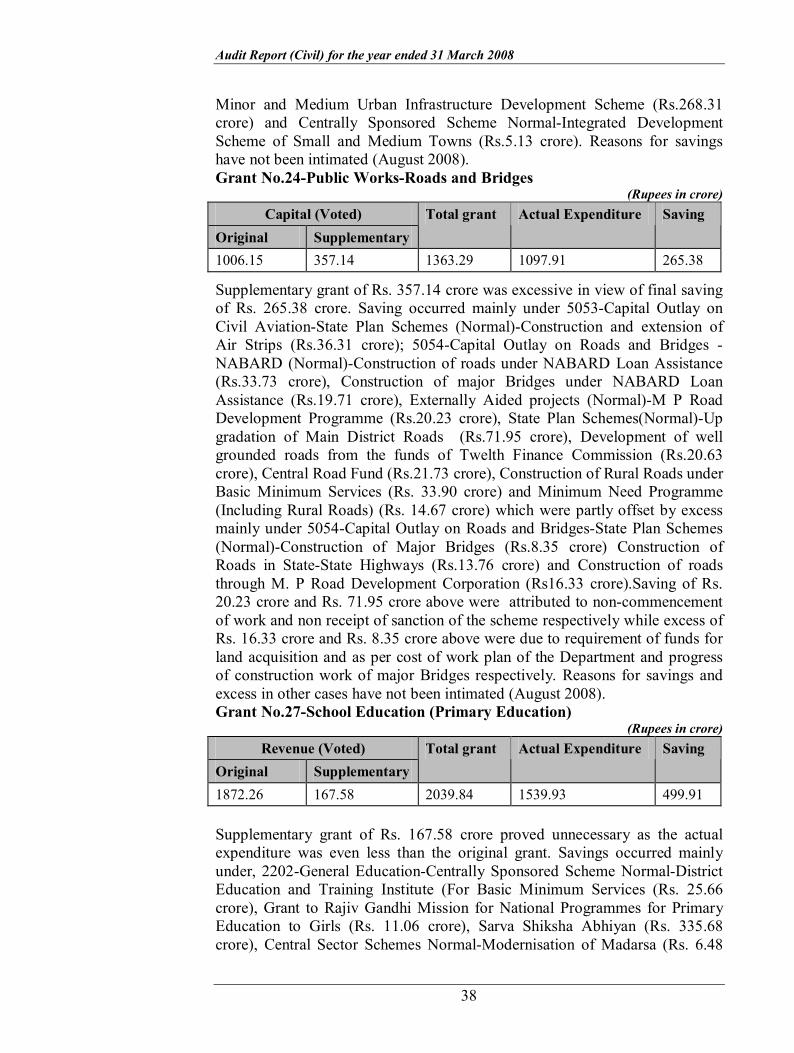
Audit Report (Civil) for the year ended 31 March 2008
38
Minor and Medium Urban Infrastructure Development Scheme (Rs.268.31 crore) and Centrally Sponsored Scheme NormalIntegrated Development Scheme of Small and Medium Towns (Rs.5.13 crore). Reasons for savings have not been intimated (August 2008). Grant No.24Public WorksRoads and Bridges
(Rupees in crore) Capital (Voted)
Original Supplementary Total grant Actual Expenditure Saving
1006.15 357.14 1363.29 1097.91 265.38
Supplementary grant of Rs. 357.14 crore was excessive in view of final saving of Rs. 265.38 crore. Saving occurred mainly under 5053Capital Outlay on Civil AviationState Plan Schemes (Normal)Construction and extension of Air Strips (Rs.36.31 crore); 5054Capital Outlay on Roads and Bridges NABARD (Normal)Construction of roads under NABARD Loan Assistance (Rs.33.73 crore), Construction of major Bridges under NABARD Loan Assistance (Rs.19.71 crore), Externally Aided projects (Normal)M P Road Development Programme (Rs.20.23 crore), State Plan Schemes(Normal)Up gradation of Main District Roads (Rs.71.95 crore), Development of well grounded roads from the funds of Twelth Finance Commission (Rs.20.63 crore), Central Road Fund (Rs.21.73 crore), Construction of Rural Roads under Basic Minimum Services (Rs. 33.90 crore) and Minimum Need Programme (Including Rural Roads) (Rs. 14.67 crore) which were partly offset by excess mainly under 5054Capital Outlay on Roads and BridgesState Plan Schemes (Normal)Construction of Major Bridges (Rs.8.35 crore) Construction of Roads in StateState Highways (Rs.13.76 crore) and Construction of roads through M. P Road Development Corporation (Rs16.33 crore).Saving of Rs. 20.23 crore and Rs. 71.95 crore above were attributed to noncommencement of work and non receipt of sanction of the scheme respectively while excess of Rs. 16.33 crore and Rs. 8.35 crore above were due to requirement of funds for land acquisition and as per cost of work plan of the Department and progress of construction work of major Bridges respectively. Reasons for savings and excess in other cases have not been intimated (August 2008). Grant No.27School Education (Primary Education)
(Rupees in crore) Revenue (Voted)
Original Supplementary Total grant Actual Expenditure Saving
1872.26 167.58 2039.84 1539.93 499.91
Supplementary grant of Rs. 167.58 crore proved unnecessary as the actual expenditure was even less than the original grant. Savings occurred mainly under, 2202General EducationCentrally Sponsored Scheme NormalDistrict Education and Training Institute (For Basic Minimum Services (Rs. 25.66 crore), Grant to Rajiv Gandhi Mission for National Programmes for Primary Education to Girls (Rs. 11.06 crore), Sarva Shiksha Abhiyan (Rs. 335.68 crore), Central Sector Schemes NormalModernisation of Madarsa (Rs. 6.48

Chapter II Allocative Priorities and Appropriation
39
crore), I E D (Rs. 7.57 crore). Savings of Rs. 25.66 crore, Rs. 6.48 crore and Rs. 7.57 crore above were mainly due to posts remaining vacant, non conduction of training, non receipt of sanction / funds from the Government of India and adoption of economic measures. Reasons for savings in other cases have not been intimated (August 2008). Grant no.41 –Tribal Areas SubPlan
(Rupees in crore) Revenue (Voted)
Original Supplementary Total grant Actual Expenditure Saving
857.46 389.57 1247.03 962.57 284.46
Supplementary grant of Rs.389.57 crore was excessive in view of final saving of Rs.284.46 crore. Significant saving occurred mainly under 2202General EducationCentrally Sponsored Schemes TSP Grant to Rajiv Gandhi Mission for National Programme of Primary Education to Girls (NPEGEL) (Rs. 10.35 crore), SarvaShiksha Abhiyan (Rs.110.46 crore), 2225Welfare of Scheduled castes, Scheduled Tribes and Other Backward ClassesCentral Sector Schemes T S PGrant to M P Residential School Society under Article 275(1) (Rs.8.36 crore), 2236NutritionTribal Area SubPlanMinimum Need Programme for Special Nutrition Schemes (Rs. 6.90 crore) and 2406Forestry and Wild Life Schemes financed out of Additive Funds from Government of India Development of forest villages (Rs. 70.53 crore). These savings were partly off set by excess of Rs. 8.55 crore mainly under 2225Tribal Aea SubPlanSelf employment Scheme. Savings of Rs. 8.36 crore above was attributed to non receipt of funds from the Government of India. Reasons for other savings and excess in other cases above have not been intimated (August 2008). Grant no.45 – Minor Irrigation Works
(Rupees in crore) Capital (Voted)
Original Supplementary Total grant Actual Expenditure Saving
286.12 229.38 515.50 368.19 147.31
Supplementary grant of Rs. 229.38 crore was excessive in view of final savings of Rs. 147.31 crore. Savings occurred mainly under 4702Capital Outlay on Minor IrrigationNABARD (Normal)Direction and Administration (Rs. 13.35 crore), State Plan Schemes (Normal)A I B P Schemes (Rs.88.92 crore) and Direction and Administration (Rs.24.03 crore). Saving of Rs. 88.92 crore above was attributed to late receipt of sanction from the Government of India. Reasons for savings in other cases above have not been intimated (August 2008).

Audit Report (Civil) for the year ended 31 March 2008
40
Grant no.57– Externally Aided Projects Pertaining to Water Resources Department
(Rupees in crore) Capital (Voted)
Original Supplementary Total grant Actual Expenditure Saving
319.33 319.33 146.48 172.85
Significant savings occurred mainly under4700Capital Outlay on Major Irrigation Externally Aided Projects (Normal)Service Providing Irrigation and Water Drainage institutionsWater Resources Department (minor head 001) (Rs.23.70 crore), Improvement in productivity of Preconstructed Irrigation Schemes of Five BasinsFisheries Department (minor head 001) (Rs.8.46 crore), Agriculture Department (minor head 001) (Rs. 7.73 crore) Water Resources Department (minor head 001) (Rs.9.53 crore), Water Resources Department (minor head 052) (Rs.7.75 crore) and Water Resources Department (minor head 800) (Rs. 83.52 crore). These savings were partly off set by excess of Rs. 13.99 crore under Major head 4700Externally aided Projects (Normal)Canal and Appurtenant Works mainly due to more payment on construction works. Savings were mainly due to slow progress of works, non completion of procedural works, non appointment of contract employees, economy measures and to provide funds under major head 4702 in grant no. 45. Grant No. 75 Financial assistance to Urban Bodies.
(Rupees in crore) Revenue (Voted)
Original Supplementary Total grant Actual Expenditure Saving
1703.07 108.71 1811.78 1567.95 243.83
Supplementary grant of Rs.108.71 crore was unnecessary as the actual expenditure was even less than the original grant. Substantial savings occurred mainly under 2217Urban DevelopmentState Plan Scheme (Normal)Jawahar Lal Nehru National Punarnavi Mission (Rs.156.80 crore) and Integrated Urban and Slum Development Programme (Rs.71.53 crore). These savings were mainly due to nonreceipt of sanction for new projects from the Government of India. In many other cases also, savings/ excesses occurred as follows:
Ø In 23 cases, the entire budget provision of Rupees one crore and more in each case totaling Rs.299.46 crore under various Central schemes including externally aided projects remained unutilized, as detailed in Appendix2.1.
Ø In 17 schemes, expenditure in each case exceeded the approved provisions by Rupees five crore or more and also by more than 100 per cent of the total provision, aggregating to Rs.379.26 crore. Excesses indicate poor

Chapter II Allocative Priorities and Appropriation
41
budgeting and weak expenditure control. Details are given in Appendix2.2.
Ø In 65 schemes, substantial saving of Rupees five crore or more and also more than 80 per cent of the provision in each case, aggregating to Rs.3773.21 crore was noticed. In 40 of these schemes, the entire provision remained unutilized. The details are given in Appendix2.3.
2.3.2 Persistent savings In 17 cases of grants and appropriations there were persistent savings of more than Rupees one crore and also 20 per cent or more of provision in each case. Persistent savings indicate budgeting based on inappropriate assumptions. Details are given in Appendix2.4.
2.3.3 Excess requiring regularisation
(i) Excess over provision relating to previous years requiring regularisation
As per Article 205 of the Constitution of India, it is mandatory for State Government to get the excess over a grant/ appropriation regularized by the State Legislature. However, the excess expenditure amounting to Rs.5161.40 crore during the years 199394 to 200607 had not been regularized so far (August 2008). This was breach of Legislative control over appropriations. The details are as follows:
Table No. 2.2: Excess requiring regularisation
(Rupees in crore) Year No. of grants/
appropriation Amount of excess
Amount for which explanations not furnished to PAC
19931994 21 258.11 Furnished 19941995 15 407.46 Furnished 19951996 21 251.59 Furnished 19961997 18 224.17 Furnished 19971998 13 302.79 0.23 19981999 17 1276.45 Furnished 19992000 17 1584.94 Furnished 20002001 07 265.07 Furnished 20012002 03 6.26 Furnished 20022003 08 424.79 Furnished 20032004 07 2.54 2.46 20042005 15 83.66 4.45 20052006 06 37.58 29.23 20062007 03 35.99 35.99 Total 5161.40 72.36
(ii) No excess over the voted and charged grants appropriations occurred during the year 200708.

Audit Report (Civil) for the year ended 31 March 2008
42
2.3.4 Original budget and supplementary provision Supplementary provision (Rs.5872.54 crore) made during this year constituted 13.50 per cent of the total provision (Rs.43500.58 crore) as against 10.55 per cent in the previous year.
2.3.5 Unnecessary/ excessive supplementary provisions Supplementary provision of Rs.901.43 crore made in 38 cases during the year proved unnecessary in view of aggregate saving of Rs.2443.74 crore (saving in each case exceeding Rs. 10 lakh), as detailed in Appendix2.5. In 46 cases, against additional requirement of only Rs.2546.69 crore, supplementary grants of Rs.4836.66 crore were obtained, resulting in savings in each case exceeding Rs.10 lakh, aggregating to Rs.2289.97 crore. Details of these cases are given in Appendix2.6.
2.3.6 Excessive/ unnecessary reappropriations/ surrender of funds
Reappropriation is a transfer of funds within a grant from one unit of appropriation where savings are anticipated to another unit where additional funds are needed. There were 77 cases where the reappropriations / surrender of funds of more than rupees one crore in each case proved injudicious due to (a) withdrawal of funds from heads increased the excess expenditure, (b) withdrawal of funds resulted in excess expenditure, (c) unnecessary augmentation of funds despite saving, and (d) augmentation of funds resulted in final savings. The details are given in Appendix2.7.
2.3.7 Anticipated savings not surrendered
(a) The spending departments are required to surrender the grants/appropriations or portion thereof to the Finance Department as and when the savings are anticipated. However, at the close of the year 200708, there were 130 cases of grants/ appropriations in which savings of Rs.4294.86 crore had not been surrendered by the departments. Out of these, in 45 cases, 69 per cent of available savings, aggregating to Rs.4250.17 crore (Rupees five crore and above in each case) were not surrendered, as per details given in Appendix 2.8.
(b) Besides, in 138 cases, Rs.2174.88 crore (69.46 per cent) were surrendered on the last day of March 2008, out of total surrender of Rs.3131.11 crore, indicating inadequate financial management.
2.3.8 Injudicious surrender of funds
In ten cases of grants/appropriations, the amount surrendered was in excess of the available saving, which indicated inefficient budgetary control. It was noticed that as against the total available savings of Rs.255.77 crore, the amount surrendered was Rs.286.03 crore, resulting in injudicious excess surrender of Rs.30.26 crore. Details are given in Appendix 2.9.
Chapter II Allocative Priorities and Appropriation
43
2.3.9 Expenditure without Budget Provision
Expenditure should not be incurred on any scheme / service without provision of funds by budget. It was however, noticed that in Grant no.21Housing and Environment under the scheme 2070112828Rent Control, expenditure of Rs.1.31 lakh was incurred without the provision having been made in the original estimates/ supplementary demands.
2.3.10 Parking of funds in Civil Deposit As per Government of India (GOI) guidelines on the Accelerated Rural Water Supply Programme (ARWSP), central assistance provided for concerned/relevant financial year should be utilized within the same year. The Government is required to biannually provide utilisation certificate to certify that the expenditure reported on ARWSP is actual and does not include any unutilized advance nor any unspent amount lying in the Civil deposit.
Further, rule 284 of MP Treasury Code stipulates that no money should be drawn from the treasury unless it is required for immediate disbursement.
The EngineerinChief (EinC), Public Health Engineering (PHE) in violation of all codal provisions and the GOI instructions, issued (28 th March 2008) directives to the field offices not to surrender the unspent ARWSP funds of 200708 if funds were not completely utilised on the programme. He also directed that the balance funds be remitted into the Personal Deposit Account (PD) of the Madhya Pradesh Laghu Udyog Nigam (MPLUN) Bhopal so that the supply of material may be received in the subsequent years. In compliance with the instructions of the EinC, the Executive Engineers (EEs) of 43 Divisions withdrew funds amounting to Rs 111.39 4 crore and remitted the same to PD account of MPLUN through Major head 8448Civil Deposit120 Other Deposits. In the Divisional accounts the expenditure was exhibited as final expenditure under Major Heads ‘2215 and 4215Water Supply and SanitationCentrally sponsored schemes. Out of the advance payment of Rs 111.39 crore, material worth Rs 59.99 crore only was supplied by MPLUN upto March 2008 and bills for supply of material of Rs 7.09 crore were pending. The particulars of payment made to the suppliers by MPLUN through its deposit accounts were not available on record. As of May 2008, there was an unspent balance of Rs 44.31 crore lying with the MPLUN. On this being pointed out, the EEs stated that they followed the orders of the department. The EinC while admitting the facts stated (May 2008) that MPLUN is the state agency for supply of material and in order to enforce timely supply of material for drinking water supply schemes, advance payment was made in view of their request. The reply is not acceptable because by
4 Rs 60 crore on 13 th November 2007 and balance on 31 st March 2008

Audit Report (Civil) for the year ended 31 March 2008
44
camouflaging advance payments as final expenditure, GOI guidelines for essential utilisation of funds in the same year were clearly violated.
The matter was reported to Government (April 2008) and the reply has not been received (November 2008).
2.3.11 Noncredit of lapsed deposit of Rs.3.40 crore to Government Account
Subsidiary rule 562 of Madhya Pradesh Treasury Code Vol. I provides that all the balances of deposit remaining unclaimed for more than three complete account years shall, after the close of March in each year, be credited to the Government Account through transfer entries in Accountant General (A&E) office. A list of lapsed deposits and balances must be submitted by the Treasury Officers in FORM MPTC71 to the Accountant General immediately after 31 st March.
Test check of the records (January2007 to June2007 and February2008) of three treasuries and thirteen subtreasuries revealed that a sum of deposit amount of Rs.3.40 crore pertaining to the period 197980 to 200405 was remained unclaimed for more than three complete account years but the details in FORM MPTC71 were not submitted to the Accountant General for credit to the Government Account as per provisions of the above Rule. Treasury wise and year wise breakup of unclaimed deposit amounts are given in the Appendix 2.10.
The matter was referred to Government (December 2007); reply had not been received (September2008)
2.4 Unreconciled expenditure
Departmental Controlling Officers are required to reconcile periodically the departmental figures of expenditure with those booked by the Accountant General (A&E). The reconciliation of expenditure of Rs.2534.78 crore in respect of 11 major heads involving 13 grants, representing 7.02 per cent of the total expenditure during the year, had however, remained unreconciled in several departments. Details are given in Appendix2.11.
2.5 Defective sanctions for reappropriations/surrenders
As per instructions (November 2006) of the State Government and financial rules, (i) all sanctions for reappropriations / surrenders should be issued before the end of the financial year and should be received in Accountant General (A&E) office well in time for incorporation in the Accounts, (ii) proper details of schemes should be furnished and (iii) Provision in concerned heads should be available from which surrenders/ reappropriations are sanctioned etc. Audit observed that Rs.68.26 crore were reappropriated/ surrendered during the year

Chapter II Allocative Priorities and Appropriation
45
in violation of these instructions. However, these were not accepted by the Accountant General (A&E) for inclusion in accounts. Details are given in Appendix2.12.
2.6 Rush of expenditure
The financial rules require that Government expenditure should be evenly distributed throughout the year. The rush of expenditure particularly in the closing months of the financial year is regarded as financial impropriety. The position in respect of expenditure for the four quarters and also for the month of March 2008 is depicted in Appendix2.13 which shows that the expenditure incurred in March 2008 in 20 cases ranged between 31 and 84 per cent of the total expenditure during the year indicating a tendency to utilize the budget at the close of the financial year.
2.7 Budgetary Control
A review of budgetary procedure and control over expenditure and test check of records pertaining to ten grants 5 revealed the following:
2.7.1 Non maintenance of Expenditure Control Registers
For the purpose of effective control and monitoring over expenditure, a register is required to be maintained by Grants controlling officers and the subordinate offices are required to send the monthly expenditure statement regularly to the controlling officer. The Figures of expenditure so received are to be posted in the Expenditure Control Register and progressive total thereof worked out monthbymonth by the controlling officer to enable him to update the position of expenditure.
Test check of records of ten grants 5 revealed that neither Expenditure Control Registers were maintained in any of the controlling offices nor Monthly Expenditure Statements were sent regularly by subordinate offices. This indicated absence of proper control and monitoring of expenditure which led to (a) heavy excesses/ large savings over the provisions under certain subheads, and (b) inadequate/unnecessary/ excessive supplementary provisions. The Controlling officers of Grant nos. 22 and 67 stated in their reply that all the monthly expenditure control is managed by computer and all the records related to budget are available in computer.
5 08Land Revenue and District Administration (Revenue voted), 16Fishries (Revenue Voted), 20Public Health Engineering (Revenue Voted), 22Urban Administration and Development (Revenue and Capital Voted), 25Mineral Resources (Revenue Voted), 30Rural Development Department (Revenue Voted), 40Expenditure Pertaining to Water Resources DepartmentCommand Area Development (Capital Voted), 67Public WorksBuildings (Revenue Voted),71Biodiversity and BioTechnology Department (Revenue Voted),72Gas Tragedy Relief and Rehabilitation (Revenue and Capital Voted)
Audit Report (Civil) for the year ended 31 March 2008
46
2.7.2 Defective preparation of budget estimates
The procedure followed in testchecked grants 5 and the Appropriation Accounts, 200708 revealed that demands for budget estimates were prepared on adhoc basis. The poor quality of budget preparation and budgetary operations led to:
(i) Excessive provisions totaling to Rs147.04 crore ranging between Rs.1.00 crore and Rs.65.20 crore in nine grants (8, 16, 20, 22, 25, 30, 67, 71 and 72) under Revenue voted section. In Capital voted section also, excessive provisions totaling to Rs.7.96 crore ranged from Rs.0.50 crore to Rs.6.05 crore in three grants (22 , 40 and 72).
(ii) Substantial savings of Rupees two crore or more and also more than 20 per cent of the provision in each case aggregating to Rs.111.65 crore under 13 schemes of test checked grants during 200708 (in eight schemes persistent saving had occurred) as per details given in Appendix2.14. Under 13 schemes, substantial excesses of more than Rupees one crore in each case, totaling Rs.87.12 crore during 200708 (in six schemes persistent excess had occurred) were noticed as per details given in Appendix2.15.
2.7.3 Unnecessary/ excessive/inadequate supplementary provisions under schemes of selected grants.
In seven schemes of testchecked grants, supplementary provisions totaling Rs.17.48 crore remained unutilized and proved unnecessary and in nine schemes supplementary provisions were excessive by Rs.21.33 crore. In four other schemes, supplementary provisions were inadequate in view of excess of Rs. 54 crore. Details are given in Appendix2.16.
2.7.4 Parking of Funds under Civil Deposit and Bank Account
Financial Rules prohibit drawal of money from treasury unless required for immediate disbursement. Test check of records and Appropriation Account 200708 revealed that money was drawn and credited to Civil Deposit, Bank Account after exhibiting as final expenditure in accounts to avoid lapse of budget provisions. Details are given below:
(i) A sum of Rs. 3.29 crore was drawn under the Scheme 20291030801 Central Sector Scheme Normal5917Extension of Computerization Scheme of Land Records in grant no. 8 and credited to Major head 8443Civil Deposit 800Other Deposit on 31 st March 2008.
(ii) During 200708, a sum of Rs. 245.23 crore was drawn under the Schemes 6 pertaining to Development of Basic facilities in Municipal
6 22170580012017905 (Rs.3.21 crore), 42176005112017905(Rs.15.41 crore), 62176080012017905 (Rs.191.15 crore), 42170105112017986 (Rs.3.50 crore), 62170180012017986 (Rs.31.96 crore).

Chapter II Allocative Priorities and Appropriation
47
Corporations in Grant No.22 and credited to 8443Civil Deposit106Personal Deposit Account under M P Urban (ADB) Project (Urban Water Supply and Environment Improvement Project). Balance of Rs.20.38 crore as on 31.3.2008 was still lying in the aforesaid P.D. Account. In addition, Rs.11.34 crore relating to Schemes 2217/4217/62177986/7905 (Rs.10.18 crore) and 2217 7321Urban Services Programme for poor people (Rs.1.16 crore) were also lying in Bank Account as on 31.3.2008.
(iii) An amount of Rs.7.61 7 crore was drawn during 19 th to 31 st March 2008 by various DDOs under Major Heads 2225,2801,2525 and 2235 in Grant nos. 15,41,52,64 and 80 and deposited to 8443Civil Deposit106Personal Deposit.
2.7.5 Nonreconciliation of expenditure under selected grants
In order to enable the controlling officer to ascertain exact and updated position of expenditure, the figures of expenditure in Departmental records should be reconciled with those shown in the records of the Accountant General (A&E)I, Madhya Pradesh. Test check revealed that reconciliation of Departmental expenditure figures for the year 200708 was not carried out with the figures of Accountant General (A&E)I by any of the Controlling officer of grant no. 8, 16, 20, 30, 40, 67 and 72 resulting in ineffective control over expenditure. The controlling officers accepted the fact.
2.7.6 Nonreceipt of Utilization Certificates A sum of Rs. 6.51 crore was transferred (September 2007, March 2008) to Municipal Corporations 8 from the Scheme 22170580012017321Urban Services Programme for Poor under Grant No. 22 by the Project Director, Madhya Pradesh Urban Services for Poor people, but the Utilization Certificates were not received by the Department (June 2008). The Department accepted the facts and stated that Utilisation Certificates are being called for from the concerned Municipal Corporations.
2.7.7 Rush of expenditure in March under schemes of selected grants. Regular flow of expenditure throughout the year is the primary requirement of budgetary control. In 37 Schemes, the expenditure ranging from 42 percent to 100 percent totaling to Rs.391.54 crore was incurred during March2008 which indicate poor financial control. Details are given in Appendix2.17.
7 Shivpuri Treasury: Rs.0.75 crore (Major Heads 2225 (Rs.0.53 crore), 2801 (Rs.0.22 crore), Betul Treasury: Rs.6.65 crore (Major Heads 2225 (Rs.5.93 crore),2235 (Rs. 0.25 crore) and 2525 (Rs.0.68 crore)
8 Bhopal (Rs. 1.44 crore), Indore (Rs. 1.50 crore), Jabalpur (Rs. 1.69 crore) and Gwalior (Rs. 1.88 crore) .

Chapter III Performance Reviews
49
CHAPTER III Performance Audit
This Chapter contains performance audits on Implementation of Watershed Development Programmes, National Programme of Nutritional Support to Primary Education (Mid Day Meal), Infrastructure Development under Tribal SubPlan and one long paragraph on Irrigation facilities in Narmada Tapti Basin.
Panchayat and Rural Development Department
3.1 Implementation of Watershed Development Programmes
Highlights
Watershed Development programmes aimed to achieve sustained growth in agriculture productivity through prevention of drought and soil degradation and by bringing about improvement in soil fertility were started in 1996. The success in these initiatives was expected to improve living conditions among people dependent on agriculture and allied activities.
The performance review indicated partial success in works of water conservation. However the achievement in activities like afforestation, pasture development etc. were significantly below the target.
The districts taken up as sample for scrutiny revealed that only 65 per cent of the total projected output was achieved. The various components of the programme were not sequenced properly, leading to nonoptimisation of benefit. Impact of the activities under the programme was not assessed to determine the extent of change in socioeconomic environment and need for mid course correction. Further major audit findings noticed in implementing the programmes are as follows:
Expenditure of Rs.24.75 crore was incurred by Watershed Committees in excess of cost norms fixed .
(Paragraph 3.1.6.3) Expenditure of Rs.76.38 crore was incurred on six watershed projects under Integrated Wasteland Development Programme (IWDP) and 292 watershed projects under Drought Prone Area Programme (DPAP) where agriculture land was over 70 per cent .
(Paragraph 3.1.7.4)
Audit Report (Civil) for the year ended 31 March 2008
50
Avoidable expenditure of Rs.21.84 crore was incurred on villages which had already been treated by the Agriculture Department or were under command areas of earlier Irrigation Projects.
(Paragraphs 3.1.7.5 and 3.1.7.6) Zila Panchayats failed to achieve the assigned targets despite time and cost over runs. As of March 2008 only 213 of the 986 scheduled watershed projects were completed.
(Paragraph 3.1.8.1) In five districts Rs.8.32 crore out of funds meant for afforestation, pasture development, training/community organisation, etc. was diverted for water conservation works.
(Paragraph 3.1.8.3) Rupees 1.60 crore was irregularly deducted from the wages of labourers for funding Watershed Development Fund Accounts.
(Paragraph 3.1.8.4) Developmental works were executed by Watershed Committees in Rewa and Shivpuri district at a cost of Rs.29.04 crore without employing labourers. Similarly payment of Rs.5.08 crore was made on works without recording detailed measurement in Measurement Book.
(Paragraph 3.1.8.5 and 3.1.8.7)
3.1.1 Introduction
In order to overcome the problems of drought, land degradation and to improve the socioeconomic condition of economically weaker sections, Watershed 1 Development Projects were taken up in the State under the Centrally Sponsored Schemes “Drought Prone Area Programme” (DPAP) for nonarable lands since 1987 and “Integrated Wasteland Development Programme” (IWDP) for developing wastelands since 1989. The primary objectives of both programmes interalia included conservation of soil, water and other natural resources through watershed development programmes with the help of low cost and locally accessible technologies such as insitu soil and moisture conservation measures, afforestation, pasture development etc.
3.1.2 Organisational setup
The Principal Secretary/Development Commissioner, Panchayat and Rural Development Department is the overall incharge for implementation of watershed development programmes at Government level. Rajiv Gandhi
1 Watershed is a geohydrological unit or an area that drains at common point.

Chapter III Performance Reviews
51
Watershed Management Mission (RGWMM) established in August 1994 under the Panchayat and Rural Development Department is headed by a Director, who is competent to sanction new watershed projects, monitoring progress and supervision.
At the district level these programmes are being implemented by the Chief Executive Officer (CEO) under the leadership of the Collector, through the Project Implementing Agencies 2 (PIAs) headed by Project Officers (POs) at block level. Each PIA supervises one or more microwatershed projects 3 .
At village level the programmes are executed through Watershed Committees 4 (WCs) in association with Self Help Groups 5 (SHGs) and User Groups 6 (UGs).
3.1.3 Objectives of Audit
Audit objectives were to assess whether:
Ø the watershed projects were selected as per prescribed criteria and approved guidelines of the programmes;
Ø the action plans of watershed projects were prepared according to guidelines;
Ø financial management, implementation of programme components, supervision and monitoring mechanism were effective.
3.1.4 Audit Criteria
Audit conclusion were benchmarked against the following criteria:
Ø DPAP Manual and Guidelines issued by the Ministry of Rural Development, Land Resources Department, Government of India.
2 PIA: Team of members from Government Department and voluntary organization which work on the project.
3 One microwatershed project comprises of approximately 500 hectare and one milli watershed comprises of ten microwatersheds.
4 Nominated 1012 members from UG (45), SHG (34), Gram Panchayat (23) and members of WDT (Multidisciplines from Agriculture, Engineering, Horticulture, Sociology etc.)
5 SHG: Homogenous groups having common identity such as agriculture labourers, women, shepherds, SCs/STs etc.
6 UG: Identified Groups of most affected people, either beneficially or adversely.

Audit Report (Civil) for the year ended 31 March 2008
52
Ø Circulars and orders issued by Government of Madhya Pradesh, Panchayat and Rural Development Department regarding watershed development projects.
Ø Detailed Project Reports of each watershed project and records pertaining to its execution.
3.1.5 Audit Scope and Methodology
The implementation of the Watershed Development Porgrammes during the period 200308, was reviewed through a test check (AprilOctober 2008) of the records maintained by the Director RGWMM and twelve 7 out of 48 CEOs, Zila Panchayats. Information was also collected from other line departments. Out of 2394 DPAP and 124 IWDP watershed projects in the State, 1638 DPAP and 18 IWDP watershed projects were checked involving an expenditure of Rs.339.89 crore (55 per cent) out of the total expenditure of Rs.616.88 crore.
The districts were selected on the basis of number of DPAP blocks, number of watershed projects sanctioned in DPAP/IWDP watershed programmes and allocation of funds received from GOI/State Government on a random sampling basis.
An entry conference was held in May 2008 with Director RGWMM where the audit objectives, criteria etc were explained. Audit findings and recommendations of audit were discussed with Principal Secretary to Government of Madhya Pradesh, Panchayat and Rural Development Department in an exit conference held in November 2008. Views of the Government were considered while finalising the review report. Results of testcheck are embodied in the succeeding paragraphs.
Audit Findings
3.1.6 Financial Management
Both the programmes are Centrally Sponsored on cost sharing basis between the Government of India (GOI) and State Government in the ratio 3:1 (DPAP) and 11:1 (IWDP). GOI and State Government release their shares to Zila Panchayats (ZPs). ZPs in turn release funds to PIAs and WCs through account payees cheques, which are deposited in the respective bank accounts. Eighty per cent of funds upto March 2003 and thereafter eighty five per cent of funds are earmarked for development works by WCs. Five per cent funds were earmarked each for training and community organization upto March
7 Badwani, Betul, Chhindwara, Damoh, Dhar, Jhabua, Khandwa, Khargone, Rewa, Shajapur, Shivpuri and Sidhi

Chapter III Performance Reviews
53
2003. Thereafter, only five per cent funds for both the components are transferred to PIAs. Administrative expenses (10 per cent ) are shared in equal ratio between PIAs and WCs. WCs, PIAs and ZPs prepare their annual accounts duly audited by Chartered Accountant (CA). WCs and PIAs submit monthly report on physical and financial progress to ZPs. ZPs submit their annual accounts alongwith utilization certificates (UCs) to GOI. Watershed projects were sanctioned in batches by the GOI every year and funds were received accordingly. The funds were also earmarked against each batch and expenditure was to be watched there against. As per GOI instructions the saving of one batch could not be utilised in other batches.
Programmewise and yearwise breakup of amounts released by GOI, State Government and expenditure incurred during 20032008 in the State is as under:
Table No. 3.1: Financial outlays and expenditure (Rupees in crore)
Total Release Name of Programme
Year Opening Balance Central
share State share
Other receipt
Total funds available
Expenditure Balance with per cent age
200304 18.48 50.22 21.97 0.15 90.82 69.60 21.22 (23) 200405 21.22 52.88 16.72 0.11 90.93 62.58 28.35 (31) 200506 28.35 53.28 19.25 0.19 101.07 69.85 31.22 (31) 200607 31.22 80.36 29.67 0.13 141.38 101.55 39.83 (28) 200708 39.83 56.57 16.12 0.18 112.70 81.58 31.12 (28)
DPAP
Total 293.31 103.73 0.76 385.16 200304 9.92 25.58 2.41 0.06 37.97 28.07 9.90(26) 200405 9.90 29.79 2.46 0.08 42.23 25.27 16.96 (40) 200506 16.96 44.65 3.44 0.10 65.15 47.95 17.20 (26) 200607 17.20 78.54 5.75 0.06 101.55 68.53 33.02 (33) 200708 33.02 56.33 5.05 0.16 94.56 61.90 32.66 (35) Total 234.89 19.11 0.46 231.72
IWDP
G.T.s 528.20 122.84 1.22 616.88
Source: Data furnished by Director RGWMM
There were significant savings at the end of the year which was attributed by the department to delayed release of funds by GOI. No visible efforts had however been made by RGWMM to take up the matter for early release of funds with the GOI.
3.1.6.1 Release of funds
As envisaged in the guidelines, funds were required to be released by ZP to PIA and WC within 15 days from the date of its receipt.
In 11 out of 12 Zila panchayats checked it was noticed that Rs.57.60 8 crore out of Rs.339.89 crore was released after significant delays ranging from two to 27
8 (Barwani Rs.5.29 crore, Betul Rs.8.79 crore, Chhindwara Rs.5.54 crore, Damoh Rs.2.44 crore, Dhar Rs.8.36 crore, Jhabua Rs.9.66 crore, Khandwa Rs.2.61 crore, Khargone Rs.4.99 crore, Rewa Rs.1.30 crore, Shivpuri Rs.2.19 crore and Sidhi Rs.6.43 crore)
Extent of delay in release of funds to WCs by ZPs was between 2 to 27 months.

Audit Report (Civil) for the year ended 31 March 2008
54
months during 200308. The delay in release of funds was assigned to non formation of WCs, nonreceipt of demand from WCs and frequent changes of staff at ZPs level. The delay in release of funds to WCs led to delayed completion of watershed projects. In the exit conference department intimated that ebanking system to expedite release of funds is being introduced.
3.1.6.2 Diversion of earmarked components funds
According to the guidelines, expenditure under project components shall be limited to the percentage ceilings fixed for each component. Any amount remaining unutilized from earmarked components shall be duly refunded to ZP by the PIA and WC.
Contrary to these provisions, savings of Rs.2.08 9 crore out of funds earmarked for administration, training and community organization components was used by PIAs and WCs on Development works components in excess of ceiling fixed for that component without approval of ZPs and Mission Leaders as detailed below:
(Rupees in crore) DPAP5 th , 6 th & 7 th Batch IWDP (PhaseI) Name of component with
per cent age breakup Expenditure ceiling as per norms
Expenditure actually incurred
Excess (+) Saving ()
Expenditure ceiling as per norms
Expenditure actually incurred
Excess (+) Saving ()
Administrative cost (10 per cent )
3.10 2.81 0.29 0.80 0.80
Training (5 Per cent ) 1.55 0.69 0.86 0.40 0.27 0.13 Community organization (5 per cent )
1.55 0.75 0.80 0.40 0.40
Development works (80 per cent )
24.80 26.75 +1.95 6.40 6.53 +0.13
Total 31.00 31.00 8.00 8.00
The CEO, ZPs Jhabua and Khargone intimated that the unspent amount of components was utilized as per relaxation given in the State Government order (March 2002). Replies do not correctly interpret the said order. As per the provisions such amounts could be used to cover special cases only (viz. in such micro watersheds where funds was not provided as per project cost) and were not meant to cover routine cases.
3.1.6.3 Adherence to cost norms
As per guidelines overall cost norms 10 fixed for treatment of land per hectare was to be adhered to. Scrutiny of progress reports (March2008) of checked
9 (Dhar Rs.0.05 crore, Jhabua Rs.0.56 crore, Khargone Rs.1.39 crore and Shivpuri Rs.0.08 crore)
10 Rs.4000 per hectare in DPAP 5 th Batch, IWDPIst and Rs.6000 per hectare in other batches
Expenditure of Rs.2.08 crore was incurred in excess of norms on work component without authorization.
Expenditure of Rs.24.75 crore was incurred in excess of cost norms.
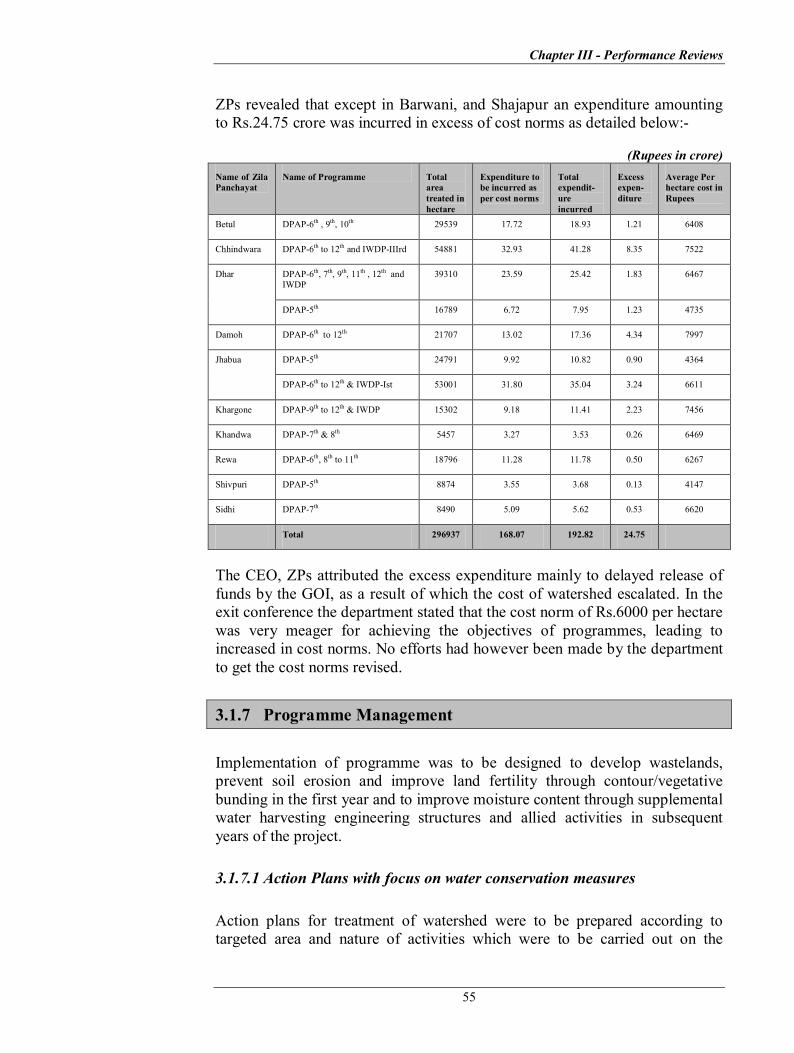
Chapter III Performance Reviews
55
ZPs revealed that except in Barwani, and Shajapur an expenditure amounting to Rs.24.75 crore was incurred in excess of cost norms as detailed below:
(Rupees in crore) Name of Zila Panchayat
Name of Programme Total area treated in hectare
Expenditure to be incurred as per cost norms
Total expendit ure incurred
Excess expen diture
Average Per hectare cost in Rupees
Betul DPAP6 th , 9 th , 10 th 29539 17.72 18.93 1.21 6408
Chhindwara DPAP6 th to 12 th and IWDPIIIrd 54881 32.93 41.28 8.35 7522
DPAP6 th , 7 th , 9 th , 11 th , 12 th and IWDP
39310 23.59 25.42 1.83 6467 Dhar
DPAP5 th 16789 6.72 7.95 1.23 4735
Damoh DPAP6 th to 12 th 21707 13.02 17.36 4.34 7997
DPAP5 th 24791 9.92 10.82 0.90 4364 Jhabua
DPAP6 th to 12 th & IWDPIst 53001 31.80 35.04 3.24 6611
Khargone DPAP9 th to 12 th & IWDP 15302 9.18 11.41 2.23 7456
Khandwa DPAP7 th & 8 th 5457 3.27 3.53 0.26 6469
Rewa DPAP6 th , 8 th to 11 th 18796 11.28 11.78 0.50 6267
Shivpuri DPAP5 th 8874 3.55 3.68 0.13 4147
Sidhi DPAP7 th 8490 5.09 5.62 0.53 6620
Total 296937 168.07 192.82 24.75
The CEO, ZPs attributed the excess expenditure mainly to delayed release of funds by the GOI, as a result of which the cost of watershed escalated. In the exit conference the department stated that the cost norm of Rs.6000 per hectare was very meager for achieving the objectives of programmes, leading to increased in cost norms. No efforts had however been made by the department to get the cost norms revised.
3.1.7 Programme Management
Implementation of programme was to be designed to develop wastelands, prevent soil erosion and improve land fertility through contour/vegetative bunding in the first year and to improve moisture content through supplemental water harvesting engineering structures and allied activities in subsequent years of the project.
3.1.7.1 Action Plans with focus on water conservation measures
Action plans for treatment of watershed were to be prepared according to targeted area and nature of activities which were to be carried out on the

Audit Report (Civil) for the year ended 31 March 2008
56
arable, nonarable land including degraded land, wasteland, government land and community land out of earmarked funds received for work components. The cost of developmental works was to be fixed in sectorwise ceiling limits viz. 30 per cent for soil conservation, 40 per cent for water conservation, 10 per cent for afforestation, 10 per cent for pasture development, 7.5 per cent for other activities and 2.5 per cent for assistance to Self Help Groups.
The action plan for watershed development indicated only the name of work and its cost. It did not link these works to any outcome parameters viz. area to be treated by the work and quantified benefits to the users from each of the individual works planned.
In eight districts 11 high priority was given to water conservation works (more than 60 per cent of funds were allocated against prescribed 40 per cent) by ignoring afforestation, pasture development and other activities, which were also essential in drought proofing the areas.
The CEO, ZPs intimated that due to nonavailability of land, less priority were given to these activities. Replies of CEO, ZPs indicated that selection of villages were made without conducting a benchmark survey.
In the exit conference the department stated that deviation was permitted in special circumstances. This reply is not acceptable as GOI guidelines restricted the deviation upto five per cent only.
3.1.7.2 Selection of Watershed Projects
The main criteria for selection of watershed projects was preponderance of wastelands, common lands, acute shortage of drinking water and prevalent poor wage rate (lower than the minimum wages). Scrutiny showed that in many projects these criteria and size norms were not followed as described in the succeeding paragraphs.
3.1.7.3 Size of microwatershed
Scrutiny of action plan of watershed projects in testchecked districts revealed that except in Betul and Damoh the size of 94 microwatersheds was overstated in reports submitted for release of funds to GOI visàvis that in the action plans. The variation in size of microwatersheds testchecked by audit were as under:
11 Betul, Dhar, Damoh, Khargone, Khandwa, Rewa, Shajapur and Sidhi
Action plans prepared by ZPs gave indicated priority to water conservation works leaving areas like afforestation and pasture development unaddressed.
Area of 94 micro watersheds was over reported to GOI.
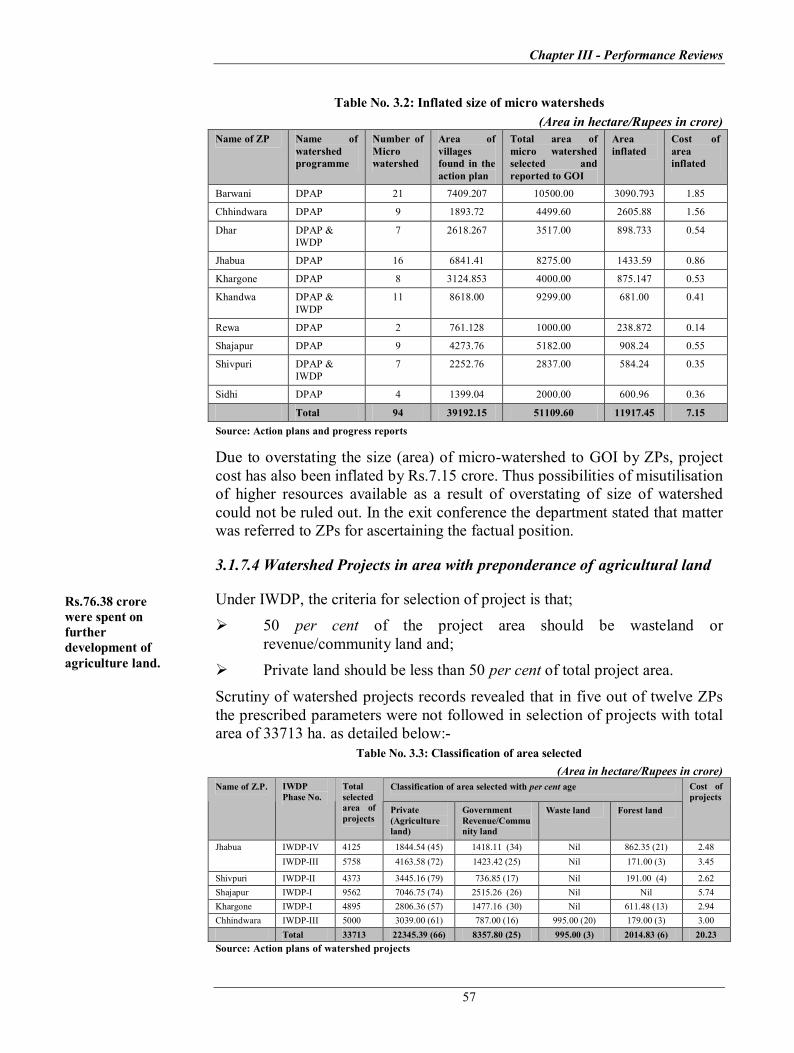
Chapter III Performance Reviews
57
Table No. 3.2: Inflated size of micro watersheds (Area in hectare/Rupees in crore)
Name of ZP Name of watershed programme
Number of Micro watershed
Area of villages found in the action plan
Total area of micro watershed selected and reported to GOI
Area inflated
Cost of area inflated
Barwani DPAP 21 7409.207 10500.00 3090.793 1.85
Chhindwara DPAP 9 1893.72 4499.60 2605.88 1.56
Dhar DPAP & IWDP
7 2618.267 3517.00 898.733 0.54
Jhabua DPAP 16 6841.41 8275.00 1433.59 0.86
Khargone DPAP 8 3124.853 4000.00 875.147 0.53
Khandwa DPAP & IWDP
11 8618.00 9299.00 681.00 0.41
Rewa DPAP 2 761.128 1000.00 238.872 0.14
Shajapur DPAP 9 4273.76 5182.00 908.24 0.55
Shivpuri DPAP & IWDP
7 2252.76 2837.00 584.24 0.35
Sidhi DPAP 4 1399.04 2000.00 600.96 0.36
Total 94 39192.15 51109.60 11917.45 7.15
Source: Action plans and progress reports
Due to overstating the size (area) of microwatershed to GOI by ZPs, project cost has also been inflated by Rs.7.15 crore. Thus possibilities of misutilisation of higher resources available as a result of overstating of size of watershed could not be ruled out. In the exit conference the department stated that matter was referred to ZPs for ascertaining the factual position.
3.1.7.4 Watershed Projects in area with preponderance of agricultural land
Under IWDP, the criteria for selection of project is that; Ø 50 per cent of the project area should be wasteland or
revenue/community land and; Ø Private land should be less than 50 per cent of total project area. Scrutiny of watershed projects records revealed that in five out of twelve ZPs the prescribed parameters were not followed in selection of projects with total area of 33713 ha. as detailed below:
Table No. 3.3: Classification of area selected (Area in hectare/Rupees in crore)
Classification of area selected with per cent age Name of Z.P. IWDP Phase No.
Total selected area of projects
Private (Agriculture land)
Government Revenue/Commu nity land
Waste land Forest land
Cost of projects
IWDPIV 4125 1844.54 (45) 1418.11 (34) Nil 862.35 (21) 2.48 Jhabua IWDPIII 5758 4163.58 (72) 1423.42 (25) Nil 171.00 (3) 3.45
Shivpuri IWDPII 4373 3445.16 (79) 736.85 (17) Nil 191.00 (4) 2.62 Shajapur IWDPI 9562 7046.75 (74) 2515.26 (26) Nil Nil 5.74 Khargone IWDPI 4895 2806.36 (57) 1477.16 (30) Nil 611.48 (13) 2.94 Chhindwara IWDPIII 5000 3039.00 (61) 787.00 (16) 995.00 (20) 179.00 (3) 3.00
Total 33713 22345.39 (66) 8357.80 (25) 995.00 (3) 2014.83 (6) 20.23 Source: Action plans of watershed projects
Rs.76.38 crore were spent on further development of agriculture land.

Audit Report (Civil) for the year ended 31 March 2008
58
The ZPs covered 22345.39 ha. area (66 per cent ) of agricultural land by spending Rs.13.41 crore (66 per cent of Rs.20.23 crore) where the treatment was not required.
Similarly, under DPAP 292 micro watershed projects were selected in contravention of guidelines. The ZPs in selected districts covered 104957 ha. of agriculture land (73 to 89 per cent) after spending Rs.62.97 crore (77 per cent) on areas which were not to be covered as per prescribed guidelines as detailed in Appendix 3.1.
The ZPs intimated that selection of watershed project was made on the basis of availability of land and demand of local people. The reply was not acceptable as the norms for selection have been drawn to bring nonarable land to the status of arable land and selection of project areas which were predominantly arable defeated the objective.
3.1.7.5 Overlapping of programmes and reselection of already treated villages
As per guidelines of National Watershed Development Project for Rainfed Areas (NWDPRA) of Ministry of Agriculture, watershed development projects were to be implemented only through DPAP funds in all the declared drought prone blocks and in the remaining blocks watershed projects were to be implemented through either NWDPRA for arable lands or IWDP funds for nonarable lands. It was however, noticed that this territorial delineation was not found to be maintained; as 206 NWDPRA projects were being implemented simultaneously in 75 DPAP blocks or where IWDP watershed programmes were in operation. Similarly 58 IWDP projects were found in operation in 4 DPAP blocks.
Further, those villages, which had already been treated under previous/earlier schemes of watershed development programme like DPAP/NWDPRA/IWDP were not to be taken up for treatment again.
It was however noticed in test check of records of CEO, ZPs that 30 villages, which had already been treated at a cost of Rs.4.53 crore under NWDPRA by Agriculture Department in 8 th ,9 th ,10 th , five years plan (199293 to 200607) were reselected for treatment under DPAP in 6 ZPs at a cost of Rs.8.64 crore as per details in Appendix 3.2. Expenditure of Rs.2.73 crore has been spent on these projects upto March 2008.
Selection of villages was wrong as many villages earlier were also covered by similar programmes. This indicated lack of coordination between ZPs and Agriculture department and nonconducting of survey during Participatory Rural Appraisal exercises by the Project Officers. Thus expenditure of Rs.2.73 crore incurred on the treatment of already treated villages (upto March2008) was avoidable. On this being pointed out, CEO, ZPs stated that no intimation
Avoidable expenditure of Rs.2.73 crore incurred on selection of villages which were already treated by Agriculture department.
Chapter III Performance Reviews
59
of these watershed villages, which were already been treated by Agriculture Department, was received at the time of selection.
3.1.7.6 Selection of microwatershed villages falling under command area of Irrigation Projects
Villages falling within the command area of irrigation projects were not to be selected for treatment under watershed programme. Scrutiny of records of ZPs revealed that ZPs had approved Rs.19.11 crore for 63 microwatersheds, which fell under the command area of irrigation projects Appendix 3.3.
3.1.8 Programme Implementation
3.1.8.1 Physical Achievements
As per guidelines, the targeted areas were to be treated within a period of five years from the date of sanction of project by GOI. Status of watershed projects sanctioned, completed, ongoing and land treated was not made available to audit by Director, RGWMM. Position of achievement of checked ZPs during 200308 was as shown in Appendix 3.4. Following audit points emerged: Ø Out of the total targeted area of 807485 ha., only 524000 ha. area (65
per cent) could be treated up to March 2008 by incurring an expenditure of Rs.339.89 crore. Thus not only was the area treated much less than what was targeted but the treatment cost was also above the norm of Rs.6000 per ha.
Ø The watersheds taken up for development were to be completed within five years but most of the watershed projects could not be completed. 986 12 watersheds projects (550180 13 ha.) were targeted to be completed upto 2008, but only 213 14 projects having an area of 106946 ha. could be completed, 773 watershed projects with total area of 443234 ha., remained incomplete even after time overrun of one to three years.
The CEO, ZPs attributed the shortfall in achievement to nonavailability of funds from GOI. The ZPs could have explored the possibility of approaching GOI to utilize the saving from earlier batches till the receipt of funds for the succeeding batches.
12 Total number of project DAAP 6 th 399,7 th 161, 8 th 219, 9 th 198 IWDPI2, II4, III 1, IV2=986
13 Total area of these batches 199500+80500+109500+99000+19581+24232+7972+ 9895=550180 ha
14 DPAP6 th Betul12 (5882 ha.), Barwani38 (18775 ha.), Dhar45 (19346 ha.), Khargone38 (18916 ha.), Khandwa35 (17500 ha.), Rewa25 (11311 ha.), Shivpuri7 (3488 ha.) DPAP7 th –Barwani12 (5621 ha.) IWDP Shivpuri1 (6107 ha.)=213
Watershed projects costing Rs.19.11 crore was carried out in the command area of Irrigation projects.
Slow progress of works in checked ZPs resulted in 65 per cent achievement of the planned target.
ZPs failed to complete the projects within the period of five years only 213 out of 986 watershed projects completed.
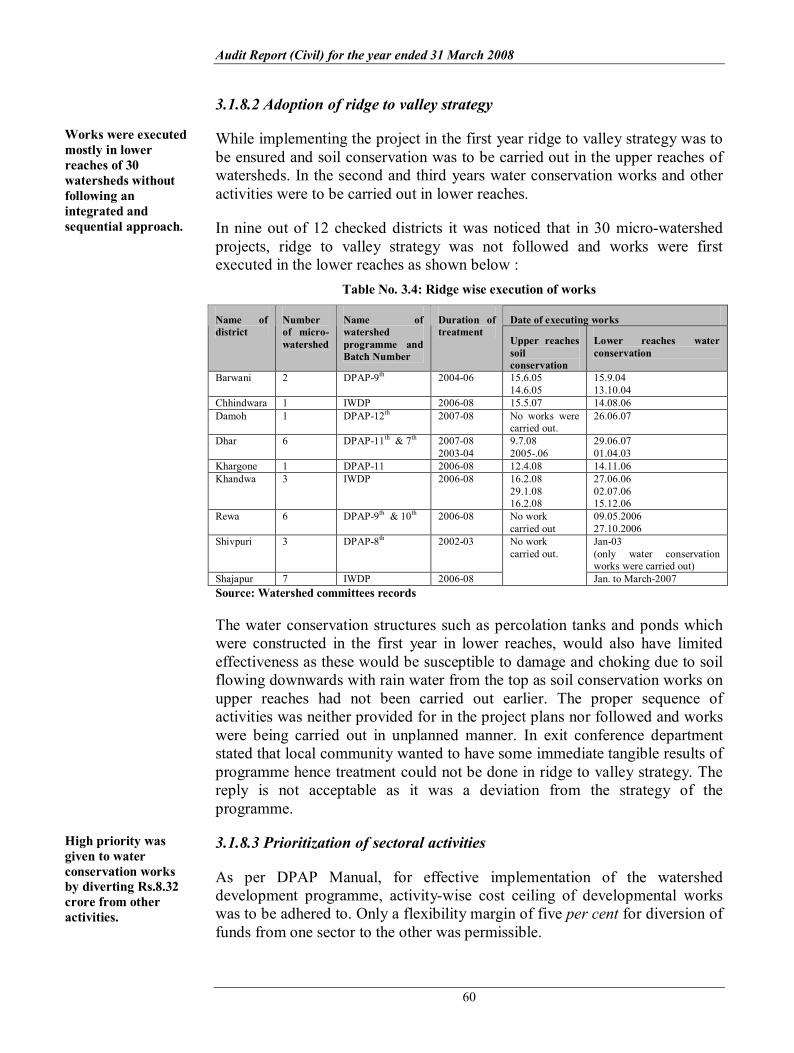
Audit Report (Civil) for the year ended 31 March 2008
60
3.1.8.2 Adoption of ridge to valley strategy
While implementing the project in the first year ridge to valley strategy was to be ensured and soil conservation was to be carried out in the upper reaches of watersheds. In the second and third years water conservation works and other activities were to be carried out in lower reaches.
In nine out of 12 checked districts it was noticed that in 30 microwatershed projects, ridge to valley strategy was not followed and works were first executed in the lower reaches as shown below :
Table No. 3.4: Ridge wise execution of works
Date of executing works Name of district
Number of micro watershed
Name of watershed programme and Batch Number
Duration of treatment
Upper reaches soil conservation
Lower reaches water conservation
Barwani 2 DPAP9 th 200406 15.6.05 14.6.05
15.9.04 13.10.04
Chhindwara 1 IWDP 200608 15.5.07 14.08.06 Damoh 1 DPAP12 th 200708 No works were
carried out. 26.06.07
Dhar 6 DPAP11 th & 7 th 200708 200304
9.7.08 2005.06
29.06.07 01.04.03
Khargone 1 DPAP11 200608 12.4.08 14.11.06 Khandwa 3 IWDP 200608 16.2.08
29.1.08 16.2.08
27.06.06 02.07.06 15.12.06
Rewa 6 DPAP9 th & 10 th 200608 No work carried out
09.05.2006 27.10.2006
Shivpuri 3 DPAP8 th 200203 Jan03 (only water conservation works were carried out)
Shajapur 7 IWDP 200608
No work carried out.
Jan. to March2007 Source: Watershed committees records
The water conservation structures such as percolation tanks and ponds which were constructed in the first year in lower reaches, would also have limited effectiveness as these would be susceptible to damage and choking due to soil flowing downwards with rain water from the top as soil conservation works on upper reaches had not been carried out earlier. The proper sequence of activities was neither provided for in the project plans nor followed and works were being carried out in unplanned manner. In exit conference department stated that local community wanted to have some immediate tangible results of programme hence treatment could not be done in ridge to valley strategy. The reply is not acceptable as it was a deviation from the strategy of the programme.
3.1.8.3 Prioritization of sectoral activities
As per DPAP Manual, for effective implementation of the watershed development programme, activitywise cost ceiling of developmental works was to be adhered to. Only a flexibility margin of five per cent for diversion of funds from one sector to the other was permissible.
Works were executed mostly in lower reaches of 30 watersheds without following an integrated and sequential approach.
High priority was given to water conservation works by diverting Rs.8.32 crore from other activities.

Chapter III Performance Reviews
61
Scrutiny of final progress reports of completed watershed projects of DPAP6 th Batch in five 15 districts revealed that activity wise cost ceiling for development works was not adhered to as detailed below:
Table No. 3.5: Sector wise expenditure (Rupees in crore)
Sl No.
Activities with per cent age Expenditure as per norms
Actual expenditure
Per cent Excess/less over cost ceiling
1. Soil Conservation (30 per cent ) 8.74 7.98 27 0.76
2. Water Conservation (40 per cent ) 11.66 19.98 16
(18.59 +1.39)
64 +8.32
(6.93+ 1.39)
3. Afforestation (10 per cent ) 2.91 1.28 4 1.63
4. Pasture Development (10 per cent ) 2.91 0.59 2 2.32
5. Other Activities (7.5 per cent )
6. Self Help Group (2.5 per cent )
2.91 0.69 3 2.22
Total 29.13 30.52 100
Source: Watershed committees records
From the above table following points emerged: Ø Maximum expenditure of Rs.19.98 crore was incurred on water
conservation works i.e. construction of percolation tank, farm pond, dabri and deepening of ponds etc. (against the ceiling limit of Rs.11.66 crore) by diverting Rs.8.32 crore meant for afforestation, pasture development, training/community organization and SHG’s activities.
Ø The afforestation programme aimed at increasing productivity of degraded land and providing fuel and fodder to the local people, an expenditure of Rs.1.28 crore (four per cent ) was incurred against the provision of Rs.2.91 crore, this was 50 per cent below the prescribed cost ceiling.
Ø Only two per cent of project cost was spent on Pasture development against 10 per cent as required under the programme. Pasture development which was essential for providing fodder as well as preventing soil erosion was thus given least priority.
Ø Other income generating activities of SHGs were marginally covered in the district. Formation of SHGs and Women Thrift and credit groups, their training, linking them with credit institutions and facilitating them to start income generating activities were not given due attention.
15 Betul, Dhar, Khargone, Rewa & Shivpuri 16 Rs.1.39 crore was incurred out of savings of training & community organization
components.

Audit Report (Civil) for the year ended 31 March 2008
62
The CEO, ZP Shivpuri stated that POs will be instructed to execute the treatment works as per action plan. CEO, ZPs Khargone and Dhar stated that there was nonavailability of lands in microwatersheds area for afforestation and pasture development works, hence high priority was given to water conservation works. CEOs of ZPs Betul and Rewa intimated that thrust on water conservation works were given as per policy of Pani Roko Abhiyan.
Thus due to nonperformance of all the sectoral activities, the programmes lacked synergy in action, and also failed to improve areas like income generation and participative management.
3.1.8.4 Execution of works through muster rolls
As per DPAP Manual all works under programme were to be executed by employing local labourers through muster rolls so that full benefit of wage employment could reach labourers. However, it was observed that payment of Rs.29.04 crore (in Rewa Rs.0.16 crore and in Shivpuri Rs.28.88 crore) for developmental works of the programme were made on subvouchers to Secretary of WCs instead of labourers through muster rolls of works. In the absence of muster rolls the possibilities of the works getting executed through contractor and mechanical means could not be ruled out. On this being pointed out, CEOs of ZPs, Rewa and Shivpuri stated that in future, works would be carried out on muster rolls. In exit conference department assured to initiate an early action in this regard.
3.1.8.5 Closure of watershed project without treating the entire targeted area
In DPAP, projects were sanctioned by GOI to ensure drought proofing of the entire drought prone areas on watershed basis. Scrutiny of final progress reports of 122 completed watershed projects revealed that projects were closed without treating the entire targeted area sanctioned by the GOI. Details are as under:
Table No. 3.6: Incomplete projects closed (Area in hectare and Rupees in crore)
Name of ZP
Name of program me & Batch No.
Year of sanction
No. of sanctioned projects
Targe ted Area
Funds recei ved
Treated Area
Area left without treatment
Expen diture
Amount
Refunded to Director RGWMM
Dhar DPAP5
DPAP6
199596
200001
39
45
19578
22500
8.07
13.69
16789
19346
2789
3154
7.95
12.77
0.12
0.92
Khargone DPAP6 200001 38 19000 11.49 18916 84 11.05 0.44
TOTAL 122 61078 33.25 55051 6027 31.77 1.48
Source: Progress reports
Despite provision of funds by GOI, the projects were closed without treating 6027 hectare area and an unspent balance of Rs.1.48 core was refunded to Director, RGWMM. CEO, ZPs did not intimate the reasons but stated that
Works costing Rs.29.04 crore were got executed without employing labourers.
Incomplete watershed projects closed despite availability of funds.

Chapter III Performance Reviews
63
remaining area of each microwatershed will be treated by other ongoing schemes i.e. NREGS in near future.
3.1.8.6 Execution of works without recording detailed measurement As per guidelines all works executed should be measured and details of measurements recorded in the Measurement Book (MB) which would form the basis of payments.
Scrutiny of records of WCs of ZP Rewa revealed that construction works were executed under soil and water conservation and plantation work valued at Rs.5.08 crore as of March 2008 through muster rolls but the progress/measurement of all works were not found to be recorded in PartII of muster rolls/MB as prescribed. Consequently in the absence of recorded measurement of works, actual execution of works as per requirement and specification as well as correctness of payment could not be ascertained in audit. On being pointed out CEO, ZP accepted the audit observation and stated that instructions are being issued to all WCs in this regard.
3.1.9 Verification of Treated Areas through Land Revenue Records
The objective of improving the economic conditions of weaker sections through watershed development alone was not assessable as this depended on diverse socioeconomic factors and watershed programmes could at best play a limited role. As far as drought prevention was concerned, it was observed that 1656 watershed projects were undertaken in 85 drought affected blocks during 200308 in the twelve checked districts. These blocks also include villages where watershed treatment works are being carried out over long periods (199596).
Thus, 1656 watershed projects (924885 ha.) in 85 blocks of twelve districts were executed during 200308 for drought proofing/prevention of which 524000 ha. area (65 per cent ) of the targeted area was treated as of March 2008. The status of the land in the testchecked blocks in the districts was assessed for pre and post classification status in 2000 and 2007. This revealed that the sown area was 2138925 ha. in 200607 against 2154015 ha. in 1999 2000 showing a decline by 15090 ha. Similarly the area of barren land and nonagriculture land showed an increase from 505782 ha. to 597349 ha. during the same period. District wise details are shown in Appendix 3.5. Thus the claims made by the ZPs of achieving 524000 ha. land treatment was not supported by the records of Superintendent, Land Records Department. The audit scrutiny identified the reasons as nonselection of appropriate project areas, nonexecution of project plans as per prescribed sequence, less emphasis on afforestation and pasture development programmes, absence of efforts to develop skills of the community development and nonmaintenance of assets by ZPs.
In the exit conference the department stated that instructions to CEO, ZPs have been issued to get the changed status of land incorporated in to land revenue
Payment of Rs.5.08 crore made without recording measurement.
Increase of barren land/ nonagriculture use land/ wasteland indicated failure of watershed programmes in checked districts.

Audit Report (Civil) for the year ended 31 March 2008
64
records. The contention of the department is not accepted in audit because of absence of confirmation of achievements either in the land revenue records or by line departments.
3.1.10 Impact Analysis
For carrying out impact assessment of completed watershed projects, no records like pre and post watersheds observation of ground water level, change in cropping pattern, change in productivity, increase in area of irrigation and reduction in area of wasteland etc. had been maintained at any level. Data for physical achievements resulting in increases in ground and surface water level in water bodies, checking of soil erosion, enhancement of area for irrigation, land treatment etc. depicted that in 103 completion reports shown to audit out of 213 completed projects were not certified by the line departments. These data of achievements were certified by the POs and WC members themselves only and were not authenticated by any other authority. Thus after incurring an expenditure of Rs.339.89 crore during 200308, neither the DPAP blocks nor the villages treated on watershed basis could be declared as drought proof in the test check districts. In the exit conference the department intimated that a village wise register was being maintained to enter pre and post data of crop production, water table etc. but no such register was found to be maintained in the micro watersheds covered by audit.
3.1.11 Monitoring and Supervision
The implementation of watershed programmes was to be monitored at the State, District and Project level. The data of physical and financial achievements of watershed programmes reported through Monthly Progress Reports (MPRs) were however not analysed at any level.
Although periodical returns/reports required for monitoring of the programmes were prescribed yet the progress reports did not contain the component wise and activity wise cumulative figures of physical and financial achievements of the programme at the end of month/year. The formats of reports were being changed every year and were unable to depict the true and fair status of programmes. Poor monitoring of programmes at State level resulted in defective planning, irregularities in selection of microwatershed area, non adherence to cost norms, nonexecution of work in proper sequence etc. by ZPs as pointed out earlier.
3.1.12 Conclusion
The planning for the projects was not sound. It ignored the GOI guidelines and could not give the required attention to activities which could yield multiple and long term benefits. Project selection was faulty, villages with preponderance of agriculture lands were being selected, land upgradation

Chapter III Performance Reviews
65
measures were totally ignored. Components of the programme were not executed in prescribed sequence necessary for proper development of watershed. Major emphasis was given to construction of minor structures under water and soil conservation measures, which were not of sustainable nature and other components were either partially taken up or totally ignored. Due to tardy progress, the projects could not be completed in time.
Thus it was evident that the watershed development programmes under execution in the State since 199596 and all other measures for drought prevention have met with little success even after an expenditure of Rs.616.88 crore during 200308 on implementation. The testchecked blocks therefore remained drought prone and contrary to the guidelines of programme land records showed increase in area under barren land and nonagriculture land use.
3.1.13 Recommendations
Following recommendations if adopted could help in smooth operation and flow of benefits from watershed development programmes:
Ø Selection of microwatershed projects should be based on scientific and technical surveys and actual availability of lands for its treatment in the villages of DPAP blocks and other blocks of the districts as per Land Revenue Records.
Ø Project plans should be prepared with appropriate need based technical inputs and all related activities as envisaged in guidelines to be carried out in watershed area. Project plan should be approved by the Director RGWMM.
Ø Coordination between line departments should be closely monitored to prevent overlapping and reselection of villages.
Ø Funds should be released to the WCs in time for proper implementation of the projects and watershed development works should be executed according to norms.
Ø Monitoring and evaluation of the programmes to be made more effective to achieve the goals.
Ø Pre and post status data of lands classification, soil erosion, crops production and water table shown in project completion reports should be certified by the line departments to keep a close watch on the programme parameters.
These recommendations have been accepted by the department in exit conference.
Audit Report (Civil) for the year ended 31 March 2008
66
Panchayat and Rural Development Department
3.2 National Programme of Nutritional Support to Primary Education (Mid Day Meal)
Highlights The Mid Day Meal (MDM) scheme was launched in the State of Madhya Pradesh with the specific objectives of improving the nutritional status of school going children and bringing about growth in their enrolment and retention to give boost to primary education among children of poorer sections of the society. The figures of enrolment in primary classes in the year 200708 decreased by five per cent from the previous year. Performance audit of the programme revealed deficiencies in financial management and programme implementation as there were cases of unspent funds, providing meals in inadequate quantities to students, nonsupply of meals to students, lack of infrastructure such as pucca kitchen, drinking water facility, cooking gas facility, etc. Study conducted by National Institute of Public Co operation and Child Development (NIPCCD) at the instance of MP Govt. revealed poor nutritional status of students covered under the scheme. Some of the highlights of audit review are as follows:
Cost of cooking was not sufficiently provided to the Parent Teacher Associations as a result they had to incur a credit of Rs.3.68 crore.
(Paragraph 3.2.6.2)
Suspected embezzlement of Rs.1.20 lakh was noticed in Block Education Office Gandhwani district Dhar
(Paragraph 3.2.6.4)
Enrolment figure in primary classes declined during 200708. (Paragraph 3.2.7.1)
Against the requirement of 79471 kitchencumstore (KCS) only 58688 KCS were sanctioned out of Government of India funds. Out of this construction of 17359 KCS were completed. Against the sanction of 13848 kitchen sheds (KS) out of state fund, only 5024 KS were completed by Tribal Welfare Department (TWD).
(Paragraph 3.2.12.2)
Commissioner TWD provided funds of Rs.9.10 crore irregularly to the districts for purchase of utensils at district level, instead of crediting in the accounts of Parent Teacher Associations (PTAs) of schools for procurement of kitchen devices/utensils.
(Paragraph 3.2.12.3)

Chapter III Performance Reviews
67
Irregular engagement of contractor and non Government organization for cooking/serving of cooked meals below the prescribed rate led to deterioration in quality of food and interruption in supply.
(Paragraph 3.2.13)
3.2.1 Introduction
The Mid Day Meal Scheme (MDM) was launched as a Centrally Sponsored Scheme on 15 August 1995 with the objective of boosting universalisation of primary education by increasing enrolment, attendance, retention and simultaneous improvement in the nutritional level of students of primary classes (I to V) of all Government schools including local body and Government aided schools. From October 2002, the scheme was extended to children studying in the Centres under Education Guarantee Scheme (EGS) and Alternative and Innovative Education (AIE). The Scheme initially provided for distribution of fixed quantities of dry food grains to school children. This was replaced by cooked meals with effect from October 1995 of selected blocks and of all primary schools from July 2004 after the orders of the Supreme Court. The scheme laid (December 2004) special emphasis on disadvantaged groups with the additional objective of providing MDM in droughtaffected areas during summer vacation also. From September 2006, the calorific value of the meal was increased from 300 calories to 450 calories and protein content from 812 grams to 12 grams and providing essential micro nutrients and deworming medicines to the children regularly.
3.2.2 Organisational setup
Principal Secretary to the Government of MP, Panchayat and Rural Development Department (PRDD), (nodal department), is responsible at Government level for implementation of the scheme. The Development Commissioner implemented the scheme with the assistance of Tribal Welfare Department (TWD) Urban Administration and Development Department (UADD), Food and Civil Supplies Department (FCSD), School Education Department (SED) and Public Health & Family Welfare Department (PHFWD).
At the district level, the Collector was responsible for planning and implementation of the programme. The day to day functioning of the programme was carried out by Chief Executive Officer, Zila Panchayat (CEOZP) with the assistance of other connected departments at district level/ block level.
At the school level, Gram Panchayats (GP)/ Nagriya Nikay (NN) were the implementing agencies prior to the year 2004. Thereafter, Parent Teacher Associations (PTAs) of schools were made responsible as implementing

Audit Report (Civil) for the year ended 31 March 2008
68
agencies for the programme. Self Help Groups (SHGs) were involved (September 2007) in place of PTAs for the schools of rural areas for running the programme/scheme. The responsibilities of PTAs/SHGs included fixing of menu, appointment of cooks, procurement of ingredients for cooking food, procurement of kitchen devices/utensils, payment of expenditure incurred on cooking, maintenance of quality and hygiene.
The Madhya Pradesh State Civil Supplies Corporation (MPSCSC) is the nodal agency for lifting of food grains from the nearest FCI Depot and its distribution to Fair Price Shops (FPSs) through lead societies from where PTAs/SHGs are required to lift the food grains and to transport it upto schools. An organisational chart is given in Appendix 3.6.
3.2.3 Audit Objectives
The objectives of the performance audit were to verify whether: Ø the scheme achieved its principal objective of supporting the
universalisation of primary education; Ø the scheme achieved its secondary objective of improving the
nutritional status of the children in the primary classes; Ø the internal controls were adequate and in place;
Ø the scheme was run through well designed implementation procedures; and conformed to the prescribed norms for expenditure; and
Ø reporting, inspection and monitoring system were efficient.
3.2.4 Audit Criteria
The following audit criteria were adopted while carrying out the Performance Audit.
Ø Relevant guidelines, instructions issued by the Central and State Government from time to time for implementation of the programme;
Ø Utilisation of funds as per prescribed norms;
Ø Statistics on enrolment, retention and attendance in schools;
Ø Nutrient value of meals served to students; and
Ø Evaluation reports/studies and survey findings etc.

Chapter III Performance Reviews
69
3.2.5 Audit Coverage and Methodology
The performance audit of the scheme for the period 200308 was conducted 17 in twelve 18 out of 48 districts, as selected by Stratified Circular Systematic Random Sampling (10 districts) and Probability Proportional to size with Replacement (two districts) method. Twenty schools were also selected on random basis in each test checked district.
Records of the implementing departments, MPSCSC and Rajya Shiksha Kendra (RSK), maintained at the state, district and block levels, were scrutinized. Joint inspection of 64 schools, interview of 63 children and 41 teachers were also carried out alongwith the representatives of PRDD/SED.
An introductory meeting was held in April 2008 with Secretary PRD Department and subsequently the audit findings and recommendations of audit were discussed in the exit conference held in November 2008 with Principal Secretary, Government of Madhya Pradesh, PRD Department and their views were considered while finalising the review. Results of testcheck are embodied in the succeeding paragraphs.
Audit Finding
3.2.6 Financial Management
The GOI provided financial assistance to the State for the MDM scheme in the shape of food grains free of cost through FCI godowns and funds for (i) conversion cost, (ii) management, monitoring and evaluation (MME) funds, (iii) infrastructural funds and (iv) transportation cost of food grains from FCI godowns to schools by reimbursement on receipt of transportation bills.
3.2.6.1 Excess provision for conversion cost
From September 2004, conversion cost of ingredients 19 , cost of fuel and wages/remuneration for cooking was payable by GOI at the rate of Rupee one per child per school day and the differential cost of cooking beyond the central assistance was to be borne by State Govt. The rate was increased (15 August 2006) to Rupees two (including State share of Re. 0.50) per child per school day. Details of fund released by Central and State Government and their utilization for the period of 200308 for conversion cost was as under:
17 During February to November 2007 and May to October 2008 18 Betul, Bhind, Bhopal, Burhanpur, Dindori, Jhabua, Khargone, Mandla, Narsinghpur,
Shahdol, Shajapur, Shivpuri. 19 Pulses, vegetables cooking oil and condiments.

Audit Report (Civil) for the year ended 31 March 2008
70
Table No. 3.7: Funds released and expenditure
(Rupees in crore) Year Central Funds State Funds Total Actual
Expenditure Saving()/ Excess(+)
Percentage of Saving/ Excess
200304 NA NA NA NA NA NA 200405 138.96 179.07 318.03 237.15 ()80.88 ()25 200506 186.14 95.51 281.65 253.13 ()28.52 ()10 200607 235.08 121.50 356.58 288.90 ()67.68 ()19 200708 199.38 50.37 249.75 315.02 65.27 26 Source: Panchyat and Rural Development Department.
From the above it is seen that funds between 10 to 25 per cent remained unutilised at the end of each year during 200407 indicated excess provision of funds in budget. PRDD attributed (April 2008) the savings to less attendance of children. The departmental reply accepts failure to achieve the objective of improvement of attendance. In test checked districts unutilized balances of Rs.11.63 20 crore (as of March 2008) with the Zila Panchayats (ZPs) were not taken into consideration while releasing the funds to PTAs.
3.2.6.2 Sufficient funds of conversion cost not provided to PTAs
Sufficient funds for conversion cost was to be credited in the PTA’s account of school in advance on the basis of students enrolled. Progress report of the CEO ZPs revealed that PTAs spent more than the funds provided to them amounting to Rs.3.68 crore as detailed below.
(Rupees in crore) Name of district
Reporting month
Period covered in the report
Cooking cost provided to PTAs
Cooking cost incurred by PTAs
Amount of minus balance
Shahdol June 08 July 07to June 08 3.43 5.28 1.85 Shivpuri April 08 July 07 to April 08 7.17 9.00 1.83 Total 10.60 14.28 3.68
Only CEO ZP Shivpuri replied (July 2008) that PTAs purchased the materials on credit or made arrangement on their own. Similarly out of 237 schools checked in audit, 19 to 27 per cent schools 21 reported minus balance during 200408 as shown in Appendix 3.7.
3.2.6.3 Reimbursement of cooking cost to Gram Panchayats (GPs) without observing formalities
As per instructions (July 2004) of Assistant Commissioner Tribal Welfare Department Dindori, the amount spent by Gram Panchayats (GPs)/Nagriya Nikays (NNs) in excess of funds provided to them were to be reimbursed by Block Education Officers (BEOs) after getting the information of previous
20 Betul Rs. 2.73 crore, Bhind Rs. 2.70 crore, Burhanpur Rs. 0.91 crore, Dindori Rs. 0.05 crore, Jhabua Rs. 0.45 crore, Khargone Rs. 1.54 crore, Mandla Rs. 0.22 crore and Shajapur Rs. 3.03 crore.
21 44 schools in 200405, 59 schools in 200506, 48 schools in 200607 and 63 schools in 200708
Short transfer of funds of Rs.3.68 crore to Parent Teacher Associations.
Block Education Officer reimubursed irregularly Rs.1.96 lakh to GPs.

Chapter III Performance Reviews
71
years, utilization certificates, and information on proformaV duly signed by teachers of schools. It was, however, observed that BEO, Shahpura irregularly reimbursed the claim of Rs.1.96 lakh to GPs for the period July 2003 to January 2004 without getting the aforesaid information duly signed by teachers of schools. BEO replied (July 2008) that necessary action is in process.
3.2.6.4 Suspected embezzlement
According to instructions/guidelines of scheme, BEOs were required to credit the amount of conversion cost into PTA’s account and were not authorised to incur any expenditure at block level. Scrutiny of records of BEO Gandhwani district Dhar revealed that a payment of Rs.1.20 lakh through DD on account of conversion cost was shown in the cash book on 3 December 2005, but neither the bank’s slip for DD and payees stamp receipts, nor the voucher of the party to whom the payment was made, were available from the records. BEO Gandhwani replied (May 2007 and October 2008) that after scrutiny, result would be intimated but results are awaited (November 2008). No reply was furnished by Government.
3.2.7 Enrolment, Attendance and Retention of students
According to the scheme guidelines (August 1995) while furnishing the request/ Annual Work Plan and Budget (AWPB) for each year PRDD was required to be furnished to the GOI, along with the number of Children enrolled in class I to V in Government, Local body and Government aided primary schools and also in EGS and AIE centres for release of food grains, conversion cost and management monitoring and evaluation (MME) cost.
GOI guidelines (December 2004) also envisaged that base line studies for the year 200405 should be conducted and completed before the end of academic session 200405. However no base line study has been conducted so far (March 2008).
3.2.7.1 Enrolment of students
The year wise position of enrolment, retention and dropout of students in primary education during the period 200308 are shown in Appendix 3.8. It was observed that the enrolment in the schools providing MDM increased by 10 per cent from 76.94 lakh students to 84.90 lakh students during 200304 to 200708. Analysis indicated that though the enrolments increased in year 2003 07 it decreased by five per cent during 200708. It was also noticed that percentage of number of beneficiaries availing MDM decreased by six per cent during the year 200708. The table also shows significant decline in new enrollments from 24.05 lakh students in 200405 to 11.80 lakh students in 200708. For the decline in enrolment no specific reasons were furnished by the Department.
Block Education Officer Gandhwani, made doubtful payment of Rs.1.20 lakh.
Base line survey was not conducted.
Enrolment increased by 10 per cent during 200308.

Audit Report (Civil) for the year ended 31 March 2008
72
3.2.7.2 Attendance and retention
Scrutiny of information furnished by schools checked in audit revealed that average attendance rate (AAR) decreased from 75 per cent in 200304 to 74 per cent in 200708 as shown in Appendix 3.9. Joint inspection of 64 schools in nine checked districts by the audit team alongwith the representatives of PRDD and SED showed that against enrolment of 9815 students, 5742 (59 percent) were present as per the attendance registers, showing a wide gap between the children enrolled and those attending schools. On actual counting, the number of children present in the schools was 5620 as against 9815 children enrolled (57 per cent) only.
Scrutiny of data captured from checked sample schools revealed that the retention of students from class I to V decreased in nine 22 districts as shown in Appendix 3.9.
3.2.8 Management Monitoring and Evaluation (MME) Assistance
The GOI was to provide funds equivalent to 0.9 per cent during 200405 and there after 1.8 per cent of the total assistance on food grains, transportation cost and cooking cost, under the MDM scheme for effective MME. The MME fund was to be utilized for school level expenses i.e. forms, stationery, weighing machine, height recorder and replacement of cooking device/utensile etc.(50 per cent), management, supervision, training, internal monitoring and evaluation (35 per cent) and external monitoring and evaluation (15 per cent). The details of funds received from GOI and utilization were as under:
Table No. 3.8: Funds available and spent on MME
(Rupees in crore) Year Opening
balance Released by GOI
Total availability
Expenditure incurred by the State Govt.
Saving
200506 Nil 3.27 3.27 0.60 2.67 200607 2.67 3.14 5.81 5.13 0.68 200708 0.68 6.93 7.61 5.64 1.97 Source : Panchyat and Rural Development Department.
It was observed that:
Ø Funds for forms, stationery, weighing machine and height recorder at school level were not released during 200508.
Ø PRDD issued (March 2006) instructions to each district for evaluating the programme through District Institute of Educational Training (DIET). However PRDD released Rs.0.50 lakh to each district as late
22 Bhind, Burhanpur, Jhabua, Khargone, Mandla, Narsinghpur, Shahdol, Shajapur and Shivpuri
Average attendance did not improve.
Decline in retention figures.

Chapter III Performance Reviews
73
as in July 2007. Even after that CEO ZP Jhabua and Narsingpur did not provide funds to DIET and hence the evaluation was not done.
3.2.9 Food grains management
The GOI provided food grains free of cost at the rate of 100 gram per child per school day under the cooked meal scheme. Allocation of food grains was made by GOI to FCI.
3.2.9.1 Quality and quantity control of food grains
According to GOI instructions (2004), District collectors were to ensure that food grains of Fair Average Quality (FAQ) are issued by FCI. This was to be ensured through joint inspection by a team consisting of FCI and collector nominee(s). Similar instructions were issued (June 2005 and December 2005) by PRDD in which District Manager MPSCSC was asked to furnish the report to this effect each month to Development Commissioner. Though joint inspection of stack was conducted each month, DM MPSCSC of checked districts did not submit reports to this effect to Coordinator MDM. As per instructions of PRDD issued (December 2005) food grains are required to be lifted by PTAs only after actual weighing. However, 128 (54 percent) out of 237 schools checked, stated that the food grains were not being given by FPSs after actual weighing but on the basis of number of gunny bags as per filling capacity. Hence the possibility of short receipt remaining undetected cannot be ruled out.
3.2.9.2 Allotment of food grains to Fair Price Shops.
Allotment orders for distribution of foodgrains are issued by the Collectors/ CEO ZP and required provisioning is done by MPSCSC to FPSs through lead societies. Thereafter foodgrains are lifted by PTAs of schools on the basis of release orders issued by CEOs/ BEOs. Scrutiny of records in checked districts revealed that the entire quantity provided to FPSs was not lifted by the schools and balances remained with the FPSs each year. Balances of food grains available with the FPSs were however not accounted for during the subsequent release by Collector/CEO, ZPs. It has been gathered from District Co operative Central Banks of checked districts that 3,195 MT 23 food grains valuing Rs.3.20 crore was lying undistributed with FPS at the end of March 2008. The loss of these food grains due to theft/pilferage, etc. is a risk which has not been addressed.
23 Betul :846, Bhind :22.7, Bhopal :308.7, Shahdol :399.4, Shajapur :32.8, Shivpuri: 315.0 , Khargon 714.3 , Jhabua 230.90 and Mandla 325.20 MT.
Joint inspection reports were not submitted.
Food grains were not given by actual weighing.
Accumulation of undistributed food grains worth Rs.3.20 crore with Fair Price Shops.

Audit Report (Civil) for the year ended 31 March 2008
74
3.2.9.3 Inflated data of utilization of food grains reported to GOI
PRDD was required to furnish a Utilisation Certificate (UC) to GOI in respect of food grains lifted and consumed during the preceding financial year. A scrutiny of the UCs furnished, revealed that the stock of food grains in hand reported by the PRDD were at variance with the stock in hand as depicted in the records of MPSCSC as shown below:
(Quantity in quintal) Year Balance Stock in hand as
per MPSCSC Figures reported to GOI as per utilization certificate
Excess reported
200405 Opening (W) 100684.33 (W)100634.33 50.00
(W) 170805.66 (W)154025.04 16780.62 200506 Closing
(R) 60556.18 (R) 59403.47 1152.71
Total 17983.33
WWheat, RRice
Thus, utilization of 17983 quintal food grains worth Rs.1.80 crore during 200406 were over reported to GOI.
3.2.9.4 Actual consumption of food grains not reported to GOI
Utilisation Certificates (UCs) sent to GOI were not based on actual utilization of food grain. In the UCs, quantity of food grains utilized for coverage of eligible children was to be reported. But PRDD sent the UCs on the basis of food grains distributed by MPSCSC to FPSs which was not based on actual consumption. This resulted in reporting of consumption of food grains in excess to that consumed.
3.2.10 Transportation
3.2.10.1 Non payment of transportation charges to PTAs
Out of transportation cost of Rs.75 per quintal being reimbursed by GOI to MPSCSC, Rupees five per quintal were payable to PTA for transportation of food grains from FPS to school. In the checked districts it was noticed that Rs.31.95 24 lakh for transportation of food grains from FPSs to schools during April 2005 to March 2008 were not reimbursed due to non submission of claims after completing the formalities with necessary documents by PTAs due to non awareness and lengthy procedure. PRDD further simplified (July 2007) the procedure of submission of transportation claim cancelling the earlier
24 Bhind : Rs. 6.26 lakh, Betul :Rs 5.02 lakh, Bhopal : Rs. 2.40 lakh, Narsinghpur : Rs. 2.68 lakh, Shahdol : Rs. 2.97 lakh, Shivpuri : Rs. 7.98 lakh, Shajapur Rs. 4.64 lakh.
Over reporting of utilization of food grains to GOI.
Actual consumption of food grains was not reported.
Transportation charges were not paid to Parent Teacher Associations.

Chapter III Performance Reviews
75
orders but still the payments were not made for the above period to the PTAs as the required information was not furnished by link societies/FPSs.
3.2.10.2 Undue benefit to FPSs
The scheme guidelines issued (December 2004) by GOI, envisaged that empty gunny bags should be disposed off by the implementing agency at school level i.e. PTA/SHG in a transparent manner so as to fetch the best possible price and their sale proceeds utilized for further enrichment of the MDM scheme. PRDD issued (June 2005) the instructions. However, it was observed that out of 237 schools, 219 schools (92 per cent) had reported that the empty gunny bags were called back by FPSs. Thus, 20.52 lakh empty gunny bags valuing of Rs.2.51 crore @ Rs.12.25 approximately on 10.26 lakh Qtl 25 of food grains distributed up to March 2008 in the checked districts resulted in undue benefit to FPSs.
3.2.11 Nutritional status of children
The scheme aimed at providing cooked meal adhering to the prescribed nutritional norm of calories and protein by adding fresh green vegetables etc. in adequate quantities. GOMP decided (January 2004) to provide cooked tasty meal in all primary schools (PS/EGS/AIE centers) from July 2004. Implementing Officer was to ensure that wholesome cooked meal of good quality and prescribed nutritional value was served without any interruption.
3.2.11.1 Nutritive value
As per scheme requirement, each child was to be provided with a meal comprising 300 calories and 812 grams of protein from July 2004 to 14 August 2006. From 15 August 2006 the calorific value was increased to 450 calories and 12 grams of protein. Audit observed that there is no provision in the scheme to check the nutritional value of the meals provided to children. National Institute of Public Cooperation and Child Development, (NIPCCD) Western Regional Centre, Indore had evaluated the nutritional value and stated that the amount given to the child was about two roties, one katori of dal or vegetable. Sometimes a child receives three roties on demand and its availability. A standard roti weighs about 30 grams which contributes 103.5 calories of energy and 2.04 grams of protein. Hence caloric contribution in two roties is barely 207 calories and 4.08 grams of protein. The remaining energy has to be made good by either dal or vegetable. Dal/ vegetables prepared in the form of curry was found thin thus reducing the possibilities of adequate calorie and protein supplementation as per norms.
25 Betul 1.24, Bhind 1.25, Bhopal 0.69, Khargone 1.26, Shajapur 0.99, Shivpuri 1.42, Dindori 0.66, Mandla 0.82, Shahdol 0.99, Burhanpur 0.26, Narsinghpur 0.68 (figure in lakh Quintal).
Empty gunny bages of Rs.2.51 crore retained by FPSs.
Audit Report (Civil) for the year ended 31 March 2008
76
3.2.11.2 Distribution of cooked meals
Cooked meals were to be served regularly according to varied menu without interruption, but it was observed that there was interruption in supply of MDM in 323 schools 26 of Bhopal and Bhind during December 2004 to April 2007. There was also interruption in urban schools of Dindori district during June July 2008 (39 to 50 days) and about 388 students were deprived of MDM.
Joint inspection of 41 schools (July to October 2008) revealed that
Ø Cooked meal was not prepared and served in primary school (PS) Pipariya, Sohagpur (Shahdol) on 21 July 2008 due to non availability of rice.
Ø Interviewed boys and girls stated that dal toowar (Arhar) and potato vegetable are prepared generally thereby indicating nonsupply of varied menu .
Ø Iodised salt was not used in PS Imalitola Burhar Shahdol.
Ø Meal was not prepared in required quantity and according to menu in PS Imalitola of Burhar Shahdol as a result of which, two students used to share one thali meals meant for one student.
The responsibility for cooking and distribution of cooked meals in schools of urban areas of Bhopal was given to M/s Naandi Foundation from July 2006. Block Resource Centre Coordinator (BRCC), Block Phanda, Bhopal reported that against the requirement of 794857 meals in April 2007 (for 23 days to 34559 average number of students) only 549621 meals were provided. During the joint inspection of PS Bhiansakhedi Bairagarh Bhopal on 4 October 2007, it was also noticed that out of 211 students enrolled only 125 students were present. M/s Naandi Foundation provided only 10 kg cooked rice, against the requirement of 22 to 25 kg cooked rice made from 12.5 kg uncooked rice. Thus, cooked meal was not given in required quantity to the students but the agency was given the full money for providing required quantity of cooked meals to students.
3.2.11.3 Distribution of deworming & micronutrient tablets
The revised scheme in 2004 provided that midday meal programme should also be utilized for appropriate intervention relating to micronutrients, Vitamin A supplementation and deworming of primary school students.
Directorate Health Services placed (December 2006) the supply order to MP, LUN for supply of Albendazol tablets (88.92 lakh) costing Rs.34.68 lakh and
26 DistrictMonthNumber of SchoolsBhopal12/0469, 02/0579; Bhind08/0643, 09/0648, 10/0627, 11/0615, 12/0624, 01/0710, 02/07 to 04/0708
Cooked meals not/ short distributed.
Chapter III Performance Reviews
77
IFA tablets (8891.70 lakh) costing Rs.4.45 crore. It was, however, observed that both the tablets were not supplied to three districts 27 and Albendazol tablets to two districts 28 during 200608. Further micronutrient and de worming tablets were not procured during 200708.
Schools were not provided full quantities of tablets for distribution to students thereby, depriving the students from the supplementation in the schools as shown in Appendix 3.10.
Scrutiny revealed that Vitamin A supplement was not given in any year 200508, though provided in the scheme.
3.2.11.4 Nutritional status
A committee was constituted with the representatives from National Institute of Public Cooperation and Child Development (NIPCCD), UNICEF, Food and Nutrition Board, National Institute of Nutrition and Gandhi Medical College, Bhopal to provide input for nutritional assessment, growth monitoring and develop training manual for teachers to carry out growth monitoring exercise. However no detailed instructions were issued in the checked schools. Despite availability of funds of Rs.2.67 crore at the end of March 2006 and Rs.1.97 crore at the end of March 2008 under MME, Weighing machine/Height recorder were not provided in any school. However, NIPCCD evaluated the programme and reported that nutritional status of the children receiving MDM in the State was far from satisfactory.
3.2.12 Infrastructure
Scheme guidelines envisaged that kitchen sheds/ Kitchen cum store (KCS) should be constructed in each school to facilitate cooking in schools itself so that fresh and hot cooked meal is served to children. Clean drinking water facility was required to be made available in each school. Cooking devices such as smokeless chulha were to be used to the extent possible and use of firewood was to be discouraged in the interest of environmental protection. Further containers for storage of food grains and other ingredients and utensils for cooking and serving were to be made available to all schools.
3.2.12.1 Infrastructure provided
The status of infrastructure available in checked district as shown in Appendix 3.11 was inadequate. Due to lack of adequate infrastructure in schools, smooth implementation of the programme was hampered to a large extent. Cases of deficiencies noticed in the joint inspection of sample schools in rural areas were as under:
27 Betul, Burhanpur,and Narsinghpur . 28 Shahdol and Dindori.
Short/non distribution of micro nutrients.
Vitamin ‘A’ was not distributed.
There were no norms for impact of nutritional level and nutritional level was far from satisfaction.

Audit Report (Civil) for the year ended 31 March 2008
78
Ø MDM was being cooked in open space under unhygienic condition in PS Imalitola in Shahdol district.
Ø Students had to drink water by thali as the glasses, though available, were not provided to them in Girls PS Police line in Shajapur district.
Ø In PS Koni in Shahdol and PS Talapar in Narsinghpur districts, MDM was being cooked in the Verandah attached to the class room creating a lot of smoke and disturbing the teaching/learning process.
Ø Children were drinking contaminated water in PS Talapar, Narsinghpur.
3.2.12.2 Construction of Kitchen cum Store (KCS)/ kitchen shed(KS) in primary schools
PRDD assessed the requirement of 79,471 Kitchen sheds in the State. GOI released Rs.139.39 crore and 212.74 crore during 200607 and 200708 for construction of 23,232 and 35456 KCS @ Rs.60,000 per KCS. The work of construction of KCS was to be completed in about 3 months. But, only 17,359 KCS were completed, 12,420 KCS were in progress and 28,909 KCS were yet to be started as of March 2008. In the exit conference Department stated that the earlier provision of Rs. 60,000 fixed by the Central Government two years ago was insufficient due to escalation and now Rs. 90,000 are required for construction of shed of similar specification but the Central Government has not revised provision or specification for the shed. Hence due to inadequacy of funds, the KCS could not be completed.
Similarly TWD sanctioned construction of 13848 kitchens in 89 tribal blocks of 19 districts during 200607 and provided funds of Rs.45.95 crore out of the saving of cooking cost, yet only 5024 KS were completed as of March 2008. In the checked districts it was observed that 2234 kitchens were incomplete as the approval for revised estimates and specifications had not been accorded. Thus, the money remained blocked and schools were not getting the desired benefit.
Joint inspection of PS boys Sunera, Shajapur revealed that KCS do not have platforms and proper ventilation.
3.2.12.3 Kitchen Utensils
According to scheme guidelines, procurement of utensil and storage bins at schools was to be done by the PTAs. However, Commissioner TWD provided (January 2007) funds of Rs.9.10 crore to Assistant Commissioners Tribal Development (ACTDs) of 19 tribal districts for purchase of utensils and storage bins and instructed that purchases be made at district level. ACTDs Dindori, Betul, Mandla, Shahdol and Burhanpur purchased utensils and storage bins on scale basis for all the schools contrary to the provision of guidelines.
Unfruitful expenditure on construction of kitchen cum stores.

Chapter III Performance Reviews
79
The flexibility of PTAs to assess their own requirements was also eroded leading to mismatch between material supplied and its requirement.
3.2.13 Role of Non Government Organisations/ Self Help Groups
The guidelines (December 2004) envisaged that in urban areas where a centralized kitchen set up was possible for a cluster of schools, cooking may where appropriate, be undertaken in a centralized kitchen and cooked hot meal transported under hygienic conditions through a reliable transport system to various schools. No contractor or bhojnalaya was to be engaged. But it was observed that the work of cooking and serving was assigned to contractor and Bhojnalaya in Shajapur 29 and Dindori 30 districts.
Further it was observed that in Shajapur district, contract was given to contractors below the prescribed rate of the conversion cost fixed by GOI (during 200608) resulting in students getting deprived of meals of proper calorific value and quality. There were many complaints leading to cancellation of the contract (September 2007). In Dindori district there was interruption in supply of cooked meal from 39 to 50 days during JuneJuly 2008 wherein 388 children did not get cooked meals.
3.2.13.1 Engagement of Self Help Groups
It was observed that the BEO Shahdol and Mandla engaged SHGs at block level for regular supply of ingredients to 911 schools and made payment worth Rs.64.38 lakh 31 during April 2005 to February 2006 against the laid down procedure. Further, Collector (Tribal) Jhabua engaged 24 SHGs for work of grinding of wheat and supply of flour in packets of 23 kg each by adjusting wastage of 8 kg wheat per quintal. There was no provision of allowing/permitting wastage of foodgrains at any level in the guidelines. Wastage of 942.02 quintal of Rs.9.42 lakh was allowed at 8 percent of 11775 quintal wheat grinded in Bhabra, Jobat, Rama and Ranapur blocks during 200607. It was also observed that recovery of short supplied flour of 37.44 Quintal @ Rs. 5/ per kg was made from SHGs, instead @ Rs.10/ per kg as prescribed in guidelines resulting in loss of Rs.18.72 lakh.
29 Shajapur District: (i) Nagar Panchayat Nalkhera Namdev Bhojnalaya @ Rs. 1.40 per child per day July 2005 to April 06,Jain Bhojnalaya @ Rs. 1.90 per child per day August 06 to April 07, (ii) Nagar Panchayat Susner @ Rs. 1 per child per day (iii) Urban school Shajapur Akanchha SHG Jawad @ Rs. 0.89 per child per day October 06 to April 07, Pasupati Nath Mahila Mandal @ Rs. 1.80 per child per day September 07 to April 08.
30 Dindori Urban schools of Dindori – Durgadas Multipurpose Sanstha – at prevailing rate February 08 to June 08.
31 . BEO GohaparuShahdol Jyoti Mahila SHG Chotarihatola Rs 6.51 lakh, Ganga SHG Umaria Rs. 8.19 lakh., BEO Jaisingh Nagar ShahdolMahila SHG Kanadi Khurd Rs.40.24 lakh, BEO NiwasMandlaJai Bhawani SHG Awadongri, Rs.5.93 lakh, Mahabir SHG Kusmi Rs. 3.51 lakh.
Meal supply arrangement were made with contractors below the prescribed rate.
Improper Engagement of Self Help Groups.

Audit Report (Civil) for the year ended 31 March 2008
80
3.2.14 Monitoring and Supervision
Ø According to PRDD instructions (FebruaryMarch 2005) Steering cum Monitoring committees (SMCs) at District/Block level were required to have atleast one meeting in every month. Against the requirement of 36 meetings to be held in each district during 200508, few meetings Bhopal (3), Dindori (11), Shahdol (6), Bhind (10), Burhanpur (2) were held. Blocks where SMCs were set up have not furnished the details of meetings held during 200508. Scrutiny revealed that SMCs were not constituted at block of Betul, Burhanpur, Dindori, Mandla, Narsinghpur, Shahdol and Shivpuri districts. Meetings were thus not held as required at block level. Thus monitoring of performance by the designated committees was far from satisfactory.
Ø According to instructions (April 2006) of PRDD, MDM Cell was to be established in each district for effective MME. It was observed that MDM cell in Dindori, Jhabua, Mandla, Narshingpur and Shivpuri districts were not established and the funds were lying unutilized.
Ø PRDD issued (October 2005) instructions that Jan Shikshak/Cluster Resource Centre (CRC) was to inspect all schools atleast once in a month. At block and district level, a roster was to be prepared and the officers at block/district level were to inspect atleast 10 schools and 5 schools of remote locality in a month. No information or records relating to inspections were furnished by checked districts/blocks.
Ø PRDD issued instructions (October 2005) regarding submission of reports in prescribed formats and to prepare the MIS database. During scrutiny of formats of monthly progress reports of Dindori, Khargone, Mandla, Dhar and Shahdol, it was noticed that the data of the previous month did not tally with the current month. CEOZP Betul, Jhabua and Shajapur did not provide the progress reports to audit.
Ø Separate cash book and ledger were required to be maintained for MDM, It was observed that separate cash book and ledger were not maintained at State level, instead they were mixed with Rajeev Gandhi Jal Grahan Mission account.
3.2.15.Conclusion
The programme implementation was week. Main objective of universalisation of Primary Education was not achieved as there was no noticeable improvement in overall enrolment, average attendance and retention of students. There were cases of deficiencies in financial management such as nonutilisation of funds, diversion of funds etc. Besides there were cases of short allotment of cooking cost to PTAs, non/short distribution of cooked

Chapter III Performance Reviews
81
meals, delay in construction of kitchens in primary schools etc. were also observed. Non/short distribution of deworming & micronutrient tablets indicated that implementation of the programme lacked focus on internal issues. ‘Health profile’ of primary students was not maintained rendering monitoring of health standards more difficult. MDM Cells and Steering cum Monitoring Committees were not set up at district and block levels respectively. Regular meetings were not held to discuss the operational issues. Regular inspections of primary schools, were not carried out to ensure efficient implementation of MDM.
3.2.16.Recommendation
Since the success of the scheme depended heavily on improved delivery, some steps need to be taken to address issues like quality of meals and regularity in supply and efficiency in operation. Some major areas/aspects requiring better attention and efforts are stated below:
Ø Cooking and supply of meals should conform to the prescribed procedure be of the required quality.
Ø Necessary records be maintained to monitor the health standards of children.
Ø The committees at various level should be made more pro active/participative.
Ø Evaluation of the scheme may be made to pinpoint events, reasons behind fall in enrolment and retention of school going children.
Ø More attention needs to be given to improve the status of the kitchen and drinking water as well as utensils.
Ø Construction of kitchens be speeded up to avoid disruption in teaching by making suitable arrangements for additional funds.

Audit Report (Civil) for the year ended 31 March 2008
82
Scheduled Tribes and Scheduled Castes Welfare Department
3.3 Infrastructure Development under Tribal SubPlan
Highlights
The Government of India (GOI) evolved Tribal SubPlan (TSP) strategy during 5 th Plan period (197479) with the objective to develop basic infrastructure facilities like irrigation, road and bridge connectivity, construction of educational institutions and health infrastructure in the tribal areas of the State. In Madhya Pradesh Rs.1606.84 crore were spent during 10 th Plan (20022007) under TSP for developing infrastructure for areas inhabited by tribal population of the State. Some important findings of performance audit are given below. Government failed to utilise TSP funds of Rs.356.99 crore during the entire 10 th plan period. Rupees 4.92 crore received from Central grants remained unutilized as deposits in Badwani and Khargone districts.
(Paragraph 3.3.7) Diversion of Rs.14.68 crore from TSP funds to nontribal areas was noticed in Katni and Sidhi districts. The irrigation potential created could not be utilised fully.
(Paragraphs 3.3.7.1 and 3.3.8.2) Unwarranted splitting of works resulted in avoidable extra expenditure of Rs.4.18 crore.
(Paragraph 3.3.7.3) Abandonment of five minor irrigation schemes due to overlapping of command area resulted in unfruitful expenditure of Rs.26 lakh.
(Paragraph 3.3.8.5) A sixty bedded hospital building in Jhabua district remained incomplete for last 12 years due to abnormal delay in finalising the tender.
(Paragraph 3.3.9.6)
3.3.1 Introduction
Scheduled Tribes (STs) are the most disadvantaged section of the Indian society. Apart from high levels of poverty, they remained backward in all aspects of human development indices including education, health, employment, nutrition etc.
The ST population of the country, as per 2001 Census, was 8.43 crore (i.e. 8.2 per cent of the total population of the country) of which 1.22 crore STs live in
Chapter III Performance Reviews
83
Madhya Pradesh (MP), 20.27 per cent of the total population of MP is ST, which is the highest among all the Indian States. There were 17 full/ partial tribal districts in the State covering 89 Tribal Development Blocks.
Tribal Development Strategy
The Tribal SubPlan (TSP) strategy was evolved by an Expert Committee set up by the Ministry of Education and Social Welfare, for rapid socioeconomic development of the tribal population during the Fifth Five Year Plan (197479) and the same is in operation till date.
The salient features of TSP were: Ø The benefits given to the tribals and tribal areas of the State should be
in addition to what percolates from the overall Plan of the State.
Ø To ensure a flow of funds for TSP areas the allotment should at least be in equal proportion to the ST population of the State (i.e.20.27 per cent in case of MP).
Ø The TSP funds were nonlapsable and nondivertible.
Expenditure from TSP funds upto 30 per cent was permissible for the purpose of developing infrastructure.
3.3.2 Organisational setup
The Scheduled Tribes and Scheduled Castes Welfare Department (TWD) is the nodal department for development of SCs/STs in the State. The Principal Secretary, TWD acts as the Nodal Officer for TSP schemes.
There were four Works Departments (Water Resources Department, Narmada Valley Development Authority, Public Works Department & Public Health Engineering Department) mainly responsible for development of infrastructure in the State including ST areas of the State. Each department at apex level is headed by the Principal Secretary to the Government and assisted by Engineersin Chief (EinC) , Chief Engineers (CE), Superintending Engineers (SE) and at field level Executive Engineers (EE). The NVDA is headed by the Chairman, five members, CEs, SEs and the EEs.
3.3.3 Audit objectives
The performance audit objectives were to assess whether:
Ø the planning for various infrastructure development schemes was systematically done;

Audit Report (Civil) for the year ended 31 March 2008
84
Ø the fund flow earmarked for various infrastructure development schemes under TSP was adequate and in proportion to ST population of the State and the same was utilized for benefit of STs;
Ø the schemes were executed properly and effectively by executing / implementing agencies;
Ø the basic development indices of the STs have improved during this period; and
Ø the monitoring system at various levels was adequate and effective.
3.3.4 Audit criteria
The main criteria to arrive at audit conclusions were:
Ø Guidelines issued by the Government of India and the Planning Commission for release and utilization of TSP funds;
Ø Budget provisions under tribal subplan during the period from 2002 03 to 200607;
Ø Sanctions accorded for the schemes/works under TSP, detailed estimates prepared for works/schemes and the contract documents.
3.3.5 Scope of audit and methodology
The Performance Audit of infrastructure development of STs under TSP was conducted during February to October 2008 covering the period from 2003 to 2008.
Scrutiny of records was conducted in nine WRD and six PWD divisions in nine (out of total 17) tribal districts and two nontribal districts of the State. Also the information was collected from Nodal Officer and Heads of the Departments. Probability proportionate to size sampling (PPS) method was used to select tribal divisions.
An introductory meeting was held in March 2008 with Commissioner Tribal Development, Secretary of Public Works Department (PWD) and Water Resources Department (WRD) and subsequently audit findings and recommendations of audit were discussed in the exit conference held in December 2008 with Secretary Scheduled Tribes and Scheduled Castes Welfare Department, PWD and WRD.

Chapter III Performance Reviews
85
Audit Findings
3.3.6 Planning
In order to achieve the objective of the programme/schemes, the department/implementing agency was required to develop a system of planning, assessment and identification of the infrastructure development works to be created in the tribal areas and their execution with in a prescribed time frame. It was, however observed that no such planning was attempted by the implementing departments and execution was carried out as and when sanctions were accorded by the Government.
Implementation of Schemes
3.3.7 Fund Management
Funding Pattern and Budget Analysis
Funds for Tribal Development (under TSP) were sourced from:
Ø State Plans,
Ø Special Central Assistance (SCA) and Grants under Article 275 (1) of the Constitution,
Ø Sectoral (Grants of Ministries and Departments), and
Ø Institutional Finance like NABARD loan assistance.
(i) Allocation of funds under TSP:As per guidelines, the flow of funds to the TSP in MP out of the total State plan outlays should not be less than 20.27 per cent (i.e. proportionate to the tribal population) of total state plan outlays. These funds were to be used for implementing the community development programmes (70 per cent) and infrastructural development (30 per cent).
Table No.3.9: Allotment and expenditure for infrastructure (Rupees in crore)
Allotment & Expenditure in Works Departments for infrastructure development Years Total Plan Outlay of State
Allotment under TSP (per cent) Water Resources Department Public Works
Department Narmada Valley Development
Authority Allotment Expenditure Allotment Expenditure Allotment Expenditure
200203 4821.00 824.69 (17.11) 85.76 72.96 79.26 48.68 62.14 65.18 200304 5703.00 962.73 (16.88) 103.79 95.98 69.60 57.84 104.01 78.31 200405 6709.96 1365.55 (20.35) 107.75 102.19 100.20 47.70 328.16 307.63 200506 7471.00 1652.59 (22.12) 138.07 126.02 96.23 88.89 191.78 119.06 200607 9100.67 2060.61 (22.64) 160.73 149.66 128.72 99.49 207.63 147.25 Grand Total
33805.63 6866.17 (20.31) 596.10 546.81 474.01 342.60 893.72 717.43
(+)Excess expenditure/() Savings () Rs.49.29 crore () Rs.131.41 crore () Rs.176.29 crore
Source: State Planning Board & Information given by PWD, WRD and NVDA

Audit Report (Civil) for the year ended 31 March 2008
86
The GOMP did not provide fund under TSP in proportion to the tribal population of the State during 200203 and 200304, though, the flow of fund improved in the subsequent years. However, during the entire 10 th Plan period, Rs.356.99 crore under TSP remained unutilised.
On this being pointed out, the GOMP, WRD, stated (October 2008) that utilisation of allotment was more than 90 per cent, hence it was considered satisfactory.
(ii) Central Assistancefunds kept under Civil Deposits The State received a sum of Rs.803.35 crore as central assistance and grants under Article 275 (1) of the Constitution from Government of India (GOI). According to the guidelines only 30 per cent amount of central grants is to be spent on infrastructural development activities through ITDPs 32 . An amount of Rs.787.89 crore from central assistance and grants were utilised by the State Government on community programmes and infrastructure schemes.
GOI guidelines (1998) clearly prohibited parking of central funds under civil deposits. Audit observed that in one district (Badwani) seven irrigation works estimated to cost Rs.4.66 crore were sanctioned with grants under Article 275(1) of the Constitution. The amount was also received by the WR Division and was kept under Civil Deposits. Only two works were completed at a cost of Rs.0.48 crore and balance amount of Rs.4.18 crore was lying in 8443Civil Deposits. No work was started on five irrigation schemes, while the Nodal Officer reported to GOI that grants have been utilized.
Similarly in WR Division, Khargone it was noticed that a sum of Rs.0.74 crore provided in December 2006 remained unutilized as of May 2008. The unspent amount was kept under Civil Deposits. Audit observed that in the above cases the implementing department received fund from the nodal department at the fag end of the financial year. In order to avoid lapse of fund, these amounts were kept under Civil Deposits.
On this being pointed out, Government admitted (October 2008) that certain grants were temporarily kept under Civil Deposits.
3.3.7.1 Diversion of TSP funds
In MP 89 Tribal Development Blocks were notified in 17 districts (vide Annexure VII) by the Government of India under Constitution (Scheduled Tribes) Order 2003 (C.O.192) of February 2003. As per guidelines of scheme the TSP funds were to be primarily utilized only in scheduled areas, however, diversion of TSP funds for nonscheduled areas was permissible if beneficiaries of the schemes were more than 50 per cent from tribal
32 ITDPs Integrated Tribal Development Projects
There was under utilisation of Rs.356.99 crore TSP funds during 10 th Plan period.
An amount of Rs.4.92 crore was lying under Civil Deposits whereas utilization was reported to GOI.

Chapter III Performance Reviews
87
community. Cases of diversion of TSP funds, where tribal population is less than 50 per cent, as noticed by audit are discussed below:
Ø GOMP spent Rs.1.43 crore under TSP for construction of Jhanpi tank project to irrigate 154 ha. land of Katni district. The scheme was completed in June 2004. Scrutiny of detailed project report (DPR) revealed that out of total 162 beneficiary cultivators, the number of ST cultivators was merely 29 (18 per cent) with their land holdings as 15 per cent.
On this being pointed out, it was stated by the EE that the tribal beneficiaries were 41 per cent. Even the 41 per cent as reported by EE did not qualify the norms prescribed by GOI.
Ø In Sidhi district, ST population is 30 per cent and out of eight development blocks only one block namely Kusmi was declared as a Tribal block. Scrutiny of records revealed that GOMP accorded (June 1999 to June 2001) approval of Rs.21.46 crore for construction of eight roads having length of 145.70 km under TSP. None of these roads was located in the tribal block of Kusmi. The division incurred an expenditure of Rs.13.25 crore on completion of 79.10 km Black Topped (BT) road as of July 2008. The beneficiary ST population in those nontribal areas ranged between 10.84 and 32.78 per cent, which did not qualify the conditions for utilization of TSP funds in nontribal area.
3.3.7.2 Schemes sanctioned during 5 th & 6 th Plan remained incomplete due to nonreceipt of funds in time
The objective of TSP was to ensure flow of funds to complete the incomplete projects with priority to old ongoing projects over the new projects. In one district (Shalipura tank of Mandleshwar division of district Khargone), a scheme was approved (1978 i.e. during 5 th Plan) with designed irrigation potential of 398 hectares. Only 298 hectare (74.87 per cent) potential could however been created as of March 2008, due to noncompletion of canals.
The abnormal delay in completion of canal in the eight divisions of seven districts test checked by audit was due to various reasons, which are exhibited in Appendix 3.12. It would be seen that 57 schemes sanctioned during 5th and 9 th Plan period, capable of irrigating 16832 ha land remained incomplete due to the reasons like paucity of funds, delay in getting the forest clearance from GOI and etc. as indicated against each.
On these being pointed out in audit, the Government stated (October 2008) that non completion was due to local resistance in acquisition of land required for the schemes. The completion of all the incomplete schemes would be expedited.
Diversion of Rs.14.68 crore TSP funds to nontribal areas/ schemes was noticed.
Fifty seven schemes capable to irrigate 16832 ha remained incomplete as of March 2008.

Audit Report (Civil) for the year ended 31 March 2008
88
Reply is not acceptable, as out of 57 schemes only five remained incomplete due to nonacquisition of land and the 22 schemes remained incomplete due to inadequacy of funds. Balance 30 schemes were under progress.
3.3.7.3 Unwarranted splitting of work resulted in extra cost of Rs.4.18 crore
Construction of Bagedi tank project in Badnawar block of Dhar district was approved (August 2002) under TSP at an estimated cost of Rs.10.72 crore. The construction of canal work including steel siphon was awarded (November2003) to a contractor for Rs.3.84 crore. The agency could execute the work valuing Rs.0.92 crore only and after that the contract was rescinded (January 2006). The work of providing and erection of MS steel pipes for siphon was awarded (January 2006) to another agency through Madhya Pradesh Laghu Udhyog Nigam (MPLUN) at a cost of Rs.5.61 crore. Balance civil work (except steel siphon work) with an estimated cost of Rs.1.67 crore was awarded (June 2006) to another agency for Rs.2.09 crore (25.01 per cent above) at risk and cost of the original contractor. Though the canal work is still incomplete, the cost of steel siphon was paid without commissioning the canal. The dam work was completed in June 2006.
In original contract the civil work of canal and MS steel siphon work was awarded to a single contractor. The rate of MS pipes for siphon (weighing 417282 kg) was based on per kg steel and its total cost as per contractor’s rates works out to Rs.1.14 crore. However, while splitting of siphon work, the weight component was eliminated and nomenclature of the item was changed on the basis of diameter, length and thickness of steel pipe. The escalation in cost of civil work was merely 25 per cent (June 2006) while cost of siphon work (January 2006) rose to Rs.5.61 crore (490.83 percent). Had the splitting of work not done and been included in subsequent single contract like the original one the cost of the work could have been minimized to Rs.1.43 crore. Thus unwarranted splitting of work resulted in avoidable extra expenditure of Rs.4.18 crore under TSP besides litigation in fixing risk and cost on defaulting contractor.
On being pointed out, the GOMP, WRD stated (October 2008) that due to unsatisfactory progress, the earlier contract was rescinded. While preparing tender for balance work, MPLUN directed (September 2005) that purchase of MS pipe was included in reserved list of MPLUN, hence it should be removed from contract and be purchased through MPLUN only. Therefore, it was separated from the balance work and the splitting was done from the composite work.
Reply was not in consonance with the fact that the item of MS pipe was already existed in reserved list and the Store Purchase Rules were also in existence at the time of original contract. Further, it was a civil contract for execution of complete canal work and not only purchase of MS pipe alone.
Unwarranted splitting of work resulted in avoidable extra expenditure of Rs.4.18 crore.
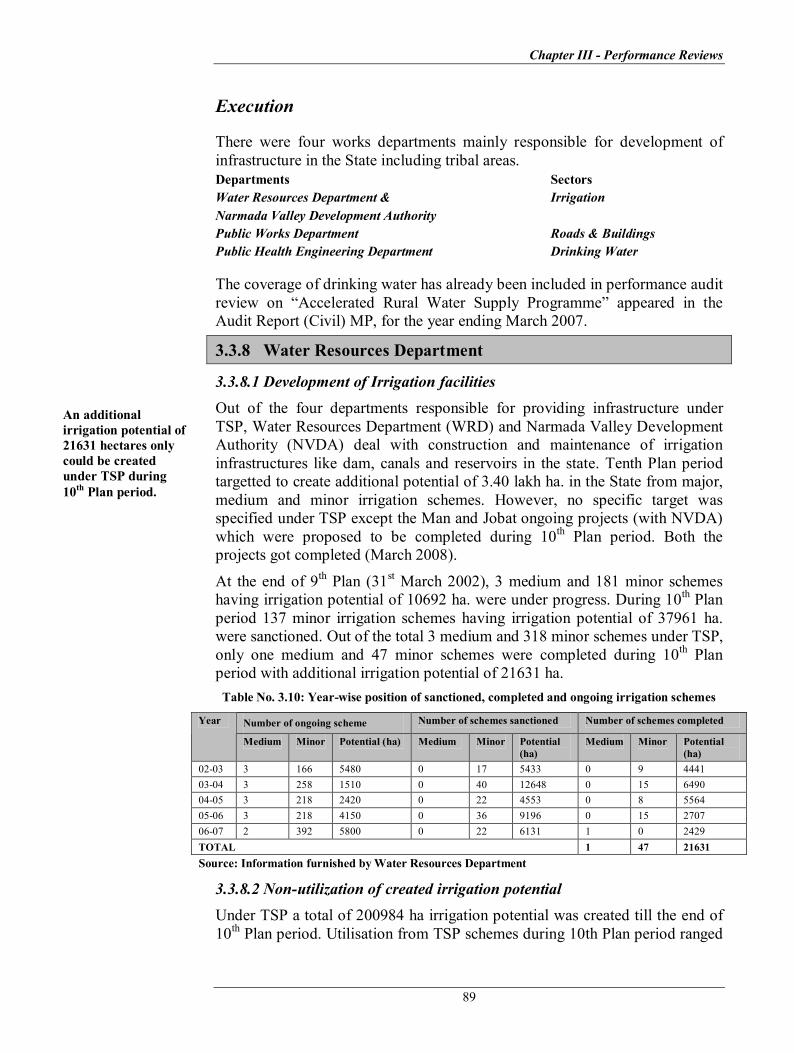
Chapter III Performance Reviews
89
Execution
There were four works departments mainly responsible for development of infrastructure in the State including tribal areas. Departments Sectors Water Resources Department & Irrigation Narmada Valley Development Authority Public Works Department Roads & Buildings Public Health Engineering Department Drinking Water
The coverage of drinking water has already been included in performance audit review on “Accelerated Rural Water Supply Programme” appeared in the Audit Report (Civil) MP, for the year ending March 2007.
3.3.8 Water Resources Department
3.3.8.1 Development of Irrigation facilities Out of the four departments responsible for providing infrastructure under TSP, Water Resources Department (WRD) and Narmada Valley Development Authority (NVDA) deal with construction and maintenance of irrigation infrastructures like dam, canals and reservoirs in the state. Tenth Plan period targetted to create additional potential of 3.40 lakh ha. in the State from major, medium and minor irrigation schemes. However, no specific target was specified under TSP except the Man and Jobat ongoing projects (with NVDA) which were proposed to be completed during 10 th Plan period. Both the projects got completed (March 2008).
At the end of 9 th Plan (31 st March 2002), 3 medium and 181 minor schemes having irrigation potential of 10692 ha. were under progress. During 10 th Plan period 137 minor irrigation schemes having irrigation potential of 37961 ha. were sanctioned. Out of the total 3 medium and 318 minor schemes under TSP, only one medium and 47 minor schemes were completed during 10 th Plan period with additional irrigation potential of 21631 ha. Table No. 3.10: Yearwise position of sanctioned, completed and ongoing irrigation schemes
Number of ongoing scheme Number of schemes sanctioned Number of schemes completed Year
Medium Minor Potential (ha) Medium Minor Potential (ha)
Medium Minor Potential (ha)
0203 3 166 5480 0 17 5433 0 9 4441 0304 3 258 1510 0 40 12648 0 15 6490 0405 3 218 2420 0 22 4553 0 8 5564 0506 3 218 4150 0 36 9196 0 15 2707 0607 2 392 5800 0 22 6131 1 0 2429 TOTAL 1 47 21631 Source: Information furnished by Water Resources Department
3.3.8.2 Nonutilization of created irrigation potential Under TSP a total of 200984 ha irrigation potential was created till the end of 10 th Plan period. Utilisation from TSP schemes during 10th Plan period ranged
An additional irrigation potential of 21631 hectares only could be created under TSP during 10 th Plan period.
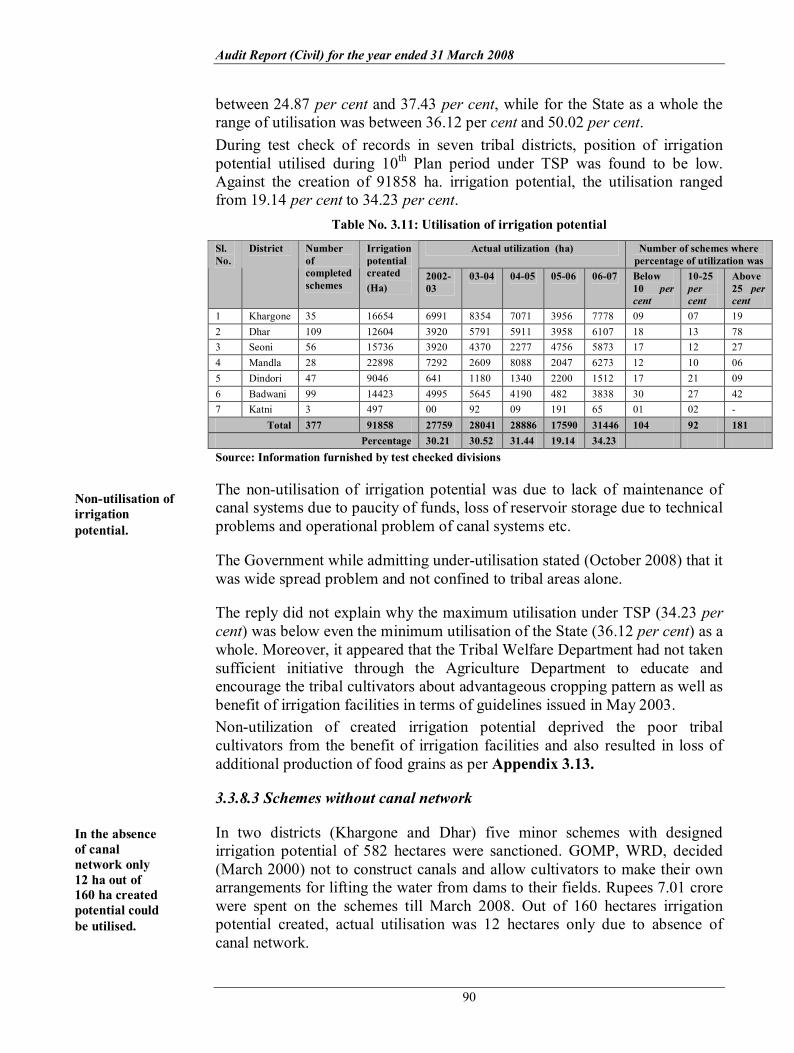
Audit Report (Civil) for the year ended 31 March 2008
90
between 24.87 per cent and 37.43 per cent, while for the State as a whole the range of utilisation was between 36.12 per cent and 50.02 per cent. During test check of records in seven tribal districts, position of irrigation potential utilised during 10 th Plan period under TSP was found to be low. Against the creation of 91858 ha. irrigation potential, the utilisation ranged from 19.14 per cent to 34.23 per cent.
Table No. 3.11: Utilisation of irrigation potential
Actual utilization (ha) Number of schemes where percentage of utilization was
Sl.No.
District Number of completed schemes
Irrigation potential created (Ha)
2002 03
0304 0405 0506 0607 Below 10 per cent
1025 per cent
Above 25 per cent
1 Khargone 35 16654 6991 8354 7071 3956 7778 09 07 19 2 Dhar 109 12604 3920 5791 5911 3958 6107 18 13 78 3 Seoni 56 15736 3920 4370 2277 4756 5873 17 12 27 4 Mandla 28 22898 7292 2609 8088 2047 6273 12 10 06 5 Dindori 47 9046 641 1180 1340 2200 1512 17 21 09 6 Badwani 99 14423 4995 5645 4190 482 3838 30 27 42 7 Katni 3 497 00 92 09 191 65 01 02
Total 377 91858 27759 28041 28886 17590 31446 104 92 181 Percentage 30.21 30.52 31.44 19.14 34.23
Source: Information furnished by test checked divisions
The nonutilisation of irrigation potential was due to lack of maintenance of canal systems due to paucity of funds, loss of reservoir storage due to technical problems and operational problem of canal systems etc.
The Government while admitting underutilisation stated (October 2008) that it was wide spread problem and not confined to tribal areas alone.
The reply did not explain why the maximum utilisation under TSP (34.23 per cent) was below even the minimum utilisation of the State (36.12 per cent) as a whole. Moreover, it appeared that the Tribal Welfare Department had not taken sufficient initiative through the Agriculture Department to educate and encourage the tribal cultivators about advantageous cropping pattern as well as benefit of irrigation facilities in terms of guidelines issued in May 2003. Nonutilization of created irrigation potential deprived the poor tribal cultivators from the benefit of irrigation facilities and also resulted in loss of additional production of food grains as per Appendix 3.13.
3.3.8.3 Schemes without canal network
In two districts (Khargone and Dhar) five minor schemes with designed irrigation potential of 582 hectares were sanctioned. GOMP, WRD, decided (March 2000) not to construct canals and allow cultivators to make their own arrangements for lifting the water from dams to their fields. Rupees 7.01 crore were spent on the schemes till March 2008. Out of 160 hectares irrigation potential created, actual utilisation was 12 hectares only due to absence of canal network.
Nonutilisation of irrigation potential.
In the absence of canal network only 12 ha out of 160 ha created potential could be utilised.

Chapter III Performance Reviews
91
The Government admitted (October 2008) that many irrigation schemes were takenup without canal network in the entire State including tribal areas on local demand. Government also admitted that marginal farmers might not take advantage of such schemes; therefore, expectation of the Government seems to be unrealistic.
3.3.8.4 Delay in completion of canal network
In four 33 districts it was observed that though head works (dam) of 12 minor schemes with designed irrigation potential of 5,574 hectares were completed at a cost of Rs.51.48 crore and reservoirs were full of water but due to delay in construction of canal network no irrigation facilities could be provided to the tribal cultivators as of May 2008 resulting in idle investment of Rs.51.48 crore.
The Government admitted (October 2008) that delay was mainly due to non acquisition of land for canal network and for some other reasons too.
3.3.8.5 Overlapping of command area resulting in abandonment of schemes
In one district (Khargone) seven schemes with designed potential of 1415 ha at an estimated cost of Rs.13.19 crore were sanctioned (during 200203 to 2006 07) under TSP. After incurring an expenditure of Rs.0.26 crore, five schemes were proposed for abandonment due to overlapping of command area of one medium and one major project. Two schemes were abandoned due to refusal of cultivators of submergence area. Abandonment of schemes indicated unrealistic and inadequate survey/ investigations while proposing the schemes, and the expenditure of Rs.0.26 crore became unfruitful.
The Government admitted (October 2008) that while preparing land acquisition cases it was found that the schemes were in the command area of Indira Sagar Project, and were therefore dropped.
3.3.9 Public Works Department
The Public Works Department was responsible for infrastructural development such as road, government residential and nonresidential buildings, requirement for educational infrastructure, health infrastructure and general administration etc for the entire State including tribal areas.
3.3.9.1 Development of Road Infrastructure
Road is the basic need to provide physical connectivity between two destinations, hence is one of the oldest forms of infrastructure. Roads are, therefore, the backbone of any economy. The PWD is vested with the
33 Khargone, Badwani, Dindori and Dhar districts
Irrigation potential of 5574 hectare remained unutilised in four districts rendering the expenditure of Rs.51.48 crore idle.
Overlapping of command area resulted in abandonment of five approved schemes.

Audit Report (Civil) for the year ended 31 March 2008
92
responsibility of construction, upgradation and maintenance of roads in the State. Two new authorities, the Madhya Pradesh Rural Road Development Authority (MPRRDA) and the Madhya Pradesh Road Development Corporation (MPRDC) were constituted with effect from December 2000 and July 2004 respectively with the specific purpose to improve rural roads connectivity, especially with reference to implementation of PMGSY 34 by the MPRRDA, and construction and maintenance of state highways by the MPRDC.
Test check of records in five districts out of eleven, revealed that not a single km BT 35 road was constructed for new connectivity to tribal habitations. Three (3) km WBM 36 road in Khargone district and one km WBM road in Dindori district for PTG 37 (Baiga village) were constructed. A substantial portion of TSP fund was utilized for upgradation and strengthening of existing roads instead of new connectivity.
Table No. 3.12: Position of unconnected habitation in 10 tribal districts
Tribal Districts Percentage of villages not connected by pucca road Badwani 51.8 Betul 61.9 Dhar 61.8 Dindori 64.6 Jhabua 48.2 Khargone 53.1 Mandla 61.8 Seoni 68.4 Shahdol 59.6 Sidhi 51.3
Source: MPRRDA and Annual Reports of PWD for 1999 to 2006
3.3.9.2 Inordinate delay in completion of road for primitive tribal groups
Rusa to Jada Surang, all weather BT road with length of seven km in Dindori district for providing connectivity to Baiga (PTGs) villages was sanctioned (March,2006) by GOI under Article 275 (1) of the Constitution. Though funds were made available (March 2006) to the department, yet the work was not allotted to any contract agency till March 2008.Scrutiny of records did not reveal any reason for the nonallotment of work to any contract agency. Audit further observed that the work was being executed departmentally and only one km WBM road was constructed after incurring an expenditure of Rs.0.31 crore as of March 2008.
34 PMGSY Pradhan Mantri Gram Sadak Yojana 35 BT Black Topped ( BT road is considered as all weather road and superior than
WBM road) 36 WBMWater Bound Macadam 37 PTGs Primitive Tribal Groups

Chapter III Performance Reviews
93
3.3.9.3 SubStandard Cement Concrete Pavement
According to MORT&H specifications (clause 602.4) a cement concrete pavement should be laid over a Dry Lean Concrete (DLC) sub base 38 constructed in accordance with clause 601. Audit observed that in two 39 districts the cement concrete pavement was laid directly on Water Bound Macadam (WBM) surface without the proper subbase of DLC. This resulted in substandard work valuing Rs.2.22 crore.
On being pointed out it was stated by auditee that DLC subbase was not provided in the CC 40 roads passing through village area in view of less traffic. Hence it was not provided in the sanctioned estimates. The reply was not conforming to the specifications of MORTH.
3.3.9.4 Excess payment on back filling
The MORT&H specifications section 300, as well as general note of SOR provided that the item of excavation for foundation of structures included backfilling upto original ground level, no extra charges were payable on this account.
It was, however, observed that in Dindori, Jhabua and Mandla districts, hume pipe (HP) culverts 41 were constructed and an item “backfilling behind abutments and returns” was paid to the contractors. Since the item of excavation for foundation had already included backfilling and the HP culverts did not have any abutment 42 or returns except headwalls and face walls 43 the item was superfluous resulting in excess payment of Rs.42 lakh to the contractors.
On being pointed out it was stated that earthwork for face walls and head walls was necessary, hence payment was regulated vide the item of back filling behind abutments. The reply was contrary to the provisions of SOR as no separate payment for backfilling was to be made.
38 Dry lean concrete subbase acts as foundation of cement concrete pavement 39 BistanSirwelTensemli, AnakwadiKabriBhulwania road (Khargone district) and
JobatBoriPara road (Jhabua district), 40 Cement concrete roads are classified as rigid pavements for roads. 41 Hume pipe culverts are cross drainage structures made of Hume pipes. 42 Abutments are the end support of the bridge structure and returns are provided
behind abutment to accommodate embankment for approaches to the bridge structure.
43 Head wall supports the Hume pipes along the roadway, while face wall supports the pipe along the waterway for cross drainage.;
Substandard work of Rs.2.22 crore was executed against the Specifications.
Execution of superfluous item resulted in excess payment of Rs.42 lakh.
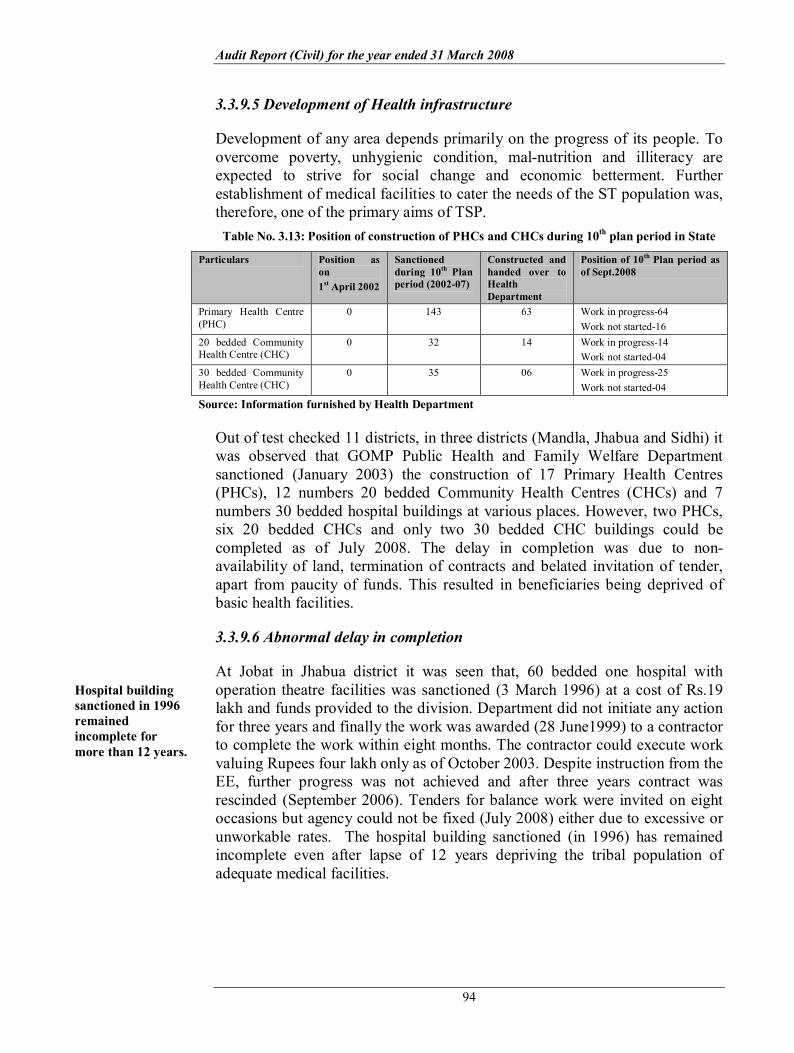
Audit Report (Civil) for the year ended 31 March 2008
94
3.3.9.5 Development of Health infrastructure
Development of any area depends primarily on the progress of its people. To overcome poverty, unhygienic condition, malnutrition and illiteracy are expected to strive for social change and economic betterment. Further establishment of medical facilities to cater the needs of the ST population was, therefore, one of the primary aims of TSP. Table No. 3.13: Position of construction of PHCs and CHCs during 10 th plan period in State
Particulars Position as on1 st April 2002
Sanctioned during 10 th Plan period (200207)
Constructed and handed over to Health Department
Position of 10 th Plan period as of Sept.2008
Primary Health Centre (PHC)
0 143 63 Work in progress64 Work not started16
20 bedded Community Health Centre (CHC)
0 32 14 Work in progress14 Work not started04
30 bedded Community Health Centre (CHC)
0 35 06 Work in progress25 Work not started04
Source: Information furnished by Health Department
Out of test checked 11 districts, in three districts (Mandla, Jhabua and Sidhi) it was observed that GOMP Public Health and Family Welfare Department sanctioned (January 2003) the construction of 17 Primary Health Centres (PHCs), 12 numbers 20 bedded Community Health Centres (CHCs) and 7 numbers 30 bedded hospital buildings at various places. However, two PHCs, six 20 bedded CHCs and only two 30 bedded CHC buildings could be completed as of July 2008. The delay in completion was due to non availability of land, termination of contracts and belated invitation of tender, apart from paucity of funds. This resulted in beneficiaries being deprived of basic health facilities.
3.3.9.6 Abnormal delay in completion
At Jobat in Jhabua district it was seen that, 60 bedded one hospital with operation theatre facilities was sanctioned (3 March 1996) at a cost of Rs.19 lakh and funds provided to the division. Department did not initiate any action for three years and finally the work was awarded (28 June1999) to a contractor to complete the work within eight months. The contractor could execute work valuing Rupees four lakh only as of October 2003. Despite instruction from the EE, further progress was not achieved and after three years contract was rescinded (September 2006). Tenders for balance work were invited on eight occasions but agency could not be fixed (July 2008) either due to excessive or unworkable rates. The hospital building sanctioned (in 1996) has remained incomplete even after lapse of 12 years depriving the tribal population of adequate medical facilities.
Hospital building sanctioned in 1996 remained incomplete for more than 12 years.

Chapter III Performance Reviews
95
3.3.9.7 Development of Educational Infrastructure Eklavya Model Residential Schools (EMRS)
With the objective of providing quality education to the tribal students, it was decided (199798) by Government of India to utilize a part of the funds under Article 275(1) of the Constitution of India for setting up of EMRS in the State. The GOI provides Rs.2.50 crore for construction of school building and associated infrastructure such as hostel for each EMR Schools.
During test check of 11 districts, in five 44 districts it was noticed that as against the target of five EMRS, only three EMRS (Mandla, Jhabua and Betul) were completed and remaining two EMRS (Dindori and Khargone) were incomplete because of delay on the part of the contractors for not giving proportionate progress though prescribed period of completion had expired.
View of incomplete EMRS building Khargone (As on February 2008)
On being pointed out the department replied that progress was satisfactory. Reply was contrary to the actual progress.
3.3.9.8 Noncompletion of hostel building
In Jhabua district it was observed that the division invited tenders for construction of 300 seated hostel building. The building was completed at a cost of Rs.1.70 crore and was handed over to TWD on 31 st March 2004. The Tribal Commissioner while inspecting the site ordered (19 th May 2004) the construction of one additional 50 seated block of hostel building. The work was awarded (December 2004) to a contractor at an estimated cost of Rs.0.29 crore but due to nonavailability of funds the work could not be completed. The funds (Rs.0.25 crore) were provided only on 10 March 2008. The 50 seated hostel block remained incomplete as of July 2008. On this being pointed out, the department admitted the facts.
3.3.9.9 Defective construction
The GOMP accorded (January 2002) sanction of Rs.1.81 crore for 350 seated hostels and Rs.2.38 crore (March 2003) for construction of school building and
44 Khargone, Mandla, Dindori, Jhabua and Betul
50 seated hostel building remained incomplete due to non availability of additional funds.

Audit Report (Civil) for the year ended 31 March 2008
96
staff quarters for EMRS Shahpura, district Betul. The works of construction of school and hostel were awarded to a contractor in 200304 and 200405. The EMRS, except 3 staff quarters was completed in April 2006. Scrutiny revealed that sanction for Rs.4.19 crore accorded by GOMP exceeded the norms of Rs.2.50 crore fixed by GOI. Further, the collector during inspection (August 2008) observed that the quality of work was poor as there were many defects such as cracks in walls, leakage from roof slab, breakage of septic tank and sanitary fittings causing overflow, lack of drainage system etc. indicating ineffective supervision and lack of quality control by the department.
On being pointed out EE stated (October 2008) that defects would be repaired from the earnest money of contractor available with the department.
3.3.9.10 Construction of Hostels for Girls and Boys
The scheme for construction of Girls Hostel was started during 3rd Plan period (196166). A separate scheme for construction of Hostel for ST Boys was launched in 198990. Both the schemes were merged into one scheme during the 10th Plan. The main objective of the scheme was to promote literacy among tribals by providing hostel accommodation to those tribal students who were not in a position to continue their education either because of the remote location of their villages or because of their poor economic conditions.
Table No. 3.14: Prematric and postmatric hostels constructed under TSP
Type of Institutions
Boys Girls Total
As on 1 st April 2002
As on 31 st March 2007
As on 1 st April 2002
As on 31 st March 2007
As on 1 st April 2002
As on 31 st March 2007
PreMatric Hostels
968 980 178 232 1146 1212
PostMatric Hostels
52 56 30 39 82 95
Total 1020 1036 208 271 1228 1307
The position of works allocated to PWD in the test checked districts was as under:
Ø Three Prematric Girls hostel buildings at Samnapur, Bajag and Amarpur block headquarters of Dindori districts were sanctioned (November 2006) by GOMP for Rs. 91.95 lakh. Scrutiny in audit revealed that the department failed to initiate any action for about 16 months as agency could not be fixed in respect of Samnapur and Bajag. Only one work at Amarpur was at initial stage (brick work) as of February 2008 after incurring an expenditure of Rs.0.14 crore deprived the tribal girls from availing the hostel facilities.
On this being pointed out it was stated (March 2008) that tenders were called for and were submitted to competent authority. However, approval was

Chapter III Performance Reviews
97
awaited. The reply indicated lackadaisical approach of the executing department.
Ø One postmatric and 3 prematric boys/girls hostel buildings were sanctioned (October 2003) for Rs.1.05 crore in Singarpur, Nainpur, Chiraidongri and Mandla of Mandla district. After incurring an expenditure of Rs.0.90 crore one work at Mandla remained incomplete as of March 2007.
This was indicative of the fact that Nodal Officer (TWD) as well as the implementing agency (PWD) failed to monitor the works effectively.
3.3.10 Impact Assessment
A detailed study 45 was carried out in the State in 1999 to understand the role of different types of public investments and their impact on poverty. The results show that government spending on productivity enhancing investments such as on irrigation, rural infrastructure (including roads), rural development etc. targeted directly to rural poor, have all contributed to reduction in rural poverty.
Test check in 11 districts 46 (9 tribal and 2 nontribal) of the State, however, revealed that despite substantial investment in infrastructure development under TSP, the number of ST families below poverty line (BPL) increased from 617644 (2002) to 687635 (2007), while the Human Development Indices (comprising of education, health and income as of 2005) of these districts were between 0.398 and 0.596 as against 0.710 and 0.680 in respect of developed urban areas of the State, thus negating the impact of government investments on infrastructure development.
3.3.11 Monitoring
According to the guidelines the State Government had to develop information system for smooth flow of information about all the projects/ schemes sanctioned/ implemented with TSP/central fund for effective monitoring. The monitoring mechanism was also to be strengthened at District and State level.
Scrutiny of records in 11 districts, however, revealed that though there was regular and smooth flow of information about the progress of sanctioned works at nodal department level as well as at apex level of sectoral departments, yet, there was lack of effective monitoring. The sectoral departments were unable to deal with the bottlenecks at field level such as delay in acquisition of land, nonavailability of funds, delays and defaults on the part of the contractors
45 By : Fan, Hazell and Thorat (1999) Source: Madhya Pradesh Human Development Report2007 46 Dhar, Khargone, Seoni Badwani , Mandla Sidhi, Katni , Jhabua,Sidhi,Sehore and Betul districts
Number of ST families below poverty line increased from 617644 (2002) to 687635 (2007) negating the impact.
Lack of effective monitoring at sectoral/departments level.

Audit Report (Civil) for the year ended 31 March 2008
98
resulting in under utilization/ nonutilization of assets created, abandonment of schemes due to planning weaknesses etc.
3.3.12 Conclusion
Despite the added thrust given to the TSP since 5 th Five Year Plan, planning and implementation suffered due to neglect of priority areas. Inadequate and inefficient monitoring resulted in non completion of schemes. Underutilization of created irrigation potential, inadequate infrastructure facilities related to education and health care and increase in number of family below poverty line etc. largely contributed to failure in delivering the expected improvement in socioeconomic conditions of the ST population. Poor fund management led to diversion of large amount to nontribal areas, and amount being kept in deposits, apart from nonutilization of TSP Funds during the 10 th Plan period.
3.3.13 Recommendations
Ø Government should ensure flow of funds for TSP in proportion to the tribal population in the State as well as its timely release to the implementing departments.
Ø Parking of funds in civil deposits may be discouraged. Diversion of TSP funds to nontribal areas/ schemes should not be allowed.
Ø The implementing departments may ensure proper system of planning for infrastructure development.
Ø Proper/ timely utilization of irrigation potential created may be ensured by the Government.
Ø Nodal/ Sectoral departments to streamline monitoring of TSP schemes for their effective implementation.
Ø Impact assessment on the socioeconomic development of beneficiary tribal population may be conducted periodically.

Chapter III Performance Reviews
99
WATER RESOURCES DEPARTMENT
3.4 Irrigation facilities in Narmada Tapti Basin
The Narmada Tapti (NT) Basin is the biggest river basin of the State of Madhya Pradesh (MP). It covers 13 districts 47 and 24.9 per cent of total 308245 sq.km area of the State.
Ø Up to March 2003, net sown area (NSA) was 43.77 lakh hectare (ha) (29.23 per cent of the State) and irrigation potential created was 2.58 lakh ha (11.72 per cent of the State)
Ø During 200308 additional potential of only 0.22 lakh hectare could be created.
The NT Basin is under the administrative control of the Water Resource Department (WRD) headed by the Principal Secretary at Government level. The EngineerinChief (EinC) is the technical advisor and head of the department with seven basins headed by the Chief Engineers (CE). The CE in charge of NT basin has five Circles headed by the Superintending Engineers (SE) and 21 Divisions headed by the Executive Engineers (EE).
3.4.1 Planning
During 200308, a total of 434 irrigation projects (including ongoing Mahi major project) were taken up for construction in the NT Basin at an outlay of Rs.889.03 crore. It aimed to create an additional irrigation potential of 1.02 lakh ha. Till March 2008, 108 projects were completed after incurring an
47 Indore, Ujjain, Ratlam, Dhar, Mandsaur, Neemuch, Jhabua, Khargone, Badwani, Khandwa, Burhanpur, Dewas, and Shajapur
Out of 434 projects targeted to be completed during 200308, only 108 projects could be completed. Work of 104 projects was not started.

Audit Report (Civil) for the year ended 31 March 2008
100
expenditure of Rs.181.83 crore and 22033 ha. additional irrigation potential was created.
222 projects remained incomplete due to delay in land acquisition/ compensation, slow progress of work by contractors, opposition by cultivators, delay in obtaining Government of India’s (GOI) approval because of involvement of forestland, technical unfeasibility, high cost of construction and nonsanction of revised estimates. Work in case of 104 projects has not been taken up. Out of 2.80 48 lakh ha. irrigation potential created as on March 2008, only 0.71 lakh ha potential could be utilized and balance remained unutilized due to various reasons like no irrigation for kharif crop, changes in cropping pattern, scanty rain fall, water kept reserved for drinking purpose and deteriorating conditions of dams and canals.
The funding of the projects was obtained from the State Plan fund, Tribal Sub Plan (TSP), loan from National Agriculture Bank of Rural Development (NABARD), Special Central Assistance under article 275 (i), Special Component Plan (SCP) and Accelerated Irrigation Benefit Programme (AIBP). Status of the projects with reference to their sanctioned cost, expenditure incurred, designed irrigation potential and irrigation potential created is shown in Appendix 3.14. In addition to above 434 projects, Government of Madhya Pradesh(GOMP), WRD had undertaken the survey work of 382 projects but work on these projects could not be sanctioned or started due to various reasons as tabulated below as on 31 st March 2008.
Table No. 3.15: The physical progress of survey work of the projects (Rupees in crore)
Sl No.
No. of Schemes
Sanctioned cost
Designed irrigation potential (ha)
Present status Remark
1 116 1011.44 81245 Surveyed between January 1990 and January 2007
DPRs submitted between March 2003 and February 2008 but sanctions are awaited (March 2008) from the GOMP, WRD
2 21 53.72 4418 Surveyed between November 2003 and January 2007
Proposed to drop due to high cost of construction. The approval was awaited (March 2008) from the GOMP, WRD.
3 20 231.35 20112 Surveyed between January 2004 and March 2006
Forest affected and some were rejected by the Standing Committee due to high cost of compensation for forestland.
4 33 54.22 5287 Surveyed between November 2003 and March 2006
Proposed to drop due to their technical unfeasibility and command overlapped. The orders for dropping was awaited (March 2008) from the GOMP, WRD.
5 28 59.68 5691 Though survey works were reported complete but DPRs could not be prepared by March 2007.
The instructions (November 2006) of Minister of WRD were not complied.
6 164 Schemes were identified for
Survey work not started.
48 Irrigation potential created by March 2003 was 2.58 lakh hectares and additional 0.22 lakh hectare was created during 20032008.

Chapter III Performance Reviews
101
survey.
The plan conceived to create additional irrigation potential could not be delivered despite clear instructions (November 2006) of the GOMP, WRD to complete the work and get the projects sanctioned with NABARD loan by March 2007. The progress was tardy due to lackadaisical approach of the divisional officers as reflected in the table above .
3.4.2 Financial Management
3.4.2.1 Diversion of funds under Special Component Plan
Central assistance is received under Special Component Plan (SCPgrant no. 64) for construction of projects in the area where scheduled castes (SC) beneficiaries are more than 50 per cent. Scrutiny revealed that due to less number of projects/slow progress of projects under SCP grant no. 64, there was savings of Rs.19.15 crore. EinC (December 2006), and GOMP,WRD with a view to utilize that savings directed (May 2007) to debit the cost of other (non SCP grant) projects to SCPgrant no.64 in the ratio of SC beneficiaries under the project. Thus Rs.11.43 crore and Rs.6.75 crore were spent against the allotment of Rs.12 crore and Rs.7.15 crore during 200607 and 200708 respectively under SCPgrant no. 64/4702 on other projects sanctioned under non tribal grants. The investment clearance of these projects by the State Planning Board was also under non tribal grants other than SCPgrant no. 64.
This resulted in diversion of central assistance of Rs.19.15 crore.
3.4.2.2 Expenditure of major project to medium project and medium to minor project
In a number of cases as shown in the following table, department debited allotment and expenditure of the projects from one category to another category though it was not permissible.
Table No. 3.16: Incorrect classification of allotment and expenditure of the projects
S.No Name of the project Period Amount (Rupees in crore)
Where the amount was wrongly debited
Correct debit head
1 Mahi major project, Petlawad
March 2008
210.57 Grant no. 41/4701 (Medium)
Grant no. 41/4700 (Major)
2 Chambal,Gandhisagar Mandsaur (major) and Sukta, Khandwa (major)
200203 13.45 Grant no. 23/2701 Non Plan (Medium)
Grant no. 23/2700 (Major)
3 Retam Barrage, (medium) Mandsaur
July, 2006 4.49 Grant no. 64/4702 (Minor)
Grant no. 45/4701 (Medium)
The CE stated (May 2008) that expenditure on Mahi major Project was incurred as per budget provided by the Tribal/Finance department. Expenditure on Retam Barrage was not included as a medium project in the supplementary
Savings of Rs. 19.15 crore during 200608 under Special Component Plan relating to SC beneficiaries was wrongly utilized on other projects.
Audit Report (Civil) for the year ended 31 March 2008
102
budget for 200607 which was lapse on the part of department. The CE did not explain, why funds could not be demanded as per approved classification of projects.
3.4.2.3 Irregular utilization of AIBP funds
The project wise allotment was released by the Government of India (GOI), Ministry of Water Resources (M/o WRD) under AIBP during 200708. As per the AIBP guidelines, the savings of one project was not permitted to be utilized on other projects. However, scrutiny in audit revealed that there was savings of Rs.17.24 crore of 24 projects, out of which Rs.4.40 crore was utilised on 11 projects other than for which the amount was sanctioned. Similarly, savings of Rs.7.24 crore of seven projects was utilized to cover excess Rs. 6.64 crore spent on 10 different projects as shown in Appendix 3.15.
The CE stated (May 2008) that amount was spent as per actual execution of works. The reply was not in consonance with the AIBP guidelines.
3.4.3 Execution
3.4.3.1 Major and medium project
3.4.3.2 Mahi major project
Mahi major project was sanctioned (March 1981) at an outlay of Rs.27.10 crore to create additional irrigation potential of 26430 ha in Dhar and Jhabua districts and to meet (51.640 mcft 49 ) drinking water and industrial water requirements of Ratlam. The cost of the project was revised to Rs.61.52 crore in 1985 under VI th Five year plan. The work which was awarded in October 1991 was stopped in May 1993 due to paucity of funds.
Fresh work order was issued (October 2002) to complete the balance work by March 2006. The work was in progress till March 2008 and the contractor’s 68 th running account bill of Rs.29.79 crore was paid (March 2008). The Division had admitted (April 2008) that the work has been delayed for 2 years and the cost of the project had shot up due to slow progress of rehabilitation and resettlement (R and R) work, revision (December 2002) of R and R policy by the GOMP, delayed cooperation of Revenue authorities in land acquisition, hindrance by project affected people, delayed receipt of construction drawing from Central Water Commission (CWC), substantial increase in quantities of masonry and concrete work due to changes suggested by the Geological Survey of India and CWC as per model studies.
49 Million cubic feet
Unutilised funds of Rs.11.04 crore under AIBP was incorrectly utilized on other projects.

Chapter III Performance Reviews
103
The contractor requested (July 2007) for the foreclosure of the work as he was unable to execute the excess quantities due to low quoted rates. Agenda note to foreclose the contract and award of additional quantities of work costing Rs.20.43 crore to some other contractor under separate agreement was sent (February 2008) to the EinC but decision was awaited (November 2008). Rs.283.18 crore was spent against revised (August 2002) sanctioned cost of Rs.203.56 crore. The sanction of further revised cost of Rs. 360.52 crore was awaited (June 2008).
Thus, the decision of apex body to revoke the old agreement proved imprudent. Therefore, target for completion of the much needed project under AIBP could not be achieved. Rather it resulted in a loss of Rs.2.22 crore (Interest of Rs. 1.67 crore on advances given to contractor and burden of Rs. 0.55 crore as royalty charges payable by the contractor was waived of).
3.4.3.3 Retam Barrage medium project
Retam Barrage in Mandsaur was initially sanctioned (October 2003) by the GOMP, WRD as minor project at an outlay of Rs.22.75 crore 50 though it had a cultivable command area of 3360 ha. (more than minimum area limit of a medium project). The project was taken up late (2006) due to delay in deciding the classification of project as a minor or medium project. The project was sanctioned with NABARD loan (Tranche XII) of Rs.32.06 crore in September 2006 after GOMP, WRD accorded the revised sanction as a medium project in July 2006. The project was neither examined nor cleared through CWC and Planning Commission as required under Para 2.026 (ii) Medium Projects of Works Manual. Eighty per cent dam work was reported completed on which Rs. 34.99 crore was spent as of March 2008. The canal work has not yet started.
3.4.3.4 Minor Irrigation Projects
432 minor irrigation projects were sanctioned between 200203 and 200708 at an estimated cost of Rs. 856.97 crore to create additional irrigation potential of 0.99 lakh ha. 108 projects were reported complete at a cost of Rs. 181.83 crore, 220 projects were still in pipeline on which Rs.307.77 crore was spent as of March 2008. The work of 104 projects was not started.
3.4.3.5 Expenditure in excess of sanctioned cost
46 projects were sanctioned between 200203 and 200708 at an estimated cost of Rs.110.22 crore. Revised estimates of Rs.158.61 crore of these projects were submitted in 200608 but approval was still awaited (November 2008).
50 under grant no. 45/4702
Delay in deciding the classification of the project resulted in cost over run. The project was not got cleared by CWC.
Rs.35.27 crore were spent in excess over sanctioned cost of 46 projects.
Rs.2.22 crore payable by the contractor was waived of thereby an undue favour to the contractor.

Audit Report (Civil) for the year ended 31 March 2008
104
The increase in cost of Rs.48.39 crore 51 was due to delay in completion, unrealistic estimation of land compensation, inaccurate or inadequate estimation and execution of unapproved items. An amount of Rs.145.49 crore was spent (March 2008) on these projects, still in progress resulting in excess expenditure of Rs.35.27 crore as compared to their sanctioned cost (Rs.110.22 crore).
The GOMP, WRD had prescribed ceiling cost of Rupees one lakh per ha. Thus the cost of construction in above cases would exceed the prescribed ceiling limit thereby disturbing the BC ratio 52 and ERR 53 of the projects. Moreover, while according administrative approval by the GOMP, WRD no time schedule was prescribed for completion of the projects, which had resulted in denial of irrigation facilities to the cultivators.
3.4.3.6 Projects with lapsed sanction
As per Para 2.124 of M P Works Department Manual, if the construction work does not commence within three years of its being sanctioned then fresh administrative approval and technical sanction requires to be obtained. Four minor projects 54 sanctioned between March and June 2003 at an outlay of Rs.3.48 crore to create additional irrigation potential of 554 ha. were taken up for execution between October 2006 and April 2007 under AIBP although the sanctions had lapsed.
3.4.3.7 Blockade of investment
21 minor projects 55 were taken up with NABARD loan during 200308. One of the conditions of loan was that nalla closure works should be taken up only after completion of 75 per cent of canal components. However, in violation of that, the department had completed nalla closure work first before taking up canal construction. Therefore, progress of the canal construction suffered and also resulted in blockage of interest bearing loan of Rs.39.95 crore. The CE admitted (May 2008) that the dam and canal work could not be completed simultaneously and stated that progress of canal suffered due to delay in land acquisition.
51 Revised estimates for Rs.158.61 crore ( ) original cost Rs.110.22 crore = 48.39 crore.
52 Benefit cost ratio i.e. annual benefits from agriculture production and annual cost of project.
53 Economic rate of return i.e. increase in agriculture production as a result of irrigation as compared to investment on construction of irrigation project.
54 Kadwal tank (Rs.99.20 lakh) Jhabua, Chagola tank (Rs.65.70 lakh) Jhabua, Dharia Tank Rs.99.20 lakh), Bamjhar tank Rs.84.85 lakh) Khandwa
55 Jhabua01, Khargone05, Badwani02, Mandsaur06, Shajapur01, Indore02, Burhanpur 01,Alirajpur01, Dhar02
Rs. 39.95 crore spent remained blocked due to non completion of canal component of 21 projects.
Chapter III Performance Reviews
105
3.4.3.8 Unfruitful Expenditure
The Forest Conservation Act, 1980 lays down that prior permission for transfer of forest land coming under any project should be obtained before taking up work. It was however observed that 53 projects 56 with an outlay of Rs.172.22 crore were sanctioned by the GOMP, WRD between May 1980 and May 2007 without obtaining permission for transfer of forestland. The projects could not be materialised due to non transfer of 837.531 ha forestland. Besides denial of irrigation facility, the cost of the projects increased to Rs.213.35 crore due to time and cost over run and high cost of compensation for forestland. This included 11 projects taken up with interest bearing NABARD loan and four projects under AIBP. The expenditure of Rs.32.11 crore incurred as of March 2008, therefore proved unfruitful till clearance of forest land.
3.4.3.9 Unrealistic expectations from small cultivators
GOMP, WRD decided (March 2000) not to construct canals in minor irrigation schemes (CCA from 40 ha to 200 ha) with the expectations that the cultivators should make their own arrangement for lifting the water from the reservoir to their fields and also should pay the water tax. Though willingness of cultivators was obtained but no legal action can be initiated against them in case of refusal in future. Rupees 23.42 crore were spent (March 2008) on 44 projects 57 still in progress as against the sanctioned outlay of Rs.29.09 crore with no provision of canals. Most of these projects are located in the backward districts of MP thickly populated by tribal inhabitants. Moreover, with a view to increase the utilization of irrigation potential already created, NABARD and Government of India insisted on constructing field channels along with the minor canals to facilitate the carrying of water to the fields of cultivators from the reservoir for irrigation under National Rural Employment Guarantee Programme (NREGP). The EngineerinChief apprehended (February 2008) that poor and small cultivators would be the worst to get affected by this arrangement.
3.4.3.10 Substandard work
Rudaheda project in Ujjain, which was sanctioned with NABARD loan (2002 03) at an outlay of Rs.4.10 crore to irrigate 482 ha breached between RD 370 M and 455 M during heavy rains on 10/11 August 2006. The CE in his inspection note (01 September 2006) attributed the breach of dam due to execution of substandard nalla closure work in June 2005. However, the contractor was never inzformed about execution of substandard work.
56 Jhabua 05, Khargone 12, Badwani 05, Mandsaur04, Shajapur01, Indore03, Burhanpur01,Dhar09, Khandwa01, Neemuch08, Ratlam03, Dewas01
57 Ujjain13, Indore9, Neemuch9, Jhabua4, Alirajpur3, Dewas, Dhar and Khargone 2 projects each.
Rs.32.11 crore spent on 53 projects was unfruitful due to non transfer of forestland.
44 projects constructed at a cost of Rs.23.42 crore without canal component did not meet the objectives of the project.
Execution of sub standard work of Rudaheda project and Chambleshwar tank did not yield projected benefits. Sanctions of Rs.1.32 crore for remedial measures were awaited.

Audit Report (Civil) for the year ended 31 March 2008
106
Similarly, Chambleshwar tank in Neemuch was reported as completed in June 2003 at a cost of Rs.16.51 crore with NABARD loan. The leakage of water from canal structures and syphon joints due to execution of substandard work was noticed while starting irrigation for the first time during 200506. Consequently 900 ha area could only be irrigated against created potential of 1567 ha.
An estimate of Rs.1.32 crore (Rudaheda tank Rs.75.32 lakh in September 2007 and Chambleshwar tank Rs. 56.32 lakh in December 2007) was sent to EinC for remedial measure of both the projects. However, the required approvals were awaited (May 2008).
3.4.3.11 Wasteful expenditure
Ninety lift irrigation schemes (LIS) were completed at an investment of Rs.27.98 crore to irrigate 18740 ha between 1973 and 2006. Dismal performance of LIS due to high cost of maintenance and non availability of pool of water was mentioned in Para 3.4 of C&AG Report for the period ending March 2006. As a sequel to it GOMP, WRD decided (August 2007) to make all the LIS functional. As per EinC only 11 LIS were made functional in NT Basin. The CE proposed (October 2007) 46 LIS for revival, 18 LIS for abandonment as their revival was not possible due to nonavailability of pool of water and cultivators were not willing to bear high cost of maintenance. The fate of remaining 15 LIS was not decided (October 2008). Rupees 3.28 crore were spent against allotment of Rs 4.23 crore provided for repair of LIS between 200304 and 200708. The expenditure on LIS thus proved to be nugatory as no impact or extent of irrigation generated was available from LIS record.
Further, Ahukhana LIS sanctioned (January 1987) at an outlay of Rs.24.87 lakh remained incomplete (September 1994) even after spending Rs.1.01 crore. The cost has been revised from Rs.24.87 lakh to Rs.1.39 crore (December 1992) due to time and cost over run, addition of new items as well. The revised sanction was awaited (May 2008). Meanwhile the steel foot bridge got washed away (September 1994) and pumps & accessories costing Rs.12.26 lakh were reported stolen (February 2004). The work has not been restored (June 2008) thereby rendering an expenditure of Rs.1.01 crore infructuous.
3.4.4 Contract Management
3.4.4.1 Extra cost
The EinC has specifically directed (May 2002) that for minor irrigation projects the work of dam and canal should be awarded under the same agreement. Scrutiny in audit revealed that department had awarded separate tenders for dam and canal works of 6 projects due to delay in land acquisition for canal and delay in approval of canal alignment. Thus due to acceptance of
Performance of 90 LIS was dismal due to no pool of water and high cost of maintenance. 46 LIS only were proposed for revival. Rs.3.28 crore spent on repair did not yield and fruits.
Chapter III Performance Reviews
107
separate tenders at higher rates, between 200506 and 200708, the department had incurred an extra cost of Rs.75.88 58 lakh
3.4.4.2 Arbitrary allotment and expenditure on annual repair of projects
As per Works department Manual, allotment for annual repair was to be provided projects wise and sub head wise as per norms depending upon the utilization of irrigation potential created and potential that remained unutilized.
Scrutiny revealed that during 200208 the department has spent Rs.93.33 crore on annual repair of irrigation projects. Out of which Rs.63.06 crore (67 per cent) was spent on wages, Rs.8.87 crore (9.5 per cent) was paid to Water User Associations (WUAs) and only an amount of Rs.21.4 crore (23.5 per cent) was utilized for annual repairs. The precious work of maintenance of all the components of the projects was not attended. Consequently canals, canal structures, project and colony roads and colony buildings have been deteriorating day by day. The roads have lost their crust & camber and require strengthening and repairs.
Moreover, sufficient allotment for annual repair was not included/provided for. CE admitted (May 2008) that with the meagre maintenance allowance, no planning was possible. The huge expenditure on payment of wages could not be avoided. The EinC also intimated that norms of maintenance were under revision.
3.4.4.3 Under utilization of created irrigation potential
According to reply (March 2002) to Assembly Question No. 179 furnished (March 2008) by CE, the NSA and the irrigation potential created was steeply reduced from 43.77 lakh ha (during 200206) to 40.42 lakh ha and from 2.83 lakh ha to 2.05 lakh ha respectively. With a view to make the project financially viable and keep the cost of construction with in the prescribed ceiling cost per hectare the projection of benefits were made on higher side and found to be unrealistic. Though there was no demand of irrigation for kharif crop and cultivators have not adopted new cropping pattern and new techniques of cultivation even than it continued to be projected while getting the sanctions from GOMP, WRD. Thus the wide gap between the potential created and utilized persisted. The EinC however attributed short utilisation to various constraints like scanty rainfall, conventional cropping pattern, water kept reserved for drinking purpose and deteriorating conditions of dams and canals.
58 Parsali tank, (Rs.56.90 lakh), Tungi tank (Rs.3.68 lakh), Paroniya tank (Rs.3.15 lakh), Ralayta tank (Rs.3.36 lakh) and Gajakhedi tank (Rs. 2.38 lakh) in Mandsaur and Kharbardi tank in Manawar (Rs.6.41 lakh)
The maintenance of projects was not satisfying due to insufficient allotment and huge expenditure on wages as well.
Audit Report (Civil) for the year ended 31 March 2008
108
3.4.4.4 Work against invalid contract
Kiradiya tank, Manawar (sanctioned in August 2003) was taken up with NABARD loan (December 2003) at a cost of Rs.2.27 crore. Tender was accepted (27 th May 2004) by the CE in favour of a contractor at his tendered cost of Rs.1.54 crore. The tenderer ‘A’ failed to sign the agreement and furnish the performance security of Rs.6.75 lakh within a fortnight of receipt of communication of acceptance of his tender. Instead of cancelling the tender and forfeiting the earnest money, the agreement was signed after a gap of nearly 5 months and work order was issued to the same contractor on 30 th November 2004. The matter was referred (November 2004 and October 2005) to GOMP, WRD by the CE for condonation of the irregularity but there was no response. Thus it was irregular to get the work executed against invalid contract. The CE had justified it to possibility of higher rates and delay on re tender. The reply was not in consonance with the conditions of the tender.
3.4.4.5 Irregular utilization of NREGP fund
National Rural Employment Guarantee Programme (NREGP) aimed to provide employment and create new assets. Scrutiny in audit however revealed that 50 works of regular maintenance of canals in Manawar were executed during 200708 under NREGP at a cost of Rs.1.86 crore against the guidelines of NREGP. The works were to be executed out of annual maintenance grant.
3.4.5 Unauthorized retention of workman welfare cess under civil deposits
According to the Madhya Pradesh Building and Other Construction Labour Welfare Act, one per cent Cess was to be deducted from the payments made to contractors for construction work. The amount of cess realised was to be remitted to the Secretary, Building and Other Construction Labour Welfare Board, Bhopal through demand draft by the end of the month. Test check of monthly accounts and Deposit Register revealed that welfare cess of Rs.1.08 crore realised during 200607 and 200708 was kept under civil deposit instead of remitting it to the Welfare Board.
The Executive Engineers admitted (April 2008) that due to nonentry of amount lying under Civil Deposits in the Central Server in District treasuries the amount of cess could not be remitted.
3.4.6 Irregular purchase
According to Central Public Works Account Code and Works Manual the cost of purchase of ordinary tools and plant (T & P) against sanctioned estimate and allotment is charged to the minor head T & P. Scrutiny revealed that purchase of survey instruments for Rs.71.45 lakh and GI corrogated sheets for Rs.6.36
The contractor was allowed to sign the agreement and execute the work against invalid contract.
Chapter III Performance Reviews
109
lakh was irregularly made by debiting the amount to works under NABARD and AIBP instead of minor head T & P as their was no provision in the sanctioned estimates of the works under NABARD/AIBP.
3.4.7 Unadjusted Suspense Account
Rupees 1.48 crore under Cash Settlement Suspense Account (originating items Rs.46.19 lakh and responding items Rs.1.02 crore) and Rs.98.28 lakh under Material Purchase Suspense Account was lying unadjusted since 1970. The matter was reported to the Government (June 2008); and the reply is awaited (July 2008).
3.4.8 Conclusion and recommendation
The irrigation projects undertaken in the NT basin during 200308 could create 21.56 per cent of the targeted irrigation potential due to noncompletion of 75 per cent of the projects. Moreover, utilization of irrigation potential created was 27.5 per cent. Rs.35.27 crore was spent in excess over sanctioned cost of 46 projects. Rs.39.95 crore spent remained blocked due to non completion of canals of 21 projects. Rs.32.11 crore spent on 53 projects was unfruitful due to non transfer of forestland. 44 projects constructed at a cost of Rs.23.42 crore without canal infrastructure did not meet the objectives of the project. Annual maintenance and repair works were not attended properly due to inadequate allotment of fund on maintenance.
In view of above, audit recommends that:
Ø The department may focus on increasing utilization of irrigation potential created.
Ø The department may take necessary steps to revise allotment on annual repairs in order to cover maintenance of all components of the projects.

Chapter IV Audit of Transactions
111
CHAPTER IV
Audit of Transactions
4.1 Fraud/Misappropriation/Embezzlement/Losses
Public Health Engineering Department
4.1.1 Fraudulent withdrawals from General Provident Fund
Fraudulent withdrawals from General Provident Fund amounting Rs.3.97 lakh in the office of the Executive Engineer, Public Health Engineering Division, Bhopal was facilitated due to nonexercising of prescribed checks by DDO/TO.
As per Rule 15 and 16 of Madhya Pradesh General Provident Fund (GPF) Rules 1965, a subscriber has to apply to the Drawing and Disbursing Officer (DDO) concerned for Temporary Advance/Part Final Withdrawal from his GPF Account. After the amount of advance/part withdrawal is sanctioned by the DDO, a bill is prepared and sent to Treasury for passing and issuing cheque to DDO for disbursement.
Further Rule 165 of Madhya Pradesh Treasury Code stipulates that Treasury Officer should take special care in cases where any additions/ alterations in bills/documents are observed. He should not accept and authorize the payment on any document/bill with any overwriting or cutting. Similarly, Rule 12 of Madhya Pradesh Financial Code stipulates that Controlling Officer is responsible for prevention and detection of errors and irregularities and to guard against loss.
Scrutiny of debit vouchers for the months October 2006 and August 2007 to October 2007 relating to Public Health Engineering Division, Bhopal revealed that withdrawals from GPF account as given in the following table were passed by the Treasury Officer, District Treasury Bhopal and disbursed by the DDOthe Executive Engineer, Public Health Engineering Division, Bhopal despite overwriting on the bills. Audit also observed that the bills were supported by fake sanction orders.
Vr. No.
Month/ Year
Voucher Amount
Name of Subscriber affected Series & Account No. Fraud Amount (Rs.)
89 10/2006 1,25,000 S.K. Malviya PHE105709 1,25,000 49 08/2007 1,50,000 Pradeep Kumar Saxena PHE104370 1,35,000 16 09/2007 1,47,000 O.P. Tiwari PHE104508 47,000 25 10/2007 1,08,500 Mohan Singh Thakur PHE107185 90,000
Total 3,97,000
Audit Report (Civil) for the year ended 31 March 2008
112
When pointed out, the Executive Engineer, Public Health Engineering Division Bhopal (March 2008) confirmed the fraudulent withdrawals by tampering/manipulation of the original sanction orders and related vouchers by an official of the division. Fraudulent withdrawals to the tune of Rs.3.97 lakh were thus made as detailed above.
The Executive Engineer also intimated that out of total fraudulent withdrawal of Rs.3.97 lakh, an amount of Rs.1.82 lakh has already been deposited into treasury through challan (February 2008).
Thus failure of the Treasury Officer, District Treasury Bhopal and the concerned DDO to exercise the required checks on bills facilitated fraudulent withdrawal of funds.
The matter was referred (September 2008) to the Finance Department; reply had not been received (October 2008).
School Education Department
4.1.2 Loss due to excess procurement of books
Excess requisition of books by DPC, Shajapur, resulted in loss of Rs.53.98 lakh
Under Sarva Shiksha Abhiyan, free text books are distributed to all students from class one to five and also to all the girls and boys belonging to SC/ST/ BPL families, studying in class six to eight in Government schools.
Scrutiny (March 2008) of records of District Project Coordinator (DPC), Zila Shiksha Kendra, Shajapur revealed that the textbooks were requisitioned far in excess of the number of students enrolled in each class every year during 2003 04 to 200708 which resulted in books costing Rs.53.98 lakh lying undistributed as mentioned below:
Session No. of students enrolled
Set of books requisitioned and received
Set of books distributed
Set of Books lying undistributed
Cost of books lying undistributed (Rupees In lakh)
200304 141060 155359 141060 14299 6.77 200405 164002 180826 164002 16824 7.67 200506 159180 191356 159180 32176 19.57 200607 171521 178305 176275 1 2030 0.81 200708 162220 177600 157466 20134 19.16 Total 85463 53.98
Further no action was taken to transfer the excess books to other districts/ schools where these books could have been used for students.
1 Out of 176275 sets, 4754 sets were distributed during 200708.
Chapter IV Audit of Transactions
113
On this being pointed out in audit, the Government stated (July 2008) that the district offices had requisitioned the books on estimated requirement and the undistributed books were kept safely and utilized in the session 200708. The reply was not acceptable as the distribution statement for the year 200708 indicated that only 4,754 sets were utilized during 200708. Further DPC informed (AugustSeptember 2008) that the syllabus was changed during 200506 and 200708 academic session. Undistributed books lying at district office (weight 5 tonnes) were sold (September 2005) as unusable material (raddi) at a cost of Rs.20,450 and 22,143 undistributed sets lying at block level offices are in process of sale as unusable material.
Thus, the requisition of books on the basis of the estimates instead of actual enrolment of students and non adjustment of number of undisbursed books of preceeding year from the requisition of succeeding year was not only injudicious but also resulted in loss of Rs.53.98 lakh to Government.
4.2 Excess/Wasteful/Infructuous/Unfruitful expenditure
Finance Department
4.2.1 (A) Excess payment of Rs.94.14 lakh to family pensioners
Due to non observance of instruction of Director Treasuries and Accounts by Treasury Officers, excess payment of Rs.94.14 lakh to family pensioners by banks could not be prevented.
As per rule 47 of M.P. Pension Rules, family pension at enhanced rate is payable for a period of seven years or till the date on which the Government Servant would have attained the age of 67 years, had he survived, whichever is earlier. In order to ensure that no excess payment of pension is made by the nationalized banks to the pensioners/family pensioners, Director, Treasuries & Accounts, Madhya Pradesh, Bhopal had instructed (August 2000) all Treasury Officers in Madhya Pradesh to check two per cent of the total number of pension cases in the district every month and to maintain a register in the prescribed format to record the results of checking. In case difference between the amount of pension calculated by the treasury and the amount paid by any bank’s branch is noticed in more than one per cent cases, the entire pension cases of the bank’s branch were to be examined in detail.
Scrutiny of the records relating to pension payments in 34 out of 53 treasuries in the State revealed that the register in the prescribed format showing the result of prescribed check was not maintained in treasuries. It was also seen that the nationalized banks continued to make payment of family pension at enhanced rates to the family pensioners even after the specific date in terms of provisions of Rule 47 of M.P. Pension Rules. This resulted in excess payment
Audit Report (Civil) for the year ended 31 March 2008
114
of family pension amounting to Rs.94.14 lakh to the family pensioners as detailed in the Appendix 4.1. Had the Treasury Officer observed the ibid instruction, the excess payments could have been avoided.
Nonobservance of orders issued by the Director, Treasuries and Accounts by the Treasury Officers and consequent excess payment of Rs.94.14 lakh to 477 pensioners during the period from July 1998 to March 2008 was communicated from time to time to the concerned treasury officers through the inspection reports of the concerned treasuries, State Finance Department and Commissioner Treasuries and Accounts, M.P., Bhopal. But only Rs.17.23 lakh were recovered so far.
Matter was referred to Government in March 2008; reply had not been received (November 2008).
(B)Non recovery of overpayment of commuted value of pension of Rs.78.14 lakh from Pensioners
Overpayment of Rs.78.14 lakh made to pensioners due to wrong interpretation of Rule 8 of M.P. Civil Pension (Commutation of Pension) Rules 1996 was not recovered despite instructions of Finance Department.
As per provisions of Rule 8 of M.P. Civil Pension (Commutation of Pension) Rules 1996 the pensioner will get commuted value of Pension as per table given there under. Government of Madhya Pradesh, Finance Department clarified (October 2002) that calculation of commuted value of pension is to be done keeping in view the value of pension at the age and the year in which reduction in pension has started. It was also directed that recovery may be made in cases where overpayment was made due to wrong interpretation of rule 8 of M.P. Civil Pension (Commutation of Pension) Rules 1996. Special attention was to be given in cases of pensioners who retired after January 1996 and whose pension was revised after 1 March 1998 wherein revised commuted value was also paid (as per recommendation of Fifth Pay Commission).
Out of total 53 treasuries in Madhya Pradesh the scrutiny of the records of 36 treasuries revealed that an over payment of Rs.78.14 lakh was made to the pensioners due to payment of commuted value of pension at the rates applicable on the dates of retirement instead of at the rates applicable on the date from which reduction of pension was actually started (Appendix 4.2). It was further observed that the recovery of such overpayments has not been made so far despite Finance Department’s clear instructions.
The matter regarding non recovery of overpayment of commutation of Pension was brought to the notice of Government (October 2008); the reply had not been received (November 2008).

Chapter IV Audit of Transactions
115
Narmada Valley Development Department
4.2.2 Excess payment for watering and compaction of earth work
Double payment for watering and compaction of earthwork resulted in excess payment of Rs.38.98 lakh.
Balance work 2 of Right Bank main canal of Bargi Diversion project in reduced distance (R.D.) Km. 42.00 to 50.00 was awarded (September 2004) to a contractor on an item rate contract at tendered rate of Rs.25.43 crore (evaluated at 16.61 per cent above the estimated cost). The work scheduled for completion by August, 2005 was still in progress (March 2008) and payment amounting to Rs.23.81 crore was made to the contractor in July 2008 for his 37 th running bill.
Item 4 (a) of the Schedule of quantities, forming part of the agreement, provided earth work for bund and canal embankments as per dam specifications. It included all lead and lifts of materials and all other charges for watering and compaction of earth work at optimum moisture content (OMC) to achieve dry density not below 90 per cent by sheep foot roller (SFR) as per specifications. The contractor quoted a rate of Rs.63 per cum for this item. Item 4 (a) was for execution of earth work using borrowed soil including watering and compaction of earth work.
Another item 4(b) provided watering and compaction of earth work at OMC to achieve dry density not below 90 per cent by SFR as per specifications and as directed by Engineersincharge. The contractor quoted a rate of Rs.18 per cum for this item. Item 4 (b) was meant for watering and compaction of embankment constructed with soil obtained from canal excavation.
Scrutiny (June 2007) of records of Executive Engineer (EE), Narmada Development Division No.1 Panagar district, Jabalpur, revealed that the contractor executed 216535.80 cum earth work for canal embankments using borrowed soil and was paid Rs.1.36 crore @ 63 per cum under item 4 (a) which was inclusive of the item of watering and compaction. He also executed 53990.72 cum of earthwork with soil obtained from canal excavation under item 4(b). The item of watering and compaction for this quantity was payable at Rs.18 per cum only. However, watering and compaction of 216535.80 cum of borrowed soil was again included in the total quantity (i.e. 270526.52 3 cum) of watering and compaction under item 4 (b).
2 Of excavation, earth work cement concrete lining and construction of structures of minors and distribution system
3 270526.52 cum = 216535.80 cum + 53990.72 cum

Audit Report (Civil) for the year ended 31 March 2008
116
Thus payment for watering and compaction of 216535.80 cum earth work was made twice. This resulted in excess payment of Rs.38.98 lakh to the contractor.
The Government accepted the audit observations and directed (August 2008) to recover the excess payment from the bills of the contractor. However, the recovery particulars are awaited (November 2008).
Panchayat and Rural Development Department
4.2.3 Nugatory expenditure due to incorrect selection of road
PMGSY road work executed on railway lands without obtaining permission from Railway Authorities, had to be abandoned mid way resulting in nugatory expenditure of Rs.39.82 lakh.
According to Government of India’s guidelines for Pradhan Mantri Gram Sadak Yojana (PMGSY), the prime objective of the scheme is to provide connectivity by all weather roads to unconnected rural habitation. Madhya Pradesh Rural Road Development Authority (MPRRDA) is the nodal agency for implementation of PMGSY in the State.
According to the approved estimates, for PMGSY package no. MP 2003 of district Katni, three roads in 13.60 km length, were to be constructed upto bituminous topped surface. One road from New Katni junction to Padariya village was to be constructed in 3 Km. length, of which 1.8 Km. length was passing through a railway colony.
The work was awarded (May 2002) to contractor “A” for completion within 9 months excluding rainy season without obtaining prior permission of the Railway authorities for the road length passing through the railway colony.
Audit scrutiny (May 2007) revealed that during the progress of work the railway authorities objected (November 2002) to the construction of traffic bearing roads through their colony. By that time an expenditure of Rs. 30.29 lakh was incurred on construction of the road.
The efforts made by the District Collector, Jabalpur (January 2003) to get the clearance from railways remained unsuccessful. Further since the contractor had delayed the completion of other works which formed part of this contract, the contract was rescinded (December 2003) at the risk and cost of the contractor. Payment for work done amounting to Rs.1.07 crore was, however made (April 2004) without imposition of debitable clause three of the agreement.
Department without addressing the objections of Railway Authorities again awarded (November 2004) the balance work to contractor ‘B’ for Rs.67.84
Chapter IV Audit of Transactions
117
lakh stipulating completion within 6 months including rainy season. The work was stopped midway in February 2005 after construction up to granular sub base (GSB) level as the Railway authorities did not permit further construction of the road. A total expenditure of Rs.39.82 4 lakh was incurred on the incomplete road as of April 2006.
The department started the road work without availability of land for construction of road which was against the provision of PMGSY guidelines. Consequently the incorrect selection of road deprived the inhabitants from all weather road connectivity and led to unfruitful expenditure of Rs.39.82 lakh.
On this being pointed out the General Manager (GM), PIU, Katni stated that the road constructed up to GSB level was abandoned as the railway authorities did not permit the construction of the road on railway land. He also added that the road had proved its utility as ‘gravel road’. Reply is contrary to the provisions of the agreement because the approved estimate and fund allotted under PMGSY was for black topped road and not ‘gravel road’. Further, construction of road in railway colony without obtaining Railways’ consent amounted to encroachment and its maintenance in subsequent years would be at peril.
The matter was reported to the Government (July 2007 and May 2008); the reply had not been received (November 2008).
Public Works Department
4.2.4 Extra expenditure due to nonacceptance of tender within validity period
Delay in acceptance of tender in first call and acceptance of higher rate tender in the fourth call resulted in extra cost of Rs.65.62 lakh.
NABARD sanctioned (May 2005) a loan of Rs.5.68 crore for upgradation of 43.60 km. MaheshwarMehatwadaBablaiSomakhedi Road. The Chief Engineer (CE), Public Works Department (PWD), Indore invited (12 May 2005) percentage rate tenders for the work with probable amount of contract as Rs.5.56 crore. The lowest offer of 17 per cent below SOR was recommended (17 June 2005). The validity of the tender was till 6 October 2005. CE decided (25 June 2005) to keep the tenders pending till release of funds by NABARD, but did not make any efforts to get the validity period of tenders extended.
NABARD released the loan on 24 September 2005. CE accepted the lowest tender on 3 October 2005 and the tender acceptance letter was issued on 6
4 Rs.30.29 lakh under previous agreement and Rs.9.53 lakh under subsequent agreement.

Audit Report (Civil) for the year ended 31 March 2008
118
October 2005 (i.e. the date of expiry of the validity period). The tenderer received the acceptance letter on 14 October 2005 but refused to sign the agreement on the ground that the validity period of the tender had already expired.
The tenders were reinvited (November 2005) and the lowest offer in the fourth call of tenders @ 5.2 per cent below SOR was accepted by the CE (April 2006).
Failure in getting the validity period extended and absence of alacrity in acceptance and subsequent noncommunication of offer to the contractor within the validity period thus resulted in extra expenditure of Rs.65.62 lakh 5 .
On this being pointed out in audit (July 2007), CE stated (July 2007) that rate offered by the contractor was not “workable” CE did not explain the term “workable” in his reply. Neither there was any noting in support of his reply.
Audit has found the reply not tenable due to following reasons: Ø If the rates were not “workable”, then how the same CE had accepted it on
3 October 2005? Rather the tender was accepted and acceptance letter was issued to the contractor on the last date of expiry of validity of tender.
Ø Audit has found that another work of the same nature was accepted @ 17.10 per cent below the SOR during the same period (4 October 2005) in the same NIT by the same CE.
The matter was reported to Government (October 2007); reply had not been received (November 2008).
School Education Department
4.2.5 Unfruitful expenditure on rural libraries
Inadequate release of operational funds rendered Rs. 1.08 crore incurred on establishment of rural libraries, unfruitful.
With a view to retain new educated members in the main stream of education and in order to develop their interest in reading alongwith rural population’s interest in reading, Government of Madhya Pradesh, School Education Department issued orders (October 2002) for establishment of Gramin Pustakalya (Rural Libraries). These libraries were to be established from 26 January 2003 as a culture center and were to operate through Padhna Badhna Sangh. Unit cost of Rs.12,500 per library was meant for providing material (almirah, stationery, carpet, television, radio, public address system, sports
5 Difference of rates in 1 st and 4 th call 11.80% (17%5.20%)X 556.10 lakh (PAC) = Rs. 65.62 lakh.

Chapter IV Audit of Transactions
119
material and books etc.). Besides, Rs.12,500 per annum per center was provided to each library as a recurring grant for organizing activities for illiterates, providing news papers, magazines, books and other miscellaneous expenses etc. A “Prerak” was to be nominated for running of these libraries on honorarium basis.
Scrutiny of records (February 2007) of Secretary Zila Saksharta Samiti Dewas and further information collected (JuneJuly 2008) revealed that for establishment of 950 rural libraries Rajya Shiksha Kendra (RSK) provided (October 2002) Rs. 90.25 lakh and placed (December 2002) orders with book suppliers for supply of books. Zila Shaksharta Samiti spent Rs. 81.65 lakh on establishment of 871 libraries and provided books costing Rs.26.13 lakh to these libraries during (200203) which were received as per supply order of RSK. Rs.8.60 lakh were refunded to RSK in February 2003. Thus an amount of Rs.1.08 crore was incurred on establishment of 871 libraries. Following table shows operation/ non operation of these libraries on the basis of honorarium paid to preraks:
Libraries operated Libraries Nonoperated S.No. Year
Number Period No. Period 1 200304 871 2 Month Nil Nil 2. 200405 871 5 Month 871 7 Months 3 200506 484 2 Month 484
387 10 Months 12 Months
4 200607 436 4 Month 436 435
8 Months 12 Months
5. 200708 645 8 Month 645 226
4 Months 12 Months
As the Government could not provide annual recurring grant, the honorarium to Prerak could not be paid regularly as a result of which none of the libraries could run round the year. Out of 871 libraries 387, 435 and 226 libraries remained closed during 200506, 200607 and 200708 respectively. Newspaper and new books were also not provided to libraries since June 2003. The failure of the government to ensure timely release of funds for payment as honorarium to the Preraks and for purchase of newspapers, new books etc. rendered the expenditure of Rs.1.08 crore on establishment of libraries largely unfruitful.
The Secretary, Zila Saksharta Samiti, Dewas stated (June 2008) that 226 libraries were closed and other libraries are not operated regularly due to insufficient and delayed release of funds for purchase of books, news papers and payment of honorarium etc. The reply of auditee accepts the audit finding that release of insufficient funds led to the expenditure on rural libraries being rendered largely unfruitful.
The matter was referred to Government in May 2008; reply had not been received (July 2008).
Audit Report (Civil) for the year ended 31 March 2008
120
Water Resources Department
4.2.6 Unauthorised aid to contractor
Foreclosure of a contract and its subsequent retender on the same day to the same contractor at higher rates resulted in undue financial aid of Rs.1.43 crore and a delay of four years.
Bakud Minor irrigation tank project in Betul district envisaging irrigation of 1457 hectares land was administratively approved by Government of Madhya Pradesh, Water Resources Department (WRD) in May 2003.The Executive Engineer (EE), WRD Dn. No.II, Betul awarded (February 2005) the works 6 of the tank Project to a contractor on item rate contract basis. Cost of project estimate was Rs.4.03 crore and contract was awarded for Rs.3.16 crore (21.8 per cent below the probable amount of contract) with stipulated date of completion by May 2006 including rainy season.
Audit noticed : • The contractor to whom the work was awarded was the proprietor of
another civil construction firm. As the old firm was a defaulter and black listed; he constituted the new firm for award of work.
• The project envisaged acquisition of 166 hectare private agricultural land. The work was awarded without acquiring the land. The contractor was handed over a 120 metre stretch of land in May and August 2005 to commence the work.
The contractor failed to achieve progress citing health problems and resistance of cultivator due to non payment of land compensation. Due to slack progress the EE terminated (May 2005) the agreement. The Chief Engineer (CE), however revoked (June 2005) the termination order in favour of the contractor with instructions to complete the work as per schedule.
Scrutiny revealed that at the stage when land acquisition award for 166 hectare land was passed (March 2006) and the compensation amount of Rs.2.77 crore was awaiting disbursement in the Land Acquisition Office (LAO), the CE ordered foreclosure of the contract (1 May 2006) .The contract was foreclosed (11 May 2006) and the balance work costing Rs.3.67 crore was put to retender on the same day (11 May 2006) and was awarded (November 2006 ) to the same contractor at a higher cost of Rs. 4.59 crore (evaluated at 24.98 per cent above the PAC). This injudicious decision of CE resulted in
6 Construction of balance earthwork of bund from reduced distance (R.D.) 0 to 831 m i/c nalla portion, excavation of spill and approach channel, construction of sluice at R.D. 705m and construction of flush bar.

Chapter IV Audit of Transactions
121
undue favour to the black listed contractor and an extra cost of Rs.1.43 7 crore to the Government. Audit noticed that although there was reduction in scope of work, the completion period was increased to 20 months in place of 15 months to extend the benefits of price escalation.
On this being pointed out in audit (September 2006) EE justified (September 2006 and July 2007) the foreclosure and reaward of work on the grounds of resistance from cultivators on account of non payment of land compensation.
The reply does not explain why
• The work was awarded and reawarded to a blacklisted contractor without ensuring due vigilance on both the occasions.
• The tender was foreclosed on 11 May 2006 citing ‘nonacquisition’ of land and was retendered on the same day citing reason that the land already stood acquired.
Therefore the decision of the department to patronize the defaulting contractor by reawarding the work at higher rates and with price escalation benefits by increasing the completion period despite reduction in quantum of work was improper.
The matter was reported to Government (September 2007/March 2008); the reply had not been received (November 2008).
4.3 Violation of contractual obligation/ Undue favour to contractors/ Avoidable expenditure
Narmada Valley Development Department
4.3.1 Non accountal of hard rock (iron ore) and payment for work not done
Excavated hard rock identified as iron ore worth Rs.4.18 crore was lying uncared and unaccounted for more than two years and payment of Rs.14.96 lakh was made on stacking of the excavated hard rock (iron ore) which was not done.
The work of construction of Bargi Right Bank Main Canal (Km 50 to 56) of Rani Avanti Bai Lodhi Sagar was awarded (February 2003) by Executive Engineer (EE), Narmada Development (ND) Dn. II, Panagar to a contractor on item rate contract at his tendered rate of Rs.17.98 crore. The construction included excavation, earthwork etc. The work was in progress and the 46 th
7 (Rs. 4.59 crore– Rs 3.16 crore).

Audit Report (Civil) for the year ended 31 March 2008
122
running account bill for Rs.17.93 crore was paid (March 2008) to the contractor.
The agreement provided for 79866 cum excavation of hard rock (H/R). However, during excavation it was substantially increased to 284568.57 cum due to excavation in deep cutting in mountainous terrain, out of this 267666.97 cum was found to be iron ore 8 . Narmada Valley Development Authority (NVDA) had accepted this and approved the rate of Rs.118.98 per cum for it.
The excavated iron ore became a Government property as per Note 13 under Chapter IV of the Unified Schedule of Rate (USR) and its sanction as an ‘extra item’ was accorded by the Government (March 2005). As per Government instructions (March 2005) this required stacking, but the contractor did not stack it. Since the contractor had not done the stacking, the component for stacking @ Rs.7.10 per cum was to be reduced from his payment. However, the department made full payment to the contractor without reducing stacking component, which resulted in an excess payment to the contractor of Rs.14.96 9 lakh.
On being pointed out by audit, the Executive Engineer (EE) stated (July 2007) that on the basis of test results, H/R (iron ore) was found unusable; therefore it was not taken into account. Later, the CE stated (May 2008) that the rock was stacked but the stack measurements were not recorded and the payment had been done on the basis of pit measurement. The matter was referred to Government by audit in 2007 and April 2008. The Government simply endorsed (August 2008) the reply of the CE.
Government’s reply that excavated H/R (iron ore) was ‘not usable’ contradicts the report (September 2005) of Geological Survey of India which has found the quality of iron ore as useful for extraction of metal. Moreover, admission of the fact that stack measurement was not recorded and only pit measurement was taken for payment purpose itself proves that the stacking was not done. Had the material been properly stacked then it would have been taken into Material at site account (MAS). The department has admitted that the material has not been taken in MAS account.
Moreover, the precious Government property like iron ore worth Rs.4.18 crore 10 remained unaccounted for more than 2 years (as of May 2008). Collector, Jabalpur solicited (October 2006) direction from the Government for appropriate disposal. Government reply awaited.
8 As per geotechnical test report conducted by Engineering College, Jabalpur dt. 22 August 2003 and confirmed by Geological survey of India on 23 September 2005.
9 USR rate for stacking Rs. 7.10 per cum minus 21.26 per cent for HR (Iron ore) 2,67,666.97 cum = Rs 14.96 lakh.
10 1 cum hard rock = 2.4 tonne iron ore there fore, 267666.97 cum X 2.4 tonne @ 65/ per tonne = Rs 41756047 = Rs 4.18crore.
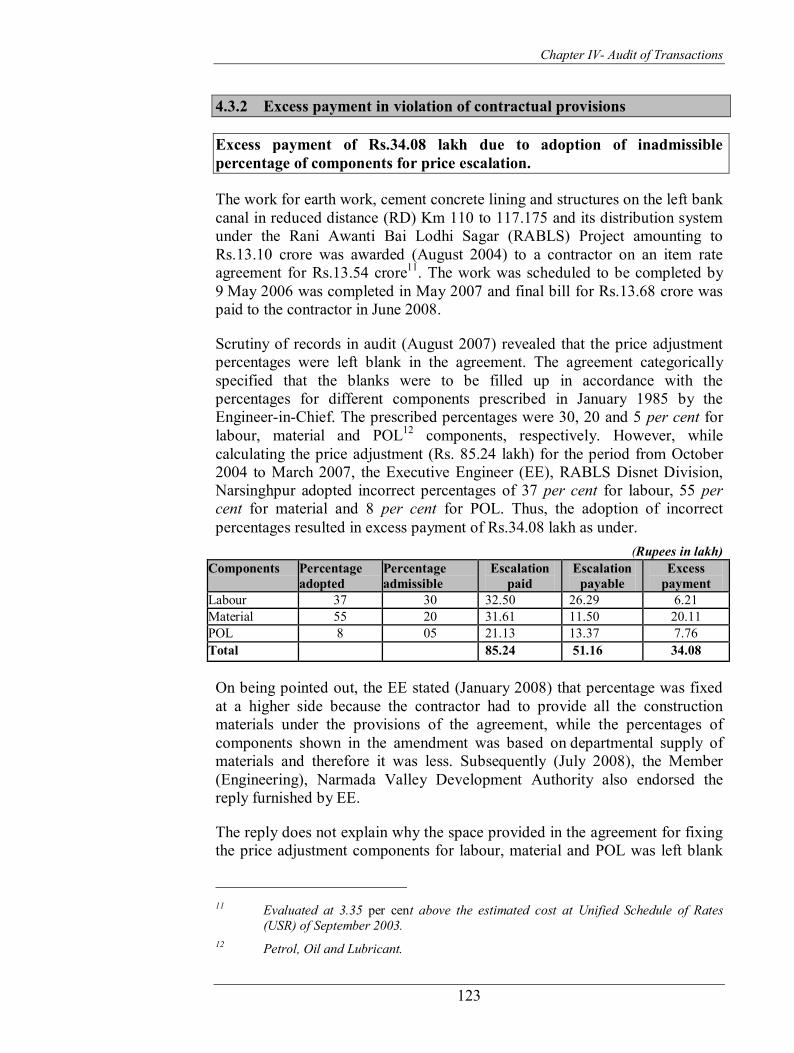
Chapter IV Audit of Transactions
123
4.3.2 Excess payment in violation of contractual provisions
Excess payment of Rs.34.08 lakh due to adoption of inadmissible percentage of components for price escalation.
The work for earth work, cement concrete lining and structures on the left bank canal in reduced distance (RD) Km 110 to 117.175 and its distribution system under the Rani Awanti Bai Lodhi Sagar (RABLS) Project amounting to Rs.13.10 crore was awarded (August 2004) to a contractor on an item rate agreement for Rs.13.54 crore 11 . The work was scheduled to be completed by 9 May 2006 was completed in May 2007 and final bill for Rs.13.68 crore was paid to the contractor in June 2008.
Scrutiny of records in audit (August 2007) revealed that the price adjustment percentages were left blank in the agreement. The agreement categorically specified that the blanks were to be filled up in accordance with the percentages for different components prescribed in January 1985 by the EngineerinChief. The prescribed percentages were 30, 20 and 5 per cent for labour, material and POL 12 components, respectively. However, while calculating the price adjustment (Rs. 85.24 lakh) for the period from October 2004 to March 2007, the Executive Engineer (EE), RABLS Disnet Division, Narsinghpur adopted incorrect percentages of 37 per cent for labour, 55 per cent for material and 8 per cent for POL. Thus, the adoption of incorrect percentages resulted in excess payment of Rs.34.08 lakh as under.
(Rupees in lakh) Components Percentage
adopted Percentage admissible
Escalation paid
Escalation payable
Excess payment
Labour 37 30 32.50 26.29 6.21 Material 55 20 31.61 11.50 20.11 POL 8 05 21.13 13.37 7.76 Total 85.24 51.16 34.08
On being pointed out, the EE stated (January 2008) that percentage was fixed at a higher side because the contractor had to provide all the construction materials under the provisions of the agreement, while the percentages of components shown in the amendment was based on departmental supply of materials and therefore it was less. Subsequently (July 2008), the Member (Engineering), Narmada Valley Development Authority also endorsed the reply furnished by EE.
The reply does not explain why the space provided in the agreement for fixing the price adjustment components for labour, material and POL was left blank
11 Evaluated at 3.35 per cent above the estimated cost at Unified Schedule of Rates (USR) of September 2003.
12 Petrol, Oil and Lubricant.

Audit Report (Civil) for the year ended 31 March 2008
124
although the agreement clause stipulated that the blanks should be filled up as per appropriate percentages of price adjustment as prescribed in the amended provisions. Further, there was no mention in the manual or in the amendment about the lower percentage of price adjustment components notified in the amendment, or they were applicable on agreements specifying departmental supply of material. Therefore, the payment was to be strictly regulated in accordance with the percentages as agreed to in the agreement itself.
The matter was reported to Government (October 2007); its reply had not been received (November 2008).
4.3.3 Inadmissible payment for superfluous item of trimming
Although payment for trimming is prohibited in the USR in earthwork involving item of dressing, separate payment of Rs.27.45 lakh was irregularly made resulting in excess payment.
As per general note in Chapter IV of Unified schedule of rate 2003 (USR), in any earthwork/excavation involving payment for dressing 13 , separate payment for trimming 14 is not permissible even if the work of trimming is executed.
Scrutiny of records (May & October 2007) of two divisions 15 revealed that for providing cement concrete lining of canals, the material obtained from spoil bank 16 was laid as free draining material for preparation of sub grade. The rate for the component of dressing was inclusive in this complete item. Thus, the separate payment for the item of mechanical trimming was not admissible, being superficial as per USR. The Division, however, made separate payment for the item of mechanical trimming over freshly laid free draining material over an area of 804830.79 sq.m which resulted in an inadmissible payment of Rs.27.45 lakh as under:
S. No
Name of Dn.
Agt. No.
Name of work PAC/Tend er percen tage
Executed qty. of MT (in sqm.)
Agreed rate per sqm. (Rs)
Add propor tionate escalation (Rs)
Total inadmi ssible payment (Rs)
1. ND Dn. 10 Sanawad
01.03.0 4
ISP main canal RD Km 17.00 to 31.250
32.50 crore 6.32 per cent below
504739.57 (as of March 2008)
3 14.28 per cent
17,30,449
2. ND Dn. 27 Sanawad
01.03.0 4
ISP Main canal RD km 31.284 to 41.250
20.32 crore 10.61 per cent below
300091.22 (as of July 2007)
3 12.68 per cent
10,14,428
Total 804830.79 sq.m.
27,44,877 say Rs 27.45 lakh
13 Dressing involves making the existing surface as smooth as natural surface. 14 The item of trimming involves preparation of sub grade by removing grass and
grassroots, touching the uneven surface to form a uniform surface. 15 Narmada Development (ND) Dn. No.27, Sanawad and ND Dn. No.10, Sanawad 16 Spoil bank is formed by material dumped during excavation

Chapter IV Audit of Transactions
125
On this being pointed out, the Executive Engineer (EE), ND Dn. 27, Sanawad stated (May 2007) that the tenderers quoted item rates on the basis of nomenclature of the items of the NIT. Therefore it should not be mixed/linked with the nomenclature of USR. The reply is misleading because inclusion of the superfluous item of mechanical trimming in the NIT alongwith the item of earthwork involving dressing was incorrect. The item of trimming in such cases was not payable as per general note in the USR.
The EE, ND Dn. 10 Sanawad stated (April 2008) that trimming was necessary on freshly laid free draining material in order to prepare the subgrade for lining. The reply is not tenable because even if trimming was required to be done, a separate payment for mechanical trimming is not allowable under general note of USR as the payment for dressing was already included under item of excavation of spoil bank.
The matter was reported to the Government (May 2007) and the reply had not been received (November 2008).
4.4 Idle investment/Idle establishment/Blockade of funds/Delay in commissioning equipment/Diversion of funds
Public Health and Family Welfare Department
4.4.1 Unauthorised expenditure
Joint Director Health Services Ujjain irregularly purchased Soya Products amounting to Rs.1.60 crore for distribution to malnourished children out of the budget allotments meant for providing diet to indoor patients in hospitals.
Rule 11 of the Madhya Pradesh Financial Code (MPFC) provides that funds allotted should be utilized economically, in the public interest and only on that activity for which the money was provided. Rule 119 of MPFC also provide that purchase order should not be split up to avoid the sanction of higher authority required for the total amount of purchase.
Scrutiny (October 2007) of the records of the Joint Director, Health Services, (JDHS) Ujjain and further information collected (October 2008) revealed that an allotment of Rs.1.60 crore was received during the period 200608 for providing diet to indoor patients (200607 Rs.0.50 crore and 200708: 1.10 crore). JDHS, Ujjain, however spent Rs.1.60 crore for purchasing Soya Products 17 during February 2007 to March 2008 for distribution to
17 (Soya Biscuits: 4,10,090 packets costing Rs.1.44 crore and Soya Namkeen: 1,10,160 packets costing Rs.0.16 crore).

Audit Report (Civil) for the year ended 31 March 2008
126
malnourished children, without receiving any demand from districts and without ascertaining the number of such children. The purchased products were issued to the Chief Medical and Health Officers (CMHOs) without any instructions for distribution thereof. CMHOs in turn distributed the products to Project Officers, Integrated Women and Child Development Projects for onward distribution. Thus the funds released for providing diet to patients admitted in hospitals were utilised for purchasing of Soya Products without any order/demand. Even the Soya products costing Rs.1.60 crore were purchased by splitting the purchase orders to Rs.80 to 90 thousand each only to avoid the required sanction of higher authorities in contravention of provision of Rule 119 of the MPFC.
JDHS is an administrative officer and the budget allotment received under diet head either should have been passed on to the hospitals for which it was meant or should have been surrendered to the budget controlling authority. Moreover, ‘Supplementary Nutrition Programme’ for providing nutritious food to malnourished children in the State was already being run by Mahila Evam Bal Vikas Department. The procurement of Soya biscuits/ Namkeen by JDHS, Ujjain without any mandate or any demand was thus highly irregular as departmental budget for diet to indoor patients was unauthorisedly utilised for an activity which was not in the purview of JDHS.
On being pointed out, Director Health services, Madhya Pradesh stated (May 2008 and August 2008) that funds were provided to JDHS Ujjain for diet of patients and show cause notice has been issued to the then JDHS.
The matter was referred to the Government in January 2008; reply had not been received (August 2008).
School Education Department
4.4.2 Diversion of fund
Zila Saksharta Samiti, Rajgarh diverted Central (DPEP) funds amount to Rs.33.28 lakh for State level schemes.
Rajya Shiksha Kendra (RSK), Bhopal was responsible for implementing the District Primary Education Programme (DPEP) a 100 per cent Centrally sponsored scheme of Government of India in Madhya Pradesh State. The scheme was closed on 31 December 2002. RSK Bhopal had issued directions to all District Project Coordinators (DPCs) that no expenditure should be incurred from DPEP funds after 31 December 2002 and the balance amount under the scheme at different levels viz district, block and sankul should be surrendered to the RSK Bhopal.
Scrutiny (October 2007) of records of District Project Coordinator, Rajiv Gandhi Shiksha Mission, Rajgarh revealed that Rs.1.05 crore out of DPEP

Chapter IV Audit of Transactions
127
funds were provided in May 2003 i.e. after 31 December 2002 to Secretary Zila Saksharta Samiti, district Rajgarh for expenditure on establishment of rural libraries instead of surrendering it to Rajya Shiksha Kendra Bhopal resulting in irregular diversion of fund. Out of this amount Zila Saksharta Samiti diverted and spent Rs.5.75 lakh for Padhna Badhna Andolan and Rs.27.53 lakh for Gurudakshina programme which are State schemes and for which separate budget allotment were required to be made by State Government, and refunded the balance amount of Rs.71.92 lakh to RSK in July 2003.
On being pointed out State Government stated (July 2008) that DPEP funds were provided for establishment of rural libraries because that time there were no instructions from GOI regarding refund of balance amount of DPEP. After receipt of GOI instructions regarding refund of amount to GOI, the Sakaharta Samities were instructed to refund the amount transferred to State schemes and the action for remittance of fund to Government of India was being taken. The reply of the department indicates acceptance of Audit objection.
Scheduled Tribes and Scheduled Castes Welfare Department
4.4.3 Idle expenditure on Girls Hostel Building
Construction of building for Girls hostel remained incomplete due to non availability of funds; expenditure of Rs.44.81 lakh incurred so far was rendered idle.
Government of India, Ministry of Tribal Affairs sanctioned (March 2001) Rs.89.63 lakh for construction of 144 seated Girls Hostel building in Mankunwar Bai Women College, Jabalpur. GOI was to provide 50 per cent of construction cost (Rs.44.81 lakh) as grantinaid under Centrally Sponsored Scheme of Girls hostels for Scheduled Tribes and remaining 50 per cent was to be provided from Member of Parliament Local Areas Development Scheme (MPLADS) funds as per commitment given by Member of Parliament (MP), Jabalpur. GOI provided its share of Rs.44.81 lakh in July 2001.
Scrutiny of records (September 2007) of Assistant Commissioner Tribal Development (ACTD) Jabalpur revealed that Collector Jabalpur nominated (October 2001) MP Housing Board Division No.1 Jabalpur as the construction agency and provided (March 2002) Rs.44.81 lakh (GOI share) to the Housing Board Division. The entire amount was spent by the Division during 2001 2005. The work of construction of hostel building was however lying incomplete due to non receipt of remaining 50 per cent of construction cost from MPLADS funds. Collector Jabalpur intimated (April 2007) ACTD that due to dispute in construction work, the MP Jabalpur did not recommend the release of share from MPLADS funds.

Audit Report (Civil) for the year ended 31 March 2008
128
The Commissioner Tribal Development while admitting (August 2008) that the construction of the Hostel building could not be completed due to non receipt of MPLADS funds, stated that proposal has been submitted (February 2008) to State Government to provide Rs.61.75 lakh from State budget as per revised estimates for completion of the work. However, State Government failed to make provision in the State budget for 200708. He further assured that proposal for making budget provision in the second supplementary of 200809 will be submitted. The State Government endorsed (September 2008) the views of commissioner Tribal Development. Thus, due to non completion of building work the expenditure of Rs.44.81 lakh incurred on Mankunwar Bai Girls Hostel was rendered idle. Besides the girls from scheduled tribe community could not avail the boarding facility.
4.5 Regulatory issues and other points
Forest Department
4.5.1 Loss of interest of Rs. 18.40 crore
Nonadherence to order of Government of India resulted in loss of Rs. 18.40 crore.
Adhoc Compensatory Afforestation Fund Management and Planning Authority (CAMPA) was created in May 2006 under the orders of Ministry of Environment and Forest of Government of India (GOI). As per GOI instructions issued in March 2004 the funds received on behalf of CAMPA such as funds for compensatory afforestation, net present value, catchment area treatment plan etc. from the user agencies should be kept in the form of fixed deposit in the name of the concerned Divisional Forest Officer (DFO) / Nodal Officer for forest conservation of the respective State Government till the CAMPA is constituted.
Scrutiny of records from the office of the Principal Chief Conservator of Forest (PCCF), Bhopal in respect of 55 forest divisions revealed (July 2006 & February 2007) that it received Rs. 253.72 crore on behalf of CAMPA from the user agencies during March 2004 to October 2006, but in violation of the GOI instruction the said amount was not kept in the form of fixed deposits by the forest divisions, which resulted in loss of interest of Rs. 18.40 crore.
After this was pointed out the DFOs stated that the amount was deposited in personal deposit accounts as per instructions of Government of Madhya Pradesh (GOMP) issued in December 2004. Government (July 2007) endorsed the reply of DFO.

Chapter IV Audit of Transactions
129
By overruling the GOI directions, therefore, GOMP has not only incurred a loss of interest of Rs. 18.40 crore, but also deprived conservation efforts which could have been undertaken from the above amount.
Medical Education Department
4.5.2 Irregular expenditure on payment of electricity bills of medical college hostels
Payment of Rs.1.78 crore for electricity bills of medical college hostels from Government allotment was contrary to the instructions of the Director Medical Education.
The Government of Madhya Pradesh declared (March 1997) all Medical, Colleges (MC) and their affiliated hospitals as autonomous bodies. Although the State Government continued to provide budget to these institutions, the Director, Medical Education, Madhya Pradesh, Bhopal issued specific instructions (August 2004) that the payment of electricity bills of hostels in college campus should not be made from the budget provided by the Government for college buildings.
Scrutiny (August 2007) of the records of the Dean, Gandhi Medical College (GMC), Bhopal and further information collected (August 2008) from Medical Colleges Rewa, Indore and Jabalpur revealed that contrary to the instructions of August 2004 an expenditure of Rs.1.78 crore (MC Bhopal: Rs.73.24 lakh; MC Rewa: Rs.76.12 lakh and MC Indore: Rs.28.97 lakh) was incurred during September 2004 to June 2008 on payment of electricity bills of hostels from the budget provided by Government for college and hospital buildings. In Medical College Jabalpur also, electricity bills of hostels were paid from Government budget but in the absence of separate electricity connection, amount of expenditure on hostels could not be segregated from total expenditure of Rs.3.13 crore incurred during the period September 2004 to July 2008 on electricity bills of common connection for college, hospital, cancer hospital and hostel.
Further, the Medical Colleges were declared autonomous long back in March 1997. As such providing budget by Government for recurring expenses of autonomous institutions was irregular. Besides, the aim of the Government to transform Medical Colleges of the state into selfreliant institutions capable of meeting their contingent liabilities from own resources could not be fulfilled.
Government replied (August 2008) that a proposal was being made in the working committee of autonomous body for remittance of amount in government account.

Audit Report (Civil) for the year ended 31 March 2008
130
Thus, expenditure of Rs.1.78 crore incurred on electricity bills of hostels, contrary to the instructions of August 2004 was not only irregular but also resulted in loss to the Government.
Panchayat and Rural Development Department
4.5.3 Extra cost due to injudicious stoppage of road work
Injudicious stoppage of an ongoing work midway and its reawarding to another contractor resulted in an extra expenditure of Rs 27.87 lakh apart from delay in providing connectivity.
Pradhan Mantri Gram Sadak Yojana (PMGSY) is an all India programme launched in December 2000 with the objective of providing all weather road connectivity to rural habitation with a population of 500 persons and above (250 persons and above in case of tribal habitation) by end of Tenth Five Year Plan ending March 2007. Being a time bound programme, Government of India (GOI) identified several impediments that might retard smooth implementation of the programme, and one such impediment was belated demands for addition or substitution of new road not forming part of the core network.
GOI guidelines therefore, categorically envisaged that the proposals made by Members of Parliament (MP) and District Panchayat (DP) received by the stipulated date, should be given full consideration in preparing proposal of roads, core network, district rural road plan and comprehensive new connectivity priority list (CNCPL). After finalization of these, no deviation would be permissible except with the approval of GOI.
Scrutiny (July 2007) revealed that under PMGSY package no. MP1708 construction of two roads estimated to Rs 2.72 crore was awarded (February 2004) by Programme Implementation Unit (PIU), Indore to a contractor at 6.66 per cent below state schedule of rate (SSR) for completion within a period of nine months excluding rainy season. Of these, one road (Jalodiya Gyan Approach Road) was completed (December 2005) by the contractor. While the tendering process was under progress the DP, Indore resolved (December 2003) to change the road alignment of Katkoda – Karjoda road for providing connectivity to some other unapproved village (Banediya). The Panchayat resolution was also endorsed and recommended by the MP and Union Minister. However, the revised proposal, submitted (April 2004) by MPRRDA was not considered (August 2005) by GOI. Meanwhile, in view of the resolution of the DP, the PIU stopped the work (June 2005) and made final payment to the contractor’s bill in respect of ‘JalodiaGyan Approach Road’ valuing Rs.1.15 crore (which included the cost of incomplete Katkoda to Karjoda road Rs.1.70 lakh).

Chapter IV Audit of Transactions
131
Subsequently, as per request (June 2006) of the MP for construction of the road as per the original alignment (estimated to cost Rs.1.17 crore) the road work was reawarded (November 2006) to another contractor at 18 per cent above SSR.
Thus, the decision to stop the approved work without approval of GOI was injudicious which resulted in an extra expenditure of Rs.27.87 lakh 18 incurred by MPRRDA. Besides the work which was to be completed by February 2005, was in progress as of March 2008 thereby delaying the objective of providing rural road connectivity by more than three years.
On this being pointed out, the General Manager, PIU stated that the work was stopped in view of recommendation of the DP and MP for change of alignment. The reply is not in consonance with the guidelines which categorically provided for considering the proposals of DP and/or MPs at the initial stage of planning only. Belated interference after approval of core network was prohibited as per clause 4.6 of PMGSY guidelines.
The matter was reported to Government (September 2007); the reply was awaited (November 2008).
Public Works Department
4.5.4 Nonadjustment/nonrecovery of Miscellaneous Works Advances
An amount of Rs.7.03 crore was lying outstanding under the head ‘Miscellaneous Works Advances’ in seven public works divisions for the last 53 years for want of recovery or settlement.
‘Miscellaneous Works Advances (MWA)’ is a suspense head of account intended to record transactions on account of (i) sales on credit, (ii) expenditure incurred on deposit works in excess of deposit received (iii) losses, retrenchment, errors, etc. and other items of expenditure of allocation of which is not known or which are required to be recovered or settled. Items in MWA are cleared either by actual recovery or by transfer under proper sanction or authority to some other head of account. Recoverable amounts which may become irrecoverable should not be so transferred until ordered to be written off. The divisional officers are responsible for prompt clearance of the suspense head by recovery or transfer to the proper head concerned.
18 (Rs. 117.28 add 18 per cent)(Rs. 118.41 less 6.66 per cent) = Rs. 27.87 lakh.

Audit Report (Civil) for the year ended 31 March 2008
132
The Public Account Committee 19 had also expressed (December 1996) its displeasure over failure of the Government in taking effective steps for timely adjustments and recoveries of outstanding balances under the head MWA.
Scrutiny of Monthly Accounts and information collected from seven out of seventeen Divisions of Public Works Department, Capital Zone, Bhopal revealed that as of March 2008 the balance outstanding under MWA pertaining to periods 195556 and onwards was Rs 7.03 crore as detailed in Appendix 4.3. The Department failed to take necessary action to clear this suspense head notwithstanding the fact that position of outstanding balances under MWA were also brought to the notices of the concerned divisional officers and controlling officers by audit for prompt recovery/settlement through annual audit inspection reports.
A review of outstanding balances under the head MWA revealed the following:
(a) Recoveries due from 583 departmental officers between February 1955 and June 2005 towards shortage of stores, temporary advances and expenditure in excess of sanctions / allotment (Rs 1.08 crore) remained unrecovered or unsettled because they had retired, expired or were transferred from the Divisions. No mention of the outstanding advances was made in the Last Pay Certificates. The Divisions had no details or whereabouts of these officials and had failed to initiate timely action to settle the outstanding dues.
(b) In three Divisions 20 dues amounting to Rs 70.65 lakh pertaining to the period 1999 to 2007 were outstanding against 15 officials who were still working in the Divisions, but no action for adjustment of dues was taken as of April 2008.
(c) The liabilities due from 222 suppliers/contractors towards advance payments for supply, excess payment etc. of Rs 2.39 crore remained unrealized due to inaction on the part of divisional officers. The dues related to the period 1969 to 2005 were required to be adjusted against the dues (security deposits, earnest money and other payments for work) of the suppliers/ contractors.
(d) Government issued orders (April 1984) dispensing with the system of credit sale of departmental materials between Divisions with effect from May 1, 1984 and introduced the system of “Cash and Carry” for inter divisional transactions. However, three Divisions persisted with credit sales (Rs 47.48 lakh) debiting the 27 transactions to MWA even after April 1984 in violation of Government orders. Besides, two divisions issued articles on credit worth Rs 2.38 crore to 23 other departments. These are pending for settlements as of
19 PAC’s 76 th Report – (10 th Vidhan Sabha). 20 PWD Divisions Raisen, Vidisha and Vidhan Sabha, Bhopal.

Chapter IV Audit of Transactions
133
August 2008. Government did not take any action to stop the misuse of this suspense head.
Although a detailed account showing the nature of transactions with their voucher numbers and reasons for debiting them under MWA is to be maintained in Form CPWA 67, the registers were not being maintained properly in these offices. According to the Central Public Works Account Code prompt steps were required to be taken to clear the outstanding balances but the Divisional Officers allowed to accumulate outstanding under this head. This not only hampered the standard accounting procedure but also afforded unabated unauthorized financial aid to the defaulters. These lapses and failures persisted despite it being repeatedly brought to the notice of all divisional officers and their controlling officer every year through audit inspection reports.
Government should investigate the prolonged non clearance of outstandings under MWA and take effective action to recover the amount due and adjust the long pending debits to the final head concerned. Government should also initiate action to curb the misuse of the suspense head for accommodating irregular transactions.
The matter was reported to the Government (May 2008); reply had not been received (November 2008).
General
4.5.5 Failure to enforce accountability and protect the interests of Government
Principal Accountant General (Civil and Commercial Audit), Madhya Pradesh, Gwalior (PAG) and Accountant General (Works and Receipt Audit), Madhya Pradesh, Bhopal (AG) conduct periodical audit of the Government departments to test check, interalia, the transactions and verify the maintenance of important accounting and other records as per prescribed rules and procedures. Irregularities detected during audit are reported through Inspection Reports (IRs) to ensure rectificatory action in compliance of the prescribed rules and procedures and accountability for the deficiencies and lapses. The Heads of Offices and next higher authorities are required to comply with the observations contained in the IRs and rectify the defects/omissions promptly and report their compliance to the PAG/AG. The PAG/AG also brings serious irregularities to the notice of the Heads of Departments. A halfyearly report of pending IRs and paras is sent to the Principal Secretary/ Secretary of the Department to facilitate monitoring of the compliance to audit observations in the pending IRs.
A review of the IRs issued by PAG upto December 2007 pertaining to Civil Departments (except Public Works Department, Public Health Engineering

Audit Report (Civil) for the year ended 31 March 2008
134
Department, Water Resource Department and Forest Department) disclosed that 21,662 paragraphs relating to 8,693 Inspection Reports remained outstanding as on 30 June 2008. This includes 8,421 paragraphs of 4,262 Inspection Reports outstanding for more than six years. Departmentwise and yearwise position of outstanding Inspection Reports and paragraphs is given in Appendix 4.4 and 4.5.
Similarly review of the IRs issued by AG upto December 2007 pertaining to 687 divisions/offices of Forest, Water Resources, Public Works, Public Health Engineering and other Works 21 Departments disclosed that 17,328 paragraphs relating to 3,729 IRs were outstanding since 199798 to the end of 30 June 2008.Department wise position of the outstanding IRs and paragraphs is given in Appendix 4.6.
The Heads of the offices (whose records were audited) and the Heads of Departments did not send any reply to a large number of IRs/paragraphs indicating their failure to initiate action with respect to the defects, omissions and irregularities pointed out in the IRs. The Principal Secretary/Secretaries of the Departments who were informed of the position through half yearly reports also did not ensure that the concerned offices of the Department take prompt and timely action.
Absence of any action against the defaulting officers facilitated the continuance of irregularities and losses to the Government despite being pointed out in Audit. It is recommended that Government need to relook into the procedure for fixing responsibility on the officials who failed to take corrective/remedial action on the audit observations and failed to send replies to IRs/paragraphs within a prescribed time. Action is required to be initiated to recover losses, outstanding advances, over payments, etc. in a time bound manner and enforce accountability to ensure proper and timely response to issues brought out in audit.
21 Narmada Valley Development Department, Housing and Environment Department, Bhopal Gas Rahat (Relief and Rehabilitation) Department and Panchayat and Rural Development Department.

Chapter V – Internal Control System
135
CHAPTER V
Internal Control Mechanism in Government Departments
Mahila Evam Bal Vikas Department
5.1 Internal Control in Mahila Evam Bal Vikas Department
Highlights
Internal control is an important aspect of functioning within an organization. Internal control processes establish a system which provides reasonable assurance on financial reporting, operational data and the application of laws, regulations and various control parameters designed to achieve organizational objectives. Internationally the best practices in internal control have been given in the Committee of Sponsoring Organisations of the National Commission on Fraudulent Financial Reporting or the Treadway Commission (COSO) framework which is a widely accepted model for internal controls. In India the GOI has prescribed comprehensive instructions on maintenance of internal control in government departments through rule 64 of General Financial Rules 2005. A review of internal control of Mahila Evam Bal Vikas Department revealed that budget estimates (BEs) were deficient in so far as persistent savings occurred each year. BEs were submitted to Finance Department with delays up to 98 days. Cases of belated release of fund to the subsidiary formations; rush of expenditure in the last month and unsatisfactory cash management were also noticed. Nongazetted employees were vested with drawing and disbursing powers though rules prohibited such delegation:
Out of Rs.42.48 crore parked under civil deposit, a sum of Rs.1.30 crore lapsed and Rs.23.21 crore were still lying unutilised. Further Rs.37.97 crore were parked in Personal Ledger Account (PLA) of which Rs.1.17 crore were still lying unspent. Contrary to the decision, Rs.5.91 crore were credited to bank account of Anganwadi workers.
(Paragraph 5.1.5.3. and 5.1.6.3)
Supplementary provisions of Rs.84.95 crore proved unnecessary as the amount under original Budgetary provisions could not be spent. Rs.272.48 crore were surrendered though available savings were Rs.257.28 crore.
(Paragraph 5.1.5.4 and 5.1.5.5)
Temporary advance of Rs.3.77 crore were lying unadjusted. (Paragraph 5.1.8.3)

Audit Report (Civil) for the year ended 31 March 2008
136
Inadequate control led to exclusion of 37 to 53 per cent of identified beneficiaries and wasteful expenditure of Rs.11.24 crore incurred due to providing solid food instead of weaning food to infants.
(Paragraph 5.1.6.2 and 5.1.6.3)
Internal audit wing was ineffective as 367 Project Offices were not covered during 200308. Periodicity of units was also not fixed.
(Paragraph 5.1.9.3)
5.1.1 Introduction
Internal Control Mechanism (ICM) in an organisation denotes the activities and processes placed by the organistation to control, eliminate and minimize risks, events with the potential to influence the achievements of an organisation’s activities. The ICM includes provisions of codes, manuals, rules and monitoring mechanism to ensure compliance. The Internal Audit helps in identification of shortcomings in ICM and its strengthening.
Mahila Evam Bal Vikas Department (Department) with the aim to improve the socioeconomic, health and nutritional status of women and physical, psychological, social and nutritional status of children up to six years and protect them against malnutrition; create awareness about laws and schemes for overall development of women and children started functioning in 1988. The Department has been implementing various schemes, such as Integrated Child Development Services, National Nutrition Mission, Adolescent Girls Scheme and Ladli Laxmi Yojana for the achievement of the above mentioned objectives. The various functionaries as in the para below are a part of the ICM of department.
5.1.2 Organisational Setup
The Department is headed by a Principal Secretary for implementation of the government policies and schemes. The CommissionercumDirector Women and Child Development (Director) is the Nodal Officer at the State level and is responsible for planning, guidance, monitoring and supervision. At the District level, the District Programme Officer (DPO)/District Women and Child Development Officer (DWCDO) is responsible for coordination, monitoring, supervision and implementation of the schemes while at block level these works are assigned to the Child Development Project Officer (CDPO). The primary point for delivery of services is Anganwadi Centre (AWC) set up in a village or a ward of urban slum area and is attended by an Anganwadi Worker (AWW).
Chapter V – Internal Control System
137
5.1.3 Audit objectives This review of internal control has been conducted to assess whether: Ø the budgetary, expenditure and cash controls were adequate and
effective; Ø the administrative controls on establishment and inventory related
controls were efficient; Ø the operational controls were adequate to ensure achievement of the
objectives of the Department in an effective manner; Ø the monitoring was effective; and
Ø the internal audit and vigilance mechanism was effective.
5.1.4 Audit coverage and methodology The records of the office of the Directorate, and nine 1 out of 48 districts and 20 2 out of 88 project offices were selected using simple random sampling without replacement method and test checked during MarchAugust 2008 covering the period 200308. The methodology adopted was to test check records with reference to the provisions of Madhya Pradesh Financial Code (MPFC), Madhya Pradesh Treasury Code (MPTC), and circulars/instructions etc. issued by the Government. The COSO frame work has been adopted for evaluation of internal control. An introductory meeting was held in March 2008 with Director Mahila Evam Bal Vikas Department and subsequent audit findings and recommendations of audit were discussed in the exit conference held in November 2008 with Principal Secretary to Government of Madhya Pradesh, MEBV Department and their views were considered while finalising the review report. Results of testcheck are embodies in the succeeding paragraphs.
5.1.5 Compliance with Financial Rules Budgeting requires the Administrative Departments to prepare budget estimates (BE) based on inputs from lower formations, incur expenditure within the budgeted provisions, avoid rush of expenditure towards the end of the financial year and surrender anticipated savings in time. The review of budgetary and expenditure controls of the department showed instances of persistent savings, belated surrenders, irregular transfer of funds to civil deposit, rush of expenditure and delayed submission of budget estimates to Finance Department (FD) as discussed in the succeeding paragraphs:
1 Betul, Bhopal Chiindwara, Dhar Hosangabad Jhabua, Khargone, Mandla, Sheopur.out of 48 districts
2 Betul (3), Chhindwara (2), Dhar (4), Hosangabad, (2), Jhabua (4), Mandla, (2) and Sheopur (3).
Audit Report (Civil) for the year ended 31 March 2008
138
5.1.5.1 Budget Estimates
Rule 192 of MP FC provides that Budget Estimates (BEs) should be furnished to the FD before the dates fixed by the FD through the Administrative Department. It was however noticed that the Department was able to send the BE to the FD with a delay 3 ranging between 41 and 98 days from the dates fixed by the FD during 200408. BEs were sent directly by the Director to FD without routing through its Administrative Department which was irregular as there was no examination by the Administrative Department of the budgetary proposal. In exit conference departmental officials stated that there was no delay in sending BE to FD and approval of the Administrative Ministry had been obtained but no record in support of the statement was shown to audit.
5.1.5.2 Savings Details of budget provisions, under seven 4 grants and expenditure incurred shows the savings during 200308 as at Appendix 5.1. The savings of 15 to 44 per cent was attributed by the department to absence of demand from DDOs, nonprocurement of medicine and education kits, etc. and making provisions for vacant posts. The entire provision of Rs.163.82 crore under Central Sector Schemes and Rupees three crore under State Sector Schemes under five 5 grants remained unutilized. In exit conference, departmental officials stated that funds were received late from GOI and periodical change in policy led to surrender of funds.
5.1.5.3 Transfer of funds to Civil Deposit MP TC prohibits drawal of funds from treasury unless required for immediate disbursement. It was noticed that the Central assistance of Rs.42.48 crore received for distribution of medicines and educational kits, were transferred to Civil Deposit (CD) during 200308. Only Rs.17.97 crore were utilized in subsequent years while Rs.1.30 crore were allowed to lapse due to non utilization of same within three years and Rs.23.21 crore was still lying in CD as of March 2008. Further out of funds deposited in Civil Deposit prior to 200304 Rs.5.75 crore lapsed to State revenue during the period. Parking of fund in CD was irregular and led to overstatement of the expenditure while distorting the allocation of subsequent years. Also, the expected benefits of distribution of the medicines and educational items did not reach the beneficiaries, as Rs.7.05 crore of central fund meant for the above purposes became a source of unintended revenue of the state and Rs.23.21 crore remained unutilized.
Directorate deposited Rs.37.97 crore in personal deposit account of Madhya Pradesh Laghu Udhyog Nigam (MPLUN) during 200407, out of which
3 200405 Plan/NP (78 days), 200506 NP (66 days), 200506 Plan (98 days) 200607 Plan/NP (41 days) and 200708 Plan/NP (60 days).
4 Grant No.15, 41, 52, 55, 64, 80 and 82 5 Grant No.15, 41, 55, 64 and 82.
Budget Estimates were submitted with delays ranging from 41 to 98 days.
There were savings ranging from 15 to 44 per cent during 200308.
Rs.42.48 crore were transferred to Civil Deposit thereby, inflating the expenditure without spending and Rs.24.38 crore remained unutilized in CD/PD account.

Chapter V – Internal Control System
139
Rs.1.17 crore were unspent as of March 2008. Such accumulation of funds in the CD and PDA without incurring expenditure during the year of their drawals for the intended purpose was irregular as it compromised with the objectives of budgetary exercise.
5.1.5.4 Supplementary Budget provisions Rule 60 of General Financial Rules (GFR) provides that a supplementary demand for grants need to be proposed only in case of requirement of additional fund. It was noticed that supplementary budget provisions of Rs.84.95 crore during 200308 as shown in Appendix 5.2 was made under grant no. 55 but the same could not be utilised. The department stated that funds could not be utilised due to delayed receipt of supplementary budget provision . The reply is not convincing as the expenditure incurred was even less than the original budget provisions.
5.1.5.5 Release and surrender of fund Financial rules provide that all anticipated savings should be surrendered immediately after these are foreseen latest by 15 th March of the financial year. It was however, noticed that the Department in all the above five years surrendered Rs.571.07 crore on the last day of the respective financial years. Analysis of data further revealed that Rs.272.48 crore was surrendered against available savings of Rs.257.28 crore during 200306. In three schemes, funds were withdrawn by reappropriations/surrender in excess of available saving resulting in excess expenditure of Rs.12.14 crore during 200306.
Audit further observed that Rs.39.84 crore were released at the fag end of the financial year (29 th March 2008) by the Directorate to districts with the direction to use the same within the same financial year. DPO, Chhindwara surrendered Rs.1.21 crore of this amount on the last working day of the financial year. In exit conference department admitted delayed release of fund.
5.1.5.6 Expenditure in the last month of the financial year GFR 56 (3) provides that the expenditure under any head of account should be incurred proportionately in each month as per the budget provision for a financial year. Expenditure in the last month of the financial year however ranged between 24.55 per cent and 28.09 per cent during 200308 under four grants 6 as shown in Appendix 5.3: Commissioner stated that due to receipt of sanction at the fag end of the year and in order to avoid lapse of budget, the expenditure was made in the month of March. This indicates the weakness of financial control mechanisms.
5.1.5.7 Reconciliation of expenditure figures Departmental controlling officers are required to reconcile the departmental expenditure figures with those booked by the Accountant General (A&E) to
6 Grant No.41, 64, 55 and 80.
Supplementary budget provisions of Rs.84.95 crore during 200308 proved unnecessary.
Expenditure incurred in last month of the financial year ranged between 24.55 percent to 28.09 percent.

Audit Report (Civil) for the year ended 31 March 2008
140
enable corrections of the nature of errors, omissions, misclassifications and detection of lapses etc. It was, however, seen that during 200308 there was difference in figures ranging from Rs.3.15 crore to Rs.42.50 crore under seven grants 7 as shown in Appendix 5.4. The department failed in implementing important financial control activity. In exit conference, Department accepted the audit observation and assured to expedite the reconciliation process regularly.
5.1.5.8 Drawal from Contingency Fund of State Financial Rules provide that drawal from Contingency Fund of State may be made for incurring only expenditure of emergent nature. It was noticed that the Department, withdrew Rs.40 lakh from contingency fund on 30 March 2002 and deposited in Civil Deposit on the same day. An expenditure of Rs.29 lakh was incurred (April 2002) and balance amount of Rs.11 lakh lapsed to Government revenue (March 2005). Thus the withdrawal from the contingency fund was made without any immediate requirement. The department noted the point for future compliance.
5.1.5.9 Internal Control in Cash Management Test check of records of Drawing and Disbursing Officers (DDOs) in Directorate and in 9 test checked districts revealed that DDOs disregarded provisions relating to cash management as discussed below:
Ø 24 DDOs did not attest regularly each entry in the cash book in token of checks exercised by them.
Ø 25 DDOs did not conduct the physical verification of cash and did not verify the totals in the cash book regularly at the end of each month.
Ø 29 and 27 offices respectively did not review the bill registers and bill transit registers.
Ø Security deposit was not obtained from the cashier in 14 offices.
Ø DPO Shivpuri violated the rule 29 of MPFC by not depositing and accounting cash receipts worth Rs.9,252 collected between 8 October 2005 and 27 December 2007. DPO Sheopur, Hoshangabad, Betul and PO Meghnagar did not deposit the cash receipts worth Rs.5,392 collected between 200508 as of May 2008.
Ø In DPO Mandla an amount of Rs.15,794 was left out from the opening balance of Rs.1,49,202 while carrying to subsequent page in cash book as on 5 October 2006.
7 Grant No.15, 41, 52, 55, 64, 80 and 82.
Unnecessary drawal of Rs.11 lakh from contingency fund.
Non observance of codal provisions regarding maintenance of cash books and subsidiary records.

Chapter V – Internal Control System
141
Ø DPO Dhar and Hoshangabad did not maintain cash book of Gramya Yojna though about Rs.12 lakh were received on different occasions. CDPO Sardarpur (Dhar) also did not maintain the cash book of Swayam Siddha Yojana though 52 transactions worth Rs.13.80 lakh occurred during 200307.
Ø As per Rule 53 of MPTC the cash book is to be written daily. However, the cash book of Project Officer (PO) Mandla was not written from 4 March 2008 to 15 April 2008 though Rs.35,35,093 were drawn from treasury. PO did not attest the cash book from 17 December 2007 till 15 April 2008. Similarly, cash book of PO Pandhurna was found incomplete from 26 February 2008 (as of 15 June 2008) though Rs.23.87 lakh were drawn. Cash book was also not signed by the PO from 5 September 2007 till 16 June 2008.
Ø Rs.73.43 lakh received from Directorate (April 2008) for the year 200708 for nutrition programme was not accounted for by the DPO Dhar as of 24 July 2008.
The laxity in observance of controls relating to cash book writing and monitoring could lead to risks of frauds and misappropriation. In exit conference department assured to take corrective action in all cases.
5.1.5.10 Maintenance of records and documents Rule 52 of GFR and Rule 297 of MPTC Volume I require that budget control register and contingent register should be maintained properly so that budget control mechanism is effective. Audit observed that these registers were not properly maintained by 19 DDOs in checked districts.
The Government had invested Rs.1.26 crore in Madhya Pradesh Mahila Evam Vitya Vikas Nigam (MPMEVVN) during 200607 but no record of investment was found maintained by the Directorate. No information regarding investment in other years was made available by the Directorate. Director stated that position will be intimated after ascertaining from MPMEVVN. In exit conference department assured to take corrective action.
5.1.6 Operational Control
5.1.6.1 Laxity in operational control led to unauthorized assistance to ineligible beneficiaries under LLY
In order to promote family planning, restore the gender balance and prevent child marriage, State Government launched the Ladli Laxmi Yojana (LLY) from 1 st April 2007. The parents who have two or less than two children and have adopted family planning and also who are not income tax payer can apply for registration in Angan Wadi Centre (AWC) under the scheme for girl child born after 1 January 2006. Assistance of Rs.6000 per year for five years in the shape of National Saving Certificate (NSC) was to be provided in the name of
Non maintenance of records of investment of Rs.1.26 crore.
Payment of Rs.1.08 crore to ineligible beneficiaries under LLY and NSC of Rs.54.60 lakh not distributed.

Audit Report (Civil) for the year ended 31 March 2008
142
girl child who will get Rupees one lakh at the age of 21 years provided she was not married up to the age of 18 years and appeared in 12 th standard examination. It was however, noticed that in seven 8 districts payment of Rs.1.08 crore (out of total expenditure of Rs.24.51 crore) was made in 1629 unregistered cases, 77 cases without ascertaining adoption of family planning and in 99 cases recorded date of birth of child was after the date of family planning operation of mother. DPOs stated that cases were sent to the Directorate who had sanctioned and paid the amount to the concerned Post Office directly. The reply of department is not acceptable as the Directorate made the payment to ineligible cases, which had been incorrectly recommended by the P.O. Further, Rs.54.60 lakh in 910 cases were deposited in the post offices but the NSCs had not been received (October 2008).
5.1.6.2 Compliance of Apex Court directives Under the directives (28 November 2001) of the Hon’ble Supreme Court of India, all identified beneficiaries under Supplementary Nutritional Programme (SNP) were to be covered for providing supplementary nutrition. Despite categorical directive of the apex court, shortfall in coverage of identified beneficiaries in the State was found as under:
Table No.5.1: Coverage of beneficiaries under SNP (Figures of beneficiaries in lakh/)
Pregnant and nursing mother Children 6 months to 6 years Year Identified Assisted Percentage of Short
fall Identified Assisted Percentage of Short
fall 200304 11.67 6.31 46 53.37 25.74 52 200405 12.02 6.23 48 56.04 26.11 53 200506 12.38 6.51 47 56.91 26.86 53 200607 12.86 7.68 40 60.25 32.59 46 200708 14.44 9.11 37 70.12 42.05 40 Source: Data furnished by Directorate.
Thus 37 to 48 per cent expectant and nursing mothers and 40 to 53 per cent children were denied supplementary nutrition. DPOs/CDPOs attributed to non release/delayed release of funds to the districts.
Supreme Court directives (28 November 2001) and state Government’s orders (September 2005) further provide that supplementary nutrition (SNP) for minimum 21 days in each month is to be provided for all beneficiaries. It was however, noticed that distribution of SNP was made for less than 21 days in a month in AWCs.
Table No.5.2: Shortfall in providing SNP Year Total number of
AWC Range of AWC in which SNP was supplied below 21 days per month
Short supply percentage ranging between
200304 49787 5355 to 20279 11 to 41 200405 49787 11892 to 20579 24 to 41 200506 49787 10305 to 14678 21 to 29 200607 49787 5936 to 16437 10 to 33 200708 59324 1584 to 11618 3 to 20 Source: Data furnished by Directorate.
8 Betul, Bhopal, Chhindwara, Dhar,Hoshangabad, Jhabua and Mandla.
Achievements under SNP ranged between 47 to 63 per cent.

Chapter V – Internal Control System
143
The figure of such defaulting AWCs ranged between 3 per cent to 41 per cent during 200308. The Directorate stated that interruption in distribution of SNP was caused due to shortage of Angan Wadi Workers and helpers (AWW/H). Reply is not acceptable as the responsibility for timely posting of AWW/H rests with the Department. Inaction not only resulted in non compliance of Supreme Court directives but also deprived the beneficiaries of the nutrition. In exit conference the department stated that the implementation of the scheme is being strengthened.
5.1.6.3 Operational control in implementation of Local Food Model Scheme
Local Food Model Scheme (LFMS) for providing supplementary nutritional food (SNP) to six months to six years old children and pregnant and lactating mother was launched (15 February 2007) by the State Government. Under the scheme any of the 20 types of cooked food items within a cost of Rupees two per day/ per child were to be provided to three to six years and weaning food to six month to 36 months old children by the AWW after approval of the District level committee headed by the collector. A state level cell for regular monitoring of testing of food was to be constituted. For overall monitoring and control, committees at AWC, block and district level were to be constituted which were responsible for evaluation and sending quarterly reports to the Directorate with recommendations. Annual audit of all DPO / DWCDO alongwith five per cent AWC was to be conducted by the audit wing of the Directorate. Review of implementation of LFMS revealed the following major irregularities:
Ø Despite refusal by the Finance Department for granting financial powers to AWW for purchase of food articles, the Directorate allowed AWW’s to purchase food articles. Directorate stated that as per scheme AWW’s were allowed to purchase. Reply was not acceptable as delegation of financial powers did not permit such arrangement.
Ø Directorate delayed release of Rs.45.32 crore pertaining to October and November 2007 by two to three months. Similarly advance drawal of Rs.19.71 crore pertaining to month of January 2008 could be credited to the bank account of AWW after about 3 months.
Ø Pay orders dated 6 December 2007 for Rs.59.41 lakh issued by lead bank was returned by the Regional Rural Bank (RRB) Hoshangabad which interrupted the regular supply of SNP to the beneficiaries.
Ø Rupees 6.33 crore were not transferred to the bank account of the Angan Wadi Workers and were lying with the lead bank (October 2008).
Ø The budget allotment of Rs.39.84 crore from department for February and March 2008 was allotted by the Directorate on 29 March 2008. Cash of Rs.18.43 crore was drawn (31 March 2008) by the Directorate

Audit Report (Civil) for the year ended 31 March 2008
144
was transferred on 14 April 2008 to the field units which interrupted the regular distribution of SNP during 200708.
Ø Utilisation certificates (UC's) worth Rs.18.13 crore were not sent by the test checked district officers and UC’s for Rs.24.55 crore sent to the directorate were without approval of District Collector.
Ø State level monitoring cell for testing of food was not constituted and untested food was supplied to the children round the year. Thus it could not be confirmed that food actually supplied contained the prescribed quantity of protein/ calories. Directorate could not conduct the annual audit of each district and cover required per centage of audit of AWC as prescribed in the scheme. Evaluation of scheme by the committees at AWC, block and district level was also not done. Further scrutiny of records of AWCs by the audit party showed that the cash book and raw food material stock register were incomplete. Bank reconciliation was not carried out to eliminate risk of financial loss. Thus the control in implementation of scheme at nodal officer (Director) level was weak. In exit conference the department stated that the implementation of the scheme is being strengthened.
Ø The Department withdrew (March 2008) the departmental decision for depositing money in the bank account of AWW for arranging supplementary nutrition food. Accordingly, the Department issued (20 March 2008) orders to the effect that money should not be credited in the bank account of AWW. It was however, seen that the 5 DPOs 9 credited Rs.5.91 crore in the bank account of AWWs in contravention of the orders indicating weakness of administrative controls. In exit conference department informed that the funds were released against pending demands.
Ø Instead of supplying weaning food to children in the age of six to 12 months solid food worth Rs.11.24 crore was provided to 23.46 lakh infants up to the age of 12 months in test checked districts during 2003 08. As the infants of these age group can neither eat/crush nor digest 80 gram solid food daily, the utility of such menu remained doubtful. Weaning food was also not provided to children in the age group of 12 to 36 months. The inherent programme risk has not been controlled. In exit conference, the department assured compliance in future.
5.1.7 Stores Management Control
Physical verification of stores was not conducted in all checked units as well as in the Directorate. Field units stated that physical verification of stores was in progress. Prescribed security deposit from store keepers was also not obtained
9 Betul, Bhopal, Dhar, Khargone and Hoshangabad.

Chapter V – Internal Control System
145
in test checked units. The inventory controls to ensure continued existence of assets were not implemented. In exit conference, the department stated that compliance would be ensured in future.
5.1.7.1 Procurement of medicine and preeducation kits
GOI provides funds each year to the Directorate for procurement of medicine/education kits for health check and informal education of children and pregnant/lactating mothers. The kits were provided during 200306. It was, however, noticed that despite receiving Rs.22.85 crore during 200608 the Directorate could not provide medicine and education kits to AWC for the last two years and amount was transferred to civil deposit in March 2007 and 2008. Thus the identified facilities did not reach the beneficiaries at the AWC’s during 200608. The department attributed it to delay in tendering process which is a weakness of the control mechanism of procurement leading to significant compromise in the objectives of the scheme. In exit conference the department informed that process was being expedited.
5.1.7.2 Procurement of Dalia at higher rates
Directorate directed 10 all district officers for fixing of rate for procurement of Dalia which should not be more than Rs10.50 per Kg. during May 2003 to 27 September 2005 and Rs.13.75 per Kg thereafter. However, it was noticed that four DPOs 11 procured (200307) Dalia at higher rates which resulted in extra expenditure of Rs.2.02 crore as shown in Appendix 5.5. DPOs, stated that the rates were fixed according to the price of wheat available at local level. The reply is not acceptable as the prices in excess of prescribed ceilings should have been got approved from the Director. In exit conference the department assured examination of all the cases.
5.1.8 Administrative Control
The work of monitoring and reporting was not being done properly as 121 posts of Assistant Statistical Officers (43 per cent) were vacant. 13 posts of District Programme Officers out of 41 and 66 posts of Project Officers ICDS out of 367 were also vacant. The shortage of manpower had effected the implementation, coordination, monitoring and supervision of the schemes like LFMS. In exit conference department agreed to fill up the vacant posts.
5.1.8.1 Grant of drawing and disbursing powers to nongazetted employees
Contrary to Rule 125 of MPTC VolI and the instructions issued (June 1996) by the Directorate granted (May 2006) drawing and disbursing powers to 74
10 30 May 2003 and 28 September 2005. 11 Bhopal, Chhindwara, Dhar and Khargone
Non procurement of medicine and preeducation kits of Rs.22.85 crore.
Extra expenditure of Rs.2.02 crore in procurement of Dalia.
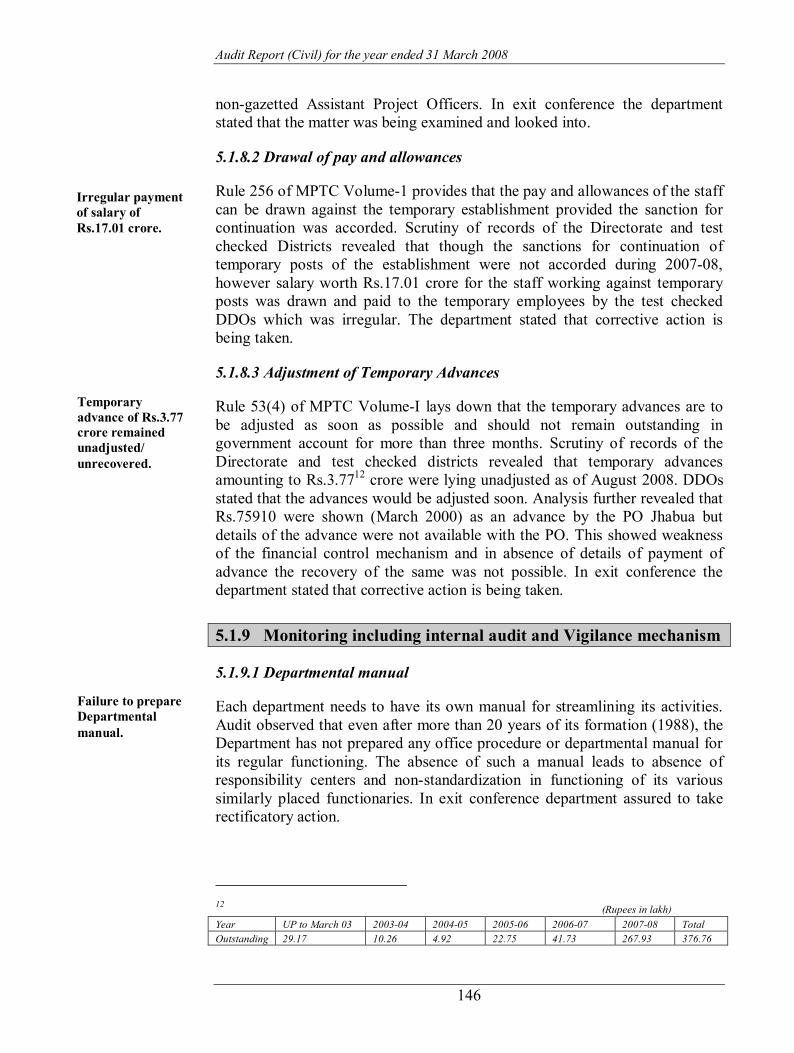
Audit Report (Civil) for the year ended 31 March 2008
146
nongazetted Assistant Project Officers. In exit conference the department stated that the matter was being examined and looked into.
5.1.8.2 Drawal of pay and allowances
Rule 256 of MPTC Volume1 provides that the pay and allowances of the staff can be drawn against the temporary establishment provided the sanction for continuation was accorded. Scrutiny of records of the Directorate and test checked Districts revealed that though the sanctions for continuation of temporary posts of the establishment were not accorded during 200708, however salary worth Rs.17.01 crore for the staff working against temporary posts was drawn and paid to the temporary employees by the test checked DDOs which was irregular. The department stated that corrective action is being taken.
5.1.8.3 Adjustment of Temporary Advances
Rule 53(4) of MPTC VolumeI lays down that the temporary advances are to be adjusted as soon as possible and should not remain outstanding in government account for more than three months. Scrutiny of records of the Directorate and test checked districts revealed that temporary advances amounting to Rs.3.77 12 crore were lying unadjusted as of August 2008. DDOs stated that the advances would be adjusted soon. Analysis further revealed that Rs.75910 were shown (March 2000) as an advance by the PO Jhabua but details of the advance were not available with the PO. This showed weakness of the financial control mechanism and in absence of details of payment of advance the recovery of the same was not possible. In exit conference the department stated that corrective action is being taken.
5.1.9 Monitoring including internal audit and Vigilance mechanism
5.1.9.1 Departmental manual
Each department needs to have its own manual for streamlining its activities. Audit observed that even after more than 20 years of its formation (1988), the Department has not prepared any office procedure or departmental manual for its regular functioning. The absence of such a manual leads to absence of responsibility centers and nonstandardization in functioning of its various similarly placed functionaries. In exit conference department assured to take rectificatory action.
12 (Rupees in lakh) Year UP to March 03 200304 200405 200506 200607 200708 Total Outstanding 29.17 10.26 4.92 22.75 41.73 267.93 376.76
Irregular payment of salary of Rs.17.01 crore.
Temporary advance of Rs.3.77 crore remained unadjusted/ unrecovered.
Failure to prepare Departmental manual.

Chapter V – Internal Control System
147
5.1.9.2 Departmental inspection Periodic inspections by departmental officers are an important and effective tool to ensure proper functioning of the schemes in the department. The roster of inspection for officers of the Directorate was not available. While only ten inspections were carried out by the Director during 200306, no inspection was conducted by the Joint Director and the Director during 200608. Rule 291 of MPTC VolumeI provides that every DDO should make the monthly inspection of account of his office and quarterly report should be sent to higher authorities. Scrutiny of records in checked district revealed that none of DDOs carried out the regular inspection. In exit conference department assured compliance in future.
5.1.9.3 Internal Audit
Internal Audit (IA) examines and evaluates compliance to the departmental rules and procedures and statutory provisions so as to provide independent assurance to the management at senior levels on the adequacy of the internal control frame work in the department and its implementation thereof. A separate Internal Audit Wing was formed under the supervision of Joint Director (Finance) comprising of two Assistant Internal Audit Officers on deputation from the Treasury and Accounts Department and two departmental Senior Auditors. All districts were to be covered in Internal Audit every years as per applicable rules. However no internal audit was conducted up to 2003 04. During 200408, 14, 18, 24 and 24 units respectively were planned but the coverage was only 9, 9, 11 and 12 units respectively. Thus annual IA of 204 units and 367 project offices during 200308 was not conducted. Director stated that due to shortage of staff it could not be done. The selection of the units was not done on any scientific assessment of risk factors. Since all the units could not be covered during the year, there was a necessity for defining parameters regarding selection of unbiased sample on the basis of risk perception. Thus the Internal Audit process lacked the coverage as well as risk assessment. There was no manual for internal audit and process of follow up was not found effective. In exit conference department assured to take rectificatory action.
5.1.9.4 Response to Audit
The Principal Accountant General (Civil and Commercial), MP conducts statutory audit of the Department and its subordinate offices. The shortcomings are brought to notice through Inspection Reports (IRs). A half yearly report on the pending IRs is also sent to the Principal Secretary of the department to facilitate monitoring and compliance of audit observations. As of May 2008, 1175 paragraphs of 375 IRs issued up to March 2008 were pending for settlement. Of these 138 paragraphs of 75 IRs were outstanding for more than ten years. In exit conference department agreed to have Audit Committee meetings for Mahila and Bal Vikas Department in 200809 on last Thursday
Departmental inspections not conducted.
Functioning of internal audit wing was deficient.
Status of outstanding audit paras.
Audit Report (Civil) for the year ended 31 March 2008
148
and Friday of January at Gwalior and last Thursday and Friday of February at Bhopal.
5.1.9.5 Departmental Enquiry and Legal Cell in the Directorate
Although Departmental Enquiry cases against 21 gazetted officers and 63 non gazetted employees were pending as of December 2007 pertaining to the period 200207, no departmental enquiry cell was functioning at the Directorate level to expedite the cases. Details of pending court cases and the information in which first reply was yet to be submitted by the Department were not furnished to audit. Legal cell was also not functioning at the Directorate level to expedite the Court cases. Two family pension cases and one pension case and six appointment cases on compassionate ground were also pending at the Directorate level since 200607. Seven public complaints received during 200708 also remained undisposed at Directorate (3) and Government (4) level as of 15 July 2008. In exit conference the departmental officials informed that corrective actions was being taken.
5.1.9.6 Monitoring of schemes Prescribed monthly progress report (MPR) containing monthly progress of Integrated Child Development Service and other schemes is to reach the Directorate by 10 th of succeeding month. The district units were sending the MPRs with a delay up to two and half months regularly. Such delays compromise with the effectiveness of the monitoring system. In exit conference the department agreed to ensure proper and timely monitoring.
5.1.10 Conclusion
The internal controls in the Department were found deficient. Nonobservation of budgetary controls resulted in persistent savings. Parking of fund under Civil Deposits not only inflated the expenditure but also effected future budget formulation. Cash management system showed weakness. Supreme Court directives were not acted upon in regard to coverage of all beneficiaries under SNP. Several irregularities were observed in implementation of LFMS. Vacancies in post of field officials adversely effected the implementation of schemes. Medicine and education kits were not provided to AWC during 2006 08. The Department did not have an effective internal audit system. Extent of compliance with the existing rules, procedures and instructions could not be monitored on a regular basis. Department also did not have a manual for its operative procedures.
5.1.11 Recommendation Ø The Department should prepare its departmental and office procedure
manual for proper guidance and control of activities.
Non functioning of Departmental Enquiry and Legal Cell.
Chapter V – Internal Control System
149
Ø In order to ensure timely and accurate preparation of Budget Estimates, inputs from subordinate offices should be obtained well in time and provisions against vacant posts should be quantified separately. Depending on progress of filling up the posts, the amounts against vacant posts should be surrendered periodically.
Ø DDOs, may be impressed upon to pay sufficient attention on proper maintenance of basic records like cash books.
Ø Internal audit wing should be strengthened by deploying adequate staff and employing suitable methods of planning and selection of units. Efforts should also be made to cover more units under Internal Audit. The department agreed with the recommendations in exit conference.
Gwalior (SANAT KUMAR MISHRA) The Principal Accountant General
(Civil and Commercial Audit) Madhya Pradesh
Countersigned
New Delhi (VINOD RAI) The Comptroller and Auditor General of India
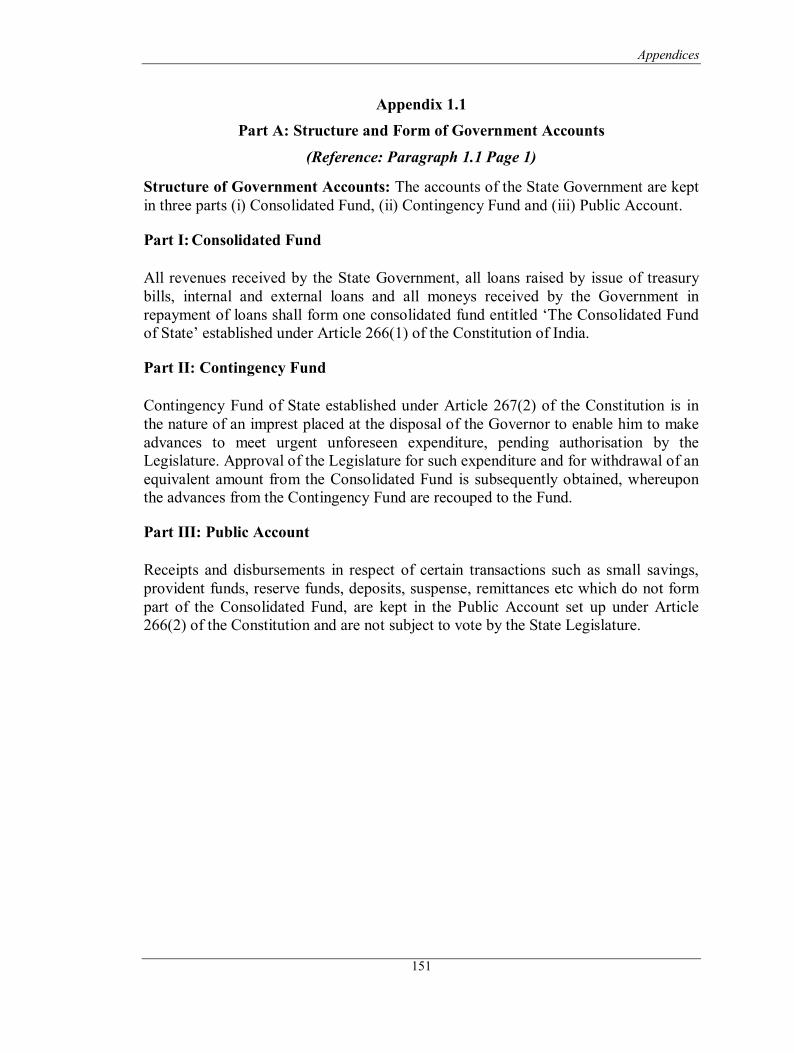
Appendices
151
Appendix 1.1 Part A: Structure and Form of Government Accounts
(Reference: Paragraph 1.1 Page 1)
Structure of Government Accounts: The accounts of the State Government are kept in three parts (i) Consolidated Fund, (ii) Contingency Fund and (iii) Public Account.
Part I:Consolidated Fund
All revenues received by the State Government, all loans raised by issue of treasury bills, internal and external loans and all moneys received by the Government in repayment of loans shall form one consolidated fund entitled ‘The Consolidated Fund of State’ established under Article 266(1) of the Constitution of India.
Part II: Contingency Fund
Contingency Fund of State established under Article 267(2) of the Constitution is in the nature of an imprest placed at the disposal of the Governor to enable him to make advances to meet urgent unforeseen expenditure, pending authorisation by the Legislature. Approval of the Legislature for such expenditure and for withdrawal of an equivalent amount from the Consolidated Fund is subsequently obtained, whereupon the advances from the Contingency Fund are recouped to the Fund.
Part III: Public Account
Receipts and disbursements in respect of certain transactions such as small savings, provident funds, reserve funds, deposits, suspense, remittances etc which do not form part of the Consolidated Fund, are kept in the Public Account set up under Article 266(2) of the Constitution and are not subject to vote by the State Legislature.

Audit Report (Civil) for the year ended 31 March 2008
152
PART B Layout of Finance Accounts
(Reference: Paragraph 1.1 Page 1)
Statement Lay Out
Statement No.1 Presents the summary of transactions of the State Governmentreceipts and expenditure, revenue and capital, public debt receipts and disbursements etc in the Consolidated Fund, Contingency Fund and Public Account of the State.
Statement No.2 Contains the summarized statement of capital outlay showing progressive expenditure to the end of 2007 08.
Statement No.3 Gives financial results of irrigation works, their revenue receipts, working expenses and maintenance charges, capital outlay, net profit or loss, etc.
Statement No.4 Indicates the summary of debt position of the State, which includes borrowing from intern debt, Government of India, other obligations and servicing of debt.
Statement No.5 Gives the summary of loans and advances given by the State Government during the year repayments made, recoveries in arrears etc.
Statement No.6 Gives the summary of guarantees given by the Government for repayment of loans etc. raised by the statutory corporations, local bodies and other institutions.
Statement No.7 Gives the summary of cash balances and investments made out of such balances.
Statement No.8 Depicts the summary of balances under Consolidated Fund, Contingency Fund and Public Account as on 31 March 2008.
Statement No.9 Shows the revenue and expenditure under different heads for the year 200708 as a percentage of total revenue/expenditure.
Statement No.10 Indicates the distribution between the charged and voted expenditure incurred during the year.
Statement No.11 Indicates the detailed account of revenue receipts by minor heads

Appendices
153
Statement No.12 Provides accounts of revenue expenditure by minor heads under nonplan and plan separately and capital expenditure by major head wise.
Statement No.13 Depicts the detailed capital expenditure incurred during and to the end of 200708.
Statement No.14 Shows the details of investment of the State Government in statutory corporations, Government companies, other joint stock companies, cooperative banks and societies etc up to the end of 200708.
Statement No.15 Depicts the capital and other expenditure to the end of 200708 and the principal sources from which the funds were provided for that expenditure.
Statement No.16 Gives the detailed account of receipts disbursements and balances under heads of accounts relating to Debt, Contingency Fund and Public Account.
Statement No.17 Presents detailed account of debt and other interest bearing obligations of the Government of M.P.
Statement No.18 Provides the detailed account of loans and advances given by the Government of Madhya Pradesh, the amount of loan repaid during the year, the balance as on 31 March 2008.
Statement No.19 Gives the details of earmarked balances of reserve funds.

Audit Report (Civil) for the year ended 31 March 2008
154
PART C
List of Terms Used in the Chapter I and basis of their Calculation
(Reference: Paragraph 1.2 Page 4 )
Terms Basis of calculation Buoyancy of a parameter Rate of Growth of the parameter
GSDP Growth Buoyancy of a parameter (X) with respect to another parameter (Y)
Rate of Growth of the parameter (X) Rate of Growth of the parameter (Y)
Rate of Growth (ROG) [(Current year Amount/previous year Amount)1]*100
Development Expenditure Social Services + Economic Services Average interest paid by the State Interest payment / [(Amount of
previous year's Fiscal Liabilities + Current year's Fiscal Liabilities)/2]*100
Weighted Interest Rate (Iw) W I I i
n
i i w ∑ = , Where I i is the rate of interest on
the i th stock of debt and W i is the share of i th stock in the
total debt stock of the State.
Interest spread GSDP growth – Weighted Interest Rate
Quantum spread Debt stock * Interest spread Interest received as per cent to Loans Outstanding
Interest Received [(Opening balance + Closing balance of Loans and Advances)/2]*100
Revenue Deficit Revenue Receipts – Revenue Expenditure
Fiscal Deficit Revenue Expenditure + Capital Expenditure + Net Loans and Advances Revenue Receipts – Miscellaneous Capital Receipts
Primary Deficit Fiscal Deficit – Interest Payment Balance from Current Revenue (BCR)
Revenue Receipts minus all plan grants and Nonplan Revenue Expenditure excluding debits under 2048 Appropriation for Reduction of Avoidance of Debt
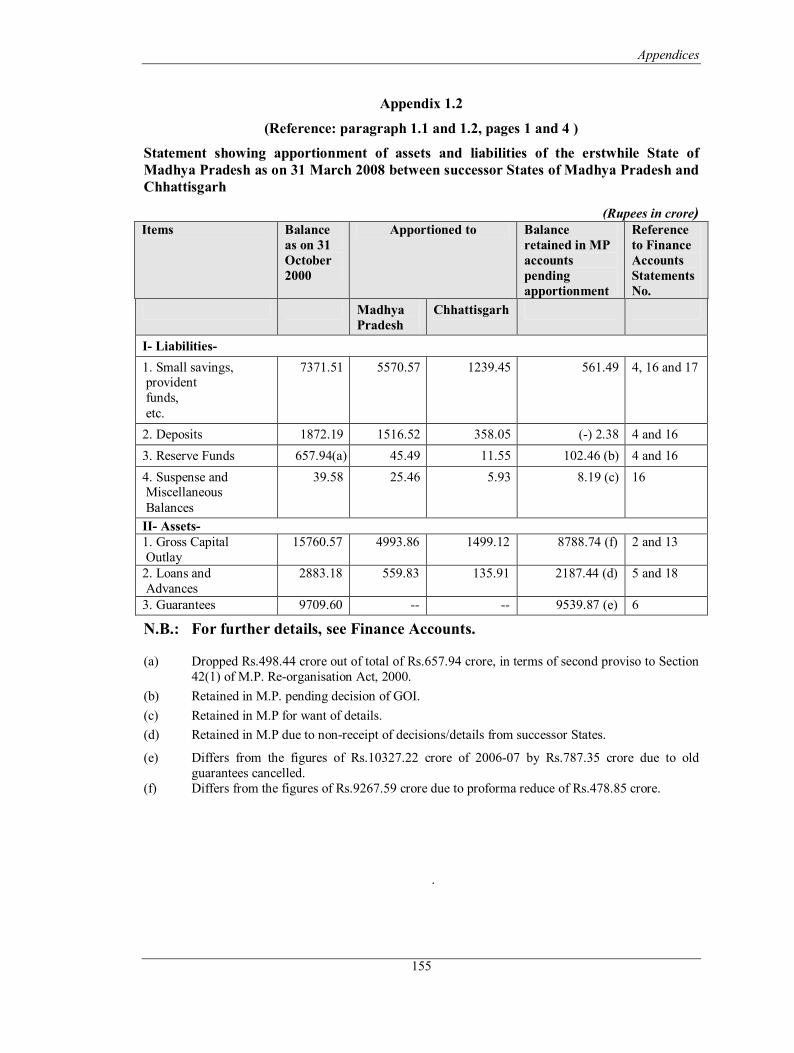
Appendices
155
Appendix 1.2
(Reference: paragraph 1.1 and 1.2, pages 1 and 4 )
Statement showing apportionment of assets and liabilities of the erstwhile State of Madhya Pradesh as on 31 March 2008 between successor States of Madhya Pradesh and Chhattisgarh
(Rupees in crore) Items Balance
as on 31 October 2000
Apportioned to Balance retained in MP accounts pending apportionment
Reference to Finance Accounts Statements No.
Madhya Pradesh
Chhattisgarh
I Liabilities 1. Small savings, provident funds, etc.
7371.51 5570.57 1239.45 561.49 4, 16 and 17
2. Deposits 1872.19 1516.52 358.05 () 2.38 4 and 16 3. Reserve Funds 657.94(a) 45.49 11.55 102.46 (b) 4 and 16 4. Suspense and Miscellaneous Balances
39.58 25.46 5.93 8.19 (c) 16
II Assets 1. Gross Capital Outlay
15760.57 4993.86 1499.12 8788.74 (f) 2 and 13
2. Loans and Advances
2883.18 559.83 135.91 2187.44 (d) 5 and 18
3. Guarantees 9709.60 9539.87 (e) 6
N.B.: For further details, see Finance Accounts.
(a) Dropped Rs.498.44 crore out of total of Rs.657.94 crore, in terms of second proviso to Section 42(1) of M.P. Reorganisation Act, 2000.
(b) Retained in M.P. pending decision of GOI. (c) Retained in M.P for want of details. (d) Retained in M.P due to nonreceipt of decisions/details from successor States.
(e) Differs from the figures of Rs.10327.22 crore of 200607 by Rs.787.35 crore due to old guarantees cancelled.
(f) Differs from the figures of Rs.9267.59 crore due to proforma reduce of Rs.478.85 crore.
.

Audit Report (Civil) for the year ended 31 March 2008
156
Appendix 1.3 (Reference: paragraph 1.2.1.1 page 5 )
Trends in Select Fiscal Indicators (Rupees in crore)
Previous Year
Current Year
S.No. Fiscal Indicators
200506 A/C
200607 R.E
200708 B.E.
% Change in previous year over 200506
% Change in current year over previous year
(1) (2) (3) (4) (5) (6) (7)
1 Revenue Receipts (2+3+4)
20596.80 24859.86 27995.84 20.70 12.62
2 Tax Revenue (2.1+2.2)
15456.06 17790.15 20101.59 15.10 12.99
2.1 State Tax 9113.83 10167.17 11716.31 11.56 15.24
2.2 Share in Central Taxes
6342.23 7622.98 8385.28 20.19 10.00
3 NonTax Revenue
2208.20 2334.17 2427.03 5.70 3.98
4 Grantinaid from Central Govt.
2932.54 4735.54 5467.22 61.48 15.45
5 Capital Receipts (6+7+8)
7451.75 4192.62 4816.54 () 43.74 14.88
6 Recovery of loans and advances
2851.98 58.26 43.78 () 97.96 () 24.85
7 Net public debt 4206.69 3489.06 4705.50 () 17.06 34.86
8 Net Receipts from Public Account
393.08 645.30 67.26 64.17 () 89.58
9 Total Receipts (1+5)
28048.55 29052.48 32812.38 3.58 12.94
10 Revenue Expenditure (10.1+10.2)
20563.48 23096.48 25989.11 12.32 12.52
10.1 NonPlan Revenue Expenditure
16351.00 17271.60 19112.90 5.63 10.66
10.2 Plan Revenue Expenditure
4212.48 5824.88 6876.21 38.28 18.05

Appendices
157
1 2 3 4 5 6 7
10.3 Revenue Expenditure
Of which
10.3.1 Interest payments 3421.79 3910.02 4252.32 14.27 8.78
10.3.2 Subsidies 6519.46 7110.47 7860.21 9.07 10.54
10.3.3 .
Wages & Salaries 6038.80 6900.76 8185.67 14.27 18.62
10.3.4 Pension Payments 1557.15 1729.16 1999.05 11.05 15.61
11 Capital Expenditure (11.1+11.2)
6623.28 5172.28 5881.46 ()21.90 13.71
11.1 NonPlan Capital Expenditure
2923.47 315.86 197.00 ()89.20 ()37.63
11.2 Plan Capital Expenditure
3699.81 4856.42 5684.46 31.26 17.05
12 Loans and Advances
834.44 1242.59 823.68 48.91 () 33.71
12.1 Non Plan Loans and Advances
796.53 890.02 266.22 11.74 () 70.09
12.2 Plan Loans and Advances
37.91 352.57 557.46 830.01 58.11
13 Total Expenditure 28021.20 29511.35 32694.25 5.32 10.79
13.1 NonPlan Expenditure (10.1+11.1+12.1)
20071.00 18477.48 19576.12 () 7.94 5.95
13.2 Plan Expenditure (10.2+11.2+12.2)
7950.20 11033.87 13188.13 38.79 18.89
14 Revenue Deficit (110)
33.32 1763.38 2006.73 5192.26 13.80
15 Fiscal Deficit (1+613)
() 4572.42
() 4593.23 () 4654.63 0.46 1.34
16 Primary Deficit [1+6(1310.3.1)]
() 1150.63
() 683.21 () 402.31 () 40.62 () 41.26

Audit Report (Civil) for the year ended 31 March 2008
158
Appendix 1.4
(Reference: paragraphs 1.2 and 1.7, pages 4 and 22 )
Summarised financial position of the Government of Madhya Pradesh as on 31 March 2008
(Rupees in crore)
As on 31.3.2007 Liabilities As on 31.3.2008
31666.69 Internal Debt 33258.49
11308.26 Market Loans bearing interest 12645.30
1.13 Market Loans not bearing interest 1.14
6184.75 Loans from other Institutions (Autonomous bodies)
6311.66
14172.55 Special Security issued to NSS fund of Central Government
14300.39
8679.70 Loans and Advances from Central Government
8781.85
1.88 Pre 198485 Loans 1.88
73.92 NonPlan Loans 69.77
8461.63 Loans for State Plan Schemes 8566.85
27.85 Loans for Central Plan Schemes 25.09
114.42 Loans for Centrally Sponsored Plan Schemes 118.26
100.00 Contingency Fund 100.00
7644.01 Small Savings, Provident Funds, etc. 7836.48
3621.75 Deposits 3900.26
1885.86 Reserve Funds 1851.74
125.53 Suspense & Miscellaneous 141.42
53723.54 55870.24
Note: Apportionment of assets and liabilities except Public debt of the composite State of Madhya Pradesh immediately prior to the appointed day i.e. 1 November 2000 is yet to be finalized.

Appendices
159
As on 31.03.2007 Assets As on 31.03.2008
38201.34 Gross Capital Outlay on Fixed Assets 44529.59
8161.71 Investments in shares of Companies, Corporations, etc.
8844.99
30039.63 Other Capital Outlay 35684.60
4773.49 Loans and Advances 5823.13
2211.33 Loans for Power Projects 2730.26
2531.79 Other Development Loans 3060.86
30.37 Loans to Government servants and Miscellaneous loans
32.01
9.13 Advances 14.10
380.43 Remittance Balances 322.54
Suspense and Miscellaneous
2409.77 Cash 1792.45
2.64 Cash in Treasuries and Local Remittances
2.65
() 334.42 Deposits with Reserve Bank () 1303.79
17.97 Departmental Cash Balance including permanent cash imprest
16.64
2723.58 Cash Balance Investments and investment of earmarked funds
3076.95
7949.38 Deficit on Government account 3388.43
11261.59 (i) Accumulated deficit brought forward
7949.38
() 3331.67 (ii) Revenue Surplus of the current year
() 5087.63
0.22 (iii) InterState Settlement 0.27
60.00* (iv) Amount closed to Government account
33.81
() 40.76 (v) Proforma transfer to Chhattisgarh during the year
() 0.78
(vi) Proforma reduce in respect of M.P. S.E.B.
478.85
(vii) Share of Investment allotted to Chhatisgarh
14.53
53723.54 55870.24
* Appropriation to Contingency fund, which was closed to Government Account.
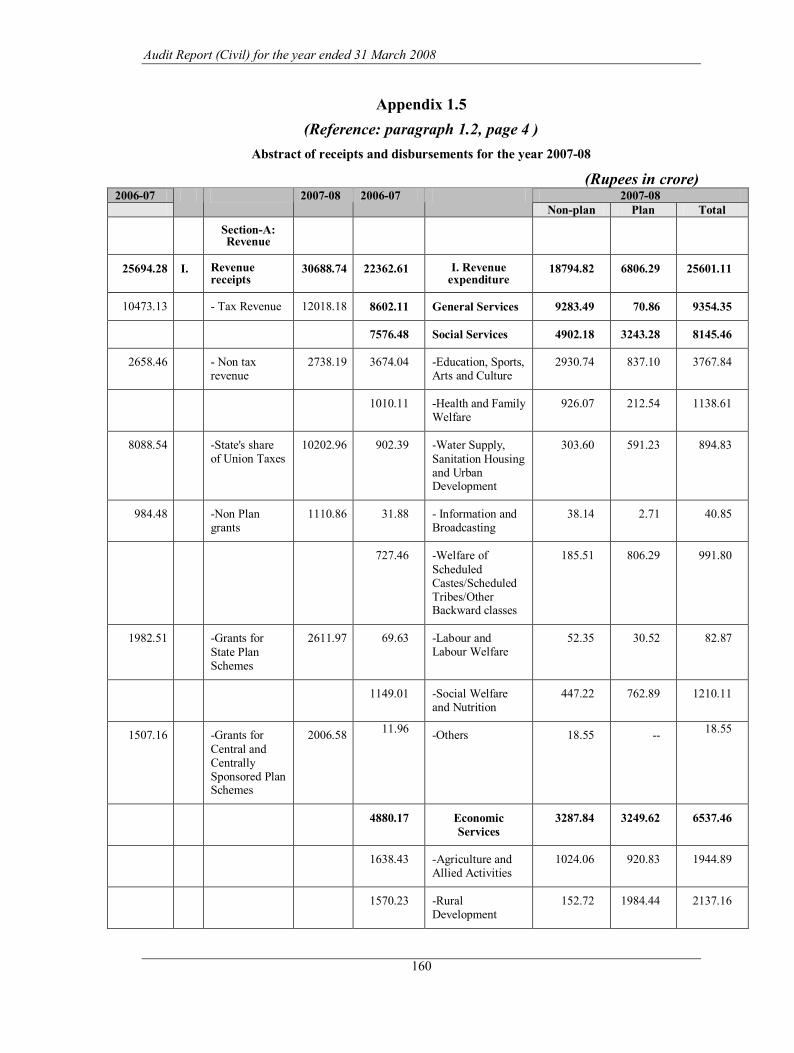
Audit Report (Civil) for the year ended 31 March 2008
160
Appendix 1.5 (Reference: paragraph 1.2, page 4 )
Abstract of receipts and disbursements for the year 200708
(Rupees in crore) 200607 200708 200708 200607
Nonplan Plan Total SectionA: Revenue
25694.28 I. Revenue receipts
30688.74 22362.61 I. Revenue expenditure
18794.82 6806.29 25601.11
10473.13 Tax Revenue 12018.18 8602.11 General Services 9283.49 70.86 9354.35
7576.48 Social Services 4902.18 3243.28 8145.46
2658.46 Non tax revenue
2738.19 3674.04 Education, Sports, Arts and Culture
2930.74 837.10 3767.84
1010.11 Health and Family Welfare
926.07 212.54 1138.61
8088.54 State's share of Union Taxes
10202.96 902.39 Water Supply, Sanitation Housing and Urban Development
303.60 591.23 894.83
984.48 Non Plan grants
1110.86 31.88 Information and Broadcasting
38.14 2.71 40.85
727.46 Welfare of Scheduled Castes/Scheduled Tribes/Other Backward classes
185.51 806.29 991.80
1982.51 Grants for State Plan Schemes
2611.97 69.63 Labour and Labour Welfare
52.35 30.52 82.87
1149.01 Social Welfare and Nutrition
447.22 762.89 1210.11
1507.16 Grants for Central and Centrally Sponsored Plan Schemes
2006.58 11.96 Others 18.55 18.55
4880.17 Economic Services
3287.84 3249.62 6537.46
1638.43 Agriculture and Allied Activities
1024.06 920.83 1944.89
1570.23 Rural Development
152.72 1984.44 2137.16
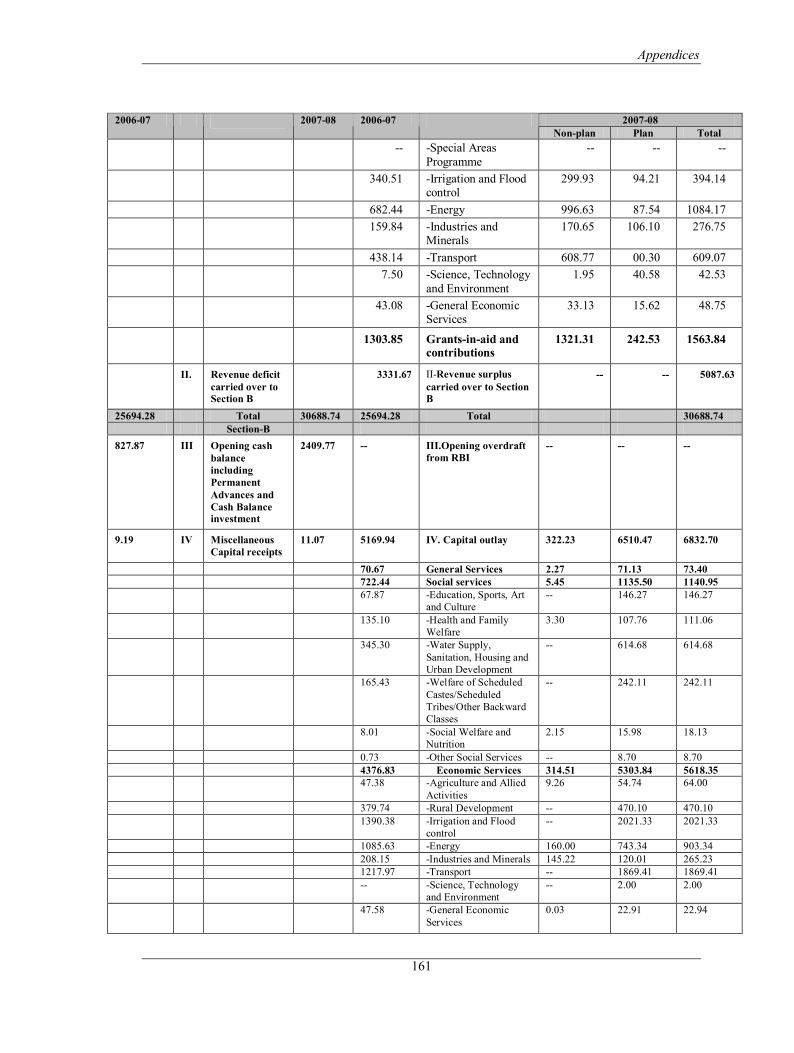
Appendices
161
200708 200607 200708 200607 Nonplan Plan Total
Special Areas Programme
340.51 Irrigation and Flood control
299.93 94.21 394.14
682.44 Energy 996.63 87.54 1084.17 159.84 Industries and
Minerals 170.65 106.10 276.75
438.14 Transport 608.77 00.30 609.07 7.50 Science, Technology
and Environment 1.95 40.58 42.53
43.08 General Economic Services
33.13 15.62 48.75
1303.85 Grantsinaid and contributions
1321.31 242.53 1563.84
II. Revenue deficit carried over to Section B
3331.67 IIRevenue surplus carried over to Section B
5087.63
25694.28 Total 30688.74 25694.28 Total 30688.74 SectionB
827.87 III Opening cash balance including Permanent Advances and Cash Balance investment
2409.77 III.Opening overdraft from RBI
9.19 IV Miscellaneous Capital receipts
11.07 5169.94 IV. Capital outlay 322.23 6510.47 6832.70
70.67 General Services 2.27 71.13 73.40 722.44 Social services 5.45 1135.50 1140.95 67.87 Education, Sports, Art
and Culture 146.27 146.27
135.10 Health and Family Welfare
3.30 107.76 111.06
345.30 Water Supply, Sanitation, Housing and Urban Development
614.68 614.68
165.43 Welfare of Scheduled Castes/Scheduled Tribes/Other Backward Classes
242.11 242.11
8.01 Social Welfare and Nutrition
2.15 15.98 18.13
0.73 Other Social Services 8.70 8.70 4376.83 Economic Services 314.51 5303.84 5618.35 47.38 Agriculture and Allied
Activities 9.26 54.74 64.00
379.74 Rural Development 470.10 470.10 1390.38 Irrigation and Flood
control 2021.33 2021.33
1085.63 Energy 160.00 743.34 903.34 208.15 Industries and Minerals 145.22 120.01 265.23 1217.97 Transport 1869.41 1869.41 Science, Technology
and Environment 2.00 2.00
47.58 General Economic Services
0.03 22.91 22.94

Audit Report (Civil) for the year ended 31 March 2008
162
200607 200708 200607 200708 28.12 V Recoveries of Loans
and Advances 105.24 953.07 V. Loans and Advances disbursed 1154.88
0.75 From Power Projects 0.75 654.68 For Power Projects 519.68 2.84 From Government
Servants () 1.57*** 0.03 To Government Servants 0.05
24.53 From others 106.06 298.36 To others 635.15 1.11 VI InterState Settlement 1.79 1.33 VI. Inter State Settlement 2.06
3331.67 VII Revenue Surplus brought down
5087.63 VII. Revenue deficit brought down
4602.97 VIII Public debt receipt 3370.95 1731.53 VIII. Repayment of Public debt 1677.00 4171.62 Internal debt other
than ways and means advances and overdraft
2831.93 988.87 Internal debt other than ways and means advances and overdraft
1240.13
431.35 Loans and advances from Central Government
539.02 742.66* Repayment of loans and advances to Central Government
436.87**
68.15 IX Contingency Fund 60.00 IX. Appropriation to the Contingency Fund
32225.38 X Public Account receipts
39895.93 30768.82 X. Public Account disbursements 39423.29
1419.33 Small Savings and Provident Funds
1438.87 1261.44 Small Savings and Provident Funds 1245.60
819.17 Reserve funds 716.06 397.18 Reserve Funds 750.19 18954.61 Suspense and
Miscellaneous 23275.43 18883.18 Suspense and Miscellaneous 23293.35
6596.27 Remittances 8928.62 6573.26 Remittances 8870.74 4436.00 Deposits and Advances 5536.95 3653.76 Deposits and Advances 5263.41
XI Closing Overdraft from Reserve Bank of India
2409.77 XI Cash Balance at end of the year
1792.45
2.64 Cash in Treasuries and Local Remittances
2.65
() 334.42 Deposits with Reserve Bank () 1303.79
17.97 Departmental Cash Balance including permanent cash imprest
16.64
2723.58 Cash Balance Investment and Investment of Earmarked Funds
3076.95
66788.74 Total 81571.12 66788.74 Total 81571.12 * Includes Rs.726.12 crore for 200506 and 200607 received by the State Government on account of Debt Consolidation and Relief Facility to state under recommendation of the Twelfth Finance Commission from Government of India.
** Includes Rs.363.06 crore for 200708 received by the State Government on account of Debt Consolidation and Relief Facility to state under recommendation of the Twelfth Finance Commission from Government of India.
*** Minus transaction is due to adjustment of previous year.
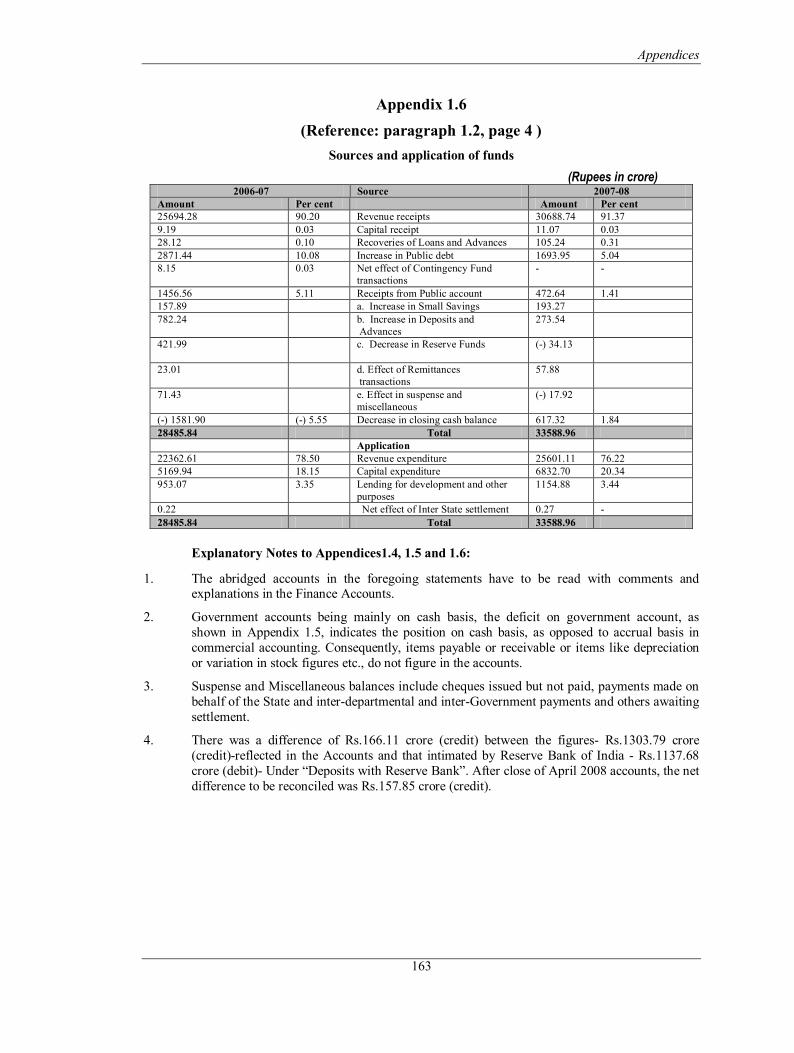
Appendices
163
Appendix 1.6 (Reference: paragraph 1.2, page 4 )
Sources and application of funds (Rupees in crore)
200607 Source 200708 Amount Per cent Amount Per cent 25694.28 90.20 Revenue receipts 30688.74 91.37 9.19 0.03 Capital receipt 11.07 0.03 28.12 0.10 Recoveries of Loans and Advances 105.24 0.31 2871.44 10.08 Increase in Public debt 1693.95 5.04 8.15 0.03 Net effect of Contingency Fund
transactions
1456.56 5.11 Receipts from Public account 472.64 1.41 157.89 a. Increase in Small Savings 193.27 782.24 b. Increase in Deposits and
Advances 273.54
421.99 c. Decrease in Reserve Funds () 34.13
23.01 d. Effect of Remittances transactions
57.88
71.43 e. Effect in suspense and miscellaneous
() 17.92
() 1581.90 () 5.55 Decrease in closing cash balance 617.32 1.84 28485.84 Total 33588.96
Application 22362.61 78.50 Revenue expenditure 25601.11 76.22 5169.94 18.15 Capital expenditure 6832.70 20.34 953.07 3.35 Lending for development and other
purposes 1154.88 3.44
0.22 Net effect of Inter State settlement 0.27 28485.84 Total 33588.96
Explanatory Notes to Appendices1.4, 1.5 and 1.6:
1. The abridged accounts in the foregoing statements have to be read with comments and explanations in the Finance Accounts.
2. Government accounts being mainly on cash basis, the deficit on government account, as shown in Appendix 1.5, indicates the position on cash basis, as opposed to accrual basis in commercial accounting. Consequently, items payable or receivable or items like depreciation or variation in stock figures etc., do not figure in the accounts.
3. Suspense and Miscellaneous balances include cheques issued but not paid, payments made on behalf of the State and interdepartmental and interGovernment payments and others awaiting settlement.
4. There was a difference of Rs.166.11 crore (credit) between the figures Rs.1303.79 crore (credit)reflected in the Accounts and that intimated by Reserve Bank of India Rs.1137.68 crore (debit) Under “Deposits with Reserve Bank”. After close of April 2008 accounts, the net difference to be reconciled was Rs.157.85 crore (credit).

Audit Report (Civil) for the year ended 31 March 2008
164
APPENDIX 1.7
(Reference: Paragraph 1.5.5 Page 22)
Details of Department wise Breakup of outstanding utilization certificates
(Rupees in crore) 19972002 200203 200304 200405 200506 200607 200708 Total Sl
No. Name of Institutions
No. of Institution
No. Amt. No. Amt. No. Amt. No. Amt. No. Amt. No. Amt. No. Amt. No. Amt.
1. Educational Institutions
04 45 31.02 76 127.95 121 158.97
2. Municipal corporation and Municipalities
01 338 467.73 338 557.85 338 1872.65 1014 2898.23
3. Zilla Parishads and other Panchayati Raj Institutions
03 33 80.30 47 144.62 80 224.92
4. Development agencies
01 48 1.95 48 6.81 96 8.76
5. Hospitals and other charitable Institutions
02 1 6.32 9 7.13 10 13.45
6. Other Institutions
20 27 37.68 18 6.95 39 4.01 63 11.43 47 37.56 377 207.13 651 553.19 1222 857.95
Total 31 27 37.68 18 6.95 39 4.01 63 11.43 385 505.29 842 884.57 1169 2712.35 2543 4162.28
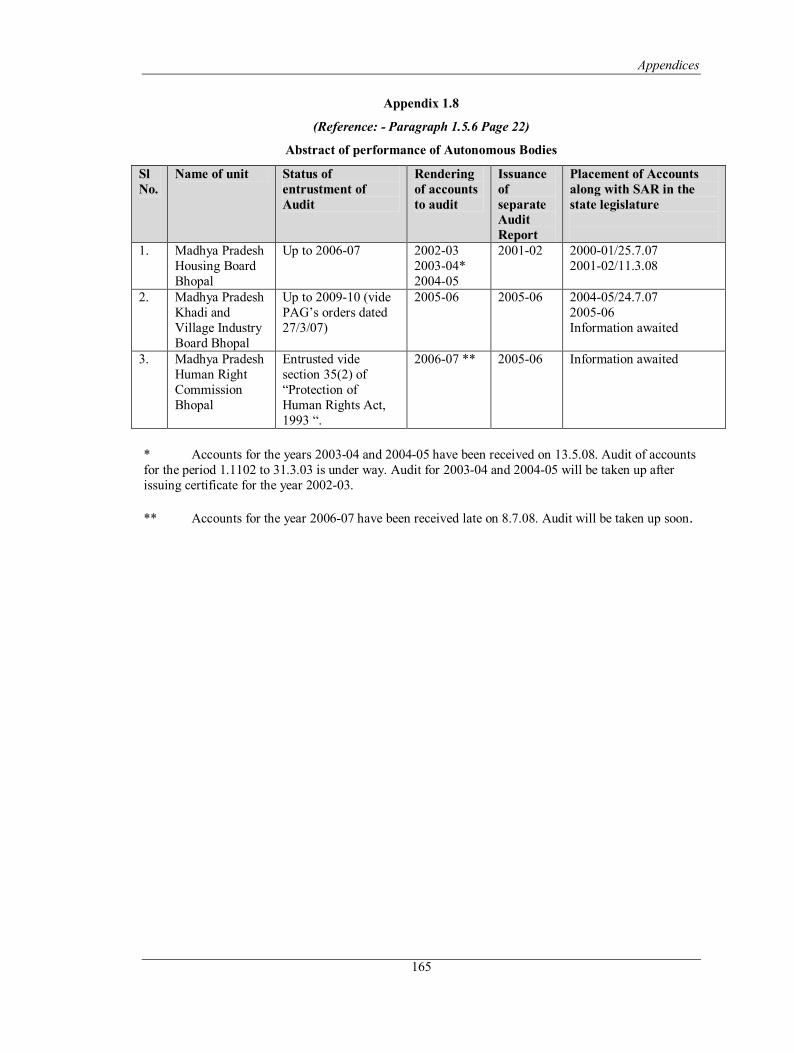
Appendices
165
Appendix 1.8
(Reference: Paragraph 1.5.6 Page 22)
Abstract of performance of Autonomous Bodies
Sl No.
Name of unit Status of entrustment of Audit
Rendering of accounts to audit
Issuance of separate Audit Report
Placement of Accounts along with SAR in the state legislature
1. Madhya Pradesh Housing Board Bhopal
Up to 200607 200203 200304* 200405
200102 200001/25.7.07 200102/11.3.08
2. Madhya Pradesh Khadi and Village Industry Board Bhopal
Up to 200910 (vide PAG’s orders dated 27/3/07)
200506 200506 200405/24.7.07 200506 Information awaited
3. Madhya Pradesh Human Right Commission Bhopal
Entrusted vide section 35(2) of “Protection of Human Rights Act, 1993 “.
200607 ** 200506 Information awaited
* Accounts for the years 200304 and 200405 have been received on 13.5.08. Audit of accounts for the period 1.1102 to 31.3.03 is under way. Audit for 200304 and 200405 will be taken up after issuing certificate for the year 200203.
** Accounts for the year 200607 have been received late on 8.7.08. Audit will be taken up soon.

Audit Report (Civil) for the year ended 31 March 2008
166
Appendix 1.9
(Reference: paragraph 1.6, page 22 )
Department/ year wise breakup of Misappropriations, Defalcations etc as on 31 March 2008
(Amount in Rupees) Sl. No.
Major Head
Name of Department
Up to March 2004 200405 200506 200607 200708 Grand Total
No. of cases
Amount No. of cases
Amount No. of cases
Amount No. of cases
Amount No. of cases
Amount No. of cases
Total Amount
1. 2210 Medical & Public Health Department
62 9348287.29 1 27022.00 63 9375309.29
2. 2245 Natural Calamities 1 16536.05 1 16536.05 3. 2051 Public Service
Commission 1 23109.71 1 23109.71
4. 2014 Administration of Justice
7 632876.11 2 127963.00 9 760839.11
5. 2054 Treasury and Accounts (Finance Deptt.)
12 3322206.95 12 3322206.95
6. 2029 Land Revenue 13 405863.49 13 405863.49 7. 2053 District
Administration 3 86919.68 1 1575.00 4 88494.68
8. 2058 Printing and Stationery
1 66739.00 1 66739.00
9. 2211 Family Welfare 19 710570.11 19 710570.11 10. 2403 Veterinary
Services 16 1310909.90 8 80257.00 4 36954.00 1 63493.00 29 1491613.90
11. 2225 Welfare of SC/ST OBC
47 2121510.81 47 2121510.81
12. 2030 Stamp & Registration
1 95980.00 1 34155.00 2 130135.00
13. 2055 Police 198 10005647.57 33 744330.00 40 524283.00 11 141798.07 228 3929360.62 510 15345419.23

Appendices
167
Sl. No.
Major Head
Name of Department
Up to March 2004 200405 200506 200607 200708 Grand Total
No. of cases
Amount No. of cases
Amount No. of cases
Amount No. of cases
Amount No. of cases
Amount No. of cases
Total Amount
14 2041 Transport 1 563756.00 1 563756.00 15. 2235 Panchayat
and Social Welfare
7 559650.15 1 159412.00 8 719062.15
16. 2235 Women and Child Welfare
6 231018.00 1 131102.00 7 362121.00
17. 2235 Rehabilitation Department
2 47303.00 2 47303.00
18. 2401 Agriculture Deptt.
21 872324.10 3 182840.00 3 793900.00 27 1849064.10
19. 2402 Agriculture Deptt.
8 184825.25 1 40487.00 9 225312.25
20. 2851 Village Industry
4 287287.40 4 287287.40
21. 2230 Labour 7 774332.00 2 13315.00 1 4800.00 10 792447.00 22. 2039 State Excise 11 457589.00 11 457589.00 23. 2408 Food & Civil
Supply 1 52357.35 1 1100.00 2 53457.35
24. 2425 Cooperative 2 111774.00 2 111774.00 25. 2202 Primary
Education 111 5536512.00 9 1734581.00 7 368047.47 12 15077283.00 139 22716423.47
26. 2202 Higher Education
9 943561.00 1 3545.00 6 171325.00 10 321314.00 8 328806.00 34 1768551.00
27. 2203 Technical Education
5 885115.00 2 95531.00 3 196753.50 7 1565110.00 6 303391.00 23 3045900.50
28. 2205 Art & Culture 1 1312117.70 1 25000.00 2 1337117.70

Audit Report (Civil) for the year ended 31 March 2008
168
Sl. No.
Major Head
Name of Department
Up to March 2004 200405 200506 200607 200708 Grand Total
No. of cases
Amount No. of cases
Amount No. of cases
Amount No. of cases
Amount No. of cases
Amount No. of cases
Total Amount
29. 2501, 2505, 2515
Rural Development and Employment
9 622806.44 1 4231000.00 10 4853806.44
30. 2217 Urban Development Department
1 2000.00 1 2000.00
31. 2852 Village Industry
1 103000.00 1 103000.00
32. 2853 Mines and Minerals
2 54179.00 1 3000.00 3 57179.00
Total 589 41645664.03 55 1542432 69 3538813.50 39 6782254.54 255 19702333.62 1007 73211497.69

Appendices
169
Appendix 1.10
(Reference: paragraph 1.6.1, page 22)
Write off of losses, etc
Sl. No. Major Head Department Number of cases
Amount (in Rupees)
01. 2245 Relief on account of Natural
Calamities
01 4667000.00
02. 2014 Administration of Justice 01 59210.50
03. 2029 Land Revenue 01 61800.00
04. 2202 Primary Education 05 44280.00
05. 2202 Higher Education 03 10936.00
06. 2501,2505 &
2515
Rural Development &
Employment
01 2374.00
07. 2055 Police 52 803635.67
08. 2225 Tribal Welfare 01 100554.05
09. 2401 Agriculture Department 01 8000.00
10. 2230 Labour 01 3337.00
11. 2039 State Excise 01 22714.72
TOTAL 68 5783841.94

Audit Report (Civil) for the year ended 31 March 2008
170
Appendix 1.11
(Reference paragraphs 1.2 and 1.7 pages 4 and 22 )
TimeSeries data on State Government Finances (Rupees in crore)
200304 200405 200506 200607 200708 Part A. Receipts 1. Revenue Receipts 14289 19743 20597 25694 30689 (i) Tax Revenue 6789(48) 7773(39) 9115(44) 10473(41) 12018(39)
Taxes on Sales, Trade, etc. 3293(49) 3913(51) 4508(50) 5261(50) 6045(50) State Excise 1086(16) 1193(15) 1370(15) 1547(15) 1854(15) Stamps and Registration fees 614(9) 789(10) 1009(11) 1251(12) 1532(13) Taxes on Vehicles 455(6) 489(6) 556(6) 634(6) 703(6) Other Taxes 1341(20) 1389(18) 1672(18) 1780(17) 1884(16)
(ii) Non Tax Revenue 1480(10) 4462(23) 2208(11) 2658(10) 2738(9) (iii) State’s share in Union taxes
and duties 4247(30) 5077(26) 6341(31) 8089(31) 10203(33)
(iv) Grantsinaid from GOI 1773(12) 2431(12) 2933(14) 4474(17) 5730(19) 2. Non debt Capital Receipts * 9 11 2A. Inter State Settlement 1 2 3. Total revenue and Non debt
capital receipts (1 + 2 + 2A) 14289 19743 20597 25704 30702
4. Recovery of Loans and Advances
36 53 2852 28 105
5. Public Debt Receipts 9938 8849 5161 4603 3371 Internal Debt (Excluding. Ways & Means Advances and Overdraft)
7949(80) 6968(79) 4867(94) 4172(91) 2832(84)
Loans and Advances from Government of India S
1722(17) 1881(21) 294(6) 431(9) 539(16)
Net Transactions under Ways and means advances and overdraft
267(3)
6. Total receipts in the Consolidated fund (3+4+5)
24263 28645 28610 30335 34178
7. Contingency Fund receipts 1 68 8. Public Account receipts 22285 24790 29038 32225 39896 9. Total receipts of the Government (6+7+8)
46548 53436 57648 62628 74074
Part B. Expenditure/ Disbursement 10. Revenue expenditure 18765(87) 18026(69) 20563(73) 22363(79) 25601(76)
Plan 2816(15) 3165(18) 4212(20) 5452(24) 6806(27) NonPlan 15949(85) 14861(82) 16351(80) 16911(76) 18795(73) General Services (including
interest, payments) 6574(35) 7468(41) 7593(37) 8602(38) 9354(37)
Social Services 5322(28) 5672(32) 6658(32) 7577(34) 8146(32) Economic Services 6278(34) 3969(22) 5195(25) 4880(22) 6537(25) Grantsinaid and contributions
591(3) 917(5) 1117(6) 1304(6) 1564(6)
11. Capital Expenditure 2679 (12) 4951(19) 6623(24) 5170(18) 6833(20) Plan 2673(100) 3568(72) 3700(56) 4855(94) 6511(95) NonPlan 6 1383(28) 2923(44) 315(6) 322(5) General Services 36(1) 146(3) 121(2) 71(1) 74(1) Social Services 535(20) 432(9) 635(10) 722(14) 1141(17) Economic Services 2108(79) 4373(88) 5867(88) 4377(85) 5618(82)
contd..
* Excludes recovery of loans and advances. S Includes ways and means advances from GOI during 200304 and 200405.

Appendices
171
Appendix 1.11 (continued) (Rupees in crore)
200304 200405 200506 200607 200708 12. Disbursement of Loans and
Advances 204(1) 3311(12) 834 (3) 953(3) 1155(4)
12A InterState settlement 1 2 13. Total expenditure (10+11+12+12A) 21648 26288 28020 28487 33591 14. Repayment of Public Debt 2275 3391 954 1732 1677
Internal Debt (excluding Ways & Means Advances and Overdraft)
278 1147 539 989 1240
Net transactions under Ways and Means Advances and Overdraft
267
Loans and Advances from Government of India
1997 1977 415 743 437*
15. Appropriation to Contingency Fund
60
16. Total disbursement out of Consolidated Fund (13+14+15)
23923 29679 28974 30279 35268
17. Contingency Fund disbursements
8
18. Public Account disbursements
22439 23591 28096 30769 39423
19. Total disbursements by the Government (16+17+18)
46362 53270 57078 61048 74691
Part C. Deficits 20. Revenue Deficit () /Surplus (+) ()4476 (+)1717 (+) 34 (+)3331 (+)5088 21. Fiscal Deficit ()/Surplus(+)
(3+413) ()7323 ()6492 ()4571 ()2755 ()2784
22. Primary Deficit ()/Surplus(+) (2123)
()4117 ()2831 ()1149 (+)1274 (+)1407
Part D. Other data
23. Interest payments (included in revenue expenditure)
3206 3661 3422 4029 4191
24. Arrears of Revenue $ (percentage of Tax & non Tax Revenue receipts)
758 (9) 34 (0.28) 986 (8.71) 919(6.99) 802(5.43)
25. Financial assistance to local bodies etc.
3324 1143 2081 767 898
26. Ways and Means Advances/ Overdraft availed (days)
200/60 127/00
27. Interest on WMA/Overdraft 13/4 4/00 28. Gross State Domestic Product
(GSDP) 102839 107282 116322 128202 (Q)# 142204 (A)#
29. Outstanding debt (Opening balance)
30340 37525 44235 49173 53280
30. Outstanding guarantees (yearend)
974 2016 613 866 856
31. Maximum amount guaranteed (year end)
12131 12507 12637 12424 12086
32. Number of incomplete projects
453 436 NA N.A. 3^
33. Capital blocked in incomplete projects
7447 9031 NA N.A. 13^
*Includes debt relief of Rs.363.06 crore under DCRF. #(Q) Quick estimates,(A)Advanced estimates. ^To the extent information available in the Finance Accounts. $Revenue figure of some principal heads of revenue.

Audit Report (Civil) for the year ended 31 March 2008
172
Appendix 1.12
(Reference: Paragraph 1.7.2.1, Page 23 )
Financial position of Statutory Corporations/Government Companies as on 31 March 2008 running in loss for the latest year for which accounts were finalized
(Rupees in lakh) Sl. No
Name of the Companies/ Corporations
Years up to which accounts furnished.
Amount invested(paidupcapital)at the end of the year Accumulated loss() at the end of 31 March of the year
Sector
State Central Others Total 1. 2. 3. 4. 5. 6. 7. 8. 9. A Government Companies (Working) 1. M.P.State Agro Industries
Development Corporation Limited, Bhopal
200506 329.50 329.50 914.50 Agriculture and allied
2. M.P.Audyogik Kendra Vikas Nigam (Rewa) Ltd,.Rewa
200607 80.00 80.00 28.55 Area Development
3. M.P.State Industrial Development Corporation Limited, Bhopal
200405 8109.18 8109.18 63405.06 Finance
4. M.P.Tourism Development Corporation Limited, Bhopal
200405 2497.29 2497.29 1071.68 Tourism
5. M.P.Paschim Kshetra Vidyut Vitran Company Limited, Indore
200708 63731.39 63731.39 67980.32 Energy
6. M.P.Madhya Kshetra Vidyut Vitran Company Limited, Bhopal
200607 44572.04 44572.04 52371.92 Energy
7. Special Economic Zone Indore Limited, Indore
200405 2697.40 2697.40 107.02 Area Development
8. M.P. Poorva Kshetra Vidyut Vitran Co. Ltd. Jabalpur
200607 34871.67 34871.67 30442.40 Energy
9. M.P. Power Transmission Co. Ltd. Jabalpur
200708 90183.03 90183.03 974.22 Energy
10. M.P. Power Generating Co. Ltd. Jabalpur
200607 168793.01 168793.01 3553.97 Energy

Appendices
173
B Government Companies (Nonworking) 1. Optel Telecommunication
Limited,Bhopal 200506 2293.42 103.29 2396.71 11532.89 Electronics
2. M.P. State Industries Corporation Limited,Bhopal
200405 1511.67 1511.67 5057.64 Industries
3. M.P.State Textiles Corporation Limited,Bhopal
200506 685.95 685.95 9528.80 Textiles
C 619(B) Companies (Working) Nil D 619(B) Companies (Nonworking) 1. M.P.Vidyut Yantra Limited,
Jabalpur 198990 126.00 24.00 150.00 377.52 Energy
E Statutory Corporations (Working) 1. M.P State Electricity
Board,Jabalpur 200506 85826.43 85826.43 86341.07 Energy
2. M.P. State Road Transport Corporation
200506 14140.34 4096.38 18236.72 78123.71 Transport
3. M.P.Financial Corporation, Indore
200708 31227.84 2101.15 33328.99 24128.75 Finance
F Statutory Corporations (Nonworking) Nil G Company under liquidation 1. M.P. Rajya Setu Nirman
Nigam Limited, Bhopal 199091 500.00 500.00 214.68 Construction
Total 552096.16 4120.38 2284.44 558500.98 436154.70
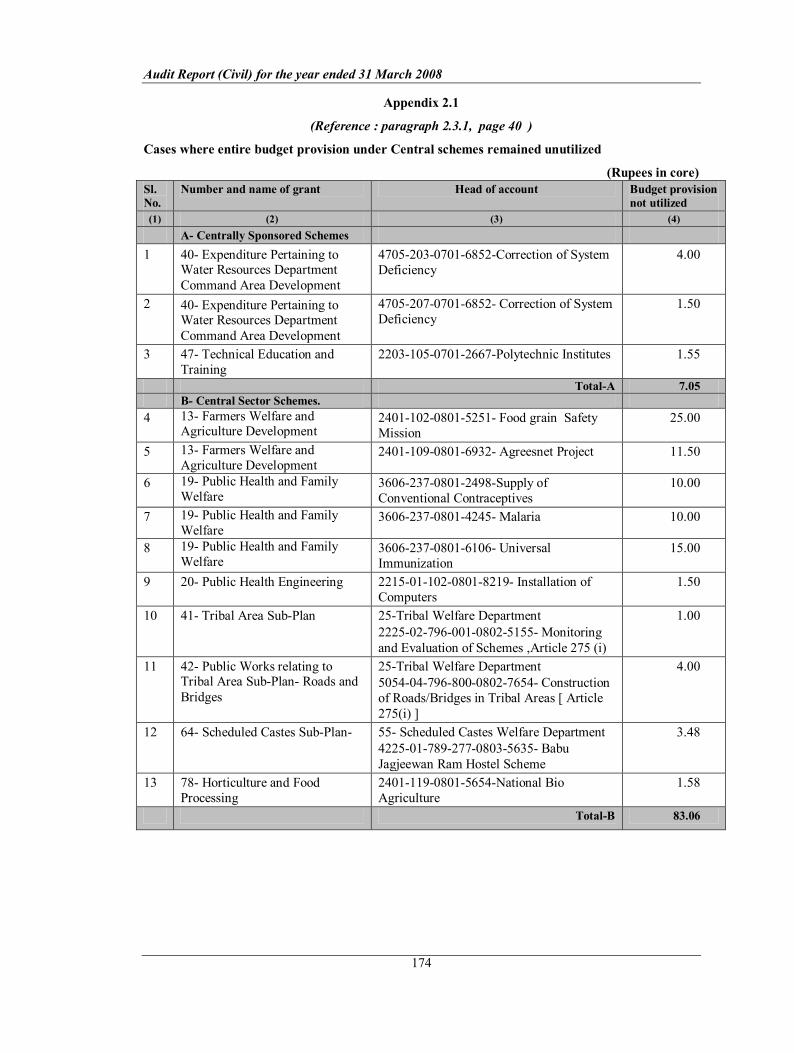
Audit Report (Civil) for the year ended 31 March 2008
174
Appendix 2.1
(Reference : paragraph 2.3.1, page 40 )
Cases where entire budget provision under Central schemes remained unutilized
(Rupees in core) Sl. No.
Number and name of grant Head of account Budget provision not utilized
(1) (2) (3) (4) A Centrally Sponsored Schemes
1 40 Expenditure Pertaining to Water Resources Department Command Area Development
470520307016852Correction of System Deficiency
4.00
2 40 Expenditure Pertaining to Water Resources Department Command Area Development
470520707016852 Correction of System Deficiency
1.50
3 47 Technical Education and Training
220310507012667Polytechnic Institutes 1.55
TotalA 7.05 B Central Sector Schemes.
4 13 Farmers Welfare and Agriculture Development
240110208015251 Food grain Safety Mission
25.00
5 13 Farmers Welfare and Agriculture Development
240110908016932 Agreesnet Project 11.50
6 19 Public Health and Family Welfare
360623708012498Supply of Conventional Contraceptives
10.00
7 19 Public Health and Family Welfare
360623708014245 Malaria 10.00
8 19 Public Health and Family Welfare
360623708016106 Universal Immunization
15.00
9 20 Public Health Engineering 22150110208018219 Installation of Computers
1.50
10 41 Tribal Area SubPlan 25Tribal Welfare Department 22250279600108025155 Monitoring and Evaluation of Schemes ,Article 275 (i)
1.00
11 42 Public Works relating to Tribal Area SubPlan Roads and Bridges
25Tribal Welfare Department 50540479680008027654 Construction of Roads/Bridges in Tribal Areas [ Article 275(i) ]
4.00
12 64 Scheduled Castes SubPlan 55 Scheduled Castes Welfare Department 42250178927708035635 Babu Jagjeewan Ram Hostel Scheme
3.48
13 78 Horticulture and Food Processing
240111908015654National Bio Agriculture
1.58
TotalB 83.06
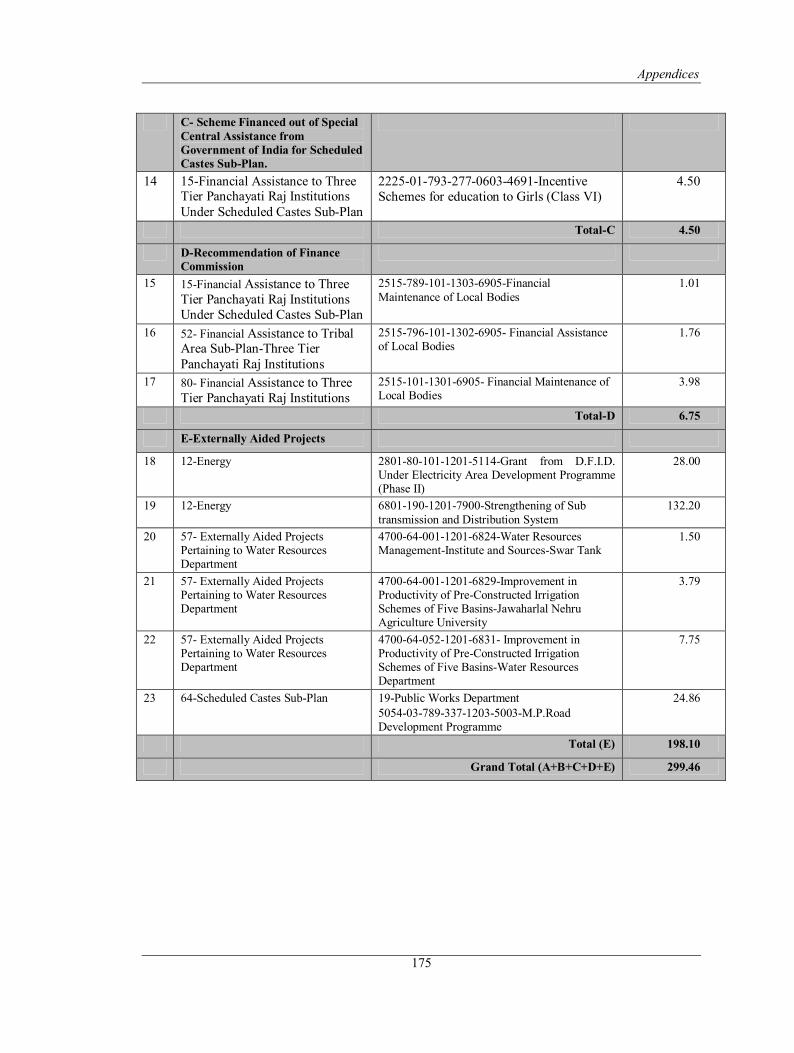
Appendices
175
C Scheme Financed out of Special Central Assistance from Government of India for Scheduled Castes SubPlan.
14 15Financial Assistance to Three Tier Panchayati Raj Institutions Under Scheduled Castes SubPlan
22250179327706034691Incentive Schemes for education to Girls (Class VI)
4.50
TotalC 4.50
DRecommendation of Finance Commission
15 15Financial Assistance to Three Tier Panchayati Raj Institutions Under Scheduled Castes SubPlan
251578910113036905Financial Maintenance of Local Bodies
1.01
16 52 Financial Assistance to Tribal Area SubPlanThree Tier Panchayati Raj Institutions
251579610113026905 Financial Assistance of Local Bodies
1.76
17 80 Financial Assistance to Three Tier Panchayati Raj Institutions
251510113016905 Financial Maintenance of Local Bodies
3.98
TotalD 6.75
EExternally Aided Projects
18 12Energy 28018010112015114Grant from D.F.I.D. Under Electricity Area Development Programme (Phase II)
28.00
19 12Energy 680119012017900Strengthening of Sub transmission and Distribution System
132.20
20 57 Externally Aided Projects Pertaining to Water Resources Department
47006400112016824Water Resources ManagementInstitute and SourcesSwar Tank
1.50
21 57 Externally Aided Projects Pertaining to Water Resources Department
47006400112016829Improvement in Productivity of PreConstructed Irrigation Schemes of Five BasinsJawaharlal Nehru Agriculture University
3.79
22 57 Externally Aided Projects Pertaining to Water Resources Department
47006405212016831 Improvement in Productivity of PreConstructed Irrigation Schemes of Five BasinsWater Resources Department
7.75
23 64Scheduled Castes SubPlan 19Public Works Department 50540378933712035003M.P.Road Development Programme
24.86
Total (E) 198.10
Grand Total (A+B+C+D+E) 299.46
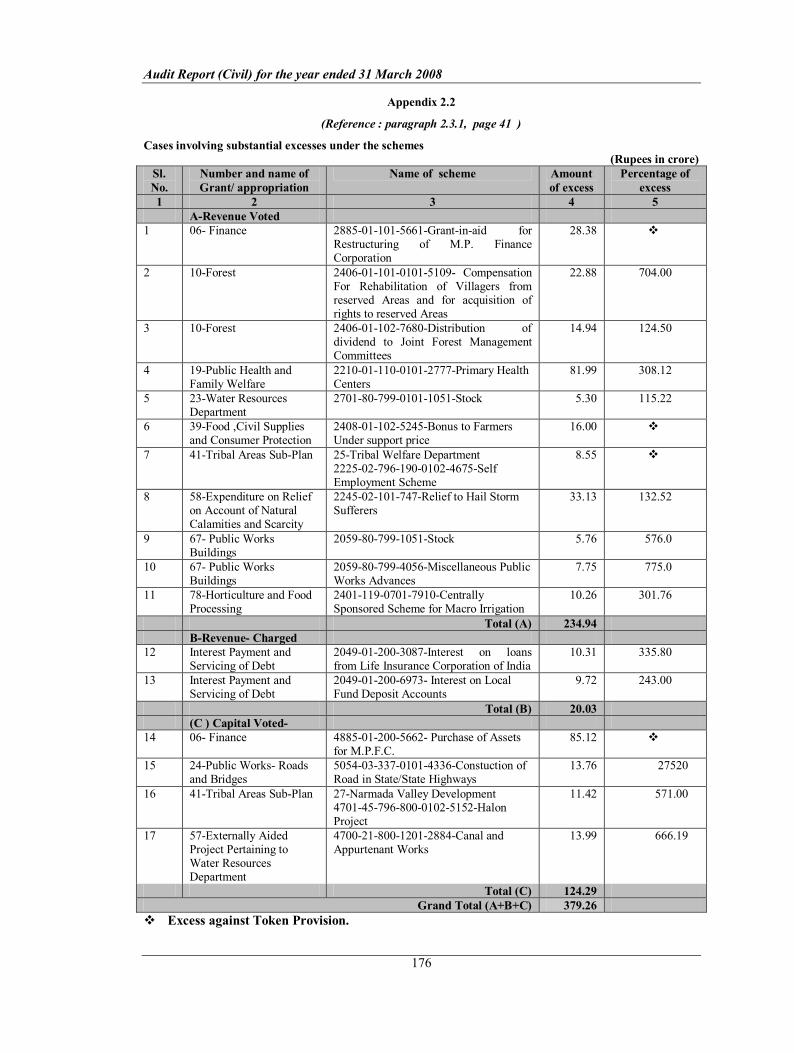
Audit Report (Civil) for the year ended 31 March 2008
176
Appendix 2.2
(Reference : paragraph 2.3.1, page 41 )
Cases involving substantial excesses under the schemes (Rupees in crore)
Sl. No.
Number and name of Grant/ appropriation
Name of scheme Amount of excess
Percentage of excess
1 2 3 4 5 ARevenue Voted
1 06 Finance 2885011015661Grantinaid for Restructuring of M.P. Finance Corporation
28.38 v
2 10Forest 24060110101015109 Compensation For Rehabilitation of Villagers from reserved Areas and for acquisition of rights to reserved Areas
22.88 704.00
3 10Forest 2406011027680Distribution of dividend to Joint Forest Management Committees
14.94 124.50
4 19Public Health and Family Welfare
22100111001012777Primary Health Centers
81.99 308.12
5 23Water Resources Department
27018079901011051Stock 5.30 115.22
6 39Food ,Civil Supplies and Consumer Protection
2408011025245Bonus to Farmers Under support price
16.00 v
7 41Tribal Areas SubPlan 25Tribal Welfare Department 22250279619001024675Self Employment Scheme
8.55 v
8 58Expenditure on Relief on Account of Natural Calamities and Scarcity
224502101747Relief to Hail Storm Sufferers
33.13 132.52
9 67 Public Works Buildings
2059807991051Stock 5.76 576.0
10 67 Public Works Buildings
2059807994056Miscellaneous Public Works Advances
7.75 775.0
11 78Horticulture and Food Processing
240111907017910Centrally Sponsored Scheme for Macro Irrigation
10.26 301.76
Total (A) 234.94 BRevenue Charged
12 Interest Payment and Servicing of Debt
2049012003087Interest on loans from Life Insurance Corporation of India
10.31 335.80
13 Interest Payment and Servicing of Debt
2049012006973 Interest on Local Fund Deposit Accounts
9.72 243.00
Total (B) 20.03 (C ) Capital Voted
14 06 Finance 4885012005662 Purchase of Assets for M.P.F.C.
85.12 v
15 24Public Works Roads and Bridges
50540333701014336Constuction of Road in State/State Highways
13.76 27520
16 41Tribal Areas SubPlan 27Narmada Valley Development 47014579680001025152Halon Project
11.42 571.00
17 57Externally Aided Project Pertaining to Water Resources Department
47002180012012884Canal and Appurtenant Works
13.99 666.19
Total (C) 124.29 Grand Total (A+B+C) 379.26
v Excess against Token Provision.

Appendices
177
Appendix 2.3
(Reference: paragraph 2.3.1, page 41 )
Cases involving substantial savings under the schemes
(Rupees in crore) Sl. No.
Number and name of Grant/ Appropriation
Name of scheme Amount of
savings
Percentage of savings
(1) (2) (3) (4) (5) ARevenue Voted
1 06Finance 20708000101224Other expenditure 495.00 100.00 2 06Finance 20757975659Transfer in
Consolidated Deposit Fund 100.00 100.00
3 06Finance 2071011029999Composite State of Madhya Pradesh
8.04 80.40
4 07Commercial Tax 204000101018808Works related to Information Technology
9.13 87.29
5 10Forest 2406011017680Distribution of dividend to Joint Forest Managing Committees
8.00 100.00
6 10Forest 24060111001015109Compensation for Rehabilitation of Villagers of reserved areas and for acquisition of Rights in Reserved Areas
26.00 100.00
7 12Energy 28018010112015114Grant from D.F.I.D. Under Electricity Area Development Programme (PhaseII)
28.00 100.00
8 13Farmers Welfare and Agriculture Development
240110908016932Agreesnet Project 11.50 100.00
9 13Farmers Welfare and Agriculture Development
240110208015251Foodgrain Safety Mission
25.00 100.00
10 19Public Health and Family Welfare
360623708012498Supply of Conventional Contraceptives
10.00 100.00
11 19Public Health and Family Welfare
360623708014245Malaria 10.00 100.00
12 19Public Health and Family Welfare
360623708016106Universal Immunization
15.00 100.00
13 27School Education (Primary Education)
22020110208016344Modernisation of Madarsa
6.48 99.72
14 34 Social Welfare 2235021016864Vivekanand Insurance Scheme
5.00 100.00
15 39 Food, Civil Supplies and Consumer Protection
2408011023248Recoupment of Losses to M.P.State Cooperative Marketing Federation for procurement of food grains
6.68 83.50
16 45Minor Irrigation Works 2702808005422Dam Safety Works 17.25 86.25 17 46Science and Technology 34256020001016705
Implementation of National (Natural) Resources Information System
8.70 86.14

Audit Report (Civil) for the year ended 31 March 2008
178
18 55Women and Child Development
2235021038882Pay and Allowances of Village Workers (Gram Savikas)
5.39 100.00
19 64 Scheduled Castes Sub Plan
14Farmar Welfare and Agriculture Development Department 240178911001038792National Agriculture Insurance Scheme
7.55 85.31
20 64 Scheduled Castes Sub Plan
15Cooperation Department 242578910701039254Interest grant on Short term Agriculture Loan through Cooperative Banks
6.22 100.00
21 64 Scheduled Castes Sub Plan
34 Public Health Engineering 22150178919101032181Urban Water Supply Scheme
7.09 84.59
22 68 Financial Assistance to Tribal Area SubPlan Urban Bodies
18 Urban Administration and Development Department 22170579619101026982Integrated Urban and Slum Development Programme
25.20 94.31
23 77 Other Expenditure Pertaining to School Education Department (Excluding Primary Education)
22020210901016967Upgradation of Middle Schools into High Schools
11.98 95.23
24 80 Financial Assistance to Three Tier Panchayati Raj Institutions
22020219101015276Grant for Salary to Teacher/Samida Shala Shikshak
16.52 100.00
Total (A) 869.73 B Revenue Charged
25 Interest Payments and Servicing of Debt
2049012003089Interest on Ways and Means Advances and Advances taken to meet short fall in Cash balance received from the Reserve Bank of India
10.00 100.00
26 Interest Payments and Servicing of Debt
204903104807Interest on Work men's Contributory Provident Fund
6.47 92.00
27 06Finance 2071011019999 Composite State of Madhya Pradesh
8.54 100.00
28 10Forest 2406017973885Transfer to Forest Development Fund (Charged)
13.00 100.00
Total (B) 38.01 CCapital Voted
29 03 Police 40552112643Mordernisation of Police Force
27.73 92.43
30 06Finance 60758006788Provision for settlement of S.L.R. Bonds issued by undertakings and subordinate Institutions of State Government
5.00 100.00
31 12Energy 48010519012016929Investment for Transmission System Works
30.47 91.39

Appendices
179
32 12Energy 48010519012017900Strengthening of Sub transmission and Distribution System
56.66 100.00
33 12Energy 680119012017900Strengthening of Subtransmission and Distribution System
132.20 100.00
34 17Cooperation 442510701012759Investment in the share capital of Primary Land Development Banks
8.39 100.00
35 17Cooperation 642510701013242Purchase of debentures Floated by the M.P. State Cooperative Land Development Bank
30.54 89.17
36 19Public Health and Family Welfare
42100111001017648Construction of Buildings for Hospitals and Dispensaries
21.36 84.96
37 19Public Health and Family Welfare
42100210301017871Construction of Primary Health Centres, Sub Health Centres and Community Health Centers for Basic Services
36.03 84.58
38 21Housing and Environment
62170280001016706Grant to Madhya Pradesh Development Authority for Small and Medium Towns Infrastructure Development Scheme
19.89 100.00
39 23Water Resources Department
47008000101012304Direction and Administration
7.01 100.00
40 23Water Resources Department
47018000101012304 Direction and Administration
20.01 94.16
41 23Water Resources Department
47018000114012304 Direction and Administration
6.06 100.00
42 24Public WorksRoads and Bridges
50530210201014727Construction and Extension of Air Strips
36.31 89.65
43 24Public WorksRoads and Bridges
50540433701015139Upgradation of Main District Roads
71.95 100.00
44 37Tourism 54520110107017630Construction of Tourist Infrastructure (Central Share)
41.84 83.68
45 41Tribal Areas SubPlan 25Tribal Welfare Department 451579610301025111Incentive to Navachar
6.00 100.00
46 41Tribal Areas SubPlan 34Public Health Engineering 42150179610207029207Drinking Water Arrangement in Hard Water affected villages
6.87 90.39
47 42Public Works relating to Tribal Areas SubPlan Roads and Bridges
19Public Works Department 50540479680001025139 Upgrdation of Main District Roads
18.04 100.00
48 45Minor Irrigation Works 470210114012304Direction and Administration
13.35 100.00
49 45Minor Irrigation Works 470280001012304Direction and Administration
24.03 100.00

Audit Report (Civil) for the year ended 31 March 2008
180
50 48Narmada Valley Development
47008000101015010Narmada Kshipra Link Project
7.87 98.87
51 48Narmada Valley Development
48010120301016403Payment of share to N.H.D.C. of Indira Sagar Project Unit1
16.36 100.00
52 48Narmada Valley Development
48010120501019133Sardar Sarovar Project
66.67 100.00
53 57 Externally Aided Projects Pertaining to Water Resources Department
47006400112016826Improvement in productivity of Preconstructed Irrigation Schemes of Five Basins Agriculture Department
7.73 92.02
54 57 Externally Aided Projects Pertaining to Water Resources Department
47006400112016827 Improvement in Productivity of preConstructed Irrigation Schemes of Five Basins Fisheries Department
8.46 96.25
55 57 Externally Aided Projects Pertaining to Water Resources Department
47006400112016830 Improvement in productivity of Preconstructed Irrigation Schemes of Five Basins Animal Husbandry Department
5.78 85.63
56 57 Externally Aided Projects Pertaining to Water Resources Department
47006405212016831 Improvement in productivity of Preconstructed Irrigation Schemes of Five Basins Water Resources Department
7.75 100.00
57 60 Expenditure Pertaining to District Plan Schemes
451510101015111Incentive to Navachar
19.50 100.00
58 64 Scheduled Castes Sub plan
19Public Works Department 50540378933712035003M.P. Road Development Programme
24.86 100.00
59 64 Scheduled Castes Sub plan
19Public Works Department 50540478980001035139 Upgradation of Main Roads of Districts
10.00 100.00
60 64 Scheduled Castes Sub plan
55Scheduled Caste Welfare Department 451578910301035111 Incentive to Navachar
12.00 100.00
61 77 Other Expenditure Pertaining to School Education Department (Excluding Primary Education)
42020120201016969Constrution of High School Buildings
11.40 100.00
62 79 Medical Education Department
42100310501016974Sagar Medical Collage
32.00 88.74
Total (C) 850.12 DCapital Charged
63 Charged Appropriation Public Debt
60031096236 Loans from National Capital Region Planning Board
15.35 100.00
64 Charged Appropriation Public Debt
6003110637 Ways and Means Advances
1000.00 100.00

Appendices
181
65 Charged Appropriation Public Debt
6003110779 Advances to meet short fall
1000.00 100.00
Total (D) 2015.35 Grand Total (A+B+C+D) 3773.21
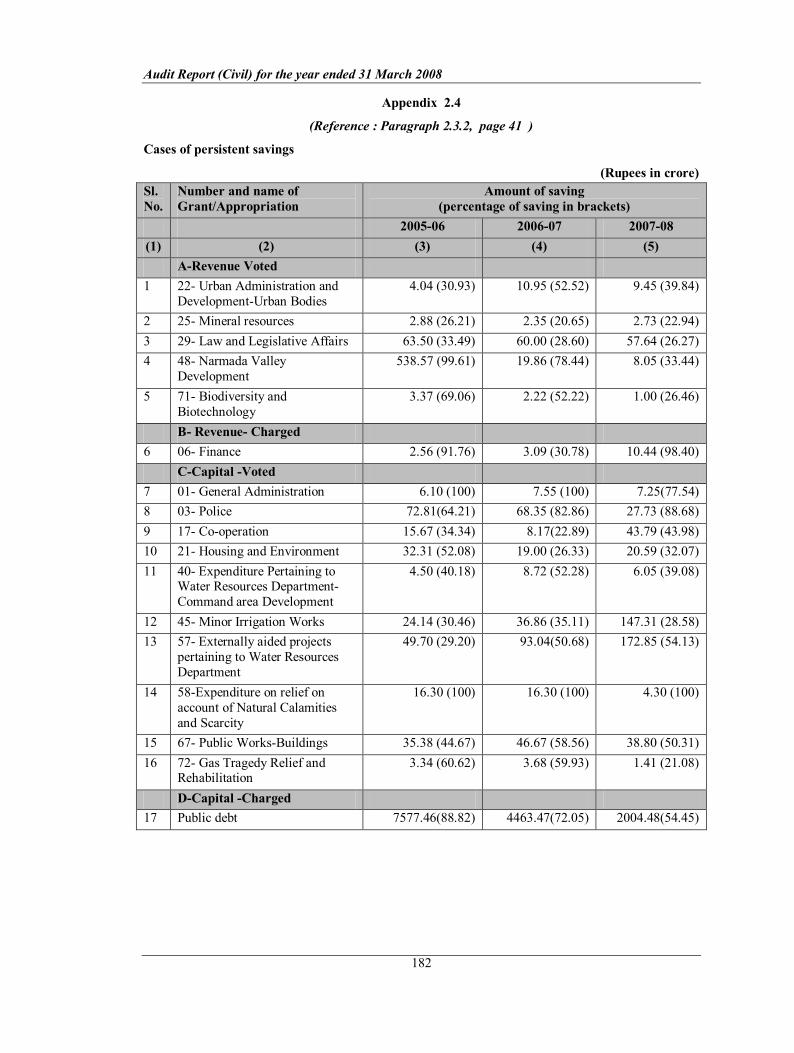
Audit Report (Civil) for the year ended 31 March 2008
182
Appendix 2.4
(Reference : Paragraph 2.3.2, page 41 )
Cases of persistent savings
(Rupees in crore) Sl.No.
Number and name of Grant/Appropriation
Amount of saving (percentage of saving in brackets)
200506 200607 200708 (1) (2) (3) (4) (5)
ARevenue Voted 1 22 Urban Administration and
DevelopmentUrban Bodies 4.04 (30.93) 10.95 (52.52) 9.45 (39.84)
2 25 Mineral resources 2.88 (26.21) 2.35 (20.65) 2.73 (22.94) 3 29 Law and Legislative Affairs 63.50 (33.49) 60.00 (28.60) 57.64 (26.27) 4 48 Narmada Valley
Development 538.57 (99.61) 19.86 (78.44) 8.05 (33.44)
5 71 Biodiversity and Biotechnology
3.37 (69.06) 2.22 (52.22) 1.00 (26.46)
B Revenue Charged 6 06 Finance 2.56 (91.76) 3.09 (30.78) 10.44 (98.40)
CCapital Voted 7 01 General Administration 6.10 (100) 7.55 (100) 7.25(77.54) 8 03 Police 72.81(64.21) 68.35 (82.86) 27.73 (88.68) 9 17 Cooperation 15.67 (34.34) 8.17(22.89) 43.79 (43.98) 10 21 Housing and Environment 32.31 (52.08) 19.00 (26.33) 20.59 (32.07) 11 40 Expenditure Pertaining to
Water Resources Department Command area Development
4.50 (40.18) 8.72 (52.28) 6.05 (39.08)
12 45 Minor Irrigation Works 24.14 (30.46) 36.86 (35.11) 147.31 (28.58) 13 57 Externally aided projects
pertaining to Water Resources Department
49.70 (29.20) 93.04(50.68) 172.85 (54.13)
14 58Expenditure on relief on account of Natural Calamities and Scarcity
16.30 (100) 16.30 (100) 4.30 (100)
15 67 Public WorksBuildings 35.38 (44.67) 46.67 (58.56) 38.80 (50.31) 16 72 Gas Tragedy Relief and
Rehabilitation 3.34 (60.62) 3.68 (59.93) 1.41 (21.08)
DCapital Charged 17 Public debt 7577.46(88.82) 4463.47(72.05) 2004.48(54.45)

Appendices
183
Appendix 2.5
(Reference: paragraph 2.3.5, page 42 )
Cases where supplementary provision proved unnecessary
(Rupees in crore) Sl. No.
Number and name of grant/ appropriation
Original grant/ appropriation
Supplementary grant/
appropriation
Actual expenditure
Saving
(1) (2) (3) (4) (5) (6) A Revenue Voted
1. 01General Administration 98.20 13.56 92.95 18.81 2. 02Other Expenditure pertaining to
General Administration Department 17.52 0.03 11.95 5.60
3 03 Police 1169.14 47.53 1100.22 116.45 4. 04 Other Expenditure pertaining to
Home Department 11.20 0.17 9.96 1.41
5. 05 Jail 84.65 1.34 82.92 3.07 6. 06 Finance 2643.95 111.50 2143.81 611.64 7. 07 Commercial Tax 555.58 30.07 530.17 55.48 8 08 Land Revenue and District
Administration 413.45 6.59 354.84 65.20
9. 14 Animal Husbandry 226.04 40.15 201.21 64.98 10. 18 Labour 51.05 2.15 45.96 7.24 11. 19 Public Health and Family
Welfare 849.13 12.27 817.69 43.71
12. 20 Public Health Engineering 242.60 1.13 227.89 15.84 13. 23 Water Resources Department 349.91 8.35 323.73 34.53 14 25 Mineral Resources 11.85 0.05 9.17 2.73
15 27 School Education (Primary Education)
1872.26 167.58 1539.93 499.91
16. 28 State Legislature 27.61 1.38 23.62 5.37 17. 29 Law and Legislative Affairs 216.41 3.03 161.81 57.63 18. 31 Planning, Economics and
Statistics 24.74 3.00 23.98 3.76
19. 33 Tribal Welfare 508.30 26.83 498.13 37.00 20 34 Social Welfare 41.05 5.59 37.30 9.34 21 39 Food, Civil Supplies and
Consumer Protection 127.14 0.96 102.19 25.91
22 44 Higher Education 365.27 22.56 356.04 31.79 23 46 Science and Technology 15.25 2.36 9.79 7.82 24 47 Technical Education and
Training 130.18 2.79 115.65 17.32
25 49 Scheduled Caste Welfare 49.20 0.35 42.33 7.22 26 51 Religious Trusts and
Endowments 11.27 0.15 9.31 2.11
27 52 Financial assistance to Tribal AreaSubPlanThree Tier Panchayati Raj Institutions
740.56 72.24 739.30 73.50
28 53 Financial Assistance to Urban Bodies under Scheduled Castes Sub Plan
92.86 0.85 41.08 52.63
29 55 Women and Child Development 495.49 43.88 457.22 82.15

Audit Report (Civil) for the year ended 31 March 2008
184
30 64 Scheduled Castes SubPlan 600.50 115.39 574.72 141.17 31 65 Aviation 10.50 0.05 9.26 1.29 32 75 Financial assistance to Urban
Bodies 1703.07 108.71 1567.95 243.83
33 77 Other Expenditure pertaining to School Education Department (Excluding Primary Education)
442.31 25.70 437.41 30.60
34 79 Medical Education Department 251.18 1.52 231.17 21.53 Total (A) 14449.42 879.81 12930.66 2398.57
B Revenue Charged 35 10 Forest 13.25 0.65 0.87 13.03 36 29 Law and Legislative Affairs 24.43 1.73 21.86 4.30
Total (B) 37.68 2.38 22.73 17.33 C Capital Voted
37 01 General Administration 4.35 5.00 2.10 7.25 38 21 Housing and Enviornment 49.96 14.24 43.61 20.59
Total (C) 54.31 19.24 45.71 27.84 Total (A+B+C) 14541.41 901.43 12999.10 2443.74
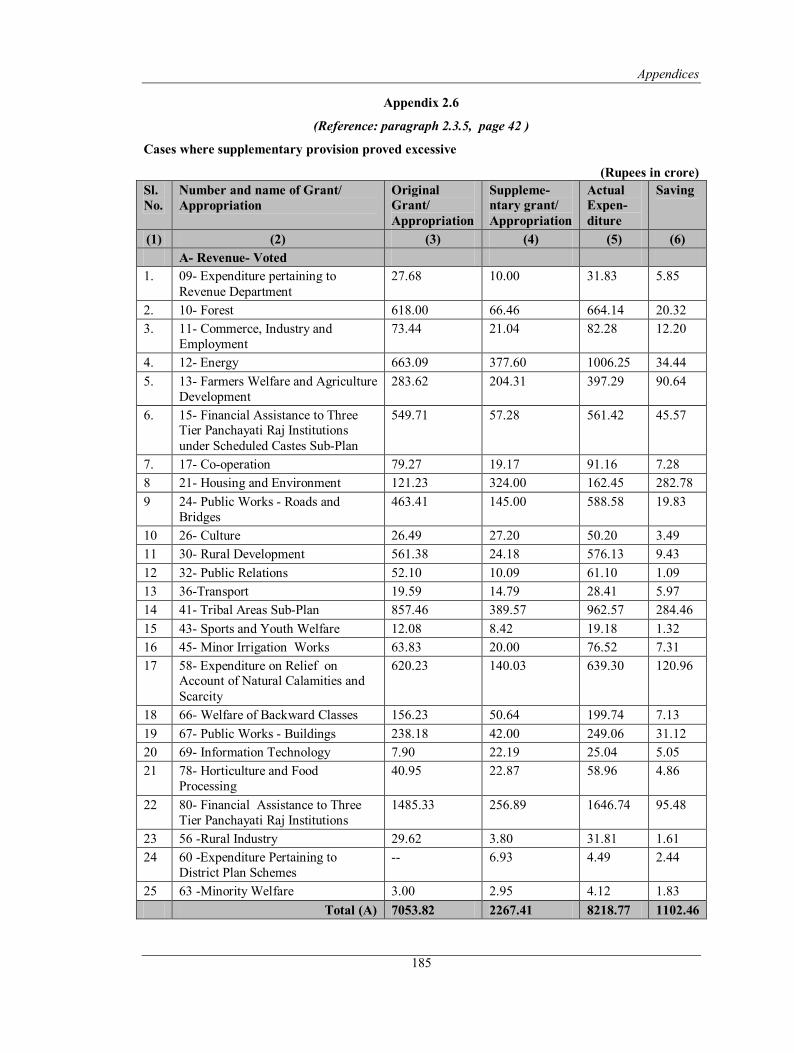
Appendices
185
Appendix 2.6
(Reference: paragraph 2.3.5, page 42 )
Cases where supplementary provision proved excessive
(Rupees in crore) Sl.No.
Number and name of Grant/ Appropriation
Original Grant/ Appropriation
Suppleme ntary grant/ Appropriation
Actual Expen diture
Saving
(1) (2) (3) (4) (5) (6) A Revenue Voted
1. 09 Expenditure pertaining to Revenue Department
27.68 10.00 31.83 5.85
2. 10 Forest 618.00 66.46 664.14 20.32 3. 11 Commerce, Industry and
Employment 73.44 21.04 82.28 12.20
4. 12 Energy 663.09 377.60 1006.25 34.44 5. 13 Farmers Welfare and Agriculture
Development 283.62 204.31 397.29 90.64
6. 15 Financial Assistance to Three Tier Panchayati Raj Institutions under Scheduled Castes SubPlan
549.71 57.28 561.42 45.57
7. 17 Cooperation 79.27 19.17 91.16 7.28 8 21 Housing and Environment 121.23 324.00 162.45 282.78 9 24 Public Works Roads and
Bridges 463.41 145.00 588.58 19.83
10 26 Culture 26.49 27.20 50.20 3.49 11 30 Rural Development 561.38 24.18 576.13 9.43 12 32 Public Relations 52.10 10.09 61.10 1.09 13 36Transport 19.59 14.79 28.41 5.97 14 41 Tribal Areas SubPlan 857.46 389.57 962.57 284.46 15 43 Sports and Youth Welfare 12.08 8.42 19.18 1.32 16 45 Minor Irrigation Works 63.83 20.00 76.52 7.31 17 58 Expenditure on Relief on
Account of Natural Calamities and Scarcity
620.23 140.03 639.30 120.96
18 66 Welfare of Backward Classes 156.23 50.64 199.74 7.13 19 67 Public Works Buildings 238.18 42.00 249.06 31.12 20 69 Information Technology 7.90 22.19 25.04 5.05 21 78 Horticulture and Food
Processing 40.95 22.87 58.96 4.86
22 80 Financial Assistance to Three Tier Panchayati Raj Institutions
1485.33 256.89 1646.74 95.48
23 56 Rural Industry 29.62 3.80 31.81 1.61 24 60 Expenditure Pertaining to
District Plan Schemes 6.93 4.49 2.44
25 63 Minority Welfare 3.00 2.95 4.12 1.83 Total (A) 7053.82 2267.41 8218.77 1102.46
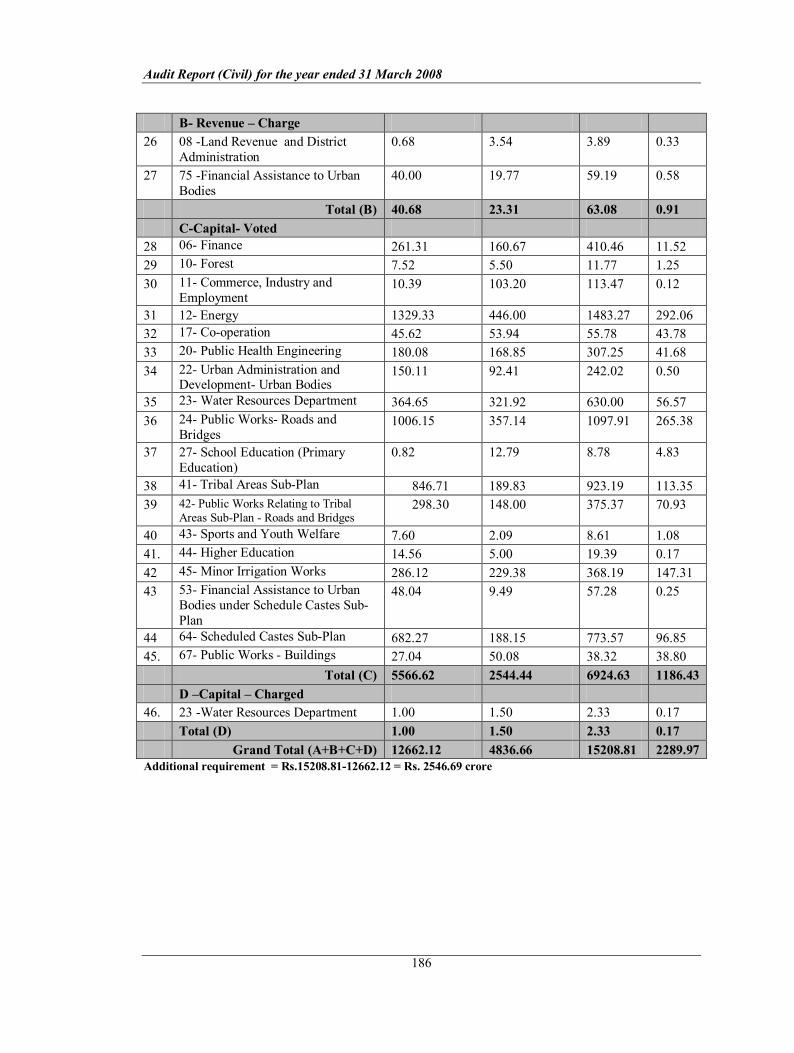
Audit Report (Civil) for the year ended 31 March 2008
186
B Revenue – Charge 26 08 Land Revenue and District
Administration 0.68 3.54 3.89 0.33
27 75 Financial Assistance to Urban Bodies
40.00 19.77 59.19 0.58
Total (B) 40.68 23.31 63.08 0.91 CCapital Voted
28 06 Finance 261.31 160.67 410.46 11.52 29 10 Forest 7.52 5.50 11.77 1.25 30 11 Commerce, Industry and
Employment 10.39 103.20 113.47 0.12
31 12 Energy 1329.33 446.00 1483.27 292.06 32 17 Cooperation 45.62 53.94 55.78 43.78 33 20 Public Health Engineering 180.08 168.85 307.25 41.68 34 22 Urban Administration and
Development Urban Bodies 150.11 92.41 242.02 0.50
35 23 Water Resources Department 364.65 321.92 630.00 56.57 36 24 Public Works Roads and
Bridges 1006.15 357.14 1097.91 265.38
37 27 School Education (Primary Education)
0.82 12.79 8.78 4.83
38 41 Tribal Areas SubPlan 846.71 189.83 923.19 113.35 39 42 Public Works Relating to Tribal
Areas SubPlan Roads and Bridges 298.30 148.00 375.37 70.93
40 43 Sports and Youth Welfare 7.60 2.09 8.61 1.08 41. 44 Higher Education 14.56 5.00 19.39 0.17 42 45 Minor Irrigation Works 286.12 229.38 368.19 147.31 43 53 Financial Assistance to Urban
Bodies under Schedule Castes Sub Plan
48.04 9.49 57.28 0.25
44 64 Scheduled Castes SubPlan 682.27 188.15 773.57 96.85 45. 67 Public Works Buildings 27.04 50.08 38.32 38.80
Total (C) 5566.62 2544.44 6924.63 1186.43 D –Capital – Charged
46. 23 Water Resources Department 1.00 1.50 2.33 0.17 Total (D) 1.00 1.50 2.33 0.17
Grand Total (A+B+C+D) 12662.12 4836.66 15208.81 2289.97 Additional requirement = Rs.15208.8112662.12 = Rs. 2546.69 crore

Appendices
187
Appendix 2.7
(Reference: paragraph 2.3.6, page 42 )
Injudicious/ Irregular/ Incorrect Reappropriations/ Surrenders
(a) Some of the cases in which withdrawal by reappropriation/ surrender, proved injudicious in view of final excess over provision
(Rupees in crore) Sl. No.
Description of Grant and Head of Account Original plus supple mentary provision
Actual expen diture
Excess excluding re approp riation
Re appro priation/ surren der ()
Final excess (+)
(1) (2) (3) (4) (5) (6) (7) 1 Interest payment and Servicing of Debt
(Charged) 2049011016763 New Market Loan
105.00 151.13 46.13 12.00 58.13
2. 07Commercial Tax 2030021022455 Expenses on sale of nonjudicial stamp
15.00 18.54 3.54 8.12 11.66
3. 19Public Health and Family Welfare 221001110748 Dispensaries
4.17 9.03 4.86 1.33 6.19
4 19Public Health and Family Welfare 22100310301015868 State Level Patients Assistance Fund
10.00 16.38 6.38 4.02 10.40
5 23 Water Resources Department 27018079901011051Stock
4.60 9.90 5.30 1.56 6.86
6 23 Water Resources Department 47002280001012884Canal and Appurtenant Works
31.29 42.97 11.68 1.40 13.08
7 42Public Works Relating to Tribal Area SubPlanRoads and Bridges 19Public Works Department 50540479680001022457Minimum Needs Programme (including Rural Roads)
84.85 91.81 6.96 8.18 15.14
8 64 Scheduled Caste SubPlan 55 Scheduled Caste Welfare Department 22250178927701032676Post Matric Scholarship
48.86 49.67 0.81 1.33 2.14
(b) Some of the cases, in which withdrawal by reappropriation/surrender, resulted in final excess of Rs.10 lakh and above.
(Rupees in crore) Sl. No.
Description of Grant and Head of Account
Original plus supplementary provision
Actual expen diture
Avail able saving
Re approp riation/ surrender
()
Final excess (+)
(1) (2) (3) (4) (5) (6) (7) 9 03Police
2055101270Criminal Investigation Department
43.90 34.95 8.95 9.21 0.26
10 03Police 9.30 7.50 1.80 2.25 0.45

Audit Report (Civil) for the year ended 31 March 2008
188
2055101279Directorate of Prosecution
11 03Police 20551044492Normal Expenditure (Special Police)
255.88 230.99 24.89 32.65 7.76
12 03Police 20551091816 Anti Dacoity operations
16.12 13.40 2.72 3.50 0.78
13 03Police 20551094491General Expenditure (District Establishment)
607.30 574.89 32.41 42.69 10.28
14 03Police 20701074670Training of Home Guards
5.63 4.62 1.01 1.52 0.51
15 07 Commercial Tax 2030030011480 District Charges
10.50 9.17 1.33 1.57 0.24
16 13 Farmers Welfare and Agriculture Development 24011081102 Sugarcane Transportation Grant
4.37 2.83 1.54 1.83 0.29
17 13Farmers Welfare and Agriculture Development 240180007011580Macro Management Scheme
53.41 36.97 16.44 16.59 0.15
18 14Animal Husbandry 240310107013786 Mata Epidemic Eradication
5.31 4.27 1.04 1.15 0.11
19 14Animal Husbandry 24031033578 Poultry Development Farms
5.77 4.46 1.31 2.65 1.34
20 15Financial Assistance to Three Tier Panchayati Raj Institutions under Scheduled Castes SubPlan 22150278910707035206 Rural Cleanliness Programme
29.26 15.54 13.72 17.55 3.83
21 17Cooperation 24250010101123 Superintendance
15.39 13.48 1.91 2.28 0.37
22 19 Public Health and Family Welfare 221001110993 T.B. Hospitals
19.96 15.96 4.00 4.94 0.94
23 19Public Health and Family Welfare 2210060033463 Training of Women Health Workers
2.91 0.80 2.11 2.23 0.12
24 19Public Health and Family Welfare 2210061012818 Filaria
2.56 1.37 1.19 1.34 0.15
25 19Public Health and Family Welfare 2210061014245 Malaria
65.96 57.50 8.46 13.17 4.71
26 19Public Health and Family Welfare 2210061018150 Multipurpose Workers Scheme
37.11 29.66 7.45 9.30 1.85

Appendices
189
27 20Public Health Engineering 22150210707016263Rural Sewerage Scheme (Complete Cleanliness Expedition)
12.73 4.49 8.24 11.12 2.88
28 24Public Works Roads and Bridges 305401337134Maintinance and RepairOrdinary Repairs
50.50 21.31 29.19 30.00 0.81
29 27School Education (Primary Education) 22020480008014402 Government Education Colleges
1.50 0.54 0.96 1.06 0.10
30 29Law and Legislative Affairs 20141054497General Establishment
124.90 96.49 28.41 28.84 0.43
31 29 Law and Legislative Affairs 2014102573 High Court (Charged)
25.95 21.71 4.24 4.45 0.21
32 41Tribal Area SubPlan 34Public Health Engineering 42150179610207029489 Fluorosis Control Programme in the State
26.20 23.32 2.88 4.60 1.72
33 41Tribal Area SubPlan 14Farmers Welfare and Agriculture Development Department 240179680007021580 Macro Management Scheme
14.22 11.62 2.60 3.85 1.25
34 41Tribal Area SubPlan 25 Tribal Welfare Department 42250279627707028799 Construction of Hostel Building
10.10 8.27 1.83 2.00 0.17
35 44Higher Education 2202031030101798Art, Science and Commerce Colleges
257.75 235.18 22.57 27.20 4.63
36 45Minor Irrigation Works 470210101016708 A.I.B.P. Schemes
138.00 49.08 88.92 90.00 1.08
37 49Scheduled Castes Welfare 2225012771398 Operation of Hostels/Ashrams
22.97 19.99 2.98 3.58 0.60
38 49Scheduled Castes Welfare 2225012778050Various Scholarships
17.35 14.82 2.53 2.84 0.31
39 52Financial Assistance to Tribal Area SubPlan Three Tier Paanchayati Raj Institutions 34Public Health Engineering 22150279610707025206 Rural Cleanliness Programme
26.26 12.39 13.87 16.05 2.18
40 52Financial Assistance to Tribal Area SubPlan Three Tier Paanchayati Raj Institutions 58Rural Development Department
17.03 12.13 4.90 5.31 0.41

Audit Report (Civil) for the year ended 31 March 2008
190
25050179670207029376 National ProgrammeSampoorna Gramin Rojgar Yojna
41 57Externally Aided Projects Pertaining to Water Resources Department 47006400112016825 Service Providing Irrigation and Water Drainage InstitutionWater Resources Department
31.11 7.41 23.70 26.10 2.40
42 57Externally Aided Projects Pertaining to Water Resources Department 47006480012016822Water Resources Management Institute and Sources SWARA
6.01 2.63 3.38 3.48 0.10
43 57Externally Aided Projects Pertaining to Water Resources Department 47006405212016825Regarding Providing Services Irrigation and Water DrainageWater Resources Department
8.24 3.23 5.01 5.21 0.20
44 64Scheduled Castes SubPlan 14 Farmers Welfare and Agriculture Development Department 240178910207031580 Macro Management Scheme
8.14 4.77 3.37 3.61 0.24
45 64Scheduled Castes SubPlan 35 Animal Husbandry Department 240378910201031109 Intensive Cattle Development Project
5.59 4.44 1.15 1.49 0.34
46 64Scheduled Castes SubPlan 55 Scheduled Castes Welfare Department 22250178927701034717 Scheduled Castes Hostels
21.75 15.86 5.89 6.17 0.28
47 75 Financial Assistance to Urban Bodies 22020110301012669 Maintenance Grant to Local Bodies Rural and Urban
26.96 23.32 3.64 4.11 0.47
(c) Unnecessary augmentation of funds, despite available saving. (Rupees in crore)
Sl.No.
Description of Grant and Head of account
Original plus supplementary provision
Actual expen diture
Avail able Saving
Re approp
riation (+)
Final Saving ()
(1) (2) (3) (4) (5) (6) (7) 48 17Cooperation
642510701013242Purchase of debentures Floated by the M.P. State
34.25 3.71 30.54 1.76 32.30

Appendices
191
Cooperative Land Development Bank
49 19 Public Health and Family Welfare 22111020801621 Additional Sub Health Centers
133.65 118.40 15.25 3.83 19.08
50 24Public Works Roads and Bridges 50540480001011513 Construction of Major District Roads
21.00 18.31 2.69 8.00 10.69
51 24Public Works Roads and Bridges 50540480001012457 Minimum Need Programme (Including Rural Roads)
96.97 82.30 14.67 15.00 29.67
52 24Public Works Roads and Bridges 50540414016590 Construction of Roads under NABARD Loan Assistance
281.31 247.59 33.72 48.96 82.68
53 42Public Works Relating to Tribal Areas Subplan Roads and Bridges 19Public Works Department 50540479680014025226 Construction of Rural Roads( NABARD)
121.18 72.51 48.67 22.03 70.70
54 64Scheduled Castes SubPlan 17Public Health and Family Welfare Department 42100178911001037648 Construction of buildings for Hospital and Dispensaries
1.70 0.65 1.05 1.00 2.05
(d) Augmentation of funds by reappropriation, resulted in final savings.
(Rupees in crore) Sl.No.
Description of Grant and Head of account
Original plus supple mentary provision
Actual expen diture
Excess excluding re appropriation
Re approp riation (+)
Final saving ()
(1) (2) (3) (4) (5) (6) (7) 55 PublicDebt (Charged)
60031053731Loans from the National Agricultural Credit Fund of the National Bank for Agriculture and Rural Development
118.35 147.72 29.37 37.49 8.12
56 Interest Payments and Servicing of Debt (Charged) 2049012003732Interest on Loan from the National Agriculture Fund of the National Bank of Agriculture and Rural Development
100.00 117.05 17.05 17.25 0.20
57 Interest Payment and Servicing of Debt (Charged) 2049012006973Interest on Local fund Deposit Account
4.00 13.72 9.72 12.00 2.28

Audit Report (Civil) for the year ended 31 March 2008
192
58 23Water Resources Department 47001280001012897 Dam and Appurtenant Works
38.52 42.27 3.75 4.52 0.77
59 24Public WorksRoads and Bridges 3054048007081Renovation, Upgradation and Bituminisation of Highways/Main District Roads
205.00 215.81 10.81 40.00 29.19
60 24 Public WorksRoads and Bridges 50540310101014149 Construction of Major Bridges
24.00 32.35 8.35 13.83 5.48
61 24Public WorksRoads and Bridges 50540333701014336 Construction of Roads in State Highways
0.05 13.81 13.76 20.23 6.47
62 40Expenditure pertaining to Water Resources Department Command Area Development 470520307012823Construction of Field Channels
5.00 6.97 1.97 2.50 0.53
63 41Tribal Area SubPlan 25 Tribal Welfare Department 22250279601024675 Self Employment Scheme
Token 8.55 8.55 8.81 0.26
64 41Tribal Area SubPlan 34Public Health Engineering 4215017961020702693Tools and Plant
3.00 6.61 3.61 3.78 0.17
65 42Public Works Relating to Tribal Areas SubPlanRoads and Bridges 19Public Works Department 50540479680001023539 Main Districts Roads
3.50 4.97 1.47 4.20 2.73
66 45Minor Irrigation Works 270280800207Other Minor Irrigation Construction works
55.28 66.43 11.15 15.71 4.56
67 48Narmada Valley Development 47004180001012872Bargi Canal Diversion Project
141.98 202.89 60.91 64.77 3.86
68 48Narmada Valley Development 47004380001012884Canal and Appurtenant Works
104.35 135.82 31.47 35.60 4.13
69 48Narmada Valley Development 47008080001016399Indira Sagar Project (UnitI)
12.81 52.44 39.63 39.82 0.19
70 52Financial Assistance to Tribal Area SubPlan Three Tier Panchayati Raj Institutions 25 Tribal Welfare Department 2225027962770102850 Scholarship to Girl and Boys at Primary Level
17.70 20.05 2.35 3.28 0.93

Appendices
193
71 52Financial Assistance to Tribal Area SubPlan Three Tier Panchayati Raj Institutions 58Rural Development Department 22160379610207025198 Indira Awas Yojna
10.60 12.79 2.19 2.36 0.17
72 52Financial Assistance to Tribal Area SubPlan Three Tier Paanchayati Raj Institutions 58Rural Development Department 25010279680001025128 Implementation of Water Storage Working Plan
1.15 1.55 0.40 1.00 0.60
73 55Women and Child Development 22350210301015067Ladly laxmi Yojna
13.92 15.78 1.86 2.00 0.14
74 64Scheduled Castes SubPlan 19 Public Works Department 50540478980001039002 Construction of Roads in Scheduled Castes Majority Areas
61.95 64.74 2.79 10.00 7.21
75 64Scheduled Castes SubPlan 31Water Resources Department 47014378980014032897Dam and Appurtenant Works
3.00 5.69 2.69 3.00 0.31
76 67Public WorksBuildings 205901051183Other Maintenance Works
1.10 5.04 3.94 8.00 4.06
77 79Medical Education Department 2210041010101465Ayurvedic and Other Dispensaries
1.78 3.80 2.02 2.42 0.40

Audit Report (Civil) for the year ended 31 March 2008
194
Appendix 2.8
(Reference: Paragraph 2.3.7 (a) page 42 )
Nonsurrender of significant savings (Rupees five crore and above)
(Rupees in crore) Sl. No.
Number and name of Grant/Appropriation Total available saving
Amount not surrendered
(percentage to total saving in brackets)
(1) (2) (3) (4) A Revenue Voted
1. 06Finance 611.64 602.94 (98.58) 2. 08Land Revenue and District Administration 65.20 37.76 (57.91) 3 10Forest 20.32 18.81 (92.57) 4. 11Commerce, Industry and Employment 12.20 6.59 (54.02) 5. 14Animal Husbandry 64.98 22.36 (34.41) 6 18Labour 7.24 5.19(71.69) 7 19Public Health and Family Welfare 43.71 42.95(98.26) 8 21 Housing and Environment 282.78 272.52(96.37) 9 23Water Resources Department 34.53 28.13(81.47) 10 24Public WorksRoads and Bridges 19.83 19.83 (100) 11 27—School Education (Primary Education) 499.91 13.85(2.77) 12 29Law and Legislative Affairs 57.64 6.01 (10.43) 13 30Rural Development 9.43 5.35 (56.73) 14 33Tribal Welfare 37.00 36.51(98.68) 15 34Social Welfare 9.34 9.34 (100) 16 36Transport 5.98 5.98 (100) 17 41Tribal Areas SubPlan 284.46 105.73 (37.17) 18 45Minor Irrigation Works 7.31 6.50 (88.92) 19 47Technical Education and Training 17.32 5.22 (30.14) 20 52Financial Assistance to Tribal Area SubPlanThree
Tier Panchayati Raj Institutions 73.50 9.80 (13.33)
21 55Women and Child Development 82.15 33.93 (41.30) 22 62Panchayat 10.78 10.78 (100) 23 64Scheduled Castes SubPlan 141.17 21.28 (15.07) 24 67Public WorksBuildings 31.12 30.93 (99.39) 25 75Financial Assistance to Urban Bodies 243.83 5.22(2.14) 26 79Medical Education Department 21.53 6.18 (28.70) 27 80 Financial Assistance to Three Tier Panchayati Raj
Institutions 95.48 24.04 (25.18)
Total (A) 2790.38 1393.73 B Revenue Charged
28 Interest Payments 62.56 62.55 (100) 29 06Finance 10.43 10.43 (100) 30 10Forest 13.03 13.03 (100)
Total (B) 86.02 86.01 C Capital Voted
31 06Finance 11.52 11.52(100) 32 17Cooperation 43.79 32.31(73.78) 33 19Public Health and Family Welfare 55.22 27.22 (49.29) 34 20 Public Health Engineering 41.67 31.67 (76.00)

Appendices
195
35 23 Water Resources Department 56.57 47.92 (84.71) 36 24Public WorksRoads and Bridges 265.39 265.39 (100) 37 37Tourism 46.84 22.78 (48.63) 38 41Tribal Areas SubPlan 113.35 70.00 (61.76) 39 42Public Works relating to Tribal Areas SubPlan –
Roads and Bridges 70.93 66.93 (94.36)
40 45Minor Irrigation Works 147.31 47.01 (31.91) 41 48Narmada Valley Development 108.90 32.10 (29.48) 42 57Externally Aided Projects pertaining to Water
Resources Department 172.85 14.77 (8.54)
43 64Scheduled Castes SubPlan 96.85 57.53 (59.40) 44 67Public WorksBuildings 38.80 38.80 (100)
Total (C) 1269.99 765.95 D Capital Charged
45 PublicDebt 2004.48 2004.48 (100) Total (D) 2004.48 2004.48
Grand Total (A+B+C+D) 6150.87 4250.17

Audit Report (Civil) for the year ended 31 March 2008
196
Appendix 2.9
(Reference: Paragraph 2.3.8 page 42 )
Cases of injudicious/ unrealistic surrender
(a) Cases where amount surrendered more than available saving.
(Rupees in crore) Sl.No.
Number and name of Grant/Appropriation Available Saving
Amount Surrendered
ARevenue Voted 1 03Police 116.45 137.37 2 05Jail 3.08 3.21 3 07 Commercial Tax 55.48 61.99 4 12Energy 34.44 34.53 5 17Cooperation 7.28 7.94 6 40Expenditue pertaining to Water Resources
DepartmentCommand Area Development 0.75 0.79
7 49Scheduled Caste Welfare 7.22 8.20 8 56Rural Industry 1.60 2.12
Total (A) 226.30 256.15 BRevenue Charged
9 29 Law and Legislative Affairs 4.29 4.49 Total (B) 4.29 4.49
CCapital Voted 10 60Expenditure Pertaining to District Plan Scheme 25.18 25.39
Total (C) 25.18 25.39 Grand Total (A+B+C) 255.77 286.03

Appendices
197
Appendix2.10
(Referrence:Paragraph 2.3.11 Page 44 )
Year wise breakup of unclaimed (Revenue) deposit amounts
SL.No. Name of Treasury/sub Treasury. Year Amount 1 Sub Treasury Indore 199899 95306.00
992000 2244212.00 200001 2282435.00 200102 24741677.00 200203 244476.00
Total 29608106.00 2 Sub Treasury Karera (Shivpuri) 199697 20308.00
199798 2200.00 199899 11785.00 992000 200000.00 200102 12719.00
Total 247012.00 3 Sub Treasuryy Pichhor (Shivpuri) 198081 22027.12
198182 1628.65 198283 4449.25 198384 9418.43 198485 2624.95 198586 510.20 198687 360.70 198788 995.00 198889 26814.95 198990 4017.70 199091 17765.44 199192 265.00 199293 977.10 199394 369.00 199495 4850.40 199596 2577.00 199697 1934.00 199798 2735.00 199899 786.00 992000 67951.00 200001 6310.00 200102 100.00 200203 5000.00
Total 184466.89 4 Sub Treasury Ambah (Morena) 197980 666.00
198081 6366.00 198182 794.00 198283 2369.00 198384 1080.00 198485 2855.00 198586 477.00 198687 49857.00 198788 4259.00 198889 58904.00
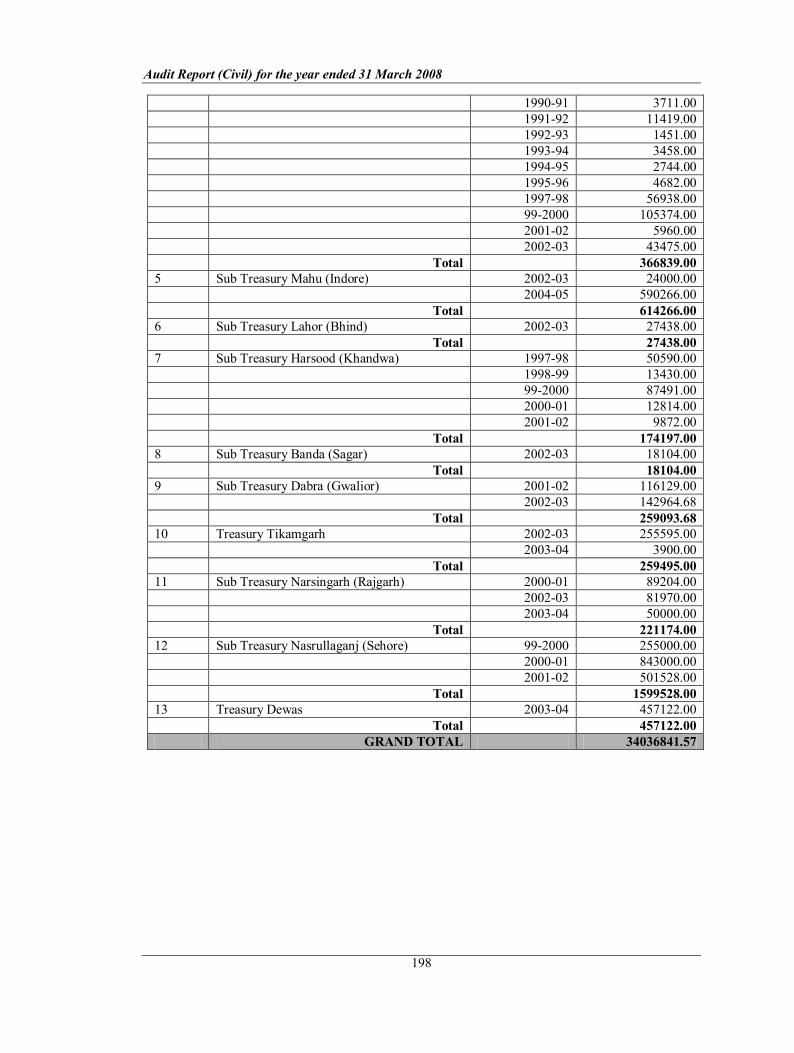
Audit Report (Civil) for the year ended 31 March 2008
198
199091 3711.00 199192 11419.00 199293 1451.00 199394 3458.00 199495 2744.00 199596 4682.00 199798 56938.00 992000 105374.00 200102 5960.00 200203 43475.00
Total 366839.00 5 Sub Treasury Mahu (Indore) 200203 24000.00
200405 590266.00 Total 614266.00
6 Sub Treasury Lahor (Bhind) 200203 27438.00 Total 27438.00
7 Sub Treasury Harsood (Khandwa) 199798 50590.00 199899 13430.00 992000 87491.00 200001 12814.00 200102 9872.00
Total 174197.00 8 Sub Treasury Banda (Sagar) 200203 18104.00
Total 18104.00 9 Sub Treasury Dabra (Gwalior) 200102 116129.00
200203 142964.68 Total 259093.68
10 Treasury Tikamgarh 200203 255595.00 200304 3900.00
Total 259495.00 11 Sub Treasury Narsingarh (Rajgarh) 200001 89204.00
200203 81970.00 200304 50000.00
Total 221174.00 12 Sub Treasury Nasrullaganj (Sehore) 992000 255000.00
200001 843000.00 200102 501528.00
Total 1599528.00 13 Treasury Dewas 200304 457122.00
Total 457122.00 GRAND TOTAL 34036841.57
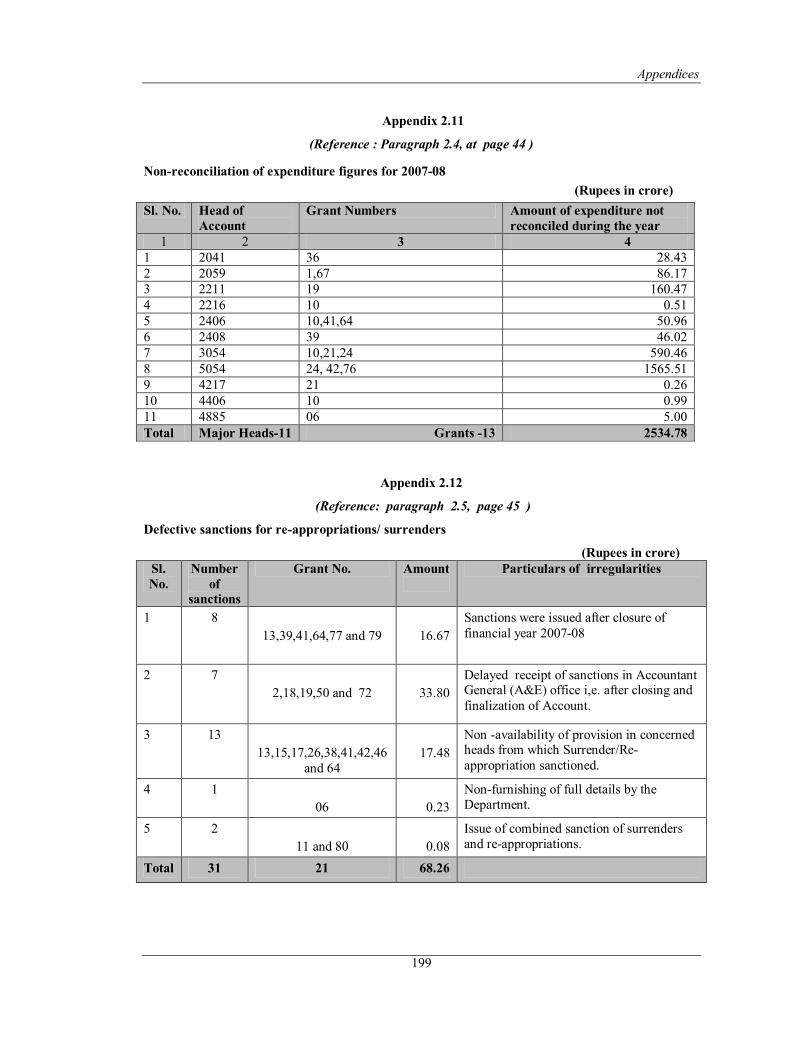
Appendices
199
Appendix 2.11
(Reference : Paragraph 2.4, at page 44 )
Nonreconciliation of expenditure figures for 200708 (Rupees in crore)
Sl. No. Head of Account
Grant Numbers Amount of expenditure not reconciled during the year
1 2 3 4 1 2041 36 28.43 2 2059 1,67 86.17 3 2211 19 160.47 4 2216 10 0.51 5 2406 10,41,64 50.96 6 2408 39 46.02 7 3054 10,21,24 590.46 8 5054 24, 42,76 1565.51 9 4217 21 0.26 10 4406 10 0.99 11 4885 06 5.00 Total Major Heads11 Grants 13 2534.78
Appendix 2.12
(Reference: paragraph 2.5, page 45 )
Defective sanctions for reappropriations/ surrenders
(Rupees in crore) Sl. No.
Number of
sanctions
Grant No. Amount Particulars of irregularities
1 8 13,39,41,64,77 and 79 16.67
Sanctions were issued after closure of financial year 200708
2 7 2,18,19,50 and 72 33.80
Delayed receipt of sanctions in Accountant General (A&E) office i,e. after closing and finalization of Account.
3 13 13,15,17,26,38,41,42,46
and 64 17.48
Non availability of provision in concerned heads from which Surrender/Re appropriation sanctioned.
4 1 06 0.23
Nonfurnishing of full details by the Department.
5 2 11 and 80 0.08
Issue of combined sanction of surrenders and reappropriations.
Total 31 21 68.26
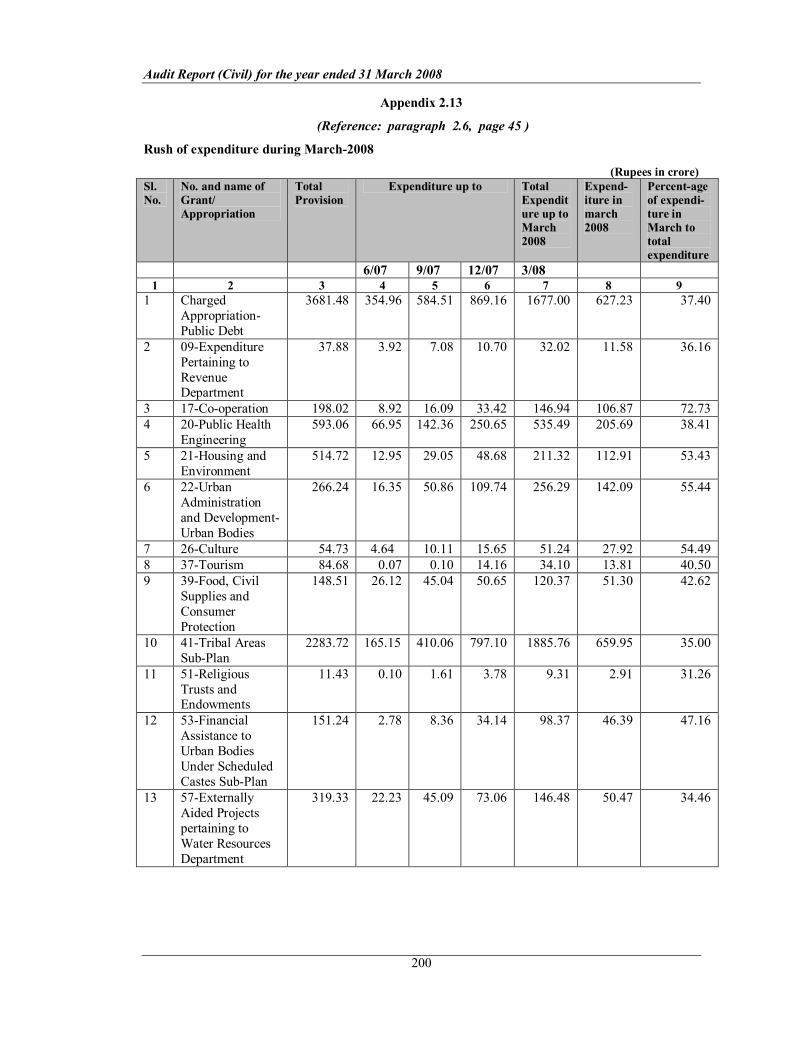
Audit Report (Civil) for the year ended 31 March 2008
200
Appendix 2.13
(Reference: paragraph 2.6, page 45 )
Rush of expenditure during March2008
(Rupees in crore) Sl. No.
No. and name of Grant/ Appropriation
Total Provision
Expenditure up to Total Expendit ure up to March 2008
Expend iture in march 2008
Percentage of expendi ture in March to total expenditure
6/07 9/07 12/07 3/08 1 2 3 4 5 6 7 8 9
1 Charged Appropriation Public Debt
3681.48 354.96 584.51 869.16 1677.00 627.23 37.40
2 09Expenditure Pertaining to Revenue Department
37.88 3.92 7.08 10.70 32.02 11.58 36.16
3 17Cooperation 198.02 8.92 16.09 33.42 146.94 106.87 72.73 4 20Public Health
Engineering 593.06 66.95 142.36 250.65 535.49 205.69 38.41
5 21Housing and Environment
514.72 12.95 29.05 48.68 211.32 112.91 53.43
6 22Urban Administration and Development Urban Bodies
266.24 16.35 50.86 109.74 256.29 142.09 55.44
7 26Culture 54.73 4.64 10.11 15.65 51.24 27.92 54.49 8 37Tourism 84.68 0.07 0.10 14.16 34.10 13.81 40.50 9 39Food, Civil
Supplies and Consumer Protection
148.51 26.12 45.04 50.65 120.37 51.30 42.62
10 41Tribal Areas SubPlan
2283.72 165.15 410.06 797.10 1885.76 659.95 35.00
11 51Religious Trusts and Endowments
11.43 0.10 1.61 3.78 9.31 2.91 31.26
12 53Financial Assistance to Urban Bodies Under Scheduled Castes SubPlan
151.24 2.78 8.36 34.14 98.37 46.39 47.16
13 57Externally Aided Projects pertaining to Water Resources Department
319.33 22.23 45.09 73.06 146.48 50.47 34.46

Appendices
201
14 59 Externally Aided Projects pertaining to Rural Development Department
68.95 6.50 13.30 17.60 68.95 46.66 67.67
15 60 Expenditure Pertaining to District Plan Scheme
187.90 16.82 42.62 69.53 160.27 60.87 37.98
16 63Minority Welfare
5.95 0.58 1.10 1.83 4.12 1.93 46.84
17 68 Financial Assistance to Tribal Area Sub Plan Urban Bodies
38.10 0.37 1.44 2.08 12.90 4.97 38.53
18 69Information Technology
30.09 3.69 25.04 21.12 84.35
19 70 Externally Aided Projects pertaining to Technical Education and Training
24.22 0.06 1.80 2.14 8.95 3.37 37.65
20 78Horticulture and Food Processing
63.85 7.58 15.39 24.70 58.98 26.55 45.02
Note: The expenditure shown in column (7) of grant No.39,41 and 69 includes amounts of Rs.0.41 crore, Rs.29.55 crore and Rs.18.30 crore respectively aggregating to Rs.48.26 crore, which were credited to the Major Head 8443 Civil Deposits800 Other Deposits, on 31 st March 2008.

Audit Report (Civil) for the year ended 31 March 2008
202
Appendix 2.14
(Reference: Paragraph 2.7.2(ii), page 46 )
Substantial savings under schemes of selected grants
(Rupees in crore) Sl. No. Grant number and name of scheme Saving (Percentage)
200506 200607 200708 08Land Revenue and District Administration
1. 20290016846Land Management 5.06 (19.28) 6.80(24.03) 7.06(23.65) 2. 20291022193 Nazul establishment 1.90 (18.23) 2.28(20.88) 3.20(25.93) 3 202910301015045 Digitization of
Cadastral Survey Maps 7.00 (100) 10.50(100) 2.28(100)
4 20530931509District Establishment 9.68 (17.50) 10.57 (16.44)
15.89 (21.80)
16Fisheries 5. 24051010101162District Level
Staff for Inland Fishries 1.55 (18.07) 2.23 (20.31) 4.57 (32.62)
20Public Health Engineering 6. 221501001523Establishment of
Water Supply Schemes of the State 1.35 (15.22) 1.69 (18.27) 2.11 (21.29)
7. 22150210707016263Rural Sewerage Scheme (Complete Cleanliness Expedition)
5.02 (66.93) 3.03 (67.18) 8.24 (64.73)
22Urban Administration and DevelopmentUrban Bodies 8. 22170580012017321Urban
Services Programme for Poor People NA NA 7.33 (48.83)
30Rural Development 9 251580001016931MiddayMeal
Programme NA Excess 41.98 (64.35)
40Expenditure Pertaining to Water Resources DepartmentCommand Area Development 10 470520307016852Correction of
System Deficiency 1.82 (100) 3.40(100) 4.00 (100)
67Public Works Buildings 11 2059010533645Maintenance of
Government Higher Secondary School Buildings
NA 4.45 (48.06) 3.24 (32.40)
12 2059010535009 Maintenance of Government College Buildings
NA NA 8.88 (59.20)
13 2059800527091Electrical and Mechanical Establishment
Excess Excess 2.87 (26.14)
Total 33.38 44.95 111.65

Appendices
203
Appendix 2.15 (Reference: Paragraph 2.7.2(ii) , page 46 )
Substantial excesses under schemes of selected grants
(Rupees in crore) Sl.No.
Grant number and name of Scheme Excess (percentage)
200506 200607 200708 20 Public Health Engineering
1 22150119101017446Narmada Water Extension Scheme for Bhopal City
NA Saving 8.00 (53.33)
2 221501799001Stock Saving Saving 3.28 (*)
3 2215017994058Miscellaneous Public Works Advances
3.22 (*) 4.52 (*) 2.66 (*)
22Urban Administration and DevelopmentUrban Bodies
4 42176005112017905Development of Basic Facilities in Municipal Corporations
NA Saving 1.25 (8.83)
5 62176080012017905 Development of Basic Facilities in Municipal Corporations
2.75 (*) Saving 3.15 (1.68)
30Rural Development
6 251580008017886Transpotation of MiddayMeal Material
Saving Saving 41.98 (10.21)
40Expenditure Pertaining to Water Resources DepartmentCommand Area Development
7 470520307012823Constrution of Field Channels
0.25 (5.81) Saving 1.97 (39.40)
67Public Works Buildings
8 205901051183Other Maintenance Works
0.90 (108.36) Nil 3.94 (358.18)
9 2059010531576Ordinary Repairs 7.37 (29.86) 7.91 (17.20) 4.20 (9.92)
10 20590105301013383Special RepairsBuildings
0.94 (75.05) 3.13 (48.15) 1.02 (17.00)
11 2059807991051Stock 12.09 (151.13) 23.45
(2345.00)
5.76 (576.00)
12 2059207994056 Miscellaneous Public Works Advances
6.48 (92.57) 16.24
(1624.00)
7.75 (775.00)
13 2216808004489 Ordinary Repairs 11.97 (49.77) 5.79 (13.47) 2.16 (5.20)
Total 45.97 61.04 87.12
* Excess against Token Provision

Audit Report (Civil) for the year ended 31 March 2008
204
Appendix 2.16
(Reference: Paragraph 2.7.3, page 46 )
(A) Cases where supplementary provision under schemes proved unnecessary in respect of selected grants.
(Rupees in crore) Sr. No. Description of grant and scheme Amount of unutilized
supplementary provision (1) (2) (3)
08LAND REVENUE AND DISTRICT ADMINISTRATION
1 20530931509District Establishment 2.00
2 2053094619Subdivisional Establishment 2.08
25MINERAL RESOURCES
3 28530200101012294Direction 0.05
30RURAL DEVELOPMENT
4 251580001016931MiddayMeal Programme 7.35
67PUBLIC WORKSBUILDINGS
5 2059010516997Maintenance of DIET Building 4.00
6 2059010535462 Maintenance of Commerce Industry Centers 1.00
7 2216050535469 Maintenance of Government College Hostels 1.00
Total 17.48
(B) Cases where supplementary provision proved excessive under schemes of selected grants.
(Rupees in crore) Sr. No.
Description of Grants and Schemes. Original Supple mentary
Expendi ture
Saving ()
22URBAN ADMINISTRATION AND DEVELOPMENT URBAN BODIES
1 62170180012017986Development of Basic Facilities in Capital
25.21 11.15 31.96 4.40
67PUBLIC WORKSBUILDINGS 2 2216050535466For Maintenance of
Residential Houses of Subordinate Courts 1.50 0.71 0.79
3 2216050535470 Maintenance of Government Education College Hostels
1.00 0.14 0.86
4 2216050535471 Maintenance of DIET Hostel Buildings
1.50 0.31 1.19
5 2059010531533Jail Administration Maintenance of Jail Buildings
2.00 1.09 0.91
6 2059010535009 Maintenance of Government College Buildings
5.00 10.00 6.12 8.88
7 2059010536996 Maintenance of Government Teaching Colleges
0.14 2.00 0.32 1.82
8 2059010531864 Maintenance of Technical Buildings
1.60 4.00 4.72 0.88

Appendices
205
9 2059010534220EducationMedical Colleges (Maintenance of Buildings)
2.10 9.00 9.50 1.60
Total 34.05 42.15 54.87 21.33
(C) Cases where supplementary provision proved inadequate under schemes of selected grants.
(Rs. in crore) Sr. No.
Description of Grants and Schemes Original Supple mentary
Expendi ture
Excess (+)
30RURAL DEVELOPMENT 1 221580008017886Transportation of Mid
dayMeal 394.41 16.83 453.22 (+) 41.98
67PUBLIC WORKSBUILDINGS 2 2216050532450Administration of Justice 0.50 1.00 2.12 (+) 0.62
22URBAN ADMINISTRATION AND DEVELOPMENT URBAN BODIES 3 42176005112017905Development of
Basic Facilities in Municipal Corporation 8.00 6.16 15.41 (+) 8.25
4 62176080012017905 Development of Basic Facilities in Municipal Corporation
112.91 75.09 191.15 (+) 3.15
Total 515.82 99.08 661.90 54.00

Audit Report (Civil) for the year ended 31 March 2008
206
Appendix 2.17
(Reference: Paragraph 2.7.7, page 47 )
Rush of expenditure under schemes of selected grants
(Rupees in lakh) Sr. No.
Grant No.
Particulars of schemes Total Expenditure
Expenditure in March08
Percentage of Expenditure in March08
1 16 240512007018269Construction of Residential Houses Under Fishermen's National Welfare Fund
32.90 32.90 100.00
2 20 22150100501014184Survey of Water Supply schemes in Urban and Semi Urban Areas and drainage scheme in Major Cities
23.32 16.72 71.70
3 20 22150119101017446Narmada Water Extension Scheme for Bhopal City
2300.00 2300.00 100.00
4 20 22150119201017447Revised Water Supply Scheme
231.36 104.30 45.08
5 22 22170580012017321Urban Services Programmes for Poor People
767.53 557.18 72.59
6 22 42176005112017905 Development of Basic Facilities in Municipal Corporations
1541.13 974.26 63.22
7 22 62176080012017905 Development of Basic Facilities in Municipal Corporations
19115.13 11115.00 58.15
8 22 62170180012017986 Development of Basic Facilities in Capital
3195.97 1410.00 44.12
9 30 251580008017886Transportation of Midday Meal material
45322.13 18841.88 41.57
10 67 2059010511024Treasury and Accounts Administration
18.43 18.06 98.00
11 67 2059010513859Public Service Commission
6.78 6.78 100.00
12 67 2059010514574Information and Publicity
4.06 4.06 100.00
13 67 2059010531533Jail AdministrationMaintenance of Jail Buildings
109.03 109.03 100.00
14 67 2059010532553Veterinary and Animal Health Service Programme
154.49 132.00 85.44
15 67 2059010533645Maintenance of Government Higher Secondary School Buildings
675.61 380.17 56.27

Appendices
207
16 67 2059010534177Maintinance of Urban Areas Dispensaries Buildings
187.17 114.47 61.16
17 67 2059010534220Education Medical Colleges (Maintenance of Buildings)
949.78 721.15 75.93
18 67 2059010535004Welfare of Tribes 30.43 30.43 100.00 19 67 2059010535009Maintenance of
Government College Buildings 612.14 427.20 69.79
20 67 2059010535459For Maintenance Works of Subordinate Courts
52.51 52.51 100.00
21 67 2059010535460Maintenance of Archaeology Museums
11.96 11.96 100.00
22 67 2059010536996 Maintenance of Government Teaching Collages
32.01 31.34 97.91
23 67 2059010536997Maintenance of DIET Buildings
69.72 59.72 85.66
24 67 2059010538037 Maintenance of Agriculture Farms
13.52 15.86 117.31
25 67 2059010538187 Maintenance of Buildings of Industrial Training Institutes
29.89 29.70 99.36
26 67 2216050531481District Administration
19.93 19.93 100
27 67 2216050531523Jails (Construction at Residential Quarters for Staff )
26.08 26.08 100.00
28 67 221605053183Other Maintenance Works
1044.37 1044.37 100.00
29 67 2216050531864 Maintenance of Technical (Educational Institutions) Buildings
42.67 42.67 100.00
30 67 2216050532450 Administration of Justice
211.92 211.92 100.00
31 67 2216050532631Police Administration
61.82 61.82 100.00
32 67 2216050533643Governor House 5.51 5.51 100.00
33 67 2216050535466For Maintenance of Residential Houses of Sub ordinate Courts
70.93 70.92 100.00
34 67 2216050535470 Maintenance of Government Education College Hostels
13.76 13.76 100.00

Audit Report (Civil) for the year ended 31 March 2008
208
35 67 2216050535471 Maintenance of DIET Buildings Hostels
31.35 31.35 100.00
36 67 2216050535472 Maintenance of Industrial Training Institute Hostels
53.17 53.17 100.00
37 67 2216050536220Public Works Department
76.03 76.03 100.00
Total 77144.54 39154.21
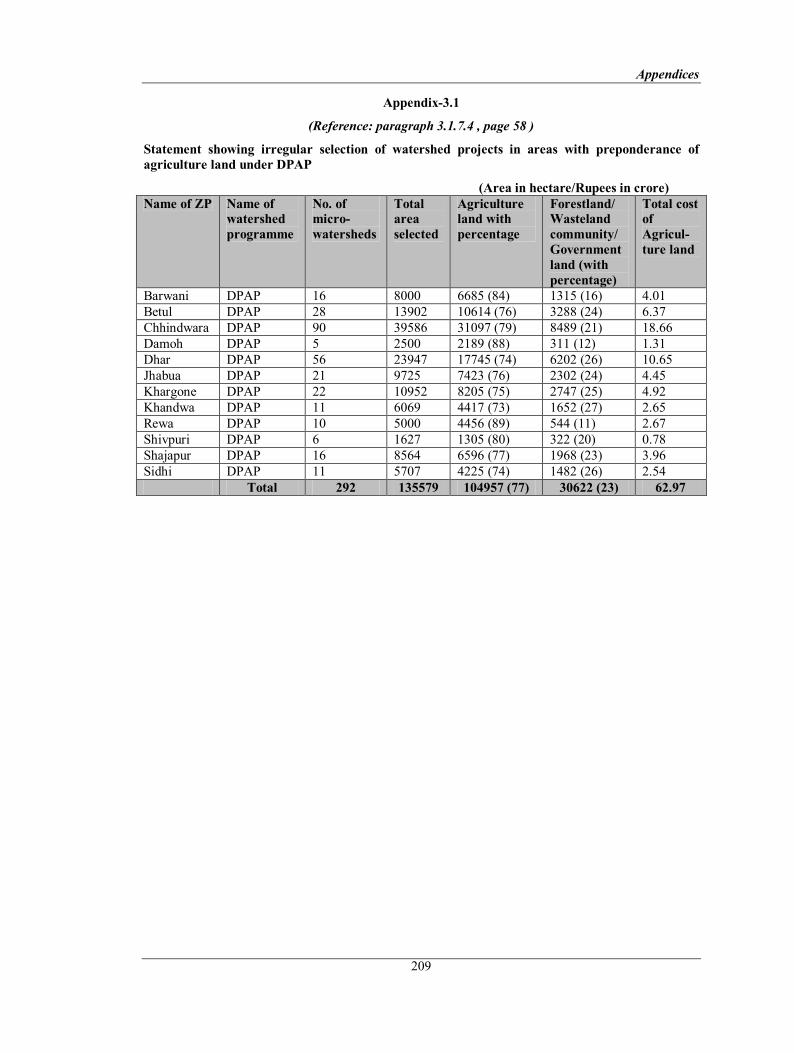
Appendices
209
Appendix3.1
(Reference: paragraph 3.1.7.4 , page 58 )
Statement showing irregular selection of watershed projects in areas with preponderance of agriculture land under DPAP
(Area in hectare/Rupees in crore) Name of ZP Name of
watershed programme
No. of micro watersheds
Total area selected
Agriculture land with percentage
Forestland/ Wasteland community/ Government land (with percentage)
Total cost of Agricul ture land
Barwani DPAP 16 8000 6685 (84) 1315 (16) 4.01 Betul DPAP 28 13902 10614 (76) 3288 (24) 6.37 Chhindwara DPAP 90 39586 31097 (79) 8489 (21) 18.66 Damoh DPAP 5 2500 2189 (88) 311 (12) 1.31 Dhar DPAP 56 23947 17745 (74) 6202 (26) 10.65 Jhabua DPAP 21 9725 7423 (76) 2302 (24) 4.45 Khargone DPAP 22 10952 8205 (75) 2747 (25) 4.92 Khandwa DPAP 11 6069 4417 (73) 1652 (27) 2.65 Rewa DPAP 10 5000 4456 (89) 544 (11) 2.67 Shivpuri DPAP 6 1627 1305 (80) 322 (20) 0.78 Shajapur DPAP 16 8564 6596 (77) 1968 (23) 3.96 Sidhi DPAP 11 5707 4225 (74) 1482 (26) 2.54
Total 292 135579 104957 (77) 30622 (23) 62.97
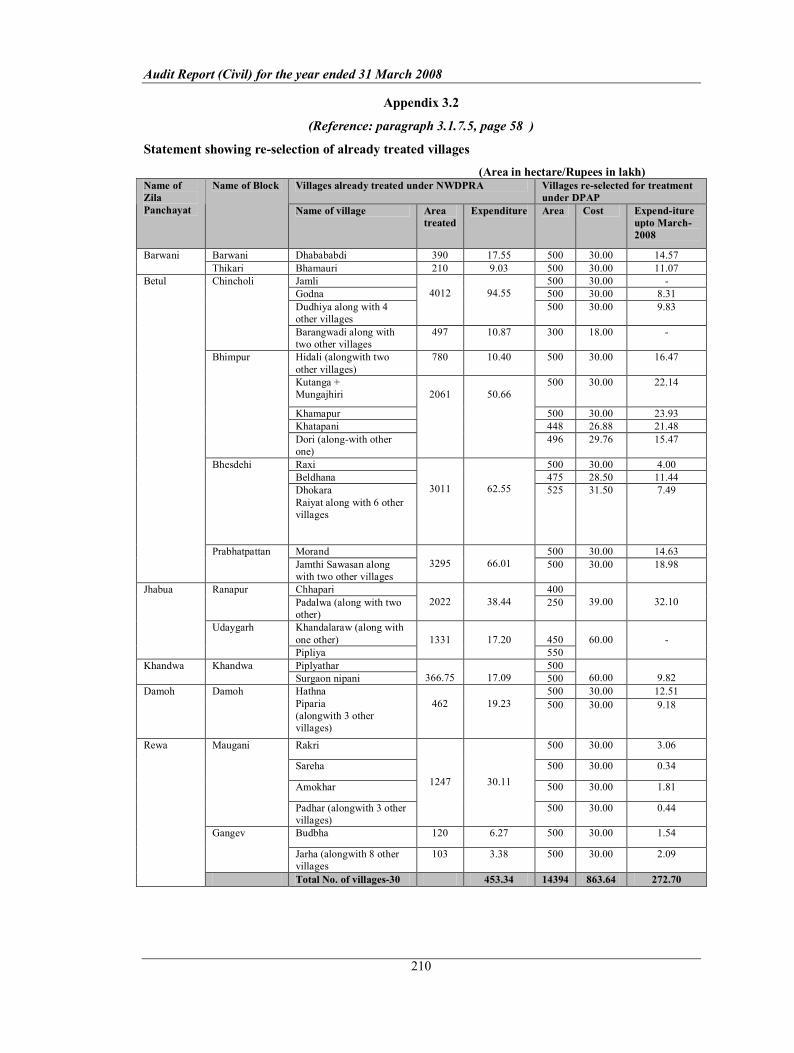
Audit Report (Civil) for the year ended 31 March 2008
210
Appendix 3.2
(Reference: paragraph 3.1.7.5, page 58 )
Statement showing reselection of already treated villages
(Area in hectare/Rupees in lakh) Villages already treated under NWDPRA Villages reselected for treatment
under DPAP Name of Zila Panchayat
Name of Block
Name of village Area treated
Expenditure Area Cost Expenditure upto March 2008
Barwani Dhabababdi 390 17.55 500 30.00 14.57 Barwani Thikari Bhamauri 210 9.03 500 30.00 11.07
Jamli 500 30.00 Godna 500 30.00 8.31 Dudhiya along with 4 other villages
4012 94.55 500 30.00 9.83
Chincholi
Barangwadi along with two other villages
497 10.87 300 18.00
Hidali (alongwith two other villages)
780 10.40 500 30.00 16.47
Kutanga + Mungajhiri
500 30.00 22.14
Khamapur 500 30.00 23.93 Khatapani 448 26.88 21.48
Bhimpur
Dori (alongwith other one)
2061 50.66
496 29.76 15.47
Raxi 500 30.00 4.00 Beldhana 475 28.50 11.44
Bhesdehi
Dhokara Raiyat along with 6 other villages
3011 62.55 525 31.50 7.49
Morand 500 30.00 14.63
Betul
Prabhatpattan Jamthi Sawasan along with two other villages
3295 66.01 500 30.00 18.98
Chhapari 400 Ranapur Padalwa (along with two other)
2022 38.44 250 39.00 32.10
Khandalaraw (along with one other) 450
Jhabua
Udaygarh
Pipliya 1331 17.20
550 60.00
Piplyathar 500 Khandwa Khandwa Surgaon nipani 366.75 17.09 500 60.00 9.82
500 30.00 12.51 Damoh Damoh Hathna Piparia (alongwith 3 other villages)
462 19.23 500 30.00 9.18
Rakri 500 30.00 3.06
Sareha 500 30.00 0.34
Amokhar 500 30.00 1.81
Maugani
Padhar (alongwith 3 other villages)
1247 30.11
500 30.00 0.44
Budbha 120 6.27 500 30.00 1.54 Gangev
Jarha (alongwith 8 other villages
103 3.38 500 30.00 2.09
Rewa
Total No. of villages30 453.34 14394 863.64 272.70

Appendices
211
Appendix 3.3
(Reference: paragraph 3.1.7.6 , page 59 )
Statement showing Selection of microwatershed (villages) falling under command areas of Irrigation projects
Name of ZP Name of Irrigation Project
Name of villages which are falling
under the command area of the Irrigation Projects
Name of watershed programme in which these villages has been selected for
treatment
Area selected
in hectare
Cost of area
(Rupees in lakh)
1 2 3 4 5 6 Betul Sanpana Dam Ankawadi + Parsodi DPAP 500 30.00
Sonkhedi Dam Niman wada DPAP 500 30.00 Jhagadiya Dam Jhagadiya DPAP 300 18.00 Gondigola Dam Sarandai DPAP 511 30.66 Pawar Jhando dam Pawar Jhanda DPAP 500 30.00 Pahawadi Dam Pahawadi power
jhanda DPAP 500 30.00
Mathani Dam Mathani DPAP 300 18.00 Lalawadi Dam Lalawadi DPAP 500 30.00 Pusli Dam Dhanora DPAP 500 30.00 Jeetu Dhana Dam Ratanpur DPAP 562 33.72 Khokhara Dam Khokhara,
Narharpur, Katkuhi
DPAP 301 609 590
18.06 36.54 35.40
Kursi Dam Mathani DPAP 500 30.00 14 6673 400.38
Chhindwara Karaboh Dam Khajri DPAP 687 41.22 Karaboh Dam Karaboh DPAP 791 47.46 Sakarwada Dam Ranikamath DPAP 573 34.38 Ghoghari Dam Mehlon DPAP 350 21.00 Mursani Dam Bichhua DPAP 380 22.80 Dolapanjra Dam Jamuniya DPAP 600 36.00 Mayawadi lift irrigation scheme
Mayawadi DPAP 400 24.00
Haranbhata lift irrigation scheme
Haranbhata DPAP 650 39.00
8 4431 265.86 Dhar Dhantoli tank Dantoli DPAP 550 33.00
Govindpura tank Badveli DPAP 500 30.00 Govindpura tank Govindpura DPAP 286 17.16 Mahaveer pavitra Amodiya DPAP 500 30.00 Anandkhedi tank Tandakheda DPAP 500 30.00 Anandkhedi tank Moyakheda DPAP 400 24.00 Anandkhedi tank Hanumantya kag DPAP 550 33.00 Kakadwa tank Kakdwa DPAP 525 31.50 Nakhli tank no.1 Narwali DPAP 484 29.04 Singachori tank Chamjhar DPAP 500 30.00 Jotgarh tank Gardi DPAP 602 36.12 Jotgarh tank Jetgarh DPAP 413 24.78 Piprani tank no.1 Piprani DPAP 500 30.00
13 6310 378.60 Contd…

Audit Report (Civil) for the year ended 31 March 2008
212
1 2 3 4 5 6 Khargone Adampura Tank Adampura DPAP 500 30.00
Dalki Tank Dalki DPAP 500 30.00 Kamodwada Tank Kamodwada DPAP 500 30.00
3 1500 90.00 Khandwa Deshgoan Tank No.2 Sahejala DPAP 1200 72.00
Saliya Tank Saliya DPAP 800 48.00 Patajan Tank Patajan DPAP 400 24.00 Dagarkot Tank Dagarkot DPAP Dabhiya Tank Dabhiya DPAP
1500 90.00
Jamdhar Jamdhar DPAP 700 42.00 Gulardhana Tank Gulardhana DPAP 800 48.00
7 5400 324.00 Shajapur Tookrana DPAP 513 30.78
Bheelwadiya DPAP 397 23.82 Loharwas DPAP 250 15.00 Chhatgoan DPAP 400 24.00 Chausala DPAP 350 21.00 Banakhedi DPAP 200 12.00
Chillar Medium Irrigation Tank
Delodari DPAP 300 18.00 Kadari DPAP 560 33.60 Amalaverdiya Tank Kachaliya DPAP 420 25.20
Rawali Lift Irrigation Scheme
Amarkot IWDP 250 15.00
Bardiyasone DPAP 520 31.20 Chausla kulmi DPAP 847 50.82 Akya DPAP 270 16.20
Sajod Dam
Sajod DPAP 258 15.48 14 5535 332.10
Rewa Sengari Rampur DPAP 500 30.00 Mauganj Tank Barria kala DPAP 500 30.00 Padar Tank Padar Tank DPAP 500 30.00 Ramsagar Tank Rakri DPAP 500 30.00
4 2000 120.00 Grand Total 63 31849 1910.94

Appendices
213
Appendix 3.4
(Reference: paragraph 3.1.8.1, page 59 )
Statement showing position of physical targets and achievements of test checked Zila Panchayats
(Area in hectare & Rupees in crore) Sanctioned project
Shortfall with percentage
Expend iture incurred as of March 2008
Name of watershed programme
No. Period
No. of years completed as on March 2008
Target of land treatment
Proportio nate target upto March 2008
Achievem ent with percentage
DPAP6 th Batch
399 200005 8 years 199500 199500 182814 (92)
16686 (8) 113.02
DPAP7 th Batch
161 200106 7 years 80500 80500 65278 (81)
15222 (19)
39.82
DPAP8 th Batch
219 200207 6 years 109500 109500 60913 (56)
48587 (44)
38.37
DPAP9 th Batch
198 200308 5 years 99000 99000 58881 (59)
40119 (41)
39.18
DPAP10 th Batch
198 200409 4 years 99000 89100 44102 (49)
44998 (51)
28.78
DPAP11 th Batch
226 200510 3 years 113000 84750 36368 (43)
48382 (57)
25.71
DPAP12 th Batch
237 200611 2 years 118580 53361 8911 (17) 44450 (83)
8.47
IWDPI 2 200005 8 years 19581 19581 18532 (95)
1049 (5) 11.02
IWDPII 4 200106 7 years 24232 24232 20029 (83)
4203 (17) 13.82
IWDPIII 1 200207 6 years 7972 7972 7659 (96) 313 (4) 5.42 IWDPIV 2 200308 5 years 9895 9895 7818 (79) 2077 (21) 6.11 IWDPV 7 200510 3 years 34125 25594 11074
(43) 14520 (57)
8.48
IWDPVI 2 200611 2 years 10000 4500 1621 (36) 2879 (64) 1.69 Total 1656 924885 807485 524000
(65) 283485 (35)
339.89
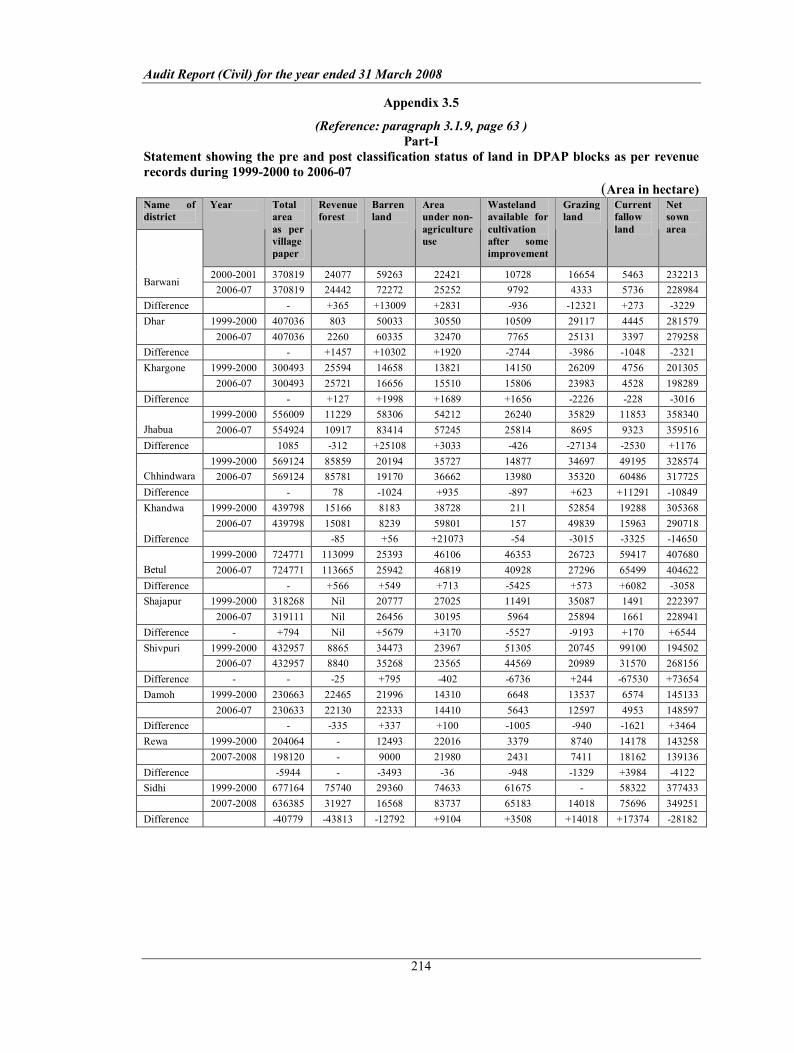
Audit Report (Civil) for the year ended 31 March 2008
214
Appendix 3.5
(Reference: paragraph 3.1.9, page 63 ) PartI
Statement showing the pre and post classification status of land in DPAP blocks as per revenue records during 19992000 to 200607
(Area in hectare) Name of district
Year Total area as per village paper
Revenue forest
Barren land
Area under non agriculture use
Wasteland available for cultivation after some improvement
Grazing land
Current fallow land
Net sown area
20002001 370819 24077 59263 22421 10728 16654 5463 232213 Barwani
200607 370819 24442 72272 25252 9792 4333 5736 228984 Difference +365 +13009 +2831 936 12321 +273 3229
19992000 407036 803 50033 30550 10509 29117 4445 281579 Dhar 200607 407036 2260 60335 32470 7765 25131 3397 279258
Difference +1457 +10302 +1920 2744 3986 1048 2321 19992000 300493 25594 14658 13821 14150 26209 4756 201305 Khargone 200607 300493 25721 16656 15510 15806 23983 4528 198289
Difference +127 +1998 +1689 +1656 2226 228 3016 19992000 556009 11229 58306 54212 26240 35829 11853 358340
Jhabua 200607 554924 10917 83414 57245 25814 8695 9323 359516 Difference 1085 312 +25108 +3033 426 27134 2530 +1176
19992000 569124 85859 20194 35727 14877 34697 49195 328574 Chhindwara 200607 569124 85781 19170 36662 13980 35320 60486 317725 Difference 78 1024 +935 897 +623 +11291 10849 Khandwa 19992000 439798 15166 8183 38728 211 52854 19288 305368
200607 439798 15081 8239 59801 157 49839 15963 290718 Difference 85 +56 +21073 54 3015 3325 14650
19992000 724771 113099 25393 46106 46353 26723 59417 407680 Betul 200607 724771 113665 25942 46819 40928 27296 65499 404622 Difference +566 +549 +713 5425 +573 +6082 3058
19992000 318268 Nil 20777 27025 11491 35087 1491 222397 Shajapur 200607 319111 Nil 26456 30195 5964 25894 1661 228941
Difference +794 Nil +5679 +3170 5527 9193 +170 +6544 19992000 432957 8865 34473 23967 51305 20745 99100 194502 Shivpuri 200607 432957 8840 35268 23565 44569 20989 31570 268156
Difference 25 +795 402 6736 +244 67530 +73654 Damoh 19992000 230663 22465 21996 14310 6648 13537 6574 145133
200607 230633 22130 22333 14410 5643 12597 4953 148597 Difference 335 +337 +100 1005 940 1621 +3464 Rewa 19992000 204064 12493 22016 3379 8740 14178 143258
20072008 198120 9000 21980 2431 7411 18162 139136 Difference 5944 3493 36 948 1329 +3984 4122 Sidhi 19992000 677164 75740 29360 74633 61675 58322 377433
20072008 636385 31927 16568 83737 65183 14018 75696 349251 Difference 40779 43813 12792 +9104 +3508 +14018 +17374 28182

Appendices
215
PartII
Statement showing the status of net sown area, barren land and nonagriculture use land of blocks of test checked districts
Sl. No.
Name of Districts
Net sown area Barren Land Nonagriculture use land
2000 2007 Difference 2000 2007 Difference 2000 2007 Difference 1 Barwani 232213 228984 3229 59263 72272 13009 22421 25252 2831 2 Dhar 281579 279258 2321 50033 60335 10302 30550 32470 1920 3 Khargone 201305 198289 3016 14658 16656 1998 13821 15510 1689 4 Jhabua 358340 359516 +1176 58306 83414 25108 54212 57245 3033 5 Khandwa 305368 290718 +14650 8183 8239 56 38728 59801 21073 6 Betul 407680 404622 3058 25393 25942 549 46106 46819 713 7 Shajapur 222397 228941 +6544 20777 26456 5679 27025 30195 3170 8 Damoh 145133 148597 +3464 21966 22333 337 14310 14410 100
26274 +11184
Total 2154015 2138925
15090
258609 315647 57038 247173 281702 34529
2000 2007 Difference Barren land 258609 315647 57038 Nonagriculture land use
247173 281702 34529
Total 505782 597349 91567

Audit Report (Civil) for the year ended 31 March 2008
216
Appendix 3.6 (Reference: paragraph 3.2.2, page 68 )
Statement showing Organisational set up chart for Mid Day Meal Scheme
State level Principal Secretary
Panchayat and Rural Development Department (Nodal Department )
Development Commissioner
(Implementing Agency)
District level District Collector
Chief Executive Officer, Zila Panchayat
Block level • Block Education Officer
• Chief Executive Officer, Janpad panchayat
School level • Nagriya Nikay/Gram Panchayats
• Parent Teacher Associations
• Self Help Groups.

Appendices
217
Appendix 3.7
(Reference : Paragraph 3.2.6.2, page70 )
Statement showing data of minus balances of conversion cost with PTAs Year 200405 Year 200506 Year 200607 Year 200708
Sr. no.
Name of District
No. of school test checked
No. of schools reported minus balance of cooking cost
Fund availabi lity
Actual expenditure
Minus balance
No. of schools reported minus balance of cooking cost
Fund availability
Actual expenditure
Minus balance
No. of schools reported minus balance of cooking cost
Fund availability
Actual expenditure
Minus balance
No. of schools reported minus balance of cooking cost
Fund availability
Actual expenditure
Minus balance
1 2 3 4 5 6 7 8 9 10 11 12 13 14 15 16 17 18 19 1 Bhopal 20 1 19586 38406 18820 1 0 85179 85179 0 0 0 0 3 73548 111042 37494
2 Bhind 20 1 2995 6648 3653 1 17697 24381 6684 1 29661 37604 7943 8 201267 245388 44121
3 Burhanpur 20 3 96162 133239 37077 7 179674 286722 107048 3 68304 239384 171080 1 56475 64938 8463
4 Narsinghpur 20 3 43518 56960 13442 1 11744 16302 4558 3 82285 90186 7901 6 166143 181250 15107
5 Shajapur 20 4 82845 102479 19634 9 195466 291719 96253 11 284209 368291 84082 9 206600 248693 42093
6 Shivpuri 20 4 64008 72535 8527 8 176976 191071 14095 8 215859 258417 42558 7 205099 249680 44581
7 Dindori 5 0 0 0 0 0 0 0 0 0 0 0 0 4 131430 175088 43658
8 Shahdol 32 0 0 0 0 0 0 0 0 0 0 0 0 15 416648 529306 112658
9 Betul 20 5 133597 164117 30523 8 191211 262536 71325 4 137410 155340 17930 1 41571 42416 845
10 Mandla 20 4 42046 46854 4808 5 64772 76867 12095 4 87298 100213 12915 2 70623 73092 2469
11 Jhabua 20 4 85709 93259 7550 6 78571 110982 32411 11 306222 368677 62455 2 87611 113342 25731
12 Khargone 20 15 430533 523545 93012 13 399646 483716 84070 3 83760 116671 32911 5 140874 175885 35011
Total 237 44 1000999 1238042 237046 59 1315757 1829475 513718 48 1295008 1734783 439775 63 1797889 2210120 412231 Data source : Test checked schools.

Audit Report (Civil) for the year ended 31 March 2008
218
Appendix 3.8
(Reference: paragraph 3.2.7.1, page 71 )
Statement showing enrolment, retention and dropout of students in primary schools
(Number of students in lakh) Year Enrolment
as per Scheme
Percen tage of increase/ decrease in enrolment
No. of beneficiaries availed MDM
Per cent of no. of beneficiaries wrt enrolment
Dropout rate(%) in MDM as per PRDD records
Retention rate(%) in MDM as per PRDD records
Dropout (No. of students)
Retention (No. of Students)
New enrollment as per dropout rate of last year and enrolment shown in current year
Increase/ decrease percentage of new enrolment
1 2 3 4 5 6 7 8 9 10 11
200304 76.94 NA NA 24 76 18.47 58.47
200405 82.52 7 NA NA 21 79 17.33 65.19 24.05
200506 88.92 8 NA NA 20 80 17.78 71.14 23.73 1
200607 89.15 0 76.11 85 18 82 16.05 73.10 18.01 24
200708 84.90 5 67.03 79 16 84 13.58 71.32 11.80 35 Source : Panchyat and Rural Development Department.
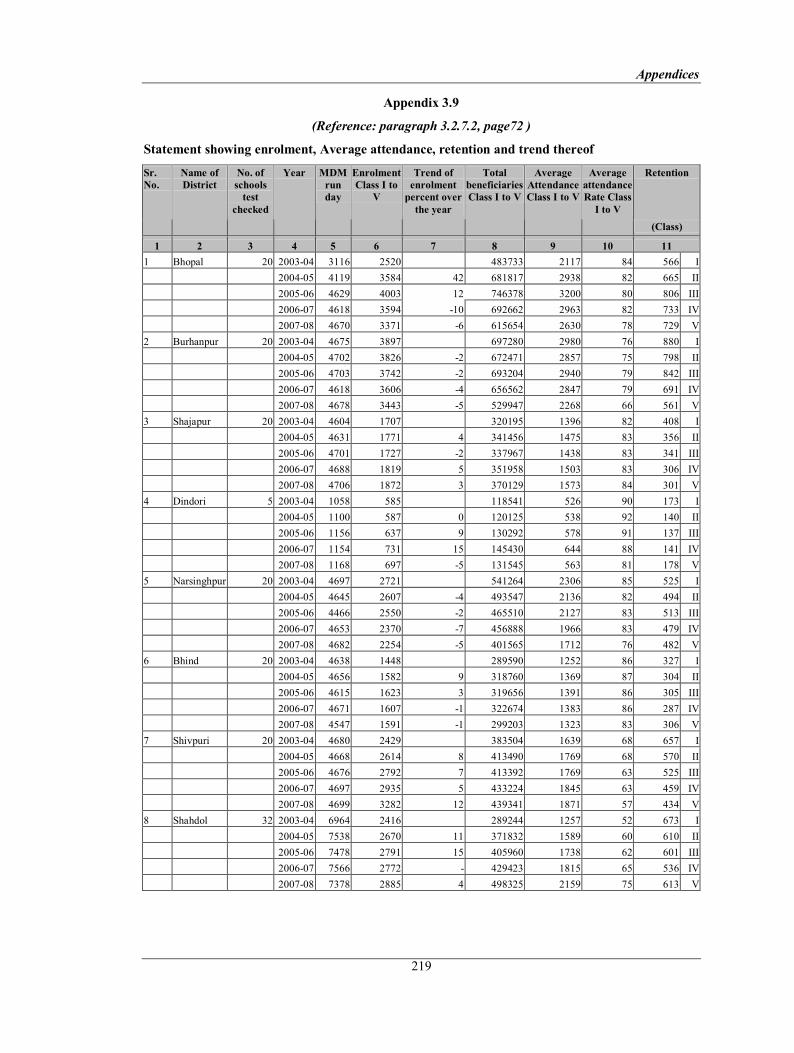
Appendices
219
Appendix 3.9
(Reference: paragraph 3.2.7.2, page72 )
Statement showing enrolment, Average attendance, retention and trend thereof
Retention Sr. No.
Name of District
No. of schools test
checked
Year MDM run day
Enrolment Class I to
V
Trend of enrolment percent over the year
Total beneficiaries Class I to V
Average Attendance Class I to V
Average attendance Rate Class I to V
(Class)
1 2 3 4 5 6 7 8 9 10 11 1 Bhopal 20 200304 3116 2520 483733 2117 84 566 I
200405 4119 3584 42 681817 2938 82 665 II 200506 4629 4003 12 746378 3200 80 806 III 200607 4618 3594 10 692662 2963 82 733 IV 200708 4670 3371 6 615654 2630 78 729 V
2 Burhanpur 20 200304 4675 3897 697280 2980 76 880 I 200405 4702 3826 2 672471 2857 75 798 II 200506 4703 3742 2 693204 2940 79 842 III 200607 4618 3606 4 656562 2847 79 691 IV 200708 4678 3443 5 529947 2268 66 561 V
3 Shajapur 20 200304 4604 1707 320195 1396 82 408 I 200405 4631 1771 4 341456 1475 83 356 II 200506 4701 1727 2 337967 1438 83 341 III 200607 4688 1819 5 351958 1503 83 306 IV 200708 4706 1872 3 370129 1573 84 301 V
4 Dindori 5 200304 1058 585 118541 526 90 173 I 200405 1100 587 0 120125 538 92 140 II 200506 1156 637 9 130292 578 91 137 III 200607 1154 731 15 145430 644 88 141 IV 200708 1168 697 5 131545 563 81 178 V
5 Narsinghpur 20 200304 4697 2721 541264 2306 85 525 I 200405 4645 2607 4 493547 2136 82 494 II 200506 4466 2550 2 465510 2127 83 513 III 200607 4653 2370 7 456888 1966 83 479 IV 200708 4682 2254 5 401565 1712 76 482 V
6 Bhind 20 200304 4638 1448 289590 1252 86 327 I 200405 4656 1582 9 318760 1369 87 304 II 200506 4615 1623 3 319656 1391 86 305 III 200607 4671 1607 1 322674 1383 86 287 IV 200708 4547 1591 1 299203 1323 83 306 V
7 Shivpuri 20 200304 4680 2429 383504 1639 68 657 I 200405 4668 2614 8 413490 1769 68 570 II 200506 4676 2792 7 413392 1769 63 525 III 200607 4697 2935 5 433224 1845 63 459 IV 200708 4699 3282 12 439341 1871 57 434 V
8 Shahdol 32 200304 6964 2416 289244 1257 52 673 I 200405 7538 2670 11 371832 1589 60 610 II 200506 7478 2791 15 405960 1738 62 601 III 200607 7566 2772 429423 1815 65 536 IV 200708 7378 2885 4 498325 2159 75 613 V

Audit Report (Civil) for the year ended 31 March 2008
220
1 2 3 4 5 6 7 8 9 10 11 9 Betul 20 200304 4702 2786 519652 2211 79 555 I
200405 4673 2735 2 489320 2094 77 492 II 200506 4713 2665 3 512925 2177 82 551 III 200607 4737 2540 5 487918 2059 81 580 IV 200708 4457 2382 6 464077 2035 85 581 V
10 Mandla 20 200304 4671 1631 272393 1167 72 432 I 200405 4680 1675 3 295987 1267 76 348 II 200506 4677 1608 4 302192 1292 80 341 III 200607 4694 1659 3 314415 1332 80 330 IV 200708 4684 1790 8 344330 1470 82 308 V
11 Khargone 20 200304 4431 2832 441072 1991 70 596 I 200405 4485 2963 5 517233 2301 78 559 II 200506 4873 3075 4 528080 2181 71 588 III 200607 4635 3108 1 518890 2242 72 578 IV 200708 4577 2943 5 490505 2138 73 573 V
12 Jhabua 20 200304 3587 1718 201392 1113 65 476 I 200405 4335 1990 16 329505 1496 75 431 II 200506 4319 2184 10 364514 1667 76 403 III 200607 4491 2319 6 398108 1765 76 382 IV 200708 4381 2406 4 386173 1756 73 348 V
Total 237 200304 51823 26690 4557860 19955 75 6268 I 200405 54232 28604 7 5045543 21829 76 5767 II 200506 55006 29397 3 5220070 22498 77 5953 III 200607 55222 29060 1 5208152 22364 77 5502 IV 200708 54627 28916 0 4970794 21498 74 5414 V
NoteData shown in column 9 is total average attendance of the no. of schools checked in the districts.

Appendices
221
Appendix 3.10 (Reference: paragraph 3.2.11.3, page 77 )
Statement showing nondistribution of IFA and Albendazol tablets in test checked schools
Year 200506 Year 200607 Year 200708 Sr. No.
Name of district
No. of Schools test checked
No. of schools where IFA teblets were not distributed
No. of students deprived of IFA teblets
No. of schools where Albendazol teblets were not distributed
No. of students deprived of Albendazol teblets
No. of schools where IFA teblets were not distributed
No. of students deprived of IFA teblets
No. of schools where Albendazol teblets were not distributed
No. of students deprived of Albendazol teblets
No. of schools where IFA teblets were not distributed
No. of students deprived of IFA teblets
No. of schools where Albendazol teblets were not distributed
No. of students deprived of Albendazol teblets
1 2 3 4 5 6 7 8 9 10 11 12 13 14 15 1 Betul 20 1 23 2 81 15 1795 15 1795 18 2273 18 2273 2 Bhind 20 1 97 6 407 2 91 7 409 6 521 11 891 3 Bhopal 20 2 295 2 295 2 252 2 252 13 1681 17 2426 4 Burhanpur 20 0 0 0 0 13 2007 16 2719 4 690 19 3220 5 Dindori 5 5 638 5 638 5 731 5 731 1 128 5 697 6 Jhabua 20 2 254 4 461 13 1662 18 2076 9 1162 16 1985 7 Khargone 20 5 665 8 1500 17 2587 18 2818 19 2793 20 2935 8Mandla 20 3 251 13 1015 10 931 14 1218 13 1069 18 1633 9 Narsinghpur 20 1 238 9 1499 18 2175 20 2382 17 2015 18 2056 10 Shahdol 32 28 2508 32 2815 28 2490 31 2735 2 142 24 2115 11 Shajapur 20 9 811 12 1106 13 1204 15 1414 19 1708 20 1858 12 Shivpuri 20 1 233 1 233 2 349 4 971 15 2689 15 2689
Total 237 58 6013 94 10050 138 16274 165 19520 136 16871 201 24778 Data source : Test checked schools.
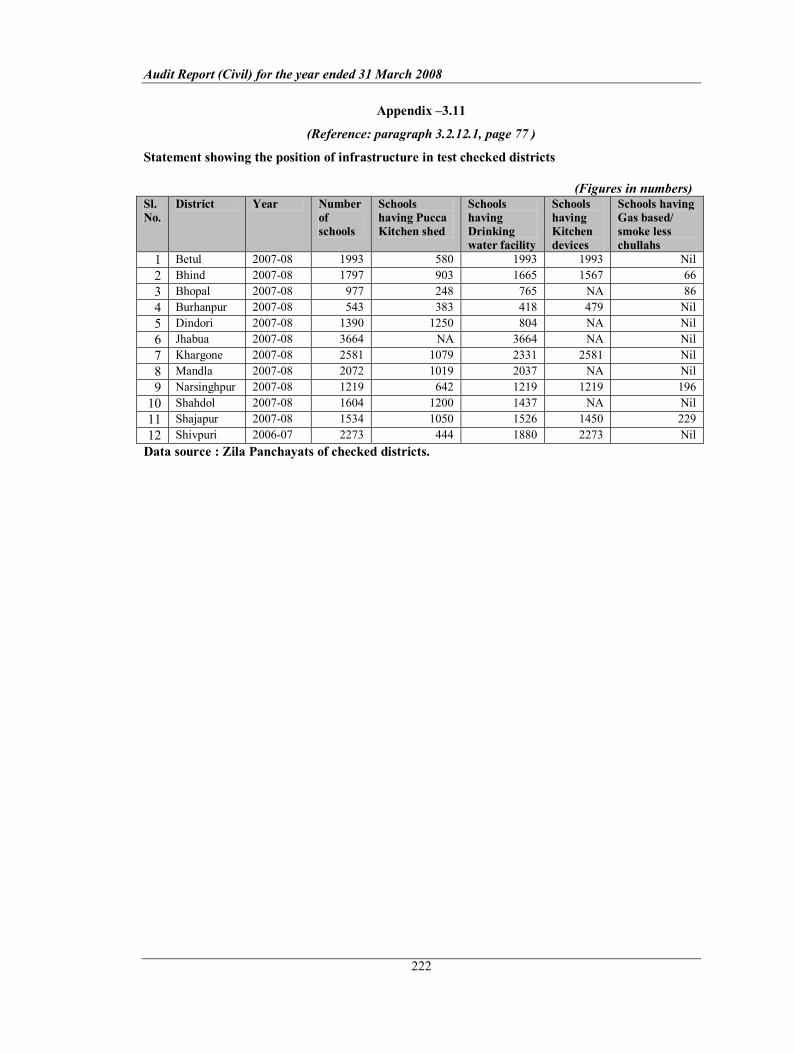
Audit Report (Civil) for the year ended 31 March 2008
222
Appendix –3.11
(Reference: paragraph 3.2.12.1, page 77 )
Statement showing the position of infrastructure in test checked districts
(Figures in numbers) Sl. No.
District Year Number of schools
Schools having Pucca Kitchen shed
Schools having Drinking water facility
Schools having Kitchen devices
Schools having Gas based/ smoke less chullahs
1 Betul 200708 1993 580 1993 1993 Nil 2 Bhind 200708 1797 903 1665 1567 66 3 Bhopal 200708 977 248 765 NA 86 4 Burhanpur 200708 543 383 418 479 Nil 5 Dindori 200708 1390 1250 804 NA Nil 6 Jhabua 200708 3664 NA 3664 NA Nil 7 Khargone 200708 2581 1079 2331 2581 Nil 8 Mandla 200708 2072 1019 2037 NA Nil 9 Narsinghpur 200708 1219 642 1219 1219 196 10 Shahdol 200708 1604 1200 1437 NA Nil 11 Shajapur 200708 1534 1050 1526 1450 229 12 Shivpuri 200607 2273 444 1880 2273 Nil Data source : Zila Panchayats of checked districts.

Appendices
223
Appendix 3.12
(Reference: paragraph 3.3.7.2, page 87 )
Statement showing incomplete schemes under Tribal Sub Plan (Rupees .in lakh)
Sl.No.
Name of District
Name of Schemes
Year of AA
Estima ted Cost
Designed Potential (Hectare)
Upto date Expendit ure
Reasons for delay
1 2 3 4 5 6 7 8 1 Badwani Ralawati Talab 2001 1385.36 1843 1723.89 Canal work is in
progress 2 Badwani Jhiri janni
Talab 2006 240.47 221 104.44 work is in progress
3 Badwani Pisnawal Talab 2006 239.52 240 . 233.49 work is in progress 4 Badwani Jaliyapaani
Talab 2001 449.20 635 584.07 Canal work is in
progress 5 Badwani Gaurikheda
Talab 2005 310.15 315 236.34 work is in progress
6 Badwani Deodhar Talab 2006 623.90 625 228.04 Work is to be started 7 Badwani Kaanpuri
Talab 2002 74.86 100 100.08 Canal work is in
progress 8 Badwani Karanpura
Talab 2005 82.25 85. 5.56 Work is to be started
9 Badwani Dharapani Talab
1998 61.25 125. 1.83 Tender work is in progress
10 Badwani Sawarda Talab 2001 84.43 112 Refusal by local villagers
11 Badwani Talawadi Talab 2003 69.40 82 Proposed for deletion 12 Badwani Juliya kundia
Talab 1982 45.29 270 49.18 Delay due to forest
clearance 13 Badwani Rajpura Talab 2002 60.00 80 Delay due to forest
clearance 14 Badwani Kekadia Talab 2001 65.02 86 62.34 Canal work is in
progress 15 Khargone Junapani tank 2002 216.84 259 280.67 Work is in progress 16 Khargone Bagri mata tank 2002 96.54 129 120.23 Work is in progress 17 Khargone Deori No. 2
tank 2002 598.70 850 644.35 Work is in progress
18 Khargone Chhoti oon tank 2003 100.88 135 137.30 Work is in progress 19 Dindori Bargi tank tank 1983 167.25 340 152.23 Inadequacy of funds 20 Dindori Ramnagar tank 1983 296.92 195 182.93 Inadequacy of funds 21 Dindori Kachhari tank 1991 260.50 269 228.49 Inadequacy of funds 22 Dindori Pakla tola tank 1991 94.50 52 74.35 Inadequacy of funds 23 Dindori Kharganna tank 2003 115.72 121 4.38 Inadequacy of funds
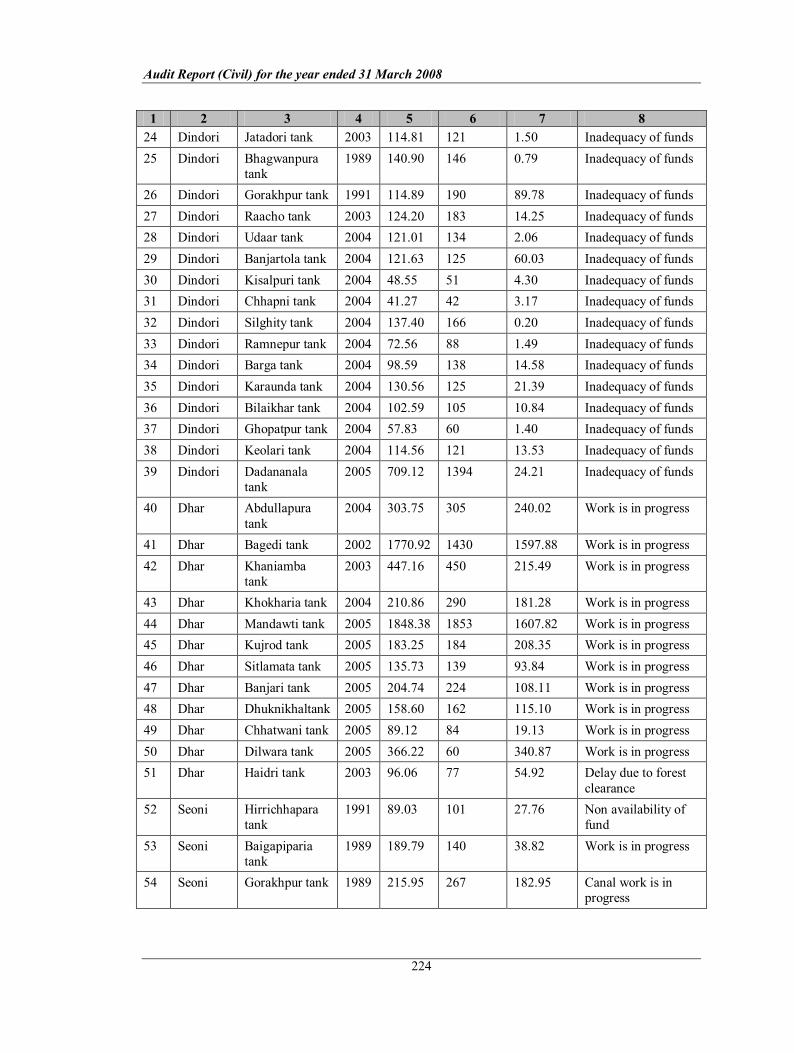
Audit Report (Civil) for the year ended 31 March 2008
224
1 2 3 4 5 6 7 8 24 Dindori Jatadori tank 2003 114.81 121 1.50 Inadequacy of funds 25 Dindori Bhagwanpura
tank 1989 140.90 146 0.79 Inadequacy of funds
26 Dindori Gorakhpur tank 1991 114.89 190 89.78 Inadequacy of funds 27 Dindori Raacho tank 2003 124.20 183 14.25 Inadequacy of funds 28 Dindori Udaar tank 2004 121.01 134 2.06 Inadequacy of funds 29 Dindori Banjartola tank 2004 121.63 125 60.03 Inadequacy of funds 30 Dindori Kisalpuri tank 2004 48.55 51 4.30 Inadequacy of funds 31 Dindori Chhapni tank 2004 41.27 42 3.17 Inadequacy of funds 32 Dindori Silghity tank 2004 137.40 166 0.20 Inadequacy of funds 33 Dindori Ramnepur tank 2004 72.56 88 1.49 Inadequacy of funds 34 Dindori Barga tank 2004 98.59 138 14.58 Inadequacy of funds 35 Dindori Karaunda tank 2004 130.56 125 21.39 Inadequacy of funds 36 Dindori Bilaikhar tank 2004 102.59 105 10.84 Inadequacy of funds 37 Dindori Ghopatpur tank 2004 57.83 60 1.40 Inadequacy of funds 38 Dindori Keolari tank 2004 114.56 121 13.53 Inadequacy of funds 39 Dindori Dadananala
tank 2005 709.12 1394 24.21 Inadequacy of funds
40 Dhar Abdullapura tank
2004 303.75 305 240.02 Work is in progress
41 Dhar Bagedi tank 2002 1770.92 1430 1597.88 Work is in progress 42 Dhar Khaniamba
tank 2003 447.16 450 215.49 Work is in progress
43 Dhar Khokharia tank 2004 210.86 290 181.28 Work is in progress 44 Dhar Mandawti tank 2005 1848.38 1853 1607.82 Work is in progress 45 Dhar Kujrod tank 2005 183.25 184 208.35 Work is in progress 46 Dhar Sitlamata tank 2005 135.73 139 93.84 Work is in progress 47 Dhar Banjari tank 2005 204.74 224 108.11 Work is in progress 48 Dhar Dhuknikhaltank 2005 158.60 162 115.10 Work is in progress 49 Dhar Chhatwani tank 2005 89.12 84 19.13 Work is in progress 50 Dhar Dilwara tank 2005 366.22 60 340.87 Work is in progress 51 Dhar Haidri tank 2003 96.06 77 54.92 Delay due to forest
clearance 52 Seoni Hirrichhapara
tank 1991 89.03 101 27.76 Non availability of
fund 53 Seoni Baigapiparia
tank 1989 189.79 140 38.82 Work is in progress
54 Seoni Gorakhpur tank 1989 215.95 267 182.95 Canal work is in progress

Appendices
225
55 Seoni Ghutna tank 1999 248.25 283 40.35 Agitation by cultivators
56 Seoni Kutmaili tank 1999 100.50 152 60.18 Delay from contractor’s side
57 Seoni Atariya tank 1999 202.05 273 166.71 Work is in progress Total 16832 Data source: Progress reports of W.R. Divisions

Audit Report (Civil) for the year ended 31 March 2008
226
Appendix 3.13
(Reference: paragraph 3.3.8.2, page 90 )
Statement showing loss of production of additional food grains due to underutilization of created
irrigation potential (considering 50 per cent utilization in moderate conditions)
• 50 per cent utilization on moderate considerations: 45,930 hectares (ha)
• Actual average utilization during plan period 24,518 ha
• Underutilization of created irrigation potential 21,412 ha
Predevelopment conditions Crop Area in ha Yield per ha
(Qtls) Total Production (Qtls)
Cost per Qtl (Rupees)
Total Cost
Soyabeen (40%) 8564.80 10 85,648.00 1500 12,84,72,000 Ground nut (8%) 1712.96 10 17,129.60 1200 2,05,55,520 Juwar (20%) 4282.40 06 25,694.40 600 1,54,16,640 Pulses (14%) 2997.68 08 23,981.44 1000 2,39,81,440 Cotton (18%) 3854.16 10 38,541.60 1800 6,93,74,880
Total 25,78,00,480 Postdevelopment conditions Cotton Imp (15%)
3211.80 25 80,295.00 2000 16,05,90,000
Soyabeen (15%) 3211.80 15 48,177.00 1500 7,22,65,500 Ground nut (10%)
2141.20 15 32,118.00 1200 3,85,41,600
Moong (12%) 2569.44 10 25,694.40 2458 6,31,56,538 Hy.Wheat (24%) 5138.88 20 1,02,777.60 1100 11,30,55,360 Gram (24%) 5138.88 08 41,111.04 1400 5,75,55,456
Total 50,51,64,751 Addition production of food grain valuing Rs.24,73,64,271 (Rs.505164751 Rs.257800480)
Data source: Detailed Project Report –Mandleshwar Dn
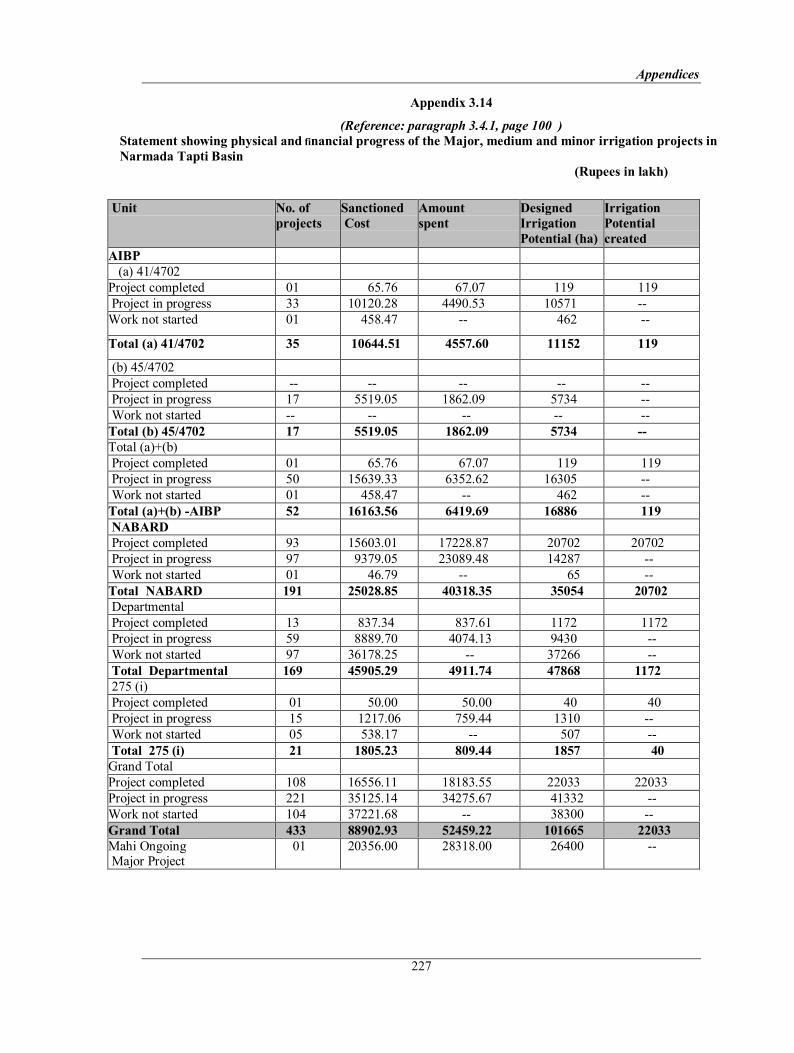
Appendices
227
Appendix 3.14
(Reference: paragraph 3.4.1, page 100 ) Statement showing physical and financial progress of the Major, medium and minor irrigation projects in Narmada Tapti Basin
(Rupees in lakh)
Unit No. of projects
Sanctioned Cost
Amount spent
Designed Irrigation Potential (ha)
Irrigation Potential created
AIBP (a) 41/4702
Project completed 01 65.76 67.07 119 119 Project in progress 33 10120.28 4490.53 10571 Work not started 01 458.47 462
Total (a) 41/4702 35 10644.51 4557.60 11152 119
(b) 45/4702 Project completed Project in progress 17 5519.05 1862.09 5734 Work not started Total (b) 45/4702 17 5519.05 1862.09 5734 Total (a)+(b) Project completed 01 65.76 67.07 119 119 Project in progress 50 15639.33 6352.62 16305 Work not started 01 458.47 462 Total (a)+(b) AIBP 52 16163.56 6419.69 16886 119 NABARD Project completed 93 15603.01 17228.87 20702 20702 Project in progress 97 9379.05 23089.48 14287 Work not started 01 46.79 65 Total NABARD 191 25028.85 40318.35 35054 20702 Departmental Project completed 13 837.34 837.61 1172 1172 Project in progress 59 8889.70 4074.13 9430 Work not started 97 36178.25 37266 Total Departmental 169 45905.29 4911.74 47868 1172 275 (i) Project completed 01 50.00 50.00 40 40 Project in progress 15 1217.06 759.44 1310 Work not started 05 538.17 507 Total 275 (i) 21 1805.23 809.44 1857 40 Grand Total Project completed 108 16556.11 18183.55 22033 22033 Project in progress 221 35125.14 34275.67 41332 Work not started 104 37221.68 38300 Grand Total 433 88902.93 52459.22 101665 22033 Mahi Ongoing Major Project
01 20356.00 28318.00 26400

Audit Report (Civil) for the year ended 31 March 2008
228
Appendix 3.15
(Reference: paragraph 3.4.2.3., page 102 )
Statement showing irregular utilisation of savings of AIBP Funds
(Rupees in lakh) S. No. Project Allotment Expenditure Savings Excess Grant No. 41/4702
1 Mandawati Tank 705.00 868.99 163.99 2 Nayakhokhariya Tank 90.00 98.79 8.79 3 Dhukankhal Tank 90.00 103.54 13.54 4 Jamunjhiri Tank 285.00 285.00 5 Kunjrod Tank 25.00 27.47 2.47 6 Banjari Tank 80.00 25.52 54.48 7 Sitalamata Tank 40.00 18.96 21.04 8 Chhagola Tank 15.00 23.99 8.99 9 Dharia Tank 30.00 31.20 1.20 10 Kadwal Tank 40.00 74.78 34.78 11 Dhanwa Tank 80.00 20.69 59.31 12 Deolia Tank 100.00 50.33 49.67 13 Momadiya Tank 80.00 106.64 26.64 14 Gorikheda Tank 120.00 99.96 20.04 15 Deodhar Tank 250.00 8.43 241.57 16 Kanpuri Tank 20.00 58.44 38.44 17 Thana Tank 660.00 76.67 583.43 18 Chhatwani Tank 30.00 14.06 15.94 19 Kisan Tank 95.00 170.36 75.36 20 Paniyadar Tank 15.00 12.43 2.57 21 Banhoor Tank 35.00 35.00 22 Jhirijamali Tank 70.00 53.37 16.63 23 Pisanwal Tank 80.00 145.83 65.83 24 Harshnagar Tank 70.00 61.42 8.58 25 Bargaon Tank 210.00 138.87 72.13 26 Kolpur Tank 60.00 42.73 17.27 27 Makanpur Tank 70.00 0.10 69.90 28 Boochandongari Tank 50.00 18.75 31.25 29 Samalyakund Tank 25.00 8.39 16.61 30 Palsyapani Tank 44.77 37.89 6.88 31 Semalkheda Tank 80.59 72.04 8.55 32 Bajrangsagar Tank 103.89 27.90 75.99 33 Tambolia tAnk 94.10 75.17 18.93 34 Kalsadia Tank 26.42 25.39 1.03 35 Ratnali Tank 34.31 21.65 12.66
Total 3904.08 2619.75 1724.46 440.03

Appendices
229
Appendix 4.1 (Reference: paragraph 4.2.1 (A), page 114 )
Statement showing the up to date position of excess payment of family pension as on March 2008
Sl.No. Name of Treasuries
Period of inspection
No. of Pensioners
Period of Excess payment
Amount Recovery Balance Net Excess payment
1 Damoh 9/03 to 3/05 9 8/03 to 3/05 79981 79981 Damoh 4/05 to 3/07 4 3/06 to 3/07 54298 54298
2 Sehore 12/02 to 2/05 5 3/05 to 2/05 75492 75492 3 Raisen 9/02 to 3/05 10 7/02 to 2/05 75515 75515 4 Jabalpur 5/03 to 3/05 3 1/03 to 4/05 44772 44772
Jabalpur 4/05 to 3/06 2 11/05 to 3/06 13749 13749 Jabalpur 4/06 to 6/07 5 4/06 to 5/07 60196 60196
118717
5 Balaghat 12/03 to 4/05 71 2/02 to 4/05 1573120 778130 794990 Balaghat 5/06 to11/07 10 5/02 to 11/07 482275 482275
1277265
6 Hoshangabad 12/03 to 4/05 38 7/02 to 4/05 827656 827656 Hoshangabad 6/06 to 2/08 4 7/07 to 1/08 24207 24207
851863
7 Vidisha 9/02 to 4/05 19 4/02 to 4/05 507373 336600 170773 Vidisha 5/05 to 8/06 11 4/05 to 8/06 185163 185163 Vidisha 9/06 to 8/07 1 2/07 to 8/07 3606 3606
359542
8 Narsinghpur 12/04 to 10/05 31 7/02 to 10/05 704898 704898 Narsinghpur 11/05 to 4/07 2 12/06 to 4/07 15521 15521 720419
9 Sagar 11/04 to 10/05 4 5/03 to 9/05 57968 57968 Sagar 11/05 to 10/06 4 2/06 to 10/06 26782 26782 Sagar 11/06 to 11/07 1 8/07 to 9/07 3483 3483 3483
10 Seoni 12/04 to 9/05 2 5/05 to 9/05 17393 17393 Seoni 10/05 to 9/06 7 5/05 to 9/06 159671 159671 Seoni 10/06 to 9/07 4 12/05 to 9/07 130845 130845
307909
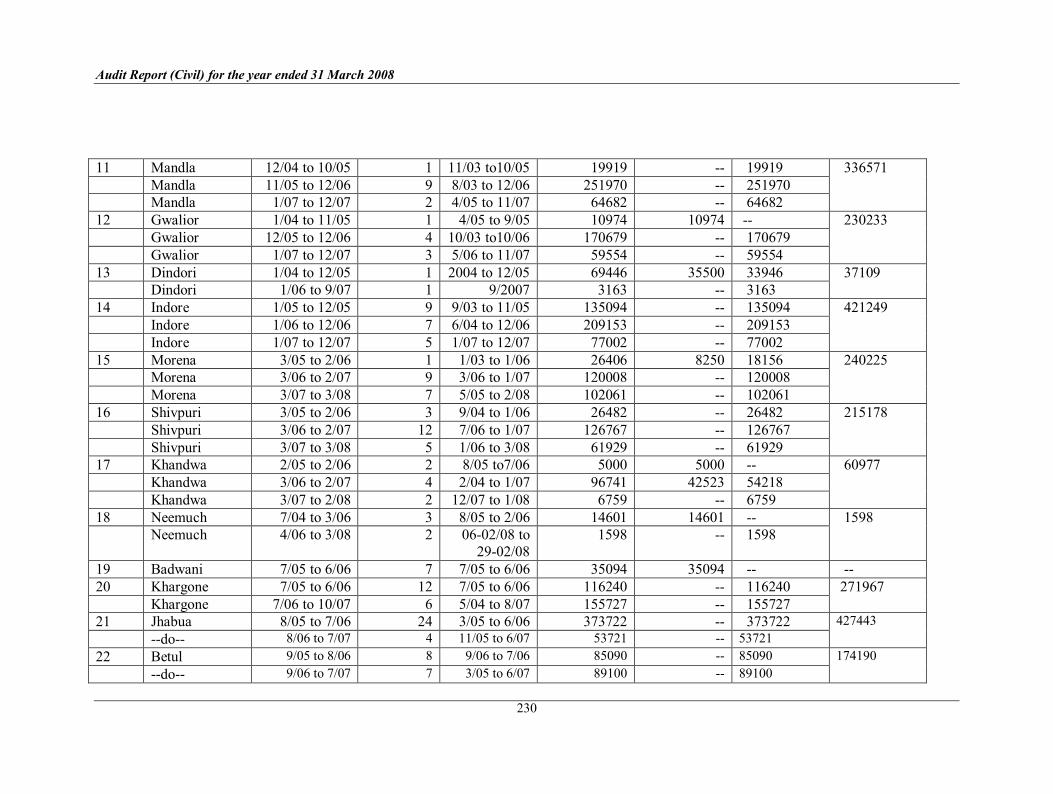
Audit Report (Civil) for the year ended 31 March 2008
230
11 Mandla 12/04 to 10/05 1 11/03 to10/05 19919 19919 Mandla 11/05 to 12/06 9 8/03 to 12/06 251970 251970 Mandla 1/07 to 12/07 2 4/05 to 11/07 64682 64682
336571
12 Gwalior 1/04 to 11/05 1 4/05 to 9/05 10974 10974 Gwalior 12/05 to 12/06 4 10/03 to10/06 170679 170679 Gwalior 1/07 to 12/07 3 5/06 to 11/07 59554 59554
230233
13 Dindori 1/04 to 12/05 1 2004 to 12/05 69446 35500 33946 Dindori 1/06 to 9/07 1 9/2007 3163 3163
37109
14 Indore 1/05 to 12/05 9 9/03 to 11/05 135094 135094 Indore 1/06 to 12/06 7 6/04 to 12/06 209153 209153 Indore 1/07 to 12/07 5 1/07 to 12/07 77002 77002
421249
15 Morena 3/05 to 2/06 1 1/03 to 1/06 26406 8250 18156 Morena 3/06 to 2/07 9 3/06 to 1/07 120008 120008 Morena 3/07 to 3/08 7 5/05 to 2/08 102061 102061
240225
16 Shivpuri 3/05 to 2/06 3 9/04 to 1/06 26482 26482 Shivpuri 3/06 to 2/07 12 7/06 to 1/07 126767 126767 Shivpuri 3/07 to 3/08 5 1/06 to 3/08 61929 61929
215178
17 Khandwa 2/05 to 2/06 2 8/05 to7/06 5000 5000 Khandwa 3/06 to 2/07 4 2/04 to 1/07 96741 42523 54218 Khandwa 3/07 to 2/08 2 12/07 to 1/08 6759 6759
60977
18 Neemuch 7/04 to 3/06 3 8/05 to 2/06 14601 14601 Neemuch 4/06 to 3/08 2 0602/08 to
2902/08 1598 1598
1598
19 Badwani 7/05 to 6/06 7 7/05 to 6/06 35094 35094 20 Khargone 7/05 to 6/06 12 7/05 to 6/06 116240 116240
Khargone 7/06 to 10/07 6 5/04 to 8/07 155727 155727 271967
21 Jhabua 8/05 to 7/06 24 3/05 to 6/06 373722 373722 do 8/06 to 7/07 4 11/05 to 6/07 53721 53721
427443
22 Betul 9/05 to 8/06 8 9/06 to 7/06 85090 85090 do 9/06 to 7/07 7 3/05 to 6/07 89100 89100
174190

Appendices
231
23 Bhopal 9/05 to 8/06 4 9/05 to 6/06 20066 20066 20066 24 Harda 2/05 to 8/06 6 12/02 to 8/06 165055 165055 165055 25 Anuppur 12/04 to 11/06 11 7/98 to 11/06 235607 235607 235607 26 Shahdol 12/05 to 11/06 3 8/04 to 11/06 86777 86777 27 Ujjain 2/06 to 1/07 3 9/03 to 11/06 21832 21832
do 2/07 to 2/08 2 5/07 to 1/08 68849 68849 90681
28 Bhind 3/06 to 2/07 2 6/02 to 1/07 95117 95117 95117 29 Dhar 2/06 to 1/07 7 1/06 to 12/06 36189 36189
do 2/07 to 1/08 8 3/03 to 12/07 473192 473192 509381
30 Shajapur 6/05 to 3/07 4 4/05 to 2/07 89936 89936 do 4/07 to 3/08 4 10/06 to 3/08 66143 66143
156079
31 Mandsour 6/05 to 5/07 7 1/03 to 4/07 248589 248589 248589 32 Ratlam 9/06 to 8/07 3 10/06 to 7/07 39987 39987 39987 33 Umaria 5/05 to 10/07 1 8/07 to 10/07 3399 3399 3399 34 Rewa 9/06 to 9/07 4 7/05 to 8/07 70688 70688 70688
Total 477 9414072 1723485 7690587 7690587

Audit Report (Civil) for the year ended 31 March 2008
232
Appendix 4.2
(Reference: paragraph4.2.1 (B), page 114 )
Statement showing details of over/ excess payment of Commutation of pension to pensioners on account of revision of pension in terms of Government of Madhya Pradesh Finance department letter dated 25 October 2002
S. No. Name of Treasury
Period of Inspection
No. of Pension Cases
Amount Total
1. Balaghat 5/06 to 11/07 10 123998 123998 2. Bhopal 9/05 to 8/06
9/06 to 11/07 299
248104 90737 33841
3. Chhatarpur 6/05 to 5/06 6/06 to 6/07
2810
225410 80586 305996
4. Dindori 1/06 to 9/07 6 28517 28517 5. Damoh 5/07 to 5/08 10 134201 134201 6. Dhar 2/07 to 1/08 7 42276 42276 7. Dewas 3/06 to 3/07
4/07 to 5/08 199
144233 59727 203960
8. Indore 1/06 to 12/06 1/07 to 12/07
1613
255322 155227 410549
9. Shivpuri 3/05 to 2/06 3/06 to 2/07
3521
214290 121032 335322
10. Shajapur 6/05 to 3/07 2 11061 11061 11. Ujjain 2/05 to 1/06
2/06 to 1/07 2/07 to 2/08
142012
111888 306837 120938 539663
12. Hoshangabad 12/02 to 4/05 6/06 to 2/08
8 7
169812 52834 222646
13. Gwalior 1/04 to 11/05 12/05 to 12/06 1/07 to 12/07
7 2018
27842 130552 141347 299741
14. Morena 3/07 to 3/08 15 155546 155546 15. Mandla 12/04 to 10/05
11/05 to 12/06 1/07 to 12/07
21213
146444 206012 24135 376591
16. Neemuch 7/04 to 3/06 4/06 to 3/08
252
227764 7659 235423
17. Khandwa 2/05 to 2/06 3/06 to 2/07 3/07 to 2/08
291410
120381 208376 72371 401128
18. Khargone 7/05 to 6/06 7/06 to 10/07
2511
256760 76475 333235
19. Mandsaur 6/05 to 5/07 6/07 to 6/08
8 25
106529 301747 408276
20. Ratlam 8/05 to 8/06 9/06 to 8/07
1719
228785 109177 337962

Appendices
233
21. Rewa 9/05 to 8/06 9/06 to 9/07
3 11
8062 112330 120392
22. Sagar 9/05 to 8/06 9/06 to 9/07
5 3
37134 53150 90284
23. Satna 1/07 to 1/08 16 132943 132943 24 Sidhi 12/06 to 10/07 9 60739 60739 25. Umariya 5/05 to 10/07 5 35014 35014 26. Panna 10/04 to 3/06
4/06 to 5/08 2 19
14537 147391 161928
27. Anuppur 12/04 to 11/06 12 77864 77864 28. Shahdol 12/05 to 11/06
12/06 to 4/08 8311
633153 84271 717424
29. Seoni 10/05 to 9/06 10/06 to 9/07
139
54571 113550 168121
30. Bhind 3/07 to 3/08 6 62725 62725 31. Vidisha 5/05 to 8/06 13 109149 109149 32. Harda 2/05 to 8/06
9/06 to 5/08 165
116712 25203 141915
33. Datiya 11/06 to 6/08 36 256255 256255 34. Betul 9/05 to 8/06
9/06 to 7/07 8 15
38175 91613 129788
35. Burhanpur 1/05 to 6/06 7/06 to 4/08
7 4
63173 18192 81365
36. Jhabua 8/05 to 7/06 26 223206 223206 Total 912 7814044 7814044
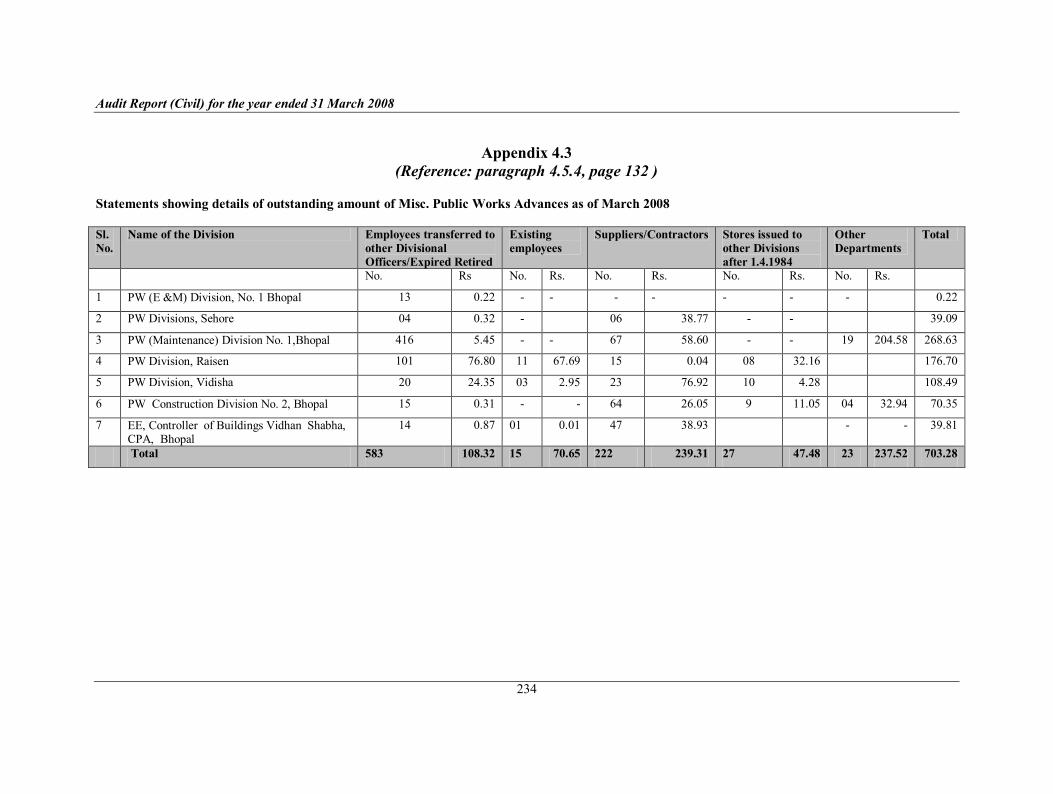
Audit Report (Civil) for the year ended 31 March 2008
234
Appendix 4.3 (Reference: paragraph 4.5.4, page 132 )
Statements showing details of outstanding amount of Misc. Public Works Advances as of March 2008
Sl. No.
Name of the Division Employees transferred to other Divisional Officers/Expired Retired
Existing employees
Suppliers/Contractors Stores issued to other Divisions after 1.4.1984
Other Departments
Total
No. Rs No. Rs. No. Rs. No. Rs. No. Rs.
1 PW (E &M) Division, No. 1 Bhopal 13 0.22 0.22
2 PW Divisions, Sehore 04 0.32 06 38.77 39.09
3 PW (Maintenance) Division No. 1,Bhopal 416 5.45 67 58.60 19 204.58 268.63
4 PW Division, Raisen 101 76.80 11 67.69 15 0.04 08 32.16 176.70
5 PW Division, Vidisha 20 24.35 03 2.95 23 76.92 10 4.28 108.49
6 PW Construction Division No. 2, Bhopal 15 0.31 64 26.05 9 11.05 04 32.94 70.35
7 EE, Controller of Buildings Vidhan Shabha, CPA, Bhopal
14 0.87 01 0.01 47 38.93 39.81
Total 583 108.32 15 70.65 222 239.31 27 47.48 23 237.52 703.28

Appendices
235
Appendix 4.4
(Reference: paragraph 4.5.5, page134 )
Statement showing outstanding Inspection Reports and Paragraphs in respect of departments as an on 30 June 2008.
Sl. No. Name of Department No. of Inspection Reports
No. of Paragraphs
1 Panchayat & Rural Development 87 324 2 Public Health & Family Welfare 426 1113 3 Revenue 628 1464 4 Medical Education 36 123 5 Finance 520 965 6 Cooperation 295 1046 7 Education 1643 4120 8 Agriculture 671 1777 9 Housing & Environment 157 656 10 Registration & Stamps 55 121 11 Public Relation 57 135 12 Panchayat & Social Welfare 460 926 13 Women & Child Development 389 1169 14 Animal husbandry 220 644 15 Police 241 514 16 Law & Legislative affairs 206 322 17 Horticulture 203 320 18 Labour & Employment 230 354 19 Jail 109 267 20 Technical Education 120 337 21 Handloom 61 146 22 Home Guard & Civil Security 59 95 23 Planning Economics & Statistics 103 280 24 Sericulture 52 131 25 Fisheries 45 118 26 Scheduled Tribes & Scheduled Castes Welfare 439 1006 27 Industries 147 453 28 General Administration 146 369 29 Transport 4 07 30 Energy Department 11 14 31 State Excise 49 66 32 Commercial Tax 48 85 33 Archaeological & Museum. 39 76 34 Rehabilitation 29 80 35 Printing & Stationery 24 94 36 Ayacut 23 46 37 Urban Administration 491 1498 38 Mining 14 31 39 Weights & Measurement 13 26 40 Civil Aviation 9 39 41 Tourism 5 22 42 Misc. Deptt.
(PSC, Ad. Academy, State Garage enquiry Commission. NCC etc.)
129 283
Total 8693 21662

Audit Report (Civil) for the year ended 31 March 2008
236
Appendix 4.5
(Reference: paragraph 4.5.5, page134 )
Statement showing year wise position of outstanding IRs and Paragraphs in respect of departments at Sl. No. 1 to 42 of Appendix 4.4 as on 30 June 2008.
Year No. of Inspection Reports No. of Paragraphs Up to 200001 3414 6663 200102 848 1758 200203 682 1582 200304 426 934 200405 727 1609 200506 965 2943 200607 822 2517 200708 (up to December 2007)
809 3656
Total 8693 21662
Appendix 4.6
(Reference: paragraph 4.5.5, page 134 )
Statement showing position of outstanding IRs and Paragraphs of Works Department.
Sl.No.
Department Number of Auditee Units
Number of Inspection Reports
Number of Paragraphs
1. Forest 158 783 2311
2. Water Resources 175 1031 5075
3. Public Works 113 802 5426
4. Public Health Engineering 85 478 2257
5. Narmada Valley Development Agency (i) Irrigation (ii) Buildings/roads (iii) PHE (iv) Forest
72110111
347 460326
923 9609 102
6. Housing and Environment (Capital Project Construction units)
05 46 277
7. Bhopal Gas Rahat (Works unit) 01 09 30
8. Panchayat and Rural Department (MPRRDA)
55 158 822
Total 687 3729 17328

Appendices
237
Appendix 5.1
(Reference: paragraph 5.1.5.2, page 138)
Statement showing budget provision & expenditure under Grant No. 15,41,52,55,64,80 and 82
(Rupees in crore) Year Budget provision Expenditure Savings Percentage of savings 200304 385.90 275,86 110.04 29 200405 408.86 283.50 125.36 31 200506 481.73 269.91 211.82 44 200607 595.51 370.27 225.24 38 200708 691.88 587.21 104.67 15
Appendix5.2
(Reference: paragraph 5.1.5.4, page139)
Statement showing the position of supplementary provisions which were not used
(Rupees in crore) Year Original grant Supplementary grant Actual expenditure
200304 295.57 25.69 231.52
200405 320.93 12.35 228.77
200506 367.69 2.83 230.02
200607 481.30 0.20 299.62
200708 495.49 43.88 457.22
Total 1960.98 84.95 1447.15
Appendix5.3
(Reference: paragraph 5.1.5.6, page 139)
Statement showing position of expenditure in last month of the year (Rupees in crore)
Year Total Expenditure
Expenditure up to February
Expenditure in March
Percentage
200304 275.82 200.14 75.68 27.44 200405 283.50 209.45 74.05 26.12 200506 269.90 203.65 66.25 24.55 200607 370.27 266.26 104.01 28.09 200708 587.21 433.86 153.35 26.11 Grand Total 1786.70 1313.36 473.34 26.49

Audit Report (Civil) for the year ended 31 March 2008
238
Appendix5.4
(Reference: paragraph 5.1.5.7,page140 )
Statement showing reconciliation of expenditure figures
(Rupees in crore) Expenditure Figures Years
As shown by AG As shown by the department Difference
200304 275.86 257.60 18.26 200405 283.50 269.34 14.16 200506 269.91 266.76 3.15 200607 370.27 405.17 34.9 200708 587.21 629.71 42.50
Appendix 5.5 (Reference: paragraph 5.1.7.2, page 145)
Statement Showing procurement of Dalia at higher rate
Year Name of the D.P.O.
Quantity of Dalia Purchased (in Quintal)
Rate fixed by Directorate (per Quintal)
Rate of Purchase (per Quintal)
Excess Rate
Amount of Excess Expenditure (Rs.in lakh)
1. 2. 3. 4. 5. 6. 7. Dhar 9231.25
12620.95
1050
1050
1162
1125
112
75
10.34
9.47
Bhopal 9992.00 1050 1250 200 19.98
Khargone 8275.50 1050 1161.56 111.56 9.23
200304
Chindwara 13698.25 1050 1161.56 111.56 15.28
Total 53817.95 64.3
200506 Bhopal 1617.66 1375 1630 255 4.12
Total 1617.66 4.12
Dhar 18453.00 1375 1550 175 32.29
Bhopal 11182.83 1375 1630 255 28.52
Khargone 7766.25 1375 1525 150 11.65
200607
Chindwara 32747.71 1375 1561 186 60.91
Total 70149.79 133.37
Grant Total 125585.4 201.79