Embed Size (px)
Citation preview

Preface: The Addendum to RS29T is not a new draft of the report. The format used to prepare the Addendum to RS29T is similar to the one used for the Supplemental DPD. For brevity, Sections of the original report that did not change and were not addressed in any comments are not reproduced. Sections where additional information was requested are reproduced (in black) along with the additional text in blue. This format allows the additions to be placed in the proper context while still allowing he reader to easily identify the new material.

RS29T i
RS29T Draft-02
March 30, 2007
Addendum Technical Design Evaluation Report
RS29T – Wastewater Treatment Technology NorthMet Project
October 2007
Table of Contents
Executive Summary .....................................................................................................................................vi Water Management Strategy................................................................................................................vi Process Water Quality Objectives.......................................................................................................vii Treatment Technology Evaluation .....................................................................................................viii Treatment Technology Recommendation ............................................................................................ ix
1.0 Introduction........................................................................................................................................1-1 1.1 Project Overview .....................................................................................................................1-1 1.2 Report Objective and Water Management Overview ..............................................................1-1 1.3 Report Organization.................................................................................................................1-2
2.0 Reuse/Recycle Water Management Plan ...........................................................................................2-1 2.1 Mine Site Process Water ..........................................................................................................2-2
2.1.1 Mine Site Process Water Quantity ..............................................................................2-2 2.1.2 Mine Site Process Water Quality ................................................................................2-4
2.2 Plant Site Process Water ..........................................................................................................2-9 2.2.1 Plant Site Process Water Quantity ..............................................................................2-9 2.2.2 Plant Site Process Water Quality ................................................................................2-9
3.0 Process Water Quality Targets...........................................................................................................3-1 3.1 Potential Surface Water Quality Standards..............................................................................3-1 3.2 Potential Groundwater Quality Standards................................................................................3-4 3.3 Anticipated Process Water Quality Targets .............................................................................3-4
4.0 Summary of Potential Wastewater Treatment Technologies .............................................................4-1 4.1 Chemical Precipitation.............................................................................................................4-2
4.1.1 Technology Description..............................................................................................4-2 4.1.2 Metal Precipitation Technologies ...............................................................................4-3 4.1.3 Chemical Precipitation Technologies for Sulfate and other Salts...............................4-8
4.2 Reverse Osmosis and other Membrane Technologies .............................................................4-9 4.2.1 Technology Description..............................................................................................4-9 4.2.2 Membrane Types ........................................................................................................4-9 4.2.3 Membrane Configurations ........................................................................................4-11 4.2.4 Operation and Maintenance ......................................................................................4-11 4.2.5 Treatment of Acid Mine Drainage Using Reverse Osmosis .....................................4-11

Table of Contents (continued)
RS29T ii
4.2.6 Treatment of Mine Process Water using Nanofiltration ...........................................4-13 4.3 Ion Exchange .........................................................................................................................4-14
4.3.1 Technology Description............................................................................................4-14 4.3.2 Types of Ion Exchange Resins..................................................................................4-15 4.3.3 Ion Exchange for Acid Mine Drainage Treatment....................................................4-15
4.4 Constructed Wetland..............................................................................................................4-16 4.4.1 Technology Description............................................................................................4-16 4.4.2 Wetland Removal Mechanisms ................................................................................4-17 4.4.3 Wetland Treatment of Mine Drainage-Case Studies ................................................4-17
5.0 Evaluation of Treatment Options for Mine Site Wastewaters ..........................................................5-1 5.1 Effectiveness ............................................................................................................................5-8 5.2 Implementability ......................................................................................................................5-8
5.2.1 Chemical Precipitation................................................................................................5-8 5.2.2 Membrane Treatment..................................................................................................5-9 5.2.3 Ion Exchange ..............................................................................................................5-9 5.2.4 Constructed Wetland...................................................................................................5-9
5.3 Cost ........................................................................................................................................5-10 5.3.1 Chemical Precipitation..............................................................................................5-10 5.3.2 Membrane Treatment................................................................................................5-11 5.3.3 Ion Exchange ............................................................................................................5-11 5.3.4 Constructed Wetland.................................................................................................5-11
5.4 Recommended Alternative.....................................................................................................5-11 5.4.1 Flow Equalization .....................................................................................................5-13 5.4.2 Nanofiltration Pre-Treatment....................................................................................5-13 5.4.3 Nanofiltration Membrane Unit..................................................................................5-13 5.4.4 Chemical Addition and Rapid Mixing ......................................................................5-13 5.4.5 Coagulation and Flocculation ...................................................................................5-13 5.4.6 Clarification (Settling) ..............................................................................................5-13 5.4.7 Recarbonation ...........................................................................................................5-13 5.4.8 Process Monitoring and Control ...............................................................................5-13
5.5 Potential Treatment System Performance..............................................................................5-13 5.6 Solid Waste Management Plan ..............................................................................................5-18
6.0 Evaluation of Treatment Options for Tailings Basins Water ............................................................6-1
7.0 Summary ............................................................................................................................................7-1
8.0 References ..........................................................................................................................................8-1 8.1 Printed Materials ......................................................................................................................8-1 8.2 Electronic Materials .................................................................................................................8-3
Table of Contents (continued)
RS29T iii
List of Tables
Table 1 Mine Site Process Water Flows to the WWTF
Table 2 Mine Site Process Water Quality
Table 3 Potential Water Quality Standards
Table 4 Water Quality Process Standards
Table 5 Solubility Products for Various Metal Hydroxides, Carbonates, and Sulfides
Table 6 Comparison of Sulfide Precipitation Technologies
Table 7 Comparison of Membrane Types
Table 8 Summary of Reverse Osmosis Treatment of Mine Wastewater
Table 9 Chelating Cation Resin Selectivity Coefficients (KM) for Metal Ions
Table 10 Stability Series for Metal-organic Interactions in Various Substrates
Table 11 Langmuir Parameters for Metal-organic Interactions in Peat and Sawdust
Table 12 Summary of Screening Evaluation of Treatment Technologies for Mine Site Wastewater
Table 13 Stage 1 and Stage 2 Equalization Pond Inflow Predicted Water Quality
Table 14 Stage 1 and Stage 2 Treatment System Effluent and CPS Pond Predicted Water Quality
List of Figures
Figure 1 Project Location Map
Figure 2 Tailings Basins Area Map
Figure 3 Tailings Basin Process Water Flow Diagram
Figure 4 Preliminary Layout of WWTF and CPS Site
Figure 5 Conceptual WWTF Process Flow Diagram

Table of Contents (continued)
RS29T iv
List of Appendices
Appendix A Technical Design Evaluation Report – Scope of Work
Appendix B Laboratory Study of Mercury Adsorption to LTV Taconite and NorthMet Tailings
Appendix C RS45 – Water Treatment Studies – Waste Rock and Lean Ore
Appendix D Review of Dunka Wetlands Treatment Performance
Appendix E Decision Tree for Treatment Wetlands
Appendix F Detailed Cost Estimates for Mine Site Wastewater Treatment Alternatives
Appendix G WWTF Treatment Estimates
Appendix H Chemical Balance: Pilot Plant Flotation Process
Appendix I Responses to DNR Comments
Appendix J Process Water Flow Schematic Drawings
Appendix K Treatment Technology Reference Summary
List of Supporting RS Documents
RS13 Process Design – Tailings Basin Water Balance
RS21 Hydrology – Mine Water Model and Balance
RS22 Mine Waste Water Management Systems
RS23T Reactive Waste Segregation
RS30 Reactive Waste Stockpile Chemical Modification
RS31 Mine Pit Water Quality Model
RS45 Water Treatment Studies – Waste Rock and Lean Ore
RS49 Stockpile Design
RS52 Closure Plan
RS53/42 Wastewater Modeling – Waste Rock and Lean Ore
RS54/46 Wastewater Modeling – Tailing Basin
RS66 Mercury Balance – Water
RS74 Water Quality Changes – Cumulative Impacts Report
Table of Contents (continued)
RS29T v
List of Acronyms
ARD Acid Rock Drainage
CFR Code of Federal Regulations
CPS Central Pumping Station
DRO Diesel Range Organics
EDTA Ethylene-diamine-tetra-acetic acid
EPA Environmental Protection Agency
EIS Environmental Impact Statement
EQ Equalization
gpm Gallons per minute
GRO Gasoline Range Organics
HDS High Density Sludge
ITRC Interstate Technology and Regulatory Council
MDNR Minnesota Department of Natural Resources
MPCA Minnesota Pollution Control Agency
NPV Net Present Value
O&M Operation and Maintenance
psi pounds per square inch
RO Reverse Osmosis
SOW Scope of Work (Appendix A)
SPCC Spill Prevention Control and Countermeasures (Plan)
SSF Sub-Surface Flow (wetland)
TDS Total Dissolved Solids
WWTF Waste Water Treatment Facility

RS29T vi
Executive Summary
This Technical Design Evaluation Report – RS29T Wastewater Treatment Technology – has been
prepared to summarize the treatment component of the overall water management strategy that will
be employed for the NorthMet Project. Process water generated at the Mine Site will contain
dissolved chemicals due to oxidation of waste rock and the pit walls. Mine Site process water will be
treated and then recycled to the Plant Site, thereby lowering the overall water consumption of the
NorthMet operation and eliminating the need for a direct discharge of Mine Site process water to
surface water. Thus, the purpose of water treatment within the NorthMet operations is to remove
chemicals from the water to maintain the overall quality of the water in the tailings basin at or below
process water quality targets.
Water Management Strategy The water management strategy used at NorthMet will be to recycle and reuse Mine Site process
water as the primary source of make-up water for the Plant Site. Because of the mine scheduling and
water management strategies used at the Mine Site, the water volume requirements at the Plant Site
will exceed the volume of process water generated at the Mine Site. Thus, Mine Site process water
will be treated and recycled. Colby Lake water will be used to supplement the water make-up
requirements for the Plant Site, after the Mine Site process water has been recycled.
Development of the overall water management strategy for the NorthMet operation incorporated
many mitigation efforts as well as extensive hydrologic, hydrogeologic, and geochemical modeling
of water quantity and quality. This work was completed in an iterative process, with information
from various models linked to provide a comprehensive solution that includes treatment and reuse of
the Mine Site process water in the overall water management strategy. All of this information is
presented in a sequence of RS documents. The results and conclusions from work presented in
several RS documents provide the input data concerning Mine Site process water quantity and quality
that will need to be treated, including:
• RS21 – Hydrology – Mine Water Model and Balance,
• RS22 – Mine Waste Water Management Systems,
• RS30 – Reactive Waste Rock Stockpile Chemical Modifications,

RS29T vii
• RS31 – Mine Pit Water Quality Model, and
• RS53/RS42 – Waste Rock Characteristics/Waste Water Modeling - Waste Rock and Lean
Ore.
The results from these and other RS documents were used to evaluate the need for water treatment at
the Mine Site for water sent to the tailings basin for use in the processing the ore. In turn, the
predicted results for waste water treatment of the Mine Site process water included in this report have
been subsequently used to complete the modeling of the tailings basin water quality and develop
water quality predictions for the water that will be contained in the tailings basin during operation.
The results of the work completed and presented in RS documents subsequent to the development of
these waste water treatment predictions include:
• RS13 – Process Design - Tailings Basin Water Balance, and
• RS54A/RS46 – Flotation Tailings Characteristics/Waste Water Modeling – Tailings.
A similar process was also used to evaluate the need for waste water treatment after closure. Much
of the information presented in the previously listed RS reports also applies to closure. However,
changes to the overall water management strategy and waste water treatment, as well as potential
long term interaction of the Mine Site with groundwater and surface water quality are included in:
• RS52 – Mine Closure Plan, and
• RS74 – Water Quality Changes – Cumulative Impact Report.
Process Water Quality Objectives The technology required for treatment of Mine Site process waters is dependent upon three factors:
• The quantity and quality of the untreated Mine Site process water,
• The water quality needs of the processing operation, and
• Long term pit water quality and the mine closure plan.
These two factors are both described in this report. Water treatment requirements to maintain the
long term pit water quality after mine closure are addressed in the Closure Plan (RS52). As noted

RS29T viii
previously, the quality and quantity of Mine Site process water is a technical matter that has been
addressed through rigorous hydrological and chemical leaching studies to provide the input necessary
to evaluate potential water treatment options. The water quality needs of the Beneficiation Plant are
generally low, because the primary function of the water is to transport a relatively high
concentration of suspended solids through the process and then deliver the tailings to the tailings
basin. The water quality and quantity needs of the Hydrometallurgical Plant are independent of the
Beneficiation Plant. The Hydrometallurgical Plant is a net consumer of water and will have
independent controls to monitor and adjust the quality of processes within the operation.
The minimum water quality requirements of the Beneficiation Plant are similar to those established
by the State of Minnesota for surface waters that would be suitable for industrial consumption, or
Class 3 waters. Because water will need to be moved between the Mine Site and the tailings basin,
and because some of the water that will be stored in the tailings basin may eventually be returned to
the West Pit or flow from the tailings basin to the natural groundwater, the process water quality
targets established for treatment of the Mine Site process waters also considered the State of
Minnesota surface water quality standards for Class 2 waters and the groundwater protection
standards. These values establish more conservative water quality standards than those required in
the Beneficiation Plant, but maintaining these concentrations throughout the operation significantly
reduces the long term impact of the mining and processing operations on water quality after closure.
Comparing the predicted water quality for Mine Site process water with the process water quality
targets, establishes the treatment objectives for the wastewater treatment facility at the Mine Site.
These objectives include:
• Removing metals and inorganics, including aluminum, antimony, arsenic, cobalt, copper,
iron, manganese, mercury, nickel, selenium, thallium, and zinc.
• Reducing the concentration of sulfate and hardness, along with the related parameters of
TDS and conductivity to reduce long-term build-up of these parameters in the tailings basin.
Treatment Technology Evaluation Four technologies were evaluated to meet these objectives – chemical precipitation, membrane
separation, ion exchange, and biological transformation. Within each of these categories, multiple
process operations were considered using published literature. Numerous references to application of
these technologies at a variety of locations, including mining operations are included in the report.

RS29T ix
In addition, bench-scale testing of chemical precipitation using water from a stockpile of Duluth
Complex rock was conducted to provide a site-specific assessment of the capability of this process to
remove metals and inorganics. The results from the bench-scale simulation of a high density sludge
treatment process – which uses oxidation and pH adjustment to precipitate and/or co-precipitate iron
and heavy metals, such as copper, nickel, and cobalt – showed that, with the exception of mercury,
all the metals of concern at the NorthMet operation could be reduced to below the process water
quality targets. Sulfate can also be removed by chemical precipitation of gypsum. This process is
well documented in the literature and was not evaluated using site-specific testing.
Within all of the four treatment categories evaluated, one or more specific processes were considered
technically capable of achieving the treatment objectives. Among those processes that were
considered effective, the evaluation further segregated potential treatment techniques based on their
implementability and cost. Given the variable nature of the Mine Site process water, and the need to
achieve multiple objectives (metals removal and TDS/sulfate reduction) combinations of these
technologies were also evaluated based upon their potential implementability and cost.
Treatment Technology Recommendation A combination of chemical precipitation and nanofiltration is recommended to treat the NorthMet
Mine Site process water to achieve the process water quality targets. The combined alternative will
include nanofiltration of the process water flows with lower concentrations of dissolved metals and
sulfate – primarily the mine pit water – along with chemical precipitation of metals and sulfate (as
gypsum) from process water flows with higher concentrations of dissolved metals and sulfate,
including the drainage from the Category 3 and Category 4 waste rock stockpiles and the brine from
the nanofiltration operation. Treatment efficiency for a combined nanofiltration and chemical
precipitation treatment system was estimated using conservative results of the site-specific bench-
scale testing, selected removal efficiencies from literature, and chemical stability modeling using
PHREEQC. The results of this evaluation (Table 14) showed that, with the exception of mercury and
thallium, all of the parameters could be reduced to below the process water quality limits for the first
5 years and that from year 10 through year 20, several parameters would be close to the process
water quality targets, including sulfate, aluminum, arsenic, cobalt, and copper. Ongoing optimization
of the chemical precipitation and nanofiltration treatment operations can and will be used to reduce
the effluent concentrations of these parameters to below the process water quality targets and
maintain long-term water quality within the tailings basin.

RS29T 1-1
1.0 Introduction
1.1 Project Overview
1.2 Report Objective and Water Management Overview The objective of this Wastewater Treatment Technology Evaluation Report is to describe in detail the
water treatment requirements and the proposed water treatment technologies for NorthMet process
water that will be generated at two locations:
• At the Mine Site, primarily from pit dewatering and stockpile drainage, and
• At the Plant Site, primarily from the beneficiation of the ore and subsequent transport of
flotation tailings to the tailings basin.
Schematic drawings of the of the water flows at the Mine Site and the Plant Site are included in
Appendix J (Note: additional Appendices included in this Addendum begin after Appendices A
through H, which were included in the original Report. Appendix I contains the response to
comments on the March 30, 2007 version of RS29T). At the Mine Site, all process water that
contacts waste rock, ore, the mine pit, or any of the active mining operations will be carefully
managed to eliminate discharge to surface water. Additional details on segregation of Mine Site
process water from storm water can be found in RS22. Only non-contact storm water will be
discharged from the Mine Site. The Mine Site process water will be treated at a wastewater
treatment facility (WWTF) prior to being pumped to the tailings basin, where it will be used as
make-up water for the beneficiation process, as described in Section 2 of this report. The WWTF
will be designed and operated to maintain water quality within the tailings basin to appropriate
process-based targets. This water management plan avoids a direct discharge of wastewater from
both the Mine Site and the Plant Site during the proposed 20-year operating life of the project.
Approximately 40 years after closure of the mining operation, when the West Pit has filled with
water, it will be necessary to discharge water from the Mine Site. Treatment and discharge of Mine
Site process water after closure is addressed in the RS52. In general, the treatment of Mine Site
process water after closure of the Mine Site will continue as described in this Report. The volumes
of flow will, however, decrease with time as all of the stockpiles are covered. After closure, treated
water from the WWTF will no longer be routed to the tailings basin for re-use. Instead, this water

RS29T 1-2
will be directed to a wetland that will be constructed in the former East Pit, which will provide
additional treatment of the water before it flows to the West Pit and eventually the Partridge River.
The schematic drawings in Appendix I show the variations in the direction of water flow during
operation of the Mine Site and after closure.
At the Plant Site, PolyMet plans to use the existing tailings basin for disposal of flotation tailings
generated by processing the ore (see Figure 2). Water will be used in the grinding and flotation
operations and will also be used to transport the tailings to this basin. Water will then be returned
from the tailings basin to be re-used in the beneficiation process. During operation of the project, no
water will be discharged directly from the Plant Site to surface water. Upon closure, the water in the
tailings basin will be pumped back to the Mine Site to accelerate filling of the West Pit. Tailings
basin seepage water will also be pumped to the Mine Site after closure.
Additional wastewater streams that will be generated at the Plant Site include the process water from
hydrometallurgical residue cells that will be constructed on closed portions of the tailings basin, and
wastewater from potable use (toilets, sinks, showers, etc). During operation, the process water from
the hydrometallurgical residue cells will be routed back to the hydrometallurgical process, which will
consume water during normal operations. Drainage water treatment will be required after closure
and is addressed in RS52. Wastewater from potable uses will be treated separately from the process
wastewaters described in this report. Therefore, at the Plant Site, the primary focus of this report is
the process water in the Beneficiation Plant-tailings basin loop.
1.3 Report Organization

RS29T 2-1
2.0 Reuse/Recycle Water Management Plan
The reuse/recycle plan for water management at NorthMet envisions no discharge of wastewater
from any of the processing activities or other operations described in this report. Water will enter the
NorthMet operation in the form of precipitation, groundwater inflows to the mine pit, and as make-up
water from Colby Lake. This water will be collected, treated when necessary, used in the
beneficiation process, and later returned the mine pits to facilitate filling at the conclusion of the
mining operations. This water management plan for NorthMet does not include any planned
discharge of process water to surface waters of the State of Minnesota until the West Pit overflows to
the Partridge River, approximately 40 years after the operation has been closed and the Mine Site has
been reclaimed. This is the essence of the reuse/recycle plan for water management. The details of
this plan are developed in several other RS documents and integrated into a single plan in the
following paragraphs.
Managing process and wastewater generation and consumption to eliminate wastewater discharge to
surface water will be a critical aspect of the proposed NorthMet project. Water is required for the
grinding of ore and flotation of the ground ore slurry to separate the concentrate from the tailings.
Water is consumed in the hydrometallurgical processes used to recover metal from the concentrate.
Water is also lost to the tailings basin when tailings are deposited (by filling the space between
tailings particles), to evaporation from the surface of the basin, and to deep groundwater (water at the
natural groundwater elevation) beneath the tailings basin. All these water-related operations must be
balanced, and appropriate factors of safety established, to provide a consistent and reliable – but not
excessive – supply of water to the operation. A source of new water, Colby Lake, will then be used
to provide any additional water required to maintain the operation.
The implementation of a complete reuse/recycle program for NorthMet is predicated upon the careful
management (balancing) of water inflows with consumption, as well as careful modeling of water
quality and appropriate treatment, when necessary. The estimates of water quality and quantity at
both the Mine Site and the Plant Site have been completed and reported in several individual RS
reports including:
• RS13 – Process Design – Tailings Basin Water Balance
• RS21 – Hydrology – Mine Water Model and Balance
• RS22 – Mine Waste Water Management System

RS29T 2-2
• RS31 – Mine Pit Water Quality Model
• RS53/RS42 – Waste Rock Characteristics/Waste Water Modeling -Waste Rock and Lean Ore
• RS54A/RS46 – Flotation Tailings Characteristics/Waste Water Modeling -Tailings
• RS52 – Mine Closure Plan
• RS74 – Water Quality Changes -- Cumulative Impact Report
Small quantities of water (liner leakage) may not be captured by the proposed control systems at the
Mine Site. In general, these flows are still captured by pit dewatering operations while the Mine Site
is active. After the Mine Site is closed, these uncollected waters (fugitive flows) would flow through
the ground, with a portion of this flow eventually reaching into the Partridge River. The potential for
these flows to impact surface water quality is evaluated in detail in RS74. For the purpose of this
report, all Mine Site process water flows are assumed to be captured in the drainage and collection
systems at the Mine Site and routed to the WWTF. This provides a conservative estimate of the flow
into the WWTF.
The plan for treatment of water after closure is described in RS52 and summarized in Section 1.2 of
this report.
The results of these reports are summarized and combined in the following paragraphs to provide an
overall assessment of water management approach and to highlight areas where water treatment is
necessary to maintain the water quality needed for plant operations and to maintain appropriate water
quality standards near NorthMet.
2.1 Mine Site Process Water
2.1.1 Mine Site Process Water Quantity
Mine Site process water is generated from four sources: groundwater entering the mine pit, direct
precipitation on the mine pit, infiltration through or runoff from waste rock stockpiles collected on
liner systems (drainage), and runoff from other site operations within the Mine Site—for example the
ore Rail Transfer Hopper, and mine service roads. The mine plan includes three separate pits
(referred to as the East Pit, the Central Pit and the West Pit), which will be changing over the life of
the mining operation. The quantity of process water generated from these pits and associated
stockpiles will also vary over the life of the mine. The use of multiple pits helps to reduce the

RS29T 2-3
maximum pumping that will be required for mine pit dewatering and also provides a location for
storing some of the process water generated at the site after the first eleven years of operation. These
options help to provide flexibility and facilitate the development of a reuse/recycle - water
management plan.
On an annual average basis, the maximum design rate of process water generation from the sources
that will require treatment at the WWTF varies from approximately 500 gpm in the early years to a
maximum of approximately 1,600 gpm near Year 10, before initiation of filling activities for the East
Pit, and reducing to approximately 1,400 gpm in the final years of operation. The detailed evaluation
procedures used to estimate these flows is included in RS22 and summarized in RS21. Table 1
contains a summary of the anticipated annual average Mine Site process water flow rates from all the
sources that will require treatment. All of these flows, even during the likely peak in Mine Site
process water generation near Year 10 can be consumed by operations at the Plant Site. Within any
given year, the process water flow will vary significantly from a minimum flow during the winter
months to a maximum flow in the spring. In general the minimum flow is 0.5 to 0.7 times the
average annual flow, while the maximum flow ranges from approximately 2.0 to 2.5 times the annual
average flow, with a maximum design flow of approximately 2,960 gpm in the Spring of Year 10.
This value provides the design basis for the maximum flow rate through the WWTF of 3,000 gpm.
Table 1 Mine Site Process Water Flows to the WWTF
Estimated high (and low)1 average annual flow (gpm) in Year: Source 1 5 10 15 20
Category 1/2 Stockpile 58.6(44.4) 195.4(48.4) 120.3(38.4) 205.8(91.8) 205.8(91.8) Category 3 Stockpile 5.0(3.8) 20(14.7) 35(25.3) 49.5(34.4) 23.2(10) Category 3 Lean Ore Stockpile 29.9(22.7) 50(36.7) 62.5(33.7) 80.2(26.2) 51.8(22.5) Category 4 Stockpile 3.8(2.9) 30.4(22.9) 35.3(25.9) 32.2(23.3) 4.6(0.9) Lean Ore Surge Pile 46.1(35) 46.1(35) 46.1(35) 46.1(35) 46.1(35) East Pit2 200.9 774 820.1 80.7 0 West Pit 79.4 123.8 224.4 486.9 924.3 Haul Roads 46.1 46.7 38.8 36.5 35.3 Rail Transfer Hopper 6 6 6 6 6 Total 476(441) 1,292(1,108) 1,389(1,248) 943(740) 1,297(1,126)
Notes: 1. Lows not shown when same as high estimates 2. Includes Central Pit - Zero flow from East Pit to WWTF starting in Year 12 when East Pit filling is
initiated. 3. See RS22 (Table 3.1.1-B and Table 4.1.4.1-B) for flow estimation procedures and results

RS29T 2-4
As contemplated in Phase 3 of the SOW, the work described in RS21 and RS22 was focused on
minimizing the Mine Site process water quantity and minimizing impacts to water quality through
the use of segregation of waste rock and capping of stockpiles as well as dewatering of multiple pits
on independent schedules. These activities contribute to the implementation of a reuse/recycle water
management plan as described in the plan for the proposed WWTF at the Mine Site in Section 5.
2.1.2 Mine Site Process Water Quality
The quality of the Mine Site process water will vary based on the source of the water. For example,
waste rock is proposed to be segregated into four different ‘categories’ based on the geochemical
properties of the rock which drives the potential for water that contacts the rock to impact water
quality. Mine pit process water quality will be different than the drainage from the waste rock
stockpiles. The anticipated water quality for each of these sources has been predicted (see RS31 and
RS53/RS42) using site-specific data obtained from humidity cell testing and site-specific hydrology.
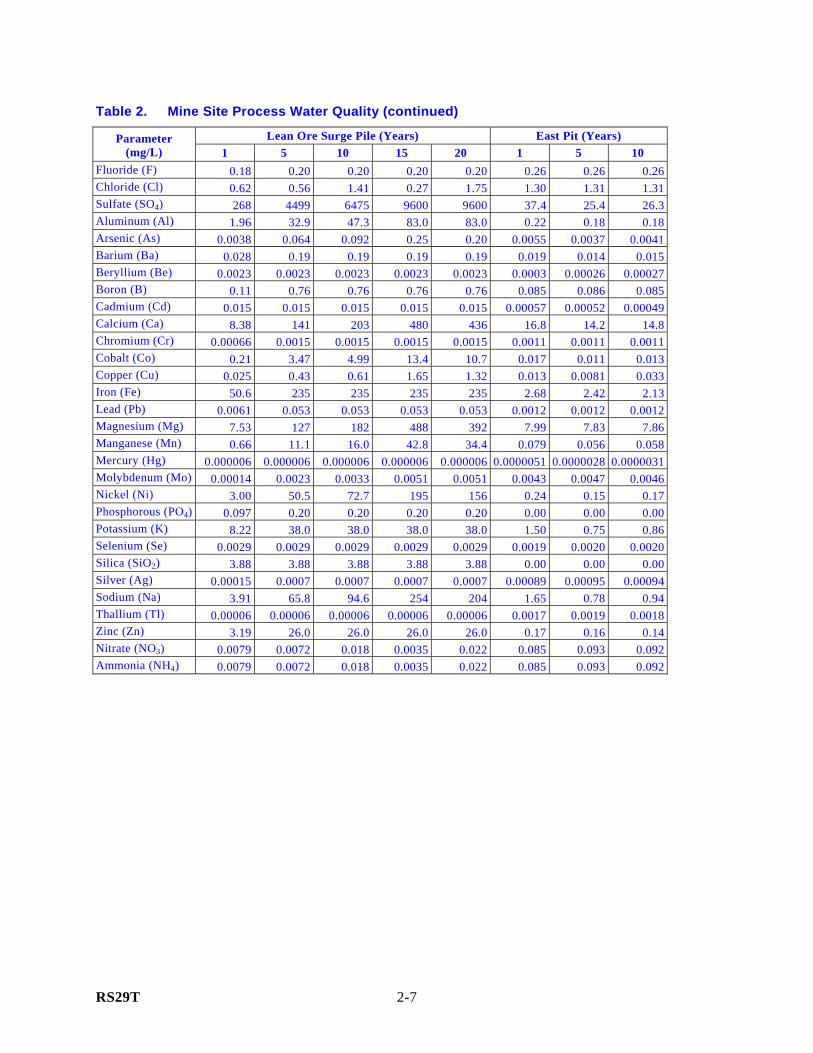
Table 2 contains a summary of the expected water quality for the primary sources of Mine Site
process water.

RS29T 2-5
Table 2 Mine Site Process Water Quality
Category 1/2 Stockpile (Years) Category 3 Stockpile (Years) Parameter (mg/L) 1 5 10 15 20 1 5 10 15 20
Fluoride (F) 0.0078 20.0 71.9 36.3 36.3 3.29 9.70 12.2 17.0 85.5Chloride (Cl) 0.11 82.5 110 0.00 0.00 19.1 12.9 5.74 8.41 53.5Sulfate (SO4) 0.68 1737 2340 2340 2340 1539 2340 9600 9600 9600Aluminum (Al) 0.026 1.68 1.68 1.68 1.68 1.68 1.68 83.0 83.0 83.0Arsenic (As) 0.0013 0.71 0.71 0.71 0.71 0.71 0.71 0.71 0.71 0.71Barium (Ba) 0.0026 0.19 0.19 0.19 0.19 0.19 0.19 0.19 0.19 0.19Beryllium (Be) 0.000029 0.0002 0.0002 0.0002 0.0002 0.0002 0.0002 0.0023 0.0023 0.0023Boron (B) 0.0011 0.76 0.76 0.76 0.76 0.73 0.76 0.76 0.76 0.76Cadmium (Cd) 0.0000058 0.00018 0.00018 0.00018 0.00018 0.00018 0.00018 0.015 0.015 0.015Calcium (Ca) 0.29 540 540 540 540 371 540 480 480 480Chromium (Cr) 0.000032 0.0015 0.0015 0.0015 0.0015 0.0015 0.0015 0.0015 0.0015 0.0015Cobalt (Co) 0.000016 0.04 0.052 0.052 0.052 0.052 0.052 15.4 24.0 44.0Copper (Cu) 0.00025 0.092 0.092 0.092 0.092 0.092 0.092 21.8 33.9 202Iron (Fe) 0.0045 0.81 0.81 0.81 0.81 0.81 0.81 28.7 44.7 235Lead (Pb) 0.000018 0.047 0.053 0.053 0.053 0.0092 0.027 0.053 0.053 0.053Magnesium (Mg) 0.051 93.0 93.0 93.0 93.0 53.1 93.0 1026 1030 1030Manganese (Mn) 0.00028 0.72 0.75 0.75 0.75 0.75 0.75 47.0 47.0 47.0Mercury (Hg) 0.0000013 0.00003 0.00003 0.00003 0.00003 0.000006 0.000006 0.000006 0.000006 0.000006Molybdenum (Mo) 0.000008 0.0051 0.0051 0.0051 0.0051 0.0051 0.0051 0.0051 0.0051 0.0051Nickel (Ni) 0.000072 0.18 0.66 0.33 0.33 0.86 0.86 182 284 762Phosphorous (PO4) 0.0058 0.20 0.20 0.20 0.20 0.20 0.20 0.20 0.20 0.20Potassium (K) 0.21 49.0 49.0 49.0 49.0 49.0 49.0 38.0 38.0 38.0Selenium (Se) 0.000031 0.0029 0.0029 0.0029 0.0029 0.0029 0.0029 0.0029 0.0029 0.0029Silica (SiO2) 0.30 8.65 8.65 8.65 8.65 8.65 8.65 3.88 3.88 3.88Silver (Ag) 0.0000074 0.0007 0.0007 0.0007 0.0007 0.0007 0.0007 0.0007 0.0007 0.0007Sodium (Na) 0.44 681 681 681 681 267 681 338 338 338Thallium (Tl) 0.0000029 0.00002 0.00002 0.00002 0.00002 0.00002 0.00002 0.00006 0.00006 0.00006Zinc (Zn) 0.00039 0.09 0.09 0.09 0.09 0.09 0.09 10.5 16.4 26.0Nitrate (NO3) 0.0015 1.07 1.43 0.00 0.00 0.20 0.14 0.060 0.088 0.56Ammonia (NH4) 0.0015 1.07 1.43 0.00 0.00 0.20 0.14 0.060 0.088 0.56

RS29T 2-6
Table 2. Mine Site Process Water Quality (continued)
Category 3 Lean Ore Stockpile (Years) Category 4 Stockpile (Years) Parameter (mg/L) 1 5 10 15 20 1 5 10 15 20
Fluoride (F) 4.11 13.1 28.1 68.2 107 0.20 0.20 0.20 0.20 0.20Chloride (Cl) 23.8 9.82 17.7 61.4 31.5 6.51 11.2 5.63 0.28 16.1Sulfate (SO4) 1925 2340 9600 9600 9600 3107 9600 9600 9600 9600Aluminum (Al) 1.68 1.68 83.0 83.0 83.0 22.7 83.0 83.0 83.0 83.0Arsenic (As) 0.71 0.71 0.71 0.71 0.71 0.044 0.19 0.45 0.61 0.71Barium (Ba) 0.19 0.19 0.19 0.19 0.19 0.19 0.19 0.19 0.19 0.19Beryllium (Be) 0.0002 0.0002 0.0023 0.0023 0.0023 0.0023 0.0023 0.0023 0.0023 0.0023Boron (B) 0.76 0.76 0.76 0.76 0.76 0.76 0.76 0.76 0.76 0.76Cadmium (Cd) 0.00018 0.00018 0.015 0.015 0.015 0.015 0.015 0.015 0.015 0.015Calcium (Ca) 465 540 480 480 480 97.3 427 480 480 480Chromium (Cr) 0.0015 0.0015 0.0015 0.0015 0.0015 0.0015 0.0015 0.0015 0.0015 0.0015Cobalt (Co) 0.052 0.052 38.5 44.0 44.0 2.39 10.5 24.6 32.9 44.0Copper (Cu) 0.092 0.092 54.3 136 202 0.29 1.29 3.03 4.06 107Iron (Fe) 0.81 0.81 71.7 180 235 235 235 235 235 235Lead (Pb) 0.012 0.037 0.053 0.053 0.053 0.053 0.053 0.053 0.053 0.053Magnesium (Mg) 66.4 93.0 1030 1030 1030 87.4 384 898 1030 1030Manganese (Mn) 0.75 0.75 47.0 47.0 47.0 7.67 33.7 47.0 47.0 47.0Mercury (Hg) 0.000006 0.000006 0.000006 0.000006 0.000006 0.000006 0.000006 0.000006 0.000006 0.000006Molybdenum (Mo) 0.0051 0.0051 0.0051 0.0051 0.0051 0.0016 0.0051 0.0051 0.0051 0.0051Nickel (Ni) 0.86 0.86 455 762 762 34.9 153 358 480 762Phosphorous (PO4) 0.20 0.20 0.20 0.20 0.20 0.20 0.20 0.20 0.20 0.20Potassium (K) 49.0 49.0 38.0 38.0 38.0 38.0 38.0 38.0 38.0 38.0Selenium (Se) 0.0029 0.0029 0.0029 0.0029 0.0029 0.0029 0.0029 0.0029 0.0029 0.0029Silica (SiO2) 8.65 8.65 3.88 3.88 3.88 3.88 3.88 3.88 3.88 3.88Silver (Ag) 0.0007 0.0007 0.0007 0.0007 0.0007 0.0007 0.0007 0.0007 0.0007 0.0007Sodium (Na) 334 681 338 338 338 45.4 199 338 338 338Thallium (Tl) 0.00002 0.00002 0.00006 0.00006 0.00006 0.00006 0.00006 0.00006 0.00006 0.00006Zinc (Zn) 0.09 0.09 26.0 26.0 26.0 26.0 26.0 26.0 26.0 26.0Nitrate (NO3) 0.25 0.10 0.19 0.65 0.33 0.092 0.16 0.08 0.004 0.23Ammonia (NH4) 0.25 0.10 0.19 0.65 0.33 0.092 0.16 0.08 0.004 0.23
RS29T 2-7
Table 2. Mine Site Process Water Quality (continued)
Lean Ore Surge Pile (Years) East Pit (Years) Parameter (mg/L) 1 5 10 15 20 1 5 10
Fluoride (F) 0.18 0.20 0.20 0.20 0.20 0.26 0.26 0.26Chloride (Cl) 0.62 0.56 1.41 0.27 1.75 1.30 1.31 1.31Sulfate (SO4) 268 4499 6475 9600 9600 37.4 25.4 26.3Aluminum (Al) 1.96 32.9 47.3 83.0 83.0 0.22 0.18 0.18Arsenic (As) 0.0038 0.064 0.092 0.25 0.20 0.0055 0.0037 0.0041Barium (Ba) 0.028 0.19 0.19 0.19 0.19 0.019 0.014 0.015Beryllium (Be) 0.0023 0.0023 0.0023 0.0023 0.0023 0.0003 0.00026 0.00027Boron (B) 0.11 0.76 0.76 0.76 0.76 0.085 0.086 0.085Cadmium (Cd) 0.015 0.015 0.015 0.015 0.015 0.00057 0.00052 0.00049Calcium (Ca) 8.38 141 203 480 436 16.8 14.2 14.8Chromium (Cr) 0.00066 0.0015 0.0015 0.0015 0.0015 0.0011 0.0011 0.0011Cobalt (Co) 0.21 3.47 4.99 13.4 10.7 0.017 0.011 0.013Copper (Cu) 0.025 0.43 0.61 1.65 1.32 0.013 0.0081 0.033Iron (Fe) 50.6 235 235 235 235 2.68 2.42 2.13Lead (Pb) 0.0061 0.053 0.053 0.053 0.053 0.0012 0.0012 0.0012Magnesium (Mg) 7.53 127 182 488 392 7.99 7.83 7.86Manganese (Mn) 0.66 11.1 16.0 42.8 34.4 0.079 0.056 0.058Mercury (Hg) 0.000006 0.000006 0.000006 0.000006 0.000006 0.0000051 0.0000028 0.0000031Molybdenum (Mo) 0.00014 0.0023 0.0033 0.0051 0.0051 0.0043 0.0047 0.0046Nickel (Ni) 3.00 50.5 72.7 195 156 0.24 0.15 0.17Phosphorous (PO4) 0.097 0.20 0.20 0.20 0.20 0.00 0.00 0.00Potassium (K) 8.22 38.0 38.0 38.0 38.0 1.50 0.75 0.86Selenium (Se) 0.0029 0.0029 0.0029 0.0029 0.0029 0.0019 0.0020 0.0020Silica (SiO2) 3.88 3.88 3.88 3.88 3.88 0.00 0.00 0.00Silver (Ag) 0.00015 0.0007 0.0007 0.0007 0.0007 0.00089 0.00095 0.00094Sodium (Na) 3.91 65.8 94.6 254 204 1.65 0.78 0.94Thallium (Tl) 0.00006 0.00006 0.00006 0.00006 0.00006 0.0017 0.0019 0.0018Zinc (Zn) 3.19 26.0 26.0 26.0 26.0 0.17 0.16 0.14Nitrate (NO3) 0.0079 0.0072 0.018 0.0035 0.022 0.085 0.093 0.092Ammonia (NH4) 0.0079 0.0072 0.018 0.0035 0.022 0.085 0.093 0.092

RS29T 2-8
Table 2. Mine Site Process Water Quality (continued)
West Pit, Central Pit, Haul Roads (Years) Rail Transfer Hopper (Years) Parameter (mg/L) 1 5 10 15 20 1 5 10 15 20
Fluoride (F) 0.26 0.25 0.25 0.26 0.26 0.058 0.058 0.058 0.058 0.058Chloride (Cl) 1.26 1.25 1.28 1.30 1.32 0.16 0.16 0.16 0.16 0.16Sulfate (SO4) 46.6 82.2 89.0 52.8 31.9 32.0 32.0 32.0 32.0 32.0Aluminum (Al) 0.32 0.33 0.43 0.31 0.20 0.023 0.023 0.023 0.023 0.023Arsenic (As) 0.019 0.017 0.017 0.012 0.0077 0.0019 0.0019 0.0019 0.0019 0.0019Barium (Ba) 0.042 0.045 0.044 0.032 0.022 0.0083 0.0083 0.0083 0.0083 0.0083Beryllium (Be) 0.00030 0.00044 0.00053 0.00038 0.0003 0.00014 0.00014 0.00014 0.00014 0.00014Boron (B) 0.069 0.076 0.079 0.080 0.082 0.015 0.015 0.015 0.015 0.015Cadmium (Cd) 0.00020 0.00026 0.00038 0.00031 0.00027 0.000031 0.000031 0.000031 0.000031 0.000031Calcium (Ca) 20.4 30.7 32.7 23.5 18.5 10.3 10.3 10.3 10.3 10.3Chromium (Cr) 0.0011 0.0011 0.0011 0.0011 0.0011 0.00014 0.00014 0.00014 0.00014 0.00014Cobalt (Co) 0.015 0.034 0.070 0.043 0.024 0.0040 0.0040 0.0040 0.0040 0.0040Copper (Cu) 0.026 0.069 0.58 0.38 0.22 0.0074 0.0074 0.0074 0.0074 0.0074Iron (Fe) 0.19 0.17 0.17 0.21 0.23 0.010 0.010 0.010 0.010 0.010Lead (Pb) 0.00079 0.00077 0.00078 0.00087 0.00094 0.00011 0.00011 0.00011 0.00011 0.00011Magnesium (Mg) 6.61 8.40 8.91 8.09 7.90 2.16 2.16 2.16 2.16 2.16Manganese (Mn) 0.090 0.17 0.19 0.11 0.072 0.032 0.032 0.032 0.032 0.032Mercury (Hg) 0.000015 0.000017 0.000017 0.00001 0.0000058 0.000006 0.000006 0.000006 0.000006 0.000006Molybdenum (Mo) 0.0027 0.0023 0.0025 0.0035 0.0042 0.000048 0.000048 0.000048 0.000048 0.000048Nickel (Ni) 0.26 0.54 0.96 0.57 0.31 0.080 0.080 0.080 0.080 0.080Phosphorous (PO4) 0.00 0.00 0.00 0.00 0.00 0.021 0.021 0.021 0.021 0.021Potassium (K) 4.19 5.35 5.52 3.35 1.80 1.47 1.47 1.47 1.47 1.47Selenium (Se) 0.0017 0.0016 0.0017 0.0018 0.0019 0.00016 0.00016 0.00016 0.00016 0.00016Silica (SiO2) 0.00 0.00 0.00 0.00 0.00 1.67 1.67 1.67 1.67 1.67Silver (Ag) 0.00068 0.00061 0.00063 0.00078 0.00089 0.000035 0.000035 0.000035 0.000035 0.000035Sodium (Na) 6.14 6.61 6.59 4.20 2.26 1.52 1.52 1.52 1.52 1.52Thallium (Tl) 0.0010 0.00088 0.00093 0.0013 0.0017 0.000014 0.000014 0.000014 0.000014 0.000014Zinc (Zn) 0.029 0.037 0.059 0.046 0.037 0.0030 0.0030 0.0030 0.0030 0.0030Nitrate (NO3) 0.051 0.043 0.045 0.067 0.082 0.0021 0.0021 0.0021 0.0021 0.0021Ammonia (NH4) 0.051 0.043 0.045 0.067 0.082 0.0021 0.0021 0.0021 0.0021 0.0021
RS29T 2-9
The water quality predictions developed in RS31 and RS53/RS42, which are summarized in Table 2,
are based on the actual groundwater and rock chemistry from the NorthMet site including the results
of numerous on-going, site-specific humidity cell tests. The results from on-site groundwater
monitoring and site-specific humidity cell testing provide the best available data for consideration of
wastewater treatment requirements at the Mine Site. Groundwater samples collected during the
Phase II and Phase III hydrogeologic investigations from boreholes completed in the Duluth
Complex at the NorthMet site to depths of up to 600 feet did not contain elevated chloride
concentrations. Chloride concentrations in these deep boreholes were generally similar to
concentrations in samples collected from wells completed in the surficial aquifer at the Mine Site.
While saline groundwater (Cl > 50,000 mg/L) has been encountered in bedrock wells throughout the
Lake Superior basin (Morton and Ameel, 1985), salinity is generally greater near the lakeshore and
decreases with distance and elevation inland (Swenson, 2007). Generally, wells completed above the
elevation of Lake Superior (~600 ft MSL) contain less than 100 mg/L chloride (STS, 1995). The
minimum elevations of the East and West pit bottoms are approximately 800 and 900 feet MSL,
respectively, 200 to 300 feet above the average elevation of Lake Superior. Based on these factors, it
is unlikely that extensive areas of saline groundwater will be encountered during mining. In the
event that significantly higher concentrations of chloride and other salts are encountered, in
comparison to the values established in the on-site testing program, additional treatment technologies
would need to be considered including, but not limited to reverse osmosis and ion exchange
treatment. These technologies are generally similar to those already evaluated in Section 4 of this
report.
Based on these water quality predictions, process water generated at the Mine Site will need to be
treated before it can be piped to the Plant Site. The variation in the expected water quality and
quantity for each of the Mine Site process water streams has implications for the sizing and selection
of wastewater treatment technologies. The impact of this variability is discussed in Section 5.
2.2 Plant Site Process Water
2.2.1 Plant Site Process Water Quantity
2.2.2 Plant Site Process Water Quality
RS29T 3-1
3.0 Process Water Quality Targets
3.1 Potential Surface Water Quality Standards Both the Mine Site and the Plant Site are located within the Lake Superior watershed basin, more
specifically within the upper reaches of the St. Louis River watershed. The Mine Site is located
within the Partridge River watershed, which flows into the St. Louis River. The Process Plant is also
located within the Partridge River watershed. A portion of the tailings basin is located within the
Partridge River watershed in the headwaters to Knox Creek (Second Creek). The majority of the
tailings basin is located within the Embarrass River watershed. The Embarrass River flows into the
St. Louis River downstream of the confluence of the Partridge and St. Louis Rivers.
In-stream surface water quality standards for both the Embarrass River and the Partridge River have
been established by the State of Minnesota. Both the Partridge River and the Embarrass River are
classified by the State of Minnesota as Class 2B waters in accordance with Minnesota Rules1. The
water quality standards for Class 2B streams have been established to protect aquatic life as well as
recreational uses. In addition, because these surface waters are part of the Lake Superior Basin
watershed, additional water quality rules for certain parameters such as dissolved metals supersede
the general Class 2B rules2. Combining the information from these two rules, the in-stream surface
water quality values for parameters potentially significant to the NorthMet operation are listed in
Table 3. A hardness of 400 mg/L was assumed in order to calculate the hardness-dependent metals
standards, as it is likely that the treated water will have hardness from lime treatment. The surface
water standards for various other stream classifications may also be applicable to Class 2B waters to
protect the use of the water for other uses. Although these additional standards are not needed to
protect aquatic life, they are also included in Table 3. For the purpose of this report, these Standards
are considered potential, because no discharge to surface waters is envisioned prior to closure of
operations at the Mine Site. Thus, these values provide a conservative basis for comparison to the
quality of Mine Site process water.
1 MN Rule 7050.0222 Subpart 4. 2 MN Rule 7052.0222 Subpart 5

RS29T 3-2
Because these surface water standards presented in Table 3 are the ‘in stream’ concentrations, they
represent conservative values for process water quality targets because process water will not be
discharged to surface waters and any actual surface water discharge limits would be developed with
consideration of base flow conditions and the potential for mixing within the stream.

RS29T 3-3
Table 3 Potential Water Quality Standards
Parameter
Surface Water Quality Standard1
(µg/L, unless noted)
Groundwater Protection Standard2 (µg/L, unless noted)
Drinking Water Standard2
(µg/L, unless noted) Metals/Inorganics
Aluminum 125 50-200 (S) Antimony 31 6 6 Arsenic 53 10 Barium 2,000 2,000 Beryllium 0.08 4 Boron 500 (4A) 600 Cadmium 7.3 4 5 Chromium (+3) 268 20,000 100 Chromium (+6) 11 100 Cobalt 5 30 (S) Copper 30 1,000 (S) 1,300 (1,000 - S) Iron 300 (S) Lead 19 15 Manganese 1,000 50 (S) Mercury 0.0013 2 2 Molybdenum 100 (S) Nickel 169 100 100 Selenium 5 30 50 Silver 1 30 100 (S) Thallium 0.56 0.6 2 Zinc 388 2,000 5,000 (S)
General Parameters Ammonia (un-ionized) 40 Bicarbonate (meq/L) 5 (4A) Chloride (mg/L) 230 (100 – 3B) 250 (S) Cyanide (free) 5.2 100 200 Dissolved Oxygen (mg/L) >5.0 Fluoride (mg/L) 4 4 (2-S) Hardness(mg/L) 250 (3B) Nitrate (mg/L) 10 10 Oil 500 pH (su) 6.0-9.0 Sodium 60 percent of cations (4A) Specific Conductance(uhmos/cm) 1,000 (4A) Sulfate 10 (4A3) 250 (S) Total Dissolved Solids 700 (4A) 500 (S) Total Salinity (mg/L) 1,000 (4B) Turbidity (NTU) 25
Notes: 1. Surface Water Standards are for Class 2B waters unless noted as Class 3B, 4A, or 4B in parenthesis. 2. Groundwater Protection and Drinking Water Protection Standards are for protection of human health except where noted as secondary standards (S), which are generally for aesthetics (taste). 3. Only when wild rice is present

RS29T 3-4
3.2 Potential Groundwater Quality Standards While direct seepage (overland flow) to surface waters or wetlands will be actively controlled,
PolyMet recognizes that deep seepage (groundwater recharge out the bottom of the basin) to
(underlying, natural) groundwater will occur during operation of the tailings basin and after closure.
The State of Minnesota has established Rules for the protection of groundwater resources3. In
addition, the U.S. EPA has established regulations to protect human health by limiting contaminants
in drinking water4.
PolyMet is the closest groundwater user to the tailings basin. A shallow bedrock well is located
approximately one-mile to the southwest of the tailings basin near the offices. The next closest
groundwater users are residential wells a minimum of 1.5 miles north of the tailings basin. While
these distances provide considerable buffer between the tailings basin and potential groundwater
users, the use of groundwater standards as process water quality targets within the basin establishes
conservative values that comply with existing rules to be protect the quality of groundwater for
human health at the nearest point of use. The State of Minnesota groundwater standards and the U.S.
EPA drinking water standards are summarized in Table 3.
3.3 Anticipated Process Water Quality Targets Using the potential surface water quality standards and the potential groundwater quality standards,
anticipated process water quality targets have been developed for the parameters of concern listed in
the Work Plan for RS29T. Anticipated targets have been developed for both Mine Site process water
and for Plant Site process water (the tailings basin). These values are summarized in Table 4. These
values will provide the benchmark that will be used to evaluate the treatment of Mine Site and, if
necessary, Plant Site process water in the following sections.
In general, the selected process water quality target for each parameter was the surface water quality
criteria, for those parameters that have specific surface water standards. For parameters without a
surface water standard, the Minnesota groundwater protection standard was selected, and for
parameters with neither a Minnesota surface water nor groundwater protection standard, the U.S.
EPA drinking water standard was selected.
3 MN Rules 4717.7100 to 4717.7800, and MN Rules 7060 4 40 CFR 141 (National Primary Drinking Water Regulations) and 40 CFR 143 (National Secondary Drinking Water Regulations).

RS29T 3-5
Table 4 Process Water Quality Targets
Parameter
Process Water Quality Target
(µg/L, unless noted) Standard Class/Basis Metals/Inorganics
Aluminum 125 Surface Water 2B – Aquatic Life Antimony 31 Surface Water 2B – Aquatic Life Arsenic 10 Drinking Water Primary/Human Health Barium 2,000 Drinking Water Primary/Human Health Beryllium 4 Drinking Water Primary/Human Health Boron 500 Surface Water 4A – Irrigation Cadmium 4 Ground Water1 Human Health Chromium (+3) 100 Ground Water Human Health Chromium (+6) 11 Surface Water 2B – Aquatic Life Cobalt 5 Surface Water 2B – Aquatic Life Copper 30 Surface Water 2B – Aquatic Life Iron 300 Drinking Water Secondary Lead 19 Surface Water 2B – Aquatic Life Manganese 50 Drinking Water Secondary Mercury 0.0013 Surface Water 2B – Aquatic Life Molybdenum 100 Drinking Water Secondary Nickel 100 Ground Water1 Human Health Selenium 5 Surface Water 2B – Aquatic Life Silver 1 Surface Water 2B – Aquatic Life Thallium 0.56 Surface Water 2B – Human Health Zinc 388 Surface Water 2B – Aquatic Life
General Parameters Ammonia (un-ionized) 40 Surface Water 2B – Aquatic Life Bicarbonate (meq/L) 5 Surface Water 4A – Irrigation Chloride (mg/L) 230 Surface Water 2B – Aquatic Life Cyanide (free) 5.2 Surface Water 2B – Aquatic Life Dissolved Oxygen (mg/L) >5.0 Surface Water 2B – Aquatic Life Fluoride (mg/L) 2 Drinking Water Secondary Hardness(mg/L) 250 Surface Water 3B – Industrial Nitrate (mg/L) 10 Drinking Water Primary Oil 500 Surface Water 2B pH (su) 6.0-9.0 Surface Water 2B Sodium 60% of cations Surface Water 4A – Irrigation Specific Conductance (uhmos/cm) 1,000 Surface Water 4A – Irrigation Sulfate 250 Drinking Water Secondary Total Dissolved Solids 700 Surface Water 4A – Irrigation Total Salinity (mg/L) 1,000 Surface Water 4B – Livestock Turbidity (NTU) 25 Surface Water 2B
Notes: 1. Ground water standard is more conservative at 400 mg/L hardness

RS29T 3-6
When comparing these process water quality targets to the predicted process water quality at the
Mine Site (Table 2), the following objectives for wastewater treatment are identified:
• Mine Site process water will likely need to be treated to remove metals, including aluminum,
antimony, arsenic, cobalt, copper, iron, manganese, mercury, nickel, selenium, thallium, and
zinc.
• Mine Site concentrations of sulfate and hardness, along with the related parameters of TDS
and conductivity will likely also require treatment to reduce long-term build-up of these
parameters in the tailings basin. Salinity, in particular sodium and chloride, do not appear to
be present at concentrations that would require treatment.
• Plant Site process water will not need to be treated provided the treatment of Mine Site
process water, prior to use as make-up water, is adequate to maintain the water quality in the
tailings basin below the process water quality targets.
These potential treatment needs will be addressed in the identification and evaluation of potential
treatment technologies in the following sections.

RS29T 4-1
4.0 Summary of Potential Wastewater Treatment Technologies
This section contains a summary of information on potential wastewater treatment technologies. As
described in the SOW, the primary technologies to be considered in this report are: chemical
precipitation, reverse osmosis, ion exchange, constructed wetland, and membrane technology.
Because reverse osmosis is a specific type of membrane technology, these processes are described
together. Other potential biological treatment options, for example biological sulfate reduction, are
considered with wetland processes. This summary is not intended to be a comprehensive review of
all literature available on the treatment of mine water, as the available publications on this topic are
extensive. For example, a recent review of treatment technologies for metals in groundwater
prepared by Kurniawan and others included a review of chemical precipitation, ion exchange, and
membrane filtration – three of the primary treatment operations considered in this evaluation – and
cited more than 100 references (Kurniawan, Chan, Lo, and Babel, 2006). A limited number of
technical references are cited for each technology to provide a basis for the applicability of these
technologies. A summary of the references cited in this technology evaluation section are
summarized in Appendix K.
The parameters of potential concern listed in the SOW and discussed in the previous section included
pH, metals, mercury, sulfate, salinity, and nutrients. These parameters will be discussed in this
section in relation to the treatment technologies identified. However, the primary parameters
considered in this evaluation are metals and sulfate. For the purposes of this evaluation, the Mine
Site water quality presented in Table 2 is considered the potential influent for a wastewater treatment
facility (WWTF).
While pH is a potential parameter of concern, it is also – in the case of many wastewater treatment
systems – an operational control parameter. The pH of the Mine Site process water will likely need
to be modified during treatment operations and will be adjusted to within the target range as a final
treatment step. Similarly, the concentrations of nutrients in the Mine Site process water are relatively
low and while they are not likely to interfere with potential physical or chemical treatment systems
evaluated in this section, they would likely need to be supplemented for the operation of biological
treatment system. While nutrients would be a potential concern if discharged to surface water, the
elimination of a direct discharge to surface water from the site helps to reduce the potential concern

RS29T 4-2
associated with nutrients in process water and the predicted concentrations of nitrogen and
phosphorous (Table 2) do not suggest that these parameters will be a concern in the tailings basin.
Mercury is present at very low concentrations in the waste rock and in the precipitation that enters
the Mine Site. Both of these sources contribute to the mercury load in the drainage from the waste
piles. While the effectiveness of the treatment systems evaluated in this section will consider
mercury treatment, the water management plan envisions the reuse/recycling of treated Mine Site
process water to the tailings basin rather than discharge to surface water. Reuse/recycling of the
treated Mine Site process water at the tailings basin will provide additional mercury
removal/treatment because it has been shown that mercury will adsorb to taconite tailings and
NorthMet tailings. Additional laboratory testing conducted on behalf of PolyMet is included in
Appendix B. This work supports the observation that mercury is adsorbed by tailings. Thus, a
majority of the mercury that remains in the treated Mine Site process water will be absorbed and
ultimately sequestered in the tailings basin prior to the water recharging to groundwater. The
NorthMet Project mercury mass balance is provided in RS66.
Organics (e.g., DRO, GRO and flotation reagents) were also identified as parameters of potential
concern, but these are not expected to be present in the Mine Site process water. While fuels
containing these materials will be used at the Mine Site, these chemicals would only be associated
with wastewater as a result of spills, rather than routine operations. Containment of spills related to
fueling operations is addressed in the SPCC plans for the Mine Site and the Plant Site (ER05 and
ER06). For this reason, these chemicals are not addressed in this section. Other organics used in the
Beneficiation Plant that will report to the tailings basin will be easily degraded or deposited with the
tailings to provide a long-term oxygen demand from the tailings basin that will reduce future
oxidation and release of inorganics. These parameters are considered in process water from the
Beneficiation Plant in Section 6.
4.1 Chemical Precipitation
4.1.1 Technology Description Chemical precipitation treatment technologies for wastewater treatment rely on the insolubility of
various chemical compounds to remove chemicals of concern. In general, one or more chemicals can
be removed from the waste stream by the addition of other chemicals that will combine to form
insoluble products that can be separated from the liquid stream. A chemical precipitation operation
would consist of chemical addition, rapid mixing, coagulation, flocculation, and settling processes,

RS29T 4-3
which would facilitate the formation and physical separation of the precipitate from the water.
Filtration could be used as a final polishing step for the water, if necessary. A filter press operation
would be used to remove as much water as possible from the solids. The treated water would then be
piped to the tailings basin for reuse while the dewatered solids would be disposed with the
hydrometallurgical residues. In general, the mass of wastewater sludge generated annually at the
WWTF would likely be less than one percent of the mass produced annually in the
Hydrometallurgical Process. The WWTF sludge would also likely be similar to the
hydrometallurgical residues, consisting primarily of gypsum. Thus it would not be expected to
change the overall chemical characteristics of the solids in the hydrometallurgical residue cells.
Several potential chemicals can be used to treat the process water from the Mine Site. Some
chemicals used in chemical precipitation processes will increase the pH (for example hydrated lime,
Ca(OH)2) to facilitate precipitation, while others require the addition of supplementary chemicals to
control pH within an optimum range to precipitate the desired chemical compound. The advantages
and disadvantages of various chemical precipitation techniques for removal of metals and sulfates (or
other salts) are discussed in the following sections.
4.1.2 Metal Precipitation Technologies
Heavy metals may be removed from water by adjusting the pH of waste stream and adding chemicals
that will help to form insoluble precipitates. The most common operations form hydroxides,
carbonates, or sulfide compounds (Benefield, Judkins, and Weand, 1982). These and other
specialized chemical precipitation technologies are described in the following paragraphs.
4.1.2.1 Hydroxide Precipitation
Hydroxide precipitation treatment is primarily used for the removal of heavy metals. Soluble heavy
metal ions are converted to insoluble metal-hydroxide precipitates that can be physically removed
from the water. Iron, manganese, and potentially magnesium also form precipitates that can be
removed, and in the case of iron and manganese, the solid hydroxides facilitate co-precipitation of
heavy metals and arsenic as well as nutrients such as phosphorous from the water. The addition of
soluble iron to the process can enhance the co-precipitation process, if necessary, to improve the
removal of metals. (Ayres, Davis, and Gietka, 1994).
Hydroxide precipitation is accomplished by adjusting the pH of the water to alkaline conditions
(generally around pH 10). The most common hydroxide precipitating agents are hydrated lime

RS29T 4-4
(Ca(OH)2), caustic soda (NaOH), or magnesium hydroxide (Mg(OH)2). However, other alkaline
materials, such as Bauxol, cement kiln dust, or flyash could also be used. In mine wastewater
treatment, lime is the most common agent because the added calcium will combine with sulfate to
form gypsum (CaSO4-2H20) when excess sulfate is present. Excess calcium is also easier to
subsequently remove from the water than sodium, potassium, or trace contaminants that could be
introduced from other alkaline waste materials.
The solubility products for several metal hydroxides are summarized in Table 5. Because many
dissolved metals – including copper, nickel and zinc – exhibit amphoteric behavior (where a soluble
metal-hydroxide complex is stable when the pH exceeds that associated with the minimum
solubility), the optimum pH for hydroxide precipitation varies with changes in the influent metal
characteristics. For example, nickel is removed effectively at pH 10, while copper is removed at
pH 8. A single-stage hydroxide precipitation system could be designed to remove both nickel and
copper if sufficient iron and manganese are available to act as co-precipitates. Otherwise, a multi-
stage process, or additional iron salts may be needed to optimize removal of both these metals.
Nickel hydroxide precipitation is also subject to competition with dissolved iron. Thus, sufficient
lime and residence time are required to facilitate removal of both iron and nickel.
Table 5: Solubility Products for Various Metal Hydroxides, Carbonates, and Sulfides
Metal Hydroxide
Hydroxide Solubility Product Carbonate
Carbonate Solubility Product Sulfide
Sulfide Solubility Product
Nickel Ni(OH)2 2.0 x 10⁻¹⁵ NiCO3 6.6 x 10⁻⁹ NiS 3 x 10-19 Copper Cu(OH)2 2.2 x 10⁻²⁰ CuCO3 1.4 x 10⁻¹⁰ CuS 6 x 10-37 Cobalt Co(OH)2 1.6 x 10⁻¹⁵ CoCO3 1.4 x 10⁻¹³ CoS 4.0 x 10⁻²¹ Zinc Zn(OH)2 1.2 x 10⁻¹⁷ ZnCO3 1.4 x 10⁻¹¹ ZnS 2 x 10-25 Iron Fe(OH)2 8.0 x 10⁻¹⁶ FeCO3 3.2 x 10⁻¹¹ FeS 6 x 10-19
Calcium Ca(OH)2 5.5 x 10⁻⁶ CaCO3 3.8 x 10⁻⁹ CaS 8.5 x 10⁻⁶
At NorthMet, the hydroxide precipitation process would likely consist of chemical addition and rapid
mixing to raise the pH, coagulation and flocculation to allow the precipitates to form, physical
(gravity) settling to remove the floc from the water, filtration (as necessary), and a final pH
neutralization step. If lime is used to raise the pH, carbon dioxide or sodium bicarbonate would be
used for neutralization so that additional calcium can be precipitated as calcium carbonate and
removed during the neutralization step, reducing the hardness of the treated water.
RS29T 4-5
The solids generated by this operation would be filter-pressed to remove any water, which would be
returned to the water treatment operation. The dewatered solids would contain hydroxides and could
either be introduced into the hydrometallurgical process or disposed with the hydrometallurgical
residues from the hydrometallurgical process. A portion of the solid precipitate may also be recycled
to the beginning of the chemical precipitation process to stimulate the initial crystallization process.
This variation of chemical precipitation treatment is commonly referred to as a high-density-sludge
(HDS) operation. The HDS process is a variation of the lime precipitation process that increases
removal efficiency while reducing the volume of sludge generated in the treatment of metals in
mining wastewaters (Sengupta, 1993). The published results from a recent pilot test of the HDS
process at the Britannia Mine in British Columbia showed that dissolved copper could be reduced
from approximately 40 mg/L to 27 µg/L or less using this process (CEMI, 2002).
The primary advantages of hydroxide precipitation are that it is a well-established and simple
technology and that it is relatively inexpensive when compared to other treatment technologies. For
these reasons, lime treatment is perhaps the most commonly used treatment for removing heavy
metals from mining wastewaters. The primary disadvantage with hydroxide precipitation is that
some metals like manganese may not be adequately treated. In addition, some metals require either
oxidation or reduction before they can be effectively precipitated as hydroxides. For example,
selenium (+6) should be reduced to selenium (+4), while arsenite (+3) should be oxidized to arsenate
(+5) to enhance precipitation. Oxidizing cobalt (+2) to cobalt (+3) also greatly enhances removal via
hydroxide precipitation (Smith and Martell, 1976).
Bench-scale testing of metal hydroxide precipitation was conducted to evaluate potential application
of this technology to the Mine Site process water. A sample of wastewater from the Dunka waste
rock stockpiles, located near the PolyMet site, was used as the influent water for the bench-scale
testing. The results of this testing are summarized in RS45 and included with this report in
Appendix C. The results of this work show that, with the exception of mercury, all of the metals
concentrations can be reduced to below the process water quality targets (see Table 9 of
Attachment C2 in Appendix C).
Predicted water quality values for drainage from the Category 3 and Category 4 waste rock piles
exceeds the concentrations for several of the parameters in the water used for hydroxide precipitation
testing for the NorthMet project. The lower concentrations in the influent for the pilot tests result in
the calculation of lower removal efficiencies, on a percentage basis. However, the potential effluent
concentrations for this and other precipitation processes are controlled by the solubility of the

RS29T 4-6
precipitate rather than an absolute value for removal percentage. The low effluent values for metals
observed in the pilot test are achievable for waters with greater influent concentrations, provided
adequate chemical reaction time and hydroxide producing chemicals are present. Low metal effluent
concentrations have been reported using hydroxide precipitation with lime for water with much
higher metals concentrations obtained from the Berkeley Pit (U.S. EPA and U.S. DOE, 1997). A
single stage neutralization process was able to remove all metals at a pH of 9.6. At higher pH values,
aluminum (pH = 10.2), and then cadmium and manganese (pH = 11.2) were not removed as
effectively. These results demonstrate that hydroxide precipitation results observed in the pilot
testing can be achieved even if influent concentrations are greater than those used in the pilot testing.
4.1.2.2 Sulfide Precipitation
The sulfide precipitation process involves the conversion of soluble metal compounds to relatively
insoluble sulfide compounds through the addition of precipitating agents such as: sodium sulfide
(Na2S), sodium hydrosulfide (NaHS), ferrous sulfide (FeS) and calcium sulfide (CaS). As shown in
Table 5, metal the solubility product of metal sulfides are generally two or more orders of magnitude
less than the solubility product of comparable metal hydroxides. Additionally, metal sulfides do not
exhibit amphoteric behavior, and are less sensitive to changes in pH. Efficient metal sulfide
precipitation can be achieved over a wide pH range (2 to 12). However, high pH (pH>7) is required
to prevent formation of hydrogen sulfide (H2S) gas. The kinetic rate for the formation of a sulfide
precipitate is faster than hydroxide precipitation, resulting in a lower required retention times for
reaction vessels. In addition, sulfide precipitation results in a solid that could be easily incorporated
into the Hydrometallurgical Process for recovery of the metals.
Sulfide precipitation using sodium sulfide was demonstrated using water from the Berkeley Pit with
very high metals concentrations. At a low pH (4.3) over 99 percent of the copper and zinc could be
recovered as metal sulfides before neutralization of the water and removal of other metals. However,
this process resulted in emission of H2S and produced a sludge that was difficult to filter. Successful
removal of metals from wastewater using calcium sulfide was reported by Kim and Amodeo (1983).
The primary disadvantages of metal sulfide precipitation technology are: potential production of H2S
gas (especially at pH values below neutral), potential residual sulfide in treatment effluent, higher
capital and operating costs than hydroxide precipitation, increased process complexity compared to
hydroxide precipitation, and potential difficulties with floc settlement (Kim and Amodeo 1983).

RS29T 4-7
Operationally, sulfide precipitation would be similar to hydroxide precipitation. The process would
likely be initiated with a lime addition step and rapid mix tank to raise the pH. Any precipitation that
occurs as a result of this step could be segregated using a conventional coagulation, flocculation and
settling operation or could remain suspended during the next phase of treatment. Next, sulfide would
be added to the high pH water using another sequence of chemical feed, rapid mix, coagulation,
flocculation, and settling. A filtration step may also be needed at the end. Other variations on the
sequence of operation could also be considered to match the specific type of sulfide reagent used in
the process. The two most commonly used sulfide precipitation processes, soluble sulfide
precipitation (SSP) and insoluble sulfide precipitation (ISP), are summarized in Table 6.
Table 6 Comparison of Sulfide Precipitation Technologies
Process Chemical(s) Advantages Disadvantages Safety Measures
• Sodium Sulfide (Na2S)
Soluble Sulfide Addition
• Sodium Hydrosulfide (NaHS)
• High solubility of these precipitating agents allows the use of high sulfide concentrations in the reaction chamber, causing rapid precipitation of metal sulfides.
• Operation can generally achieve very low effluent concentrations.
• Formation of small (pin) floc that may have poor settling characteristics and often requires the addition of a polymer or other chemical to aid in the coagulation of a settleable or filterable precipitate.
• Potential to generate hydrogen sulfide gas.
• Potential for residual sulfide in the effluent.
• Soluble sulfide dose must be sufficient to remove both iron and nickel.
• Gas generation is mitigated by operating at an elevated pH
• Sulfide quenching chemicals used to control the residual concentration of dissolved sulfide in effluent.
Insoluble Sulfide Addition
Ferrous Sulfide (FeS) – Sulfex Process (EPA 625/8-80-003).
• Metals with a lower solubility product than iron will exchange with iron and be precipitated as sulfides.
• Process works well for metals such as copper and zinc where the solubility product of the metal sulfide is several orders of magnitude less than FeS.
• Solubility products for NiS and FeS are similar (same order of magnitude).
• Nickel must be present at concentrations greater than Fe2+ for removal to occur.
• FeS is unstable and must be generated onsite.
• Sulfex process typically requires 2 to 4 times the stoichiometric amount of FeS
• Large amount of sludge (up to 3 times more than lime precipitation) is produced.
• Low solubility of FeS limits H2S production and effluent sulfide concentrations.

RS29T 4-8
Process Chemical(s) Advantages Disadvantages Safety Measures Calcium sulfide
(CaS) • Calcium particles act as
nuclei for metal-sulfide precipitates.
• CaS precipitation is capable of lower effluent nickel concentrations than Sulfex process.
• CaS precipitation provides less sludge than Sulfex process.
• Requires on-site generation of reagent using lime and a sulfide source (H2S).
• Dense sludge may require higher power mixing and handling equipment.
• Limited solubility of CaS minimizes the potential for H2S generation and sulfide overdose.
Testing of sulfide precipitation was planned for the bench scale chemical precipitation testing,
however, this work was not completed because the hydroxide precipitation test, using a HDS
simulation (solids recycle) was capable of achieving concentrations below the process water quality
targets for all parameters other than mercury.
4.1.2.3 Carbonate Precipitation
4.1.2.4 Xanthate Floatation
4.1.3 Chemical Precipitation Technologies for Sulfate and other Salts
Sulfate, phosphorous, nitrate and several other dissolved solids, in addition to metals as described
above, can also be removed using various chemical precipitation technologies. In general, these
technologies work better for divalent cations and anions, and for larger compounds. If necessary,
some of these chemical technologies can be modified to remove chloride, potassium, and larger
monovalent cations. Because the modeling of water quality in the tailings basin did not show that
sodium, potassium, chloride, phosphorous, or nitrate were likely to be at concentrations of concern in
the beneficiation process or the tailings basin, the following discussion of chemical treatment
technologies is focused primarily on the removal of sulfate. If nitrate, chloride, or other anions are
present at concentrations significantly different than those predicted for the Mine Site process water,
a portion of these chemicals could potentially be removed using the high lime processes described
below. Alternatively, treatment processes other than precipitation – for example biological
denitrification for nitrate, and reverse osmosis for chloride – would be considered.

RS29T 4-9
4.1.3.1 Lime Treatment Processes
4.1.3.2 Ultra High Lime Processes
In conventional lime treatment, where the influent concentration of sulfate is high enough to promote
gypsum precipitation, the concentration of sulfate in the effluent is generally on the order of 1,500
mg/L. The effluent sulfate concentration is limited by the solubility of gypsum, which is also a
function of the calcium concentration. The molar ratio of calcium to sulfate at saturation is typically
on the order of 0.3 (Abdel-Aal, et. al., 2004). Thus, increasing the concentration of calcium in
solution can result in a further reduction of sulfate along with silica and other oxyanions. This
concept has been demonstrated in the ultra-high lime process (Batchelor, et. al., 1991). In this
process – after settling, filtering or otherwise removing the solid material that has precipitated at a
lower pH to prevent dissolution of metals with amphoteric properties – higher doses of lime are
added to the water, raising the pH to between 11 and 12. In the presence of higher pH additional
magnesium will precipitate and additional calcium will combine with silicates as well as sulfate to
further reduce the concentration of dissolved anions. While this process is commonly used to treat
air pollution control scrubber waters, it has not been used extensively in mine wastewater
applications. Additional carbon dioxide would be needed in with this process to lower the pH prior
to recycle/reuse at the tailings basin.
4.1.3.3 Ultra High Lime with Aluminum
4.2 Reverse Osmosis and other Membrane Technologies
4.2.1 Technology Description
4.2.2 Membrane Types
The most important component of any membrane treatment system is the semi-permeable membrane.
Three major types of membranes are commonly used, each having different engineering properties,
which are summarized in Table 7 (Aquatechnology.net).

RS29T 4-10
Table 7 Comparison of Membranes Types
Feature Cellulosic Aromatic Polyamide Thin Film Composite* Rejection of Organic L M H Rejection of Low Molecular Weight Organics M H H Water Flux M L H pH Tolerance 4-8 4-11 2-11 Temperature Stability Max 35 deg. C. Max 35 deg. C. Max 45 deg. C. Oxidant Tolerance (e.g., free chlorine) H L L Compaction Tendency H H L Biodegradability H L L Cost L M H
L = Low; M = Medium; H = High *Thin film composite type having polyamide surface layer
Of the three basic membrane types, cellulosic membranes have the lowest unit cost and are most
resistant to degradation by free chlorine. However, they have several limitations. Due to their
asymmetric structure, they are susceptible to compaction (collapsing of membrane pores under high
pressure) under high operating pressures especially at elevated temperatures. In addition, they are
also susceptible to alkaline hydrolysis, and biodegradation. The operating pH for these membranes is
4 to 8.
Aromatic polyamide membranes are more resistant to biodegradation and alkaline hydrolysis than
cellulosic membranes. The operating pH for these membranes is 4 to 11. Even though these
membranes are subject to compaction at high temperatures and pressures, they have the capacity to
withstand higher temperatures when compared to cellulosic membranes. The salt and organic
rejection characteristics of these membranes are also better than that of cellulosic membranes. The
principle limitation of these membranes is their susceptibility to degradation by oxidants such as free
chlorine. Ammonium ion can also degrade these membranes.
Thin film composite membranes comprise a thin, dense solute-rejecting film underlain by a porous
substructure. Thin film composite membranes offer similar advantages and disadvantages to
aromatic polyamide membranes. However, materials for the two layers can be selected to optimize
water flux and solute rejection, providing greater operational flexibility than other membrane types.

RS29T 4-11
4.2.3 Membrane Configurations Membrane treatment systems may be configured in a number of different ways, which offer several
potential advantages and disadvantages (Lipnizki, 2007):
• Plate-and-frame: Maintenance of these units is simple due to the nature of their assembly but
hydraulic flux across the membrane is limited by low specific surface area.
• Spiral-wound: Generally, these units have the lowest cost of installation and can be changed-
out easily. The modules can be designed to use turbulence to enhance hydraulic flux and
decrease membrane fouling. However, maintenance cleaning and backwashing of these units
can be more difficult.
• Hollow-fiber: This configuration offers the greatest packing densities due to high specific
surface area of the hollow fibers. The loose arrangements of the hollow fibers allows for
more frequent back-washing of the systems. Disadvantages of hollow fiber systems include
higher capital cost than spiral wound (similar to tubular systems) and potentially increased
operating costs.
• Tubular: This configuration offers enhanced resistance to fouling when operated under
turbulent influent conditions. The disadvantages of using a tubular module are high capital
costs (similar to the hollow fiber system) and high energy requirements.
4.2.4 Operation and Maintenance
4.2.5 Treatment of Acid Mine Drainage Using Reverse Osmosis
Treatment of acid mine drainage via reverse osmosis has been studied at several different sites (U.S.
EPA, 1973). While these studies focused on the removal of iron, aluminum, magnesium, and
calcium, the removal characteristics should be similar for nickel, copper, cobalt, and zinc due to their
similarity in size and charge to iron and aluminum. Additionally, the operation and maintenance
experience gained from these applications can also be applied to NorthMet. Membrane fouling due
to calcium sulfate precipitation was identified as the principle limiting factor in operation of these
systems. Neutrolosis, or blending of recycled brine into the influent stream, was used to reduce
membrane fouling. Pretreatment included filtration (10 μm), ultraviolet disinfection, and pH
adjustment. A summary of these early membrane treatment operations using reverse osmosis are
summarized in Table 8.

RS29T 4-12
Table 8 Summary of Reverse Osmosis Treatment of Mine Wastewater
Treatment Performance Site
Membrane
Type
Flux
(gal/ft2/day)
Recovery
(%) Pre-
Treatment
pH Parameter Influent
(mg/L) Effluent (mg/L)
Removal (%)
Iron 103.3 1.8 98.3
Calcium 111.7 2.7 97.6
Magnesium 36 0.8 97.7
Aluminum 36.3 1.1 96.9
Norton Spiral-wound, modified cellulose acetate
16.8 to 18.8 @ 600 psi
80 Sand Filter, 10 um cartridge filter
3.1-3.7
Sulfate 913.3 13.9 98.5
Iron 1,300 29 97.8
Calcium 530 9.6 98.2
Magnesium 420 7.6 98.2
Aluminum 320 5.0 98.4
Morgan-town
Spiral-wound, modified cellulose acetate
13.5 to 19.2 @ 400 to 600 psi
50 Sand Filter, 10 um cartridge filter
2.24-3.14
Sulfate 10,900 190 98.3
Iron 98 1 99
Calcium 186.7 1.4 99.3
Magnesium 56 0.6 98.9
Aluminum 33 1.0 96.9
Ebensburg Spiral-wound, modified cellulose acetate
7.4 (50oF) to 11.9 (77oF) @ 400 psi
84 Sand Filter, 10 um cartridge filter
3.1- 4.8
Sulfate 1,547 12.7 99.2
Iron 105.7 1.1 99
Calcium 150 0.8 99.5
Magnesium 109.3 1.7 98.4
Aluminum 13.7 0.5 96.3
Mocanaqua Spiral-wound, modified cellulose acetate
16.8 to 18.8 @ 600 psi
84 10 um filter with UV
4.3
Sulfate 843 7.0 99.2
Note: Results reported for average of multiple runs at Norton (6), Ebensburg (3), and Mocanaqua (3) Reference: U.S. EPA, 1973.
Based on the results summarized in Table 8, membrane treatment, in particular microfiltration or
ultrafiltration as pretreatment for either RO or nanofiltration, is likely capable of producing water
that would meet the process water quality targets. While these results do not include information on
heavier metals, it is expected that copper, nickel, zinc, and other metals heavier than iron would be
preferentially removed by membrane operations because of their larger molecular size. In a recent
study, copper was shown to be removed effectively by nanofiltration, especially in the presence of
sulfate (Ku, et. al., 2005)

RS29T 4-13
The operating pressures used in earlier demonstration tests were relatively high in comparison to
typical pressures used today. Pilot testing of membrane treatment technology with current membrane
configurations will help to provide additional input on the operating pressures required to achieve
similar results and would provide a brine stream that could be evaluated for chemical precipitation
treatment. After chemical precipitation, the remaining brine from an RO system would be
reincorporated into the treated water flow provided the combined concentrations of chloride and
other salts do not exceed the process water quality targets. If higher salt values than anticipated are
encountered, the brine could be disposed off-site, evaporated and crystallized on site, or recycled for
use as a salt product.
More recent work with the RO treatment process continues to show that this technology is feasible
for use in removing sulfate and other dissolved constituents in mine water. In South Africa, RO was
used to remove high concentrations of dissolved solids from mine water (Schoeman and Steyn,
2001). In this work, spiral wound RO elements were used to reduce the concentration of total
dissolved solids from approximately 4,000 mg/L to less than 120 mg/L, including reducing the
sulfate concentration from over 2,000 mg/L to less than 50 mg/L. Similarly, in Australia RO was
used in combination with lime treatment and bio-polishing to treat water from a uranium mine with
an initial pH in the range of 5 and initial sulfate concentrations over 16,000 mg/L (Topp, et. al.,
2005). After the initial precipitation processes, the feed water to the RO units at this facility
contained approximately 2,500 mg/L sulfate and 40 ug/L copper, which were reduced to less than 1
mg/L and 3 ug/L respectively.
4.2.6 Treatment of Mine Process Water using Nanofiltration In addition to being used to remove sulfate from sea water, as noted previously, nanofiltration has
also been used to treat sulfate laden mine process water. Water from a South African gold mine with
a pH of less than 4 and sulfate concentrations approaching 3,000 mg/L was treated using
nanofiltration (Visser, et. al., 2001). After adjusting the pH to near neutral, sulfate removal
efficiencies of between 95 and 99 percent were reported. Lower removal efficiencies were measured
at lower pH because a portion of the sulfate is present as the mono-valent HSO41-. Nanofiltration has
also been used in France to remove sulfate from water impacted by a flooded iron mine (Bertrand, et.
al., 1997). In this operation, sulfate concentrations approaching 1,800 mg/L were reduced to less
than 30 mg/L (~98 percent) using nanofiltration.

RS29T 4-14
4.3 Ion Exchange
4.3.1 Technology Description
The ion exchange process involves the reversible exchange of ions between an insoluble substance
and the wastewater. The insoluble substance is usually a synthetic organic ion exchange resin
composed of high-molecular-weight polyelectrolytes that can exchange their mobile ions for ions of
similar charge from the surrounding medium. Each resin has a distinct number of mobile ion sites
that set the maximum quantity of exchanges per unit of resin (www.remco.com).
Ion exchange reactions are stoichiometric and reversible. As an example, a resin with hydrogen ions
available for exchange will exchange those ions for nickel ions from solution. The reaction can be
written as follows:
2(R-SO3H) + NiSO4 => 2(R-SO3)Ni + H2SO4
R indicates the organic portion of the resin and SO3 is the immobile portion of the ion active group.
Two resin sites are needed for nickel ions with a plus 2 valence (Ni2+).
When compared to other wastewater treatment alternatives, ion exchange appears to have greater
flexibility. While most ion exchange resins are designed for removal of specific chemicals of
concern, for example metals, different resin types have the capability to remove various chemicals,
and more than one resin can be used in series. Specialty resins are also available that can selectively
bond with specific cations for their removal. In addition, ion exchange can be used with fluctuating
flow rates. However, this technology may be limited by high concentrations of total dissolved solids
(http://www.nesc.wvu.edu).
Ion exchange treatment does not result in the creation of a solid waste, so it does not lead to solids
disposal problems, like chemical precipitation, thus lowering the operational costs for the disposal of
residual metal solids (Kurniawan et al., 2006). However, the resin does need to be regenerated,
either at the site or at an off-site location, which results in a brine waste, which would need to be
managed, similar to a membrane treatment approach. To apply ion exchange treatment of mine
wastewater, appropriate pretreatment such as removal of suspended solids, removal of organic
compounds, and pH adjustment would likely be required.
Chemical removal capabilities of various resin types are described in further detail in the following
paragraphs.

RS29T 4-15
4.3.2 Types of Ion Exchange Resins Ion exchange resins can be divided into three broad categories: cation exchangers, anion exchangers
and chelating resins. Cation exchangers have positively charged mobile ions available for exchange,
anion exchangers have negatively charged mobile ions for exchange, and chelating resins have a high
degree of selectivity for heavy metals (www.remco.com). The cation exchangers can in turn be
either strong or weak acid cation exchangers, and similarly the anion exchangers can be either strong
or weak base anion exchangers. A brief review of the various resin types is included in the following
paragraphs. However, it should be noted that the potential functional groups of the various resin
categories are more varied than may be implied in this document. Ion exchange resin technology is a
continually evolving field and the available products varies significantly from one manufacturer to
another and over time as the quality and function of specific ion exchange resins are modified and
improved. The following discussion is not intended to provide details on all potentially available ion
exchange resins, but to provide a basic overview of the technology.
4.3.2.1 Strong Acid Cation Resins
4.3.2.2 Weak Acid Cation Resins
4.3.2.3 Strong Base Anion Resins
4.3.2.4 Weak Base Anion Resins
4.3.2.5 Chelating Resins
4.3.2.6 Specialty Resins
4.3.3 Ion Exchange for Acid Mine Drainage Treatment
Ion exchange technology has been applied successfully to remove copper and cobalt at the Soudan
underground mine (MDNR, 2001). Using a specialty resin, removal efficiencies of greater than
99 percent were achieved at a resin loading rate of 2 pounds per cubic foot. The water is pumped
through cartridge filters to remove aluminum hydroxide and silicate precipitate then through
activated carbon filters prior to passing through the ion exchange units. Two ion exchange cartridges
are used in a lead-lag configuration. The system treats wastewater at a flow rate of 9 to 15 gpm.
When the resin is exhausted, the canister is transported offsite for regeneration. The capital cost for
this system was approximately $50,000, with annual operation, maintenance and monitoring costs of
approximately $80,000.

RS29T 4-16
Because this system is in operation and treatment efficiencies are known, additional bench-scale
testing of this technology is not required at this time.
The GYP-CIX ion exchange process has also been developed to remove high concentrations of
sulfate in mine water. This process is reviewed in the Lorax Report (2003) and was evaluated for
treatment of mine water with high sulfate concentrations in South Africa (Schoemann and Steyn,
2001). This process uses two resin types in series to first remove sulfate and then remove the counter
cation, typically calcium. The two brine streams generated during the regeneration of these two steps
is combined to precipitate gypsum. Breaking the process of gypsum precipitation into multiple steps
provides some additional control over the process. However, the volume of gypsum produced is
increased significantly because of the additional chemicals -- primarily sulfuric acid and lime –
needed for the operations. The GYP-CIX operation has been reported to be capable of reducing TDS
and sulfate in mine water from 4,500 mg/L and 2,800 mg/L to less than 240 mg/L and 50 mg/L
respectively.
4.4 Constructed Wetland
4.4.1 Technology Description
The use of constructed wetlands to treat municipal and industrial wastewater streams has become a
widespread, conventional technology. As wastewater flows through a wetland, pollutants are
transformed or sequestered through various biological and geochemical reactions involving wetland
vegetation, sediments, and bacteria. Wetlands have been used predominantly to degrade organic
matter, capture suspended solids in storm water runoff, and adsorb or fix inorganic nutrients such as
nitrogen and phosphorus (ITRC, 2003). They have also been used extensively to treat metal- and
sulfate-laden mine water discharges, similar to the potential flows that may be generated at
NorthMet.
Wetlands are well suited for treating mine drainage because they are capable of transforming many
different parameters, most of which will be of potential concern at NorthMet, especially sub-surface
flow systems that provide an anaerobic environment and facilitate precipitation of metal sulfides
(Wieder, 1988). Wetland sediments can neutralize acid via dissolution of carbonate minerals in the
sediments and through the production of alkalinity via microbial decomposition of organic matter.
Wetlands are also capable of removing sulfate via microbial reduction to sulfide and subsequent
precipitation with metals such as iron. Many of the natural processes that occur in wetlands can also
be designed into bioreactors that perform essentially the same functions. Bioreactors generally

RS29T 4-17
require less space than constructed wetlands but require much more operation and maintenance to
provide the substrate and nutrients for the biological processes and to remove the accumulated solids
(U.S. EPA, 2006). This treatment option will also be considered for NorthMet. Separate cost
estimates for a sub-surface flow constructed wetland system and a bioreactor system are included in
Appendix F and discussed in the cost evaluation portion of Section 5.
A wetland treatment system will be incorporated into the wastewater treatment program for Mine
Site process water that is generated after closure of the Mine Site. As described in the Closure Plan
(RS52) filling of the East Pit during the mining operations will create approximately 160 acres of
land that will be available for construction of new wetlands. These wetlands will be installed with a
subsurface drainage system that will allow the area to be used as a constructed wetland treatment
system that will provide additional treatment of Mine Site process water effluent from the WWTF
beginning in Year 21.
4.4.2 Wetland Removal Mechanisms
4.4.2.1 Uptake of Metals by Plants
4.4.2.2 Ion Exchange/Adsorption of Metals onto Sediment
4.4.2.3 Formation of Insoluble Metal Oxides
Metal oxide surfaces within the wetland substrate can also act as adsorptive sites for metal cations
(Tarutus, et al., 1992). In the presence of oxygen, some metals, such as iron and manganese, form
insoluble metal oxides. Such oxidation can occur near the sediment-water interface in a surface flow
wetland, or in the rhizosphere of emergent wetland vegetation. While zinc, nickel, cobalt, and
copper do not form insoluble oxides under typical environmental conditions, these metals can bind to
iron and manganese oxide surfaces in a wetland environment in the same way they would bind to
iron oxides in a chemical precipitation system (Dzombak and Morel, 1990). However, in a wetland
environment, sorption to metal oxide surfaces is more sensitive to changes in substrate redox state,
and reducing conditions can result in the release of sorbed metals (Patrick and Turner, 1968).
4.4.2.4 Formation of Insoluble Metal Sulfides in Wetlands
4.4.3 Wetland Treatment of Mine Drainage-Case Studies

RS29T 5-1
5.0 Evaluation of Treatment Options for Mine Site Wastewaters
Brief descriptions and evaluations of cost, implementability, and effectiveness for the four potential
technologies for the treatment of Mine Site wastewater are summarized in Table 12. The treatment
alternatives are compared in the following sections on an individual basis. However, when
appropriate, a discussion of potential combinations of alternatives is included. For complex
wastewaters such as those expected at the Mine Site it is not uncommon for wastewater treatment to
consist of a combination (or treatment train) of two or more of these technologies in series. Using
multiple technologies in series also helps to emphasize the positive aspects of each technology and
generally improves the overall treatment operation.
Treatment of Process Water at the Mine Site is the final step in a management system that will
include prevention and minimization of Process Water flows through control of mining operations,
segregation of waste rock into multiple categories, and staged construction of waste rock stockpile
liners and cover systems concurrent with mining operations. These operations are described in detail
in other RS documents including, but not limited to RS21, RS22, RS23, RS30, and RS49.
As noted in Table 2, the predicted quality of wastewater produced at the Mine Site varies
significantly between the pit discharge and the stockpile drainage, and will also vary among
stockpiles due to the segregation of waste rock according to the potential to produce acid rock
drainage (ARD) and leach heavy metals. See RS21 (Figure 1) for additional detail on management
of the various Process Water flows at the Mine Site. For the evaluation of potential wastewater
treatment alternatives, it is assumed that the Mine Site process water will be pumped into one of two
equalization (EQ) ponds (Stage 1 Pond and Stage 2 Pond) to produce two WWTF inflow streams.
The first inflow stream (Stage 1) would include process water runoff and drainage from the
Category 3 and Category 4 waste rock stockpiles. Stage 1 inflow is generally characterized as low
pH (pH<5) with relatively high concentrations of dissolved metals and salts. The second inflow
stream (Stage 2) would be comprised of Category 1/2 stockpile process water runoff and liner
drainage, mine pit dewatering water, and process water runoff from the haul roads and Rail Transfer
Hopper area. Stage 2 is generally characterized as near neutral pH with lower concentrations of
dissolved metals and salts. Table 13 provides a summary of the estimated water quality and quantity
for inflows to the Stage 1 and Stage 2 EQ Ponds. Separation of the multiple sources of wastewater
allows them to be collected in separate equalization ponds and combined into two treatment influent

RS29T 5-2
streams, thus allowing the consideration of multiple treatment operations. Due to the water quality
variability of the waste streams over time, inflow sources to the Stage 1 and Stage 2 EQ Pond could
also be changed over time as necessary to optimize different treatment operations for each stage.

RS29T 5-3
Table 12. Summary of Screening Evaluation of Treatment Technologies for Mine Site Process Water
Approx. Cost (Detailed estimates in Appendix F)
Technology Implementability Advantages Disadvantages Residuals Generated Capital Annual O&M
Net Present Value
(20 yrs @ 5%) Chemical Precipitation
Hydroxide Precipitation
-Requires small footprint -Residues are easily managed.
-Simple process control - Well-established technology - Inexpensive chemicals -Co-precipitation with iron oxides
-Less effective for zinc removal, simultaneous removal of certain metals may not be possible
Metal Hydroxide Sludge
$13.2 million $776,000 $27.4 million
Soluble Sulfide Precipitation - Requires small footprint - Residues are easily managed
- Effective removal of most metals to low concentrations -Metal sulfides may be easier to recycle into hydrometallurgical process
- Requires control measures for H2S generation
Metal Sulfide Sludge
$13.6 million $788,000 $28.1 million
Carbonate Precipitation -Requires small footprint - Residues are easily managed
- Simple process control
- Ineffective for removal of any metals except zinc, iron, and manganese - Soda ash is expensive, and subject to large price fluctuations - Large sludge volumes produced
Metal Carbonate Sludge
$12.5 million $1.3 million $34.8 million

RS29T 5-4
Approx. Cost (Detailed estimates in Appendix F)
Technology Implementability Advantages Disadvantages Residuals Generated Capital Annual O&M
Net Present Value
(20 yrs @ 5%) Iron Sulfide Precipitation -Requires small
footprint -Requires on-site production of FeS
-Less potential for residual sulfide than soluble sulfide precipitation
- Nickel removal is ineffective - Requires larger reagent dose than soluble sulfide precipitation - Generates more sludge than soluble sulfide precipitation - Metal sulfide precipitates managed as hazardous waste
Metal (Iron) Sulfide Sludge
$13.9 million $1.4 million $38.0 million
Calcium Sulfide Precipitation - Requires small footprint - Requires onsite generation of CaS
- Less potential for residual sulfide than soluble sulfide precipitation - Required CaS dose is less than for FeS precipitation
- Metal sulfide precipitates managed as hazardous waste
Metal Sulfide Sludge
$13.9 million $920,000 $30.4 million
Membrane Treatment Nanofiltration-Stage 1 -Requires small
footprint - Requires management of brine
-Selectively removes multivalent ions, resulting in lower TDS brine
-Membrane subject to fouling - Pre-treatment required
Metal hydroxide and gypsum sludge
$15.2 million $1.2 million $40.1 million
Nanofiltration-Stage 2 -Requires small footprint - Requires management of brine
-Selectively removes multivalent ions, resulting in lower TDS brine
-Membrane subject to fouling - Pre-treatment required
Metal hydroxide and gypsum sludge
$13.2 million $1.4 million $37.0 million

RS29T 5-5
Approx. Cost (Detailed estimates in Appendix F)
Technology Implementability Advantages Disadvantages Residuals Generated Capital Annual O&M
Net Present Value
(20 yrs @ 5%) Reverse Osmosis:
-Requires small footprint - Requires management of brine
-Can remove metals and dissolved solids to very low concentrations for excellent water quality.
-Membrane subject to fouling by organics, calcium sulfate precipitation. -Performance subject to presence of divalent anions (e.g., sulfate, nitrate). -Membrane cleaned on-site, generates waste stream. -Extensive pretreatment likely required
Rejected Brine with Sulfate, Metals
$24.5 million $2.3 million $64.2 million
Ion Exchange Ion Exchange
-Requires small footprint - Spent resin and activated carbon require management
-No potentially hazardous materials are added to the water.
-Resin subject to fouling by organic compounds, Al, Fe, Mn. -Sensitive to interference from chelating agents and fluctuations in influent concentration -Pretreatment pH adjustment and carbon filtration likely required
Metal hydroxide sludge
$21.2 million $1.6 million $48.6 million
Biological Treatment

RS29T 5-6
Approx. Cost (Detailed estimates in Appendix F)
Technology Implementability Advantages Disadvantages Residuals Generated Capital Annual O&M
Net Present Value
(20 yrs @ 5%)
Constructed Wetland
-Requires large footprint - No residual
-Metals are sequestered as stable sulfide compounds in the sediment -More metals storage capacity is produced as the wetland ages -No secondary waste stream generated
-Land-intensive technology -Hydraulic/hydrologic limitations -Requires maturation period for best metals removal results
No residuals
$54.6 million
$488,000
$72.8 million
Bioreactor Treatment – Stage 1 -Requires handling of ethanol substrate
-Sulfate is reduced to sulfide by bacteria, then precipitated with iron -Metals are removed as metal sulfide precipitates
-Produces a biological sludge in addition to chemical sludge - Requires large inputs of ethanol and iron - Control of a biological system can be difficult
Biological sludge, metal sulfides
$13.6 million $1.8 million $42.9 million
Bioreactor Treatment – Stage 2 -Requires handling of ethanol substrate
-Sulfate is reduced to sulfide by bacteria, then precipitated with iron -Metals are removed as metal sulfide precipitates
-Produces a biological sludge in addition to chemical sludge - Requires large inputs of ethanol and iron - Control of a biological system can be difficult
Biological sludge, metal sulfides
$18.9 million $1.0 million $38.3 million

RS29T 5-7
Table 13 Stage 1 and Stage 2 Equalization Pond Inflow Predicted Water Quality
Year 1 Year 5 Year 10 Year 15 Year 20Parameter units Stage 1 Stage 2 Stage 1 Stage 2 Stage 1 Stage 2 Stage 1 Stage 2 Stage 1 Stage 2 Flow gpm 102 377 209 999 233 1,128 189 702 177 1,091Hardness mg/L 629 66 1,565 155 2,740 137 4,083 305 2,825 217Fluoride (F) mg/L 1.90 0.23 8.56 1.22 17.9 2.70 30.1 4.97 37.7 3.29Chloride (Cl) mg/L 10.4 1.13 27.7 5.23 27.1 5.00 14.1 1.12 14.4 1.20Sulfate (SO4) mg/L 791 36 2,914 118 5,026 120 7,276 352 5,020 226Aluminum (Al) mg/L 2.55 0.23 16.3 0.28 38.7 0.29 53.9 0.48 33.9 0.32Arsenic (As) mg/L 0.22 0.009 0.39 0.04 0.39 0.031 0.71 0.10 0.56 0.07Barium (Ba) mg/L 0.15 0.025 0.23 0.028 0.23 0.028 0.30 0.052 0.28 0.036Beryllium (Be) mg/L 0.0018 0.00027 0.0020 0.00029 0.0027 0.00032 0.0027 0.00036 0.0026 0.00029Boron (B) mg/L 0.50 0.07 0.92 0.12 0.88 0.11 1.07 0.17 1.10 0.14Cadmium (Cd) mg/L 0.0069 0.00037 0.0063 0.00046 0.010 0.00045 0.010 0.00029 0.0073 0.00026Calcium (Ca) mg/L 179 15.9 396 42.5 375 36.8 622 91 541 62.4Chromium (Cr) mg/L 0.0039 0.00093 0.0057 0.0011 0.0057 0.0011 0.0049 0.0011 0.0070 0.0011Cobalt (Co) mg/L 0.20 0.0140 1.82 0.017 10.9 0.027 17.1 0.044 10.6 0.0265Copper (Cu) mg/L 0.097 0.016 0.34 0.023 11.4 0.164 27.0 0.343 39.0 0.206Iron (Fe) mg/L 29.4 1.49 74.0 1.94 82.4 1.61 106 0.29 92.2 0.28Lead (Pb) mg/L 0.010 0.0009 0.038 0.0033 0.040 0.0028 0.060 0.008 0.051 0.0053Magnesium (Mg) mg/L 44.6 6.50 141 12.0 438 11.0 615 19.1 359 15.0Manganese (Mn) mg/L 0.89 0.073 6.22 0.11 20.1 0.11 29.5 0.20 16.4 0.13Mercury (Hg) mg/L 3.17E-05 7.95E-06 3.30E-05 6.59E-06 3.62E-05 7.18E-06 4.94E-05 1.29E-05 4.79E-05 7.80E-06Molybdenum mg/L 0.013 0.0032 0.021 0.0043 0.021 0.0041 0.016 0.0036 0.027 0.0042Nickel (Ni) mg/L 2.99 0.22 26.4 0.22 138 0.37 254 0.54 176 0.314Phosphorous mg/L 0.094 0.00101 0.15 0.010 0.13 0.0069 0.22 0.026 0.18 0.017Potassium (K) mg/L 24.5 2.24 40.1 3.87 36.1 3.59 56.7 9.3 48.3 5.77Selenium (Se) mg/L 0.0074 0.0016 0.010 0.0020 0.010 0.0019 0.009 0.0020 0.013 0.0020Silica (SiO2) mg/L 3.90 0.063 5.15 0.43 3.39 0.30 6.48 1.15 5.80 0.74Silver (Ag) mg/L 0.0027 0.00070 0.0043 0.00087 0.0043 0.00086 0.0031 0.00077 0.0053 0.00087Sodium (Na) mg/L 97 3.0 358 34.8 255 25.4 524 93 451 59Thallium (Tl) mg/L 0.0044 0.0013 0.0072 0.0016 0.0072 0.0016 0.0041 0.0012 0.0088 0.0015Zinc (Zn) mg/L 2.21 0.102 7.82 0.13 12.3 0.12 14.8 0.052 10.3 0.041Nitrate (NO3) mg/L 0.32 0.073 0.76 0.16 0.73 0.15 0.11 0.000018 0.079 0.000012Ammonia (NH4) mg/L 0.32 0.073 0.76 0.16 0.73 0.15 0.11 0.000018 0.079 0.000012
RS29T 5-8
5.1 Effectiveness Effectiveness is based on the ability of a treatment technology to address all of the parameters of
concern at NorthMet. With the exception of carbonate precipitation, all of the technologies reviewed
in Section 4 have the potential to be effective in treating the parameters of potential concern in the
process water from the Mine Site. A membrane or a wetland treatment system could be designed to
treat all of the parameters of concern simultaneously. While this would be effective, and relatively
simple to operate, it may not necessarily be efficient. Chemical precipitation and ion exchange can
be used to remove one or more specific parameters of concern, for example metals or sulfate, but
would likely require a multi-step process to be effective in treating all of the parameters of concern.
For example, in the case of chemical precipitation one stage may be needed to remove metals with a
second stage to remove sulfate. This would increase the complexity of the treatment operation, but
could also potentially reduce the operating costs. Complexity is addressed in the following
discussion of implementability and costs for various alternatives.
This evaluation confirms that the pre-screening of alternatives that was conducted in the development
of the SOW for this evaluation selected technologies that can all be designed to be effective. Thus,
the selection of a preferred alternative is reduced to consideration of the implementability and the
cost for each particular option. These factors are discussed in the following paragraphs.
5.2 Implementability
5.2.1 Chemical Precipitation
Implementation of chemical precipitation for the Mine Site process water would likely require a
multi-stage system to be able to achieve the desired process water quality targets. Using chemical
precipitation, metals would likely be removed as a hydroxide precipitate or as a co-precipitate with
iron hydroxides. Sulfate would be removed as a gypsum precipitate. If additional sulfate removal is
required, a chemical treatment system could be upgraded with the addition of aluminum salts using
an ultra high lime with aluminum process as described in Section 4.1.3.3 of this report. The
concentrations of other dissolved solids, for example silica, phosphorous, or nitrate would likely be
reduced in the precipitation process. Calcium, which would be added to the process, could be
removed in a final neutralization step with carbon dioxide or soda ash.
Chemical precipitation may require filtration as a final polishing step and would require solids
handling and management, most likely incorporating the solids into the hydrometallurgical process.

RS29T 5-9
The implementation of a chemical precipitation treatment system is a viable option at the Mine Site.
The chemical precipitation treatability testing conducted for this evaluation (Appendix C)
demonstrated that with the exception of mercury, all the parameters of concern at NorthMet can be
removed using lime with an HDS operating configuration. As noted in Section 4, chemical
precipitation at higher influent concentrations produce similar effluent concentrations (with greater
removal efficiencies) provided adequate reaction time is provided, because the final concentrations
are driven by solubility limits for the precipitates formed (U.S. EPA and U.S. DOE, 1997). The
footprint for a chemical precipitation process at the Mine Site would be relatively small, most likely
less than 10 acres. Power, chemicals, and other inputs for a chemical precipitation plant at the Mine
Site can be delivered, and road access between the Mine Site and the Plant Site could accommodate
the transportation of wastewater solids for reuse or disposal. A chemical treatment system can also
be designed with two or more units in parallel to deal with variable incoming flow rates both
seasonally and over the lifetime of the project.
5.2.2 Membrane Treatment
5.2.3 Ion Exchange
5.2.4 Constructed Wetland
5.2.4.1 Hydraulic Design
5.2.4.2 Required Sulfate Reduction Rate
5.2.4.3 Carbon Utilization Rates
5.2.4.4 NorthMet Wetland Size Requirements
A constructed wetland could be used as a secondary treatment step to remove additional sulfate after
the use of a chemical precipitation step to remove a majority of the sulfate. Assuming a sulfate input
of 25,000 pounds per day for the Mine Site wastewater based on an average annual flow of 1,300
gpm and a sulfate concentration of 540 mg/L after lime treatment of the Stage 1 flow and blending of
the Stage 1 and Stage 2 flows, the corresponding carbon demands required to meet a 250 mg/L
sulfate discharge criterion would be approximately 110,000 moles C/day. Assuming a conservative
photosynthetic carbon input of 50 moles C/m2/yr, the required size of a wetland treatment system at
the Mine Site would be approximately 200 acres. This would represent a significant additional land
requirement for the project, and would not likely fit within the currently available land.
RS29T 5-10
In lieu of a constructed wetland, a bioreactor could be constructed to remove sulfate. The
combination of biological sulfate reduction with chemical precipitation also provides an opportunity
for excess sulfide generated by sulfate reducing bacteria to be used to promote metal precipitation.
In this configuration, a sulfate reducing bioreactor or a portion of the treated wastewater from a
constructed wetland could be recycled into the chemical precipitation process to provide soluble
sulfide that should enhance the metal precipitation process.
While a constructed wetland has the potential to be a very effective treatment technology for the
Mine Site process water, it is not likely to be implementable during the operation of the mine, due to
the size requirements. Although a constructed wetland can effectively treat the parameters of
potential concern in the Mine Site process water, the land requirements for this type of system are
likely prohibitive.
A constructed wetland is, however, considered a potentially viable technology for removing
additional metals and sulfate from the smaller volume of process water flows that are predicted for
after the closure of the Mine Site. This is described in greater detail in RS52.
5.3 Cost
5.3.1 Chemical Precipitation
Tables F-1 through F-5 are cost estimates for treatment of the Mine Site process water using five
different chemical precipitation methods: hydroxide, sulfide, carbonate, ferrous sulfide and calcium
sulfide. Hydroxide precipitation is least expensive chemical precipitation technology, with a net
present value (NPV) of $27.4 million (20 years at 5%). Sulfide precipitation and carbonate
precipitation had NPV costs of $28.1 million and $34.8 million, respectively. While the capital cost
for the three technologies is similar ($12.5 to $13.6 million), annual operating costs vary widely
($776,000, $788,000, and $1.3 million for hydroxide, sulfide, and carbonate precipitation,
respectively.
The estimated NPV cost for insoluble sulfide precipitation via ferrous sulfide is approximately
$38 million, assuming four times the required stoichiometric FeS dose as indicated in the literature.
The subsequent increase in sludge generation also increases annual costs. NPV cost for calcium
sulfide precipitation is about $30.4 million, due to the roughly stoichiometric calcium sulfide dose.

RS29T 5-11
Metal recovery costs are not considered in this evaluation as all of the solid residues will be disposed
in the hydrometallurgical residue cells. Metal recovery could be included in any or of these
processes, which could be recycled into the hydrometallurgical process. For any of these
technologies, a metal-recovery step would likely focus on collecting the metals before moving on to
precipitate most of the sulfate as gypsum. This would mean minimizing the addition of calcium in
the first step to inhibit gypsum precipitation, which would favor sulfide precipitation over other
technologies.
5.3.2 Membrane Treatment
5.3.3 Ion Exchange
5.3.4 Constructed Wetland
5.4 Recommended Alternative Based on the comparative evaluation of potential treatment technologies described above, a multi-
technology approach is recommended for the treatment of the Mine Site process water. Chemical
precipitation treatment will be used to remove metals and sulfate. However, given the limitation of
chemical precipitation as gypsum to reduce sulfate to the process water quality target, nanofiltration
will be used to concentrate sulfate in a brine stream prior to precipitation. Blending the permeate
stream with the treated water from the chemical precipitation operations would produce a combined
flow that with limited exceptions will meet the conservative process water quality targets throughout
the operating life of the Mine Site.
As noted in Section 4, chemical precipitation has been used to reduce concentrations of metals and
sulfate in mine waters, including highly contaminated waters from the Berkeley Pit (U.S. EPA and
U.S. DOE, 1997). Similarly, nanofiltration has been used to successfully reduce the concentrations
of dissolved salts in mine water at several sites. The concept of combining these technologies to
treat mine water has also been applied to treat water from a former mine pit in New Mexico (Kuipers,
2002). The combination of these technologies offers flexibility of operation and the capacity to treat
the range characteristics expected in all of the Mine Site process water flows.
Nanofiltration will be used to treat the Stage 2 process water flows with high volume and relatively
low concentrations of metals and sulfate including mine pit process water, runoff from the working
areas of the Mine Site, and drainage from the Category 1/2 stockpile. These flows generally have a
neutral pH and as noted in Table 2, the concentrations metals in these flows are near the process

RS29T 5-12
water quality targets while the concentration of sulfate is generally too low to remove sulfate as
gypsum. Concentrating this stream will provide a clean permeate and a brine stream with qualities
similar to the anticipated Stage 1 flow (drainage from the Category 3 Waste Rock stockpile,
Category 3 Lean Ore stockpile, Category 4 Waste Rock stockpile and the Lean Ore surge pile).
Pretreatment prior to nanofiltration will include filtration using sand filters or a combination of micro
or ultrafiltration membranes. Anti-scalants would also be added, as necessary, to condition the feed
to the nanofiltration membranes and optimize operations (minimize operating pressures and
membrane cleaning events). The brine from the nanofiltration operation as well as the Stage 1
drainage would then be treated using a two-stage chemical precipitation operation.
The Wastewater Treatment Facility (WWTF) will consist of two parallel units, which will allow the
system to be built in stages and will allow the system operating capacity to increase and decrease
with time as the volume of flow changes throughout the process of mining and filling the pits. At the
maximum extent, the WWTF will occupy approximately 5 acres. The plant will be located in the
southwest portion of the Mine Site, near the Central Pumping Station (CPS) that will be used to
convey treated Mine Site process water to the tailings basin. A conceptual layout of the WWTF is
shown in Figure 4. A conceptual flow-diagram of the wastewater treatment system is shown on
Figure 5. The following paragraphs describe the preliminary conceptual design details for the
individual process units. Final sizing of process units and pumps and selection of materials of
construction for all of the process units will be completed during the detailed design phase of the
project.

RS29T 5-13
5.4.1 Flow Equalization
5.4.2 Nanofiltration Pre-Treatment
5.4.3 Nanofiltration Membrane Unit
5.4.4 Chemical Addition and Rapid Mixing
5.4.5 Coagulation and Flocculation
5.4.6 Clarification (Settling)
5.4.7 Recarbonation
5.4.8 Process Monitoring and Control
5.5 Potential Treatment System Performance As noted in Section 3, the goal of the WWTF at the Mine Site will be to produce a treated effluent
that will not adversely impact the operation of the Beneficiation Plant or the subsequent
hydrometallurgical processes at the Plant Site. In addition, the objective of wastewater treatment will
be to achieve the process water quality targets listed in Table 4. These process water quality targets
have been conservatively established based on in-stream water quality standards for the Partridge and
Embarrass Rivers and the protection of groundwater. These values have been used because the
Treated Water Pipeline will cross several streams within the Partridge River watershed between the
Mine Site and the Plant Site and also because these values provide very conservative treatment goals
that will help to maintain the long-term water quality of the water in the Tailings Basin, which will
eventually be returned to the mine pit.
Estimates of the potential WWTF effluent quality are listed in Table 14 along with the water quality
process targets. The basis for these estimates is provided in Appendix G. These values show that, on
an annual average basis, WWTF should be capable of achieving the process water quality targets for
most of the parameters of concern with limited exceptions that may require enhanced chemical
treatment.
The effluent predictions are based on the annual average flows and use the low flow estimates,
because the low flow scenario results in the highest potential influent concentrations to the WWTF.
Because the WWTF will be sized to accommodate the high flow conditions, the plant will have
additional retention time in all the process units that could facilitate improved performance.

RS29T 5-14
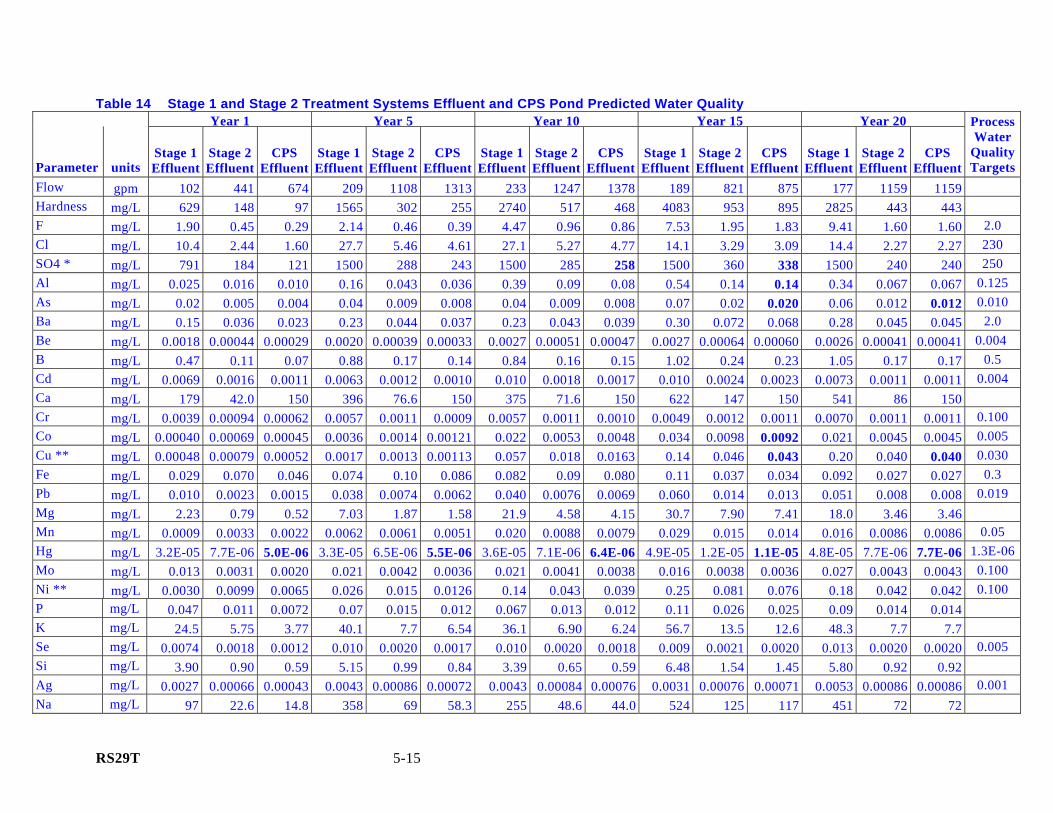
RS29T 5-15
Table 14 Stage 1 and Stage 2 Treatment Systems Effluent and CPS Pond Predicted Water Quality Year 1 Year 5 Year 10 Year 15 Year 20
Parameter units Stage 1 Effluent
Stage 2 Effluent
CPS Effluent
Stage 1 Effluent
Stage 2 Effluent
CPS Effluent
Stage 1 Effluent
Stage 2 Effluent
CPS Effluent
Stage 1 Effluent
Stage 2 Effluent
CPS Effluent
Stage 1 Effluent
Stage 2 Effluent
CPS Effluent
Process Water
Quality Targets
Flow gpm 102 441 674 209 1108 1313 233 1247 1378 189 821 875 177 1159 1159 Hardness mg/L 629 148 97 1565 302 255 2740 517 468 4083 953 895 2825 443 443 F mg/L 1.90 0.45 0.29 2.14 0.46 0.39 4.47 0.96 0.86 7.53 1.95 1.83 9.41 1.60 1.60 2.0 Cl mg/L 10.4 2.44 1.60 27.7 5.46 4.61 27.1 5.27 4.77 14.1 3.29 3.09 14.4 2.27 2.27 230 SO4 * mg/L 791 184 121 1500 288 243 1500 285 258 1500 360 338 1500 240 240 250 Al mg/L 0.025 0.016 0.010 0.16 0.043 0.036 0.39 0.09 0.08 0.54 0.14 0.14 0.34 0.067 0.067 0.125 As mg/L 0.02 0.005 0.004 0.04 0.009 0.008 0.04 0.009 0.008 0.07 0.02 0.020 0.06 0.012 0.012 0.010 Ba mg/L 0.15 0.036 0.023 0.23 0.044 0.037 0.23 0.043 0.039 0.30 0.072 0.068 0.28 0.045 0.045 2.0 Be mg/L 0.0018 0.00044 0.00029 0.0020 0.00039 0.00033 0.0027 0.00051 0.00047 0.0027 0.00064 0.00060 0.0026 0.00041 0.00041 0.004 B mg/L 0.47 0.11 0.07 0.88 0.17 0.14 0.84 0.16 0.15 1.02 0.24 0.23 1.05 0.17 0.17 0.5 Cd mg/L 0.0069 0.0016 0.0011 0.0063 0.0012 0.0010 0.010 0.0018 0.0017 0.010 0.0024 0.0023 0.0073 0.0011 0.0011 0.004 Ca mg/L 179 42.0 150 396 76.6 150 375 71.6 150 622 147 150 541 86 150 Cr mg/L 0.0039 0.00094 0.00062 0.0057 0.0011 0.0009 0.0057 0.0011 0.0010 0.0049 0.0012 0.0011 0.0070 0.0011 0.0011 0.100 Co mg/L 0.00040 0.00069 0.00045 0.0036 0.0014 0.00121 0.022 0.0053 0.0048 0.034 0.0098 0.0092 0.021 0.0045 0.0045 0.005 Cu ** mg/L 0.00048 0.00079 0.00052 0.0017 0.0013 0.00113 0.057 0.018 0.0163 0.14 0.046 0.043 0.20 0.040 0.040 0.030 Fe mg/L 0.029 0.070 0.046 0.074 0.10 0.086 0.082 0.09 0.080 0.11 0.037 0.034 0.092 0.027 0.027 0.3 Pb mg/L 0.010 0.0023 0.0015 0.038 0.0074 0.0062 0.040 0.0076 0.0069 0.060 0.014 0.013 0.051 0.008 0.008 0.019 Mg mg/L 2.23 0.79 0.52 7.03 1.87 1.58 21.9 4.58 4.15 30.7 7.90 7.41 18.0 3.46 3.46 Mn mg/L 0.0009 0.0033 0.0022 0.0062 0.0061 0.0051 0.020 0.0088 0.0079 0.029 0.015 0.014 0.016 0.0086 0.0086 0.05 Hg mg/L 3.2E-05 7.7E-06 5.0E-06 3.3E-05 6.5E-06 5.5E-06 3.6E-05 7.1E-06 6.4E-06 4.9E-05 1.2E-05 1.1E-05 4.8E-05 7.7E-06 7.7E-06 1.3E-06 Mo mg/L 0.013 0.0031 0.0020 0.021 0.0042 0.0036 0.021 0.0041 0.0038 0.016 0.0038 0.0036 0.027 0.0043 0.0043 0.100 Ni ** mg/L 0.0030 0.0099 0.0065 0.026 0.015 0.0126 0.14 0.043 0.039 0.25 0.081 0.076 0.18 0.042 0.042 0.100 P mg/L 0.047 0.011 0.0072 0.07 0.015 0.012 0.067 0.013 0.012 0.11 0.026 0.025 0.09 0.014 0.014 K mg/L 24.5 5.75 3.77 40.1 7.7 6.54 36.1 6.90 6.24 56.7 13.5 12.6 48.3 7.7 7.7 Se mg/L 0.0074 0.0018 0.0012 0.010 0.0020 0.0017 0.010 0.0020 0.0018 0.009 0.0021 0.0020 0.013 0.0020 0.0020 0.005 Si mg/L 3.90 0.90 0.59 5.15 0.99 0.84 3.39 0.65 0.59 6.48 1.54 1.45 5.80 0.92 0.92 Ag mg/L 0.0027 0.00066 0.00043 0.0043 0.00086 0.00072 0.0043 0.00084 0.00076 0.0031 0.00076 0.00071 0.0053 0.00086 0.00086 0.001 Na mg/L 97 22.6 14.8 358 69 58.3 255 48.6 44.0 524 125 117 451 72 72
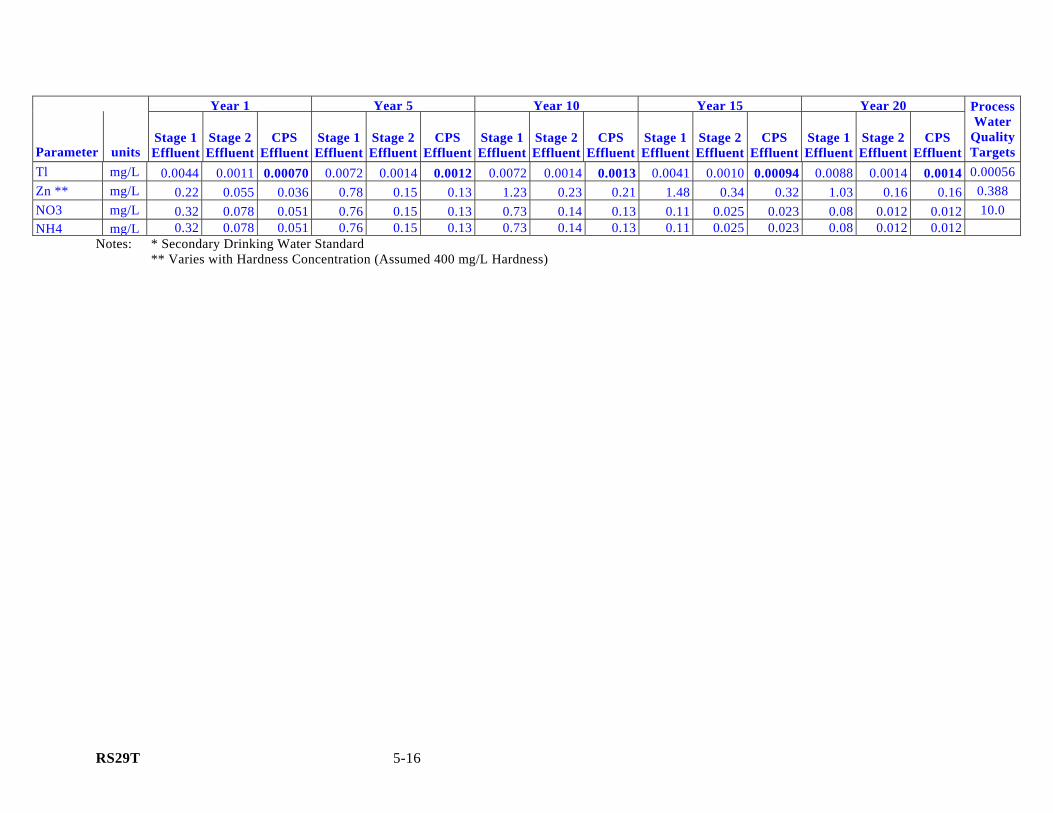
RS29T 5-16
Year 1 Year 5 Year 10 Year 15 Year 20
Parameter units Stage 1 Effluent
Stage 2 Effluent
CPS Effluent
Stage 1 Effluent
Stage 2 Effluent
CPS Effluent
Stage 1 Effluent
Stage 2 Effluent
CPS Effluent
Stage 1 Effluent
Stage 2 Effluent
CPS Effluent
Stage 1 Effluent
Stage 2 Effluent
CPS Effluent
Process Water
Quality Targets
Tl mg/L 0.0044 0.0011 0.00070 0.0072 0.0014 0.0012 0.0072 0.0014 0.0013 0.0041 0.0010 0.00094 0.0088 0.0014 0.0014 0.00056 Zn ** mg/L 0.22 0.055 0.036 0.78 0.15 0.13 1.23 0.23 0.21 1.48 0.34 0.32 1.03 0.16 0.16 0.388 NO3 mg/L 0.32 0.078 0.051 0.76 0.15 0.13 0.73 0.14 0.13 0.11 0.025 0.023 0.08 0.012 0.012 10.0 NH4 mg/L 0.32 0.078 0.051 0.76 0.15 0.13 0.73 0.14 0.13 0.11 0.025 0.023 0.08 0.012 0.012
Notes: * Secondary Drinking Water Standard ** Varies with Hardness Concentration (Assumed 400 mg/L Hardness)

RS29T 5-17
Parameters that could potentially exceed these targets and potential plans to mitigate these values, if
necessary, include:
• Sulfate – The primary contribution of sulfate to the Mine Site process water is from
Category 3 and Category 4 stockpiles. The drainage from the Category 3 and 4 stockpiles is
proposed to be routed to the Stage 1 EQ Pond and will undergo chemical precipitation
treatment. Concentrating the sulfate in the Stage 2 flows prior to chemical precipitation will
improve the overall effectiveness of the WWTF and provide a permeate that when blended
with the treated stream from the chemical precipitation unit will achieve the process water
quality targets in all years modeled except Year 15. Given the variability of the
concentration of sulfate in Stage 1 and Stage 2 flows, the effluent estimate for sulfate is
potentially sensitive to significant changes in the ratio between these flows as well as the
concentration of sulfate in any flow. The values used in this evaluation, however, are
conservative, and the proposed treatment operation is capable of treating a wide range of
potential volumes and concentrations. For example, in Year 15 when the estimated flows to
Stage 2 decrease, a portion of the Stage 1 flows could be routed into Stage 2 to concentrate
more of the mass flow in Stage 1 and provide additional permeate in Stage 2.
• Metals (Aluminum, Arsenic, Cobalt, and Copper) – The primary contributor of these
parameters to the Mine Site process water is also from Category 3 and Category 4 stockpiles.
The predicted effluent values for these parameters are close to the process water quality
targets using conservative removal percentages from the treatability study. Additional
removal of these parameters is anticipated using the HDS process, as demonstrated in the
absolute values obtained in the treatability study (Table 9 in Attachment C2), which showed
all these parameters below the process water quality targets. If necessary, additional
coagulation and flocculation time, or the addition of iron salts to the process would improve
removal efficiencies. No other process modification would be required.
• Mercury –Mercury will likely exceed the process water quality target. However, this water
will be pumped to the tailings basin where additional mercury removal is anticipated due to
exposure to the NorthMet tailings. No other process modifications are anticipated to remove
additional mercury.
• Thallium – The analytical results from several sources used in the prediction of the influent
water quality to the WWTF reported thallium as non-detect at values above the process water
quality target. Thus the reported value is likely a maximum value. At this time, thallium is

RS29T 5-18
not expected to be a concern, however, additional analysis of input flows will be needed to
confirm the actual inputs and, if necessary, evaluate removal efficiencies using the proposed
unit operations.
The ability of the WWTF to achieve the level of performance established by the process water
quality targets will be monitored during the operation of the facility. If necessary, improvements to
the process can be developed and/or additional technologies can be added to achieve treatment
objectives.
5.6 Solid Waste Management Plan A portion of the solids removed from the Stage 1clarifier will be returned to the rapid mix tank at the
beginning of the chemical precipitation treatment process to promote crystal formation. The
remaining solids will be conveyed to a sludge thickening unit and then pumped to a filter press
operation where excess liquids will be removed prior to being returned to the influent stream of the
Stage 1 treatment system. One press will be installed for the Stage 1 clarifier and an additional press
will be installed for the solids from the final (recarbonation) clarifier to allow the solid waste streams
generated from each of these operations to be managed individually. Dewatered solids will be
disposed with the hydrometallurgical residues.
As noted in Section 4.1.1 of this report, the mass of wastewater sludge generated annually at the
WWTF would likely be less than one percent of the mass produced annually in the
Hydrometallurgical Process. The WWTF sludge would also likely be similar to the
hydrometallurgical residues, consisting primarily of gypsum. Thus it would not be expected to
change the overall chemical characteristics of the solids in the hydrometallurgical residue cells.

RS29T 6-1
6.0 Evaluation of Treatment Options for Tailings Basins Water

RS29T 7-1
7.0 Summary

RS29T 8-1
8.0 References
8.1 Printed Materials Abdel-Aal, E.A., Rashad, M. M., and El-Shall, H. 2004. Crystallization of Calcium Sulfate
Dihydrate at Different Super-saturation Ratios and Different Free Sulfate Concentrations. Crystal Research and Technology, 39:4, 313-321
Ayres, David M., Davis, Allen P., and Gietka, Paul M., 1994. Removing Heavy Metals from Wastewater. University of Maryland, Engineering Research Center Report.
Batchelor, B., Lasala, M.B., McDevitt, M., and Peacock, E., 1991. Technical and Economic Feasibility of Ultra-High Lime Treatment for Recycled Cooling Water. Research Journal of the Water Pollution Control Federation, 63:7, 982-990.
Bertrand, S., Lemaitre, I., and Wittmann, E., 1997. Performance of a Nanofiltration Plant on Hard and Highly Sulfated Water during Two Years of Operation. Desalination. 113:277-281.
Brinson, M.M., Lugo, A.E., and Brown, S. 1981. Primary productivity, decomposition, and consumer activity in freshwater wetlands. Annu. Rev. Ecol. Syst., 12: 123-161.
CEMI, 2002. Pilot Scale Testing of the High Density Sludge Process. Prepared for BC Ministry of Water Land, and Air Protection. Contract No. CLM02-57, Acid Mine Drainage Treatment, Britannia Beach, BC. Prepared by Canadian Environmental and Metallurgical Inc. (CEMI), May 2002.
Davis, R.A., McElhiney, J.E., 2002. The Advancement of Sulfate Removal from Seawater in Offshore Waterflood Operations. Proceedings: Corrosion 2002.
Dzombak, D.A. and Morel, F.M.M. 1990. Surface Complexation Modeling – Hydrous Ferric Oxide. John Wiley and Sons, New York, NY.
Eger, P., Wagner, J., Melchert, G., Antonson, D., and Jackson, A. 2000. Long Term Wetland Treatment of Mine Drainage at LTV Steel Mining Company’s Dunka Mine. Minnesota DNR.
Gula, M. and Harvey, J., 1996. Novel Silica-Based Ion Exchange Resin .Eichrom Industries, Inc. Darien, IL, Conference on Industry, Morgantown, WV, October 22-24, 1996.
ITRC, 2003. Technical and regulatory guidance document for constructed treatment wetlands.
Kim, B.M. and Amodeo, P.A., 1983. Calcium sulfide process for treatment of metal-containing wastes. Environmental Progress 2: 175-180.
Ku, Y., Chen, S.W., and Wang, W.Y., 2005. Effect of Solution Composition on the Removal of Copper Ions by Nanofiltration. Separation and Purification Technology. 43:135-142
Kuipers, J.P., 2002. Water Treatment as a Mitigation for Pit Lakes. Southwest Hydrology, September/October 2002.
Kurniawan, T. A., Chan, G. Y. S., Lo, W., and Babel, S. Physico-chemical treatment techniques for wastewater laden with heavy metals. Chemical Engineering Journal, January, 2006.

RS29T 8-2
Le Gouellec, Y.A., Elimelech, M., 2002. Control of Calcium sulfate (Gypsum) Scale in Nanofiltration of Saline Agricultural Drainage Water. Environmental Engineering Science, 19:6. 387-397.
Lipnizki, J. 2007. Strategies for Controlling Membrane Fouling. Chemical Engineering, Sept. 2007, 62-64.
Lorax Environmental, 2003. Treatment of Sulphate in Mine Effluents. Prepared for the International Network for Acid Prevention, October 2003.
Madigan, M.T., Martinko, J.M., and Parker, J. 1997. Brock Biology of Microorganisms, 8th Edition. Prentice Hall, Inc., Upper Saddle River, NJ.
Minnesota Department of Natural Resources, Paul Eger, Andrea Johnson, Jon Wagner, 2001, “Investigation of Elevated Copper and Cobalt Concentrations in Soudan Mine Drainage” (MNDNR, 2001)
Morton, P., and Ameel, J. 1985. Saline Waters as Indicators of Economic Mineralization, Minnesota Department of Natural Resources Report 241-1.
Patrick, W.H. and Turner, F.T. 1968. Effect of redox potential on manganese transformation in waterlogged soil. Nature 220, 476-478.
Schoeman, J.J., and Steyn, A., 2001. Investigation into Alternative Water Treatment Technologies for the Treatment of Underground Mine Water Discharged by Grootvlei Proprietary Mines Ltd into the Blesbokspruit in South Africa. Desalination 133:13-30
Sencindiver, J.C. and Bhumbla, D.K. 1988. Effects of cattail (Typha) on metal removal from mine drainage. Mine Drainage and Surface Mine Reclamation 1: 359-366.
Smit, J. and Sibilski, U.E., October 2003. Pilot Plant Study to Treat Typical Gold Mine Minewater Using the SAVMIN Process. Proceedings, Water in Mining Conference.
Smith, R., and Martell, A.E. 1976. Critical Stability Constants Vol. 4. Plenum Press, New York, NY
STS Consultants, 1995. Evaluation of boron impacted wells. Report to LTV Steel.
Swenson, J.B. 2007. Continental Glaciation as a Groundwater-Impelling Mechanism: Pleistocene Flushing of Deep Brines in the Lake Superior basin. Unpublished data.
Tarutus, W.J., Unz, R.F., and Brooks, R.P. 1992. Behavior of sedimentary Fe and Mn in a natural wetland receiving acidic mine drainage, Pennsylvania, USA. Applied Geochemistry, 7:77-85.
Taylor, G.J. and Crowder, A.A. 1982. Uptake and accumulation of copper, nickel, and iron by Typha latifolia grown in solution culture. Canadian Journal of Botany, 61:1825-1830.
Topp, H., Russell, H., Davidson, J., Jones, D., Levy, V., Gilderdale, M., Davis, G., Ring, R., Conway, G., Macintosh, P., and Sertorio, L. 2003. Process Water Treatment at the Ranger Uranium Mine in Northern Australia. Water Science and Technology. 47:10, 155-162.
US Army Corps of Engineers, 2001. “Precipitation/coagulation/flocculation Engineering and Design Manual, EM 1110-1-4012”
U.S. Environmental Protection Agency, 2006. “Management and Treatment of Water from Hard Rock Waste Sites”, Office of Research and Development, National Risk Management Research Laboratory, Cincinnati, Ohio. EPA-625/R-06/014.
RS29T 8-3
U.S. Environmental Protection Agency, 1999. “Final Report – Berkeley Pit Innovative Technologies Project, Phase III: Hydrometrics, Inc. Demonstration of Sulfate Removal using the Walhalla Process, Mine Waste Technology Program Activity IV, Project 7”. Prepared by Montana Tech of the University of Montana and MSE Technology Applications, Inc., February 1999.
U.S. Environmental Protection Agency, 1996. “Capsule Report: Reverse Osmosis Process”, EPA-625/R-96/009.
U.S. Environmental Protection Agency, 1980. “Summary Report: Control and Treatment Technology for the Metal Finishing Industry”. EPA 625/8-80-003.
U.S. Environmental Protection Agency, 1973. “Applications of Reverse Osmosis to Acid Mine Drainage Treatment”, EPA-670/2-73-100.
U.S. Environmental Protection Agency and U.S. Dept. of Energy, 1997. Final Report – Berkeley Pit Water Treatment Research Project. Mine Waste Technology Program, Activity IV, Project 1. Prepared by Montana Tech of the University of Montana and MSE Technology Applications, Inc. April 1997.
Visser, T.J.K., Modise, S.J., Kreig, H.M., and Keizer, K., 2001. The Removal of Acid Sulfate Pollution by Nanofiltration. Desalination. 140:79-86
Vymazal, 1995. “Algae and Nutrient Cycling in Wetlands”. CRC Press/Lewis Publishers, Boca Raton, Florida.
Wieder, R.K. 1988. Determining the capacity for metal retention in man-made wetlands constructed for treatment of coal mine drainage. Mine Drainage and Surface Mine Reclamation 1: 375-380.
Wieder, R.K. 1990. Metal cation binding to Sphagnum peat and sawdust: relation to wetland treatment of metal-polluted waters. Water, Air, and Soil Pollution, 53: 391-400.
Wieder, R.K. and Lange, G.E. 1988. Cycling of inorganic and organic sulfur in peat from Big Run Bog, West Virginia. Biogeochemistry, 5, 221-242.
Worrall, F., Reed, M., Warburton, J., and Burt, T. 2003. Carbon budget for a British upland peat
catchment. The Science of the Total Environment. 312: 133-146.
8.2 Electronic Materials http://www.aquatechnology.net, Accessed April 13, 2006.
http://www.frtr.gov/matrix2/section4/4_52.html#cost, Accessed April 17, 2006.
http://gewater.com/library/tp/833_WHat_Is.jsp, Accessed April 13, 2006.
http://www.nesc.wvu.edu/ndwc/pdf/OT/TB/TB4_IonExchange.pdf, Accessed April 17, 2006.
http://www.nmfrc.org/pdf/ro.htm, Accessed June 23, 2006.
http://www.remco.com/ix.htm, Accessed April 17, 2006.

Technical Design Evaluation Report RS29T – Wastewater Treatment Technology NorthMet Project Hoyt Lakes, Minnesota Prepared for PolyMet Mining, Inc March 2007

Technical Design Evaluation Report RS29T – Wastewater Treatment Technology NorthMet Project Hoyt Lakes, Minnesota Prepared for PolyMet Mining, Inc. March 2007
4700 West 77th Street Minneapolis, MN 55435-4803Phone: (952) 832-2600 Fax: (952) 832-2601
RS29T i
RS 29T Draft-02
March 30, 2007
Technical Design Evaluation Report
RS29T – Wastewater Treatment Technology NorthMet Project
March 2007
Table of Contents
1.0 Introduction........................................................................................................................................1-1 1.1 Project Overview .....................................................................................................................1-1 1.2 Report Objective and Water Management Overview ..............................................................1-1 1.3 Report Organization.................................................................................................................1-2
2.0 Reuse/Recycle Water Management Plan ...........................................................................................2-1 2.1 Mine Site Process Water ..........................................................................................................2-2
2.1.1 Mine Site Process Water Quantity ..............................................................................2-2 2.1.2 Mine Site Process Water Quality ................................................................................2-3
2.2 Plant Site Process Water ..........................................................................................................2-8 2.2.1 Plant Site Process Water Quantity ..............................................................................2-8 2.2.2 Plant Site Process Water Quality ................................................................................2-9
3.0 Process Water Quality Targets...........................................................................................................3-1 3.1 Potential Surface Water Quality Standards..............................................................................3-1 3.2 Potential Groundwater Quality Standards................................................................................3-4 3.3 Anticipated Process Water Quality Targets .............................................................................3-4
4.0 Summary of Potential Wastewater Treatment Technologies .............................................................4-1 4.1 Chemical Precipitation.............................................................................................................4-2
4.1.1 Technology Description..............................................................................................4-2 4.1.2 Metal Precipitation Technologies ...............................................................................4-3 4.1.3 Chemical Precipitation Technologies for Sulfate and other Salts...............................4-8
4.2 Reverse Osmosis and other Membrane Technologies ...........................................................4-10 4.2.1 Technology Description............................................................................................4-10 4.2.2 Membrane Types ......................................................................................................4-12 4.2.3 Membrane Configurations ........................................................................................4-13 4.2.4 Operation and Maintenance ......................................................................................4-13 4.2.5 Treatment of Acid Mine Drainage Using Reverse Osmosis .....................................4-14
4.3 Ion Exchange .........................................................................................................................4-16 4.3.1 Technology Description............................................................................................4-16 4.3.2 Types of Ion Exchange Resins..................................................................................4-17 4.3.3 Ion Exchange for Acid Mine Drainage Treatment....................................................4-18
4.4 Constructed Wetland..............................................................................................................4-19 4.4.1 Technology Description............................................................................................4-19
Table of Contents (continued)
RS29T ii
4.4.2 Wetland Removal Mechanisms ................................................................................4-20 4.4.3 Wetland Treatment of Mine Drainage-Case Studies ................................................4-23
5.0 Evaluation of Treatment Options for Mine Site Wastewaters ..........................................................5-1 5.1 Effectiveness ............................................................................................................................5-7 5.2 Implementability ......................................................................................................................5-7
5.2.1 Chemical Precipitation................................................................................................5-7 5.2.2 Membrane Treatment..................................................................................................5-8 5.2.3 Ion Exchange ..............................................................................................................5-9 5.2.4 Constructed Wetland...................................................................................................5-9
5.3 Cost ........................................................................................................................................5-12 5.3.1 Chemical Precipitation..............................................................................................5-12 5.3.2 Membrane Treatment................................................................................................5-12 5.3.3 Ion Exchange ............................................................................................................5-13 5.3.4 Constructed Wetland.................................................................................................5-13
5.4 Recommended Alternative.....................................................................................................5-13 5.4.1 Flow Equalization .....................................................................................................5-14 5.4.2 Nanofiltration Pre-Treatment....................................................................................5-15 5.4.3 Nanofiltration Membrane Unit..................................................................................5-16 5.4.4 Chemical Addition and Rapid Mixing ......................................................................5-16 5.4.5 Coagulation and Flocculation ...................................................................................5-17 5.4.6 Clarification (Settling) ..............................................................................................5-17 5.4.7 Recarbonation ...........................................................................................................5-17 5.4.8 Process Monitoring and Control ...............................................................................5-18
5.5 Potential Treatment System Performance..............................................................................5-18 5.6 Solid Waste Management Plan ..............................................................................................5-23
6.0 Evaluation of Treatment Options for Tailings Basins Water ............................................................6-1
7.0 Summary ............................................................................................................................................7-1
8.0 References ..........................................................................................................................................8-1 8.1 Printed Materials ......................................................................................................................8-1 8.2 Electronic Materials .................................................................................................................8-2

RS29T iii
List of Tables
Table 1 Mine Site Process Water Flows to the WWTF
Table 2 Mine Site Process Water Quality
Table 3 Potential Water Quality Standards
Table 4 Water Quality Process Standards
Table 5 Solubility Products for Various Metal Hydroxides, Carbonates, and Sulfides
Table 6 Comparison of Sulfide Precipitation Technologies
Table 7 Comparison of Membrane Types
Table 8 Summary of Reverse Osmosis Treatment of Mine Wastewater
Table 9 Chelating Cation Resin Selectivity Coefficients (KM) for Metal Ions
Table 10 Stability Series for Metal-organic Interactions in Various Substrates
Table 11 Langmuir Parameters for Metal-organic Interactions in Peat and Sawdust
Table 12 Summary of Screening Evaluation of Treatment Technologies for Mine Site Wastewater
Table 13 Stage 1 and Stage 2 Equalization Pond Inflow Predicted Water Quality
Table 14 Stage 1 and Stage 2 Treatment System Effluent and CPS Pond Predicted Water Quality

RS29T iv
List of Figures
Figure 1 Project Location Map
Figure 2 Tailings Basins Area Map
Figure 3 Tailings Basin Process Water Flow Diagram
Figure 4 Preliminary Layout of WWTF and CPS Site
Figure 5 Conceptual WWTF Process Flow Diagram
List of Appendices
Appendix A Technical Design Evaluation Report – Scope of Work
Appendix B Laboratory Study of Mercury Adsorption to LTV Taconite and NorthMet Tailings
Appendix C RS45 – Water Treatment Studies – Waste Rock and Lean Ore
Appendix D Review of Dunka Wetlands Treatment Performance
Appendix E Decision Tree for Treatment Wetlands
Appendix F Detailed Cost Estimates for Mine Site Wastewater Treatment Alternatives
Appendix G WWTF Treatment Estimates
Appendix H Chemical Balance: Pilot Plant Flotation Process

RS29T 1-1
1.0 Introduction
1.1 Project Overview PolyMet Mining, Inc. (PolyMet) plans to excavate and process low-grade, polymetallic,
disseminated, magmatic-sulfide NorthMet-deposit ore in northeastern Minnesota, approximately
6 miles south of the town of Babbitt, Minnesota. Figure 1 shows the location of the proposed Mine
Site, Process Plant, and tailings basin.
PolyMet is proposing to manage process waters from mining and metal recovery operations in a
manner that eliminates the need for any direct discharge to the surface waters of the State of
Minnesota. This report describes the process waters generated by the proposed NorthMet project, the
treatment technologies that have been evaluated, and the preferred treatment methods that are
proposed to reuse/recycle this water.
1.2 Report Objective and Water Management Overview The objective of this Wastewater Treatment Technology Evaluation Report is to describe in detail the
water treatment requirements and the proposed water treatment technologies for NorthMet process
water that will be generated at two locations:
• At the Mine Site, primarily from pit dewatering and stockpile drainage, and
• At the Plant Site, primarily from the beneficiation of the ore and subsequent transport of
flotation tailings to the tailings basin.
At the Mine Site, all process water that contacts waste rock, ore, the mine pit, or any of the active
mining operations will be carefully managed to eliminate discharge to surface water. Only non-
contact storm water will be discharged from the Mine Site. The Mine Site process water will be
treated at a wastewater treatment facility (WWTF) prior to being pumped to the tailings basin, where
it will be used as make-up water for the beneficiation process, as described in Section 2 of this
report. The WWTF will be designed and operated to maintain water quality within the tailings basin
to appropriate process-based targets. This water management plan avoids a direct discharge of
wastewater from both the Mine Site and the Plant Site during the proposed 20-year operating life of
the project.

RS29T 1-2
Approximately 40 years after closure of the mining operation, when the West Pit has filled with
water, it will be necessary to discharge water from the Mine Site. Treatment and discharge of Mine
Site process water after closure is addressed in the RS52.
At the Plant Site, PolyMet plans to use the existing tailings basin for disposal of flotation tailings
generated by processing the ore (see Figure 2). Water will be used in the grinding and flotation
operations and will also be used to transport the tailings to this basin. Water will then be returned
from the tailings basin to be re-used in the beneficiation process. During operation of the project, no
water will be discharged directly from the Plant Site to surface water. Upon closure, the water in the
tailings basin will be pumped back to the Mine Site to accelerate filling of the West Pit. Tailings
basin seepage water will also be pumped to the Mine Site after closure.
Additional wastewater streams that will be generated at the Plant Site include the leachate from
hydrometallurgical residue cells that will be constructed on closed portions of the tailings basin, and
wastewater from potable use (toilets, sinks, showers, etc). During operation, the leachate from the
hydrometallurgical residue cells will be routed back to the hydrometallurgical process, which will
consume water during normal operations. Drainage water treatment will be required after closure
and is addressed in RS52. Wastewater from potable uses will be treated separately from the process
wastewaters described in this report. Therefore, at the Plant Site, the primary focus of this report is
the process water in the Beneficiation Plant-tailings basin loop.
1.3 Report Organization The Scope of Work (SOW) for RS29T was specified in Attachment A of the Final Scoping Decision
Document for the PolyMet EIS. The evaluation of wastewater treatment technology is divided into
five phases.
• Phase 1 of the study, presented in Section 3, establishes potential process water quality
targets for implementation of a complete reuse/recycle water management plan.
• The potential wastewater treatment technologies are described in Section 4 and constitute
Phase 2 of the study.
• Phase 3 of the study, described in Section 2, describes wastewater quantity and quality
information for the project. This section focuses on the Mine Site as this is the location
where wastewater will be treated. The wastewater quantity and quality at the Plant Site is

RS29T 1-3
discussed in relation to how treatment of the Mine Site process water affects water quality at
the Plant Site.
• Phases 4 and 5 of the study outline, discussed in Sections 5 and 6 of the report, contain an
evaluation of the effectiveness, implementability, and cost of the potential wastewater
treatment technologies discussed in Section 4, for Mine Site process water and Plant Site
process water wastewater, respectively.
A copy of the original SOW for this report is included in Appendix A. The original SOW was
developed with the assumption that treated wastewater would need to be discharged to surface water.
However, the Final Scoping Decision Document also noted that PolyMet may consider other options
for managing wastewater, including the reuse/recycle of Mine Site process water as make-up water
for the plant operations. Reuse/recycle of Mine Site process water provides the basis for the current
water management plan to eliminate surface water discharges. Because the focus of wastewater
treatment is different than was contemplated when the SOW for this report was prepared, the order in
which items are discussed in this report has been revised. For example, the quantity and quality of
water generated and consumed at NorthMet are significant to the overall development of the
reuse/recycle water management plan. Thus, the plan for water management, which is summarized
in the following Section, is of primary importance when compared to the discussion of potential
discharge goals and is, therefore, addressed first.

RS29T 2-1
2.0 Reuse/Recycle Water Management Plan
The reuse/recycle plan for water management at NorthMet envisions no discharge of wastewater
from any of the processing activities or other operations described in this report. Water will enter the
NorthMet operation in the form of precipitation, groundwater inflows to the mine pit, and as make-up
water from Colby Lake. This water will be collected, treated when necessary, used in the
beneficiation process, and later returned the mine pits to facilitate filling at the conclusion of the
mining operations. This water management plan for NorthMet does not include any planned
discharge of process water to surface waters of the State of Minnesota until the West Pit overflows to
the Partridge River, approximately 40 years after the operation has been closed and the Mine Site has
been reclaimed. This is the essence of the reuse/recycle plan for water management. The details of
this plan are developed in several other RS documents and integrated into a single plan in the
following paragraphs.
Managing process and wastewater generation and consumption to eliminate wastewater discharge to
surface water will be a critical aspect of the proposed NorthMet project. Water is required for the
grinding of ore and flotation of the ground ore slurry to separate the concentrate from the tailings.
Water is consumed in the hydrometallurgical processes used to recover metal from the concentrate.
Water is also lost to the tailings basin when tailings are deposited (by filling the space between
tailings particles), to evaporation from the surface of the basin, and to deep groundwater beneath the
tailings basin. All these water-related operations must be balanced, and appropriate factors of safety
established, to provide a consistent and reliable – but not excessive – supply of water to the
operation. A source of new water, Colby Lake, will then be used to provide any additional water
required to maintain the operation.
The implementation of a complete reuse/recycle program for NorthMet is predicated upon the careful
management of water inflows and consumption, as well as careful modeling of water quality and
appropriate treatment, when necessary. The estimates of water quality and quantity at both the Mine
Site and the Plant Site have been completed and reported in several individual RS reports including:
• RS13A – Process Design – Tailings Basin Water Balance - Operations
• RS21 – Hydrology – Mine Water Model and Balance
• RS22 – Mine Wastewater Management System
• RS31 – Mine Pit Water Quality Model

RS29T 2-2
• RS53/RS42 – Waste Rock Characteristics/Waste Water Modeling -Waste Rock and Lean Ore
• RS54A/RS46 – Flotation Tailings Characteristics/Waste Water Modeling -Tailings
• RS52 – Mine Closure Plan
The results of these reports are summarized and combined in the following paragraphs to provide an
overall assessment of water management approach and to highlight areas where water treatment is
necessary to maintain the water quality needed for plant operations and to maintain appropriate water
quality standards near NorthMet.
2.1 Mine Site Process Water
2.1.1 Mine Site Process Water Quantity
Mine Site process water is generated from four sources: groundwater entering the mine pit, direct
precipitation on the mine pit, infiltration through or runoff from waste rock stockpiles collected on
liner systems (drainage), and runoff from other site operations within the Mine Site—for example the
ore Rail Transfer Hopper, and mine service roads. The mine plan includes three separate pits
(referred to as the East Pit, the Central Pit and the West Pit), which will be changing over the life of
the mining operation. The quantity of process water generated from these pits and associated
stockpiles will also vary over the life of the mine. The use of multiple pits helps to reduce the
maximum pumping that will be required for mine pit dewatering and also provides a location for
storing some of the process water generated at the site after the first eleven years of operation. These
options help to provide flexibility and facilitate the development of a reuse/recycle - water
management plan.
On an annual average basis, the maximum design rate of process water generation from the sources
that will require treatment at the WWTF varies from approximately 500 gpm in the early years to a
maximum of approximately 1,600 gpm near Year 10, before initiation of filling activities for the East
Pit, and reducing to approximately 1,400 gpm in the final years of operation. Table 1 contains a
summary of the anticipated annual average Mine Site process water flow rates from all the sources
that will require treatment. All of these flows, even during the likely peak in Mine Site process water
generation near Year 10 can be consumed by operations at the Plant Site. Within any given year, the
process water flow will vary significantly from a minimum flow during the winter months to a
maximum flow in the spring. In general the minimum flow is 0.5 to 0.7 times the average annual
flow, while the maximum flow ranges from approximately 2.0 to 2.5 times the annual average flow,

RS29T 2-3
with a maximum design flow of approximately 2,960 gpm in the Spring of Year 10. This value
provides the design basis for the maximum flow rate through the WWTF of 3,000 gpm.
Table 1 Mine Site Process Water Flows to the WWTF
Estimated high (and low)1 average annual flow (gpm) in Year: Source 1 5 10 15 20
Category 1/2 Stockpile 113.1(85.8) 217.5(99.6) 281.5(50.1) 270.4(120.6) 270.4(120.6) Category 3 Stockpile 5.0(3.8) 20(14.7) 35(25.3) 49.5(34.4) 23.2(10) Category 3 Lean Ore Stockpile 29.9(22.7) 50(36.7) 62.5(33.7) 80.2(26.2) 51.8(22.5) Category 4 Stockpile 3.8(2.9) 30.4(22.9) 35.3(25.9) 32.2(23.3) 4.6(0.9) Lean Ore Surge Pile 46.1(35) 46.1(35) 46.1(35) 46.1(35) 46.1(35) East Pit2 200.9 774 820.1 80.7 0 West Pit 79.4 123.8 224.4 486.9 924.3 Haul Roads 46.1 46.7 38.8 36.5 35.3 Rail Transfer Hopper 6 6 6 6 6 Total 530(480) 1,320(1,160) 1,550(1,260) 1,090(850) 1,360(1,155)
Notes: 1. Lows not shown when same as high estimates 2. Includes Central Pit - Zero flow from East Pit to WWTF starting in Year 12 when East Pit filling is
initiated.
As contemplated in Phase 3 of the SOW, the work described in RS21 and RS22 was focused on
minimizing the Mine Site process water quantity and minimizing impacts to water quality through
the use of segregation of waste rock and capping of stockpiles as well as dewatering of multiple pits
on independent schedules. These activities contribute to the implementation of a reuse/recycle water
management plan as described in the plan for the proposed WWTF at the Mine Site in Section 5.
2.1.2 Mine Site Process Water Quality
The quality of the Mine Site process water will vary based on the source of the water. For example,
waste rock is proposed to be segregated into four different ‘categories’ based on the geochemical
properties of the rock which drives the potential for water that contacts the rock to impact water
quality. Mine pit process water quality will be different than the drainage from the waste rock
stockpiles. The anticipated water quality for each of these sources has been predicted (see RS31 and
RS53/RS42) using site-specific data obtained from humidity cell testing and site-specific hydrology.
Table 2 contains a summary of the expected water quality for the primary sources of Mine Site
process water.

RS29T 2-4
Table 2 Mine Site Process Water Quality
Category 1/2 Stockpile (Years) Category 3 Stockpile (Years) Parameter (mg/L) 1 5 10 15 20 1 5 10 15 20
Fluoride (F) 1.3E+00 1.4E+01 6.1E+01 3.5E+01 3.5E+01 3.2E+00 9.5E+00 1.2E+01 1.7E+01 8.4E+01Chloride (Cl) 1.9E+01 6.2E+01 1.0E+02 0.0E+00 0.0E+00 1.9E+01 1.3E+01 5.6E+00 8.3E+00 5.3E+01Sulfate (SO4) 1.2E+02 1.2E+03 2.3E+03 2.3E+03 2.3E+03 1.5E+03 2.3E+03 9.6E+03 9.6E+03 9.6E+03Aluminum (Al) 1.7E+00 1.7E+00 1.7E+00 1.7E+00 1.7E+00 1.7E+00 1.7E+00 8.3E+01 8.3E+01 8.3E+01Arsenic (As) 2.3E-01 7.1E-01 7.1E-01 7.1E-01 7.1E-01 7.1E-01 7.1E-01 7.1E-01 7.1E-01 7.1E-01 Barium (Ba) 1.9E-01 1.9E-01 1.9E-01 1.9E-01 1.9E-01 1.9E-01 1.9E-01 1.9E-01 1.9E-01 1.9E-01 Beryllium (Be) 2.0E-04 2.0E-04 2.0E-04 2.0E-04 2.0E-04 2.0E-04 2.0E-04 2.3E-03 2.3E-03 2.3E-03 Boron (B) 2.0E-01 7.6E-01 7.6E-01 7.6E-01 7.6E-01 7.1E-01 7.6E-01 7.6E-01 7.6E-01 7.6E-01 Cadmium (Cd) 1.8E-04 1.8E-04 1.8E-04 1.8E-04 1.8E-04 1.8E-04 1.8E-04 1.5E-02 1.5E-02 1.5E-02 Calcium (Ca) 5.0E+01 5.1E+02 5.4E+02 5.4E+02 5.4E+02 3.7E+02 5.4E+02 4.8E+02 4.8E+02 4.8E+02Chromium (Cr) 1.5E-03 1.5E-03 1.5E-03 1.5E-03 1.5E-03 1.5E-03 1.5E-03 1.5E-03 1.5E-03 1.5E-03 Cobalt (Co) 2.7E-03 2.8E-02 5.2E-02 5.2E-02 5.2E-02 5.2E-02 5.2E-02 1.5E+01 2.4E+01 4.4E+01Copper (Cu) 4.3E-02 9.2E-02 9.2E-02 9.2E-02 9.2E-02 9.2E-02 9.2E-02 2.1E+01 3.3E+01 2.0E+02Iron (Fe) 7.7E-01 8.1E-01 8.1E-01 8.1E-01 8.1E-01 8.1E-01 8.1E-01 2.8E+01 4.4E+01 2.4E+02Lead (Pb) 3.2E-03 3.3E-02 5.3E-02 5.3E-02 5.3E-02 9.1E-03 2.7E-02 5.3E-02 5.3E-02 5.3E-02 Magnesium (Mg) 8.8E+00 9.0E+01 9.3E+01 9.3E+01 9.3E+01 5.2E+01 9.3E+01 1.0E+03 1.0E+03 1.0E+03Manganese (Mn) 4.9E-02 5.0E-01 7.5E-01 7.5E-01 7.5E-01 7.5E-01 7.5E-01 4.7E+01 4.7E+01 4.7E+01Mercury (Hg) 6.0E-06 6.0E-06 6.0E-06 6.0E-06 6.0E-06 6.0E-06 6.0E-06 6.0E-06 6.0E-06 6.0E-06 Molybdenum (Mo) 1.4E-03 5.1E-03 5.1E-03 5.1E-03 5.1E-03 5.1E-03 5.1E-03 5.1E-03 5.1E-03 5.1E-03 Nickel (Ni) 1.2E-02 1.3E-01 5.6E-01 3.2E-01 3.2E-01 8.6E-01 8.6E-01 1.8E+02 2.8E+02 7.6E+02Phosphorous (PO4) 2.0E-01 2.0E-01 2.0E-01 2.0E-01 2.0E-01 2.0E-01 2.0E-01 2.0E-01 2.0E-01 2.0E-01 Potassium (K) 3.6E+01 4.9E+01 4.9E+01 4.9E+01 4.9E+01 4.9E+01 4.9E+01 3.8E+01 3.8E+01 3.8E+01Selenium (Se) 2.9E-03 2.9E-03 2.9E-03 2.9E-03 2.9E-03 2.9E-03 2.9E-03 2.9E-03 2.9E-03 2.9E-03 Silica (SiO2) 8.7E+00 8.7E+00 8.7E+00 8.7E+00 8.7E+00 8.7E+00 8.7E+00 3.9E+00 3.9E+00 3.9E+00Silver (Ag) 7.0E-04 7.0E-04 7.0E-04 7.0E-04 7.0E-04 7.0E-04 7.0E-04 7.0E-04 7.0E-04 7.0E-04 Sodium (Na) 7.5E+01 6.8E+02 6.8E+02 6.8E+02 6.8E+02 2.6E+02 6.8E+02 3.4E+02 3.4E+02 3.4E+02Thallium (Tl) 2.0E-05 2.0E-05 2.0E-05 2.0E-05 2.0E-05 2.0E-05 2.0E-05 6.0E-05 6.0E-05 6.0E-05 Zinc (Zn) 6.7E-02 9.0E-02 9.0E-02 9.0E-02 9.0E-02 9.0E-02 9.0E-02 1.0E+01 1.6E+01 2.6E+01Nitrate (NO3) 2.5E-01 8.0E-01 1.3E+00 0.0E+00 0.0E+00 2.0E-01 1.3E-01 5.9E-02 8.7E-02 5.5E-01 Ammonia (NH4) 2.5E-01 8.0E-01 1.3E+00 0.0E+00 0.0E+00 2.0E-01 1.3E-01 5.9E-02 8.7E-02 5.5E-01
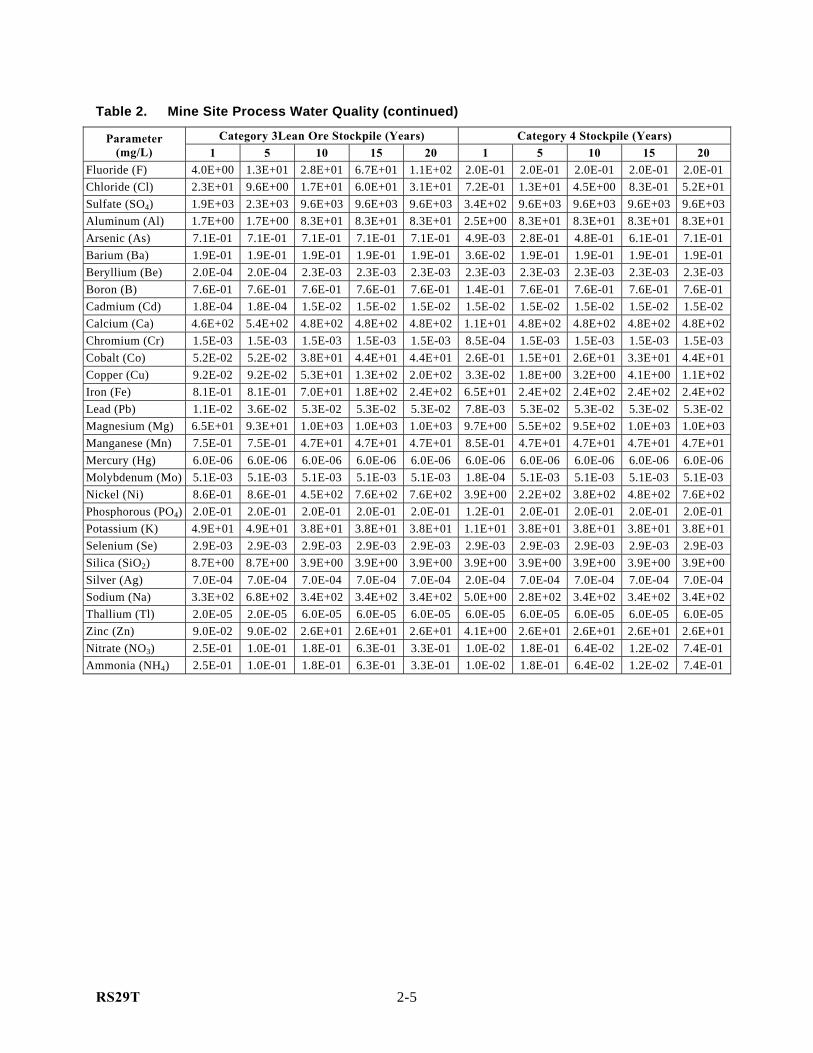
RS29T 2-5
Table 2. Mine Site Process Water Quality (continued)
Category 3Lean Ore Stockpile (Years) Category 4 Stockpile (Years) Parameter (mg/L) 1 5 10 15 20 1 5 10 15 20
Fluoride (F) 4.0E+00 1.3E+01 2.8E+01 6.7E+01 1.1E+02 2.0E-01 2.0E-01 2.0E-01 2.0E-01 2.0E-01 Chloride (Cl) 2.3E+01 9.6E+00 1.7E+01 6.0E+01 3.1E+01 7.2E-01 1.3E+01 4.5E+00 8.3E-01 5.2E+01Sulfate (SO4) 1.9E+03 2.3E+03 9.6E+03 9.6E+03 9.6E+03 3.4E+02 9.6E+03 9.6E+03 9.6E+03 9.6E+03Aluminum (Al) 1.7E+00 1.7E+00 8.3E+01 8.3E+01 8.3E+01 2.5E+00 8.3E+01 8.3E+01 8.3E+01 8.3E+01Arsenic (As) 7.1E-01 7.1E-01 7.1E-01 7.1E-01 7.1E-01 4.9E-03 2.8E-01 4.8E-01 6.1E-01 7.1E-01 Barium (Ba) 1.9E-01 1.9E-01 1.9E-01 1.9E-01 1.9E-01 3.6E-02 1.9E-01 1.9E-01 1.9E-01 1.9E-01 Beryllium (Be) 2.0E-04 2.0E-04 2.3E-03 2.3E-03 2.3E-03 2.3E-03 2.3E-03 2.3E-03 2.3E-03 2.3E-03 Boron (B) 7.6E-01 7.6E-01 7.6E-01 7.6E-01 7.6E-01 1.4E-01 7.6E-01 7.6E-01 7.6E-01 7.6E-01 Cadmium (Cd) 1.8E-04 1.8E-04 1.5E-02 1.5E-02 1.5E-02 1.5E-02 1.5E-02 1.5E-02 1.5E-02 1.5E-02 Calcium (Ca) 4.6E+02 5.4E+02 4.8E+02 4.8E+02 4.8E+02 1.1E+01 4.8E+02 4.8E+02 4.8E+02 4.8E+02Chromium (Cr) 1.5E-03 1.5E-03 1.5E-03 1.5E-03 1.5E-03 8.5E-04 1.5E-03 1.5E-03 1.5E-03 1.5E-03 Cobalt (Co) 5.2E-02 5.2E-02 3.8E+01 4.4E+01 4.4E+01 2.6E-01 1.5E+01 2.6E+01 3.3E+01 4.4E+01Copper (Cu) 9.2E-02 9.2E-02 5.3E+01 1.3E+02 2.0E+02 3.3E-02 1.8E+00 3.2E+00 4.1E+00 1.1E+02Iron (Fe) 8.1E-01 8.1E-01 7.0E+01 1.8E+02 2.4E+02 6.5E+01 2.4E+02 2.4E+02 2.4E+02 2.4E+02Lead (Pb) 1.1E-02 3.6E-02 5.3E-02 5.3E-02 5.3E-02 7.8E-03 5.3E-02 5.3E-02 5.3E-02 5.3E-02 Magnesium (Mg) 6.5E+01 9.3E+01 1.0E+03 1.0E+03 1.0E+03 9.7E+00 5.5E+02 9.5E+02 1.0E+03 1.0E+03Manganese (Mn) 7.5E-01 7.5E-01 4.7E+01 4.7E+01 4.7E+01 8.5E-01 4.7E+01 4.7E+01 4.7E+01 4.7E+01Mercury (Hg) 6.0E-06 6.0E-06 6.0E-06 6.0E-06 6.0E-06 6.0E-06 6.0E-06 6.0E-06 6.0E-06 6.0E-06 Molybdenum (Mo) 5.1E-03 5.1E-03 5.1E-03 5.1E-03 5.1E-03 1.8E-04 5.1E-03 5.1E-03 5.1E-03 5.1E-03 Nickel (Ni) 8.6E-01 8.6E-01 4.5E+02 7.6E+02 7.6E+02 3.9E+00 2.2E+02 3.8E+02 4.8E+02 7.6E+02Phosphorous (PO4) 2.0E-01 2.0E-01 2.0E-01 2.0E-01 2.0E-01 1.2E-01 2.0E-01 2.0E-01 2.0E-01 2.0E-01 Potassium (K) 4.9E+01 4.9E+01 3.8E+01 3.8E+01 3.8E+01 1.1E+01 3.8E+01 3.8E+01 3.8E+01 3.8E+01Selenium (Se) 2.9E-03 2.9E-03 2.9E-03 2.9E-03 2.9E-03 2.9E-03 2.9E-03 2.9E-03 2.9E-03 2.9E-03 Silica (SiO2) 8.7E+00 8.7E+00 3.9E+00 3.9E+00 3.9E+00 3.9E+00 3.9E+00 3.9E+00 3.9E+00 3.9E+00Silver (Ag) 7.0E-04 7.0E-04 7.0E-04 7.0E-04 7.0E-04 2.0E-04 7.0E-04 7.0E-04 7.0E-04 7.0E-04 Sodium (Na) 3.3E+02 6.8E+02 3.4E+02 3.4E+02 3.4E+02 5.0E+00 2.8E+02 3.4E+02 3.4E+02 3.4E+02Thallium (Tl) 2.0E-05 2.0E-05 6.0E-05 6.0E-05 6.0E-05 6.0E-05 6.0E-05 6.0E-05 6.0E-05 6.0E-05 Zinc (Zn) 9.0E-02 9.0E-02 2.6E+01 2.6E+01 2.6E+01 4.1E+00 2.6E+01 2.6E+01 2.6E+01 2.6E+01Nitrate (NO3) 2.5E-01 1.0E-01 1.8E-01 6.3E-01 3.3E-01 1.0E-02 1.8E-01 6.4E-02 1.2E-02 7.4E-01 Ammonia (NH4) 2.5E-01 1.0E-01 1.8E-01 6.3E-01 3.3E-01 1.0E-02 1.8E-01 6.4E-02 1.2E-02 7.4E-01

RS29T 2-6
Table 2. Mine Site Process Water Quality (continued)
Lean Ore Surge Pile (Years) East Pit (Years) Parameter (mg/L) 1 5 10 15 20 1 5 10
Fluoride (F) 1.8E-01 2.0E-01 2.0E-01 2.0E-01 2.0E-01 2.6E-01 2.6E-01 2.6E-01 Chloride (Cl) 6.2E-01 5.6E-01 1.4E+00 2.7E-01 1.7E+00 1.3E+00 1.3E+00 1.3E+00 Sulfate (SO4) 2.7E+02 4.8E+03 9.3E+03 9.6E+03 9.6E+03 9.5E+01 4.1E+01 5.1E+01 Aluminum (Al) 2.0E+00 3.5E+01 6.8E+01 8.3E+01 8.3E+01 6.0E-01 2.8E-01 3.3E-01 Arsenic (As) 3.8E-03 6.8E-02 1.3E-01 3.2E-01 2.9E-01 3.3E-02 1.2E-02 1.6E-02 Barium (Ba) 2.8E-02 1.9E-01 1.9E-01 1.9E-01 1.9E-01 2.7E-02 1.7E-02 1.9E-02 Beryllium (Be) 2.3E-03 2.3E-03 2.3E-03 2.3E-03 2.3E-03 3.8E-04 2.8E-04 3.0E-04 Boron (B) 1.1E-01 7.6E-01 7.6E-01 7.6E-01 7.6E-01 1.3E-01 9.8E-02 1.0E-01 Cadmium (Cd) 1.5E-02 1.5E-02 1.5E-02 1.5E-02 1.5E-02 6.8E-04 5.6E-04 5.3E-04 Calcium (Ca) 8.4E+00 1.5E+02 2.9E+02 4.8E+02 4.8E+02 2.4E+01 1.6E+01 1.8E+01 Chromium (Cr) 6.6E-04 1.5E-03 1.5E-03 1.5E-03 1.5E-03 1.1E-03 1.1E-03 1.1E-03 Cobalt (Co) 2.1E-01 3.7E+00 7.1E+00 1.7E+01 1.6E+01 1.2E-02 1.0E-02 9.2E-03 Copper (Cu) 2.5E-02 4.5E-01 8.8E-01 2.1E+00 1.9E+00 9.4E-03 5.0E-03 5.9E-03 Iron (Fe) 5.1E+01 2.4E+02 2.4E+02 2.4E+02 2.4E+02 2.8E+00 2.5E+00 2.2E+00 Lead (Pb) 6.1E-03 5.3E-02 5.3E-02 5.3E-02 5.3E-02 1.6E-03 1.3E-03 1.3E-03 Magnesium (Mg) 7.5E+00 1.3E+02 2.6E+02 6.3E+02 5.7E+02 8.4E+00 8.0E+00 8.0E+00 Manganese (Mn) 6.6E-01 1.2E+01 2.3E+01 4.7E+01 4.7E+01 7.5E-02 5.6E-02 5.7E-02 Mercury (Hg) 6.0E-06 6.0E-06 6.0E-06 6.0E-06 6.0E-06 5.1E-06 2.8E-06 3.1E-06 Molybdenum (Mo) 1.4E-04 2.4E-03 4.7E-03 5.1E-03 5.1E-03 4.6E-03 4.7E-03 4.7E-03 Nickel (Ni) 3.0E+00 5.4E+01 1.0E+02 2.5E+02 2.3E+02 1.6E-01 1.3E-01 1.2E-01 Phosphorous (PO4) 9.7E-02 2.0E-01 2.0E-01 2.0E-01 2.0E-01 0.0E+00 0.0E+00 0.0E+00 Potassium (K) 8.2E+00 3.8E+01 3.8E+01 3.8E+01 3.8E+01 3.3E+00 1.3E+00 1.7E+00 Selenium (Se) 2.9E-03 2.9E-03 2.9E-03 2.9E-03 2.9E-03 2.0E-03 2.0E-03 2.0E-03 Silica (SiO2) 3.9E+00 3.9E+00 3.9E+00 3.9E+00 3.9E+00 0.0E+00 0.0E+00 0.0E+00 Silver (Ag) 1.5E-04 7.0E-04 7.0E-04 7.0E-04 7.0E-04 9.2E-04 9.5E-04 9.5E-04 Sodium (Na) 3.9E+00 7.0E+01 1.4E+02 3.3E+02 3.0E+02 2.2E+01 6.7E+00 9.8E+00 Thallium (Tl) 6.0E-05 6.0E-05 6.0E-05 6.0E-05 6.0E-05 1.7E-03 1.9E-03 1.8E-03 Zinc (Zn) 3.2E+00 2.6E+01 2.6E+01 2.6E+01 2.6E+01 1.8E-01 1.6E-01 1.4E-01 Nitrate (NO3) 7.9E-03 7.2E-03 1.8E-02 3.5E-03 2.2E-02 8.5E-02 9.3E-02 9.2E-02 Ammonia (NH4) 7.9E-03 7.2E-03 1.8E-02 3.5E-03 2.2E-02 8.5E-02 9.3E-02 9.2E-02
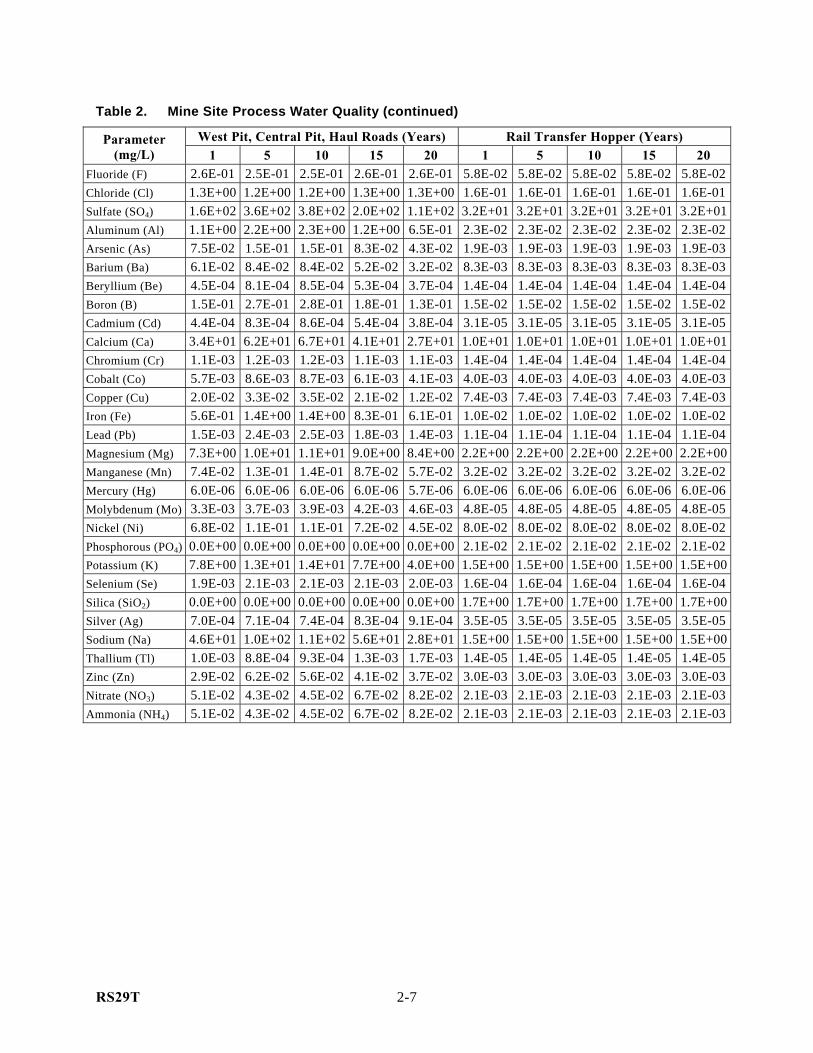
RS29T 2-7
Table 2. Mine Site Process Water Quality (continued)
West Pit, Central Pit, Haul Roads (Years) Rail Transfer Hopper (Years) Parameter (mg/L) 1 5 10 15 20 1 5 10 15 20
Fluoride (F) 2.6E-01 2.5E-01 2.5E-01 2.6E-01 2.6E-01 5.8E-02 5.8E-02 5.8E-02 5.8E-02 5.8E-02Chloride (Cl) 1.3E+00 1.2E+00 1.2E+00 1.3E+00 1.3E+00 1.6E-01 1.6E-01 1.6E-01 1.6E-01 1.6E-01Sulfate (SO4) 1.6E+02 3.6E+02 3.8E+02 2.0E+02 1.1E+02 3.2E+01 3.2E+01 3.2E+01 3.2E+01 3.2E+01Aluminum (Al) 1.1E+00 2.2E+00 2.3E+00 1.2E+00 6.5E-01 2.3E-02 2.3E-02 2.3E-02 2.3E-02 2.3E-02Arsenic (As) 7.5E-02 1.5E-01 1.5E-01 8.3E-02 4.3E-02 1.9E-03 1.9E-03 1.9E-03 1.9E-03 1.9E-03Barium (Ba) 6.1E-02 8.4E-02 8.4E-02 5.2E-02 3.2E-02 8.3E-03 8.3E-03 8.3E-03 8.3E-03 8.3E-03Beryllium (Be) 4.5E-04 8.1E-04 8.5E-04 5.3E-04 3.7E-04 1.4E-04 1.4E-04 1.4E-04 1.4E-04 1.4E-04Boron (B) 1.5E-01 2.7E-01 2.8E-01 1.8E-01 1.3E-01 1.5E-02 1.5E-02 1.5E-02 1.5E-02 1.5E-02Cadmium (Cd) 4.4E-04 8.3E-04 8.6E-04 5.4E-04 3.8E-04 3.1E-05 3.1E-05 3.1E-05 3.1E-05 3.1E-05Calcium (Ca) 3.4E+01 6.2E+01 6.7E+01 4.1E+01 2.7E+01 1.0E+01 1.0E+01 1.0E+01 1.0E+01 1.0E+01Chromium (Cr) 1.1E-03 1.2E-03 1.2E-03 1.1E-03 1.1E-03 1.4E-04 1.4E-04 1.4E-04 1.4E-04 1.4E-04Cobalt (Co) 5.7E-03 8.6E-03 8.7E-03 6.1E-03 4.1E-03 4.0E-03 4.0E-03 4.0E-03 4.0E-03 4.0E-03Copper (Cu) 2.0E-02 3.3E-02 3.5E-02 2.1E-02 1.2E-02 7.4E-03 7.4E-03 7.4E-03 7.4E-03 7.4E-03Iron (Fe) 5.6E-01 1.4E+00 1.4E+00 8.3E-01 6.1E-01 1.0E-02 1.0E-02 1.0E-02 1.0E-02 1.0E-02Lead (Pb) 1.5E-03 2.4E-03 2.5E-03 1.8E-03 1.4E-03 1.1E-04 1.1E-04 1.1E-04 1.1E-04 1.1E-04Magnesium (Mg) 7.3E+00 1.0E+01 1.1E+01 9.0E+00 8.4E+00 2.2E+00 2.2E+00 2.2E+00 2.2E+00 2.2E+00Manganese (Mn) 7.4E-02 1.3E-01 1.4E-01 8.7E-02 5.7E-02 3.2E-02 3.2E-02 3.2E-02 3.2E-02 3.2E-02Mercury (Hg) 6.0E-06 6.0E-06 6.0E-06 6.0E-06 5.7E-06 6.0E-06 6.0E-06 6.0E-06 6.0E-06 6.0E-06Molybdenum (Mo) 3.3E-03 3.7E-03 3.9E-03 4.2E-03 4.6E-03 4.8E-05 4.8E-05 4.8E-05 4.8E-05 4.8E-05Nickel (Ni) 6.8E-02 1.1E-01 1.1E-01 7.2E-02 4.5E-02 8.0E-02 8.0E-02 8.0E-02 8.0E-02 8.0E-02Phosphorous (PO4) 0.0E+00 0.0E+00 0.0E+00 0.0E+00 0.0E+00 2.1E-02 2.1E-02 2.1E-02 2.1E-02 2.1E-02Potassium (K) 7.8E+00 1.3E+01 1.4E+01 7.7E+00 4.0E+00 1.5E+00 1.5E+00 1.5E+00 1.5E+00 1.5E+00Selenium (Se) 1.9E-03 2.1E-03 2.1E-03 2.1E-03 2.0E-03 1.6E-04 1.6E-04 1.6E-04 1.6E-04 1.6E-04Silica (SiO2) 0.0E+00 0.0E+00 0.0E+00 0.0E+00 0.0E+00 1.7E+00 1.7E+00 1.7E+00 1.7E+00 1.7E+00Silver (Ag) 7.0E-04 7.1E-04 7.4E-04 8.3E-04 9.1E-04 3.5E-05 3.5E-05 3.5E-05 3.5E-05 3.5E-05Sodium (Na) 4.6E+01 1.0E+02 1.1E+02 5.6E+01 2.8E+01 1.5E+00 1.5E+00 1.5E+00 1.5E+00 1.5E+00Thallium (Tl) 1.0E-03 8.8E-04 9.3E-04 1.3E-03 1.7E-03 1.4E-05 1.4E-05 1.4E-05 1.4E-05 1.4E-05Zinc (Zn) 2.9E-02 6.2E-02 5.6E-02 4.1E-02 3.7E-02 3.0E-03 3.0E-03 3.0E-03 3.0E-03 3.0E-03Nitrate (NO3) 5.1E-02 4.3E-02 4.5E-02 6.7E-02 8.2E-02 2.1E-03 2.1E-03 2.1E-03 2.1E-03 2.1E-03Ammonia (NH4) 5.1E-02 4.3E-02 4.5E-02 6.7E-02 8.2E-02 2.1E-03 2.1E-03 2.1E-03 2.1E-03 2.1E-03
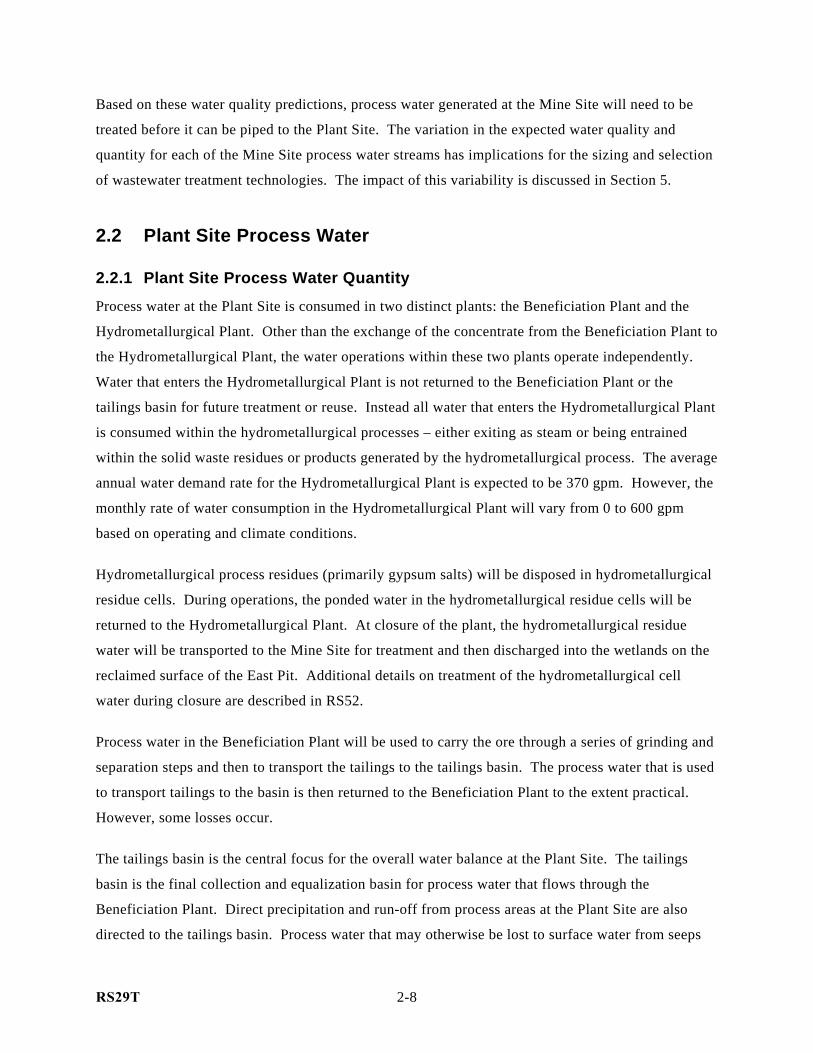
RS29T 2-8
Based on these water quality predictions, process water generated at the Mine Site will need to be
treated before it can be piped to the Plant Site. The variation in the expected water quality and
quantity for each of the Mine Site process water streams has implications for the sizing and selection
of wastewater treatment technologies. The impact of this variability is discussed in Section 5.
2.2 Plant Site Process Water
2.2.1 Plant Site Process Water Quantity
Process water at the Plant Site is consumed in two distinct plants: the Beneficiation Plant and the
Hydrometallurgical Plant. Other than the exchange of the concentrate from the Beneficiation Plant to
the Hydrometallurgical Plant, the water operations within these two plants operate independently.
Water that enters the Hydrometallurgical Plant is not returned to the Beneficiation Plant or the
tailings basin for future treatment or reuse. Instead all water that enters the Hydrometallurgical Plant
is consumed within the hydrometallurgical processes – either exiting as steam or being entrained
within the solid waste residues or products generated by the hydrometallurgical process. The average
annual water demand rate for the Hydrometallurgical Plant is expected to be 370 gpm. However, the
monthly rate of water consumption in the Hydrometallurgical Plant will vary from 0 to 600 gpm
based on operating and climate conditions.
Hydrometallurgical process residues (primarily gypsum salts) will be disposed in hydrometallurgical
residue cells. During operations, the ponded water in the hydrometallurgical residue cells will be
returned to the Hydrometallurgical Plant. At closure of the plant, the hydrometallurgical residue
water will be transported to the Mine Site for treatment and then discharged into the wetlands on the
reclaimed surface of the East Pit. Additional details on treatment of the hydrometallurgical cell
water during closure are described in RS52.
Process water in the Beneficiation Plant will be used to carry the ore through a series of grinding and
separation steps and then to transport the tailings to the tailings basin. The process water that is used
to transport tailings to the basin is then returned to the Beneficiation Plant to the extent practical.
However, some losses occur.
The tailings basin is the central focus for the overall water balance at the Plant Site. The tailings
basin is the final collection and equalization basin for process water that flows through the
Beneficiation Plant. Direct precipitation and run-off from process areas at the Plant Site are also
directed to the tailings basin. Process water that may otherwise be lost to surface water from seeps

RS29T 2-9
around the perimeter of the tailings basin is captured and returned to the basin. The collection of
seep water will help to protect surface water quality (by eliminating a discharge) and to minimize the
volume of make-up water required. The primary losses of water from the tailings basin system
include evaporation, loss to storage within the pores of the deposited tailings, and water that moves
to the deep groundwater beneath the tailings basin. These water losses will be made-up by a
combination of treated Mine Site process water and, if necessary, new water from Colby Lake.
A detailed evaluation of the process water balance for the tailings basin has been prepared and is
included in RS13A. Figure 3 summarizes the primary flow components of the tailings basin process
water balance. The water balance model for the tailings basin shows that wastewater discharge from
the tailings basin to surface water is not required to maintain an adequate working volume within the
tailings basin.
2.2.2 Plant Site Process Water Quality
A detailed evaluation of the water quality within the tailings basin is included in RS54A/RS46. This
model incorporates the predicted effluent quality from the WWTF at the Mine Site estimated in
Section 5 of this report.
The tailings basin equalizes water quality at the Plant Site in the same manner that it equalizes flows.
The quality of water in the tailings basin is dependent on the variability and nature of all of the
sources, as well as chemical reactions that may occur within the tailings basin or Beneficiation Plant.
The quality of the process water in the tailings basin has been estimated by combining the volumetric
inputs to the basin with chemical inputs from the beneficiation process, the make-up water (in the
form of treated water from the Mine Site or from Colby Lake), return seepage, run-on to the basin,
and chemical reactions occurring within the basin. Of these flows, the dominant source of dissolved
chemicals is expected to be the treated wastewater from the Mine Site. Thus, the water quality
within the basin will be dependent on the type of wastewater treatment implemented at the Mine Site.
One of the objectives for wastewater treatment at the Mine Site will be to maintain the quality of the
water in the tailings basin so that it can be recycled through the Beneficiation Plant. In addition, any
water that leaves the basin, eventually entering the groundwater regime, would need to have adequate
quality to protect the groundwater resource. These two criteria have been used to establish treatment
goals for tailings basin process water in this report.

RS29T 2-10
Within the basin the predominant chemical activities are continued oxidation of tailings exposed to
intermittent weathering (for example on beaches), settling and filtration of fine particles during
seepage through the tailings, and adsorption or precipitation of chemicals onto the solid surfaces of
the tailings.

RS29T 3-1
3.0 Process Water Quality Targets
In this section, water-quality-based process targets for wastewater treatment are developed for both
the Mine Site and Plant Site process waters. The parameters of concern addressed in this section, as
described in Phase 1 of the SOW for RS29T are pH, metals, mercury, sulfate, salinity, nutrients, and
organics. Although no water is expected to be discharged to surface waters at either the Mine Site or
the Plant Site, these process targets have been developed as benchmarks for the evaluation of
potential wastewater treatment technologies, which are described in Section 4. Treatment of
wastewater to these process targets would significantly reduce the need for contingency planning or
other regulatory requirements that may otherwise be needed to pipe process water from the Mine Site
to the tailings basin or to store process water within the tailings basin.
The process water quality targets are based on potential discharge limits for surface water and
groundwater. Water that is stored in the tailings basin with concentrations below the surface water
quality discharge limits has no potential to adversely impact surface water quality in the event that
water would need to be released, or would potentially seep from the basin to surface water.
Similarly, water that is lost from the tailings basin to groundwater will not impact the quality of the
groundwater if it already meets limits that have been established to prevent degradation of the
groundwater resource. Thus, by considering both surface water and groundwater standards in the
development of process water quality targets, those targets are conservative.
While discharge of treated process waters to surface waters will be eliminated during operations,
potential discharge to surface water may occur after closure. The surface water discharge criteria for
water that may be treated and discharged to surface water after closure will be addressed in RS52.
3.1 Potential Surface Water Quality Standards Both the Mine Site and the Plant Site are located within the Lake Superior watershed basin, more
specifically within the upper reaches of the St. Louis River watershed. The Mine Site is located
within the Partridge River watershed, which flows into the St. Louis River. The Process Plant is also
located within the Partridge River watershed. A portion of the tailings basin is located within the
Partridge River watershed in the headwaters to Knox Creek (Second Creek). The majority of the
tailings basin is located within the Embarrass River watershed. The Embarrass River flows into the
St. Louis River downstream of the confluence of the Partridge and St. Louis Rivers.

RS29T 3-2
In-stream surface water quality standards for both the Embarrass River and the Partridge River have
been established by the State of Minnesota. Both the Partridge River and the Embarrass River are
classified by the State of Minnesota as Class 2B waters in accordance with Minnesota Rules1. The
water quality standards for Class 2B streams have been established to protect aquatic life as well as
recreational uses. In addition, because these surface waters are part of the Lake Superior Basin
watershed, additional water quality rules for certain parameters such as dissolved metals supersede
the general Class 2B rules2. Combining the information from these two rules, the in-stream surface
water quality values for parameters potentially significant to the NorthMet operation are listed in
Table 3. A hardness of 400 mg/L was assumed in order to calculate the hardness-dependent metals
standards, as it is likely that the treated water will have hardness from lime treatment. Potential
surface water standards for lower stream classifications may also be applicable to Class 2B waters to
protect the use of the water for other uses. Although these additional standards are not needed to
protect aquatic life, they are also included in Table 3.
Because these surface water standards presented in Table 3 are the ‘in stream’ concentrations, they
represent conservative values for process water quality targets because process water will not be
discharged to surface waters and any actual surface water discharge limits would be developed with
consideration of base flow conditions and the potential for mixing within the stream.
1 MN Rule 7050.0222 Subpart 4. 2 MN Rule 7052.0222 Subpart 5
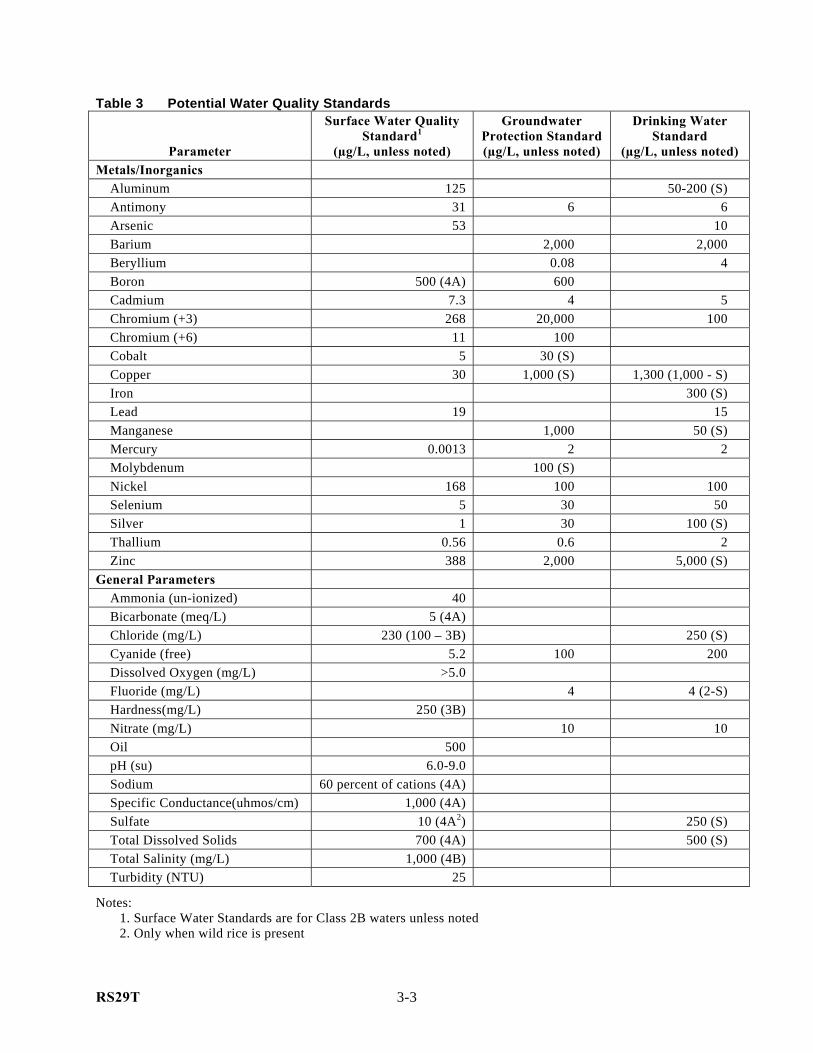
RS29T 3-3
Table 3 Potential Water Quality Standards
Parameter
Surface Water Quality Standard1
(µg/L, unless noted)
Groundwater Protection Standard (µg/L, unless noted)
Drinking Water Standard
(µg/L, unless noted) Metals/Inorganics
Aluminum 125 50-200 (S) Antimony 31 6 6 Arsenic 53 10 Barium 2,000 2,000 Beryllium 0.08 4 Boron 500 (4A) 600 Cadmium 7.3 4 5 Chromium (+3) 268 20,000 100 Chromium (+6) 11 100 Cobalt 5 30 (S) Copper 30 1,000 (S) 1,300 (1,000 - S) Iron 300 (S) Lead 19 15 Manganese 1,000 50 (S) Mercury 0.0013 2 2 Molybdenum 100 (S) Nickel 168 100 100 Selenium 5 30 50 Silver 1 30 100 (S) Thallium 0.56 0.6 2 Zinc 388 2,000 5,000 (S)
General Parameters Ammonia (un-ionized) 40 Bicarbonate (meq/L) 5 (4A) Chloride (mg/L) 230 (100 – 3B) 250 (S) Cyanide (free) 5.2 100 200 Dissolved Oxygen (mg/L) >5.0 Fluoride (mg/L) 4 4 (2-S) Hardness(mg/L) 250 (3B) Nitrate (mg/L) 10 10 Oil 500 pH (su) 6.0-9.0 Sodium 60 percent of cations (4A) Specific Conductance(uhmos/cm) 1,000 (4A) Sulfate 10 (4A2) 250 (S) Total Dissolved Solids 700 (4A) 500 (S) Total Salinity (mg/L) 1,000 (4B) Turbidity (NTU) 25
Notes: 1. Surface Water Standards are for Class 2B waters unless noted 2. Only when wild rice is present

RS29T 3-4
3.2 Potential Groundwater Quality Standards While direct seepage to surface waters or wetlands will be actively controlled, PolyMet recognizes
that deep seepage to groundwater will occur during operation of the tailings basin and after closure.
The State of Minnesota has established Rules for the protection of groundwater resources3. In
addition, the U.S. EPA has established regulations to protect human health by limiting contaminants
in drinking water4.
PolyMet is the closest groundwater user to the tailings basin. A shallow bedrock well is located
approximately one-mile to the southwest of the tailings basin near the offices. The next closest
groundwater users are residential wells a minimum of 1.5 miles north of the tailings basin. While
these distances provide considerable buffer between the tailings basin and potential groundwater
users, the use of groundwater standards as process water quality targets within the basin provides
additional conservatism as they are intended to be protective of human health at the actual point of
use. The State of Minnesota groundwater standards and the U.S. EPA drinking water standards are
summarized in Table 3.
3.3 Anticipated Process Water Quality Targets Using the potential surface water quality standards and the potential groundwater quality standards,
anticipated process water quality targets have been developed for the parameters of concern listed in
the Work Plan for RS29T. Anticipated targets have been developed for both Mine Site process water
and for Plant Site process water (the tailings basin). These values are summarized in Table 4. These
values will provide the benchmark that will be used to evaluate the treatment of Mine Site and, if
necessary, Plant Site process water in the following sections.
3 MN Rules 4717.7100 to 4717.7800 4 40 CFR 141 (National Primary Drinking Water Regulations) and 40 CFR 143 (National Secondary Drinking Water Regulations).
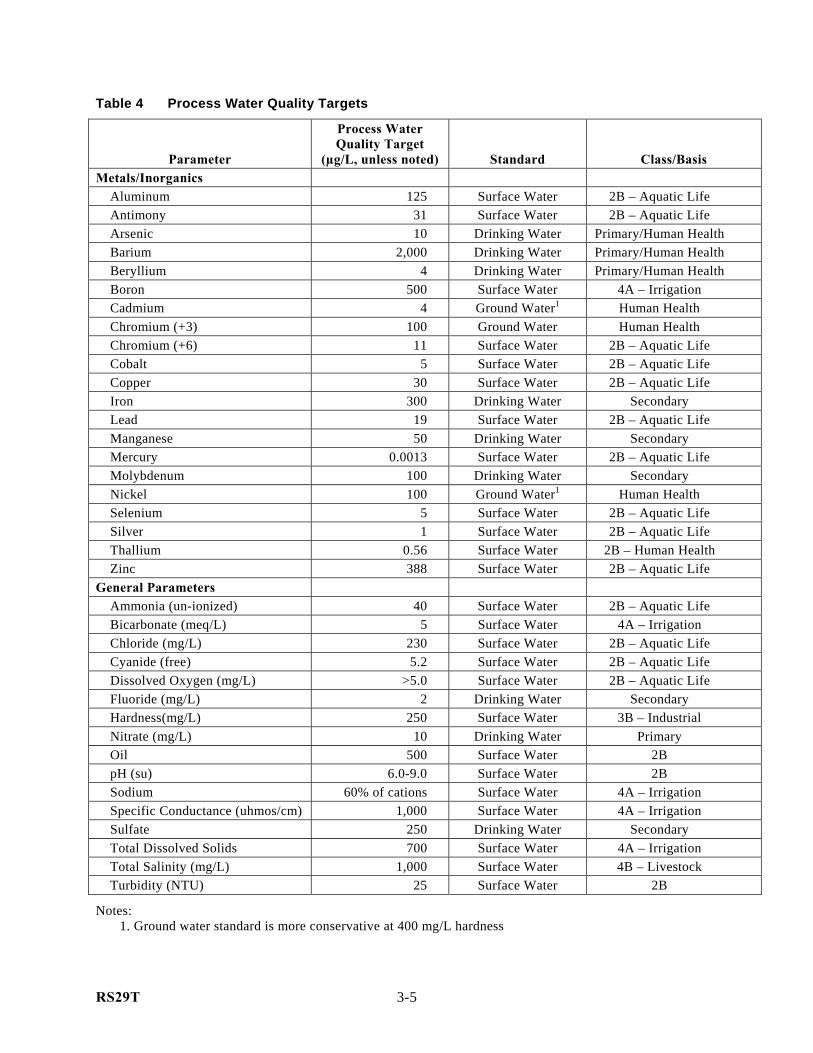
RS29T 3-5
Table 4 Process Water Quality Targets
Parameter
Process Water Quality Target
(µg/L, unless noted) Standard Class/Basis Metals/Inorganics
Aluminum 125 Surface Water 2B – Aquatic Life Antimony 31 Surface Water 2B – Aquatic Life Arsenic 10 Drinking Water Primary/Human Health Barium 2,000 Drinking Water Primary/Human Health Beryllium 4 Drinking Water Primary/Human Health Boron 500 Surface Water 4A – Irrigation Cadmium 4 Ground Water1 Human Health Chromium (+3) 100 Ground Water Human Health Chromium (+6) 11 Surface Water 2B – Aquatic Life Cobalt 5 Surface Water 2B – Aquatic Life Copper 30 Surface Water 2B – Aquatic Life Iron 300 Drinking Water Secondary Lead 19 Surface Water 2B – Aquatic Life Manganese 50 Drinking Water Secondary Mercury 0.0013 Surface Water 2B – Aquatic Life Molybdenum 100 Drinking Water Secondary Nickel 100 Ground Water1 Human Health Selenium 5 Surface Water 2B – Aquatic Life Silver 1 Surface Water 2B – Aquatic Life Thallium 0.56 Surface Water 2B – Human Health Zinc 388 Surface Water 2B – Aquatic Life
General Parameters Ammonia (un-ionized) 40 Surface Water 2B – Aquatic Life Bicarbonate (meq/L) 5 Surface Water 4A – Irrigation Chloride (mg/L) 230 Surface Water 2B – Aquatic Life Cyanide (free) 5.2 Surface Water 2B – Aquatic Life Dissolved Oxygen (mg/L) >5.0 Surface Water 2B – Aquatic Life Fluoride (mg/L) 2 Drinking Water Secondary Hardness(mg/L) 250 Surface Water 3B – Industrial Nitrate (mg/L) 10 Drinking Water Primary Oil 500 Surface Water 2B pH (su) 6.0-9.0 Surface Water 2B Sodium 60% of cations Surface Water 4A – Irrigation Specific Conductance (uhmos/cm) 1,000 Surface Water 4A – Irrigation Sulfate 250 Drinking Water Secondary Total Dissolved Solids 700 Surface Water 4A – Irrigation Total Salinity (mg/L) 1,000 Surface Water 4B – Livestock Turbidity (NTU) 25 Surface Water 2B
Notes: 1. Ground water standard is more conservative at 400 mg/L hardness

RS29T 3-6
When comparing these process water quality targets to the predicted process water quality at the
Mine Site (Table 2), the following objectives for wastewater treatment are identified:
• Mine Site process water will likely need to be treated to remove metals, including aluminum,
antimony, arsenic, cobalt, copper, iron, manganese, mercury, nickel, selenium, thallium, and
zinc.
• Mine Site concentrations of sulfate and hardness, along with the related parameters of TDS
and conductivity will likely also require treatment to reduce long-term build-up of these
parameters in the tailings basin. Salinity, in particular sodium and chloride, do not appear to
be present at concentrations that would require treatment.
• Plant Site process water will not need to be treated provided the treatment of Mine Site
process water, prior to use as make-up water, is adequate to maintain the water quality in the
tailings basin below the process water quality targets.
These potential treatment needs will be addressed in the identification and evaluation of potential
treatment technologies in the following sections.

RS29T 4-1
4.0 Summary of Potential Wastewater Treatment Technologies
This section contains a summary of information on potential wastewater treatment technologies. As
described in the SOW, the primary technologies to be considered in this report are: chemical
precipitation, reverse osmosis, ion exchange, constructed wetland, and membrane technology.
Because reverse osmosis is a specific type of membrane technology, these processes are described
together. Other potential biological treatment options, for example biological sulfate reduction, are
considered with wetland processes. This summary is not intended to be a comprehensive review of
all literature available on the treatment of mine water, as the available publications on this topic are
extensive. Rather, this review relies on examples where the proposed treatment technologies have
been employed on water with quality as close to the predicted quality of the Mine Site process water
as possible.
The parameters of potential concern listed in the SOW and discussed in the previous section included
pH, metals, mercury, sulfate, salinity, and nutrients. These parameters will be discussed in this
section in relation to the treatment technologies identified. However, the primary parameters
considered in this evaluation are metals and sulfate. For the purposes of this evaluation, the Mine
Site water quality presented in Table 2 is considered the potential influent for a wastewater treatment
facility (WWTF).
While pH is a potential parameter of concern, it is also – in the case of many wastewater treatment
systems – an operational control parameter. The pH of the Mine Site process water will likely need
to be modified during treatment operations and will be adjusted to within the target range as a final
treatment step. Similarly, the concentrations of nutrients in the Mine Site process water are relatively
low and while they are not likely to interfere with potential physical or chemical treatment systems
evaluated in this section, they would likely need to be supplemented for the operation of biological
treatment system. While nutrients would be a potential concern if discharged to surface water, the
elimination of a direct discharge to surface water from the site helps to reduce the potential concern
associated with nutrients in process water and the predicted concentrations of nitrogen and
phosphorous (Table 2) do not suggest that these parameters will be a concern in the tailings basin.
Mercury is present at very low concentrations in the waste rock and in the precipitation that enters
the Mine Site. Both of these sources contribute to the mercury load in the drainage from the waste
piles. While the effectiveness of the treatment systems evaluated in this section will consider

RS29T 4-2
mercury treatment, the water management plan envisions the discharge of treated Mine Site process
water to the tailings basin rather than to surface water. Discharging the treated Mine Site process
water into the tailings basin will provide additional mercury removal/treatment because it has been
shown that mercury will adsorb to taconite tailings and NorthMet tailings. Additional laboratory
testing conducted on behalf of PolyMet is included in Appendix B. This work supports the
observation that mercury is adsorbed by tailings. Thus, a majority of the mercury that remains in the
treated Mine Site process water will be absorbed and ultimately buried in the tailings basin prior to
discharge to groundwater. The NorthMet Project mercury mass balance is provided in RS66.
Organics (e.g., DRO, GRO and flotation reagents) were also identified as parameters of potential
concern, but these are not expected to be present in the Mine Site process water. While fuels
containing these materials will be used at the Mine Site, these chemicals would only be associated
with wastewater as a result of spills, rather than routine operations. Containment of spills related to
fueling operations is addressed in the SPCC plans for the Mine Site and the Plant Site (ER05 and
ER06). For this reason, these chemicals are not addressed in this section. Other organics used in the
Beneficiation Plant that will report to the tailings basin will be easily degraded or deposited with the
tailings to provide a long-term oxygen demand from the tailings basin that will reduce future
oxidation and release of inorganics. These parameters are considered in process water from the
Beneficiation Plant in Section 6.
4.1 Chemical Precipitation
4.1.1 Technology Description
Chemical precipitation treatment technologies for wastewater treatment rely on the insolubility of
various chemical compounds to remove chemicals of concern. In general, one or more chemicals can
be removed from the waste stream by the addition of other chemicals that will combine to form
insoluble products that can be separated from the liquid stream. A chemical precipitation operation
would consist of chemical addition, rapid mixing, coagulation, flocculation, and settling processes,
which would facilitate the formation and physical separation of the precipitate from the water.
Filtration could be used as a final polishing step for the water, if necessary. A filter press operation
would be used to remove as much water as possible from the solids. The treated water would then be
piped to the tailings basin for reuse while the dewatered solids could either be introduced into the
hydrometallurgical process or disposed with the hydrometallurgical residues.

RS29T 4-3
Several potential chemicals can be used to treat the process water from the Mine Site. Some
chemicals used in chemical precipitation processes will increase the pH (for example hydrated lime,
Ca(OH)2) to facilitate precipitation, while others require the addition of supplementary chemicals to
control pH within an optimum range to precipitate the desired chemical compound. The advantages
and disadvantages of various chemical precipitation techniques for removal of metals and sulfates (or
other salts) are discussed in the following sections.
4.1.2 Metal Precipitation Technologies
4.1.2.1 Hydroxide Precipitation
Hydroxide precipitation treatment is primarily used for the removal of heavy metals. Soluble heavy
metal ions are converted to insoluble metal-hydroxide precipitates that can be physically removed
from the water. Iron, manganese, and potentially magnesium also form precipitates that can be
removed, and in the case of iron and manganese, the solid hydroxides facilitate co-precipitation of
heavy metals and arsenic as well as nutrients such as phosphorous from the water. The addition of
soluble iron to the process can enhance the co-precipitation process, if necessary, to improve the
removal of metals.
Hydroxide precipitation is accomplished by adjusting the pH of the water to alkaline conditions
(generally around pH 10). The most common hydroxide precipitating agents are hydrated lime
(Ca(OH)2), caustic soda (NaOH), or magnesium hydroxide (Mg(OH)2). However, other alkaline
materials, such as Bauxol, cement kiln dust, or flyash could also be used. In mine wastewater
treatment, lime is the most common agent because the added calcium will combine with sulfate to
form gypsum (CaSO4-2H20) when excess sulfate is present. Excess calcium is also easier to
subsequently remove from the water than sodium, potassium, or trace contaminants that could be
introduced from other alkaline waste materials.
The solubility products for several metal hydroxides are summarized in Table 5. Because many
dissolved metals – including copper, nickel and zinc – exhibit amphoteric behavior (where a soluble
metal-hydroxide complex is stable when the pH exceeds that associated with the minimum
solubility), the optimum pH for hydroxide precipitation varies with changes in the influent metal
characteristics. For example, nickel is removed effectively at pH 10, while copper is removed at
pH 8. A single-stage hydroxide precipitation system could be designed to remove both nickel and
copper if sufficient iron and manganese are available to act as co-precipitates. Otherwise, a multi-
stage process, or additional iron salts may be needed to optimize removal of both these metals.

RS29T 4-4
Nickel hydroxide precipitation is also subject to competition with dissolved iron. Thus, sufficient
lime and residence time are required to facilitate removal of both iron and nickel.
Table 5: Solubility Products for Various Metal Hydroxides, Carbonates, and Sulfides
Metal Hydroxide
Hydroxide Solubility Product Carbonate
Carbonate Solubility Product Sulfide
Sulfide Solubility Product
Nickel Ni(OH)2 2.0 x 10⁻¹⁵ NiCO3 6.6 x 10⁻⁹ NiS 3 x 10-19 Copper Cu(OH)2 2.2 x 10⁻²⁰ CuCO3 1.4 x 10⁻¹⁰ CuS 6 x 10-37 Cobalt Co(OH)2 1.6 x 10⁻¹⁵ CoCO3 1.4 x 10⁻¹³ CoS 4.0 x 10⁻²¹ Zinc Zn(OH)2 1.2 x 10⁻¹⁷ ZnCO3 1.4 x 10⁻¹¹ ZnS 2 x 10-25 Iron Fe(OH)2 8.0 x 10⁻¹⁶ FeCO3 3.2 x 10⁻¹¹ FeS 6 x 10-19
Calcium Ca(OH)2 5.5 x 10⁻⁶ CaCO3 3.8 x 10⁻⁹ CaS
At NorthMet, the hydroxide precipitation process would likely consist of chemical addition and rapid
mixing to raise the pH, coagulation and flocculation to allow the precipitates to form, physical
(gravity) settling to remove the floc from the water, filtration (as necessary), and a final pH
neutralization step. If lime is used to raise the pH, carbon dioxide or sodium bicarbonate would be
used for neutralization so that additional calcium can be precipitated as calcium carbonate and
removed during the neutralization step, reducing the hardness of the treated water.
The solids generated by this operation would be filter-pressed to remove any water, which would be
returned to the water treatment operation. The dewatered solids would contain hydroxides and could
either be introduced into the hydrometallurgical process or disposed with the hydrometallurgical
residues from the hydrometallurgical process. A portion of the solid precipitate can also be recycled
to the beginning of the chemical precipitation process to stimulate the initial crystallization process.
This variation of chemical precipitation treatment is commonly referred to as a high-density-sludge
(HDS) operation.
The primary advantages of hydroxide precipitation are that it is a well-established and simple
technology and that it is relatively inexpensive when compared to other treatment technologies. For
these reasons, lime treatment is perhaps the most commonly used treatment for removing heavy
metals from mining wastewaters. The primary disadvantage with hydroxide precipitation is that
some metals like manganese may not be adequately treated. In addition, some metals require either
oxidation or reduction before they can be effectively precipitated as hydroxides. For example,
selenium (+6) should be reduced to selenium (+4), while arsenite (+3) should be oxidized to arsenate

RS29T 4-5
(+5) to enhance precipitation. Oxidizing cobalt (+2) to cobalt (+3) also greatly enhances removal via
hydroxide precipitation.
Bench-scale testing of metal hydroxide precipitation was conducted to evaluate potential application
of this technology to the Mine Site process water. A sample of wastewater from the Dunka waste
rock stockpiles, located near the PolyMet site, was used as the influent water for the bench-scale
testing. The results of this testing are summarized in RS45 and included with this report in
Appendix C. The results of this work show that, with the exception of mercury, all of the metals
concentrations can be reduced to below the process water quality targets (see Table 9 of
Attachment C2 in Appendix C).
4.1.2.2 Sulfide Precipitation
The sulfide precipitation process involves the conversion of soluble metal compounds to relatively
insoluble sulfide compounds through the addition of precipitating agents such as: sodium sulfide
(Na2S), sodium hydrosulfide (NaHS), ferrous sulfide (FeS) and calcium sulfide (CaS). As shown in
Table 5, metal the solubility product of metal sulfides are generally two or more orders of magnitude
less than the solubility product of comparable metal hydroxides. Additionally, metal sulfides do not
exhibit amphoteric behavior, and are less sensitive to changes in pH. Efficient metal sulfide
precipitation can be achieved over a wide pH range (2 to 12). However, high pH (pH>7) is required
to prevent formation of hydrogen sulfide (H2S) gas. The kinetic rate for the formation of a sulfide
precipitate is faster than hydroxide precipitation, resulting in a lower required retention times for
reaction vessels.
The primary disadvantages of metal sulfide precipitation technology are: potential production of H2S
gas, potential residual sulfide in treatment effluent, higher capital and operating costs than hydroxide
precipitation, increased process complexity compared to hydroxide precipitation, and potential
difficulties with floc settlement.
Operationally, sulfide precipitation would be similar to hydroxide precipitation. The process would
likely be initiated with a lime addition step and rapid mix tank to raise the pH. Any precipitation that
occurs as a result of this step could be segregated using a conventional coagulation, flocculation and
settling operation or could remain suspended during the next phase of treatment. Next, sulfide would
be added to the high pH water using another sequence of chemical feed, rapid mix, coagulation,
flocculation, and settling. A filtration step may also be needed at the end. Other variations on the
sequence of operation could also be considered to match the specific type of sulfide reagent used in

RS29T 4-6
the process. The two most commonly used sulfide precipitation processes, soluble sulfide
precipitation (SSP) and insoluble sulfide precipitation (ISP), are summarized in Table 6.
Table 6 Comparison of Sulfide Precipitation Technologies
Process Chemical(s) Advantages Disadvantages Safety Measures
• Sodium Sulfide (Na2S)
Soluble Sulfide Addition
• Sodium Hydrosulfide (NaHS)
• High solubility of these precipitating agents allows the use of high sulfide concentrations in the reaction chamber, causing rapid precipitation of metal sulfides.
• Operation can generally achieve very low effluent concentrations.
• Formation of small (pin) floc that may have poor settling characteristics and often requires the addition of a polymer or other chemical to aid in the coagulation of a settleable or filterable precipitate.
• Potential to generate hydrogen sulfide gas.
• Potential for residual sulfide in the effluent.
• Soluble sulfide dose must be sufficient to remove both iron and nickel.
• Gas generation is mitigated by operating at an elevated pH
• Sulfide quenching chemicals used to control the residual concentration of dissolved sulfide in effluent.
Insoluble Sulfide Addition
Ferrous Sulfide (FeS) – Sulfex Process (EPA 625/8-80-003).
• Metals with a lower solubility product than iron will exchange with iron and be precipitated as sulfides.
• Process works well for metals such as copper and zinc where the solubility product of the metal sulfide is several orders of magnitude less than FeS.
• Solubility products for NiS and FeS are similar (same order of magnitude).
• Nickel must be present at concentrations greater than Fe2+ for removal to occur.
• FeS is unstable and must be generated onsite.
• Sulfex process typically requires 2 to 4 times the stoichiometric amount of FeS
• Large amount of sludge (up to 3 times more than lime precipitation) is produced.
• Low solubility of FeS limits H2S production and effluent sulfide concentrations.
Calcium sulfide (CaS)
• Calcium particles act as nuclei for metal-sulfide precipitates.
• CaS precipitation is capable of lower effluent nickel concentrations than Sulfex process.
• CaS precipitation provides less sludge than Sulfex process.
• Limited solubility of CaS minimizes the potential for H2S generation and sulfide overdose.

RS29T 4-7
Testing of sulfide precipitation was planned for the bench scale chemical precipitation testing,
however, this work was not completed because the hydroxide precipitation test, using a HDS
simulation (solids recycle) was capable of achieving concentrations below the process water quality
targets for all parameters other than mercury.
4.1.2.3 Carbonate Precipitation
The carbonate precipitation process uses a carbonate precipitating agent such as soda ash (Na2CO3),
sodium bicarbonate (Na(HCO3)2), or calcium carbonate (CaCO3). Calcium carbonate results in faster
precipitation kinetics, but greater sludge volume than sodium carbonate. The optimum pH range for
carbonate precipitation is 7 to 9. In this pH range, metal carbonate precipitates are generally less
soluble than metal hydroxides, but more soluble than metal sulfides. Additionally, at this range, pH
adjustment after precipitation would not be required. The advantages of carbonate precipitation
include: carbonate sludge may be more amenable to subsequent metals recovery than hydroxide
sludge, carbonate reagents are relatively easy to handle, and lower pH conditions are required for
optimum treatment.
The disadvantages of this process are: carbonate sludge is gelatinous and difficult to settle, and the
similarity in solubility products for calcium carbonate and nickel carbonate makes the removal of
nickel via carbonate precipitation difficult. If the dissolved Ca2+ is assumed to be in equilibrium with
CaCO3, the minimum effluent nickel concentration that can be achieved via carbonate precipitation is
3.6 mg/L. Likewise, carbonate precipitation of copper and cobalt (2+) results in minimum effluent
concentrations of 85 μg/L, and 59 μg/L, respectively. Zinc, iron, and manganese carbonate
precipitation result in minimum effluent concentrations of 8.7 μg/L, 0.5 μg/L, and 12.4 μg/L,
respectively. Thus, while carbonate precipitation may be able to meet zinc, manganese, and iron
process standards, it is likely insufficient to achieve the process water quality targets for nickel,
cobalt, or copper. Because carbonate precipitation would only be applicable to a limited number of
metal parameters, no bench scale testing of this process was considered.
4.1.2.4 Xanthate Floatation
Xanthates are sulfonated organic compounds that are able to exchange sodium or potassium for
heavy metals. High pH (>9) is typically required. The exchange of heavy metals with sodium results
in precipitation of the xanthate-metal complex. The main disadvantage of this process is the large
amount of sludge generated. Advantages of this process are: the process is less sensitive to pH
fluctuations and is capable of removing selective metals. In addition, this process is operationally

RS29T 4-8
similar to the chemical separation process that will be used in the flotation plant to separate the
concentrate from the ore. Thus, any solids generated in this process may be more amenable to
further processing and metal recovery in the hydrometallurgical process with less impact to the
operation than other potential wastewater solids. This operation was considered less favorable than
hydroxide precipitation and no bench-scale testing of this operation was considered.
4.1.3 Chemical Precipitation Technologies for Sulfate and other Salts
Sulfate, phosphorous, nitrate and several other dissolved solids, in addition to metals as described
above, can also be removed using various chemical precipitation technologies. In general, these
technologies work better for divalent cations and anions, and for larger compounds. If necessary,
some of these chemical technologies can be modified to remove chloride, potassium, and larger
monovalent cations. Because the modeling of water quality in the tailings basin did not show that
sodium, potassium, chloride, phosphorous, or nitrate were likely to be at concentrations of concern in
the beneficiation process or the tailings basin, the following discussion of chemical treatment
technologies is focused primarily on the removal of sulfate.
4.1.3.1 Lime Treatment Processes
Treatment of sulfate laden mine waters with calcium, either in the form of calcium carbonate or
hydrated lime, as discussed for heavy metals removal, will result in the precipitation of gypsum
(CaSO4-2H2O) when sulfate is present at concentrations that exceed the solubility of gypsum. This
generally occurs when the concentration of sulfate exceeds 1,500 mg/L. However, gypsum crystals
form slowly and the onset of precipitation can be delayed resulting in concentrations in solution that
exceed those expected by solubility (Abdel-Aal, et. al., 2004). To increase the rate at which the
gypsum precipitate will form, the HDS process is commonly used.
4.1.3.2 Ultra High Lime Processes
In conventional lime treatment, where the influent concentration of sulfate is high enough to promote
gypsum precipitation, the concentration of sulfate in the effluent is generally on the order of 1,500
mg/L. The effluent sulfate concentration is limited by the solubility of gypsum, which is also a
function of the calcium concentration. The molar ratio of calcium to sulfate at saturation is typically
on the order of 0.3 (Abdel-Aal, et. al., 2004). Thus, increasing the concentration of calcium in
solution can result in a further reduction of sulfate along with silica and other oxyanions. This
concept has been demonstrated in the ultra-high lime process (Batchelor, et. al., 1991). In this
process, higher doses of lime are added to the water, raising the pH to between 11 and 12. In the

RS29T 4-9
presence of higher pH additional magnesium will precipitate and additional calcium will combine
with silicates as well as sulfate to further reduce the concentration of dissolved anions. While this
process is commonly used to treat air pollution control scrubber waters, it has not been used
extensively in mine wastewater applications.
4.1.3.3 Ultra High Lime with Aluminum
New methods for the precipitation of additional sulfate – beyond values achievable by gypsum
precipitation alone – have been developed by adding aluminum salts to the ultra-high lime process.
This form of chemical precipitation for sulfate removal has been investigated in several
configurations for the treatment of mine wastewater (Lorax, 2003). Two of these potential processes
have been evaluated at the pilot-scale or larger – the SAVMIN process and the WalhallaTM process.
Both of these technologies use a multi-step treatment train that begins with conventional lime
treatment to remove sulfate as gypsum. After this initial treatment, aluminum is added in a follow-up
step to form calciumaluminosulfate (Ca6(Al(OH)6)2)(SO4)3*26H2O), which is also referred to by the
mineral name ettringite and is virtually insoluble when the pH is maintained between approximately
11.4 and 12.4. The high pH requirement for the formation of this precipitate makes this process
well-suited as an add-on technology for conventional or high-lime treatment processes.
The SAVMIN process, which has been demonstrated at the pilot-scale, uses aluminum hydroxide as
the aluminum source (Smit and Sibilski, 2003). Using a wastewater with an influent sulfate
concentration of approximately 700 mg/L, the potential effluent sulfate concentrations reported from
this operation were less than 100 mg/L. The unique component of the SAVMIN is the use of a pH
reduction step following ettringite precipitation. This step dissolves the ettringite, promotes the
re-precipitation of sulfate as gypsum, and allows the aluminum hydroxide to be recovered for re-use
in the ettringite precipitation operation. This operation saves money by reducing the cost for
aluminum, and converts the precipitate to a more stable form, because gypsum is stable across a wide
range of pH values.
The Walhalla™ process uses a proprietary chemical – SX-44 – to precipitate ettringite, and has been
pilot-tested using sulfate laden mine water from the Berkeley Pit in Montana (EPA, 1999). In a
series of tests using water with an initial sulfate concentration of up to 8,000 mg/L, the Walhalla
process was capable of reducing the effluent sulfate concentration to less than 500 mg/L, the target
effluent concentration for the study. This result was obtained by varying the concentration of SX-44
reagent added to the process and the retention time used to allow the ettringite precipitation reaction
to occur. The preferred operating values were a reagent addition rate of approximately an equal mass

RS29T 4-10
of SX-44 to sulfate and a reaction time of approximately 90 minutes. The primary differences
between the Walhalla process and the SAVMIN process include the replacement of generic
aluminum hydroxide with SX-44, which is obtained from the cement industry, and elimination of the
ettringite dissolution step. While both processes have been shown to remove significant sulfate from
mine wastewaters, recycling of the aluminum in the SAVMIN process significantly lowers the cost of
this technology in comparison to the Walhalla process.
4.2 Reverse Osmosis and other Membrane Technologies
4.2.1 Technology Description Reverse osmosis (RO) and other membrane technologies separate water from a mixed solution
containing suspended and dissolved solids by forcing the water molecules through a semi permeable
membrane (nmfrc.org). In general, membranes technologies work by passing water while retaining
the suspended or dissolved items that are removed from the water.
Membranes are divided into four basic categories by decreasing pore size – microfiltration,
ultrafiltration, nanofiltration, and RO. Microfiltration and ultrafiltration are generally not capable of
removing ‘dissolved’ constituents, but are very good at removing small particulates or suspended
solids. For this reason, microfiltration or ultrafiltration are often used as pre-treatment for
nanofiltration or RO operations, and would be suitable final polishing steps for solids removal from
chemical precipitation treatment operations. Nanofiltration is similar to reverse osmosis in removing
dissolved constituents from water. However, it is not generally capable of removing small, mono-
valent ions such as sodium or chloride. Nanofiltration can be used to remove sulfate and larger salts
as well as divalent cations such as calcium, magnesium (Davis and McElhiney, 2002). Nanofiltration
could also be used to remove dissolved heavy metals of potential concern at NorthMet. RO
membranes have the smallest pore sizes and can restrict the flow of virtually all molecules other than
water. For this reason, RO is capable of removing a high percentage of almost all inorganic ions,
turbidity, bacteria, and viruses (gewater.com). RO membranes are among the few viable
technologies for removing highly soluble mono-valent cations and anions such as sodium and
chloride from water.
In membrane treatment, as pressure is applied to the mixed solution, water – and other constituents,
based on the membrane type – passes through pores in the membrane. The purified stream that
passes through the membrane is called permeate, and the remaining stream containing a higher
concentration of suspended and/or dissolved solids is called the concentrate or the brine. The cost to

RS29T 4-11
apply this pressure is one of the major operating expenses with membrane systems. Recent
improvements in the use of membrane treatment have focused on reducing the pressure required to
achieve separation across the membrane.
Membrane technologies work on particulate and dissolved species simultaneously, so the application
of this technology to all the potential dissolved chemicals of concern at NorthMet is considered at the
same time in the following paragraphs. Moreover, because the ionic species permeate the membrane
as ion-pairs, the rejection of an ion is also dependent on the rejection of its counter-ion. For
example, sodium rejection is greater when the counter-ion is sulfate (Na2SO4) than when the counter-
ion is chloride (NaCl) (gewater.com), primarily due to the differences in solubility. This limitation
to a membrane treatment system for NorthMet is discussed below.
For mine wastewaters, calcium sulfate scaling is typically the factor limiting water recovery for a RO
or nanofiltration system. This could be a concern for process water from the Mine Site. The
maximum achievable recovery can be estimated as follows (EPA, 1973):
−+ ××−= 24
2055.0100 SOCaR
Where: R = Maximum recovery, percent
Ca = Calcium concentration, mg/L
SO4 = Sulfate concentration, mg/L
Softening of the influent stream via chemical precipitation, ion exchange, or some other treatment
could increase the maximum recovery of a membrane system. Antiscalants have also been shown to
reduce the potential precipitation of gypsum and allow increased recovery of permeate in membrane
systems (Le Gouellec, and Elimelech, 2002). Because Mine Site process water is likely to have high
calcium and sulfate concentrations, pretreatment could likely include chemical precipitation,
filtration, pH adjustment, and potentially antiscalant or antimicrobial addition. Depending on the
ammonia content of the water, breakpoint chlorination may also be required to prevent degradation
of the membrane by free ammonia.
The brine produced by membrane treatment of Mine Site process water could potentially contain
high concentrations of metals and salts. The brine could be treated using chemical precipitation, or
may be suitable for direct metal recovery in the hydrometallurgical plant. If chemical precipitation is
used, the precipitated solids would be either sent to the hydrometallurgical process or the
hydrometallurgical residue cells. If the brine is treated using chemical precipitation, the remaining

RS29T 4-12
liquids could potentially be blended with the permeate prior to being sent to the tailings basin.
Alternatively, this waste stream could be thickened using evaporators, crystallizers, and a filter press.
The resultant solids could be disposed in the hydrometallurgical residues cells or at a permitted
landfill.
4.2.2 Membrane Types
The most important component of any membrane treatment system is the semi-permeable membrane.
Three major types of membranes are commonly used, each having different engineering properties,
which are summarized in Table 7 (Aquatechnology.net).
Table 7 Comparison of Membranes Types
Feature Cellulosic Aromatic Polyamide Thin Film Composite* Rejection of Organic L M H Rejection of Low Molecular Weight Organics M H H Water Flux M L H pH Tolerance 4-8 4-11 2-11 Temperature Stability Max 35 deg. C. Max 35 deg. C. Max 45 deg. C. Oxidant Tolerance (e.g., free chlorine) H L L Compaction Tendency H H L Biodegradability H L L Cost L M H
L = Low; M = Medium; H = High *Thin film composite type having polyamide surface layer
Of the three basic membrane types, cellulosic membranes have the lowest unit cost and are most
resistant to degradation by free chlorine. However, they have several limitations. Due to their
asymmetric structure, they are susceptible to compaction (collapsing of membrane pores under high
temperature) under high operating pressures especially at elevated temperatures. In addition, they
are also susceptible to alkaline hydrolysis, and biodegradation. The operating pH for these
membranes is 4 to 8.
Aromatic polyamide membranes are more resistant to biodegradation and alkaline hydrolysis than
cellulosic membranes. The operating pH for these membranes is 4 to 11. Even though these
membranes are subject to compaction at high temperatures and pressures, they have the capacity to
withstand higher temperatures when compared to cellulosic membranes. The salt and organic
rejection characteristics of these membranes are also better than that of cellulosic membranes. The

RS29T 4-13
principle limitation of these membranes is their susceptibility to degradation by oxidants such as free
chlorine. Ammonium ion can also degrade these membranes.
Thin film composite membranes comprise a thin, dense solute-rejecting film underlain by a porous
substructure. Thin film composite membranes offer similar advantages and disadvantages to
aromatic polyamide membranes. However, materials for the two layers can be selected to optimize
water flux and solute rejection, providing greater operational flexibility than other membrane types.
4.2.3 Membrane Configurations
Membrane treatment systems may be configured in a number of different ways:
• Plate-and-frame: Maintenance of these units is simple due to the nature of their assembly but
hydraulic flux across the membrane is limited by low specific surface area.
• Spiral-wound: The modules can be designed to use turbulence to enhance hydraulic flux and
decrease membrane fouling. However, maintenance of these units is difficult.
• Hollow-fiber: This configuration offers the greatest packing densities due to high specific
surface area of the hollow fibers.
• Tubular: This configuration offers enhanced resistance to fouling when operated under
turbulent influent conditions. The disadvantages of using a tubular module are high capital
costs and high energy requirements.
4.2.4 Operation and Maintenance
Membrane cleaning or replacement due to fouling is the most important maintenance requirement in
a membrane treatment operation. Membrane fouling typically occurs over a period of time due to
poor feed solution characteristics. Fouling due to suspended solids, chemical precipitates (scaling),
and biofilms can reduce membrane performance significantly. Membrane integrity is also affected
by extreme pH or oxidative attack. Thus, adequate pretreatment processes addressing these issues
are necessary to extend membrane life. Pretreatment may include chemical precipitation (softening),
filtration of suspended solids, pH adjustment, addition of antiscalants, or addition of antimicrobial
agents to prevent biofilm growth.

RS29T 4-14
4.2.5 Treatment of Acid Mine Drainage Using Reverse Osmosis Treatment of acid mine drainage via reverse osmosis has been studied at several different sites (U.S.
EPA, 1973). While these studies focused on the removal of iron, aluminum, magnesium, and
calcium, the removal characteristics should be similar for nickel, copper, cobalt, and zinc due to their
similarity in size and charge to iron and aluminum. Additionally, the operation and maintenance
experience gained from these applications can also be applied to NorthMet. Membrane fouling due
to calcium sulfate precipitation was identified as the principle limiting factor in operation of these
systems. Neutrolosis, or blending of recycled brine into the influent stream, was used to reduce
membrane fouling. Pretreatment included filtration (10 μm), ultraviolet disinfection, and pH
adjustment. A summary of these early membrane treatment operations using reverse osmosis are
summarized in Table 8.

RS29T 4-15
Table 8 Summary of Reverse Osmosis Treatment of Mine Wastewater
Treatment Performance Site
Membrane
Type
Flux
(gal/ft2/day)
Recovery
(%) Pre-
Treatment
pH Parameter Influent
(mg/L) Effluent (mg/L)
Removal (%)
Iron 103.3 1.8 98.3
Calcium 111.7 2.7 97.6
Magnesium 36 0.8 97.7
Aluminum 36.3 1.1 96.9
Norton Spiral-wound, modified cellulose acetate
16.8 to 18.8 @ 600 psi
80 Sand Filter, 10 um cartridge filter
3.1-3.7
Sulfate 913.3 13.9 98.5
Iron 1,300 29 97.8
Calcium 530 9.6 98.2
Magnesium 420 7.6 98.2
Aluminum 320 5.0 98.4
Morgan-town
Spiral-wound, modified cellulose acetate
13.5 to 19.2 @ 400 to 600 psi
50 Sand Filter, 10 um cartridge filter
2.24-3.14
Sulfate 10,900 190 98.3
Iron 98 1 99
Calcium 186.7 1.4 99.3
Magnesium 56 0.6 98.9
Aluminum 33 1.0 96.9
Ebensburg Spiral-wound, modified cellulose acetate
7.4 (50oF) to 11.9 (77oF) @ 400 psi
84 Sand Filter, 10 um cartridge filter
3.1- 4.8
Sulfate 1,547 12.7 99.2
Iron 105.7 1.1 99
Calcium 150 0.8 99.5
Magnesium 109.3 1.7 98.4
Aluminum 13.7 0.5 96.3
Mocanaqua Spiral-wound, modified cellulose acetate
16.8 to 18.8 @ 600 psi
84 10 um filter with UV
4.3
Sulfate 843 7.0 99.2
Note: Results reported for average of multiple runs at Norton (6), Ebensburg (3), and Mocanaqua (3) Reference: U.S. EPA, 1973.
Based on the results summarized in Table 8, membrane treatment, in particular microfiltration or
ultrafiltration as pretreatment for either RO or nanofiltration, is likely capable of producing water
that would meet the process water quality targets. The operating pressures used in earlier
demonstration tests were relatively high in comparison to typical pressures used today. Pilot testing
of membrane treatment technology with current membrane configurations will help to provide
additional input on the operating pressures required to achieve similar results and would provide a
brine stream that could be evaluated for chemical precipitation treatment.

RS29T 4-16
4.3 Ion Exchange
4.3.1 Technology Description
The ion exchange process involves the reversible exchange of ions between an insoluble substance
and the wastewater. The insoluble substance is usually a synthetic organic ion exchange resin
composed of high-molecular-weight polyelectrolytes that can exchange their mobile ions for ions of
similar charge from the surrounding medium. Each resin has a distinct number of mobile ion sites
that set the maximum quantity of exchanges per unit of resin (www.remco.com).
Ion exchange reactions are stoichiometric and reversible. As an example, a resin with hydrogen ions
available for exchange will exchange those ions for nickel ions from solution. The reaction can be
written as follows:
2(R-SO3H) + NiSO4 = (R-SO3)2Ni+ H2SO4 (2)
R indicates the organic portion of the resin and SO3 is the immobile portion of the ion active group.
Two resin sites are needed for nickel ions with a plus 2 valence (Ni+2).
When compared to other wastewater treatment alternatives, ion exchange appears to have greater
flexibility. While most ion exchange resins are designed for removal of specific chemicals of
concern, for example metals, different resin types have the capability to remove various chemicals,
and more than one resin can be used in series. Specialty resins are also available that can selectively
bond with specific cations for their removal. In addition, ion exchange can be used with fluctuating
flow rates. However, this technology may be limited by high concentrations of total dissolved solids
(http://www.nesc.wvu.edu).
Ion exchange treatment does not result in the creation of a solid waste, so it does not lead to solids
disposal problems, like chemical precipitation, thus lowering the operational costs for the disposal of
residual metal solids (Kurniawan et al., 2006). However, the resin does need to be regenerated,
either at the site or at an off-site location, which results in a brine waste, which would need to be
managed, similar to a membrane treatment approach. To apply ion exchange treatment of mine
wastewater, appropriate pretreatment such as removal of suspended solids, removal of organic
compounds, and pH adjustment would likely be required.
Chemical removal capabilities of various resin types are described in further detail in the following
paragraphs.

RS29T 4-17
4.3.2 Types of Ion Exchange Resins Ion exchange resins can be divided into three broad categories: cation exchangers, anion exchangers
and chelating resins. Cation exchangers have positively charged mobile ions available for exchange,
anion exchangers have negatively charged mobile ions for exchange, and chelating resins have a high
degree of selectivity for heavy metals (www.remco.com). The cation exchangers can in turn be
either strong or weak acid cation exchangers, and similarly the anion exchangers can be either strong
or weak base anion exchangers.
4.3.2.1 Strong Acid Cation Resins
These resins are highly ionized in both the acid (R-SO3H) and salt (R-SO3Na) form
(www.remco.com). The ionizable group in these resins is the sulfonic acid group (SO3H).The
hydrogen and sodium forms of strong acid resins are highly dissociated and the exchangeable Na+
and H+ are readily available for exchange over the entire pH range. Consequently, the exchange
capacity of strong acid resins is independent of solution pH.
4.3.2.2 Weak Acid Cation Resins
Weak acid cation resins have carboxylic acid (COOH) group as the exchange site. Weak acid resins
have a much higher affinity for hydrogen ions when compared to strong acid resins. The solution pH
has a strong influence on the dissociation of a weak acid resin. These resins are unsuitable for
deionizing acid mine drainage water, because they have a limited capacity below pH 6. However,
they require less acid for regeneration when compared strong acid and strong base resins.
4.3.2.3 Strong Base Anion Resins
The ionizable site in this type of resin is a trimethylammonium group. Strong base resins are highly
ionized and can be used over the entire pH range similar to the strong acid cation resins. These
resins can remove sulfate and similar anions from water; however, they are typically charged and
then subsequently regenerated with chloride ions. Thus, for Mine Site water with very high sulfate
concentrations, replacing sulfate with chloride would not provide complete treatment. This
operation, however, could potentially be advantageous as a pre-treatment step for a reverse osmosis
operation where eliminating sulfate would reduce the potential for gypsum to precipitate and foul the
membranes.

RS29T 4-18
4.3.2.4 Weak Base Anion Resins
Weak base anion resins have amino group as the ionizable site. These resins are like weak acid
resins in that the degree of ionization is strongly influenced by pH. Consequently, weak base resins
exhibit minimum exchange capacity above a pH of 7.
4.3.2.5 Chelating Resins
The functional group in chelating resins is an EDTA compound. These behave similarly to weak
acid cation resins but exhibit a high degree of selectivity for heavy metal cations over other cations in
solution. Chelating resins have the tendency to form stable complexes with the heavy metals. The
main drawbacks of chelating resins are slow metal uptake kinetics, limited operating pH range (Gula
and Harvey, 1996) and higher cost than other types of resins. Table 9 lists the selectivity coefficients
(KM) for various metal ions relative to calcium for chelating resins.
Table 9 Chelating Cation Resin Selectivity Coefficients (KM) for Metal Ions
Metal KM/Ca Hg+2 2,800 Cu+2 2,300 Pb+2 1,200 Ni+2 57 Zn+2 17 Cd+2 15 Co+2 6.7 Fe+2 4.7 Mn+2 1.2 Ca+2 1
Source: http://www.remco.com/ix.htm.
4.3.2.6 Specialty Resins
Specialty resins are available to selectively remove certain metal ions. One example is Diphonix, a
hybrid chelating/strong sulfuric acid resin that combines the selectivity of a chelating resin with the
kinetics of a strong acid cation resin.
4.3.3 Ion Exchange for Acid Mine Drainage Treatment
Ion exchange technology has been applied successfully to remove copper and cobalt at the Soudan
underground mine (MDNR, 2001). Using a specialty resin, removal efficiencies of greater than

RS29T 4-19
99 percent were achieved at a resin loading rate of 2 pounds per cubic foot. The pH of the
wastewater stream is adjusted to 4.3 and the water flows through activated carbon filters prior to
passing through the ion exchange units. Two ion exchange cartridges are used in a lead-lag
configuration. The system treats wastewater at a flow rate of 9 to 15 gpm. When the resin is
exhausted, the canister is transported offsite for regeneration. The capital cost for this system was
approximately $50,000, with annual maintenance costs of approximately $80,000.
Because this system is in operation and treatment efficiencies are known, additional bench-scale
testing of this technology is not required at this time.
4.4 Constructed Wetland
4.4.1 Technology Description
The use of constructed wetlands to treat municipal and industrial wastewater streams has become a
widespread, conventional technology. As wastewater flows through a wetland, pollutants are
transformed or sequestered through various biological and geochemical reactions involving wetland
vegetation, sediments, and bacteria. Wetlands have been used predominantly to degrade organic
matter, capture suspended solids in storm water runoff, and adsorb or fix inorganic nutrients such as
nitrogen and phosphorus (ITRC, 2003). They have also been used extensively to treat metal- and
sulfate-laden mine water discharges, similar to the potential flows that may be generated at
NorthMet.
Wetlands are well suited for treating mine drainage because they are capable of transforming many
different parameters, most of which will be of potential concern at NorthMet (Wieder, 1988).
Wetland sediments can neutralize acid via dissolution of carbonate minerals in the sediments and
through the production of alkalinity via microbial decomposition of organic matter. Wetlands are
also capable of removing sulfate via microbial reduction to sulfide and subsequent precipitation with
metals such as iron. Many of the natural processes that occur in wetlands can also be designed into
bioreactors that perform essentially the same functions. Bioreactors generally require less space than
constructed wetlands but require much more operation and maintenance to provide the substrate and
nutrients for the biological processes and to remove the accumulated solids (U.S. EPA, 2006). This
treatment option will also be considered for NorthMet.

RS29T 4-20
4.4.2 Wetland Removal Mechanisms The wetland mechanisms that would be potentially important to the removal of metals and other
parameters of concern at NorthMet are described in the following sections.
4.4.2.1 Uptake of Metals by Plants
Plants typically take up small amounts of metals as micronutrients. The magnitude of the metals
uptake mechanism is small relative to the magnitude of metals input in a typical acid mine drainage
stream (Sencindiver and Bhumbla, 1988; Wieder et al., 1990; Baek et al., 1991; Taylor and Crowder,
1982). Thus, plant uptake of metals is not an important long-term removal mechanism in this
application.
4.4.2.2 Ion Exchange/Adsorption of Metals onto Sediment
Cations within the substrate of the wetland sediments – such as sodium, magnesium, and potassium –
may be exchanged for heavy metal cations such as nickel, copper, cobalt, zinc, and iron (Wieder,
1990). The ion exchange capacity of wetland substrates varies depending on substrate type as shown
in Table 10.
Table 10 Stability Series for Metal-organic Interactions in Various Substrates
Material Stability Series Reference Soil Organic Matter Cu2+>Ni2+>Co2+>Zn2+>Fe2+>Mn2+ Irving-Williams, 1948 Soil Organic Matter Cu2+> Fe2+>Ni2+>Co2+> Mn2+>Zn2+ Jones and Jarvis, 1981
Sphagnum Peat Al3+> Fe2+>Cd2+= Ni2+= Mn2 +>Ca2+=Mg2+>K+>Na+ Wieder, 1990 Sawdust Al3+> Fe2+>Cd2+= Ni2+= Zn2+=Mn2+>Ca2+=Mg2+>K+>Na+ Wieder, 1990
Adsorption of cations to Sphagnum peat and sawdust has been described using the Langmuir
equation (Wieder, 1990):

RS29T 4-21
CONCKCONCYMAXADS
+×
=
Where:
ADS = Adsorption of a cation to an organic substrate, μeq/g
YMAX = Maximum capacity of a particular organic substrate to adsorb a cation, μeq/g
CONC = Equilibrium concentration of cation, μeq/L
K = Affinity constant associated with half-maximal adsorption, μeq/L
Table 11 summarizes the Langmuir parameters for various cations in Sphagnum peat and sawdust.
Table 11 Langmuir Parameters for Metal-organic Interactions in Peat and Sawdust (Wieder, 1990)
Sphagnum Peat Sawdust Cation YMAX, µeq/g K, µeq/L YMAX, µeq/g K, µeq/L
Al3+ 226.4 238 98.0 1,112 Fe2+ 198.3 842 75.6 1,286 Cd2+ 180.0 1,184 105.9 2,250 Ni2+ 183.0 1,391 84.0 2,497 Zn2+ 209.4 1,769 102.1 1,064 Mn2+ 155.5 1,782 65.3 2,153 Ca2+ 125.6 2,863 44.9 13,717 Mg2+ 79.0 3,641 46.4 3,593
K+ 142.0 9,420 35.5 3,097 Na+ 161.5 16,881 -- --
The ion exchange capacity of a wetland substrate is limited by the total number of available
adsorptive sites. New adsorptive sites are likely created by the accumulation of plant detritus, thus
the rate at which these sites become available for metal adsorption is dependent on the rate of plant
growth. Additionally, ion exchange can be affected by changes in cation ratios. Thus, the wetland
could act as a source of loosely bound cations (for example sodium) under certain circumstances
where more tightly bound cations are entering the system, similar to a conventional ion-exchange
system.
RS29T 4-22
4.4.2.3 Formation of Insoluble Metal Oxides
Metal oxide surfaces within the wetland substrate can also act as adsorptive sites for metal cations
(Tarutus, et al., 1992). In the presence of oxygen, some metals, such as iron and manganese, form
insoluble metal oxides. Such oxidation can occur near the sediment-water interface in a surface flow
wetland, or in the rhizosphere of emergent wetland vegetation. While zinc, nickel, cobalt, and
copper do not form insoluble oxides under typical environmental conditions, these metals can bind to
iron and manganese oxide surfaces in a wetland environment in the same way they would bind to
iron oxides in a chemical precipitation system. However, in a wetland environment, sorption to
metal oxide surfaces is more sensitive to changes in substrate redox state, and reducing conditions
can result in the release of sorbed metals (Patrick and Turner, 1968).
4.4.2.4 Formation of Insoluble Metal Sulfides in Wetlands
Metals and sulfate are liberated from mine waste rock via bacterial oxidation of metal sulfide
minerals. However, in the anoxic regions of wetland substrates, this process can be reversed. Sulfate
reducing bacteria can convert sulfate to sulfide, and metal cations, including nickel, copper, cobalt,
and zinc, readily form insoluble precipitates with sulfide. It can be seen from the relative magnitudes
of the solubility products (Table 5) that nickel precipitation requires at least 100-fold more sulfide
than precipitation of an equal amount of any of the other metals. Copper sulfide precipitation
requires far less sulfide than any of the other metals. The implications of these observations on
metals removal via sulfide precipitation in a wetland treatment system are:
• Copper removal should be achieved almost immediately upon exposure of the runoff to
sulfate reducing conditions.
• Zinc precipitation should require more sulfide and, therefore, more residence time than
copper.
• Cobalt precipitation should require more residence time than zinc.
• Nickel precipitation should require more residence time than any of the other metals and,
therefore, should be the limiting process for design purposes.
• Nickel precipitation may be inhibited by competition from iron. As aqueous iron
concentrations can be several orders of magnitude greater than nickel, this could be a
significant concern.

RS29T 4-23
• In the event of a system upset (i.e., interruption of bacterial sulfate reduction), nickel sulfide
could re-solubilize before any of the other metal sulfides. Thus, nickel-releasing behavior
could be an important indicator of system upset.
Metal sulfide precipitation is limited by the rate of bacterial sulfate reduction. Sulfate reducing
bacteria require an electron donor (energy source) and carbon source for growth. Sulfate reducing
bacteria must compete with other, faster-growing bacteria for energy and carbon sources. In order to
stimulate bacterial sulfate reduction:
• The more energetically favorable electron acceptors (i.e., oxygen, nitrate, ferric iron,
manganese [IV]) must be exhausted; or
• Carbon and energy sources must be supplied in excess of the demands of the microbial
consortium.
Constructed bioreactors can be used to generate conditions that favor sulfate reducing bacteria over
other microorganisms by providing substrate that is preferred by these organisms or through the use
of other processes to remove other electron accepting chemicals that could inhibit sulfate reduction
(U.S. EPA, 2006).
4.4.3 Wetland Treatment of Mine Drainage-Case Studies Wetland treatment technology has been applied to mine drainage at a number of existing sites. Most
of these applications, however, focus on removal of iron and manganese, which are not contaminants
of concern at NorthMet. Fortunately, several wetlands currently in use at the nearby Dunka Mine can
have been designed and installed to treat water that is potentially similar to the waste rock drainage at
NorthMet.
A review of the operation and performance of these wetlands is included in Appendix D. This
review of Dunka wetland performance suggests that a subsurface flow wetland where an anaerobic,
sulfate reducing environment can be established and maintained provides the best overall removal of
the parameters of concern at NorthMet. Additional testing of this technology is not required as the
existing information can be used to design a self-sustaining system by balancing the natural carbon
input to the system with the carbon demand from the applied sulfate load.

RS29T 5-1
5.0 Evaluation of Treatment Options for Mine Site Wastewaters
Brief descriptions and evaluations of cost, implementability, and effectiveness for the four potential
technologies for the treatment of Mine Site wastewater are summarized in Table 12. The treatment
alternatives are compared in the following sections on an individual basis. However, when
appropriate, a discussion of potential combinations of alternatives is included. For complex
wastewaters such as those expected at the Mine Site it is not uncommon for wastewater treatment to
consist of a combination (or treatment train) of two or more of these technologies in series. Using
multiple technologies in series also helps to emphasize the positive aspects of each technology and
generally improves the overall treatment operation.
As noted in Table 2, the predicted quality of wastewater produced at the Mine Site varies
significantly between the pit discharge and the stockpile drainage, and will also vary among
stockpiles due to the segregation of waste rock according to the potential to produce acid rock
drainage (ARD) and leach heavy metals. For the evaluation of potential wastewater treatment
alternatives, it is assumed that the Mine Site process water will be discharged into one of two
equalization (EQ) ponds (Stage 1 Pond and Stage 2 Pond) to produce two WWTF inflow streams.
The first inflow stream (Stage 1) would include process water runoff and drainage from the
Category 3 and Category 4 waste rock stockpiles. Stage 1 inflow is generally characterized as low
pH (pH<5) with relatively high concentrations of dissolved metals and salts. The second inflow
stream (Stage 2) would be comprised of Category 1/2 stockpile process water runoff and liner
drainage, mine pit dewatering water, and process water runoff from the haul roads and Rail Transfer
Hopper area. Stage 2 is generally characterized as near neutral pH with lower concentrations of
dissolved metals and salts. Table 13 provides a summary of the estimated water quality and quantity
for inflows to the Stage 1 and Stage 2 EQ Ponds. Separation of the multiple sources of wastewater
allows them to be collected in separate equalization ponds and combined into two treatment influent
streams, thus allowing the consideration of multiple treatment operations. Due to the water quality
variability of the waste streams over time, inflow sources to the Stage 1 and Stage 2 EQ Pond could
also be changed over time as necessary to optimize different treatment operations for each stage.

RS29T 5-2
Table 12. Summary of Screening Evaluation of Treatment Technologies for Mine Site Process Water
Approximate Cost (Appendix F)
Technology Implementability Advantages Disadvantages Residuals Generated Capital Annual O&M
Net Present Value
(20 yrs @ 5%) Chemical Precipitation
Hydroxide Precipitation
-Requires small footprint -Residues are easily managed.
-Simple process control - Well-established technology - Inexpensive chemicals
-Ineffective for zinc removal, simultaneous removal of certain metals may not be possible
Metal Hydroxide Sludge
$13.2 million $776,000 $27.4 million
Soluble Sulfide Precipitation - Requires small footprint - Residues are easily managed
- Effective removal of most metals to low concentrations
- Requires control measures for H2S generation - Metal sulfide precipitates managed as hazardous waste
Metal Sulfide Sludge
$13.6 million $788,000 $28.1 million
Carbonate Precipitation -Requires small footprint - Residues are easily managed
- Simple process control
- Ineffective for removal of any metals except zinc, iron, and manganese - Soda ash is expensive, and subject to large price fluctuations - Large sludge volumes produced
Metal Carbonate Sludge
$12.5 million $1.3 million $34.8 million
Iron Sulfide Precipitation -Requires small footprint -Requires on-site production of FeS
-Less potential for residual sulfide than soluble sulfide precipitation
- Nickel removal is ineffective - Requires larger reagent dose than soluble sulfide precipitation - Generates more sludge than soluble sulfide precipitation - Metal sulfide precipitates managed as hazardous waste
Metal (Iron) Sulfide Sludge
$13.9 million $1.4 million $38.0 million

RS29T 5-3
Approximate Cost (Appendix F)
Technology Implementability Advantages Disadvantages Residuals Generated Capital Annual O&M
Net Present Value
(20 yrs @ 5%) Calcium Sulfide Precipitation - Requires small
footprint - Requires onsite generation of CaS
- Less potential for residual sulfide than soluble sulfide precipitation - Required CaS dose is less than for FeS precipitation
- Metal sulfide precipitates managed as hazardous waste
Metal Sulfide Sludge
$13.9 million $920,000 $30.4 million
Membrane Treatment Nanofiltration-Stage 1 -Requires small
footprint - Requires management of brine
-Selectively removes multivalent ions, resulting in lower TDS brine
-Membrane subject to fouling - Pre-treatment required
Metal hydroxide and gypsum sludge
$15.2 million $1.2 million $40.1 million
Nanofiltration-Stage 2 -Requires small footprint - Requires management of brine
-Selectively removes multivalent ions, resulting in lower TDS brine
-Membrane subject to fouling - Pre-treatment required
Metal hydroxide and gypsum sludge
$13.2 million $1.4 million $37.0 million
Reverse Osmosis:
-Requires small footprint - Requires management of brine
-Can remove metals and dissolved solids to very low concentrations for excellent water quality.
-Membrane subject to fouling by organics, calcium sulfate precipitation. -Performance subject to presence of divalent anions (e.g., sulfate, nitrate). -Membrane cleaned on-site, generates waste stream. -Extensive pretreatment likely required
Rejected Brine with Sulfate, Metals
$24.5 million $2.3 million $64.2 million

RS29T 5-4
Approximate Cost (Appendix F)
Technology Implementability Advantages Disadvantages Residuals Generated Capital Annual O&M
Net Present Value
(20 yrs @ 5%) Ion Exchange
Ion Exchange
-Requires small footprint - Spent resin and activated carbon require management
-No potentially hazardous materials are added to the water.
-Resin subject to fouling by organic compounds, Al, Fe, Mn. -Sensitive to interference from chelating agents and fluctuations in influent concentration -Pretreatment pH adjustment and carbon filtration likely required
Metal hydroxide sludge
$21.2 million $1.6 million $48.6 million
Biological Treatment
Constructed Wetland
-Requires large footprint - No residual
-Metals are sequestered as stable sulfide compounds in the sediment -More metals storage capacity is produced as the wetland ages -No secondary waste stream generated
-Land-intensive technology -Hydraulic/hydrologic limitations -Requires maturation period for best metals removal results
No residuals
$54.6 million
$488,000
$72.8 million
Bioreactor Treatment – Stage 1 -Requires handling of ethanol substrate
-Sulfate is reduced to sulfide by bacteria, then precipitated with iron -Metals are removed as metal sulfide precipitates
-Produces a biological sludge in addition to chemical sludge - Requires large inputs of ethanol and iron - Control of a biological system can be difficult
Biological sludge, metal sulfides
$13.6 million $1.8 million $42.9 million

RS29T 5-5
Approximate Cost (Appendix F)
Technology Implementability Advantages Disadvantages Residuals Generated Capital Annual O&M
Net Present Value
(20 yrs @ 5%) Bioreactor Treatment – Stage 2 -Requires handling of
ethanol substrate -Sulfate is reduced to sulfide by bacteria, then precipitated with iron -Metals are removed as metal sulfide precipitates
-Produces a biological sludge in addition to chemical sludge - Requires large inputs of ethanol and iron - Control of a biological system can be difficult
Biological sludge, metal sulfides
$18.9 million $1.0 million $38.3 million

RS29T 5-6
Table 13 Stage 1 and Stage 2 Equalization Pond Inflow Predicted Water Quality
Year 1 Year 5 Year 10 Year 15 Year 20Parameter units Stage 1 Stage 2 Stage 1 Stage 2 Stage 1 Stage 2 Stage 1 Stage 2 Stage 1 Stage 2 Flow gpm 106 418 214 1,050 234 1,139 192 731 177 1,086Hardness mg/L 679 80 1,751 196 2,934 180 4,407 400 3,205 282Fluoride (F) mg/L 1.83 0.20 8.35 1.16 17.8 2.67 29.7 4.77 37.7 3.30Chloride (Cl) mg/L 10.0 1.02 27.0 4.98 26.9 4.94 13.8 1.06 14.2 1.15Sulfate (SO4) mg/L 992 94 3,106 169 5,507 228 7,947 554 5,776 355Aluminum (Al) mg/L 4.03 0.63 18.0 0.72 41.1 0.83 56.0 1.28 36.5 0.76Arsenic (As) mg/L 0.32 0.038 0.67 0.10 0.61 0.078 1.01 0.19 0.85 0.12Barium (Ba) mg/L 0.18 0.032 0.30 0.044 0.29 0.041 0.39 0.074 0.36 0.049Beryllium (Be) mg/L 0.0021 0.00032 0.0023 0.00036 0.0031 0.00042 0.0031 0.00048 0.0029 0.00035Boron (B) mg/L 0.64 0.11 1.26 0.19 1.19 0.17 1.48 0.28 1.48 0.20Cadmium (Cd) mg/L 0.0071 0.00046 0.0067 0.00056 0.010 0.00059 0.011 0.00047 0.0078 0.00035Calcium (Ca) mg/L 199 21.7 460 56.2 445 52.0 742 123 666 83.9Chromium (Cr) mg/L 0.0039 0.00087 0.0060 0.0011 0.0059 0.0011 0.0052 0.0012 0.0072 0.0011Cobalt (Co) mg/L 0.17 0.0075 1.75 0.011 10.7 0.011 16.8 0.014 10.5 0.0094Copper (Cu) mg/L 0.079 0.011 0.31 0.018 10.7 0.016 25.6 0.032 38.0 0.021Iron (Fe) mg/L 28.9 1.53 73.5 2.12 83.5 1.93 107 0.82 94.4 0.63Lead (Pb) mg/L 0.011 0.0012 0.039 0.0035 0.045 0.0039 0.070 0.010 0.062 0.0071Magnesium (Mg) mg/L 44.4 6.26 147 13.5 443 12.4 622 22.8 375 17.7Manganese (Mn) mg/L 0.83 0.059 6.04 0.10 19.9 0.11 29.1 0.20 16.5 0.13Mercury (Hg) mg/L 2.04E-05 4.47E-06 1.99E-05 3.61E-06 2.11E-05 3.89E-06 2.54E-05 6.00E-06 3.60E-05 5.77E-06Molybdenum mg/L 0.013 0.0032 0.023 0.0046 0.023 0.0045 0.019 0.0043 0.029 0.0046Nickel (Ni) mg/L 2.51 0.10 25.4 0.13 136 0.13 249 0.10 175 0.068Phosphorous mg/L 0.091 0.00091 0.19 0.019 0.14 0.0089 0.24 0.033 0.21 0.022Potassium (K) mg/L 30.7 3.94 58.3 7.79 50.0 6.58 75.8 14.5 66.9 8.96Selenium (Se) mg/L 0.0075 0.0015 0.011 0.0021 0.011 0.0021 0.010 0.0022 0.013 0.0021Silica (SiO2) mg/L 3.75 0.056 6.99 0.83 3.79 0.39 7.61 1.44 7.15 0.97Silver (Ag) mg/L 0.0027 0.00065 0.0045 0.00089 0.0045 0.00089 0.0033 0.00080 0.0054 0.00088Sodium (Na) mg/L 175 24.5 534 72.8 424 61.9 769 159 691 101Thallium (Tl) mg/L 0.0043 0.0011 0.0071 0.0015 0.0071 0.0015 0.0041 0.0011 0.0086 0.0015Zinc (Zn) mg/L 2.13 0.095 7.68 0.14 12.2 0.12 14.6 0.049 10.3 0.043Nitrate (NO3) mg/L 0.31 0.065 0.74 0.15 0.72 0.15 0.11 0.000017 0.080 0.000012Ammonia (NH4) mg/L 0.31 0.065 0.74 0.15 0.72 0.15 0.11 0.000017 0.080 0.000012
RS29T 5-7
5.1 Effectiveness Effectiveness is based on the ability of a treatment technology to address all of the parameters of
concern at NorthMet. With the exception of carbonate precipitation, all of the technologies reviewed
in Section 4 have the potential to be effective in treating the parameters of potential concern in the
process water from the Mine Site. A membrane or a wetland treatment system could be designed to
treat all of the parameters of concern simultaneously. While this would be effective, and relatively
simple to operate, it may not necessarily be efficient. Chemical precipitation and ion exchange can
be used to remove one or more specific parameters of concern, for example metals or sulfate, but
would likely require a multi-step process to be effective in treating all of the parameters of concern.
This would increase the complexity of the treatment operation, but could also potentially reduce the
operating costs. Complexity is addressed in the following discussion of implementability and costs
for various alternatives.
This evaluation confirms that the pre-screening of alternatives that was conducted in the development
of the SOW for this evaluation selected technologies that can all be designed to be effective. Thus,
the selection of a preferred alternative is reduced to consideration of the implementability and the
cost for each particular option. These factors are discussed in the following paragraphs.
5.2 Implementability Implementability will be is considered within the context of the complexity of the operation needed
to use any of the desired treatment approaches – for example what, if any pre-treatment operations
may be required and what type of solids or secondary waste streams are generated.
5.2.1 Chemical Precipitation Implementation of chemical precipitation for the Mine Site process water would likely require a
multi-stage system to be able to achieve the desired process water quality targets. Using chemical
precipitation, metals would likely be removed as a hydroxide precipitate or as a co-precipitate with
iron hydroxides. Sulfate would be removed as a gypsum precipitate. If additional sulfate removal is
required, a chemical treatment system could be upgraded with the addition of aluminum salts using
an ultra high lime with aluminum process. The concentrations of other dissolved solids, for example
silica, phosphorous, or nitrate would likely be reduced in the precipitation process. Calcium, which
would be added to the process, could be removed in a final neutralization step with carbon dioxide or
soda ash.

RS29T 5-8
Chemical precipitation may require filtration as a final polishing step and would require solids
handling and management, most likely incorporating the solids into the hydrometallurgical process.
The implementation of a chemical precipitation treatment system is a viable option at the Mine Site.
The chemical precipitation treatability testing conducted for this evaluation (Appendix C)
demonstrated that with the exception of mercury, all the parameters of concern at NorthMet can be
removed using lime with an HDS operating configuration. The footprint for a chemical precipitation
process at the Mine Site would be relatively small, most likely less than 10 acres. Power, chemicals,
and other inputs for a chemical precipitation plant at the Mine Site can be delivered, and road access
between the Mine Site and the Plant Site could accommodate the transportation of wastewater solids
for reuse or disposal. A chemical treatment system can also be designed with two or more units in
parallel to deal with variable incoming flow rates both seasonally and over the lifetime of the project.
5.2.2 Membrane Treatment
Membrane treatment is a viable option for the Mine Site process water. Either a reverse osmosis
(RO) or a nanofiltration system would likely be capable of treating Mine Site process water for the
parameters of potential concern. A single system would be capable of removing all of the chemicals.
Pre-treatment stages, such as filtration would likely be required to improve the overall operation of
the membrane unit.
The brine from a membrane treatment operation would require additional treatment. This waste
stream could be trucked off-site for disposal, or could be treated at the site. On-site treatment would
likely consist of a small chemical precipitation operation. Solids from this operation could then be
recycled at the hydrometallurgical plant or disposed with the hydrometallurgical residues. The
remaining treated water from the chemical precipitation operation could then be blended with
permeate from the membrane unit prior to being discharged to the tailings basin or, if necessary,
could be evaporated.
The potential footprint for a membrane treatment system would likely be similar to a chemical
precipitation plant, again likely less than 10 acres. A membrane treatment system can also be
installed will multiple units in parallel to help manage variable flows. Power, chemicals, and other
items needed for a membrane treatment operation, including truck access for brine or water treatment
solids removal is readily available.

RS29T 5-9
5.2.3 Ion Exchange Ion exchange would have limited viability as stand-alone treatment alternative for the mine-site
process water. While ion exchange can effectively remove metals from solution, it would be less
likely to be able to effectively remove sulfate than any of the other three technologies considered in
this evaluation, because it would most likely need to ‘exchange’ the sulfate for chloride. Excess
chloride would need to be treated, which would likely require RO. Thus, ion exchange would be
most effective as a pre-treatment operation for sulfate removal using membranes.
An ion exchange system would likely require a relatively small footprint at the Mine Site (similar to
membrane treatment or chemical precipitation). As the concentration of total dissolved solids in the
Mine Site process water increases with time, ion exchange treatment will require additional treatment
capacity and will likely also require more frequent resin change-out or regeneration. Because it
would be relatively easy to place additional ion exchange treatment capacity on-line over the
operating time of NorthMet, ion exchange could provide some operational advantages.
Unfortunately, for the units that are on-site and in operation, daily or even seasonal variations in the
flow rate to the ion exchange system can stress the operation and efficiency of individual ion
exchange units that would need to be mitigated by equalizing the inflow rates.
Pre-treatment would likely be required for an ion exchange treatment system. This would include
filtration of very small particulates, and potentially an activated carbon unit to remove any trace
organics that could foul the ion exchange media. While the concentration of organic matter in the
process water at the Mine Site is expected to be very low, even a low concentration of organic matter
could react with the ion exchange resin and reduce the treatment efficiency of the system
5.2.4 Constructed Wetland Implementation of a constructed wetland would require a site-specific design to match the expected
load with the wetland capacity. The potential design process is outlined below.
5.2.4.1 Hydraulic Design
A decision tree for mine water treatment (ITRC, 2003) is included in Appendix E. Application of the
decision tree to the Mine Site process water suggests that a subsurface-flow (SSF) wetland would be
the best configuration for a constructed wetland at NorthMet to provide long-term removal of trace
metals by sulfide precipitation. A SSF wetland can be designed to operate in one of two
configurations:

RS29T 5-10
• Vertical flow: Water is ponded on top of the wetland substrate or added to the subsurface
through an infiltration gallery. Water to be treated then flows vertically (downward or
upward) through the media. This configuration can treat high volumetric flow rates because
flow is distributed across the entire wetland area.
• Horizontal flow: Water flows horizontally through the root zone, from one end of the wetland
to the other. This configuration is generally used to treat low volumetric flow rates because
flow is distributed across a smaller area.
In either configuration, key design parameters are:
• hydraulic conductivity,
• hydraulic head required to maintain the design flow rate, and
• flow distribution in the wetland
Hydraulic conductivity will decrease with time as metal precipitates fill void spaces in the substrate.
Thus, more hydraulic head will be required to maintain the design flow. A means for balancing
inflow and outflow from the wetland is also important to prevent the substrate from drying out during
periods of low flow. In the case of horizontal-flow wetlands, the aspect ratio (length to width)
should generally be between 3:1 and 5:1 to prevent short-circuiting.
5.2.4.2 Required Sulfate Reduction Rate
Bacterial sulfate reduction is the key process in removal of trace metals by this method. The design
equation for the required rate of sulfate reduction is (ITRC, 2003):
Required Rate of Sulfate Reduction= ( )∑ ∑ ++ + acidmmolFemmolmetalsdivalentmmol 5.05.1 3
ITRC (2003) recommends a sulfate reduction rate of 300 mmoles/d/m3 wetland substrate. Assuming
a 0.5-meter substrate depth, sulfate reduction rates of 1,500 moles/ha/day are attainable under
adequate growth conditions for sulfate reducing bacteria. Adequate growth conditions for sulfate
reducing bacteria are dependent on anoxic conditions as well as the availability of carbon substrate,
as discussed in the following paragraphs.
5.2.4.3 Carbon Utilization Rates
Wieder et al. (1988) observed sulfate reduction in Big Run Bog, a peat bog in West Virginia. They
estimated the sulfate reduction rate in the bog to be approximately 17.0 mol SO42-/m2/yr. The

RS29T 5-11
corresponding carbon utilization required to fuel sulfate reduction was 34.2 mol C/m2/yr. This
corresponds to a carbon requirement of 2.0 mol C/mol SO42-.
While carbon can be supplied by incorporating organic matter into the substrate during construction,
long-term performance requires a continuous input of carbon to the wetland. Typical primary
production rates for wetlands have been reported on the order of 1,000 g/m2/yr (Vymazal, 1995).
However, as much as 40 percent of this carbon production may be unavailable to support bacterial
growth. Thus, the bioavailable carbon supply would be on the order of 600 g/m2/yr or approximately
50 mol/m2/yr.
5.2.4.4 NorthMet Wetland Size Requirements
A constructed wetland could be used as a secondary treatment step to remove additional sulfate after
the use of a chemical precipitation step to remove a majority of the sulfate. Assuming a sulfate input
of 25,000 pounds per day for the Mine Site wastewater based on an average annual flow of 1,300
gpm and a sulfate concentration of 540 mg/L after lime treatment of the Stage 1 flow, the
corresponding carbon demands required to meet a 250 mg/L sulfate discharge criterion would be
approximately 110,000 moles C/day. Assuming a conservative photosynthetic carbon input of 50
moles C/m2/yr, the required size of a wetland treatment system at the Mine Site would be
approximately 200 acres. This would represent a significant additional land requirement for the
project, and would not likely fit within the currently available land.
In lieu of a constructed wetland, a bioreactor could be constructed to remove sulfate. The
combination of biological sulfate reduction with chemical precipitation also provides an opportunity
for excess sulfide generated by sulfate reducing bacteria to be used to promote metal precipitation.
In this configuration, a sulfate reducing bioreactor or a portion of the treated wastewater from a
constructed wetland could be recycled into the chemical precipitation process to provide soluble
sulfide that should enhance the metal precipitation process.
While a constructed wetland has the potential to be a very effective treatment technology for the
Mine Site process water, it is not likely to be implementable during the operation of the mine, due to
the size requirements. Although a constructed wetland can effectively treat the parameters of
potential concern in the Mine Site process water, the land requirements for this type of system are
likely prohibitive.
RS29T 5-12
A constructed wetland is, however, considered a potentially viable technology for removing
additional metals and sulfate from the smaller volume of process water flows that are predicted for
after the closure of the Mine Site. This is described in greater detail in RS52.
5.3 Cost Costs for the potential treatment technologies considered in this evaluation are outlined in
Appendix F. These estimates represent preliminary (feasibility study level) costs, not detailed costs
that would be associated with the design and construction of a wastewater treatment facility. These
costs are developed as a basis for comparing alternatives in this evaluation.
5.3.1 Chemical Precipitation
Tables F-1 through F-5 are cost estimates for treatment of the Mine Site process water using five
different chemical precipitation methods: hydroxide, sulfide, carbonate, ferrous sulfide and calcium
sulfide. Hydroxide precipitation is least expensive chemical precipitation technology, with a net
present value (NPV) of $27.4 million (20 years at 5%). Sulfide precipitation and carbonate
precipitation had NPV costs of $28.1 million and $34.8 million, respectively. While the capital cost
for the three technologies is similar ($12.5 to $13.6 million), annual operating costs vary widely
($776,000, $788,000, and $1.3 million for hydroxide, sulfide, and carbonate precipitation,
respectively.
The estimated NPV cost for insoluble sulfide precipitation via ferrous sulfide is approximately
$38 million, assuming four times the required stoichiometric FeS dose as indicated in the literature.
The subsequent increase in sludge generation also increases annual costs. NPV cost for calcium
sulfide precipitation is about $30.4 million, due to the roughly stoichiometric calcium sulfide dose.
5.3.2 Membrane Treatment
Cost estimates for membrane treatment of Mine Site process water using either RO or nanofiltration
are presented in Tables F-6 through F-8. The capital cost for an RO operation is $24.5 million, with
annual costs of $2.3 million. NPV cost of an RO operation is $64.2 million. By comparison, the
estimated capital cost, annual operating cost, and NPV cost of nanofiltration are $13.2 million,
$1.4 million, and $37.0 million, respectively for nanofiltration of the Stage 2 flow. Significant cost
components for either an RO or nanofiltration treatment system would include pre-treatment
(ultrafiltration) and disposal of the rejected brine. The capital costs for nanofiltration are similar to
RS29T 5-13
the capital costs for chemical precipitation. However, the operating costs, primarily additional
operating costs for membrane cleaning and maintenance increase the overall NPV of this option.
5.3.3 Ion Exchange
A cost estimate for ion exchange treatment of Mine Site process water is in Table F-9. The capital
cost for this alternative is $21.2 million, with annual costs of $1.6 million. NPV cost of this
alternative is $48.6 million. Significant cost components include the cost of large volumes of resin
and activated carbon.
5.3.4 Constructed Wetland
Cost estimates for treatment of Mine Site process water using a constructed wetland or a bioreactor
are included in Tables F-10 through F-12. Capital costs ($54.6 million) associated with construction
of a 200-acre wetland account for the majority of the cost for this option. Wetland treatment is a
land-intensive technology. A large amount of surface area is required to provide enough
photosynthetic carbon input to fuel enough sulfate reduction to meet secondary water quality criteria
(250 mg/L sulfate). Annual costs are relatively low ($488,000), and are primarily associated with
chemical precipitation treatment of the Stage 1 water and monitoring the water levels within the
wetland system. The NPV cost of this option is $72.8 million.
Using a bioreactor instead of a constructed wetland to remove sulfate together with chemical
precipitation for metals removal does reduce the cost of this alternative. Treating the Stage 2 flow
biologically together with chemical precipitation of the Stage 1 flow would have a capital cost of
$ 18.9 million, an annual operating cost of $1 million, and a NPV of $38.3 million.
5.4 Recommended Alternative Based on the comparative evaluation of potential treatment technologies described above, a multi-
technology approach is recommended for the treatment of the Mine Site process water. Chemical
precipitation treatment will be used to remove metals and sulfate. However, given the limitation of
chemical precipitation as gypsum to reduce sulfate to the process water quality target, nanofiltration
will be used to concentrate sulfate in a brine stream prior to precipitation. Blending the permeate
stream with the treated water from the chemical precipitation operations would produce a combined
flow that with limited exceptions will meet the conservative process water quality targets throughout
the operating life of the Mine Site.

RS29T 5-14
Nanofiltration will be used to treat the Stage 2 process water flows with high volume and relatively
low concentrations of metals and sulfate including mine pit process water, runoff from the working
areas of the Mine Site, and drainage from the Category 1/2 stockpile. These flows generally have a
neutral pH and as noted in Table 2, the concentrations metals in these flows are near the process
water quality targets while the concentration of sulfate is generally too low to remove sulfate as
gypsum. Concentrating this stream will provide a clean permeate and a brine stream with qualities
similar to the anticipated Stage 1 flow (drainage from the Category 3 Waste Rock stockpile,
Category 3 Lean Ore stockpile, Category 4 Waste Rock stockpile and the Lean Ore surge pile).
Pretreatment prior to nanofiltration will include filtration using sand filters or a combination of micro
or ultrafiltration membranes. Anti-scalants would also be added, as necessary, to condition the feed
to the nanofiltration membranes and optimize operations (minimize operating pressures and
membrane cleaning events). The brine from the nanofiltration operation as well as the Stage 1
drainage would then be treated using a two-stage chemical precipitation operation.
The Wastewater Treatment Facility (WWTF) will consist of two parallel units, which will allow the
system to be built in stages and will allow the system operating capacity to increase and decrease
with time as the volume of flow changes throughout the process of mining and filling the pits. At the
maximum extent, the WWTF will occupy approximately 5 acres. The plant will be located in the
southwest portion of the Mine Site, near the Central Pumping Station (CPS) that will be used to
convey treated Mine Site process water to the tailings basin. A conceptual layout of the WWTF is
shown in Figure 4. A conceptual flow-diagram of the wastewater treatment system is shown on
Figure 5. The following paragraphs describe the preliminary conceptual design details for the
individual process units. Final sizing of process units and pumps and selection of materials of
construction for all of the process units will be completed during the detailed design phase of the
project.
5.4.1 Flow Equalization
A flow-equalization pond system will be used to provide a constant feed to the two-stage water
treatment system. The Stage 1 EQ Pond will receive the Stage 1 inflow stream. This average annual
flow will increase throughout the mining operation. For Stage 1, the average annual flow will range
from 64 to 485 gpm (Table 1). It is estimated that the instantaneous flow within any given year will
range from 0 to 2.9 times the anticipated annual average, with the highest flows expected in the
spring and lower flows expected throughout the winter months (See RS21 and RS22). Estimated
annual drainage flows from the Category 3 and Category 4 stockpiles will peak in approximately

RS29T 5-15
Year 15, before decreasing to an estimated 130 gpm at Year 20 (Table 1). On a preliminary basis,
the Stage 1 EQ Pond will be designed for a working capacity of approximately 4 acre-feet. The
Stage 1 EQ Pond will be lined and designed to meet the MPCA performance standards for surface
impoundments.
The Stage 2 EQ Pond will receive the Category 1 / 2 stockpile process water drainage, pit dewatering
water process water, runoff from all other active areas of the Mine Site, and process water runoff
from the Rail Transfer Hopper area. As with the equalization pond for the Stage 1 treatment, the
inflows to the Stage 2 EQ Pond will vary over the life of the operation as well as seasonally. As can
be seen in Table 1 the average annual flow for these streams will increase throughout the mining
operation with estimated flows ranging from 340 to 1,000 gpm. The estimated instantaneous flow
within any given year will range from 0.4 to 2.3 times the anticipated annual average, with the
highest flows expected in the spring and lower flows expected throughout the winter months.
The Stage 2 EQ Pond will be designed for a working capacity of approximately 6 acre-feet. The
Stage 2 EQ Pond will be lined and designed to meet MPCA performance standards for surface
impoundments. The side walls will be protected with rip-rap or vegetated to prevent erosion.
5.4.2 Nanofiltration Pre-Treatment
Prior to nanofiltration, the Stage 2 water will be filtered to remove any particulate matter. The
Stage 2 EQ Pond should provide some time for settling and removal of larger size particles, so it is
anticipated that the pre-treatment would consist of ultrafiltration alone or in combination with
microfiltration ahead of the ultrafiltration unit. The objective of these operations is to remove any
very fine particulate matter that could potentially foul the nanofiltration membrane and increase
operating pressures or the required frequency of cleaning.
The ultrafiltration unit would consist of two parallel banks of filters each filter bank would contain
an equal number of filter units and would be designed to operate with a minimum of units for small
flow volumes up to all units operating simultaneously. Configuration of the membrane treatment
units will vary depending on which vendor is selected to provide this equipment.
Solids removed in the pre-treatment filtration step will be removed by periodically washing the
filters. Filter washing operations will also be vendor specific. Solids removed with the wash water
will be directed to the Stage 1 chemical precipitation treatment operations.
RS29T 5-16
5.4.3 Nanofiltration Membrane Unit After passing through the ultrafiltration unit, the Stage 2 water would be treated with nanofiltration
membranes. As with ultrafiltration, two parallel banks of spiral-wound membrane units would be
used. For each bank, the likely operation would consist of a ‘Christmas Tree’ arrangement of filters
at a ratio of 3:2:1. All water would pass through the first line of filters (the 3 row). The permeate
from the first row would be discharged to the CPS while the brine from the first row of filters would
then pass through the second row. A similar separation strategy would then be used for the third
row. At the conclusion, the brine from the final row would be sent to the chemical precipitation
operations for the Stage 1 flows described below.
Similar to the pre-treatment operation, membrane washing and maintenance would generate a waste
stream that would be directed to the Stage 1 chemical precipitation treatment process.
5.4.4 Chemical Addition and Rapid Mixing Chemical addition and rapid mixing will be the first step in of the chemical precipitation operation.
Calcium hydroxide [Ca(OH)2 or hydrated lime] will be the primary chemical added to raise the pH
and generate hydroxides. However, as previously discussed, additional chemicals – aluminum
hydroxide [Al(0H)3], sodium hydrosulfide [NaHS], or additional iron salts – may be used at different
times throughout the operation of the mine to enhance removal of sulfate or metals. Two parallel
chemical addition/rapid mix units will be used to accommodate the projected inflow rate variability.
Each rapid mix unit will be sized to provide between one and three minutes of contact time.
Chemicals will be added using chemical metering pumps. Hydrated lime will be injected as
concentrated slurry. Rapid mixing will be achieved using high-speed agitators in relatively small
volume tanks to achieve complete mixing of the lime with the influent flow. The lime addition rate
will be controlled to maintain a pH of approximately 10 in both stages of treatment. However, a
higher pH may be used in the first stage to increase the sulfate removal rate. Sludge generated in
later operations will also be injected into the rapid mixing operations to provide solid surfaces that
will promote chemical precipitation in the following stages.
Hydrated lime will be prepared at the Process Plant site and transported to the WWTF and stored in a
lime silo. A screw conveyor system will be used to formulate the lime slurry for addition to the rapid
mix units.

RS29T 5-17
5.4.5 Coagulation and Flocculation The chemical precipitation system will contain tanks for coagulation and flocculation. The primary
purpose of this operation will be to keep the water adequately mixed to promote aeration of the
wastewater and to prevent settling of suspended solids while providing adequate retention time for
the precipitate to form large enough crystals to facilitate removal by gravity settling in the
subsequent clarification units. Mixing will be accomplished using low-shear mixing paddles spaced
throughout the tanks. Valves and baffles will be included to allow the units to accommodate the
variable flows anticipated during mining operations while maintaining the necessary retention time
identified in the preliminary bench-scale testing. The anticipated retention time for the
coagulation/flocculation units will be approximately 1 hour. Additional retention time will be
provided in the event that supplementary chemicals such as aluminum hydroxide, sodium
hydrosulfide, or iron salts need to be added to improve removal efficiencies. Chemical metering
pumps for the addition of a flocculating agent will be installed near the discharge from the
coagulation units to the clarifiers to promote settleable floc formation.
5.4.6 Clarification (Settling)
Two clarifiers will be installed in parallel for the chemical precipitation process. Each clarifier will
be sized to provide up to 60 minutes of solids settling time. Mechanical sludge removal equipment
will be installed in each unit. The shape (round or square), and the need for settling tubes or other
settlement aids, and final dimensions will be determined during the final design stages. Solids
management is described in Section 5.6.
5.4.7 Recarbonation
The treated water from the chemical precipitation operation is expected to have a pH of
approximately 10 and will have a relatively high concentration of calcium. This water will be treated
with carbon dioxide [CO2] to reduce the pH to approximately 8 in two steps. In the first step,
calcium will be removed by precipitation as calcium carbonate [CaCO3] at approximately pH 9. In
the second step the pH will be reduced to between 7.5 and 8 to limit any further precipitation of
carbonate minerals and reduce scaling in the Treated Water Pipeline. Additional clean-up steps
could also be added, if necessary, for example if the effluent pH from chemical precipitation is well
above 10, to provide removal of trace metals over a wider range of pH conditions to that would
optimize removal efficiencies.

RS29T 5-18
Carbon dioxide will be added to the liquid stream as a gas under pressure to promote dissolution and
reaction with dissolved calcium. A final flocculation tank and clarifier (two each in parallel) will be
used to recarbonate the water and remove the carbonate precipitate. Carbon dioxide gas will be
delivered to the site in bulk and stored in an on-site carbon dioxide tank.
5.4.8 Process Monitoring and Control
The WWTF operations will be monitored continuously using the pH, temperature, and conductivity
of the influent water and treated water at various stages within the process to control the addition of
lime (and other chemicals as needed) in both treatment stages. Additional wastewater quality
monitoring will be conducted on a daily basis for parameters such as total dissolved solids or
turbidity and on a less frequent basis for a variety of parameters (e.g., copper, nickel, calcium,
sulfate, and others). Continuous monitoring will be used to adjust the lime dosage rates for both
stages of chemical treatment using an automated feedback loop, which will be monitored and
adjusted, as necessary.
5.5 Potential Treatment System Performance As noted in Section 3, the goal of the WWTF at the Mine Site will be to produce a treated effluent
that will not adversely impact the operation of the Beneficiation Plant or the subsequent
hydrometallurgical processes at the Plant Site. In addition, the objective of wastewater treatment will
be to achieve the process water quality targets listed in Table 4. These process water quality targets
have been conservatively established based on in-stream water quality standards for the Partridge and
Embarrass Rivers and the protection of groundwater. These values have been used because the
Treated Water Pipeline will cross several streams within the Partridge River watershed between the
Mine Site and the Plant Site and also because these values provide very conservative treatment goals
that will help to maintain the long-term water quality of the water in the Tailings Basin, which will
eventually be returned to the mine pit.
Estimates of the potential WWTF effluent quality are listed in Table 14 along with the water quality
process targets. The basis for these estimates is provided in Appendix G. These values show that, on
an annual average basis, WWTF should be capable of achieving the process water quality targets for
most of the parameters of concern with limited exceptions that may require enhanced chemical
treatment.

RS29T 5-19
The effluent predictions are based on the annual average flows and use the low flow estimates,
because the low flow scenario results in the highest potential influent concentrations to the WWTF.
Because the WWTF will be sized to accommodate the high flow conditions, the plant will have
additional retention time in all the process units that could facilitate improved performance.

RS29T 5-20
Table 14 Stage 1 and Stage 2 Treatment Systems Effluent and CPS Pond Predicted Water Quality Year 1 Year 5 Year 10 Year 15 Year 20
Parameter units Stage 1 Effluent
Stage 2 Effluent
CPS Effluent
Stage 1 Effluent
Stage 2 Effluent
CPS Effluent
Stage 1 Effluent
Stage 2 Effluent
CPS Effluent
Stage 1 Effluent
Stage 2 Effluent
CPS Effluent
Stage 1 Effluent
Stage 2 Effluent
CPS Effluent
Process Water
Quality Targets
Flow gpm 106 482 696 214 1159 1396 234 1259 1397 192 850 903 177 1155 1155 Hardness mg/L 679 153 106 1751 333 276 2934 553 498 4407 1013 952 3205 505 505 F mg/L 1.83 0.41 0.28 2.09 0.44 0.36 4.45 0.95 0.85 7.42 1.88 1.77 9.43 1.60 1.60 2.0 Cl mg/L 10.0 2.24 1.55 27.0 5.22 4.34 26.9 5.22 4.70 13.8 3.16 2.98 14.2 2.23 2.23 230 SO4 * mg/L 992 222 154 1500 285 237 1500 289 260 1500 363 341 1500 247 247 250 Al mg/L 0.040 0.036 0.025 0.18 0.066 0.055 0.41 0.11 0.10 0.56 0.18 0.17 0.36 0.092 0.092 0.125 As mg/L 0.16 0.037 0.026 0.33 0.066 0.055 0.30 0.060 0.054 0.51 0.12 0.12 0.43 0.071 0.071 0.010 Ba mg/L 0.18 0.041 0.029 0.30 0.058 0.048 0.29 0.055 0.050 0.39 0.091 0.085 0.36 0.057 0.057 2.0 Be mg/L 0.0021 0.00047 0.00033 0.0023 0.00045 0.00037 0.0031 0.00060 0.00054 0.0031 0.00073 0.00069 0.0029 0.00046 0.00046 0.004 B mg/L 0.61 0.14 0.10 1.20 0.23 0.19 1.13 0.22 0.20 1.40 0.33 0.31 1.41 0.23 0.23 0.5 Cd mg/L 0.0071 0.0016 0.0011 0.0067 0.0013 0.0010 0.010 0.0020 0.0018 0.011 0.0025 0.0023 0.0078 0.0012 0.0012 0.004 Ca mg/L 199 44.8 150 460 87.5 150 445 85.0 150 742 173 150 666 106 150 Cr mg/L 0.0039 0.00089 0.00062 0.0060 0.0012 0.0010 0.0059 0.0012 0.0010 0.0052 0.0012 0.0012 0.0072 0.0012 0.0012 0.100 Co mg/L 0.00035 0.00040 0.00028 0.0035 0.0011 0.00094 0.021 0.0045 0.0040 0.034 0.0082 0.0077 0.021 0.0037 0.0037 0.005 Cu ** mg/L 0.00040 0.00055 0.00038 0.0016 0.0011 0.00091 0.053 0.011 0.0096 0.13 0.030 0.028 0.19 0.030 0.030 0.030 Fe mg/L 0.029 0.073 0.050 0.074 0.11 0.091 0.084 0.10 0.093 0.11 0.060 0.056 0.094 0.044 0.044 0.3 Pb mg/L 0.011 0.0024 0.0017 0.039 0.0074 0.0061 0.045 0.0085 0.0077 0.070 0.016 0.015 0.062 0.010 0.010 0.019 Mg mg/L 2.22 0.76 0.53 7.35 1.97 1.64 22.2 4.67 4.21 31.1 8.00 7.52 18.8 3.71 3.71 Mn mg/L 0.0008 0.0027 0.0019 0.0060 0.0055 0.0046 0.020 0.0085 0.0077 0.029 0.015 0.014 0.016 0.0088 0.0088 0.05 Hg mg/L 2.0E-05 4.7E-06 3.2E-06 2.0E-05 3.8E-06 3.2E-06 2.1E-05 4.1E-06 3.7E-06 2.5E-05 6.0E-06 5.6E-06 3.6E-05 5.8E-06 5.8E-06 1.3E-06 Mo mg/L 0.013 0.0031 0.0021 0.023 0.0045 0.0038 0.023 0.0045 0.0041 0.019 0.0044 0.0042 0.029 0.0046 0.0046 0.100 Ni ** mg/L 0.0025 0.0048 0.0033 0.025 0.010 0.0086 0.14 0.031 0.028 0.25 0.061 0.057 0.18 0.030 0.030 0.100 P mg/L 0.045 0.010 0.0069 0.10 0.018 0.015 0.072 0.014 0.012 0.12 0.029 0.027 0.10 0.017 0.017 K mg/L 30.7 6.93 4.80 58.3 11.1 9.24 50.0 9.57 8.63 75.8 17.8 16.7 66.9 10.7 10.7 Se mg/L 0.0075 0.0017 0.0012 0.011 0.0022 0.0018 0.011 0.0022 0.0019 0.010 0.0023 0.0021 0.013 0.0022 0.0022 0.005 Si mg/L 3.75 0.83 0.57 6.99 1.33 1.10 3.79 0.72 0.65 7.61 1.78 1.68 7.15 1.14 1.14 Ag mg/L 0.0027 0.00062 0.00043 0.0045 0.00087 0.00072 0.0045 0.00087 0.00078 0.0033 0.00079 0.00074 0.0054 0.00087 0.00087 0.001 Na mg/L
175 39.6 27.4 534 102 84.7 424 81.4 73.4 769 180 170 691 111 111

RS29T 5-21
Year 1 Year 5 Year 10 Year 15 Year 20
Parameter units Stage 1 Effluent
Stage 2 Effluent
CPS Effluent
Stage 1 Effluent
Stage 2 Effluent
CPS Effluent
Stage 1 Effluent
Stage 2 Effluent
CPS Effluent
Stage 1 Effluent
Stage 2 Effluent
CPS Effluent
Stage 1 Effluent
Stage 2 Effluent
CPS Effluent
Process Water
Quality Targets
Tl mg/L 0.0043 0.0010 0.00068 0.0071 0.0014 0.0011 0.0071 0.0014 0.0013 0.0041 0.0010 0.00091 0.0086 0.0014 0.0014 0.00056 Zn ** mg/L 0.21 0.051 0.035 0.77 0.15 0.12 1.22 0.23 0.21 1.46 0.33 0.31 1.03 0.16 0.16 0.388 NO3 mg/L 0.31 0.071 0.049 0.74 0.14 0.12 0.72 0.14 0.13 0.11 0.024 0.022 0.08 0.012 0.012 10.0 NH4 mg/L 0.31 0.071 0.049 0.74 0.14 0.12 0.72 0.14 0.13 0.11 0.024 0.022 0.08 0.012 0.012
Notes: * Secondary Drinking Water Standard ** Varies with Hardness Concentration (Assumed 400 mg/L Hardness)

RS29T 5-22
Parameters that could potentially exceed these targets and potential plans to mitigate these values, if
necessary, include:
• Sulfate – The primary contribution of sulfate to the Mine Site process water is from
Category 3 and Category 4 stockpiles. The drainage from the Category 3 and 4 stockpiles is
proposed to be routed to the Stage 1 EQ Pond and will undergo chemical precipitation
treatment. Concentrating the sulfate in the Stage 2 flows prior to chemical precipitation will
improve the overall effectiveness of the WWTF and provide a permeate that when blended
with the treated stream from the chemical precipitation unit will achieve the process water
quality targets in all years modeled except Year 15. Given the variability of the
concentration of sulfate in Stage 1 and Stage 2 flows, the effluent estimate for sulfate is
potentially sensitive to significant changes in the ratio between these flows as well as the
concentration of sulfate in any flow. The values used in this evaluation, however, are
conservative, and the proposed treatment operation is capable of treating a wide range of
potential volumes and concentrations. For example, in Year 15 when the estimated flows to
Stage 2 decrease, a portion of the Stage 1 flows could be routed into Stage 2 to concentrate
more of the mass flow in Stage 1 and provide additional permeate in Stage 2.
• Metals (Aluminum, Arsenic and Cobalt) – The primary contributor of these parameters to the
Mine Site process water is also from Category 3 and Category 4 stockpiles. The predicted
effluent values for these parameters are close to the process water quality targets using
conservative removal percentages from the treatability study. Additional removal of these
parameters is anticipated using the HDS process, as demonstrated in the absolute values
obtained in the treatability study (Table 9 in Attachment C2), which showed all these
parameters below the process water quality targets. If necessary, additional coagulation and
flocculation time, or the addition of iron salts to the process would improve removal
efficiencies. No other process modification would be required.
• Mercury –Mercury will likely exceed the process water quality target. However, this water
will be pumped to the tailings basin where additional mercury removal is anticipated due to
exposure to the NorthMet tailings. No other process modifications are anticipated to remove
additional mercury.
• Thallium – The analytical results from several sources used in the prediction of the influent
water quality to the WWTF reported thallium as non-detect at values above the process water
quality target. Thus the reported value is likely a maximum value. At this time, thallium is

RS29T 5-23
not expected to be a concern, however, additional analysis of input flows will be needed to
confirm the actual inputs and, if necessary, evaluate removal efficiencies using the proposed
unit operations.
The ability of the WWTF to achieve the level of performance established by the process water
quality targets will be monitored during the operation of the facility. If necessary, improvements to
the process can be developed and/or additional technologies can be added to achieve treatment
objectives.
5.6 Solid Waste Management Plan A portion of the solids removed from the Stage 1clarifier will be returned to the rapid mix tank at the
beginning of the chemical precipitation treatment process to promote crystal formation. The
remaining solids will be conveyed to a sludge thickening unit and then pumped to a filter press
operation where excess liquids will be removed prior to being returned to the influent stream of the
Stage 1 treatment system. One press will be installed for the Stage 1 clarifier and an additional press
will be installed for the solids from the final (recarbonation) clarifier to allow the solid waste streams
generated from each of these operations to be managed individually. Dewatered solids will be
disposed with the hydrometallurgical residues or may be re-pulped and fed into the
hydrometallurgical process for metals recovery.

RS29T 6-1
6.0 Evaluation of Treatment Options for Tailings Basins Water
No additional wastewater treatment operations are anticipated at the Plant Site. The reuse/recycle
water management program for NorthMet, the separation of the process water loops between the
Beneficiation Plant and the Hydrometallurgical Plant, and the wastewater treatment operation for
process water at the Mine Site as described in Section 5 result in water quality within the tailings
basin that is generally below the process water quality targets.
As noted in RS54A/RS46, the primary contributors of dissolved chemicals of potential concern to the
tailings basin water are the make-up water from the mine site and chemical transformations within
the tailings basin, such as oxidation on the beaches. By treating the Mine Site process water to
achieve the process water quality targets before adding this water to the tailings basin, the overall
water quality is maintained.
The potential load from recycling water from the tailings basin through the Beneficiation Plant was
evaluated during two pilot tests. A technical memo summarizing the water quality from the pilot
plant and estimating the potential load to the tailings basin was developed and is included with this
report as Appendix H. The results of this modeling show that the concentrations in the water
returning to the tailings basin from the Beneficiation Plant are lower than the concentrations in the
WWTF effluent. The water through the Beneficiation Plant is not a major source for metals, as these
are primarily captured with the concentrate. Sulfate added to the flotation process does report to the
tailings basin. However, the load is lower than the load from the WWTF effluent. RS54A/RS46
developed a more conservative calculation of values for the potential load from the Beneficiation
Plant to the tailings basin than those calculated in Appendix H. Those values were used in
RS54A/RS46 to develop water quality predictions for the basin which adds additional conservatism
to the water quality predictions for the tailings basin.
In the event that the predictions in Appendix H and RS54A/RS46 underestimate the loads to the
tailings basin from the Beneficiation Plant, the seepage return drains, or other sources, the parameters
closest to the process water quality targets, and therefore the first parameters of potential concern
would likely be sulfate and nickel. Because the concentration of sulfate would likely be too low to
be removed by chemical precipitation as gypsum, a likely wastewater treatment scenario at the Plant
Site, if any additional treatment were necessary, would be to use nanofiltration to ‘concentrate’ the
sulfate in the tailings basin water, similar to the plan for concentrating sulfate in the Stage 2 (low

RS29T 6-2
sulfate concentration) water at the Mine Site. Permeate could then be returned to the tailings basin
while the brine could be treated to remove the sulfate as gypsum, most likely by sending the brine to
the Hydrometallurgical Plant.

RS29T 7-1
7.0 Summary
This report has addressed potential wastewater quality concerns at NorthMet and evaluated different
treatment technologies for process water. This report follows the SOW established during the
scoping of the EIS for the NorthMet project. Although wastewater discharges were being considered
during the development of the SOW, PolyMet will be using a reuse/recycle water management plan
at NorthMet to eliminate the need for discharge of water to surface water. The reuse/recycle water
management plan is outlined in Section 2 along with a summary of the water quantity and quality at
the Mine Site and the Plant Site as outlined in Phase 3 of the SOW.
Phase 1 of the SOW is presented as Section 3. The work described in Section 3 developed
conservative process water quality targets based on surface water and groundwater quality standards.
Phase 2, developed in Section 4 of the report, detailed potential wastewater treatment technologies
for the removal of dissolved metals, sulfate, and other chemicals of concern. The use of chemical
precipitation, membrane treatment, ion exchange, and constructed wetlands for treatment of the Mine
Site process water, including removal of dissolved metals, sulfate and other parameters of potential
concern was detailed in Section 5 in compliance with Phase 4 of the SOW. No treatment of water is
required at the Plant Site. Section 6 of this report outlined the basis for this conclusion and provided
contingent treatment scenarios for removal of chemicals of concern in the event that actual
concentrations exceed process water quality targets.
At the completion of the treatment technology evaluation in Section 5, a proposed treatment program
for Mine Site process water was presented. The proposed treatment system would include chemical
precipitation treatment for the low-volume high-strength flows from the Mine Site including the
drainage from waste rock stockpiles along with nanofiltration to concentrate the high-volume, low-
strength flows prior to chemical precipitation treatment. This basic combination of technologies
achieves the process water quality targets for most parameters of concern throughout the operating
period of the Mine Site and has the flexibility for enhanced chemical treatment (e.g., addition of iron
salts) if necessary to achieve process water quality targets for all parameters. Estimates for potential
wastewater effluent quality were presented in Table 14. The predicted effluent concentrations were
calculated using the combination of low flow and high concentration water quantity and quality
values from the hydrologic and geochemical modeling completed at the Mine Site.

RS29T 8-1
8.0 References
8.1 Printed Materials Batchelor, B., Lasala, M.B., McDevitt, M., and Peacock, E., 1991. Technical and Economic
Feasibility of Ultra-High Lime Treatment for Recycled Cooling Water. Research Journal of the Water Pollution Control Federation, 63:7, 982-990.
Brinson, M.M., Lugo, A.E., and Brown, S. 1981. Primary productivity, decomposition, and consumer activity in freshwater wetlands. Annu. Rev. Ecol. Syst., 12: 123-161.
Davis, R.A., McElhiney, J.E., 2002. The Advancement of Sulfate Removal from Seawater in Offshore Waterflood Operations. Proceedings: Corrosion 2002.
Eger, P., Wagner, J., Melchert, G., Antonson, D., and Jackson, A. 2000. Long Term Wetland Treatment of Mine Drainage at LTV Steel Mining Company’s Dunka Mine. Minnesota DNR.
Gula, M. and Harvey, J., 1996. Novel Silica-Based Ion Exchange Resin .Eichrom Industries, Inc. Darien, IL, Conference on Industry, Morgantown, WV, October 22-24, 1996.
ITRC, 2003. Technical and regulatory guidance document for constructed treatment wetlands.
Kim, B.M. and Amodeo, P.A., 1983. Calcium sulfide process for treatment of metal-containing wastes. Environmental Progress 2: 175-180.
Kurniawan, T. A., Chan, G. Y. S., Lo, W., and Babel, S. Physico-chemical treatment techniques for wastewater laden with heavy metals. Chemical Engineering Journal, January, 2006.
Le Gouellec, Y.A., Elimelech, M., 2002. Control of Calcium sulfate (Gypsum) Scale in Nanofiltration of Saline Agricultural Drainage Water. Environmental Engineering Science, 19:6. 387-397.
Lorax Environmental, 2003. Treatment of Sulphate in Mine Effluents. Prepared for the International Network for Acid Prevention, October 2003.
Madigan, M.T., Martinko, J.M., and Parker, J. 1997. Brock Biology of Microorganisms, 8th Edition. Prentice Hall, Inc., Upper Saddle River, NJ.
Minnesota Department of Natural Resources, Paul Eger, Andrea Johnson, Jon Wagner, 2001, “Investigation of Elevated Copper and Cobalt Concentrations in Soudan Mine Drainage” (MNDNR, 2001)
Patrick, W.H. and Turner, F.T. 1968. Effect of redox potential on manganese transformation in waterlogged soil. Nature 220, 476-478.
Sencindiver, J.C. and Bhumbla, D.K. 1988. Effects of cattail (Typha) on metal removal from mine drainage. Mine Drainage and Surface Mine Reclamation 1: 359-366.
Smit, J. and Sibilski, U.E., October 2003. Pilot Plant Study to Treat Typical Gold Mine Minewater Using the SAVMIN Process. Proceedings, Water in Mining Conference.
Tarutus, W.J., Unz, R.F., and Brooks, R.P. 1992. Behavior of sedimentary Fe and Mn in a natural wetland receiving acidic mine drainage, Pennsylvania, USA. Applied Geochemistry, 7:77-85.

RS29T 8-2
Taylor, G.J. and Crowder, A.A. 1982. Uptake and accumulation of copper, nickel, and iron by Typha latifolia grown in solution culture. Canadian Journal of Botany, 61:1825-1830.
US Army Corps of Engineers, 2001. “Precipitation/coagulation/flocculation Engineering and Design Manual, EM 1110-1-4012”
U.S. Environmental Protection Agency, 2006. “Management and Treatment of Water from Hard Rock Waste Sites”, Office of Research and Development, National Risk Management Research Laboratory, Cincinnati, Ohio. EPA-625/R-06/014.
U.S. Environmental Protection Agency, 1999. “Final Report – Berkeley Pit Innovative Technologies Project, Phase III: Hydrometrics, Inc. Demonstration of Sulfate Removal using the Walhalla Process, Mine Waste Technology Program Activity IV, Project 7”. Prepared by Montana Tech of the University of Montana and MSE Technology Applications, Inc., February 1999.
U.S. Environmental Protection Agency, 1996. “Capsule Report: Reverse Osmosis Process”, EPA-625/R-96/009.
U.S. Environmental Protection Agency, 1980. “Summary Report: Control and Treatment Technology for the Metal Finishing Industry”. EPA 625/8-80-003.
U.S. Environmental Protection Agency, 1973. “Applications of Reverse Osmosis to Acid Mine Drainage Treatment”, EPA-670/2-73-100.
Vymazal, 1995. “Algae and Nutrient Cycling in Wetlands”. CRC Press/Lewis Publishers, Boca Raton, Florida.
Wieder, R.K. 1988. Determining the capacity for metal retention in man-made wetlands constructed for treatment of coal mine drainage. Mine Drainage and Surface Mine Reclamation 1: 375-380.
Wieder, R.K. 1990. Metal cation binding to Sphagnum peat and sawdust: relation to wetland treatment of metal-polluted waters. Water, Air, and Soil Pollution, 53: 391-400.
Wieder, R.K. and Lange, G.E. 1988. Cycling of inorganic and organic sulfur in peat from Big Run Bog, West Virginia. Biogeochemistry, 5, 221-242.
Worrall, F., Reed, M., Warburton, J., and Burt, T. 2003. Carbon budget for a British upland peat
catchment. The Science of the Total Environment. 312: 133-146.
8.2 Electronic Materials http://www.aquatechnology.net, Accessed April 13, 2006.
http://www.frtr.gov/matrix2/section4/4_52.html#cost, Accessed April 17, 2006.
http://gewater.com/library/tp/833_WHat_Is.jsp, Accessed April 13, 2006.
http://www.nesc.wvu.edu/ndwc/pdf/OT/TB/TB4_IonExchange.pdf, Accessed April 17, 2006.
http://www.nmfrc.org/pdf/ro.htm, Accessed June 23, 2006.
http://www.remco.com/ix.htm, Accessed April 17, 2006.

Figures

Area 1 Shops
TailingsBasin Area
PlantArea
RailroadConstruction
Mining/Stockpile Area
Area 2 ShopsNew TreatedWater Pipeline
Mud Lake
Wyma
n Cre
ek
Second Creek
Stubble Creek
Yelp Creek
Partridge River
Barr F
ooter
: Date
: 3/30
/2007
12:41
:16 PM
File
: I:\C
lient\
Polym
et\Ma
ps\EI
S_Re
ports
_and
_Stud
ies\R
S29T
\Figu
re 1 P
rojec
t Loc
ation
Map
.mxd
Use
r: TJ
A
0 1.25 2.50.625Miles
Figure 1PROJECT LOCATION MAP
NorthMet ProjectPolyMet Mining Inc.
Hoyt Lakes, MN
I
ProjectLocation
Mine SiteTreated Water PipelineProposed StockpilesProposed Pits

Cell 2W
Cell 2E
Cell 1E
Facility
0 2,000 4,0001,000 Feet
Barr F
ooter
: Date
: 3/30
/2007
12:11
:21 PM
File:
I:\C
lient\
Polym
et\Ma
ps\EI
S_Re
ports
_and
_Stud
ies\R
S29T
\Figu
re 2 T
ailing
s Bas
in.mx
d Use
r: TJ
A
IFigure 2
TAILINGS BASINNorthMet Project
PolyMet Mining Inc.Hoyt Lakes, MN
2003 FSA Aerial Photo

Concentrator
Plant
Make-Up
Water
Moisture
in Ore
Evaporation
Moisture in
Concentrator
Product
Tailings
Basin
Entrainment
Loss
Mounded Water
Within Basin
Seepage
Recovery
System
Water from
Mine Site
Watershed
Yield
Precipitation
Less Evaporation
Groundwater
SeepageTo Hydrometallurgical Plant
Water to Basin
Water from Bas
in
Seepage
Figure 3
TAILINGS BASIN PROCESS
WATER FLOW DIAGRAM
NorthMet Project
PolyMet Mining Inc.
Hoyt Lakes, MN

"5
StormwaterSedimentation
Pond
Dunka RoadCPS Pipeline toTailings Basin
CPS PondOverflow
Central PumpingStation
WESTPIT
Stage 2 Pond
Stage 1 Pond
Central PumpingStation Pond
WastewaterTreatment Facility
Figure 4PRELIMINARY LAYOUT OF WWTF
AND CPS SITENorthMet Project
PolyMet Mining Inc. Hoyt Lakes, MN
I
Barr F
ooter
: Date
: 3/30
/2007
12:43
:58 PM
File
: I:\C
lient\
Polym
et\Ma
ps\EI
S_Re
ports
_and
_Stud
ies\RS
29T\F
igure
4 Pr
elimi
nary
Layo
ut of
WWTF
and C
PS Si
te.mx
d Use
r: TJ
A
0 150 30075Feet
Equilization PondsWastewater Treatment FacilityCPS Pond OverflowWWTF FlowsMine to Plant PipelineProcess Water PipesPits
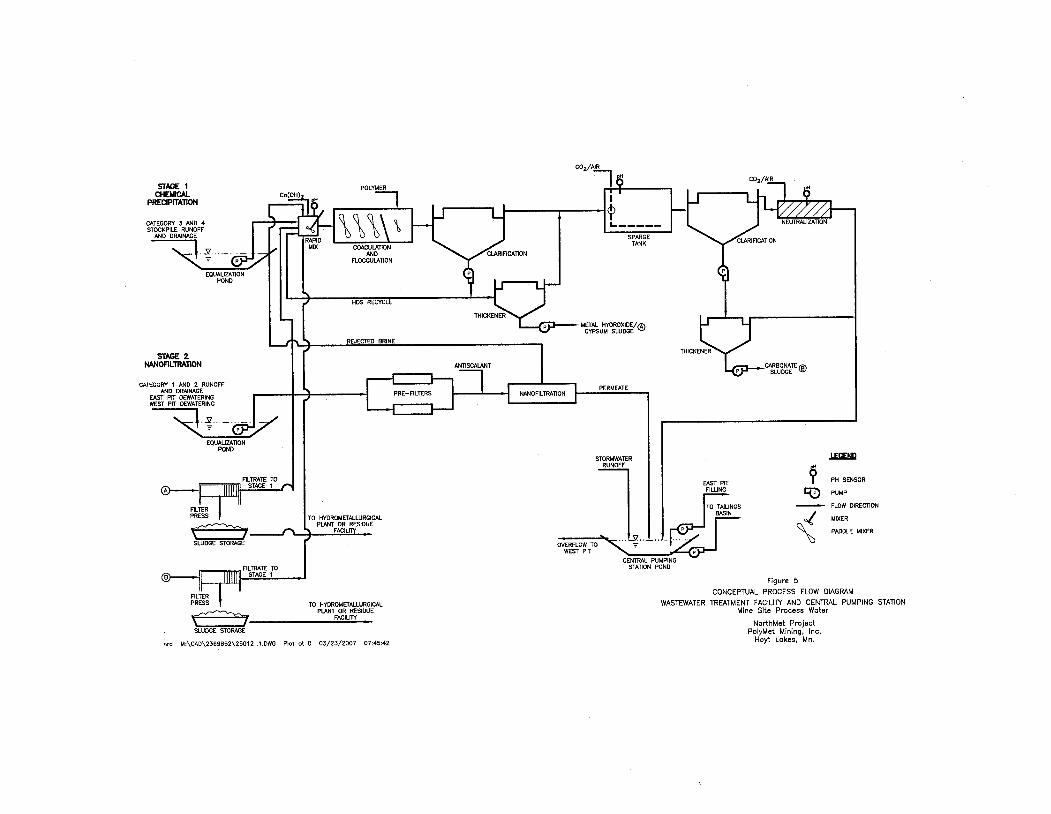

Appendix A
Technical Design Evaluation Report – Scope of Work

NorthMet Project – Technical Design Evaluation Report – Scope of Work
October 24, 2005
Name: Wastewater Treatment Technology Due Date: 4/4/06
Timeline Reference: RS29 Scoping Decision Reference: 2.5
Objective:
Study and report on wastewater treatment technologies for mine site reactive runoff water and
plant site process water and provide conceptual sketches of the proposed design.
Scope:
Phase 1 of the study will develop anticipated water quality effluent discharge limits for permitted
discharges at the mine site and plant site. The specific parameters to be studied are:
a. pH
b. Metals
c. Mercury
d. Sulfate
e. ‘Salinity’ (chloride, alkalinity, specific conductance, hardness, TDS)
f. Nutrients
g. Organics, GRO, DRO
Phase 2 of the study will collect information on the potential treatment (removal) efficiency for
the parameters listed in Phase 1, using the following wastewater treatment technologies:
a. Precipitation (neutralization, Bauxaul, sulfide, etc.)
b. Reverse osmosis
c. Ion exchange
d. Constructed Wetland
e. Membrane technology
Phase 3 of the study will address wastewater minimization by developing a matrix of potential
wastewater quantity and quality values associated with various capping and segregation
scenarios for the sources of wastewater including:
a. Mine pit dewatering
b. Stockpile run-off
i. Reactive Waste Rock
ii. Lean Ore
iii. Ore
c. Process water discharged from the tailings basin
Phase 4 of the study will evaluate the effectiveness, implementability and cost of the studied
technologies (including practical combinations - pretreatment, staged and series) for wastewater
minimization and treatment of mine site reactive runoff (Mine Pit Dewatering and Reactive
Waste Rock/Ore/Lean Ore Stockpile Seepage).
Page 1 of 2

NorthMet Project – Technical Design Evaluation Report – Scope of Work
October 24, 2005
Phase 5 of the study will evaluate the effectiveness, implementability and cost of the studied
technologies (including practical combinations – pretreatment, staged and series) for plant site
process water (Tailings Basin).
For Phases 4 and 5 of the evaluation protocol will include
I. Technological feasibility
a. Ability to meet effluent limits
b. Design limitations
i. Hydraulic and chemical capacity
ii. Effects of temperature
c. Short term effectiveness
d. Long term effectiveness (closure)
e. Metal recovery (recycling for further processing) from wastewater or sludge
II. Economic implications
a. Capital costs
b. Operating and maintenance costs
c. Closure costs
III. Implementability considerations
Existing/Provided Information:
Details on predicted pre discharge water quality and discharge water quantity will be provided in
the following reports or studies:
1. Hydrology – Mine Water Model and Balance
2. Process Design – Tailings Basin Water Balance
3. Mine Pit Water Quality Model
4. Wastewater Modeling - Waste Rock and Lean Ore
5. Wastewater Modeling – Tailings
6. Mine Wastewater Management Systems
7. Reactive Waste Segregation
Deliverable:
A report summarizing the wastewater management (including combinations of wastewater
minimization and treatment) scenarios for mine site and plant site (study details to be included as
an appendix) and ranking them on effectiveness, implementability and cost is required. Highest
effectiveness, easiest implementability and lowest cost would be an optimum solution. However,
it is likely that trade-offs between effectiveness, implementability, and cost will need to be
considered. Wherever possible, quantitative estimates of effectiveness will be provided (e.g.,
concentration and mass of pollutants in effluent and pollutant removal efficiency). Cost will
include construction, operation and post closure costs. Sketches of the proposed design will be
included, consisting of plan location, alignment and cross sections.
Page 2 of 2

Appendix B
Laboratory Study of Mercury Adsorption to LTV Taconite and NorthMet Tailings

RS29T B-i
Appendix B Laboratory Study of Mercury Adsorption to
LTV Taconite and NorthMet Tailings
Table of Contents
1.0 Laboratory Testing................................................................................................................... B-1 1.1 Background ...................................................................................................................... B-1
2.0 Materials and Methods............................................................................................................. B-1 2.1 Collection of Water and Tailings Samples........................................................................ B-1 2.2 Experimental Set-up ......................................................................................................... B-2
3.0 Results ..................................................................................................................................... B-2 3.1 Adsorption of Mercury by PolyMet Tailings .................................................................... B-2 3.2 Adsorption of Metals by PolyMet Tailings ....................................................................... B-3

RS29T B-ii
List of Attachments
Attachment B1 NTS Experiment Summary
RS29T B-1
1.0 Laboratory Testing 1.1 Background Dissolved mercury is ubiquitous in surface water in Northeastern Minnesota as a result of
atmospheric deposition from distant sources. This has caused issues with wastewater management
due to the extremely low discharge limits for mercury, especially for surface waters within the Lake
Superior watershed, where the discharge limit is set at 1.3 ng/L in accordance with the international
“Great Lakes Initiative.”
The NorthMet project will use a reuse/recycle water management strategy to eliminate the need to
discharge water from either the Plant Site or the Mine Site to the Surface Waters of the State of
Minnesota. Water generated at the Mine Site will be treated to meet process water quality targets
and then pumped to the tailings basin for use as make-up water in the Beneficiation Plant. With this
plan, low concentrations of mercury in the Mine Site process water will be partially reduced by
treatment at the wastewater treatment facility (WWTF) located at the Mine Site. The remaining
mercury will be discharged to the tailings basin.
Water quality monitoring of taconite tailings basins has suggested that mercury in tailings basin
surface waters will be adsorbed by the fine tailings material and buried within the tailings basins.
This removal mechanism was also considered likely for the NorthMet tailings and was assessed in
laboratory tests conducted on behalf of PolyMet by Northeast Technical Services, Inc. of Virginia,
Minnesota (NTS).
2.0 Materials and Methods 2.1 Collection of Water and Tailings Samples Water and NorthMet tailings used in the experiments were obtained from pilot testing of the ore
crushing and concentrating pilot tests conducted by SGS Lakefield Research Limited in accordance
with the Environmental Sampling and Analysis Plan, Pilot Test – NorthMet Deposit, prepared by
Barr Engineering (June 2005).
Flotation tests were conducted with three different ore grades with and without copper sulfate
addition. NorthMet tailings samples were collected from each run and stored in sealed 5-gallon
polyethylene containers. Tailings samples were collected in a saturated condition and maintained
with approximately 5 cm of water above the surface of the tailings. All containers were labeled and
stored in the on-site Lakefield walk-in cooler at 5ºC. Bulk process water samples associated with
each type of ore grade (with and without copper sulfate) were also collected from each run and stored

RS29T B-2
in sealed 55-gallon drums. Three drums per test cycle were collected and stored in the Lakefield 5ºC
cooler.
A 20 L sub-sample of the archived process water inventory at Lakefield was obtained by Lakefield
staff from a designated archive sample (P1L-BCS) using a peristaltic pump with new tubing (rinsed
with deionized water) and shipped directly to NTS. The sample container was filled completely
(minimal headspace), surrounded with protective bubble-wrap, placed on-ice in coolers and shipped
via overnight carrier.
A sub-sample of the NorthMet tailings was also prepared by Lakefield staff and shipped directly to
NTS. The tailings sub-sample was obtained using a clean scooping utensil (plastic preferred) to
remove tailings from the specified sample container (P1S-CCS), filling a new 1-gallon polyethylene
pail with minimal headspace. The tailings sub-sample was also bubble-wrapped, placed on-ice in a
cooler and shipped overnight.
2.2 Experimental Set-up To evaluate mercury adsorption to tailings over time, large-volume (2.5 L) shake-flask tests were
conducted. One pre-cleaned shake flask was used for each time-series experiment. Process water
obtained from Lakefield was spiked with additional dissolved mercury and then placed into the
Experimental flask (Jug C) and the Process Control flask (Jug D). At the beginning of the
experiment, PolyMet tailings were added to Jug C at a concentration of 50 g/L, while Jug D
contained only water.
At time zero (0) and seven additional time steps (5, 15, 30, 60, 120, 240, and 480 minutes), an aliquot
was removed from each jug, filtered (0.45 µm) and submitted for analysis of dissolved mercury.
Other metals were also analyzed at 0, 30, and 480 minutes. All samples were analyzed by NTS,
along with appropriate samples for quality control.
3.0 Results 3.1 Adsorption of Mercury by PolyMet Tailings The concentration of mercury remaining in solution in shake-flask experiments with (Jug C) and
without (Jug D) the addition of PolyMet tailings is reported in the table in Attachment B1 and shown
graphically on the figure in Attachment 1 (Laboratory reports for analytical data are available from
NTS upon request). The results show that mercury removal by adsorption to PolyMet tailings occurs
rapidly and remains stable throughout the conditions of this experiment. The concentration of

RS29T B-3
mercury in contact with PolyMet tailings is below the process water quality target for mercury. In
contrast, the results in the control show that mercury is not lost and remains above the process water
quality target. Together these results show that PolyMet tailings adsorb mercury.
3.2 Adsorption of Metals by PolyMet Tailings The concentrations of the heavy metals cadmium, cobalt, copper, nickel, and zinc were analyzed in
the large-shake flask experiments at 0, 30, and 480 minutes and are reported in the table in
Attachment B1. Over the 480 minutes of the experiment, the following trends were observed:
• cadmium and zinc were not detected in any of the samples in either of the shake flasks
• cobalt concentrations decreased with time in both flasks, although the change was likely not
significant
• copper concentrations increased slightly in the experiment that included PolyMet tailings, but
did not change in the control flask
• nickel concentrations decreased in the experiment with PolyMet tailings and increased
slightly in the control flask
Other dissolved parameters were also measured including calcium, magnesium, iron, manganese,
chloride, and sulfate. None of these parameters showed any significant trends in the process control
test. In the test with PolyMet tailings, a slight increase in the concentrations of calcium, chloride,
and sulfate were observed. The concentrations of iron magnesium and manganese did not change.

Attachment B1
NTS Experiment Summary

PolyMet Mercury StudyExperiment #8: Kinetics (Lakefield #2 and PolyMet Tailings)
6.22.2006
0 5 15 30 60 60.2 120 240 480 0 15 30 60 120 240 480 EBAlkalinity (as CaCO3) 140 151 185 153 146 167Cadmium, diss. ug/L <0.2 <0.2 <0.2 <0.2 <0.2 <0.2Calcium, diss. mg/L 19.7 24.8 25.1 19.8 19.9 19.7Chloride, diss. mg/L 67.7 69.1 70.8 64.7 64.5 66.8Cobalt, diss. ug/L 1.2 <1 <1 1.1 1.1 <1Copper, diss. ug/L <2 2.4 4.5 <2 <2 <2DOC mg/L 106.7 107.9 108.5 107.8 107.2 109Iron, diss. mg/L <0.05 <0.05 <0.05 <0.05 <0.05 <0.05Magnesium, diss. mg/L 11.1 11.0 11.6 11.2 11.2 11.1Manganese, diss. mg/L 0.04 0.02 0.02 0.04 0.04 0.04Mercury (LL), diss. ng/L 3.3 0.9 0.6 0.5 <0.5 <0.5 <0.5 <0.5 0.9 3.6 3.3 3.1 2.9 2.8 3.0 2.8 <0.2Nickel, diss. ug/L 16.9 7.4 5.2 17.4 17.8 20.5pH 8.2 8.3 8.3 8.1 8.2 8.2Sulfate mg/L 126 153 146 135 124 140Zinc, diss. ug/L <5 <5 <5 <5 <5 <5
Jug C Jug D

Experiment #8 - KineticsPolyMet (6472K.08)
6.23.2006
0.9
3.6
3.3
2.8
0.9
<0.5<0.5<0.50.5
0.6
3.33.0
2.8
2.93.1
0
0.5
1
1.5
2
2.5
3
3.5
4
-20 0 20 40 60 80 100
120
140
160
180
200
220
240
260
280
300
320
340
360
380
400
420
440
460
480
500
Time (minutes)
Con
cent
ratio
n of
Dis
solv
ed M
ercu
ry (n
g/L)
Jug C
Jug D
GLI Standard = 1.3 ng/L
Jug C = Experiment. Jug C contains spiked Lakefield Process water (collected at 1400h, 4.6.2006), PolyMet tailings (start conc. = 50g/L), aliquots filtered with 0.45 um membrane. Jug C was agitated by reciprocating platform shaker. Samples taken at 0, 5, 15, 30, 60, 120, 240, 480 minutes after addition of tailings.
Jug D = Process Control. Jug D contains spiked Lakefield water. Aliquots were filtered with 0.45 um membrane. Jug D was agitated by reciprocating platform shaker. Samples were taken at 0, 5, 15, 30, 60, 120, 240, 480 minutes after start of experiment.

Appendix C
RS45 – Water Treatment Studies – Waste Rock and Lean Ore

RS29T C-i
Appendix C
RS45 – Waste Rock and Lean Ore Wastewater Treatability Study Report
Table of Contents
1.0 Introduction ............................................................................................................................. C-1
1.1 Background ...................................................................................................................... C-1
1.2 Purpose and Objectives..................................................................................................... C-1
1.3 Report Organization ......................................................................................................... C-1
2.0 Synthesis of Predecessor Reports............................................................................................. C-2
3.0 Literature Evaluation of Potential Treatment Technologies ..................................................... C-2
4.0 Bench-Scale Treatability Testing ............................................................................................. C-2
4.1 Treatability Testing Protocol ............................................................................................ C-2
4.2 Treatability Testing Results .............................................................................................. C-3
5.0 Conclusions and Recommendations ......................................................................................... C-3
5.1 Conclusions ...................................................................................................................... C-3
5.2 Recommendations and Identification of Additional Data Needs....................................... C-4

RS29T C-ii
List of Tables
Table C1 Dunka Seep Water Quality Data
Table C2 Treatability Study Removal Efficiencies
List of Attachments
Attachment C1 Wastewater Treatability Study Protocol
Attachment C2 Wastewater Treatability Study Report

RS29T C-1
1.0 Introduction
1.1 Background
PolyMet Mining, Inc. (PolyMet) plans to excavate and process low-grade, polymetallic,
disseminated, magmatic-sulfide NorthMet-deposit ore in northeastern Minnesota, approximately
6 miles south of the town of Babbitt, Minnesota, as described in RS29T and other reports.
PolyMet is proposing to reuse/recycle process water from the Mine Site in the operations at the
Plant Site and to eliminate any direct discharge from NorthMet to the surface waters of the State
of Minnesota. A key component of this water management plan will include treatment of Mine
Site process water.
1.2 Purpose and Objectives
The objective of this Waste Rock and Lean Ore Wastewater Treatability Study Report (RS45) is
to summarize the results of treatability studies completed for the wastewater generated at the
Mine Site – collectively referred to as Mine Site process water. With the reuse/recycle water
management plan, this water is not being treated for discharge, but for reuse within the
Beneficiation Plant at NorthMet. Thus, treatment requirements are considered within the context
of the overall operation, which is somewhat different than the objectives envisioned during the
development of the preliminary outline for this report with the DNR.
1.3 Report Organization
The outline developed for this report in consultation with DNR staff has been used to prepare this
report. However, since most of the information contemplated in the development of this report
has been included in other reports, the content of several of these sections is limited. In
accordance with the original outline:
• Section 2 contains a summary of information from predecessor reports,
• Section 3 contains a literature evaluation of potential treatment technologies,
• Section 4 summarizes the bench-scale treatability studies, and
• Section 5 outlines the conclusions and recommendations from this work and identifies
future data needs.

RS29T C-2
2.0 Synthesis of Predecessor Reports
The recycle/reuse water management plan for NorthMet envisions no discharge of wastewater
from either the Mine Site or the Plant Site to the surface waters of the State of Minnesota. This
plan is summarized in Section 2 of RS29T. Detailed portions of this plan were developed in
several other documents, which are referred to in Section 2 of RS29T.
3.0 Literature Evaluation of Potential Treatment Technologies
Potential treatment technologies for Mine Site process water are described in detail in Section 4
of RS29T. The technologies described include chemical precipitation, membrane technologies
(including reverse osmosis and nanofiltration), ion exchange, and constructed wetlands
(including bioreactor treatment systems). As described in RS29T, all of these technologies are
potentially viable for the anticipated Mine Site process water.
All these technologies have advantages and disadvantages. These are identified in Section 5 of
RS29T along with a discussion of the benefits of using two of these technologies in combination
to improve overall treatment effectiveness in meeting the process water quality targets.
Several technologies that do not relate directly to wastewater treatment, but instead could be
implemented to reduce either the volume or the strength of Mine Site process water, have been
considered throughout the development of reports for the NorthMet Project. For example,
techniques that have been used to reduce the volumes of runoff or drainage water from waste
rock stockpiles are described in RS49, Stockpile Conceptual Design, while several technologies
that could be implemented during the construction of the waste rock piles to reduce the strength
of waste rock drainage were described in RS30, Reactive Waste Rock Stockpile Chemical
Modification.
4.0 Bench-Scale Treatability Testing
4.1 Treatability Testing Protocol
Bench-scale treatability testing was conducted in accordance with the Wastewater Treatability
Study Protocol (Attachment C1). The protocol outlined the source of water that would be used
(Dunka seep water), the technologies that would be tested, and the methods that would be used to
evaluate the treatment technologies. A split sample of the seep water was also collected and
submitted to CAS for analysis.
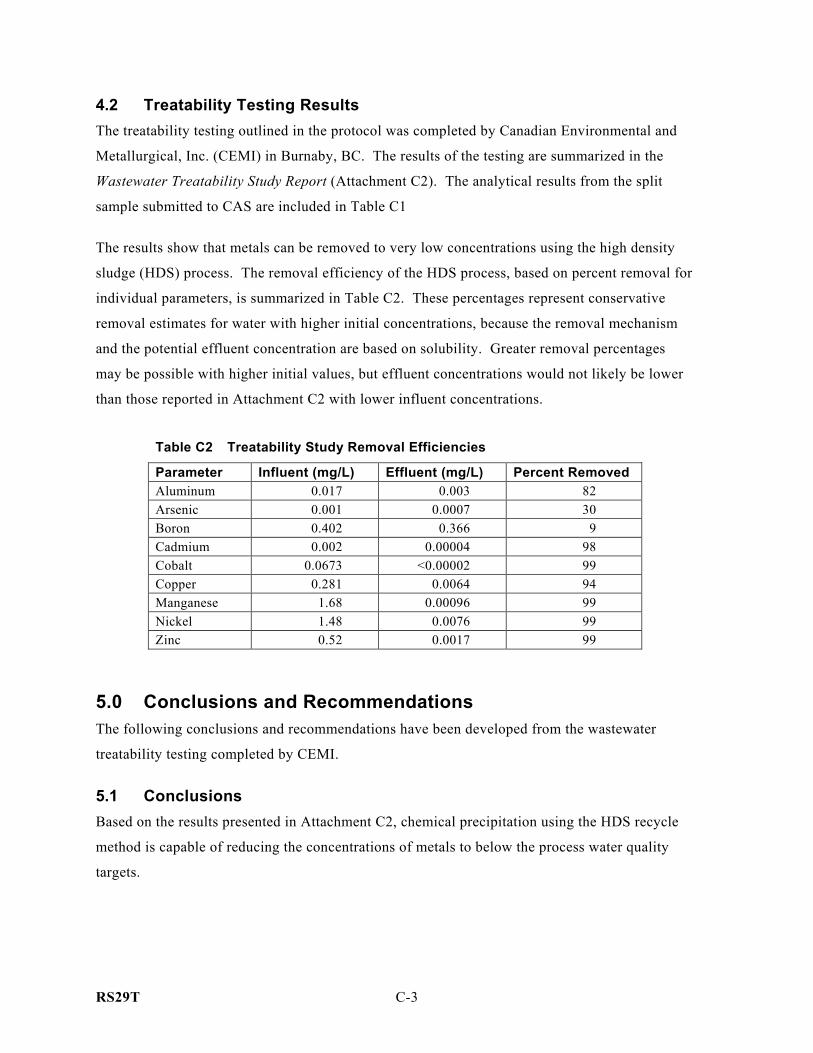
RS29T C-3
4.2 Treatability Testing Results
The treatability testing outlined in the protocol was completed by Canadian Environmental and
Metallurgical, Inc. (CEMI) in Burnaby, BC. The results of the testing are summarized in the
Wastewater Treatability Study Report (Attachment C2). The analytical results from the split
sample submitted to CAS are included in Table C1
The results show that metals can be removed to very low concentrations using the high density
sludge (HDS) process. The removal efficiency of the HDS process, based on percent removal for
individual parameters, is summarized in Table C2. These percentages represent conservative
removal estimates for water with higher initial concentrations, because the removal mechanism
and the potential effluent concentration are based on solubility. Greater removal percentages
may be possible with higher initial values, but effluent concentrations would not likely be lower
than those reported in Attachment C2 with lower influent concentrations.
Table C2 Treatability Study Removal Efficiencies
Parameter Influent (mg/L) Effluent (mg/L) Percent Removed
Aluminum 0.017 0.003 82
Arsenic 0.001 0.0007 30
Boron 0.402 0.366 9
Cadmium 0.002 0.00004 98
Cobalt 0.0673 <0.00002 99
Copper 0.281 0.0064 94
Manganese 1.68 0.00096 99
Nickel 1.48 0.0076 99
Zinc 0.52 0.0017 99
5.0 Conclusions and Recommendations
The following conclusions and recommendations have been developed from the wastewater
treatability testing completed by CEMI.
5.1 Conclusions
Based on the results presented in Attachment C2, chemical precipitation using the HDS recycle
method is capable of reducing the concentrations of metals to below the process water quality
targets.

RS29T C-4
The removal efficiencies calculated from the HDS removal simulation, on a percentage basis,
will be used to evaluate potential removal for a chemical precipitation wastewater treatment
operation at the Mine Site in RS29T (Section 5).
The parameters used in the testing program – specifically the hydraulic retention times in both
the coagulation/flocculation step (60 minutes) and in the settling/clarification step (60 minutes)
will be incorporated into the full-scale design.
The HDS process will facilitate the precipitation of sulfate as gypsum; however, the effluent
concentration will be limited by the solubility of gypsum.
5.2 Recommendations and Identification of Additional Data Needs
The results from the treatability testing completed by CEMI show very good results for metals
removal, but do not fully address other parameters of concern, including mercury and sulfate.
Combinations of technologies should be considered in RS29T to incorporate treatment of these
parameters.

Table C1
Dunka Seep Water Quality Data
(concentrations in ug/L, unless noted otherwise)
Minnesota Surface
Water Quality Criteria
Location Class 2B Chronic WS004 WS004 WS004 WS004 WS004
Date 1/31/2000 5/3/2006 5/3/2006 5/3/2006 5/3/2006 5/3/2006
Lab CAS CAS CAS CAS CAS
Exceedance Key Bold
General Chemical Parameters, mg/L
Alkalinity, (hydrox.) as @CaCO3 -- <2 -- -- -- --
Alkalinity, bicarbonate as CaCO3 -- 103 -- -- -- --
Alkalinity, total -- 103 -- -- -- --
Bromide -- <2.0 * -- -- -- --
Carbonate -- <2 -- -- -- --
Chemical Oxygen Demand -- 14 -- -- -- --
Chloride 230 5.5 -- -- -- --
Fluoride -- <4.0 * -- -- -- --
Nitrate + Nitrite -- 440 -- -- -- --
Nitrogen total kjeldahl -- 100 -- -- -- --
Nitrogen, ammonia as N 40 <50 -- -- -- --
Phosphorus total -- 0.01 -- -- -- --
Solids, total suspended -- <5 -- -- -- --
Sulfate -- 1930 -- -- -- --
Sulfide total -- <2 -- -- -- --
Sulfite -- <2 -- -- -- --
Chlorine 11 <0.1 -- -- -- --
pH, standard units 6.5-9.0 PH 7.36 -- -- -- --
Metals, ug/L
Aluminum 125 -- 229 196 198 224
Antimony 31 -- <0.05 <0.05 <0.05 <0.05
Arsenic 53 -- 0.6 0.6 0.6 0.7
Barium -- -- 12.8 12.4 12.8 13.0
Beryllium -- -- 0.04 0.03 0.03 0.03
Boron -- -- 441 418 437 423
Cadmium 1.1 HD -- 1.90 1.76 1.85 1.82
Calcium -- -- 288000 277000 285000 281000
Chromium 11 CR6 -- 0.3 0.3 0.3 0.6
Cobalt 5.0 -- 62.6 58.3 59.9 62.7
Copper 9.8 HD -- 349 330 343 336
Iron -- -- 40.5 54.1 38.6 40.5
Lead 3.2 HD -- <0.02 <0.02 <0.02 <0.02
Magnesium -- -- 371000 355000 367000 357000
Manganese -- -- 1620 1550 1610 1580
Mercury 0.0069 0.0013 -- -- -- --
Molybdenum -- -- 0.81 0.86 0.87 0.92
Nickel 158 HD -- 1460 1400 1430 1420
Potassium -- -- 6400 6330 5940 6340
Selenium 5.0 -- <2.0 <2.0 <2.0 <2.0
Silver 1.0 HD -- <0.02 <0.02 <0.02 <0.02
Sodium -- -- 57200 54800 56600 54900
Thallium 0.56 -- <0.02 <0.02 <0.02 0.02
Tin -- -- <0.1 <0.1 <0.1 <0.1
Titanium -- -- <10 <10 <10 <10
Zinc 106 HD -- 526 503 519 512
Page 1 of 1
3/30/2007 9:55 AM
p:23/69/862/LIMS/282_Dunka_WS004.xls

Attachment C1
Wastewater Treatability Study Protocol
RS29T C, C1-i
Wastewater Treatability Study Protocol Phase I: Chemical Precipitation
Waste Rock and Lean Ore PolyMet Mining, Inc.
NorthMet Project
March 2006
Table of Contents
1.0 Introduction............................................................................................................................................. 1 1.1 Objectives ................................................................................................................................... 1 1.2 Basis for Selection of Treatment Methods for Testing ............................................................... 1
2.0 Laboratory Materials and Methods ......................................................................................................... 3 2.1 Wastewater.................................................................................................................................. 3 2.2 Sampling and Analytical Procedures .......................................................................................... 4 2.3 Experimental Set-up.................................................................................................................... 4
2.3.1 Step Testing of Lime and Sulfide Precipitation ............................................................. 4
3.0 Data Review, Validation, and Reporting ................................................................................................ 6 3.1 Quality Assurance Objectives..................................................................................................... 6 3.2 Data Reporting ............................................................................................................................ 6 3.3 Data Evaluation........................................................................................................................... 7 3.4 Schedule...................................................................................................................................... 7

RS29T C, C1-ii
List of Tables
Table 1 Preliminary Wastewater Modeling Results, Water Quality Criteria, and Dunka Stockpile Leach Water
Table 2 Proposed Target Concentrations for Waste Rock and Lean Ore Test Waters
Table 3 Analytical Parameters, Method Reporting Limits, and Method Detection Limits
Table 4 Laboratory Sample Containers, Preservation and Holding Times
List of Appendices
Appendix A Barr Standard Operating Procedures for:
• Collection of Wastewater Samples
• Documentation on a Chain of Custody
• Transporting Samples to the Laboratory

RS29T C, C1-1
1.0 Introduction
This Wastewater Treatability Study Protocol (Protocol) presents a proposed approach for treatability
testing for chemical precipitation. Chemical precipitation is a wastewater treatment technology that
can be used to treat the wastewater that is anticipated to be generated from waste rock and lean ore
materials during mining operations at the NorthMet Mine Site.
1.1 Objectives The objective of these treatability tests is to demonstrate the feasibility of chemical precipitation – a
conventional wastewater treatment technology that has been used in numerous full-scale applications
– to treat wastewater from the NorthMet Mine Site. The results of this treatability testing program
will be used to estimate removal efficiency, effluent quality, chemical addition requirements, sludge
generation rates, and design parameters for a pilot-scale and a full-scale chemical precipitation
treatment system. This is the first phase of testing that will be completed to determine the levels of
treatment necessary to treat the NorthMet wastewaters to meet discharge water quality standards
consistent with a new or existing NPDES discharge permit. In a full-scale treatment system, more
than one treatment process may be needed in series to achieve acceptable results. Chemical
precipitation, the focus of this test, would likely be the first treatment operation in a full-scale
wastewater treatment system.
The results of these tests will be incorporated into the process of developing an environmental impact
statement (EIS) that will evaluate the potential impacts associated with the proposed mining
activities and to provide a baseline for pilot-scale testing and full-scale operation of a wastewater
treatment system (or systems) for the NorthMet mine.
1.2 Basis for Selection of Treatment Methods for Testing Treatment processes presented in this Protocol include:
• chemical precipitation with lime addition, and
• chemical precipitation with calcium sulfide or another similar sulfide solution as a secondary or polishing step.
Both of these methods are conventional wastewater treatment unit operations and have been used in
full-scale systems to treat metals such as copper, nickel, mercury, and zinc – the primary chemicals

RS29T C, C1-2
of concern in the wastewater that will be generated at the North Met Mine Site. Lime addition adds
hydroxide ions to the water, which raises the pH. Within a specific range of pH (which varies for
each metal), the hydroxide ions will also react with metals to produce insoluble precipitates that can
be removed from the water by settling (coagulation and flocculation) and filtering, if necessary.
Sulfides such as Na2S or CaS can be used to precipitate most metals. One advantage of sulfide metal
precipitation is that the solubility of the metal sulfide precipitate is often lower than respective
hydroxide or carbonate precipitates formed during lime precipitation. Sulfide precipitation is
typically used after lime treatment as a polishing process to reduce trace metals levels (e.g.,
cadmium). This combined lime and sulfide treatment process reduces the demand for sulfide reagent
and is typically more cost-effective as sulfide reagent costs are high.

RS29T C, C1-3
2.0 Laboratory Materials and Methods
2.1 Wastewater Wastewater for use in the treatability studies will be obtained from one or more sources including:
• synthetic wastewater formulated based on (i) chemical characteristics observed in wastewater from laboratory leaching tests using waste rock or lean ore, or, (ii) predicted for seepage from waste rock or lean ore or under field conditions; and
• waste rock leachate from stockpiles associated with the former mining operations at the Dunka Mine Pit.
The source waters selected for the proposed testing should closely approximate the water quality
expected from the waste rock and lean ore. A comparison of the wastewater modeling results and the
available Dunka Pit water quality data has been conducted to determine the most representative
wastewater source for conducting these tests. Blending of two source waters – for example leachate
from Dunka Mine waste piles and synthetic water – will likely be used to obtain the range of
potential wastewater characteristics that will be representative of wastewater from the two sources
considered in this testing. In general, wastewater from the waste rock piles should typically have a
higher quality (lower concentrations of metals and inorganic chemicals of potential concern) when
compared to the wastewater from lean ore. The treatability study approach described below will be
repeated using two wastewaters that will represent the ranges offered from these two sources.
Table 1 presents the preliminary results from the waste rock wastewater modeling results. Also
shown in Table 1 are the anticipated discharge water quality criteria (Class 2B, chronic standards)
and water quality data from the Dunka waste rock stockpiles. Based on these data, preliminary
proposed target concentrations for the source water to be used for the waste rock and lean ore
treatability tests are presented in Table 2. The target concentrations for the two waste streams will be
formulated using a combination of water from the Dunka stockpile leach water and a dilution water
containing pre-determined concentrations of constituents to achieve the desired concentrations of the
parameters of concern. Prior to developing the blended waters the unblended water will be analyzed
for all the parameters (List 1 and List 2) as described below.

RS29T C, C1-4
2.2 Sampling and Analytical Procedures Water and sludge samples will be collected from the bench-scale treatability testing. All water and
sludge samples will be collected by the test facility personnel in accordance with the Barr
Engineering Company Standard Operating Procedures (SOP) for sample collection, which is included
in Appendix A. All sample collection activities will be documented using a Chain of Custody that
will also be completed in accordance with the Barr Engineering Company SOP. Water samples will
be submitted directly to Columbia Analytical Services (CAS) for analysis of one or more of the
groups of parameters listed in Table 3. Table 3 also provides a summary of the laboratory test
methods, reporting limits, and method detection limits for each parameter. Table 4 provides
additional details for the collection of the environmental samples including container requirements,
sample preservation, storage, and shipping requirements for various analytical parameters. Solid
samples will be dried and weighed at the testing laboratory.
Since mercury is a parameter of high interest, ultra-clean glassware and laboratory procedures that
will ensure the integrity of the results will be required for all the steps described in this Protocol.
2.3 Experimental Set-up
2.3.1 Step Testing of Lime and Sulfide Precipitation This Protocol for chemical precipitation treatability testing will consist of three steps. The first step
will consist of a preliminary screening procedure to evaluate lime dosage rates. The first step of the
experiment will be conducted using conventional Phipps-Bird type jar testing equipment. Aliquots of
500 mL of the selected source water will be added to up to three (3) 1-L beakers suitable for use with
the jar testing equipment. Lime will be added in different dosages to yield a final pH range from 8.0
to 10.0 (in 1.0 pH increments). Rapid mixing will be used and pH will be maintained at the desired
pH level with addition of lime. After 60 minutes of high agitation, allowing time for oxidation, the
rate of the stirring mechanism will be reduced to simulate the flocculation step. After a reasonable
flocculation period, the stirring mechanism will be turned off and the propellers removed from the
jars. A quiescent period of approximately 60 minutes will then take place to simulate solids settling.
During the settling period, a visual observation of any changes in floc settleability and supernatant
clarity with time will be recorded at approximately 5-minute intervals. Digital photographs will be
taken of individual tests. At the conclusion of the settling period, the solution will be filtered. The

RS29T C, C1-5
solids will be dried and weighed to determine the mass of sludge generated and the filtrate will be
submitted to CAS for analysis of the List 1 parameters in Table 3.
In the second step of the test procedure, the lime dosages used in the first step will remain the same
but the rapid mix and flocculation stages of the test will be altered to determine the affect of longer
or shorter reaction and settling times on effluent water quality (clarity) and sludge production. A
total of four(4) jar tests will be used for each water type with reaction and flocculation times
increased and decreased by up to 50 percent of the values used in step one (e.g., 30- and 90-minute
rapid mix and 60-minute floc, 60-minute rapid mix, and 30- and 90-minute floc time). Floc settling
in these tests will be documented and photographs taken as described in step one. At the completion
of the tests, the solution will be filtered as described in step one. The solids will be dried and
weighed to determine the mass of sludge generated and the filtrate will be submitted to CAS for
analysis of the List 1 parameters in Table 3.
At the conclusion of the first two steps of the treatability testing, three factors will be evaluated to
determine the preferred treatment scenario for further testing. These factors, in order, will be:
• lowest concentration of metals in the filtrate,
• lowest mass of sludge, and
• shortest operating time.
The objective of step three in the treatability testing process will be to determine the affect of the
addition of either calcium sulfide or calcium polysulfide on water quality and sludge production. In
step three, five (5) jar tests will be conducted for each wastewater. The lime dosage and operating
time will be determined based on the results from steps one and two. This step will be repeated three
times for each wastewater to generate a sufficient quantity of treated water to perform the sulfide
evaluation portion of this testing procedure. After lime treatment and separation of the filtrate from
the lime sludge, calcium sulfide or polysulfide will be added at a single dose rate to five jars each
with 0.5 liters of treated wastewater. This number of jars is required to generate approximately
2.5 liters of sulfide-treated wastewater per sulfide dose required for laboratory analysis. This step is
repeated for five different doses ranging from 0.5 to 2.5 times the approximate stoichiometric sulfide
concentration needed to precipitate the residual metal cations in solution. Sulfide precipitant will be
allowed to react, flocculate, and settle using the same operating times as the lime sludge. The
samples will then be filtered. As with step one and two, the filtrate will be submitted to CAS.
However, the parameter list for step three will include List 1 and List 2 parameters shown in Table 3.

RS29T C, C1-6
3.0 Data Review, Validation, and Reporting
3.1 Quality Assurance Objectives Quality assurance objectives (QAOs) have been established to ensure accuracy, precision, sensitivity,
completeness, and comparability of laboratory analytical data and to meet the Quality Control (QC)
acceptance criteria of analytical protocols in support of project needs. Overall, QAO procedures for
field sampling, chain-of-custody, laboratory analysis, and reporting will provide the level of data
required for determining the concentration of potential contaminants in air, solid, and water samples.
Four individual QAOs, including precision, accuracy, sensitivity, and completeness will be used to
meet the QAOs for this project. Precision will measure the reproducibility of measurements at the
laboratory by comparing analytical results between matrix spike/matrix spike duplicates (MS/MSD),
laboratory duplicates, and/or masked duplicates collected in the field. The relative percent difference
will be calculated for each pair of duplicate analyses. Accuracy will be measured by the agreement
of results with a known value. Accuracy of results will be assessed using the analytical results of
method blanks, field blanks, reagent/preparation blank, matrix spike/matrix spike duplicate samples,
and laboratory control samples. Completeness is defined as the number of valid measurements
obtained compared to the planned number of measurements and is expressed as a percentage. Barr
expects that the contracted laboratory will provide useable and acceptable data for at least 95 percent
of all samples tested using the specified analytical method. Sensitivity (reporting limits) is
dependent upon instrument sensitivity, sample matrix, and composition effects and will be monitored
by the laboratory. Final laboratory reporting limits are listed in Table 3. Actual reporting limits
achieved may depend on sample size available, sample matrix interferences, and parameter
concentrations. 100 percent of the data will be reviewed.
3.2 Data Reporting At the conclusion of the sampling and analytical events, a report will be generated summarizing the
results. This report will include a summary of sampling activities including locations and numbers of
samples collected, a summary of the analytical results including a data table with any qualifiers
issued based on the quality assurance review, a summary of the quality assurance review, copies of
all laboratory reports, and any conclusions that can be made based on the data.

RS29T C, C1-7
The report will be made available in electronic format (pdf file) on the PolyMet project management
web-site hosted by Barr Engineering. All data generated will be also available as a simple Excel
spreadsheet with columns for sample location, sample date, sample time, parameter name, units,
reporting limit, analytical method, results, and qualifiers.
3.3 Data Evaluation After the data have been reviewed, the analytical results for metals in the step one and step two tests
will be used to generate solubility curves that show pH versus metal concentrations. Similarly, a plot
of metal concentration as a function of sulfide ion addition will be prepared to assess the sulfide
demand to achieve optimal metal removals for key parameters.
At the conclusion of this treatability test, the effectiveness of chemical precipitation will be evaluated
based on the removal efficiencies observed in the final step of the Protocol. Preliminary calculations
of chemical consumption rates and sludge generation rates will also be presented. A determination of
the need for another treatment process – for example ion exchange, activated carbon, or activated
silica adsorption – to achieve the desired effluent quality will also be completed and a
recommendation for further testing, if necessary, will be presented.
3.4 Schedule The treatability testing described in this Protocol will be initiated immediately after review of this
protocol by the DNR. Collection and preparation of the test water mixes will be completed in
approximately two weeks of the time that representative Dunka stockpile leachate water can be
effectively collected. After preparation of the test water, the testing work outlined in this Protocol
will be completed in approximately two weeks for each waste stream. The laboratory analysis will
be completed in approximately two to three weeks from the date of delivery to the laboratory. The
draft treatability testing report will be prepared within two weeks of receipt of the analytical data
from the laboratory.
The data evaluation and the treatability testing results will be presented in the RS45 Wastewater
Treatability Testing Report.

RS29T C, C1-8
Table 1
Preliminary Wastewater Modeling Results, Water Quality Criteria, and Dunka Stockpile Leach Water (all units in mg/L, except where noted)
Water Source Non-Reactive
Stockpile Reactive Stockpile
Data Source
Potential Water Quality
Criteria Scale-Up from Humidity Cells
Run-off from Dunka Piles
pH (su) 6.5-8.5 7.0 6.3-8.4 Chloride 100 22 Sulfate 250 119 150-2000 Aluminium 0.125 8 Antimony 0.031 0.5 Arsenic 0.053 0.1 Cadmium 0.0042 0.0019 Calcium 185 300-350 Chromium 0.152 0.013 Cobalt 0.005 0.005 0.02-0.4 Copper 0.017 0.087 0.04-1.0 Iron 0.3 0.82 0.05-0.7 Lead 0.0077 0.0029 Magnesium 44 200-450 Manganese 0.05 0.048 Mercury 0.0000013 0.001 Nickel 0.094 0.017 0.2-11.0 Potassium 37 Selenium 0.005 0.009454 Sodium 296 Thallium 0.00056 0.00095 Zinc 0.216 0.13 0.06-1.6

RS29T C, C1-9
Table 2
Proposed Target Concentration for Waste Rock and Lean Ore Treatability Testing Waters
Proposed Target Range for Non-Reactive Waste Rock Test
Water Proposed Target Range for Lean
Ore Test Water Parameter pH (pH units) 6.5-7.5 7.0-8.0 Chloride 10-30 20-150 Sulfate 50-300 200-2000 Aluminium 2-8 4-80 Antimony 0.01-0.5 0.05-1.0 Arsenic 0.001-0.1 0.01-1.0 Cadmium 0.0002-0.002 0.002-0.020 Calcium 20-200 200-400 Chromium 0.002-0.02 0.02-0.20 Cobalt 0.001-0.01 0.01-0.4 Copper 0.01-0.1 0.1-1.0 Iron 0.5-1.0 0.5-2.0 Lead 0.001-0.003 0.003-0.03 Magnesium 10-100 100-500 Manganese 0.02-0.1 0.1-0.5 Mercury 0.000001-0.00001 0.00001-0.0001 Nickel 0.02-1.0 1.0-10.0 Potassium 10-50 50-200 Selenium 0.001-0.01 0.01-0.10 Sodium 50-300 100-500 Thallium 0.0005-0.001 0.001-0.010 Zinc 0.10-0.30 0.2-2.0
Note: Units are in mg/L unless noted otherwise.

RS29T C, C1-10
Table 3
Analytical Parameters, Methods Reporting Limits and Method Detection Limits
Parameter Method
RL (μg/L except where noted)
MDL (μg/L except where noted)
List 1 Metals Copper EPA 200.8 0.1 0.03 Mercury EPA 1631 1 ng/L 0.06 ng/L Nickel EPA 200.8 0.2 0.06 Zinc EPA 200.8 0.5 0.3 List 2
Metals Aluminum EPA 200.8 2 0.7 Iron EPA 6010B 20 20 Magnesium EPA 6010B 20 9 Manganese EPA 200.8 0.05 0.02 Arsenic EPA 200.8 0.5 0.2 Cadmium EPA 200.8 0.02 0.02 Chromium EPA 200.8 0.2 0.06 Lead EPA 200.8 0.02 0.009 Cobalt EPA 200.8 0.02 0.01 Antimony EPA 200.8 0.05 0.02 Selenium EPA 200.8 1 0.2 Silver EPA 200.8 0.02 0.009 Thallium EPA 200.8 0.02 0.004 General Parameters Sulfate EPA 300.0 200 90 Calcium EPA 6010B 50 20 Potassium EPA 6010B 2000 700 Sodium EPA 6010B 100 60 pH EPA 150.1 NA NA Alkalinity SM 2320B 2 mg/L 1 mg/L Bicarbonate SM 2320B 2 mg/L 1 mg/L Carbonate SM 2320B 2 mg/L 1 mg/L Chemical Oxygen Demand EPA 410.2 5 mg/L 2 mg/L Total Organic Carbon EPA 415.1 500 100 Total Suspended Solids EPA 160.2 5 mg/L NA Total Kjeldahl Nitrogen EPA 351.4 100 4 Ammonia EPA 350.1/350.3 50/200 20/20 Sulfide EPA 376.1 2 mg/L 300 Sulfite EPA 377.1/9030 2/0.1 mg/L 0.4/0.05 mg/L Hydroxide SM 2320B 2 mg/L 1 mg/L Chloride EPA 300.0 200 30 Total Sulfur EPA 300.0M 70
RL Reporting Limit MDL Method Detection Limit

RS29T C, C1-11
Table 4
Laboratory Sample Containers, Preservation and Holding Times
Parameter/Media Container Preservative Holding Time Environmental Samples Metals (except Hg water) 500ml Plastic HNO3, Cool 4 ºC 180 days
Mercury -water 250ml Plastic Cool 4 ºC 48 hours to preserve in the lab
COD/TOC 500ml Plastic H2SO4 pH <2, Cool 4 ºC 28 days
TSS 1 Liter Plastic Cool 4 ºC 7 days
Chloride 250ml Plastic Cool 4 ºC 28 days
Total Sulfur 500ml Plastic Cool 4 ºC 28 days
Alkalinity (Bicarbonate/ Carbonate/Hydroxide)
500ml Plastic Cool 4 ºC 14 days
Sulfate 250ml Plastic Cool 4 ºC 28 days
Sulfide 1 Liter Glass NaOH, Cool 4 ºC 7 days
pH 100ml Plastic Cool 4 ºC Immediate
Sulfite 125ml Plastic Cool 4 ºC Immediate
TKN 1 Liter Plastic H2SO4 pH <2, Cool 4 ºC 28 days
Ammonia 1 Liter Plastic H2SO4 pH <2, Cool 4 ºC 28 days
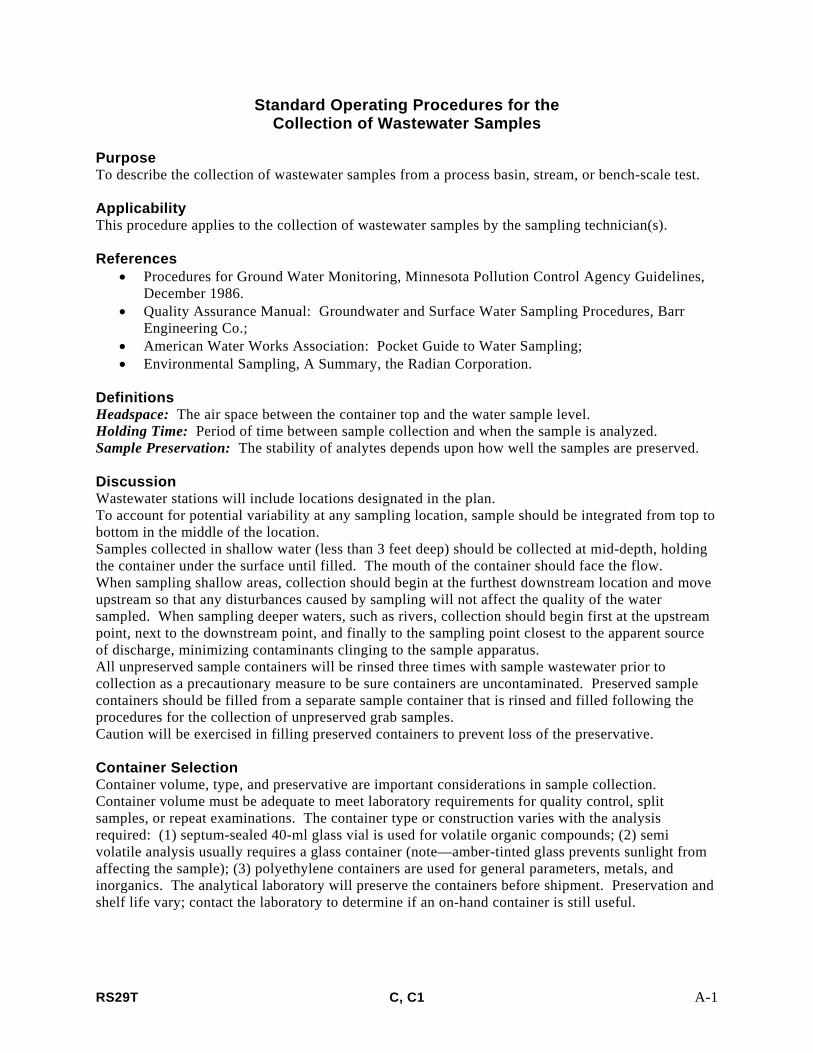
RS29T C, C1 A-1
Standard Operating Procedures for the Collection of Wastewater Samples
Purpose To describe the collection of wastewater samples from a process basin, stream, or bench-scale test. Applicability This procedure applies to the collection of wastewater samples by the sampling technician(s). References
• Procedures for Ground Water Monitoring, Minnesota Pollution Control Agency Guidelines, December 1986.
• Quality Assurance Manual: Groundwater and Surface Water Sampling Procedures, Barr Engineering Co.;
• American Water Works Association: Pocket Guide to Water Sampling; • Environmental Sampling, A Summary, the Radian Corporation.
Definitions Headspace: The air space between the container top and the water sample level. Holding Time: Period of time between sample collection and when the sample is analyzed. Sample Preservation: The stability of analytes depends upon how well the samples are preserved. Discussion Wastewater stations will include locations designated in the plan. To account for potential variability at any sampling location, sample should be integrated from top to bottom in the middle of the location. Samples collected in shallow water (less than 3 feet deep) should be collected at mid-depth, holding the container under the surface until filled. The mouth of the container should face the flow. When sampling shallow areas, collection should begin at the furthest downstream location and move upstream so that any disturbances caused by sampling will not affect the quality of the water sampled. When sampling deeper waters, such as rivers, collection should begin first at the upstream point, next to the downstream point, and finally to the sampling point closest to the apparent source of discharge, minimizing contaminants clinging to the sample apparatus. All unpreserved sample containers will be rinsed three times with sample wastewater prior to collection as a precautionary measure to be sure containers are uncontaminated. Preserved sample containers should be filled from a separate sample container that is rinsed and filled following the procedures for the collection of unpreserved grab samples. Caution will be exercised in filling preserved containers to prevent loss of the preservative. Container Selection Container volume, type, and preservative are important considerations in sample collection. Container volume must be adequate to meet laboratory requirements for quality control, split samples, or repeat examinations. The container type or construction varies with the analysis required: (1) septum-sealed 40-ml glass vial is used for volatile organic compounds; (2) semi volatile analysis usually requires a glass container (note—amber-tinted glass prevents sunlight from affecting the sample); (3) polyethylene containers are used for general parameters, metals, and inorganics. The analytical laboratory will preserve the containers before shipment. Preservation and shelf life vary; contact the laboratory to determine if an on-hand container is still useful.

RS29T C, C1 A-2
Responsibilities The Field Operations/QA Officer or the environmental technician(s) will order the sample containers prior to the sampling event. The environmental technician(s) is also responsible for proper collection of samples, sample identification, quality control procedures, sample filtering, and documentation. Procedure Wastewater Sampling 1. Approximately one week before the sampling event, the sample containers should be ordered
from the laboratory. 2. Before leaving for the site, account for all the containers. 3. Prepare sampling containers by filling out the label with the following information:
• Project number • Location identification • Individual collecting the samples • Date and time of collection • Sample analysis (if required by the lab) Note: Use an indelible permanent pen to avoid ink bleeding (Pilot permanent SC-UF).
4. Put on sampling gloves to protect the sample and skin. Note: New sampling gloves should be used for each location.
5. Remove cap from the first sample container. 6. Fill sampling container (do not overfill). 7. Continue the process until all sampling containers are filled. Samples should be collected and
containerized in order of the parameters’ sensitivity to volatilization and using the specific procedures required for each sample type as summarized below: a. Volatile organic compounds—Use caution because concentrated acid may be present. Do not
rinse glass vials. Hold bottle in one hand, the cap right side up in the other. Pour slowly, avoiding air bubbles and overfilling the vial. Cap tightly, invert the bottle, and tap gently. If any air bubbles appear in the vial, discard and collect sample in a new vial. After collecting the required number of vials, insert them in a zip-lock plastic bag and place in a cooler with ice.
b. Semivolatile organic compounds—Fill container slowly with a minimum headspace and cap tightly. Do not rinse glass containers. Place container directly in a cooler with ice.
c. Filtered Metals—Select the appropriate Corning filter size, either 250-ml or 500-ml volume (see Standard Operating Procedures for filtering groundwater samples). Pour filtered sample into metals sample container, minimizing headspace and avoiding spillage. Use caution handling metals containers because of nitric acid. Place directly in a cooler with ice.
d. Other Organics—Containers may contain acid, use caution when handling. Fill containers appropriately, minimizing headspace and avoiding spillage. Place container directly in a cooler with ice.
e. General Chemistry—Containers may or may not contain acid, use caution when handling. For general chemistry parameters collected in unpreserved containers, rinse the container three times with the sample water prior to final sample collection to ensure containers are uncontaminated.
8. After all of the samples are collected, place the sample containers in the sampling cooler with ice.
Documentation The technician(s) will document the wastewater sampling event, including the type and number of bottles, on the field log data sheet, field log cover sheet, and field log data reports, and chain-of-custody record. The analysis for each bottle and the laboratory used will be documented on the

RS29T C, C1 A-3
chain-of-custody record. The sampling request form will document which sampling containers are used for which wells.

RS29T C, C1 A-4
Standard Operating Procedures for Documentation on a Chain-of-Custody
Purpose To describe how a Chain-of-Custody should be documented properly. Applicability These procedures apply any time a Chain-of-Custody is required. Definitions Chain-of-Custody: This document shows traceable possession of samples from the time they are obtained until they are introduced as evidence in legal proceedings. References Groundwater sampling guidelines and groundwater and surface water sampling procedures by Barr Engineering Company. Discussion The Chain-of-Custody is the most important sampling document; it must be filled out accurately and completely every time. Responsibilities The environmental technician(s)/sampling technician(s) are responsible for accurate and complete documentation on the Chain-of-Custody. Procedure Writing a Chain-of-Custody 1. The Chain-of-Custody should be completed prior to leaving the sampling location. 2. Complete one Chain-of-Custody or more as needed for each cooler of samples. 3. The Chain-of-Custody form must be completed with the following information:
a. Project number b. Sample identification c. Date and time of sample collection d. Container type and number e. Whether the sample is a grab, composite, or blank sample f. Project manager g. Project contract h. Laboratory i. Analysis required j. Signature of sampler(s) k. Signature of transferee l. Date and time of transfer m. Method of transport and any shipping numbers
4. The Chain-of-Custody should always accompany the cooler of samples. a. Distribution of the Chain-of-Custody pages: pages one (white) and two (yellow) go to the
laboratory, page three (pink) goes to the lab coordinator, and the fourth page (gold) is the field copy.
Documentation The Chain-of-Custody form is the documented proof of possession of samples collected. This is documented by samplers collecting the samples and the laboratory receiving the samples.

RS29T C, C1 A-5
Standard Operating Procedures for Transporting Samples to the Laboratory
Purpose To describe the procedures necessary for personal delivery or shipment of samples to analytical laboratories. Applicability This procedure applies to the transportation of ground and surface water samples to the appropriate laboratory. Definitions Environmental Samples. Water samples not regulated by the U.S. Department of Transportation. Hazardous Material. Regulations for packing, marking, labeling, and shipping of hazardous materials are governed by the U.S. DOT. References
• Quality Assurance Manual: Groundwater and Surface Water Sampling Procedures, Barr Engineering Co.;
• Procedures for Ground Water Monitoring: MPCA Guidelines, January 1983. Discussion Maintaining proper sample temperatures (4°C) and delivering samples to the laboratory within 24 to 48 hours are primary concerns. Responsibilities The environmental technician(s) shall ensure the security, temperature, and packaging of water samples during shipment. Procedure Packaging of Groundwater Samples. Place samples in an ice cooler, carefully pack glass containers to avoid breakage. (Note: Bubble-wrap is the preferred packing material.) Add enough ice secured in double-bagged ziplock baggies, to maintain a constant temperature at 4°C until the samples arrive at the laboratory. Complete the chain-of-custody, signing relinquished by and date, and include required copies with the samples (see Standard Operating Procedure for chain-of-custody record). Personal Delivery. The samples are delivered to the laboratory by the sampling technician(s). The chain-of-custody record is signed and dated by the laboratory representative. Local Courier. The same procedures are followed as above; i.e., the chain-of-custody record is signed and dated and the top two copies are sent with the samples. The ice cooler is then secured with strapping tape and a courier form is filled out for the designated laboratory. The cooler is then left in the services area for pickup. Overnight Courier. Follow the procedures above, replacing the courier form with the Federal Express form. Date, project number, type of delivery desired, weight, and number of coolers should be included. Be sure the cooler will not leak. Federal Express will not ship a leaking container. Account for all samples before shipping and compare to the chain of custody (see Standard Operating Procedure for chain-of-custody record). QA/QC Ship samples during times when the laboratory will be able to accept and quickly analyze them. Avoid sending samples during holidays and weekends.

RS29T C, C1 A-6
Record Copies of the chain-of-custody, Federal Express forms, and sample analysis are copied and included in site files and reports. This is all documented by the sampling technician(s).

Attachment C2
Wastewater Treatability Study Report
RS45 ATTACHMENT C2: WASTEWATER TREATABILITY STUDY REPORT
MINE SITE PROCESS WATER NORTHMET PROJECT
Prepared By:
6927 Antrim Avenue Burnaby, BC, V5J 4M5
March 2007

TABLE OF CONTENTS
1.0 OBJECTIVE............................................................................................................1 1.1 The HDS Process............................................................................................................... 1 1.2 Advantages of the HDS Process........................................................................................ 2
2.0 EXPERIMENTAL APPROACH...............................................................................4 2.1 Testing Program ................................................................................................................. 4
3.0 RESULTS & DISCUSSION.....................................................................................6 3.1 Feed Sample ...................................................................................................................... 6 3.2 Neutralization Test.............................................................................................................. 7 3.2.1 Reagent Requirements .............................................................................................. 8 3.2.2 Sludge Generation ..................................................................................................... 8
3.3 Altering Mixing and Settling Time....................................................................................... 8 3.4 HDS Simulation ................................................................................................................ 11
4.0 CONCLUSIONS & RECOMMENDATIONS..........................................................13

LIST OF TABLES
Table 1. Feed Characterization ....................................................................................................... 6 Table 2. Feed Chemistry ................................................................................................................. 6 Table 3. Neutralization Results........................................................................................................ 7 Table 4. Lime Requirement ............................................................................................................. 8 Table 5. Impact of retention time on effluent quality........................................................................ 9 Table 6. Settling Data – 30 minute neutralization.......................................................................... 10 Table 7. Settling Data – 60 minute neutralization.......................................................................... 10 Table 8. Settling Data – 90 minute neutralization.......................................................................... 11 Table 9. HDS simulation at pH 10.0 .............................................................................................. 12
LIST OF APPENDICES Appendix A. Neutralization Worksheet
Appendix B. MAXXAM Analysis Report
Appendix C. CAS Analysis Report

Wastewater Treatability Study Report Mine Site Process Water NorthMet Project 1 March 2007
Can a d i a n E n v i r o nmen t a l & M e t a l l u r g i c a l I n c .
1.0 OBJECTIVE
The primary objective of this treatability study was to demonstrate the viability of
chemical precipitation using lime to treat Dunka Seep water. The testing was conducted
to determine the effectiveness of chemical precipitation, in particular the High Density
Sludge (HDS) process, to meet the process water quality targets. Additionally, the
results of this testing will be used to estimate reagent requirements and sludge
generation rates and provide potential design parameters for a pilot scale study.
This report presents the method and results for this wastewater treatability study. The
methods used were based on the Wastewater Treatability Study Protocol (Attachment
C1 to RS45), which was submitted to the DNR for review prior to the initiation of this
testing program.
1.1 The HDS Process
The effective removal of base metals in a chemically stable form in the HDS process is
primarily the result of the formation of co-precipitates with iron on the surfaces of the
recycled sludge particles. The chemical stability of the precipitate is favourably
influenced by a high iron to total metals ratio in the treatment plant feed. Typically, a
sludge recycle loop is used to increase this ratio. However, a simple recycle is
sometimes not sufficient to change metal ratios and, in extreme examples, iron may
have to be added. Otherwise, the storage site for the sludge produced must allow for
the possibility of long-term instability. In all cases, the oxidation of ferrous iron to ferric
iron is the principal oxygen-consuming reaction, and oxygen transfer into solution may
well be controlling the reaction and hence the reactor tank sizing.
Design plant throughput is also influenced by the volume of water to be treated. For
example, seasonal changes will determine variations in run-off, much of which may have
to be treated. Increased flow may be accompanied by a dilution of contaminants, both
acid and metal, and the resulting plant influent may require reduced oxidation and/or
residence time, thus compensating for the increased flow.
The near-complete precipitation of the metals as hydroxides in the neutralization process
proceeds according to the following reactions:

Wastewater Treatability Study Report Mine Site Process Water NorthMet Project 2 March 2007
Can a d i a n E n v i r o nmen t a l & M e t a l l u r g i c a l I n c .
M++ + SO4= + Ca+++ 2(OH)- + 2H2O → M(OH)2 +CaSO4•2H2O
2M+++ + 3(SO4)= + 3Ca+++ 6(OH)- + 6H2O → 2M(OH)3 + 3CaSO4•2H2O
As implied by the equations above, the products of these reactions are metal hydroxide
precipitates and calcium sulfate (gypsum). If the sulfate concentration of the wastewater
is high enough, there will be sufficient gypsum produced to exceed its solubility and it will
precipitate with the sludge.
The main features of the HDS process can be summarized as follows: Lime [Ca(OH)2]
and recycled sludge are added to the lime-sludge mix tank at the head of the process,
providing the main neutralization agent. This mixture is discharged to the rapid mix tank
where it is mixed with influent, thereby achieving neutralization. This mixture is fed to
the main lime reactor where a combination of aggressive aeration and high shear
agitation ensures optimum process chemistry and subsequent clarifier performance.
The discharge from the lime reactor is treated with flocculant in the flocculation tank. In
the final step, the clarifier separates the treated effluent from the sludge, a portion of
which is recycled to the head of the process.
The HDS process is normally operated at a pH between 9.0 and 9.5, as most metals
encountered will precipitate at or below this concentration of hydroxide ions. Oxidation
of ferrous to ferric iron takes place rapidly at this pH, with air being the most common
oxidizing agent.
For efficiency, the process relies on sludge recycle from the treated effluent. In most
plants this is achieved in a thickener-style clarifier, which provides pumpable sludge in
the underflow as the separated solids product. Recycling sludge from a settling pond or
from filters are alternatives but they may present handling problems.
1.2 Advantages of the HDS Process
The HDS process has many advantages over other lime precipitation systems. The
most important of these is a substantial reduction in sludge volume resulting from an
increase in sludge density. An increase from 5 percent solids to 40 percent solids is
typical of HDS systems; this reduces the volume of sludge produced by over 95 percent.
The resulting reduction in sludge disposal costs increases the cost effectiveness of the

Wastewater Treatability Study Report Mine Site Process Water NorthMet Project 3 March 2007
Can a d i a n E n v i r o nmen t a l & M e t a l l u r g i c a l I n c .
process. In addition to reduced sludge volume and superior sludge density, there is an
increase in sludge stability, both chemically and physically. Within a few days of
deposition, the sludge can drain to in excess of 65 percent solids and possesses enough
physical stability to support the heavy equipment on the surface of the impoundment
area. Chemically the sludge has shown excellent stability characteristics at mining sites
in British Columbia, Canada and at numerous other sites. Following twenty-five years of
impoundment at one facility, there has been no contamination of the surrounding
groundwater or any other evidence of metal reversion.
Other advantages of the HDS process include:
• A high quality effluent is produced,
• The process is easily automated,
• HDS is a proven technology, and
• Operating plants consist of standard equipment available from many competitive
manufacturers, which reduces the need for large spare parts inventories,
• Lower neutralization costs than conventional lime treatment.

Wastewater Treatability Study Report Mine Site Process Water NorthMet Project 4 March 2007
Can a d i a n E n v i r o nmen t a l & M e t a l l u r g i c a l I n c .
2.0 EXPERIMENTAL APPROACH
The testing work described in this report was conduced in accordance with the Work
Plan (RS45 Attachment C1). Two containers (5 gallons each) containing water collected
from Dunka Mine Pit near the NorthMet Mine Site were shipped to CEMI in May 2006 for
bench-scale testing. The feed sample was shaken and 250 mL aliquot was taken for
head analysis. The sample was filtered through a 0.45 micron membrane filter and
analyzed for pH, conductivity, alkalinity and sulfate at CEMI, metal analysis at Maxxam
Analytics located in Vancouver, BC and low-level mercury analysis at CAS in
Washington.
2.1 Testing Program
The testing program consisted of three steps. The first step consists of a preliminary
screening procedure to evaluate lime dosage rates. Aliquots of 500 mL of the feed water
were added to five 1-liter beakers. Lime was added in different dosages to yield a final
pH range from 8.0 to 10.0 (in 0.5 pH increments). Rapid mixing was used and pH was
maintained at the desired level with addition of lime. After 60 minutes of high agitation
allowing time for oxidation, flocculant was added and solution was allowed to settle for
60 minutes. During the settling period, samples were collected for total metal analysis
after 15 minutes, 30 minutes and 60 minutes of settling. At the conclusion of the settling
period, the solution was filtered, filter cake was dried and weighed to determine solids
generation and the filtrate was sent to Maxxam Analytics in Vancouver, Canada for
dissolved metal analysis and CAS in Washington for low-level mercury analysis.
In the second step of the test program, the lime dosage rate that provided the best
effluent quality in the first step was used and rapid mixing and settling conditions were
altered to determine the affect of longer or shorter reaction and settling times on effluent
water quality. At the completion of the tests, the solution was filtered and submitted for
metal analysis as described in step one.
Once results of the first and second steps were available, a large batch of water was
treated using the best combination of lime dosage rate and mixing scenarios that
provided the best effluent quality with lowest mass of sludge and shortest operating time.

Wastewater Treatability Study Report Mine Site Process Water NorthMet Project 5 March 2007
Can a d i a n E n v i r o nmen t a l & M e t a l l u r g i c a l I n c .
The treatment was carried out in the following manner:
A 1.0 liter sample of the contaminated water was neutralized to the pH selected in the
initial screening tests with lime slurry, followed by flocculant addition, settling, and
decanting the overflow in order to recycle sludge. The required amount of lime was then
added to the settled sludge and the sludge/lime was well mixed followed by another 1.0
liter of the contaminated water being added to this mixture. The slurry was agitated for
reaction time determined in the initial tests. This procedure was repeated 10 times. The
overflow from the final cycle was filtered and submitted for chemical analysis.

Wastewater Treatability Study Report Mine Site Process Water NorthMet Project 6 March 2007
Can a d i a n E n v i r o nmen t a l & M e t a l l u r g i c a l I n c .
3.0 RESULTS & DISCUSSION
3.1 Feed Sample
Table 1, below, summarizes the dissolved metals contained in the feed water.
Table 1. Feed Characterization
Units
Process Water Quality Target
Feed
Aluminum (Al) mg/L 0.125 0.017
Arsenic (As) mg/L 0.010 0.001
Boron (B) mg/L 0.5 0.402
Cadmium (Cd) – HD mg/L 0.004 0.002
Chromium (Cr) – HD mg/L 0.100 <0.002
Cobalt (Co) mg/L 0.005 0.0673
Copper (Cu) – HD mg/L 0.030 0.281
Iron (Fe) mg/L 0.3 <0.005
Manganese (Mn) mg/L 0.05 1.68
Nickel (Ni) – HD mg/L 0.100 1.48
Selenium (Se) mg/L 0.005 <0.005
Zinc (Zn) – HD mg/L 0.388 0.52
Mercury (Hg) ug/L 0.0013 <0.05
Low-Level Mercury ug/L 0.0013 0.0031
Notes: Process Water Quality Targets as defined in RS29T HD- Process water quality target for hardness dependent parameters based on 400 mg/L hardness. Bold – Exceeds process water quality target
As indicated in the above table, the primary metals of concern are cobalt, copper,
manganese, nickel, zinc, and mercury.
Table 2, below, summarizes the additional parameters measured at the CEMI facilities.
Table 2. Feed Chemistry
Parameter pH Conductivity us/cm
Acidity @ pH 8.3
Alkalinity mg CaCO3/L
Feed 7.77 3129 9.6 101.6

Wastewater Treatability Study Report Mine Site Process Water NorthMet Project 7 March 2007
Can a d i a n E n v i r o nmen t a l & M e t a l l u r g i c a l I n c .
3.2 Neutralization Test
The feed sample was neutralized to pH 8.0, 8.5, 9.0, 9.5 and 10.0 using hydrated lime
with the lime being added as a 5 percent slurry. For each test, a 500 mL sample was
neutralized to the selected pH while being vigorously agitated. The neutralized sample
was agitated for 60 minutes while maintaining the selected pH by adding additional
reagent when necessary. After 60 minutes, flocculant was added and solution was
allowed to settle for 60 minutes. The samples were then filtered through a 0.45 micron
membrane filter and submitted for analysis. The following table summarizes the results
of the neutralization tests.
Table 3. Neutralization Results
Units
Process Water Quality Target
Feed pH 8.0 pH 8.5 pH 9.0 pH 9.5 pH 10.0
pH 6.5-8.5 7.77 8.03 8.54 9.01 9.61 9.96
Aluminum (Al) mg/L 0.125 0.017 0.011 0.009 0.003 <0.002 <0.002
Arsenic (As) mg/L 0.01 0.001 <0.001 0.003 <0.001 0.001 <0.001
Boron (B) mg/L 0.5 0.402 0.403 0.41 0.397 0.383 0.372
Cadmium (Cd) HD mg/L 0.004 0.002 0.0019 0.0015 0.0002 0.0002 0.0002
Calcium (Ca) mg/L 285 289 304 294 265 279
Chromium (Cr) HD mg/L 0.100 <0.002 <0.002 <0.002 <0.002 <0.002 <0.002
Cobalt (Co) mg/L 0.005 0.0673 0.0675 0.0629 0.0403 0.0022 <0.0002
Copper (Cu) HD mg/L 0.030 0.281 0.21 0.11 0.028 0.009 0.007
Iron (Fe) mg/L 0.3 <0.005 <0.005 <0.005 <0.005 <0.005 <0.005
Magnesium (Mg) mg/L 360 361 366 357 353 356
Manganese (Mn) mg/L 0.05 1.68 1.66 1.6 0.909 0.104 0.0011
Nickel (Ni) HD mg/L 0.100 1.48 1.51 1.43 1.11 0.244 0.013
Selenium (Se) mg/L 0.005 <0.005 <0.005 <0.005 <0.005 <0.005 0.007
Zinc (Zn) HD mg/L 0.388 0.52 0.456 0.224 0.01 <0.005 <0.005
Mercury (Hg) ug/L 0.0013 <0.05 <0.05 <0.05 <0.05 <0.05 <0.05
Low-Level Mercury ug/L 0.0013 0.0031 0.0079 0.0041 0.0046 0.0054 0.0060
Notes: Process Water Quality Targets as defined in RS29T HD- Process water quality target for hardness dependent parameters based on 400 mg/L hardness. Bold – Exceeds process water quality target
Based on the test data summarized in Table 3 above, it was determined that
neutralization at pH 10.0 would be required to meet the process water quality targets,
specifically for manganese and nickel concentration. At pH 10, the mercury
concentration was still slightly above the process water quality target, and selenium,
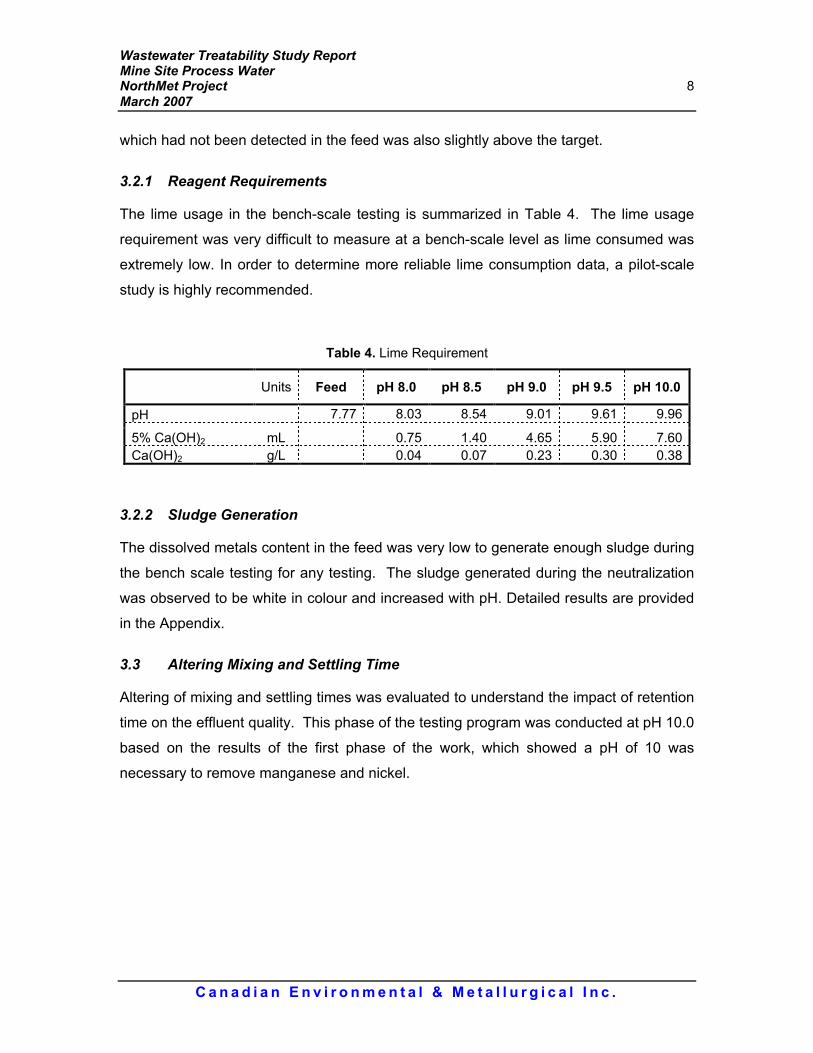
Wastewater Treatability Study Report Mine Site Process Water NorthMet Project 8 March 2007
Can a d i a n E n v i r o nmen t a l & M e t a l l u r g i c a l I n c .
which had not been detected in the feed was also slightly above the target.
3.2.1 Reagent Requirements
The lime usage in the bench-scale testing is summarized in Table 4. The lime usage
requirement was very difficult to measure at a bench-scale level as lime consumed was
extremely low. In order to determine more reliable lime consumption data, a pilot-scale
study is highly recommended.
Table 4. Lime Requirement
Units Feed pH 8.0 pH 8.5 pH 9.0 pH 9.5 pH 10.0
pH 7.77 8.03 8.54 9.01 9.61 9.96
5% Ca(OH)2 mL 0.75 1.40 4.65 5.90 7.60
Ca(OH)2 g/L 0.04 0.07 0.23 0.30 0.38
3.2.2 Sludge Generation
The dissolved metals content in the feed was very low to generate enough sludge during
the bench scale testing for any testing. The sludge generated during the neutralization
was observed to be white in colour and increased with pH. Detailed results are provided
in the Appendix.
3.3 Altering Mixing and Settling Time
Altering of mixing and settling times was evaluated to understand the impact of retention
time on the effluent quality. This phase of the testing program was conducted at pH 10.0
based on the results of the first phase of the work, which showed a pH of 10 was
necessary to remove manganese and nickel.
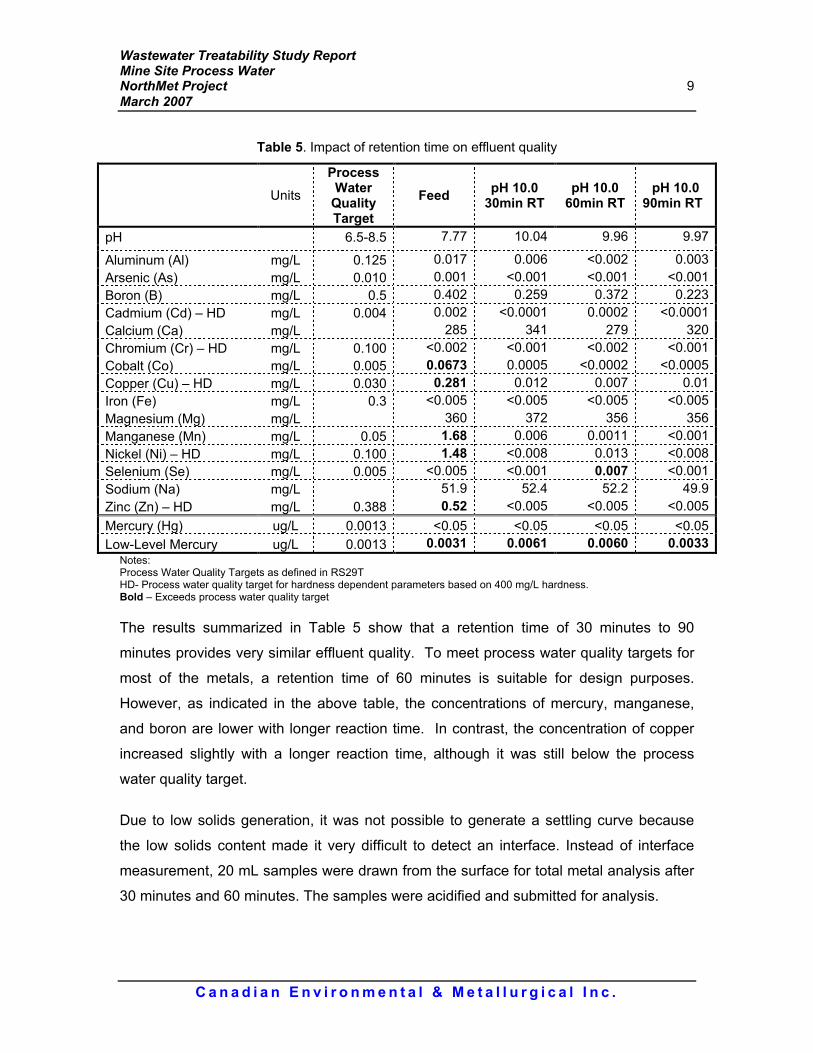
Wastewater Treatability Study Report Mine Site Process Water NorthMet Project 9 March 2007
Can a d i a n E n v i r o nmen t a l & M e t a l l u r g i c a l I n c .
Table 5. Impact of retention time on effluent quality
Units
Process Water Quality Target
Feed pH 10.0 30min RT
pH 10.0 60min RT
pH 10.0
90min RT
pH 6.5-8.5 7.77 10.04 9.96 9.97
Aluminum (Al) mg/L 0.125 0.017 0.006 <0.002 0.003
Arsenic (As) mg/L 0.010 0.001 <0.001 <0.001 <0.001
Boron (B) mg/L 0.5 0.402 0.259 0.372 0.223
Cadmium (Cd) – HD mg/L 0.004 0.002 <0.0001 0.0002 <0.0001
Calcium (Ca) mg/L 285 341 279 320
Chromium (Cr) – HD mg/L 0.100 <0.002 <0.001 <0.002 <0.001
Cobalt (Co) mg/L 0.005 0.0673 0.0005 <0.0002 <0.0005
Copper (Cu) – HD mg/L 0.030 0.281 0.012 0.007 0.01
Iron (Fe) mg/L 0.3 <0.005 <0.005 <0.005 <0.005
Magnesium (Mg) mg/L 360 372 356 356
Manganese (Mn) mg/L 0.05 1.68 0.006 0.0011 <0.001
Nickel (Ni) – HD mg/L 0.100 1.48 <0.008 0.013 <0.008
Selenium (Se) mg/L 0.005 <0.005 <0.001 0.007 <0.001
Sodium (Na) mg/L 51.9 52.4 52.2 49.9
Zinc (Zn) – HD mg/L 0.388 0.52 <0.005 <0.005 <0.005
Mercury (Hg) ug/L 0.0013 <0.05 <0.05 <0.05 <0.05
Low-Level Mercury ug/L 0.0013 0.0031 0.0061 0.0060 0.0033
Notes: Process Water Quality Targets as defined in RS29T HD- Process water quality target for hardness dependent parameters based on 400 mg/L hardness. Bold – Exceeds process water quality target
The results summarized in Table 5 show that a retention time of 30 minutes to 90
minutes provides very similar effluent quality. To meet process water quality targets for
most of the metals, a retention time of 60 minutes is suitable for design purposes.
However, as indicated in the above table, the concentrations of mercury, manganese,
and boron are lower with longer reaction time. In contrast, the concentration of copper
increased slightly with a longer reaction time, although it was still below the process
water quality target.
Due to low solids generation, it was not possible to generate a settling curve because
the low solids content made it very difficult to detect an interface. Instead of interface
measurement, 20 mL samples were drawn from the surface for total metal analysis after
30 minutes and 60 minutes. The samples were acidified and submitted for analysis.

Wastewater Treatability Study Report Mine Site Process Water NorthMet Project 10 March 2007
Can a d i a n E n v i r o nmen t a l & M e t a l l u r g i c a l I n c .
Table 6. Settling Data – 30 minute neutralization
Total Metals Units
Process Water Quality Target
Feed pH 10.0 30min RT 30min Set
pH 10.0 30min RT 60min Set
Aluminum (Al) mg/L 0.125 0.017 0.036 0.02
Arsenic (As) mg/L 0.010 0.001 <0.001 <0.001
Boron (B) mg/L 0.5 0.402 0.285 0.254
Cadmium (Cd) - HD mg/L 0.004 0.002 0.0005 0.0003
Calcium (Ca) mg/L 285 326 308
Chromium (Cr) - HD mg/L 0.100 <0.002 <0.001 <0.001
Cobalt (Co) mg/L 0.005 0.0673 0.0205 0.012
Copper (Cu) - HD mg/L 0.030 0.281 0.0962 0.0594
Iron (Fe) mg/L 0.3 <0.005 0.007 <0.005
Magnesium (Mg) mg/L 360 341 328
Manganese (Mn) mg/L 0.05 1.68 0.422 0.235
Nickel (Ni) - HD mg/L 0.100 1.48 0.372 0.215
Selenium (Se) mg/L 0.005 <0.005 <0.001 0.002
Sodium (Na) mg/L 51.9 52.1 50.4
Zinc (Zn) - HD mg/L 0.388 0.52 0.142 0.077 Notes: Process Water Quality Targets as defined in RS29T HD- Process water quality target for hardness dependent parameters based on 400 mg/L hardness. Bold – Exceeds process water quality target
Table 7. Settling Data – 60 minute neutralization
Total Metals Units
Process Water Quality Target
Feed
pH 10.0 60min RT 30min Set
pH 10.0 60min RT 60min Set
Aluminum (Al) mg/L 0.125 0.017 0.048 0.023
Arsenic (As) mg/L 0.01 0.001 <0.001 <0.001
Boron (B) mg/L 0.5 0.402 0.308 0.37
Cadmium (Cd) - HD mg/L 0.004 0.002 0.0003 0.0001
Calcium (Ca) mg/L 285 251 290
Chromium (Cr) - HD mg/L 0.100 <0.002 <0.001 <0.001
Cobalt (Co) mg/L 0.005 0.0673 0.0117 0.0052
Copper (Cu) - HD mg/L 0.030 0.281 0.0684 0.036
Iron (Fe) mg/L 0.3 <0.005 0.015 0.01
Magnesium (Mg) mg/L 360 293 352
Manganese (Mn) mg/L 0.05 1.68 0.183 0.097
Nickel (Ni) - HD mg/L 0.100 1.48 0.175 0.098
Selenium (Se) mg/L 0.005 <0.005 0.006 0.007
Sodium (Na) mg/L 51.9 43.4 52.1
Zinc (Zn) - HD mg/L 0.388 0.52 0.065 0.03
Notes: Process Water Quality Targets as defined in RS29T HD- Process Water quality target for hardness dependent parameters based on 400 mg/L hardness. Bold – Exceeds process water quality target

Wastewater Treatability Study Report Mine Site Process Water NorthMet Project 11 March 2007
Can a d i a n E n v i r o nmen t a l & M e t a l l u r g i c a l I n c .
Table 8. Settling Data – 90 minute neutralization
Total Metals Units
Process Water Quality Target
Feed
pH 10.0 90min RT 30min Set
pH 10.0 90min RT 60min Set
Aluminum (Al) mg/L 0.125 0.017 0.041 0.024
Arsenic (As) mg/L 0.01 0.001 <0.001 <0.001
Boron (B) mg/L 0.5 0.402 0.289 0.275
Cadmium (Cd) - HD mg/L 0.004 0.002 0.0008 0.0005
Calcium (Ca) mg/L 285 324 327
Chromium (Cr) - HD mg/L 0.100 <0.002 0.002 0.002
Cobalt (Co) mg/L 0.005 0.0673 0.0332 0.0223
Copper (Cu) - HD mg/L 0.030 0.281 0.137 0.0952
Iron (Fe) mg/L 0.3 <0.005 0.01 <0.005
Magnesium (Mg) mg/L 360 337 350
Manganese (Mn) mg/L 0.05 1.68 0.697 0.468
Nickel (Ni) - HD mg/L 0.100 1.48 0.614 0.418
Selenium (Se) mg/L 0.005 <0.005 0.002 0.001
Sodium (Na) mg/L 51.9 51 53.5
Zinc (Zn) - HD mg/L 0.388 0.52 0.231 0.155
Notes: Process Water Quality Targets as defined in RS29T HD- Process water quality target for hardness dependent parameters based on 400 mg/L hardness. Bold – Exceeds process water quality target
The results summarized in the above Tables 6 through 8 show that settling may be a
concern for full-scale operation if sufficient solids are note generated to form a floc, as
was the case in this testing. The reported concentrations of several metals above the
process water quality target suggests that the methods used at the laboratory scale for
this experiment did not provide adequate time to separate the solids from the water.
3.4 HDS Simulation
From previous testing results, it was decided to conduct the HDS simulation with 60
minute retention time at pH 10.0 and using 1-liter feed sample.
The following table provides the results of the bench scale HDS simulations at the pH
10.0. The individual neutralization tests and the HDS simulations only provide an
indication of effluent quality that can be achieved with a proper HDS process where the
recycle solids significantly improves precipitation kinetics through catalysed reactions.

Wastewater Treatability Study Report Mine Site Process Water NorthMet Project 12 March 2007
Can a d i a n E n v i r o nmen t a l & M e t a l l u r g i c a l I n c .
Table 9. HDS simulation at pH 10.0
Units
Process Water Quality Target
Feed pH 10.0 60min RT 10
th Cycle
Aluminum (Al) mg/L 0.125 0.017 0.003
Arsenic (As) mg/L 0.010 0.001 0.0007
Boron (B) mg/L 0.5 0.402 0.366
Cadmium (Cd) - HD mg/L 0.004 0.002 0.00004
Calcium (Ca) mg/L 285 311
Chromium (Cr) - HD mg/L 0.100 <0.002 <0.0002
Cobalt (Co) mg/L 0.005 0.0673 <0.00002
Copper (Cu) - HD mg/L 0.030 0.281 0.0064
Iron (Fe) mg/L 0.3 <0.005 <0.005
Magnesium (Mg) mg/L 360 373
Manganese (Mn) mg/L 0.05 1.68 0.00096
Nickel (Ni) - HD mg/L 0.100 1.48 0.0076
Selenium (Se) mg/L 0.005 <0.005 0.0022
Sodium (Na) mg/L 51.9 54.4
Zinc (Zn) - HD mg/L 0.388 0.52 0.0017
Low-Level Hg ug/L 0.0013 0.0031 0.0034
Notes: Process Water Quality Targets as defined in RS29T HD- Process water quality target for hardness dependent parameters based on 400 mg/L hardness. Bold – Exceeds process water quality target
The results summarized in Table 9 show that, with the exception of mercury, the HDS
simulation achieved effluent concentrations that were well below all the process water
quality targets for metals. A comparison of these results to the previous tables suggests
that the metal removal efficiency for all metals, with the exception of mercury, was
improved with the use of sludge recycle.
Wastewater Treatability Study Report Mine Site Process Water NorthMet Project 13 March 2007
Can a d i a n E n v i r o nmen t a l & M e t a l l u r g i c a l I n c .
4.0 CONCLUSIONS & RECOMMENDATIONS
This study was a preliminary bench-scale investigation of potential water treatment
needs for the NorthMet Project. Wastewater from the Dunka Seep (near the proposed
project site) was treated using conventional chemical precipitation (lime neutralization)
treatment. The results presented in this report are representative of the samples
received at the Canadian Environmental and Metallurgical Inc. laboratory in Vancouver,
BC.
Based on the test data presented in this report, the following conclusions can be made:
• Metals of concern can be removed using chemical precipitation with lime,
specifically High Density Sludge (HDS) process.
• Neutralization at pH 10.0 with 60 minute retention time is required to meet the
discharge criteria.
• Effluent quality improved with recycle of solids.
Based on the results of the testwork, following are some of the recommendations:
• Bench-scale testing with iron salt addition could be conducted to further improve
effluent quality by increasing the iron to total metals ratio.
• If the water chemistry is expected to be significantly different, then it is
recommended to conduct bench-scale testwork with different feed water.
• An on-site pilot-scale study program would aid in the determination of important
parameters for design (reagent consumption and effluent quality).
Wastewater Treatability Study Report Mine Site Process Water NorthMet Project March 2007
C a n a d i a n E n v i r o n m e n t a l & M e t a l l u r g i c a l I n c .
APPENDIX A: Neutralization Process Worksheet

| + 3
Neutralization Testinq Workbook
Project
Project No.
Date lla.v 1 . 2oo60 6 t o
Test lD
Volume
Init ial pH
% Lime
Lime Vol.
lTarget pHIlF inal pH
looo rylL
1 ' z t
W S za . 1 5
E ' o
MAxXAfl
i - lo a.AAeA-
Cn er. A q.e\-ttino. r nl Sau s\e-
lrz'r(p,, a*er C *^ . 3onc^-- ,/t^A AD- "^ivt-
looo nL1 ' 3q
. q n
4.a>
1 .oFinal pH
Sludge Generation
Other Testwork
Analysis
Notes/Comments

2 - t 3
Neutralization Testinq Workbook
Project
Project No.
Date
?oly,"vvo , l o
Test lD
Volume
Init ial pHIQ() rn L
7.36
1 f )-J (A
7.6 0
lo 'o1.1e
Lime Vol.
Target pH
Final pH
Sludge Generation
Other Testwork
Notes/Comments
Test lD
Volume
lnit ial pH
o/" Lime
Lime Vol.
Sludge Generation

3 X 3
Neutral ization Testinq Workbook
Project
Project No.
Date
?ol.. *"k
eG; to
Test lD
Volume
Init ial pH
"/" Lime
Lime Vol.
Target pH
Final pH
Sludge Generation
Other Testwork
Analysis
I @O nrL
1.2G
57"5'1 o
1 . 5
t . a r
l4ArAnL*s
Notes/Comments
. c - - t . P F r n
It f-n all- -.!*rllrt.. lIpa
)
% Lime
Lime Vol.
Target pH
Final pH
Sludge Generation
Other Testwork
Analysis
Notes/Comments

' 1 r
Neutral ization Testinq Workbook
Project
Project No.
Datef f i t o
..\qne- ? , Uo6
Ini t ial pH
% Lime
Lime Vol. 7 . 5 5 a L
,o.ol o ' oqFinal pH
Sludge Generation
Other Testwork
Notes/Comments
Lime Vol.
Target pH
Final pH
Sludge Generation
Other Testwork
Analysis
l0OO n tL
7 . 3 4
5 Z7. 8o ,trt
l o . oq.1-T
Fllxx4n
Notes/Comments
H \O - 9O "ll',t
Wastewater Treatability Study Report Mine Site Process Water NorthMet Project March 2007
C a n a d i a n E n v i r o n m e n t a l & M e t a l l u r g i c a l I n c .
APPENDIX B: MAXXAM Analysis Report

Table 1 Laboratory Report Sample Identification and Corresponding Test Condition
Wastewater Treatability Study Mine Site Process Water
NorthMet Project
Sample ID Test Conditions
25392 Feed (Table 1)
25393 pH 8.0; 60min Retention Time; Dissolved Metals (Table 3)
25396 pH 9.0; 60min Retention Time; Dissolved Metals (Table 3)
25399 pH 10.0; 60min Retention Time; Dissolved Metals (Table 3 and Table 5)
25403 pH 8.5; 60min Retention Time; Dissolved Metals (Table 3)
25406 pH 9.5; 60min Retention Time; Dissolved Metals (Table 3)
25434 pH 10.0; 30min Retention Time; Dissolved Metals (Table 5)
25438 pH 10.0; 90min Retention Time; Dissolved Metals (Table 5)
25435 pH 10.0; 30min Retention Time; Total Metals; 30min Settling (Table 6)
25436 pH 10.0; 30min Retention Time; Total Metals; 60min Settling (Table 6)
25400 pH 10.0; 60min Retention Time; Total Metals; 30min Settling (Table 7)
25401 pH 10.0; 60min Retention Time; Total Metals; 60min Settling (Table 7)
25439 pH 10.0; 90min Retention Time; Total Metals; 30min Settling (Table 8)
25440 pH 10.0; 90min Retention Time; Total Metals; 60min Settling (Table 8)
25424 HDS Simulation; pH 10.0, 10th Cycle

Your P.O. #: 129 Your Project #: 0610 Your C.O.C. #: 08186697
Attention: Rik VosCEMI6927 Antrim Ave.Burnaby, BCCANADA V5J 4M5
Report Date: 2007/03/13This report supersedes all previous reports
CERTIFICATE OF ANALYSIS
MAXXAM JOB #: A623586Received: 2006/06/07, 11:20
Sample Matrix: Water# Samples Received: 1
Date DateAnalyses Quantity Extracted Analyzed Laboratory Method Analytical MethodHardness (calculated as CaCO3) 1 N/A 2006/06/08 Elements by ICP-AES (dissolved) 1 2006/06/07 2006/06/07 BRN SOP-00040 V1.0 Based on EPA 6010B Elements by ICPMS (dissolved) ( 1 ) 1 2006/06/06 2006/06/06 BRN SOP-00042 V1.0 Based on EPA 200.8
* RPDs calculated using raw data. The rounding of final results may result in the apparent difference.
(1) SCC/CAEAL
Encryption Key
Please direct all questions regarding this Certificate of Analysis to your Project Manager.
ELAINE COUSINS, CS ManagerEmail: [email protected]# (604) 444-4808 Ext:276
====================================================================Maxxam has procedures in place to guard against improper use of the electronic signature and have the required "signatories", as per section5.10.2 of ISO/IEC 17025:2005(E), signing the reports. SCC and CAEAL have approved this reporting process and electronic report format.
Total cover pages: 1
Burnaby: 8577 Commerce Court V5A 4N5 Telephone(604) 444-4808 Fax(604) 444-4511
Page 1 of 8

CEMIMaxxam Job #: A623586 Client Project #: 0610Report Date: 2007/03/13 Site Reference:
Your P.O. #: 129Sampler Initials:
RESULTS OF CHEMICAL ANALYSES OF WATER
Maxxam ID B 5 5 1 9 6Sampling DateCOC Number 08186697 Units 25424 RDL QC Batch
Misc. Inorganics
Dissolved Hardness (CaCO3) mg/L 2310 0.5 1158317
RDL = Reportable Detection Limit
Page 2 of 8

CEMIMaxxam Job #: A623586 Client Project #: 0610Report Date: 2007/03/13 Site Reference:
Your P.O. #: 129Sampler Initials:
ELEMENTS BY ATOMIC SPECTROSCOPY (WATER)
Maxxam ID B 5 5 1 9 6Sampling DateCOC Number 08186697 Units 25424 RDL QC Batch
Dissolved Metals by ICP
Dissolved Boron (B) mg/L 0.366 0.008 1157007
Dissolved Calcium (Ca) mg/L 311 0.05 1157007
Dissolved Iron (Fe) mg/L <0.005 0.005 1157007
Dissolved Magnesium (Mg) mg/L 373 0.05 1157007
Dissolved Phosphorus (P) mg/L <0.1 0.1 1157007
Dissolved Silicon (Si) mg/L 4.74 0.05 1157007
Dissolved Sodium (Na) mg/L 54.4 0.05 1157007
Dissolved Sulphur (S) mg/L 766 0.1 1157007
Dissolved Zirconium (Zr) mg/L <0.005 0.005 1157007
Dissolved Metals by ICPMS
Dissolved Aluminum (Al) ug/L 3.0 0.2 1155980
Dissolved Antimony (Sb) ug/L 0.07 0.05 1155980
Dissolved Arsenic (As) ug/L 0.7 0.1 1155980
Dissolved Barium (Ba) ug/L 7.43 0.02 1155980
Dissolved Beryllium (Be) ug/L <0.05 0.05 1155980
Dissolved Bismuth (Bi) ug/L <0.05 0.05 1155980
Dissolved Cadmium (Cd) ug/L 0.04 0.01 1155980
Dissolved Chromium (Cr) ug/L <0.2 0.2 1155980
Dissolved Cobalt (Co) ug/L <0.02 0.02 1155980
Dissolved Copper (Cu) ug/L 6.4 0.1 1155980
Dissolved Lead (Pb) ug/L 0.07 0.02 1155980
Dissolved Lithium (Li) ug/L 41.6 0.2 1155980
Dissolved Manganese (Mn) ug/L 0.96 0.02 1155980
Dissolved Molybdenum (Mo) ug/L 1.04 0.02 1155980
Dissolved Nickel (Ni) ug/L 7.6 0.5 1155980
Dissolved Potassium (K) ug/L 6400 50 1155980
Dissolved Selenium (Se) ug/L 2.2 0.5 1155980
Dissolved Silver (Ag) ug/L <0.01 0.01 1155980
Dissolved Strontium (Sr) ug/L 789 0.01 1155980
Dissolved Thallium (Tl) ug/L 0.05 0.05 1155980
Dissolved Tin (Sn) ug/L <0.05 0.05 1155980
Dissolved Titanium (Ti) ug/L 5.9 0.5 1155980
RDL = Reportable Detection Limit
Page 3 of 8

CEMIMaxxam Job #: A623586 Client Project #: 0610Report Date: 2007/03/13 Site Reference:
Your P.O. #: 129Sampler Initials:
ELEMENTS BY ATOMIC SPECTROSCOPY (WATER)
Maxxam ID B 5 5 1 9 6Sampling DateCOC Number 08186697 Units 25424 RDL QC Batch
Dissolved Uranium (U) ug/L 0.88 0.01 1155980
Dissolved Vanadium (V) ug/L 0.65 0.05 1155980
Dissolved Zinc (Zn) ug/L 1.7 0.5 1155980
RDL = Reportable Detection Limit
Page 4 of 8

CEMIMaxxam Job #: A623586 Client Project #: 0610Report Date: 2007/03/13 Site Reference:
Your P.O. #: 129Sampler Initials:
General Comments
Results relate only to the items tested.
Page 5 of 8

CEMIAttention: Rik Vos Client Project #: 0610P.O. #: 129Site Reference:
Quality Assurance ReportMaxxam Job Number: VA623586
QA/QC DateBatch AnalyzedNum Init QC Type Parameter yyyy/mm/dd Value Recovery Units QC Limits
1155980 AA1 MATRIX SPIKE Dissolved Arsenic (As) 2006/06/06 107 % 75 - 125Dissolved Cadmium (Cd) 2006/06/06 106 % 75 - 125Dissolved Chromium (Cr) 2006/06/06 104 % 75 - 125Dissolved Cobalt (Co) 2006/06/06 103 % 75 - 125Dissolved Copper (Cu) 2006/06/06 106 % 75 - 125Dissolved Lead (Pb) 2006/06/06 103 % 75 - 125Dissolved Selenium (Se) 2006/06/06 111 % 75 - 125Dissolved Thallium (Tl) 2006/06/06 101 % 75 - 125Dissolved Zinc (Zn) 2006/06/06 107 % 75 - 125
SPIKE Dissolved Arsenic (As) 2006/06/06 98 % 75 - 125Dissolved Cadmium (Cd) 2006/06/06 101 % 75 - 125Dissolved Chromium (Cr) 2006/06/06 109 % 75 - 125Dissolved Cobalt (Co) 2006/06/06 107 % 75 - 125Dissolved Copper (Cu) 2006/06/06 104 % 75 - 125Dissolved Lead (Pb) 2006/06/06 105 % 75 - 125Dissolved Selenium (Se) 2006/06/06 95 % 75 - 125Dissolved Thallium (Tl) 2006/06/06 103 % 75 - 125Dissolved Zinc (Zn) 2006/06/06 91 % 75 - 125
BLANK Dissolved Aluminum (Al) 2006/06/06 <0.2 ug/LDissolved Antimony (Sb) 2006/06/06 <0.05 ug/LDissolved Arsenic (As) 2006/06/06 <0.1 ug/LDissolved Barium (Ba) 2006/06/06 <0.02 ug/LDissolved Beryllium (Be) 2006/06/06 <0.05 ug/LDissolved Bismuth (Bi) 2006/06/06 <0.05 ug/LDissolved Cadmium (Cd) 2006/06/06 <0.01 ug/LDissolved Chromium (Cr) 2006/06/06 <0.2 ug/LDissolved Cobalt (Co) 2006/06/06 <0.02 ug/LDissolved Copper (Cu) 2006/06/06 <0.1 ug/LDissolved Lead (Pb) 2006/06/06 <0.02 ug/LDissolved Lithium (Li) 2006/06/06 <0.2 ug/LDissolved Manganese (Mn) 2006/06/06 <0.02 ug/LDissolved Molybdenum (Mo) 2006/06/06 <0.02 ug/LDissolved Nickel (Ni) 2006/06/06 <0.5 ug/LDissolved Potassium (K) 2006/06/06 <50 ug/LDissolved Selenium (Se) 2006/06/06 <0.5 ug/LDissolved Silver (Ag) 2006/06/06 <0.01 ug/LDissolved Strontium (Sr) 2006/06/06 <0.01 ug/LDissolved Thallium (Tl) 2006/06/06 <0.05 ug/LDissolved Tin (Sn) 2006/06/06 <0.05 ug/LDissolved Titanium (Ti) 2006/06/06 <0.5 ug/LDissolved Uranium (U) 2006/06/06 <0.01 ug/LDissolved Vanadium (V) 2006/06/06 <0.05 ug/LDissolved Zinc (Zn) 2006/06/06 <0.5 ug/L
RPD Dissolved Aluminum (Al) 2006/06/06 0.6 % 25Dissolved Antimony (Sb) 2006/06/06 1.5 % 25Dissolved Arsenic (As) 2006/06/06 NC % 25Dissolved Barium (Ba) 2006/06/06 1.9 % 25Dissolved Beryllium (Be) 2006/06/06 NC % 25Dissolved Bismuth (Bi) 2006/06/06 NC % 25Dissolved Cadmium (Cd) 2006/06/06 NC % 25Dissolved Chromium (Cr) 2006/06/06 NC % 25Dissolved Cobalt (Co) 2006/06/06 NC % 25Dissolved Copper (Cu) 2006/06/06 4.1 % 25Dissolved Lead (Pb) 2006/06/06 NC % 25Dissolved Lithium (Li) 2006/06/06 NC % 25
Burnaby: 8577 Commerce Court V5A 4N5 Telephone(604) 444-4808 Fax(604) 444-4511
Page 6 of 8

CEMIAttention: Rik Vos Client Project #: 0610P.O. #: 129Site Reference:
Quality Assurance Report (Continued)Maxxam Job Number: VA623586
QA/QC DateBatch AnalyzedNum Init QC Type Parameter yyyy/mm/dd Value Recovery Units QC Limits
1155980 AA1 RPD Dissolved Manganese (Mn) 2006/06/06 2.0 % 25Dissolved Molybdenum (Mo) 2006/06/06 NC % 25Dissolved Nickel (Ni) 2006/06/06 NC % 25Dissolved Potassium (K) 2006/06/06 NC % 25Dissolved Selenium (Se) 2006/06/06 NC % 25Dissolved Silver (Ag) 2006/06/06 NC % 25Dissolved Strontium (Sr) 2006/06/06 2.9 % 25Dissolved Thallium (Tl) 2006/06/06 NC % 25Dissolved Tin (Sn) 2006/06/06 NC % 25Dissolved Titanium (Ti) 2006/06/06 NC % 25Dissolved Uranium (U) 2006/06/06 NC % 25Dissolved Vanadium (V) 2006/06/06 7.4 % 25Dissolved Zinc (Zn) 2006/06/06 NC % 25
1157007 KL1 BLANK Dissolved Boron (B) 2006/06/07 0.010, RDL=0.008 mg/LDissolved Calcium (Ca) 2006/06/07 <0.05 mg/LDissolved Iron (Fe) 2006/06/07 <0.005 mg/LDissolved Magnesium (Mg) 2006/06/07 <0.05 mg/LDissolved Phosphorus (P) 2006/06/07 <0.1 mg/LDissolved Silicon (Si) 2006/06/07 <0.05 mg/LDissolved Sodium (Na) 2006/06/07 <0.05 mg/LDissolved Sulphur (S) 2006/06/07 <0.1 mg/LDissolved Zirconium (Zr) 2006/06/07 <0.005 mg/L
RPD Dissolved Calcium (Ca) 2006/06/07 0.07 % 25Dissolved Magnesium (Mg) 2006/06/07 2.2 % 25
NC = Non-calculableRPD = Relative Percent Difference
Burnaby: 8577 Commerce Court V5A 4N5 Telephone(604) 444-4808 Fax(604) 444-4511
Page 7 of 8

Page 8 of 8

Your P.O. #: 88 Your Project #: 0610 Your C.O.C. #: 08186192
Attention: Rik VosCEMI6927 Antrim Ave.Burnaby, BCCANADA V5J 4M5
Report Date: 2007/03/13This report supersedes all previous reports
CERTIFICATE OF ANALYSIS
MAXXAM JOB #: A619312Received: 2006/05/11, 15:00
Sample Matrix: Water# Samples Received: 2
Date DateAnalyses Quantity Extracted Analyzed Laboratory Method Analytical MethodHardness (calculated as CaCO3) 2 N/A 2006/05/15 Mercury (Dissolved) 2 2006/05/16 2006/05/17 BRN SOP-00044 V1.0 Based on EPA 245.1 Elements by ICP-AES (dissolved) 2 2006/05/15 2006/05/15 BRN SOP-00040 V1.0 Based on EPA 6010B Elements by ICPMS (dissolved) ( 1 ) 2 2006/05/16 2006/05/16 BRN SOP-00042 V1.0 Based on EPA 200.8
* RPDs calculated using raw data. The rounding of final results may result in the apparent difference.
(1) SCC/CAEAL
Encryption Key
Please direct all questions regarding this Certificate of Analysis to your Project Manager.
ELAINE COUSINS, CS ManagerEmail: [email protected]# (604) 444-4808 Ext:276
====================================================================Maxxam has procedures in place to guard against improper use of the electronic signature and have the required "signatories", as per section5.10.2 of ISO/IEC 17025:2005(E), signing the reports. SCC and CAEAL have approved this reporting process and electronic report format.
Total cover pages: 1
Burnaby: 8577 Commerce Court V5A 4N5 Telephone(604) 444-4808 Fax(604) 444-4511
Page 1 of 8

CEMIMaxxam Job #: A619312 Client Project #: 0610Report Date: 2007/03/13 Site Reference:
Your P.O. #: 88Sampler Initials:
RESULTS OF CHEMICAL ANALYSES OF WATER
Maxxam ID B 2 8 8 0 6 B 2 8 8 0 7Sampling DateCOC Number 08186192 08186192 Units 25403 25406 RDL QC Batch
Misc. Inorganics
Dissolved Hardness (CaCO3) mg/L 2260 2120 0.5 1133469
RDL = Reportable Detection Limit
Page 2 of 8

CEMIMaxxam Job #: A619312 Client Project #: 0610Report Date: 2007/03/13 Site Reference:
Your P.O. #: 88Sampler Initials:
ELEMENTS BY ATOMIC SPECTROSCOPY (WATER)
Maxxam ID B 2 8 8 0 6 B 2 8 8 0 7Sampling DateCOC Number 08186192 08186192 Units 25403 25406 RDL QC Batch
Low Level Elements
Dissolved Mercury (Hg) ug/L <0.05 <0.05 0.05 1135004
Dissolved Metals by ICP
Dissolved Boron (B) mg/L 0.410 0.383 0.008 1134064
Dissolved Calcium (Ca) mg/L 304 265 0.05 1134064
Dissolved Iron (Fe) mg/L <0.005 <0.005 0.005 1134064
Dissolved Magnesium (Mg) mg/L 366 353 0.05 1134064
Dissolved Phosphorus (P) mg/L <0.1 <0.1 0.1 1134064
Dissolved Silicon (Si) mg/L 9.35 8.34 0.05 1134064
Dissolved Sodium (Na) mg/L 52.6 51.1 0.05 1134064
Dissolved Sulphur (S) mg/L 770 745 0.1 1134064
Dissolved Zirconium (Zr) mg/L <0.005 <0.005 0.005 1134064
Dissolved Metals by ICPMS
Dissolved Aluminum (Al) ug/L 9 <2 2 1135123
Dissolved Antimony (Sb) ug/L <0.5 <0.5 0.5 1135123
Dissolved Arsenic (As) ug/L 3 1 1 1135123
Dissolved Barium (Ba) ug/L 13.2 5.2 0.2 1135123
Dissolved Beryllium (Be) ug/L <0.5 <0.5 0.5 1135123
Dissolved Bismuth (Bi) ug/L <0.5 <0.5 0.5 1135123
Dissolved Cadmium (Cd) ug/L 1.5 0.2 0.1 1135123
Dissolved Chromium (Cr) ug/L <2 <2 2 1135123
Dissolved Cobalt (Co) ug/L 62.9 2.2 0.2 1135123
Dissolved Copper (Cu) ug/L 110 9 1 1135123
Dissolved Lead (Pb) ug/L 0.6 <0.2 0.2 1135123
Dissolved Lithium (Li) ug/L 40 37 2 1135123
Dissolved Manganese (Mn) ug/L 1600 104 0.2 1135123
Dissolved Molybdenum (Mo) ug/L 1.0 1.2 0.2 1135123
Dissolved Nickel (Ni) ug/L 1430 244 5 1135123
Dissolved Potassium (K) ug/L 7040 7790 500 1135123
Dissolved Selenium (Se) ug/L <5 <5 5 1135123
Dissolved Silver (Ag) ug/L <0.1 <0.1 0.1 1135123
Dissolved Strontium (Sr) ug/L 833 691 0.1 1135123
Dissolved Thallium (Tl) ug/L <0.5 <0.5 0.5 1135123
RDL = Reportable Detection Limit
Page 3 of 8

CEMIMaxxam Job #: A619312 Client Project #: 0610Report Date: 2007/03/13 Site Reference:
Your P.O. #: 88Sampler Initials:
ELEMENTS BY ATOMIC SPECTROSCOPY (WATER)
Maxxam ID B 2 8 8 0 6 B 2 8 8 0 7Sampling DateCOC Number 08186192 08186192 Units 25403 25406 RDL QC Batch
Dissolved Tin (Sn) ug/L <0.5 <0.5 0.5 1135123
Dissolved Titanium (Ti) ug/L <5 <5 5 1135123
Dissolved Uranium (U) ug/L 4.4 1.7 0.1 1135123
Dissolved Vanadium (V) ug/L <0.5 <0.5 0.5 1135123
Dissolved Zinc (Zn) ug/L 224 <5 5 1135123
RDL = Reportable Detection Limit
Page 4 of 8
CEMIMaxxam Job #: A619312 Client Project #: 0610Report Date: 2007/03/13 Site Reference:
Your P.O. #: 88Sampler Initials:
ELEMENTS BY ATOMIC SPECTROSCOPY (WATER) Comments
Sample B28806-01 Elements by ICPMS (dissolved): MDL raised due to sample dilution.
Sample B28807-01 Elements by ICPMS (dissolved): MDL raised due to sample dilution.
Results relate only to the items tested.
Page 5 of 8

CEMIAttention: Rik Vos Client Project #: 0610P.O. #: 88Site Reference:
Quality Assurance ReportMaxxam Job Number: VA619312
QA/QC DateBatch AnalyzedNum Init QC Type Parameter yyyy/mm/dd Value Recovery Units QC Limits
1134064 KL1 BLANK Dissolved Boron (B) 2006/05/15 <0.008 mg/LDissolved Calcium (Ca) 2006/05/15 <0.05 mg/LDissolved Iron (Fe) 2006/05/15 <0.005 mg/LDissolved Magnesium (Mg) 2006/05/15 <0.05 mg/LDissolved Phosphorus (P) 2006/05/15 <0.1 mg/LDissolved Silicon (Si) 2006/05/15 <0.05 mg/LDissolved Sodium (Na) 2006/05/15 <0.05 mg/LDissolved Sulphur (S) 2006/05/15 <0.1 mg/LDissolved Zirconium (Zr) 2006/05/15 <0.005 mg/L
RPD Dissolved Boron (B) 2006/05/15 NC % 25Dissolved Calcium (Ca) 2006/05/15 0.1 % 25Dissolved Iron (Fe) 2006/05/15 NC % 25Dissolved Magnesium (Mg) 2006/05/15 0.3 % 25Dissolved Phosphorus (P) 2006/05/15 NC % 25Dissolved Silicon (Si) 2006/05/15 0.2 % 25Dissolved Sodium (Na) 2006/05/15 0.4 % 25Dissolved Sulphur (S) 2006/05/15 0.2 % 25Dissolved Zirconium (Zr) 2006/05/15 NC % 25
1135004 AA1 MATRIX SPIKE Dissolved Mercury (Hg) 2006/05/17 101 % 70 - 130QC STANDARD Dissolved Mercury (Hg) 2006/05/17 100 % 80 - 120SPIKE Dissolved Mercury (Hg) 2006/05/17 95 % 80 - 120BLANK Dissolved Mercury (Hg) 2006/05/17 <0.05 ug/LRPD Dissolved Mercury (Hg) 2006/05/17 NC % 25
1135123 DJ MATRIX SPIKE Dissolved Arsenic (As) 2006/05/16 96 % 75 - 125Dissolved Cadmium (Cd) 2006/05/16 106 % 75 - 125Dissolved Chromium (Cr) 2006/05/16 109 % 75 - 125Dissolved Cobalt (Co) 2006/05/16 109 % 75 - 125Dissolved Copper (Cu) 2006/05/16 112 % 75 - 125Dissolved Lead (Pb) 2006/05/16 98 % 75 - 125Dissolved Selenium (Se) 2006/05/16 98 % 75 - 125Dissolved Thallium (Tl) 2006/05/16 95 % 75 - 125Dissolved Zinc (Zn) 2006/05/16 104 % 75 - 125
SPIKE Dissolved Arsenic (As) 2006/05/16 105 % 75 - 125Dissolved Cadmium (Cd) 2006/05/16 105 % 75 - 125Dissolved Chromium (Cr) 2006/05/16 112 % 75 - 125Dissolved Cobalt (Co) 2006/05/16 111 % 75 - 125Dissolved Copper (Cu) 2006/05/16 115 % 75 - 125Dissolved Lead (Pb) 2006/05/16 100 % 75 - 125Dissolved Selenium (Se) 2006/05/16 108 % 75 - 125Dissolved Thallium (Tl) 2006/05/16 96 % 75 - 125Dissolved Zinc (Zn) 2006/05/16 115 % 75 - 125
BLANK Dissolved Aluminum (Al) 2006/05/16 <0.2 ug/LDissolved Antimony (Sb) 2006/05/16 <0.05 ug/LDissolved Arsenic (As) 2006/05/16 <0.1 ug/LDissolved Barium (Ba) 2006/05/16 <0.02 ug/LDissolved Beryllium (Be) 2006/05/16 <0.05 ug/LDissolved Bismuth (Bi) 2006/05/16 <0.05 ug/LDissolved Cadmium (Cd) 2006/05/16 <0.01 ug/LDissolved Chromium (Cr) 2006/05/16 <0.2 ug/LDissolved Cobalt (Co) 2006/05/16 <0.02 ug/LDissolved Copper (Cu) 2006/05/16 <0.1 ug/LDissolved Lead (Pb) 2006/05/16 <0.02 ug/LDissolved Lithium (Li) 2006/05/16 0.2, RDL=0.2 ug/LDissolved Manganese (Mn) 2006/05/16 <0.02 ug/LDissolved Molybdenum (Mo) 2006/05/16 <0.02 ug/L
Burnaby: 8577 Commerce Court V5A 4N5 Telephone(604) 444-4808 Fax(604) 444-4511
Page 6 of 8
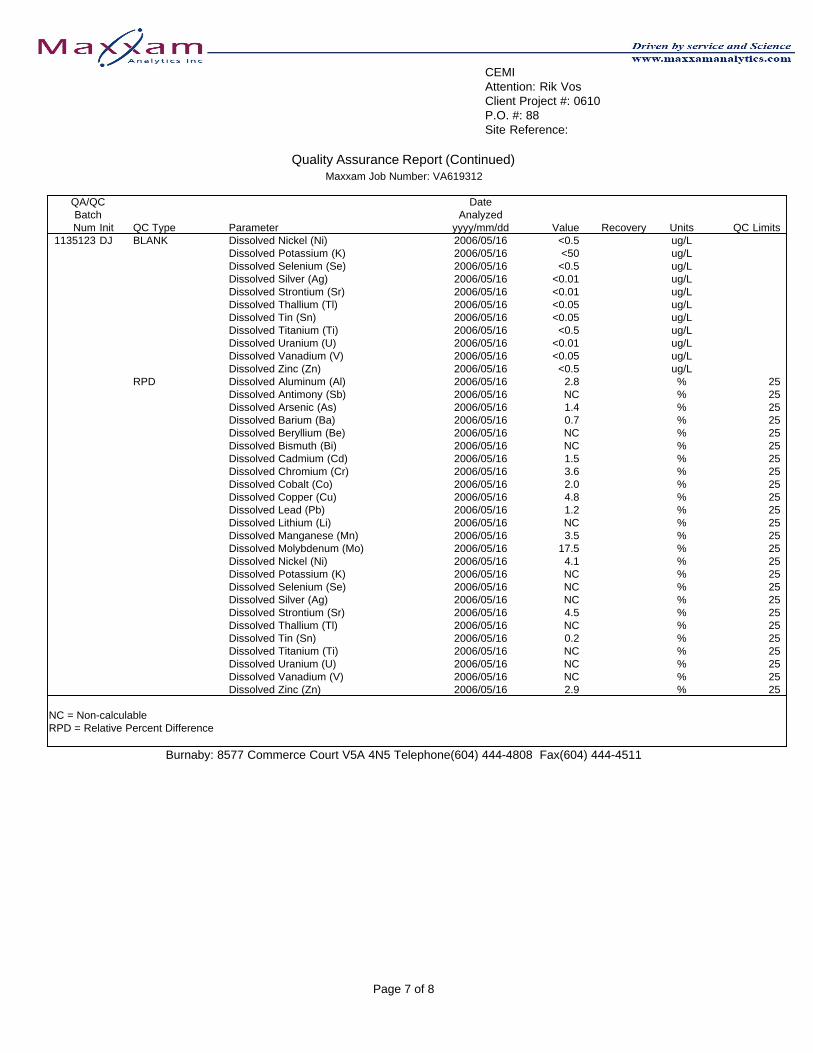
CEMIAttention: Rik Vos Client Project #: 0610P.O. #: 88Site Reference:
Quality Assurance Report (Continued)Maxxam Job Number: VA619312
QA/QC DateBatch AnalyzedNum Init QC Type Parameter yyyy/mm/dd Value Recovery Units QC Limits
1135123 DJ BLANK Dissolved Nickel (Ni) 2006/05/16 <0.5 ug/LDissolved Potassium (K) 2006/05/16 <50 ug/LDissolved Selenium (Se) 2006/05/16 <0.5 ug/LDissolved Silver (Ag) 2006/05/16 <0.01 ug/LDissolved Strontium (Sr) 2006/05/16 <0.01 ug/LDissolved Thallium (Tl) 2006/05/16 <0.05 ug/LDissolved Tin (Sn) 2006/05/16 <0.05 ug/LDissolved Titanium (Ti) 2006/05/16 <0.5 ug/LDissolved Uranium (U) 2006/05/16 <0.01 ug/LDissolved Vanadium (V) 2006/05/16 <0.05 ug/LDissolved Zinc (Zn) 2006/05/16 <0.5 ug/L
RPD Dissolved Aluminum (Al) 2006/05/16 2.8 % 25Dissolved Antimony (Sb) 2006/05/16 NC % 25Dissolved Arsenic (As) 2006/05/16 1.4 % 25Dissolved Barium (Ba) 2006/05/16 0.7 % 25Dissolved Beryllium (Be) 2006/05/16 NC % 25Dissolved Bismuth (Bi) 2006/05/16 NC % 25Dissolved Cadmium (Cd) 2006/05/16 1.5 % 25Dissolved Chromium (Cr) 2006/05/16 3.6 % 25Dissolved Cobalt (Co) 2006/05/16 2.0 % 25Dissolved Copper (Cu) 2006/05/16 4.8 % 25Dissolved Lead (Pb) 2006/05/16 1.2 % 25Dissolved Lithium (Li) 2006/05/16 NC % 25Dissolved Manganese (Mn) 2006/05/16 3.5 % 25Dissolved Molybdenum (Mo) 2006/05/16 17.5 % 25Dissolved Nickel (Ni) 2006/05/16 4.1 % 25Dissolved Potassium (K) 2006/05/16 NC % 25Dissolved Selenium (Se) 2006/05/16 NC % 25Dissolved Silver (Ag) 2006/05/16 NC % 25Dissolved Strontium (Sr) 2006/05/16 4.5 % 25Dissolved Thallium (Tl) 2006/05/16 NC % 25Dissolved Tin (Sn) 2006/05/16 0.2 % 25Dissolved Titanium (Ti) 2006/05/16 NC % 25Dissolved Uranium (U) 2006/05/16 NC % 25Dissolved Vanadium (V) 2006/05/16 NC % 25Dissolved Zinc (Zn) 2006/05/16 2.9 % 25
NC = Non-calculableRPD = Relative Percent Difference
Burnaby: 8577 Commerce Court V5A 4N5 Telephone(604) 444-4808 Fax(604) 444-4511
Page 7 of 8

Page 8 of 8

Your P.O. #: 83 Your Project #: 0610 Your C.O.C. #: 08186188
Attention: Rik VosCEMI6927 Antrim Ave.Burnaby, BCCANADA V5J 4M5
Report Date: 2007/03/13This report supersedes all previous reports
CERTIFICATE OF ANALYSIS
MAXXAM JOB #: A619315Received: 2006/05/11, 15:00
Sample Matrix: Water# Samples Received: 4
Date DateAnalyses Quantity Extracted Analyzed Laboratory Method Analytical MethodHardness (calculated as CaCO3) 4 N/A 2006/05/15 Mercury (Dissolved) 4 2006/05/16 2006/05/17 BRN SOP-00044 V1.0 Based on EPA 245.1 Elements by ICP-AES (dissolved) 4 2006/05/15 2006/05/15 BRN SOP-00040 V1.0 Based on EPA 6010B Elements by ICPMS (dissolved) ( 1 ) 4 2006/05/16 2006/05/16 BRN SOP-00042 V1.0 Based on EPA 200.8
* RPDs calculated using raw data. The rounding of final results may result in the apparent difference.
(1) SCC/CAEAL
Encryption Key
Please direct all questions regarding this Certificate of Analysis to your Project Manager.
ELAINE COUSINS, CS ManagerEmail: [email protected]# (604) 444-4808 Ext:276
====================================================================Maxxam has procedures in place to guard against improper use of the electronic signature and have the required "signatories", as per section5.10.2 of ISO/IEC 17025:2005(E), signing the reports. SCC and CAEAL have approved this reporting process and electronic report format.
Total cover pages: 1
Burnaby: 8577 Commerce Court V5A 4N5 Telephone(604) 444-4808 Fax(604) 444-4511
Page 1 of 8

CEMIMaxxam Job #: A619315 Client Project #: 0610Report Date: 2007/03/13 Site Reference:
Your P.O. #: 83Sampler Initials:
RESULTS OF CHEMICAL ANALYSES OF WATER
Maxxam ID B 2 8 8 1 8 B 2 8 8 1 9 B 2 8 8 2 0 B 2 8 8 2 1Sampling DateCOC Number 08186188 08186188 08186188 08186188 Units 25392 25393 25396 25399 RDL QC Batch
Misc. Inorganics
Dissolved Hardness (CaCO3) mg/L 2190 2210 2200 2160 0.5 1133469
RDL = Reportable Detection Limit
Page 2 of 8
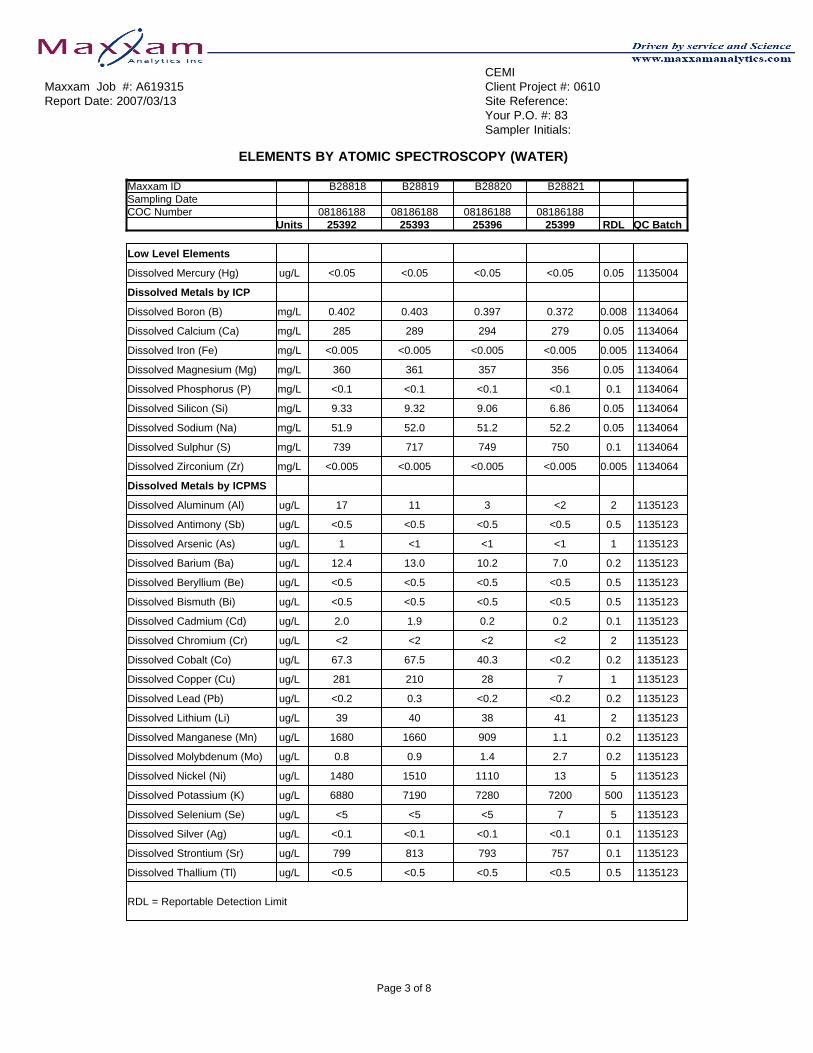
CEMIMaxxam Job #: A619315 Client Project #: 0610Report Date: 2007/03/13 Site Reference:
Your P.O. #: 83Sampler Initials:
ELEMENTS BY ATOMIC SPECTROSCOPY (WATER)
Maxxam ID B 2 8 8 1 8 B 2 8 8 1 9 B 2 8 8 2 0 B 2 8 8 2 1Sampling DateCOC Number 08186188 08186188 08186188 08186188 Units 25392 25393 25396 25399 RDL QC Batch
Low Level Elements
Dissolved Mercury (Hg) ug/L <0.05 <0.05 <0.05 <0.05 0.05 1135004
Dissolved Metals by ICP
Dissolved Boron (B) mg/L 0.402 0.403 0.397 0.372 0.008 1134064
Dissolved Calcium (Ca) mg/L 285 289 294 279 0.05 1134064
Dissolved Iron (Fe) mg/L <0.005 <0.005 <0.005 <0.005 0.005 1134064
Dissolved Magnesium (Mg) mg/L 360 361 357 356 0.05 1134064
Dissolved Phosphorus (P) mg/L <0.1 <0.1 <0.1 <0.1 0.1 1134064
Dissolved Silicon (Si) mg/L 9.33 9.32 9.06 6.86 0.05 1134064
Dissolved Sodium (Na) mg/L 51.9 52.0 51.2 52.2 0.05 1134064
Dissolved Sulphur (S) mg/L 739 717 749 750 0.1 1134064
Dissolved Zirconium (Zr) mg/L <0.005 <0.005 <0.005 <0.005 0.005 1134064
Dissolved Metals by ICPMS
Dissolved Aluminum (Al) ug/L 17 11 3 <2 2 1135123
Dissolved Antimony (Sb) ug/L <0.5 <0.5 <0.5 <0.5 0.5 1135123
Dissolved Arsenic (As) ug/L 1 <1 <1 <1 1 1135123
Dissolved Barium (Ba) ug/L 12.4 13.0 10.2 7.0 0.2 1135123
Dissolved Beryllium (Be) ug/L <0.5 <0.5 <0.5 <0.5 0.5 1135123
Dissolved Bismuth (Bi) ug/L <0.5 <0.5 <0.5 <0.5 0.5 1135123
Dissolved Cadmium (Cd) ug/L 2.0 1.9 0.2 0.2 0.1 1135123
Dissolved Chromium (Cr) ug/L <2 <2 <2 <2 2 1135123
Dissolved Cobalt (Co) ug/L 67.3 67.5 40.3 <0.2 0.2 1135123
Dissolved Copper (Cu) ug/L 281 210 28 7 1 1135123
Dissolved Lead (Pb) ug/L <0.2 0.3 <0.2 <0.2 0.2 1135123
Dissolved Lithium (Li) ug/L 39 40 38 41 2 1135123
Dissolved Manganese (Mn) ug/L 1680 1660 909 1.1 0.2 1135123
Dissolved Molybdenum (Mo) ug/L 0.8 0.9 1.4 2.7 0.2 1135123
Dissolved Nickel (Ni) ug/L 1480 1510 1110 13 5 1135123
Dissolved Potassium (K) ug/L 6880 7190 7280 7200 500 1135123
Dissolved Selenium (Se) ug/L <5 <5 <5 7 5 1135123
Dissolved Silver (Ag) ug/L <0.1 <0.1 <0.1 <0.1 0.1 1135123
Dissolved Strontium (Sr) ug/L 799 813 793 757 0.1 1135123
Dissolved Thallium (Tl) ug/L <0.5 <0.5 <0.5 <0.5 0.5 1135123
RDL = Reportable Detection Limit
Page 3 of 8

CEMIMaxxam Job #: A619315 Client Project #: 0610Report Date: 2007/03/13 Site Reference:
Your P.O. #: 83Sampler Initials:
ELEMENTS BY ATOMIC SPECTROSCOPY (WATER)
Maxxam ID B 2 8 8 1 8 B 2 8 8 1 9 B 2 8 8 2 0 B 2 8 8 2 1Sampling DateCOC Number 08186188 08186188 08186188 08186188 Units 25392 25393 25396 25399 RDL QC Batch
Dissolved Tin (Sn) ug/L <0.5 <0.5 <0.5 <0.5 0.5 1135123
Dissolved Titanium (Ti) ug/L <5 <5 <5 <5 5 1135123
Dissolved Uranium (U) ug/L 4.4 4.5 4.1 0.4 0.1 1135123
Dissolved Vanadium (V) ug/L <0.5 <0.5 <0.5 <0.5 0.5 1135123
Dissolved Zinc (Zn) ug/L 520 456 10 <5 5 1135123
RDL = Reportable Detection Limit
Page 4 of 8

CEMIMaxxam Job #: A619315 Client Project #: 0610Report Date: 2007/03/13 Site Reference:
Your P.O. #: 83Sampler Initials:
ELEMENTS BY ATOMIC SPECTROSCOPY (WATER) Comments
Sample B28818-01 Elements by ICPMS (dissolved): MDL raised due to sample dilution.
Sample B28819-01 Elements by ICPMS (dissolved): MDL raised due to sample dilution.
Sample B28820-01 Elements by ICPMS (dissolved): MDL raised due to sample dilution.
Sample B28821-01 Elements by ICPMS (dissolved): MDL raised due to sample dilution.
Results relate only to the items tested.
Page 5 of 8

CEMIAttention: Rik Vos Client Project #: 0610P.O. #: 83Site Reference:
Quality Assurance ReportMaxxam Job Number: VA619315
QA/QC DateBatch AnalyzedNum Init QC Type Parameter yyyy/mm/dd Value Recovery Units QC Limits
1134064 KL1 BLANK Dissolved Boron (B) 2006/05/15 <0.008 mg/LDissolved Calcium (Ca) 2006/05/15 <0.05 mg/LDissolved Iron (Fe) 2006/05/15 <0.005 mg/LDissolved Magnesium (Mg) 2006/05/15 <0.05 mg/LDissolved Phosphorus (P) 2006/05/15 <0.1 mg/LDissolved Silicon (Si) 2006/05/15 <0.05 mg/LDissolved Sodium (Na) 2006/05/15 <0.05 mg/LDissolved Sulphur (S) 2006/05/15 <0.1 mg/LDissolved Zirconium (Zr) 2006/05/15 <0.005 mg/L
RPD Dissolved Boron (B) 2006/05/15 NC % 25Dissolved Calcium (Ca) 2006/05/15 0.1 % 25Dissolved Iron (Fe) 2006/05/15 NC % 25Dissolved Magnesium (Mg) 2006/05/15 0.3 % 25Dissolved Phosphorus (P) 2006/05/15 NC % 25Dissolved Silicon (Si) 2006/05/15 0.2 % 25Dissolved Sodium (Na) 2006/05/15 0.4 % 25Dissolved Sulphur (S) 2006/05/15 0.2 % 25Dissolved Zirconium (Zr) 2006/05/15 NC % 25
1135004 AA1 MATRIX SPIKE Dissolved Mercury (Hg) 2006/05/17 101 % 70 - 130QC STANDARD Dissolved Mercury (Hg) 2006/05/17 100 % 80 - 120SPIKE Dissolved Mercury (Hg) 2006/05/17 95 % 80 - 120BLANK Dissolved Mercury (Hg) 2006/05/17 <0.05 ug/LRPD Dissolved Mercury (Hg) 2006/05/17 NC % 25
1135123 DJ MATRIX SPIKE Dissolved Arsenic (As) 2006/05/16 96 % 75 - 125Dissolved Cadmium (Cd) 2006/05/16 106 % 75 - 125Dissolved Chromium (Cr) 2006/05/16 109 % 75 - 125Dissolved Cobalt (Co) 2006/05/16 109 % 75 - 125Dissolved Copper (Cu) 2006/05/16 112 % 75 - 125Dissolved Lead (Pb) 2006/05/16 98 % 75 - 125Dissolved Selenium (Se) 2006/05/16 98 % 75 - 125Dissolved Thallium (Tl) 2006/05/16 95 % 75 - 125Dissolved Zinc (Zn) 2006/05/16 104 % 75 - 125
SPIKE Dissolved Arsenic (As) 2006/05/16 105 % 75 - 125Dissolved Cadmium (Cd) 2006/05/16 105 % 75 - 125Dissolved Chromium (Cr) 2006/05/16 112 % 75 - 125Dissolved Cobalt (Co) 2006/05/16 111 % 75 - 125Dissolved Copper (Cu) 2006/05/16 115 % 75 - 125Dissolved Lead (Pb) 2006/05/16 100 % 75 - 125Dissolved Selenium (Se) 2006/05/16 108 % 75 - 125Dissolved Thallium (Tl) 2006/05/16 96 % 75 - 125Dissolved Zinc (Zn) 2006/05/16 115 % 75 - 125
BLANK Dissolved Aluminum (Al) 2006/05/16 <0.2 ug/LDissolved Antimony (Sb) 2006/05/16 <0.05 ug/LDissolved Arsenic (As) 2006/05/16 <0.1 ug/LDissolved Barium (Ba) 2006/05/16 <0.02 ug/LDissolved Beryllium (Be) 2006/05/16 <0.05 ug/LDissolved Bismuth (Bi) 2006/05/16 <0.05 ug/LDissolved Cadmium (Cd) 2006/05/16 <0.01 ug/LDissolved Chromium (Cr) 2006/05/16 <0.2 ug/LDissolved Cobalt (Co) 2006/05/16 <0.02 ug/LDissolved Copper (Cu) 2006/05/16 <0.1 ug/LDissolved Lead (Pb) 2006/05/16 <0.02 ug/LDissolved Lithium (Li) 2006/05/16 0.2, RDL=0.2 ug/LDissolved Manganese (Mn) 2006/05/16 <0.02 ug/LDissolved Molybdenum (Mo) 2006/05/16 <0.02 ug/L
Burnaby: 8577 Commerce Court V5A 4N5 Telephone(604) 444-4808 Fax(604) 444-4511
Page 6 of 8

CEMIAttention: Rik Vos Client Project #: 0610P.O. #: 83Site Reference:
Quality Assurance Report (Continued)Maxxam Job Number: VA619315
QA/QC DateBatch AnalyzedNum Init QC Type Parameter yyyy/mm/dd Value Recovery Units QC Limits
1135123 DJ BLANK Dissolved Nickel (Ni) 2006/05/16 <0.5 ug/LDissolved Potassium (K) 2006/05/16 <50 ug/LDissolved Selenium (Se) 2006/05/16 <0.5 ug/LDissolved Silver (Ag) 2006/05/16 <0.01 ug/LDissolved Strontium (Sr) 2006/05/16 <0.01 ug/LDissolved Thallium (Tl) 2006/05/16 <0.05 ug/LDissolved Tin (Sn) 2006/05/16 <0.05 ug/LDissolved Titanium (Ti) 2006/05/16 <0.5 ug/LDissolved Uranium (U) 2006/05/16 <0.01 ug/LDissolved Vanadium (V) 2006/05/16 <0.05 ug/LDissolved Zinc (Zn) 2006/05/16 <0.5 ug/L
RPD Dissolved Aluminum (Al) 2006/05/16 2.8 % 25Dissolved Antimony (Sb) 2006/05/16 NC % 25Dissolved Arsenic (As) 2006/05/16 1.4 % 25Dissolved Barium (Ba) 2006/05/16 0.7 % 25Dissolved Beryllium (Be) 2006/05/16 NC % 25Dissolved Bismuth (Bi) 2006/05/16 NC % 25Dissolved Cadmium (Cd) 2006/05/16 1.5 % 25Dissolved Chromium (Cr) 2006/05/16 3.6 % 25Dissolved Cobalt (Co) 2006/05/16 2.0 % 25Dissolved Copper (Cu) 2006/05/16 4.8 % 25Dissolved Lead (Pb) 2006/05/16 1.2 % 25Dissolved Lithium (Li) 2006/05/16 NC % 25Dissolved Manganese (Mn) 2006/05/16 3.5 % 25Dissolved Molybdenum (Mo) 2006/05/16 17.5 % 25Dissolved Nickel (Ni) 2006/05/16 4.1 % 25Dissolved Potassium (K) 2006/05/16 NC % 25Dissolved Selenium (Se) 2006/05/16 NC % 25Dissolved Silver (Ag) 2006/05/16 NC % 25Dissolved Strontium (Sr) 2006/05/16 4.5 % 25Dissolved Thallium (Tl) 2006/05/16 NC % 25Dissolved Tin (Sn) 2006/05/16 0.2 % 25Dissolved Titanium (Ti) 2006/05/16 NC % 25Dissolved Uranium (U) 2006/05/16 NC % 25Dissolved Vanadium (V) 2006/05/16 NC % 25Dissolved Zinc (Zn) 2006/05/16 2.9 % 25
NC = Non-calculableRPD = Relative Percent Difference
Burnaby: 8577 Commerce Court V5A 4N5 Telephone(604) 444-4808 Fax(604) 444-4511
Page 7 of 8

Page 8 of 8

Your P.O. #: 145 Your Project #: 0610 Your C.O.C. #: 08186201
Attention: Rik VosCEMI6927 Antrim Ave.Burnaby, BCCANADA V5J 4M5
Report Date: 2006/06/15
CERTIFICATE OF ANALYSIS
MAXXAM JOB #: A624486Received: 2006/06/12, 13:46
Sample Matrix: Water# Samples Received: 8
Date DateAnalyses Quantity Extracted Analyzed Laboratory Method Analytical MethodHardness (calculated as CaCO3) 2 N/A 2006/06/12 Mercury (Dissolved) 2 2006/06/13 2006/06/13 ING143 Rev.6.2 Based on EPA 245.1 Mercury (Total) 6 2006/06/13 2006/06/13 ING143 Rev.6.2 Based on EPA 245.1 Elements by ICP-AES (dissolved) 2 2006/06/09 2006/06/12 ING101 Rev.4.0 Based on EPA 6010B Elements by ICPMS (dissolved) ( 1 ) 2 2006/06/12 2006/06/12 ING111 Rev. 1.9 Based on EPA 200.8 Elements by ICPMS (total) ( 1 ) 6 N/A 2006/06/13 ING111 Rev. 1.9 Based on EPA 200.8 Elements by ICP-AES (total) 6 N/A 2006/06/13 ING101 Rev 4.0 Based on EPA 6010B
(1) SCC/CAEAL
Encryption Key
Please direct all questions regarding this Certificate of Analysis to your Project Manager.
ELAINE COUSINS, CS ManagerEmail: [email protected]# (604) 444-4808 Ext:276
====================================================================Maxxam has procedures in place to guard against improper use of the electronic signature and have the required "signatories", as per section 5.10.2 ofISO/IEC 17025:2005(E), signing the reports. SCC and CAEAL have approved this reporting process and electronic report format.
Total cover pages: 1
Burnaby: 8577 Commerce Court V5A 4N5 Telephone(604) 444-4808 Fax(604) 444-4511Page 1 of 12

CEMIMaxxam Job #: A624486 Client Project #: 0610Report Date: 2006/06/15 Site Reference:
Your P.O. #: 145Sampler Initials:
RESULTS OF CHEMICAL ANALYSES OF WATER
Maxxam ID B 6 1 0 2 8 B 6 1 0 3 1Sampling DateCOC Number 08186201 08186201 Units 25434 25438 RDL QC Batch
Misc. Inorganics
Dissolved Hardness (CaCO3) mg/L 2400 2300 0.5 1161944
RDL = Reportable Detection Limit
Page 2 of 12

CEMIMaxxam Job #: A624486 Client Project #: 0610Report Date: 2006/06/15 Site Reference:
Your P.O. #: 145Sampler Initials:
ELEMENTS BY ATOMIC SPECTROSCOPY (WATER)
Maxxam ID B 6 1 0 2 6 B 6 1 0 2 7 B 6 1 0 2 8 B 6 1 0 2 9Sampling DateCOC Number 08186201 08186201 08186201 08186201 Units 25400 25401 25434 25435 RDL QC Batch
Dissolved Metals by ICP
Dissolved Barium (Ba) mg/L 0.009 0.001 1160347
Dissolved Beryllium (Be) mg/L <0.0002 0.0002 1160347
Dissolved Bismuth (Bi) mg/L <0.05 0.05 1160347
Dissolved Boron (B) mg/L 0.259 0.008 1160347
Dissolved Calcium (Ca) mg/L 341 0.05 1160347
Dissolved Iron (Fe) mg/L <0.005 0.005 1160347
Dissolved Magnesium (Mg) mg/L 372 0.05 1160347
Dissolved Manganese (Mn) mg/L 0.006 0.001 1160347
Dissolved Molybdenum (Mo) mg/L <0.005 0.005 1160347
Dissolved Nickel (Ni) mg/L <0.008 0.008 1160347
Dissolved Phosphorus (P) mg/L <0.1 0.1 1160347
Dissolved Potassium (K) mg/L 8 1 1160347
Dissolved Silicon (Si) mg/L 3.84 0.05 1160347
Dissolved Sodium (Na) mg/L 52.4 0.05 1160347
Dissolved Strontium (Sr) mg/L 0.718 0.001 1160347
Dissolved Sulphur (S) mg/L 732 0.1 1160347
Dissolved Tin (Sn) mg/L <0.02 0.02 1160347
Dissolved Titanium (Ti) mg/L <0.003 0.003 1160347
Dissolved Vanadium (V) mg/L <0.005 0.005 1160347
Dissolved Zinc (Zn) mg/L <0.005 0.005 1160347
Dissolved Zirconium (Zr) mg/L <0.005 0.005 1160347
Dissolved Metals by ICPMS
Dissolved Aluminum (Al) ug/L 6 1 1162126
Dissolved Antimony (Sb) ug/L <1 1 1162126
Dissolved Arsenic (As) ug/L <1 1 1162126
Dissolved Cadmium (Cd) ug/L <0.1 0.1 1162126
Dissolved Chromium (Cr) ug/L <1 1 1162126
Dissolved Cobalt (Co) ug/L 0.5 0.5 1162126
Dissolved Copper (Cu) ug/L 12.0 0.2 1162126
Dissolved Lead (Pb) ug/L <0.5 0.5 1162126
Dissolved Lithium (Li) ug/L 40 2 1162126
Dissolved Selenium (Se) ug/L <1 1 1162126
RDL = Reportable Detection Limit
Page 3 of 12

CEMIMaxxam Job #: A624486 Client Project #: 0610Report Date: 2006/06/15 Site Reference:
Your P.O. #: 145Sampler Initials:
ELEMENTS BY ATOMIC SPECTROSCOPY (WATER)
Maxxam ID B 6 1 0 2 6 B 6 1 0 2 7 B 6 1 0 2 8 B 6 1 0 2 9Sampling DateCOC Number 08186201 08186201 08186201 08186201 Units 25400 25401 25434 25435 RDL QC Batch
Dissolved Silver (Ag) ug/L <0.1 0.1 1162126
Dissolved Thallium (Tl) ug/L <0.1 0.1 1162126
Dissolved Uranium (U) ug/L 0.7 0.1 1162126
Mercury by CVAA
Dissolved Mercury (Hg) ug/L <0.05 0.05 1162561
Total Mercury (Hg) ug/L <0.05 <0.05 <0.05 0.05 1162627
Total Metals by ICP
Total Barium (Ba) mg/L 0.007 0.008 0.009 0.001 1163103
Total Beryllium (Be) mg/L <0.0002 <0.0002 <0.0002 0.0002 1163103
Total Bismuth (Bi) mg/L <0.05 <0.05 <0.05 0.05 1163103
Total Boron (B) mg/L 0.308 0.370 0.285 0.008 1163103
Total Calcium (Ca) mg/L 251 290 326 0.05 1163103
Total Iron (Fe) mg/L 0.015 0.010 0.007 0.005 1163103
Total Magnesium (Mg) mg/L 293 352 341 0.05 1163103
Total Manganese (Mn) mg/L 0.183 0.097 0.422 0.001 1163103
Total Molybdenum (Mo) mg/L <0.005 <0.005 <0.005 0.005 1163103
Total Nickel (Ni) mg/L 0.175 0.098 0.372 0.008 1163103
Total Phosphorus (P) mg/L <0.1 <0.1 <0.1 0.1 1163103
Total Potassium (K) mg/L 6 7 7 1 1163103
Total Silicon (Si) mg/L 6.12 7.06 5.39 0.05 1163103
Total Sodium (Na) mg/L 43.4 52.1 52.1 0.05 1163103
Total Strontium (Sr) mg/L 0.600 0.696 0.710 0.001 1163103
Total Sulphur (S) mg/L 724 701 720 0.1 1163103
Total Tin (Sn) mg/L <0.02 <0.02 <0.02 0.02 1163103
Total Titanium (Ti) mg/L <0.003 <0.003 <0.003 0.003 1163103
Total Vanadium (V) mg/L <0.005 <0.005 <0.005 0.005 1163103
Total Zinc (Zn) mg/L 0.065 0.030 0.142 0.005 1163103
Total Zirconium (Zr) mg/L <0.005 <0.005 <0.005 0.005 1163103
Total Metals by ICPMS
Total Aluminum (Al) ug/L 48 23 36 1 1163412
Total Antimony (Sb) ug/L <1 <1 <1 1 1163412
Total Arsenic (As) ug/L <1 <1 <1 1 1163412
Total Cadmium (Cd) ug/L 0.3 0.1 0.5 0.1 1163412
RDL = Reportable Detection Limit
Page 4 of 12
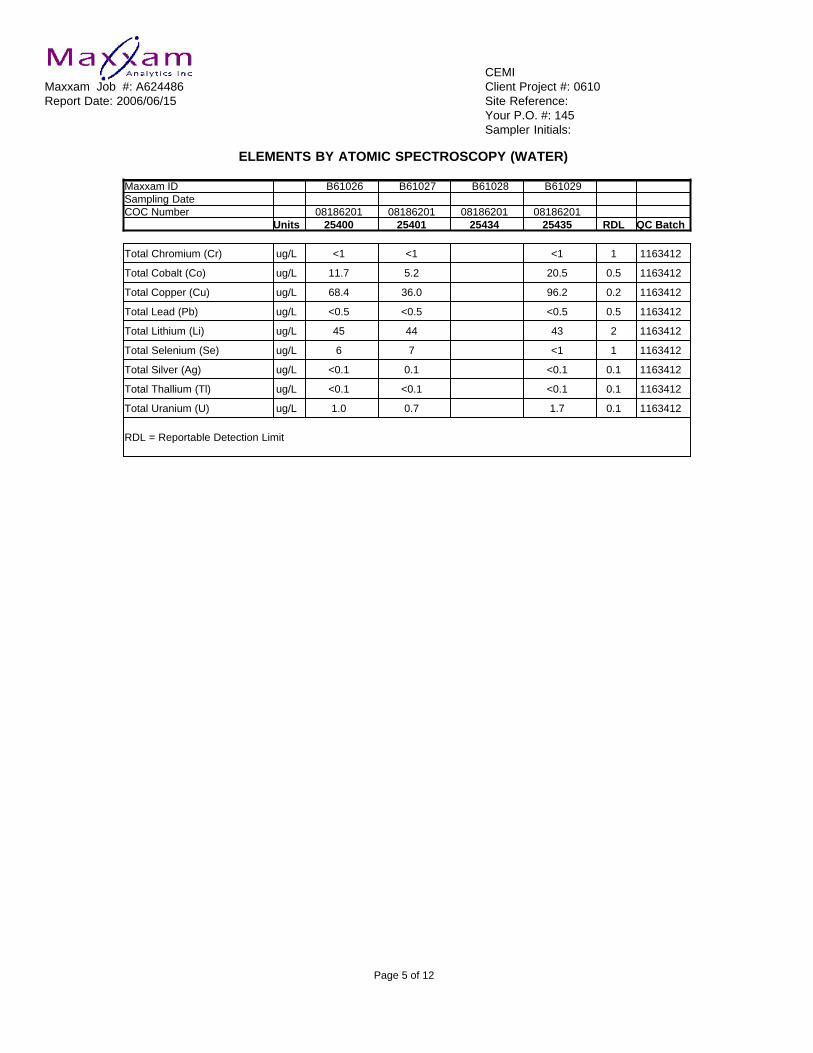
CEMIMaxxam Job #: A624486 Client Project #: 0610Report Date: 2006/06/15 Site Reference:
Your P.O. #: 145Sampler Initials:
ELEMENTS BY ATOMIC SPECTROSCOPY (WATER)
Maxxam ID B 6 1 0 2 6 B 6 1 0 2 7 B 6 1 0 2 8 B 6 1 0 2 9Sampling DateCOC Number 08186201 08186201 08186201 08186201 Units 25400 25401 25434 25435 RDL QC Batch
Total Chromium (Cr) ug/L <1 <1 <1 1 1163412
Total Cobalt (Co) ug/L 11.7 5.2 20.5 0.5 1163412
Total Copper (Cu) ug/L 68.4 36.0 96.2 0.2 1163412
Total Lead (Pb) ug/L <0.5 <0.5 <0.5 0.5 1163412
Total Lithium (Li) ug/L 45 44 43 2 1163412
Total Selenium (Se) ug/L 6 7 <1 1 1163412
Total Silver (Ag) ug/L <0.1 0.1 <0.1 0.1 1163412
Total Thallium (Tl) ug/L <0.1 <0.1 <0.1 0.1 1163412
Total Uranium (U) ug/L 1.0 0.7 1.7 0.1 1163412
RDL = Reportable Detection Limit
Page 5 of 12

CEMIMaxxam Job #: A624486 Client Project #: 0610Report Date: 2006/06/15 Site Reference:
Your P.O. #: 145Sampler Initials:
ELEMENTS BY ATOMIC SPECTROSCOPY (WATER)
Maxxam ID B 6 1 0 3 0 B 6 1 0 3 1 B 6 1 0 3 2 B 6 1 0 3 3Sampling DateCOC Number 08186201 08186201 08186201 08186201 Units 25436 25438 25439 25440 RDL QC Batch
Dissolved Metals by ICP
Dissolved Barium (Ba) mg/L 0.008 0.001 1160347
Dissolved Beryllium (Be) mg/L <0.0002 0.0002 1160347
Dissolved Bismuth (Bi) mg/L <0.05 0.05 1160347
Dissolved Boron (B) mg/L 0.223 0.008 1160347
Dissolved Calcium (Ca) mg/L 320 0.05 1160347
Dissolved Iron (Fe) mg/L <0.005 0.005 1160347
Dissolved Magnesium (Mg) mg/L 356 0.05 1160347
Dissolved Manganese (Mn) mg/L <0.001 0.001 1160347
Dissolved Molybdenum (Mo) mg/L <0.005 0.005 1160347
Dissolved Nickel (Ni) mg/L <0.008 0.008 1160347
Dissolved Phosphorus (P) mg/L <0.1 0.1 1160347
Dissolved Potassium (K) mg/L 7 1 1160347
Dissolved Silicon (Si) mg/L 2.99 0.05 1160347
Dissolved Sodium (Na) mg/L 49.9 0.05 1160347
Dissolved Strontium (Sr) mg/L 0.675 0.001 1160347
Dissolved Sulphur (S) mg/L 702 0.1 1160347
Dissolved Tin (Sn) mg/L <0.02 0.02 1160347
Dissolved Titanium (Ti) mg/L <0.003 0.003 1160347
Dissolved Vanadium (V) mg/L <0.005 0.005 1160347
Dissolved Zinc (Zn) mg/L <0.005 0.005 1160347
Dissolved Zirconium (Zr) mg/L <0.005 0.005 1160347
Dissolved Metals by ICPMS
Dissolved Aluminum (Al) ug/L 3 1 1162126
Dissolved Antimony (Sb) ug/L <1 1 1162126
Dissolved Arsenic (As) ug/L <1 1 1162126
Dissolved Cadmium (Cd) ug/L <0.1 0.1 1162126
Dissolved Chromium (Cr) ug/L <1 1 1162126
Dissolved Cobalt (Co) ug/L <0.5 0.5 1162126
Dissolved Copper (Cu) ug/L 10.0 0.2 1162126
Dissolved Lead (Pb) ug/L <0.5 0.5 1162126
Dissolved Lithium (Li) ug/L 41 2 1162126
Dissolved Selenium (Se) ug/L <1 1 1162126
RDL = Reportable Detection Limit
Page 6 of 12

CEMIMaxxam Job #: A624486 Client Project #: 0610Report Date: 2006/06/15 Site Reference:
Your P.O. #: 145Sampler Initials:
ELEMENTS BY ATOMIC SPECTROSCOPY (WATER)
Maxxam ID B 6 1 0 3 0 B 6 1 0 3 1 B 6 1 0 3 2 B 6 1 0 3 3Sampling DateCOC Number 08186201 08186201 08186201 08186201 Units 25436 25438 25439 25440 RDL QC Batch
Dissolved Silver (Ag) ug/L <0.1 0.1 1162126
Dissolved Thallium (Tl) ug/L <0.1 0.1 1162126
Dissolved Uranium (U) ug/L 0.8 0.1 1162126
Mercury by CVAA
Dissolved Mercury (Hg) ug/L <0.05 0.05 1162561
Total Mercury (Hg) ug/L <0.05 <0.05 <0.05 0.05 1162627
Total Metals by ICP
Total Barium (Ba) mg/L 0.008 0.009 0.009 0.001 1163103
Total Beryllium (Be) mg/L <0.0002 <0.0002 <0.0002 0.0002 1163103
Total Bismuth (Bi) mg/L <0.05 <0.05 <0.05 0.05 1163103
Total Boron (B) mg/L 0.254 0.289 0.275 0.008 1163103
Total Calcium (Ca) mg/L 308 324 327 0.05 1163103
Total Iron (Fe) mg/L <0.005 0.010 <0.005 0.005 1163103
Total Magnesium (Mg) mg/L 328 337 350 0.05 1163103
Total Manganese (Mn) mg/L 0.235 0.697 0.468 0.001 1163103
Total Molybdenum (Mo) mg/L <0.005 <0.005 <0.005 0.005 1163103
Total Nickel (Ni) mg/L 0.215 0.614 0.418 0.008 1163103
Total Phosphorus (P) mg/L <0.1 <0.1 <0.1 0.1 1163103
Total Potassium (K) mg/L 7 7 7 1 1163103
Total Silicon (Si) mg/L 4.51 5.82 5.03 0.05 1163103
Total Sodium (Na) mg/L 50.4 51.0 53.5 0.05 1163103
Total Strontium (Sr) mg/L 0.679 0.696 0.719 0.001 1163103
Total Sulphur (S) mg/L 719 720 731 0.1 1163103
Total Tin (Sn) mg/L <0.02 <0.02 <0.02 0.02 1163103
Total Titanium (Ti) mg/L <0.003 <0.003 <0.003 0.003 1163103
Total Vanadium (V) mg/L <0.005 <0.005 <0.005 0.005 1163103
Total Zinc (Zn) mg/L 0.077 0.231 0.155 0.005 1163103
Total Zirconium (Zr) mg/L <0.005 <0.005 <0.005 0.005 1163103
Total Metals by ICPMS
Total Aluminum (Al) ug/L 20 41 24 1 1163412
Total Antimony (Sb) ug/L <1 <1 <1 1 1163412
Total Arsenic (As) ug/L <1 <1 <1 1 1163412
Total Cadmium (Cd) ug/L 0.3 0.8 0.5 0.1 1163412
RDL = Reportable Detection Limit
Page 7 of 12

CEMIMaxxam Job #: A624486 Client Project #: 0610Report Date: 2006/06/15 Site Reference:
Your P.O. #: 145Sampler Initials:
ELEMENTS BY ATOMIC SPECTROSCOPY (WATER)
Maxxam ID B 6 1 0 3 0 B 6 1 0 3 1 B 6 1 0 3 2 B 6 1 0 3 3Sampling DateCOC Number 08186201 08186201 08186201 08186201 Units 25436 25438 25439 25440 RDL QC Batch
Total Chromium (Cr) ug/L <1 2 2 1 1163412
Total Cobalt (Co) ug/L 12.0 33.2 22.3 0.5 1163412
Total Copper (Cu) ug/L 59.4 137 95.2 0.2 1163412
Total Lead (Pb) ug/L <0.5 <0.5 <0.5 0.5 1163412
Total Lithium (Li) ug/L 44 41 41 2 1163412
Total Selenium (Se) ug/L 2 2 1 1 1163412
Total Silver (Ag) ug/L <0.1 <0.1 <0.1 0.1 1163412
Total Thallium (Tl) ug/L <0.1 <0.1 <0.1 0.1 1163412
Total Uranium (U) ug/L 1.3 2.4 1.8 0.1 1163412
RDL = Reportable Detection Limit
Page 8 of 12

CEMIMaxxam Job #: A624486 Client Project #: 0610Report Date: 2006/06/15 Site Reference:
Your P.O. #: 145Sampler Initials:
General Comments
Results relate only to the items tested.
Page 9 of 12

CEMIAttention: Rik Vos Client Project #: 0610P.O. #: 145Site Reference:
Quality Assurance ReportMaxxam Job Number: VA624486
QA/QC DateBatch AnalyzedNum Init QC Type Parameter yyyy/mm/dd Value Recovery Units QC Limits
1160347 KL1 MATRIX SPIKE Dissolved Manganese (Mn) 2006/06/12 97 % 80 - 120Dissolved Zinc (Zn) 2006/06/12 101 % 80 - 120
SPIKE Dissolved Manganese (Mn) 2006/06/12 104 % 80 - 120Dissolved Zinc (Zn) 2006/06/12 104 % 80 - 120
BLANK Dissolved Barium (Ba) 2006/06/12 <0.001 mg/LDissolved Beryllium (Be) 2006/06/12 <0.0002 mg/LDissolved Bismuth (Bi) 2006/06/12 <0.05 mg/LDissolved Boron (B) 2006/06/12 <0.008 mg/LDissolved Calcium (Ca) 2006/06/12 <0.05 mg/LDissolved Iron (Fe) 2006/06/12 <0.005 mg/LDissolved Magnesium (Mg) 2006/06/12 <0.05 mg/LDissolved Manganese (Mn) 2006/06/12 <0.001 mg/LDissolved Molybdenum (Mo) 2006/06/12 <0.005 mg/LDissolved Nickel (Ni) 2006/06/12 <0.008 mg/LDissolved Phosphorus (P) 2006/06/12 <0.1 mg/LDissolved Potassium (K) 2006/06/12 <1 mg/LDissolved Silicon (Si) 2006/06/12 <0.05 mg/LDissolved Sodium (Na) 2006/06/12 <0.05 mg/LDissolved Strontium (Sr) 2006/06/12 <0.001 mg/LDissolved Sulphur (S) 2006/06/12 <0.1 mg/LDissolved Tin (Sn) 2006/06/12 <0.02 mg/LDissolved Titanium (Ti) 2006/06/12 <0.003 mg/LDissolved Vanadium (V) 2006/06/12 <0.005 mg/LDissolved Zinc (Zn) 2006/06/12 <0.005 mg/LDissolved Zirconium (Zr) 2006/06/12 <0.005 mg/L
RPD Dissolved Calcium (Ca) 2006/06/12 0.6 % 25Dissolved Magnesium (Mg) 2006/06/12 0.4 % 25
1162126 DJ MATRIX SPIKE Dissolved Arsenic (As) 2006/06/12 105 % 75 - 125Dissolved Cadmium (Cd) 2006/06/12 106 % 75 - 125Dissolved Chromium (Cr) 2006/06/12 108 % 75 - 125Dissolved Cobalt (Co) 2006/06/12 103 % 75 - 125Dissolved Copper (Cu) 2006/06/12 106 % 75 - 125Dissolved Lead (Pb) 2006/06/12 97 % 75 - 125Dissolved Selenium (Se) 2006/06/12 115 % 75 - 125Dissolved Thallium (Tl) 2006/06/12 94 % 75 - 125
SPIKE Dissolved Arsenic (As) 2006/06/12 105 % 75 - 125Dissolved Cadmium (Cd) 2006/06/12 101 % 75 - 125Dissolved Chromium (Cr) 2006/06/12 109 % 75 - 125Dissolved Cobalt (Co) 2006/06/12 105 % 75 - 125Dissolved Copper (Cu) 2006/06/12 110 % 75 - 125Dissolved Lead (Pb) 2006/06/12 99 % 75 - 125Dissolved Selenium (Se) 2006/06/12 104 % 75 - 125Dissolved Thallium (Tl) 2006/06/12 95 % 75 - 125
BLANK Dissolved Aluminum (Al) 2006/06/12 <1 ug/LDissolved Antimony (Sb) 2006/06/12 <1 ug/LDissolved Arsenic (As) 2006/06/12 <1 ug/LDissolved Cadmium (Cd) 2006/06/12 <0.1 ug/LDissolved Chromium (Cr) 2006/06/12 <1 ug/LDissolved Cobalt (Co) 2006/06/12 <0.5 ug/LDissolved Copper (Cu) 2006/06/12 <0.2 ug/LDissolved Lead (Pb) 2006/06/12 <0.5 ug/LDissolved Lithium (Li) 2006/06/12 <2 ug/LDissolved Selenium (Se) 2006/06/12 <1 ug/LDissolved Silver (Ag) 2006/06/12 <0.1 ug/LDissolved Thallium (Tl) 2006/06/12 <0.1 ug/LDissolved Uranium (U) 2006/06/12 <0.1 ug/L
Burnaby: 8577 Commerce Court V5A 4N5 Telephone(604) 444-4808 Fax(604) 444-4511Page 10 of 12

CEMIAttention: Rik Vos Client Project #: 0610P.O. #: 145Site Reference:
Quality Assurance Report (Continued)Maxxam Job Number: VA624486
QA/QC DateBatch AnalyzedNum Init QC Type Parameter yyyy/mm/dd Value Recovery Units QC Limits
1162126 DJ RPD Dissolved Antimony (Sb) 2006/06/12 NC % 25Dissolved Arsenic (As) 2006/06/12 NC % 25Dissolved Cadmium (Cd) 2006/06/12 NC % 25Dissolved Cobalt (Co) 2006/06/12 NC % 25Dissolved Copper (Cu) 2006/06/12 NC % 25Dissolved Lead (Pb) 2006/06/12 NC % 25Dissolved Selenium (Se) 2006/06/12 NC % 25Dissolved Silver (Ag) 2006/06/12 NC % 25Dissolved Thallium (Tl) 2006/06/12 NC % 25Dissolved Uranium (U) 2006/06/12 8.9 % 25
1162561 GS2 MATRIX SPIKE Dissolved Mercury (Hg) 2006/06/13 112 % 70 - 130QC STANDARD Dissolved Mercury (Hg) 2006/06/13 100 % 80 - 120SPIKE Dissolved Mercury (Hg) 2006/06/13 109 % 80 - 120BLANK Dissolved Mercury (Hg) 2006/06/13 <0.05 ug/LRPD Dissolved Mercury (Hg) 2006/06/13 NC % 25
1162627 GS2 MATRIX SPIKE Total Mercury (Hg) 2006/06/13 114 % 70 - 130QC STANDARD Total Mercury (Hg) 2006/06/13 98 % N/ASPIKE Total Mercury (Hg) 2006/06/13 105 % 80 - 120BLANK Total Mercury (Hg) 2006/06/13 <0.05 ug/LRPD Total Mercury (Hg) 2006/06/13 NC % 25
1163103 KL1 MATRIX SPIKE Total Manganese (Mn) 2006/06/13 108 % 80 - 120Total Zinc (Zn) 2006/06/13 110 % 80 - 120
SPIKE Total Manganese (Mn) 2006/06/13 102 % 80 - 120Total Zinc (Zn) 2006/06/13 101 % 80 - 120
BLANK Total Barium (Ba) 2006/06/13 <0.001 mg/LTotal Beryllium (Be) 2006/06/13 <0.0002 mg/LTotal Bismuth (Bi) 2006/06/13 <0.05 mg/LTotal Boron (B) 2006/06/13 <0.008 mg/LTotal Calcium (Ca) 2006/06/13 <0.05 mg/LTotal Iron (Fe) 2006/06/13 <0.005 mg/LTotal Magnesium (Mg) 2006/06/13 <0.05 mg/LTotal Manganese (Mn) 2006/06/13 <0.001 mg/LTotal Molybdenum (Mo) 2006/06/13 <0.005 mg/LTotal Nickel (Ni) 2006/06/13 <0.008 mg/LTotal Phosphorus (P) 2006/06/13 <0.1 mg/LTotal Potassium (K) 2006/06/13 <1 mg/LTotal Silicon (Si) 2006/06/13 <0.05 mg/LTotal Sodium (Na) 2006/06/13 <0.05 mg/LTotal Strontium (Sr) 2006/06/13 <0.001 mg/LTotal Sulphur (S) 2006/06/13 <0.1 mg/LTotal Tin (Sn) 2006/06/13 <0.02 mg/LTotal Titanium (Ti) 2006/06/13 <0.003 mg/LTotal Vanadium (V) 2006/06/13 <0.005 mg/LTotal Zinc (Zn) 2006/06/13 <0.005 mg/LTotal Zirconium (Zr) 2006/06/13 <0.005 mg/L
RPD Total Barium (Ba) 2006/06/13 9.5 % 25Total Beryllium (Be) 2006/06/13 NC % 25Total Bismuth (Bi) 2006/06/13 NC % 25Total Boron (B) 2006/06/13 14.5 % 25Total Calcium (Ca) 2006/06/13 9.6 % 25Total Iron (Fe) 2006/06/13 9.3 % 25Total Magnesium (Mg) 2006/06/13 9.6 % 25Total Manganese (Mn) 2006/06/13 9.6 % 25Total Molybdenum (Mo) 2006/06/13 NC % 25Total Nickel (Ni) 2006/06/13 NC % 25Total Phosphorus (P) 2006/06/13 NC % 25
Burnaby: 8577 Commerce Court V5A 4N5 Telephone(604) 444-4808 Fax(604) 444-4511Page 11 of 12
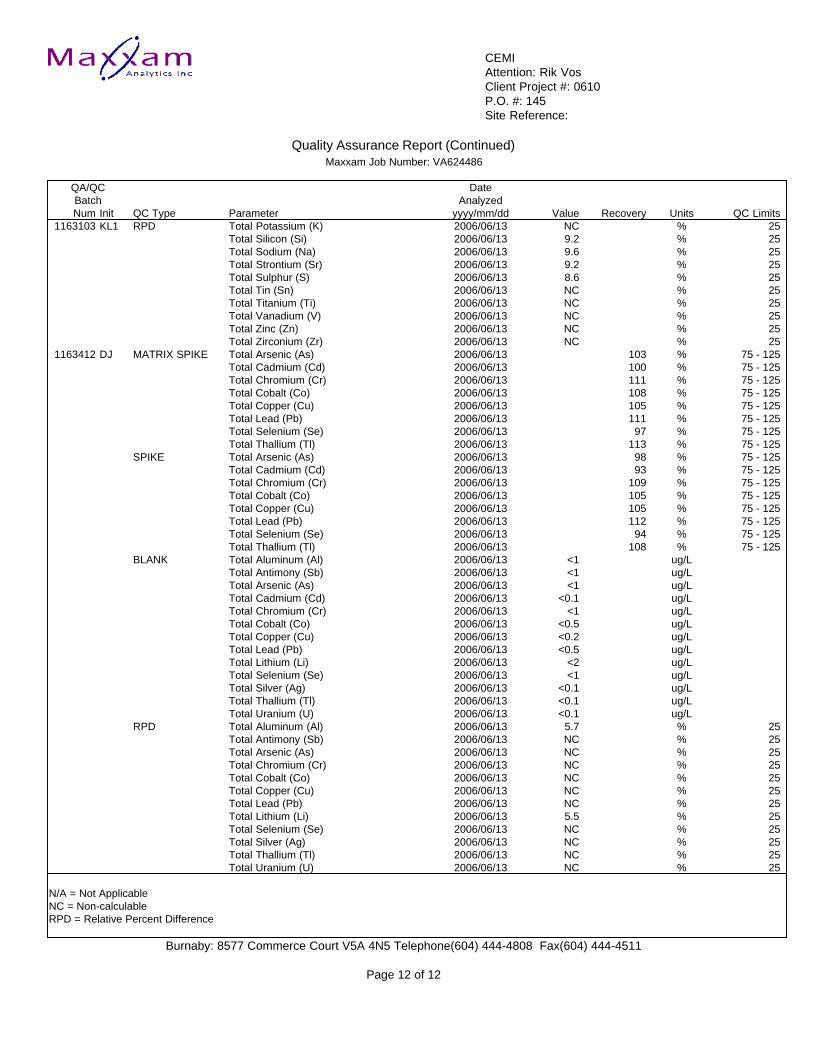
CEMIAttention: Rik Vos Client Project #: 0610P.O. #: 145Site Reference:
Quality Assurance Report (Continued)Maxxam Job Number: VA624486
QA/QC DateBatch AnalyzedNum Init QC Type Parameter yyyy/mm/dd Value Recovery Units QC Limits
1163103 KL1 RPD Total Potassium (K) 2006/06/13 NC % 25Total Silicon (Si) 2006/06/13 9.2 % 25Total Sodium (Na) 2006/06/13 9.6 % 25Total Strontium (Sr) 2006/06/13 9.2 % 25Total Sulphur (S) 2006/06/13 8.6 % 25Total Tin (Sn) 2006/06/13 NC % 25Total Titanium (Ti) 2006/06/13 NC % 25Total Vanadium (V) 2006/06/13 NC % 25Total Zinc (Zn) 2006/06/13 NC % 25Total Zirconium (Zr) 2006/06/13 NC % 25
1163412 DJ MATRIX SPIKE Total Arsenic (As) 2006/06/13 103 % 75 - 125Total Cadmium (Cd) 2006/06/13 100 % 75 - 125Total Chromium (Cr) 2006/06/13 111 % 75 - 125Total Cobalt (Co) 2006/06/13 108 % 75 - 125Total Copper (Cu) 2006/06/13 105 % 75 - 125Total Lead (Pb) 2006/06/13 111 % 75 - 125Total Selenium (Se) 2006/06/13 97 % 75 - 125Total Thallium (Tl) 2006/06/13 113 % 75 - 125
SPIKE Total Arsenic (As) 2006/06/13 98 % 75 - 125Total Cadmium (Cd) 2006/06/13 93 % 75 - 125Total Chromium (Cr) 2006/06/13 109 % 75 - 125Total Cobalt (Co) 2006/06/13 105 % 75 - 125Total Copper (Cu) 2006/06/13 105 % 75 - 125Total Lead (Pb) 2006/06/13 112 % 75 - 125Total Selenium (Se) 2006/06/13 94 % 75 - 125Total Thallium (Tl) 2006/06/13 108 % 75 - 125
BLANK Total Aluminum (Al) 2006/06/13 <1 ug/LTotal Antimony (Sb) 2006/06/13 <1 ug/LTotal Arsenic (As) 2006/06/13 <1 ug/LTotal Cadmium (Cd) 2006/06/13 <0.1 ug/LTotal Chromium (Cr) 2006/06/13 <1 ug/LTotal Cobalt (Co) 2006/06/13 <0.5 ug/LTotal Copper (Cu) 2006/06/13 <0.2 ug/LTotal Lead (Pb) 2006/06/13 <0.5 ug/LTotal Lithium (Li) 2006/06/13 <2 ug/LTotal Selenium (Se) 2006/06/13 <1 ug/LTotal Silver (Ag) 2006/06/13 <0.1 ug/LTotal Thallium (Tl) 2006/06/13 <0.1 ug/LTotal Uranium (U) 2006/06/13 <0.1 ug/L
RPD Total Aluminum (Al) 2006/06/13 5.7 % 25Total Antimony (Sb) 2006/06/13 NC % 25Total Arsenic (As) 2006/06/13 NC % 25Total Chromium (Cr) 2006/06/13 NC % 25Total Cobalt (Co) 2006/06/13 NC % 25Total Copper (Cu) 2006/06/13 NC % 25Total Lead (Pb) 2006/06/13 NC % 25Total Lithium (Li) 2006/06/13 5.5 % 25Total Selenium (Se) 2006/06/13 NC % 25Total Silver (Ag) 2006/06/13 NC % 25Total Thallium (Tl) 2006/06/13 NC % 25Total Uranium (U) 2006/06/13 NC % 25
N/A = Not ApplicableNC = Non-calculableRPD = Relative Percent Difference
Burnaby: 8577 Commerce Court V5A 4N5 Telephone(604) 444-4808 Fax(604) 444-4511
Page 12 of 12

Wastewater Treatability Study Report Mine Site Process Water NorthMet Project March 2007
C a n a d i a n E n v i r o n m e n t a l & M e t a l l u r g i c a l I n c .
APPENDIX C: CAS Analysis Report

ffiw !
tL1, Columbia^Z\.Analytical|5Z Services'*'An Employee - Owned Company
1317 South 13th Avenue P.0. Box 479 Kelso, Washington 98626 (360) 577-7222 (360) 636-1068 fax
July 12,2006 Service Request No: K0604871
Rik VosCanadian Environmental and Metallurgical Inc.6927 Antrim AvenueBurnaby, BC V5J 4M5
RE: Low level Hg
Dear Rik:
Enclosed are the results of the sample(s) submitted to our laboratory on June 14, 20A6. For yourreference, these analyses have been assigned our service request number K060 487I.
All analyses were performed according to our laboratory' s quality assurance program. The testresults meet requirements of the NELAC standards except as noted in the case narrative report.All results are intended to be considered in their entirety, and Columbia Analytical Services, Inc.(CAS) is not responsible for use of less than the complete report. Results apply only to the itemssubmitted to the laboratory for analysis and individual items (samples) analyzed, as listed in thereport.
Please call if you have any questions. My extension is 3358.
Respectfully submitted,
Client Services Manaser
LFVlmb Pager", l0
' f f i rNELAP Accredited ACIL Seal of Excellence Award 6 1oo"/" Recycted
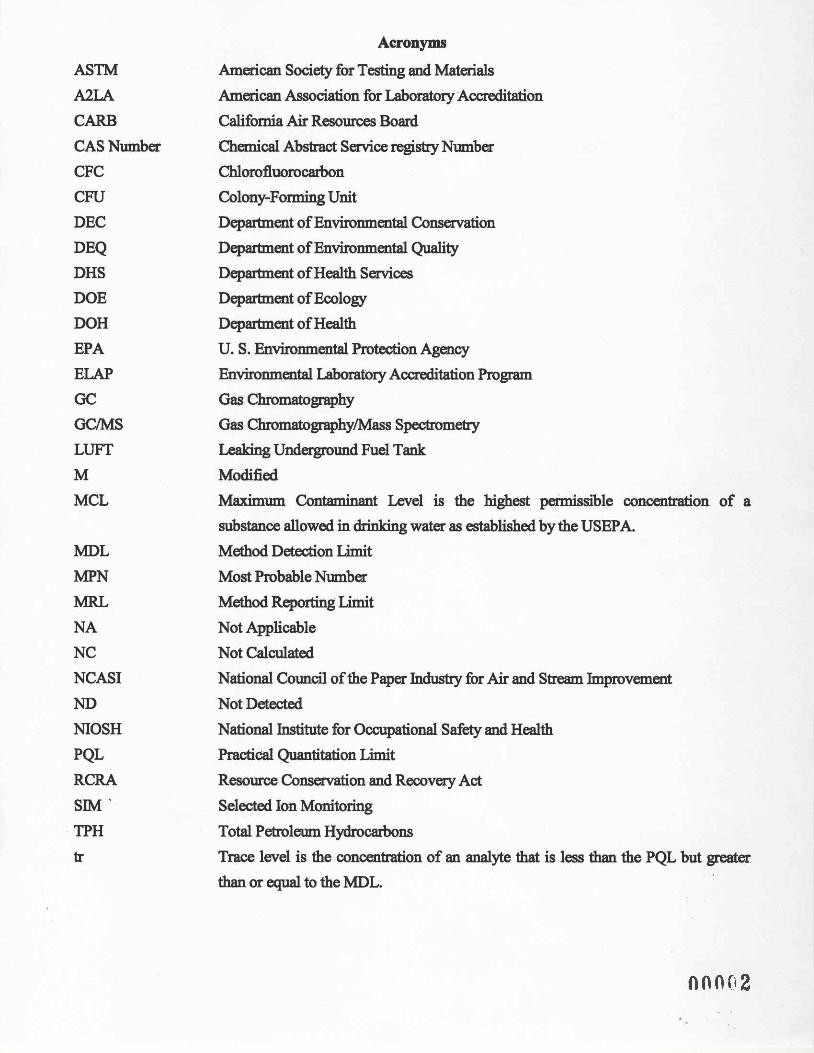
Acronyms
ASTM American Society for Testing and Materials
/JLA American Association for Laboratory Accreditation
CARB Califomia Air Resources Bomd
CAS Number Chemical Abstract Service registy Number
CFC Chlorofluorocarbon
CFU Colony-Forming Unit
DEC Deparhnent of Environmental Conservation
DEQ Departnent of Environmental QualityDHS Deparbrent of Health Services
DOE Deparbnent of Ecologz
DOH Deparbnent of Health
EPA U. S. Environmental Protection Agency
ELAP Environmental Laboratory Accreditation Program
GC Gas Chromatogra.phy
GCA{S Gas Chromatogra;phylNtfass Specfomety
LUFT Leaking Underground Fuel Tank
M Modified
MCL Maximum Contaminant kvel is the highest permissible concentration of a
substance allowed in drinking water as established by the USEPA.
MDL Method Detection Limit
MPN Most Probable Number
MRL Method Repoding Limit
NA Not Applicable
NC Not Calculated
NCASI National Council of the Paper Industry for Air and Stream Improvement
ND Not Detected
NIOSH National Institute for Occupational Safety and Health
PQL Practical Quantitation Limit
RCRA Resource Conservation and Recovery Act
SIM Selected Ion Monitoring
TPH Total Petrolzum Hydrocarbons
tr Trace lwel is the concentration of an analye that is less than the PQL but greater
than or equal to the MDL.
n n 0 0 2

Inorgrnic Data Qualiliers* The result is an outli€r. See case nalrotive.
# The c{otrol limit criterid is not applicable. See case narrative.
B The analj4e was foutrd it the associated method blank al a level that is sigtrificant rclative to the sample result
E The result is an estimate alooud because the value exc€eded the itrstom€dt calibratiot ratrge.
J Thc result is an €stimatld cono€ltratiotr tbrt is l€ss than rle MRL but greater thatr ol equal to the MDL.
U The compound was analyz€d for, but was lot detected ('Non-detect") at or above the MRLMDL.
i The MRL/MDL bas be€o elevat€d due to a Datrix interfercnce,
X See case norrative.
Metals Data Qualiliers# Tbe comrol limit criteria is rct applicable. See case narmtive.
B Tbe rEsult is atr estimat€d corcentratiotr that is less tlan the MRL but great€t tlatr or equal to theMDL.
E The percent differencp for the serial dilution was geater tha[ l0%, indicating a possible matrix interference in the sample.
M The dwlicate injection precision was not mel
N The Matrix Spike sa$ple recovery is not withitr control limifs. See case oarmtive.
S The r€port€d value was det€tmircd hy the Melhod of Stadard AddirioDs (MSA).
U The compolmd was analyzed for, but was rct dehct€d ('Non-detect,) at ol above the MRIJMDL.
W The postdig€stioo spike for fulntce AA analysis is out ofcontrol liflits, while sample abeorbance is less tlan 50% ofspikeab60roance.
i The MRL/MDL has be€n elevst€d due to a matrix hterfer€dce.
X See case narrative.* The duplicate amlysis not withitr clltol liEils. See case larative.
+ The conelation co€ffcient fo! the MSA is less than 0.995.
Organic Data Quolili€rs* The result is an outlier, See cas€ naflative.
# The c.oaol limit oir€ria is trot applicable. See case narative.
A A teotatively ideftified compound, a suspected aldol-condensatiotr producl
B The amllte rvas found in the associated method blank at a level that is significaat r€lative to the sample result.
C The anabte was qualitaiivoly co!.fiImed usitrg GCA{S t€chniques, pattem recogtrition, or by compariq to historical data.
D The rcported ftsult is from a dilution.
E The rcsult is atr estimate amount because the value exceeded the instnrment calibration range.
J The result is atr estiinatEd concentration that is less than the MRL but geater tbatr or equal to tle MDL.
N The result is presunptive. The aralyte was teotatively identified, bqt a oonfrmation analysis was not perfooed"
o Tbe GC or HPLC coalfirmation criteria *'as errceeded" The relative percent diferedce is greater tlan 40olo betwe€n the two' analytical results (25% for CLP Pesticid€s).
U The coopound was aoalyzed for, but was not detected ("Nondetect") at or above the MRIA,IDL.
i The MRL/MDL has be€o elevat€d due to a chromatographic hterference.
X See case narmtive.
Additional Petroleum Hydrocarbon Specific QualiliersF The chmmatogaphic fitrgerprht of the sample matches the elution patt€m ofthe calibration staldard.
r The cbmbatographic fil1ge4ninr offte s.mple rcsembles a peholeun pmduc! but the elutiotr pattem ildicates the pres€nce of' a greater amount of lighter molecutar weight constituetrb lhan the calibratiotr statrdard
Tt The cbmmatograpbic fi4erprint oflhe sample reseorbles I petroleum Foduct, but the elutiotr pattem indioates the presence of__ a g€ater amouDt ofheavier molecular weight coDstituents than the calibratiotr standard.
O fbe chrcmatogmphic fingerprht ofthe sample resembles moil, but does not match the calibntion stand$d"
v The chromatogmphic filgerprhl oftle saDple r€sembles a petoleum product €luting ilr a!'proxiEately the corr€ct carbon- rangg but the elution pattem do€s rct match the calibration standard.
Z The cbromatographic fingerfrrht does not resemble a lretroleum floduct'
0 0 n 0 3

Client:Project:Sample Matrix:
COLUMBIA ANALYTICAL SERVICES. INC.
Analytical Report
Canadian Environmental and Metallursical Inc.
Low level Hg
Water
Mercury, Dissolved
Service Request: K0604871Date Collected: NADate Receivedt 06114106
Units: ng/LBasis: NA
Prep Method: METHODAnalysis Method: 163lETest Notes:
Sample Name
253922539325396253992540325406254242543425438Method Blank 1Method Blank 2Method Blank 3
Dilution Date DateFactor Extracted Analvzed
06/14/0606tr4t0606n4t0606tr4t0606n4/0606n4/0606tr4t0606n4t0606n4t06061r4t0606/14/0606/14/06
07trU0607trU0607lrIt0607trU0607nU0607nr/0607trr/0607lLIt0607nL/0607lrU0607/ru060t/rU06
Result
3 . 17.94.66.04 .15.43.46 . 13 .3NDNDND
ResultNotesLab Code
K0604871-001K0604871-002K0604871-003K0604871-004K0604871-00sK0604871-006K0604871-007K0604871-008K0604871-009K060487l-MB1K0604871-MB2K0604871-MB3
MRL
1.01.01 .01 .01 .01 .01 .01 .01 .01 .01 .01 .0
K060487licpjcl - Sample 0'7112/06 0 0.0^S'4
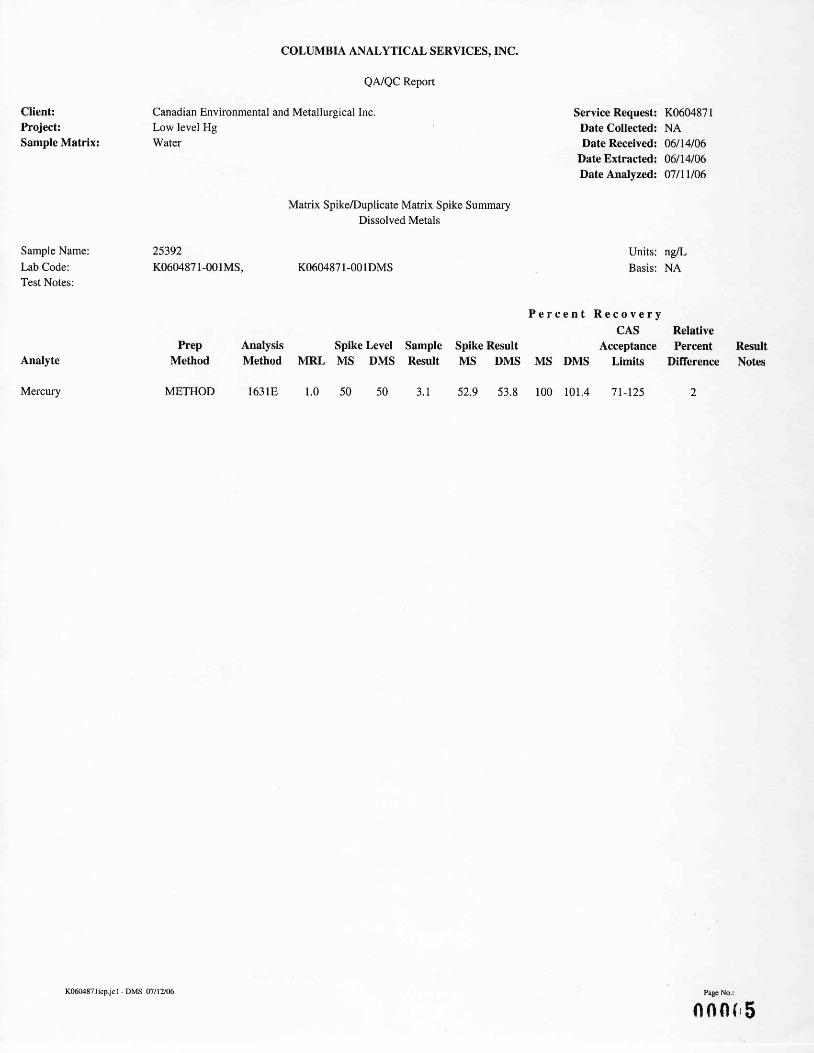
COLUMBIA ANALYTICAL SERVICES. INC.
eA./eC Reporr
Clieutr Canadian Environmental and Metallugical Inc. Servtce Requ€st: K06Ol87lProject: Low level Hg Date CoUected! NASample Matrix: Wat9l Date Receiyed: 06/14106
Date Ertrac'ted: 06/14106Date A.nslvzed: 07/l l/06
Matrix Spike/Duplicate Matrix Spike SummaryDissolved Metals
SampleName: 25392 Udts: ng/LLab Code: K0604871-001MS, K0604871-00IDMS , Basis: NATest Notes:
P e r c € n t R e c o v e r yCAS Relrtive
Prep Analysis Splke Level Ssmple Spike Result Acc€ptance Pcrceat R€sultAnalyte Method Method MRL MS DMS R€sult MS DMS MS DMS Llmits Dlfference Noteg
Mercury METHOD 1631E 1.0 50 50 3.1 52.9 53.8 100 101.4 7l-125 2
Page No.:
{ 1 0 0 { i 5K060487licpjcl - DMS 07/12106

COLUMBIA ANALYTICAL SERVICES, INC.
QA./QC Report
Cllent: Canadian Environmental aod Metallwgical loc. Service Request K06M871Project: Low level Hg Datc Collected: NALCS Matrlx: water Date Recelved: NA
Date Extracted: 06/14106Date Analyzed: 07/11/06
Ongoing Precision and Recovery (OPR) Sample SummaryTotal Metals
Sample Name: Ongoing Precision and Recovery (Initial) Units: ry/LBasis: NA
Test Notes:
Analyte
Mercury
Prep Analysis True
CASPercent
RecoveryPercent Acceptance Result
Method Method Value Result Recovery Limits Notes
METHOD 1631E 5.00 5.81 r 16 77-t23
Page No.:
n0nf lEK060487licpjcl - OPR (lcsw) 0'l112106

COLUMBIA ANALYTICAL SERVICES, INC.
QA/QC Report
Clienl Canadian Environmental aod Metallurgical Inc. Service Request: K0604871Project Low levelHg Date Collectedt NALCS Matrix: Water Date Received: NA
Date Extracted: 06/14106Date Analyzed: 07/l U06
Ongoing Precision and Recovery (OPR) Sample SummaryTotal Metals
Sample Name: Ongoing Precision and Recovery (Final) Units: ng/LBasis: NA
Test Noles:
Analyte
Mercury
Prep Analysis True
CASPercent
RecoveryPercent Acceptance Result
Method Method Value Result Recovery Limits Notes
METHOD 1631E 5.00 5.44 109 77-123
Page No.:
n 0 n 0 ?K060487licpjcl - OPR (lcsw) (2) 07112106
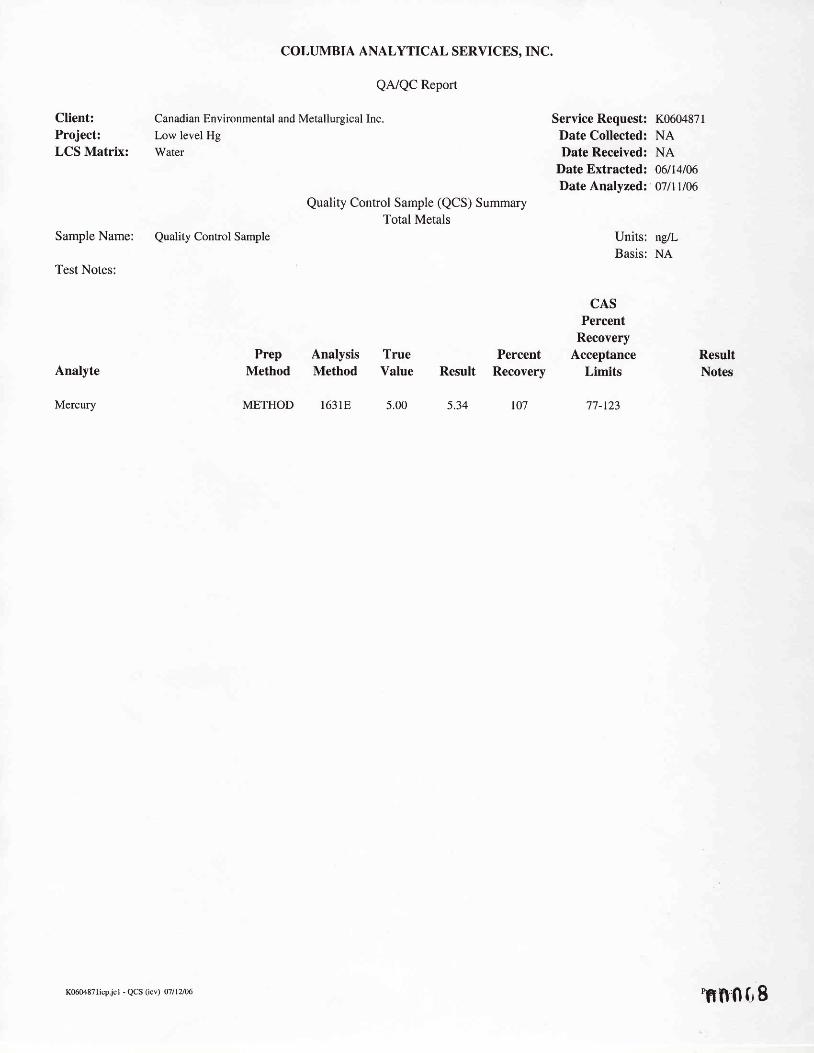
Analyte
Mercury
COLUMBIA ANALYTICAL SERVICES, INC.
QA/QC Report
Client: Canadian Environmental and Metallurgical Inc.
Project: Low level Hg
LCS Matrix: Water
Quality Control Sample (QCS) SummaryTotal Metals
Sample Name: Quality Control Sample
Test Notes:
Service Request: K0604871Date Collected: NADate Received: NA
Date Extractedz 06114106Date Analyzedt 07lLll06
Units: ngtLBasis: NA
CASPercent
RecoveryPercent Acceptance Result
NotesPrep Analysis True
Method Method Value Result Recoverv Limits
METHOD 1631E 5.00 5.34 tO7 77-123
K060487licpjcl - QCS (icv) 07lL2l06 'Hll'0 f,, 8

TO. Cst-ut'dtsttu A$Jftn*y"d-161'ftL SERuueF=,q.
t3t-7 S. 6{q AveKEuq,o r r^!4 18gzs
A1'T^J I 4.8ts !f SPt€l L'.:-.*+/
D a t e : q ' L ' n e q u z . c , o 6
Purchase Order No . t:, t 0T4
SHIP TO: CEMI1636 West 75th Ave.Vancouver, BCV6P 6G2
Tel: 604-264-5536Fax: 604-264-5535email: [email protected]
Materials and/or Services requested on this Release Form are subject to the terms and conditions included and describedon the Purchase Order referenced above.
ITEM QUANTITY DESCRIPTION
I q SA*,,ltpUt \ t.l*."
253q2 253X3 >531625�?.1^t c 5 . 4 D 3 254CI6
25t+Zq 2r�434 25+38
Y A4l trae LdNbJ LEVEL /t{EBCuF V
ArAJkr-ysrS
Requested by: Project Code '. 06 16 ?"tY*sf wrTTQuotation # :Date required by:

Columbia Analytical Services fnc.Cooler Receipt and Preservation Form
/ vlv0/+
PC uv7/
Project/Client
Cooler received on and opened on
1. Were custody seals on outside of coolers?
If yes, how many and where?.
Were custody seals intact?
Were signature and date present on the custody seais?
Is the shipper's airbitl available and filed? If no, record airbill number:
Vkq{s. bV rr#r*gfltAl Service Request K06,
2.
J .
4.
Y
Yg
- u.y/ / " f
+usc+fibff{
.p
0aN
Y
coc#Temperature of cooler(s) upon receipfi ("C)
Temperature Blank fC)
t u , pq.ltr
6.
7.
8.
9 .
1 0 .
1 1 .
1 )
1 3 .
14 .
1 5 .
r6.
Y @ , -CI)=r .@' '
9 N0 N
b NO Nu ) N
J--N
2 - 6 N 2 , '
P N lffil-
17, Was Cl2lRes negative? 1-fq-
Exptain any discrep ^1""' l- Lot n* A-k*J- aW &artut (t d ' 0, { aL . 2' hat(4Aa uLI
( / ._{
/ Z ' ?Were samples hand delivered on ttre same day as collection?
Were custody papers properly filled out (inh signed, etc.)?
Type of packing material present
Did all bottles arrive in good condition (unbroken)?
Were all bottle labels complete (i.e analysis, preservation, etc.)?
Did all bottle labels and tags agree with custody papers?
Were the correct types of bottles used for the tests indicated?
Were all of the preserved bottles received at the lab with the appropriate pH?
Were VOA. vials checked for absence of air bubbles, and if preseff, noted below?
Were the 163l Mercury bottles checked for absence of air bubbles, and if present noted below?
Did the bottles originate from CAS/I( or a branch laboratory?
Are CWA Microbiology samples received with >ll2 the24hr. hold time remaining from collection?
RESOLUTION:
Samples that required preservation or received out of temperature:
Sample lD Reaqent Volume Lot Number Bottle TvpeRec'd out ofTemperahrre lnit ials
f i n n 1 0

Appendix D
Review of Dunka Wetlands Treatment Performance

RS29T D-i
Appendix D Review of Dunka Treatment Wetland Performance
Table of Contents
1.0 LTVSMC Dunka Mine Background......................................................................................... D-1
2.0 Treatment Wetland Performance Data ..................................................................................... D-1 2.1 Dunka Mine Seep 051 (SD005) Treatment Performance .................................................. D-1 2.2 Dunka Mine Seep 041 (SD007) Treatment Performance .................................................. D-2 2.3 Dunka Mine Seep 043 (SD008) Treatment Performance .................................................. D-3 2.4 Dunka Mine Seep 044 (SD009) Treatment Performance .................................................. D-4
3.0 Conclusions ............................................................................................................................. D-4 3.1 Design Considerations Applied to the Dunka Mine Wetlands .......................................... D-5
3.1.1 Successes....................................................................................................................D-5 3.1.2 Failures.......................................................................................................................D-6 3.1.3 Lessons Learned.........................................................................................................D-6

RS29T D-ii
List of Tables
Table D1 Sulfate Reduction and Carbon Utilization Requirements for Metals Removal by the Dunka Mine Wetlands
List of Figures
Figure D1 Cumulative Metals Storage, SD005
Figure D2 Influent and Effluent Copper Concentrations, SD005
Figure D3 Influent and Effluent Cobalt Concentrations, SD005
Figure D4 Influent and Effluent Zinc Concentrations, SD005
Figure D5 Influent and Effluent Nickel Concentrations, SD005
Figure D6 Sulfate Removal, SD005
Figure D7 Calcium, Magnesium, and Sulfate Storage, SD005
Figure D8 Cumulative Metals Storage, SD007
Figure D9 Influent and Effluent Copper Concentrations, SD007
Figure D10 Influent and Effluent Cobalt Concentrations, SD007
Figure D11 Influent and Effluent Zinc Concentrations, SD007
Figure D12 Influent and Effluent Nickel Concentrations, SD007
Figure D13 Sulfate Removal, SD007
Figure D14 Calcium, Magnesium, and Sulfate Storage, SD007
Figure D15 Cumulative Metals Storage, SD008
Figure D16 Influent and Effluent Copper Concentrations, SD008
Figure D17 Influent and Effluent Cobalt Concentrations, SD008
Figure D18 Influent and Effluent Zinc Concentrations, SD008
Figure D19 Influent and Effluent Nickel Concentrations, SD008
Figure D20 Sulfate Removal, SD008
Figure D21 Calcium, Magnesium, and Sulfate Storage, SD008
Figure D22 Cumulative Metals Storage, SD009
Figure D23 Influent and Effluent Copper Concentrations, SD009
Figure D24 Influent and Effluent Cobalt Concentrations, SD009
Figure D25 Influent and Effluent Zinc Concentrations, SD009
Figure D26 Influent and Effluent Nickel Concentrations, SD009
Figure D27 Sulfate Removal, SD009
Figure D28 Calcium, Magnesium, and Sulfate Storage, SD009

RS29T D-1
1.0 LTVSMC Dunka Mine Background LTVSMC conducted an open pit taconite mining operation at the Dunka Mine north of Babbitt,
Minnesota. This operation resulted in the mining of a considerable amount of surface and rock
overburden, which was stockpiled on the site. In the 1970s, surface water seeps from these
stockpiles presented water quality issues due to elevated levels of copper, zinc, cobalt, nickel, and
sulfate. These water quality issues are also of concern for NorthMet.
At the Dunka Mine, constructed wetlands treat several of the seeps prior to discharge in accordance
with an existing NPDES permit. The site also has a lime precipitation unit capable of treating
350 gpm of wastewater as a backup treatment option. Operational data for four of the wetland
treatment systems has been summarized and is discussed in the context of wetland treatment
performance in the following sections. In previous work (Eger et al., 20001), long-term performance
of two of the wetlands (SD005 and SD009) was evaluated based on measurement of metals
concentrations in wetland sediments/media. This work builds upon the results reported in the Eger
study, using data collected from 2000 through 2005. Performance of each of the four constructed
wetlands was evaluated by comparing influent and effluent concentrations of target constituents.
Additionally, mass balances were performed and the storage capacity of each wetland was computed
for various constituents. It should be noted that mass balances were performed assuming equal
volumetric inflow and outflow from the wetland. In actuality, the inflow and outflow differ due to
precipitation received by the wetland, groundwater inputs, and evapotranspiration in the wetland.
2.0 Treatment Wetland Performance Data
2.1 Dunka Mine Seep 051 (SD005) Treatment Performance The wetland receiving water from Seep 051 is approximately 1.8 ha in area and consists of sequential
wetland cells separated by earthen berms. Some of the berms are “underflow” berms (Eger et al.,
2000), which implies that some of the cells are operated as vertical, sub-surface flow (SSF) wetlands.
The wetland substrate is Sphagnum peat, and the system is vegetated with emergent wetland plants
(mostly cattail). Portions of the wetland cells are submerged, while other portions are not.
This wetland has been very effective in removing metals, providing a net sink for nickel, copper,
zinc, and cobalt for the duration of the study period and accumulating approximately 89, 4.5, 2.3, and
1 References cited in Appendix D are listed in Section 8 of RS29T.

RS29T D-2
1.0 lb/ha for each of these metals, respectively (Figure D1). Complete removal of copper (Figure
D2), and cobalt (Figure D3) was typically achieved throughout the treatment season. Zinc removal
was typically complete (Figure D4), although effluent zinc concentrations were more variable than
copper and cobalt. Nickel removal was variable (Figure D5), generally greater than 50 percent, and
showed seasonal variability with minimum effluent concentrations occurring around August.
The trends in copper, zinc, nickel, and cobalt accumulation were similar, suggesting that all four
metals are removed by the same mechanism in the wetland. Copper, cobalt, and zinc were removed
more completely by the wetland than nickel. This is consistent with the relative magnitudes of the
solubility products for these metal sulfides (see Table 5 of the RS29T report).
The wetland also transformed non-metal parameters including sulfate, calcium, and magnesium.
Sulfate removal (Figure D6) was highly variable, generally poor, and showed no apparent seasonal
trends. The wetland acted as an overall source for sulfate (Figure D7), releasing 30,000 pounds of
sulfate per hectare of wetland area over the 5-year study period. It may also be possible that the
wetland received other sulfate inputs (i.e., surface or sub-surface flows) that were not quantified over
this period. The wetland acted as a sink for calcium and magnesium (Figure D7), accumulating
22,000 and 17,000 lb/ha of these parameters, respectively. The rates of calcium and magnesium
accumulation were relatively constant throughout the study period. Copper, nickel, zinc, and cobalt
accumulated differently from calcium and magnesium, suggesting that calcium and magnesium
accumulate via a different mechanism. It is likely that calcium and magnesium retention occurs via
ion exchange/plant uptake, while copper, cobalt, zinc, and nickel retention occurs via sulfide
precipitation.
The sulfate-releasing behavior of the wetland apparently confounds the notion of metals removal via
sulfide precipitation. However, only a small fraction of the available sulfur in the waste stream was
required to precipitate the metals. Thus, the apparent sulfate-releasing behavior of the wetland may
be an artifact of the assumption that inflow equals outflow. It may also be possible that the wetland
received other sulfate inputs (i.e., surface or sub-surface flows) that were not quantified over this
period.
2.2 Dunka Mine Seep 041 (SD007) Treatment Performance The wetland receiving water from Seep 041 is approximately 2.5 ha in area.
RS29T D-3
The wetland acted as a net sink for cobalt, copper, and zinc, but was a net source for nickel from
February 2002 through the end of the study (Figure D8). Copper, zinc, and cobalt accumulated to
9.3, 12.4, and 1.1 lb/ha, respectively. Nickel released from the wetland amounted to 35 lb/ha. As
shown in the graphs, copper and cobalt removal in this wetland (Figures D9 and D10, respectively)
was generally greater than 30 percent, but was subject to significant seasonal variation. Minimum
effluent copper and cobalt concentrations occurred around August. Zinc removal was highly variable
and, in many instances poor (Figure D11). No seasonal trends with respect to zinc removal are
apparent. Nickel removal was very poor, with effluent nickel concentrations often exceeding the
input (Figure D12).
Sulfate removal was highly variable and showed no apparent seasonal trends (Figure D13). The
wetland was a net sink of sulfate (Figure D14), accumulating 10,000 lbs/ha. On two occasions
(February 2002 and September 2002) sulfate was released from the wetland. While the wetland
accumulated calcium and magnesium (Figure D14, 9,600 lb/ha and 8,600 lb/ha, respectively), the
accumulation rates were more erratic than observed at Seep 051 wetland.
As with the Seep 051 wetland, metal sulfide precipitation is likely the primary removal mechanism in
this wetland. The onset of nickel release coincided with a release of sulfate around February 2002.
While the reason for impaired sulfate-reducing activity is unknown, a subsequent reduction in sulfide
concentrations in the wetland may have resulted in the preferential release of nickel over the other
metals. This is consistent with the differences in the solubility products of the metal sulfides
outlined in Table 5 of the RS29T report. Despite the apparent recovery of sulfate-reducing activity,
the wetland continued to act as a nickel source. Elevated concentrations of iron (data not shown)
were also detected in wetland effluent concurrent with the onset of nickel release.
While copper, cobalt, and zinc were retained in the wetland, their removal from the seepage stream
was less complete than observed at the Seep 051 wetland. This may be reflective of sulfide-limiting
conditions within the wetland.
2.3 Dunka Mine Seep 043 (SD008) Treatment Performance The wetland receiving water from Seep 043 is about 1.1 ha in area.
The wetland acted as a sink for nickel, copper, and cobalt, accumulating 13, 12.8, and 4.1 lb/ha of
these metals, respectively (Figure D15). However, the wetland acted as a source of zinc in the
amount of 31 lb/ha. Copper and cobalt removal in this wetland was generally complete (Figures D16

RS29T D-4
and D17, respectively). No seasonal variations in copper or cobalt removal were observed. Zinc and
nickel removal (Figures D18 and D19, respectively) was variable. Zinc and nickel removal exhibited
seasonal trends, with minimum effluent concentrations occurring around August.
Sulfate removal was highly variable (Figure D20), with no discernable seasonal trends. The wetland
was a net sink for sulfate until June 2003, when it became a net source (Figure D21). Overall, the
wetland released 2,500 pounds of sulfate per hectare over the course of the study period. The
wetland was a source of calcium in the amount of 1,200 lb/ha, and a sink for 500 lb/ha of magnesium
(Figure D20).
This wetland differs from Seep 051 and Seep 041 in that it is a source of calcium and zinc.
Moreover, the zinc release apparently is not associated with a concomitant release of sulfate. This
may be indicative of a groundwater input.
2.4 Dunka Mine Seep 044 (SD009) Treatment Performance The wetland receiving water from Seep 044 is about 0.92 ha in area and is a constructed peat bed
with limestone.
The wetland acted as a net sink for copper, cobalt, and zinc, which accumulated to 161, 30, and 167
lb/ha, respectively (Figure D22). Removal was variable for all metals, but copper, cobalt, and zinc
removal was more complete than nickel removal (Figures D23, D24, D25, and D26, respectively).
The wetland was at steady state with respect to nickel until February 2003, at which time it became a
net nickel source, releasing a total of 110 pounds of nickel per hectare.
Sulfate removal was poor (Figure D27). The wetland was a source of sulfate in the amount of 52,000
lb/ha and a net sink for calcium and magnesium at 18,000 and 16,500 lb/ha, respectively (Figure
D28).
This wetland again demonstrates the selective release of nickel over other metals concomitant with
the release of sulfate. This may be indicative of sulfide-limiting conditions within the wetland.
3.0 Conclusions The performances of four constructed wetlands used at the Dunka Mine for mine drainage treatment
were evaluated. All four wetlands were able to effectively remove copper and cobalt. Three of the
four wetlands effectively removed zinc. Two of the four wetlands effectively removed nickel.

RS29T D-5
Sulfate mass balance results for the wetlands may be of limited value. It does not seem likely that as
much as 5 tons of sulfur per year could be released per hectare of wetland area. Sulfate release could
be correlated with nickel release in some cases, but not in others.
All four wetlands were sinks for magnesium, and three wetlands were sinks for calcium. The
calcium and magnesium storage capacity of the wetlands is considerable and may be related to
uptake by vegetation and ion exchange with wetland substrate. This observation may be important,
as Minnesota surface water standards for metals are hardness-dependent. In the case of the Dunka
Mine wetlands, however, total hardness in wetland effluents is still near the 400 mg/L maximum
value for computation of the metal standards.
3.1 Design Considerations Applied to the Dunka Mine Wetlands Table D1 summarizes the estimated sulfate reduction rates and corresponding carbon utilization rates
necessary to provide sulfide for metals removal by the Dunka Mine constructed wetlands. The
sulfate received by these wetlands was significantly in excess of that required to precipitate the
metals. This excess sulfate can still reduced by the sulfate-reducing bacteria nonetheless, and
therefore exerts an additional annual carbon demand in the wetland. The total carbon demand
exerted by sulfate in the wetland is also tabulated in Table D1.
Table D1 Sulfate Reduction and Carbon Utilization Requirements for Metals Removal by the Dunka Mine Wetlands
Wetland
Required Sulfate Reduction Rate,
mol/ha/d
Carbon Required for
Sulfate Reduction to bind metals
mol/ha/d
Total Carbon Demand for
Complete Sulfate Reduction, mol/ha/d
Typical Available Carbon Supply (Vymazal, 1995,
40 percent refractory) mol/ha/d
SD005 6.6 13.2 3,500 1,400 SD007 22 44 2,300 1,400 SD008 5.2 10.3 1,600 1,400 SD009 6.7 13.4 2,600 1,400
3.1.1 Successes
Wetland SD005 successfully accumulated copper, cobalt, nickel, and zinc. This wetland has
emergent wetland vegetation (cattails) in addition to peat material. Metals removal occurred despite
the fact that this wetland was apparently a source of sulfate. Although the carbon demand for

RS29T D-6
wetland SD005 was high (3,500 mol C/ha/d), it was within the range reported for primary
productivity of freshwater wetlands (958 to 6,712 mol C/ha/d, Brinson et al., 1981).
Wetland SD008 successfully accumulated copper, cobalt, and nickel. This wetland was also a sink
for sulfate. This wetland had the lowest carbon demand of the Dunka Mine constructed wetlands
studied (1,600 mol C/ha/d), and is similar to the typical design value for carbon supply rates (1,400
mol/ha/d, Vymazal, 1995).
3.1.2 Failures
Wetland SD009, a peatland, exhibited nickel-releasing behavior. Peatlands are characterized by a
relatively low rate of primary production (~27 moles C/ha/d, Worrall et al., 2003). This is
significantly less than the range reported for other types of freshwater wetlands (958 to 6,712 moles
C/ha/d, Brinson et al., 1981). While the carbon demand exerted by sulfate in wetland SD009 (2,600
mol C/ha/d) can be reasonably supplied by most freshwater wetlands, it likely cannot be supplied by
a peatland. Thus, carbon-limiting conditions in wetland SD009 likely resulted in a decrease in
sulfate reducing activity, a decrease in porewater sulfide concentration, and subsequent dissolution of
nickel sulfides.
While wetland SD007 initially exhibited nickel-storing behavior, a sudden release of nickel occurred
during the study period. Wetland SD007 was also characterized by a much higher required sulfate
reduction rate than the other wetlands. While the onset of nickel release from wetland SD007
corresponded with a small release of sulfate, the wetland continued to release nickel despite the
apparent recovery of sulfate-reducing activity. While influent iron concentrations are unknown,
elevated effluent iron concentrations were observed concurrent with nickel release. Thus,
mobilization of iron within the wetland or changes in iron inputs may have also interfered with nickel
retention.
The release of calcium and zinc from wetland SD008 is inconsistent with any of the other wetlands.
The reason for this behavior is unknown.
3.1.3 Lessons Learned
A careful review of the results from operation of the wetland treatment systems for the Dunka Mine
suggest that peat alone may not provide sufficient carbon to support metals removal via sulfide
precipitation. Also, nickel removal is typically the limiting factor for design. Iron inputs to the

RS29T D-7
wetland may interfere with nickel retention. Wetland SD005 appears to be most effective at
removing metals from the seepage stream, thus a similar design may be most effective at NorthMet.

Figures

Figure D1: Cumulative Metals StorageSD005
0
0.5
1
1.5
2
2.5
3
3.5
4
4.5
5
4/26
/200
0
7/28
/200
0
10/2
9/20
00
1/30
/200
1
5/3/
2001
8/4/
2001
11/5
/200
1
2/6/
2002
5/10
/200
2
8/11
/200
2
11/1
2/20
02
2/13
/200
3
5/17
/200
3
8/18
/200
3
11/1
9/20
03
2/20
/200
4
5/23
/200
4
8/24
/200
4
11/2
5/20
04
2/26
/200
5
5/30
/200
5
8/31
/200
5
12/2
/200
5
3/5/
2006
Cum
ulat
ive
Cop
per,
Cob
alt,
and
Zinc
St
orag
e, lb
s/ha
0
10
20
30
40
50
60
70
80
90
100
Cum
ulat
ive
Nic
kel S
tora
ge, l
bs/h
a
Cu StorageCo StorageZn StorageNi Storage

Figure D2: Influent and Effluent Copper ConcentrationsSD005
0
10
20
30
40
50
60
70
80
4/26
/200
0
7/28
/200
0
10/2
9/20
00
1/30
/200
1
5/3/
2001
8/4/
2001
11/5
/200
1
2/6/
2002
5/10
/200
2
8/11
/200
2
11/1
2/20
02
2/13
/200
3
5/17
/200
3
8/18
/200
3
11/1
9/20
03
2/20
/200
4
5/23
/200
4
8/24
/200
4
11/2
5/20
04
2/26
/200
5
5/30
/200
5
8/31
/200
5
12/2
/200
5
3/5/
2006
Cop
per, μg
/L
Copper Input
Copper Output

Figure D3: Influent and Effluent Cobalt ConcentrationsSD005
0
5
10
15
20
25
30
35
40
45
50
4/26
/200
0
7/28
/200
0
10/2
9/20
00
1/30
/200
1
5/3/
2001
8/4/
2001
11/5
/200
1
2/6/
2002
5/10
/200
2
8/11
/200
2
11/1
2/20
02
2/13
/200
3
5/17
/200
3
8/18
/200
3
11/1
9/20
03
2/20
/200
4
5/23
/200
4
8/24
/200
4
11/2
5/20
04
2/26
/200
5
5/30
/200
5
8/31
/200
5
12/2
/200
5
3/5/
2006
Cob
alt, μg
/L
Cobalt InputCobalt Output

Figure D4: Influent and Effluent Zinc ConcentrationsSD005
0
10
20
30
40
50
60
70
80
4/26
/200
0
7/28
/200
0
10/2
9/20
00
1/30
/200
1
5/3/
2001
8/4/
2001
11/5
/200
1
2/6/
2002
5/10
/200
2
8/11
/200
2
11/1
2/20
02
2/13
/200
3
5/17
/200
3
8/18
/200
3
11/1
9/20
03
2/20
/200
4
5/23
/200
4
8/24
/200
4
11/2
5/20
04
2/26
/200
5
5/30
/200
5
8/31
/200
5
12/2
/200
5
3/5/
2006
Date
Zinc
, μg/
L
Zinc InputZinc Output

Figure D5: Influent and Effluent Nickel ConcentrationsSD005
0
200
400
600
800
1000
1200
4/26
/200
0
7/28
/200
0
10/2
9/20
00
1/30
/200
1
5/3/
2001
8/4/
2001
11/5
/200
1
2/6/
2002
5/10
/200
2
8/11
/200
2
11/1
2/20
02
2/13
/200
3
5/17
/200
3
8/18
/200
3
11/1
9/20
03
2/20
/200
4
5/23
/200
4
8/24
/200
4
11/2
5/20
04
2/26
/200
5
5/30
/200
5
8/31
/200
5
12/2
/200
5
3/5/
2006
Nic
kel, μg
/L
Nickel InputNickel Output

Figure D6: Influent and Effluent Sulfate ConcentrationsSD005
0
200
400
600
800
1000
1200
4/26
/200
0
7/28
/200
0
10/2
9/20
00
1/30
/200
1
5/3/
2001
8/4/
2001
11/5
/200
1
2/6/
2002
5/10
/200
2
8/11
/200
2
11/1
2/20
02
2/13
/200
3
5/17
/200
3
8/18
/200
3
11/1
9/20
03
2/20
/200
4
5/23
/200
4
8/24
/200
4
11/2
5/20
04
2/26
/200
5
5/30
/200
5
8/31
/200
5
12/2
/200
5
3/5/
2006
Sulfa
te, m
g/L
Sulfate InputSulfate Output

Figure D7: Calcium, Magnesium, and Sulfate StorageSD005
-50000
-40000
-30000
-20000
-10000
0
10000
20000
30000
4/26
/200
0
7/28
/200
0
10/2
9/20
00
1/30
/200
1
5/3/
2001
8/4/
2001
11/5
/200
1
2/6/
2002
5/10
/200
2
8/11
/200
2
11/1
2/20
02
2/13
/200
3
5/17
/200
3
8/18
/200
3
11/1
9/20
03
2/20
/200
4
5/23
/200
4
8/24
/200
4
11/2
5/20
04
2/26
/200
5
5/30
/200
5
8/31
/200
5
12/2
/200
5
3/5/
2006
Cum
ulat
ive
Stor
age,
lbs/
ha
Ca StorageMg StorageSO4 Storage

Figure D8: Cumulative Metals StorageSD007
0
2
4
6
8
10
12
14
4/26
/200
0
7/28
/200
0
10/2
9/20
00
1/30
/200
1
5/3/
2001
8/4/
2001
11/5
/200
1
2/6/
2002
5/10
/200
2
8/11
/200
2
11/1
2/20
02
2/13
/200
3
5/17
/200
3
8/18
/200
3
11/1
9/20
03
2/20
/200
4
5/23
/200
4
8/24
/200
4
11/2
5/20
04
2/26
/200
5
5/30
/200
5
8/31
/200
5
12/2
/200
5
3/5/
2006
Cum
ulat
ive
Cop
per,
Cob
alt a
nd Z
inc
Stor
age,
lbs/
ha
-50
-40
-30
-20
-10
0
10
20
30
Cum
ulat
ive
Nic
kel S
tora
ge, l
bs/h
a
Cu StorageCo StorageZn StorageNi Storage

Figure D9: Influent and Effluent Copper ConcentrationsSD007
0
10
20
30
40
50
60
70
80
90
4/26
/200
0
7/28
/200
0
10/2
9/20
00
1/30
/200
1
5/3/
2001
8/4/
2001
11/5
/200
1
2/6/
2002
5/10
/200
2
8/11
/200
2
11/1
2/20
02
2/13
/200
3
5/17
/200
3
8/18
/200
3
11/1
9/20
03
2/20
/200
4
5/23
/200
4
8/24
/200
4
11/2
5/20
04
2/26
/200
5
5/30
/200
5
8/31
/200
5
12/2
/200
5
3/5/
2006
Cop
per, μg
/L
Copper InputCopper Output
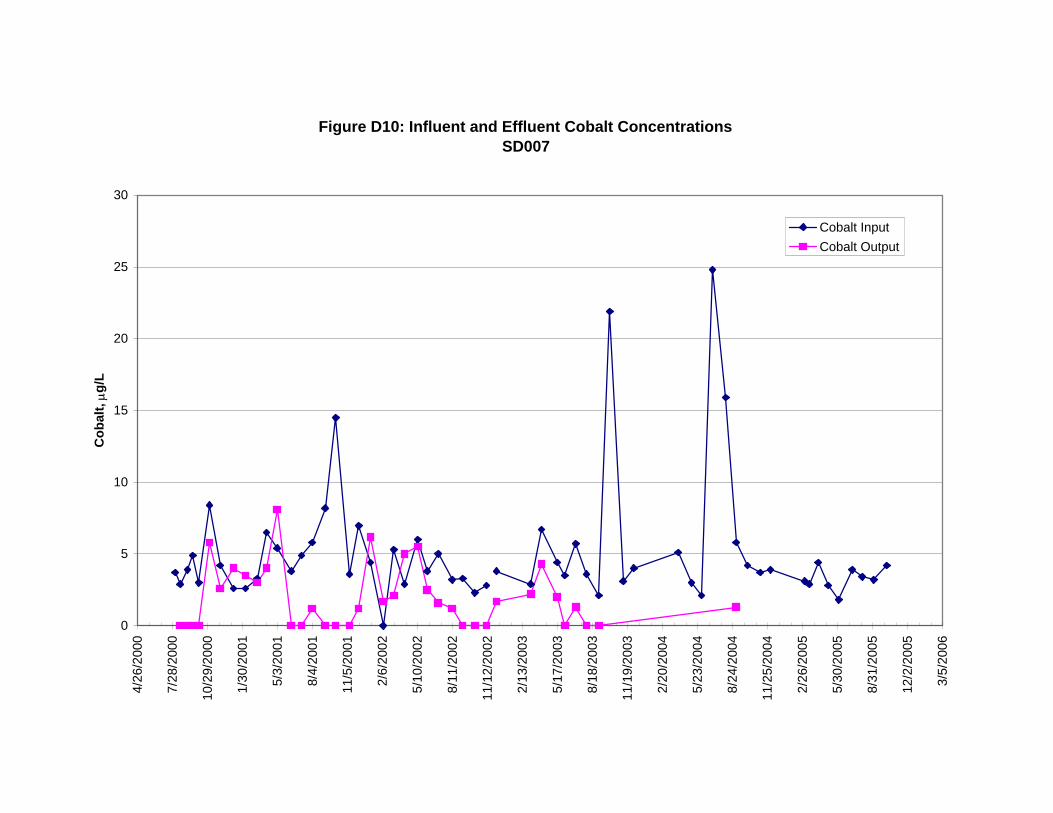
Figure D10: Influent and Effluent Cobalt ConcentrationsSD007
0
5
10
15
20
25
30
4/26
/200
0
7/28
/200
0
10/2
9/20
00
1/30
/200
1
5/3/
2001
8/4/
2001
11/5
/200
1
2/6/
2002
5/10
/200
2
8/11
/200
2
11/1
2/20
02
2/13
/200
3
5/17
/200
3
8/18
/200
3
11/1
9/20
03
2/20
/200
4
5/23
/200
4
8/24
/200
4
11/2
5/20
04
2/26
/200
5
5/30
/200
5
8/31
/200
5
12/2
/200
5
3/5/
2006
Cob
alt, μg
/L
Cobalt InputCobalt Output
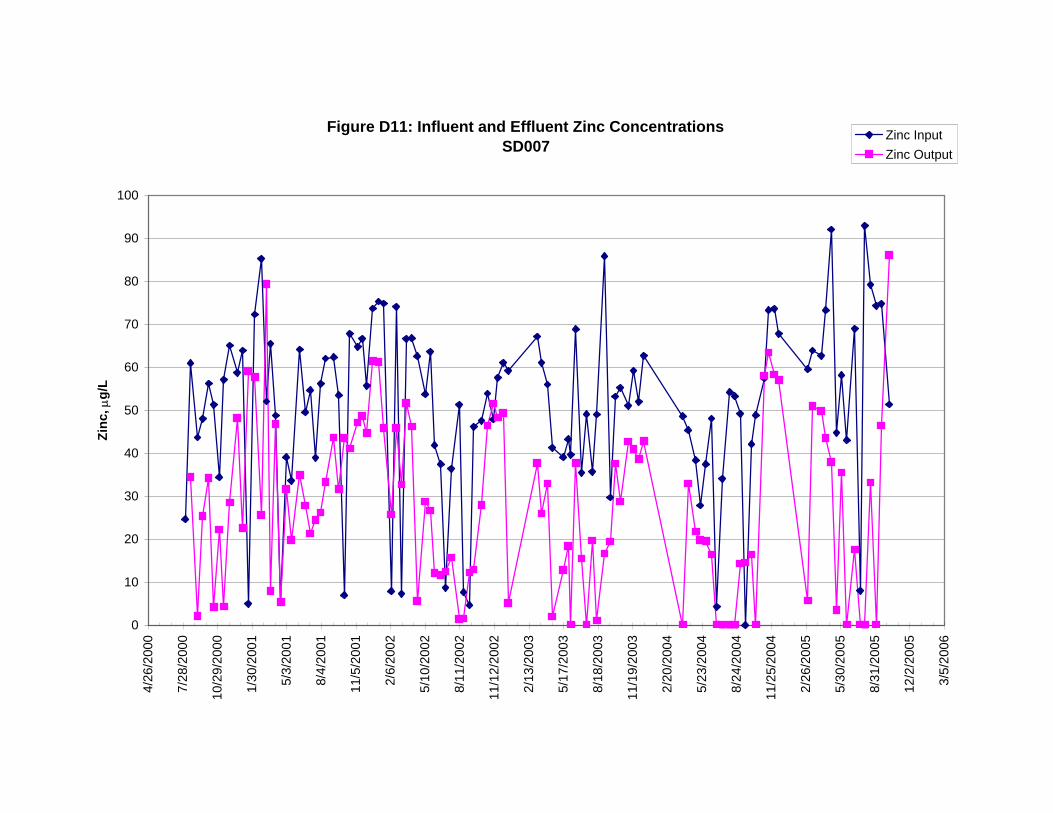
Figure D11: Influent and Effluent Zinc ConcentrationsSD007
0
10
20
30
40
50
60
70
80
90
100
4/26
/200
0
7/28
/200
0
10/2
9/20
00
1/30
/200
1
5/3/
2001
8/4/
2001
11/5
/200
1
2/6/
2002
5/10
/200
2
8/11
/200
2
11/1
2/20
02
2/13
/200
3
5/17
/200
3
8/18
/200
3
11/1
9/20
03
2/20
/200
4
5/23
/200
4
8/24
/200
4
11/2
5/20
04
2/26
/200
5
5/30
/200
5
8/31
/200
5
12/2
/200
5
3/5/
2006
Zinc
, μg/
L
Zinc InputZinc Output

Figure D12: Influent and Effluent Nickel ConcentrationsSD007
0
200
400
600
800
1000
1200
4/26
/200
0
7/28
/200
0
10/2
9/20
00
1/30
/200
1
5/3/
2001
8/4/
2001
11/5
/200
1
2/6/
2002
5/10
/200
2
8/11
/200
2
11/1
2/20
02
2/13
/200
3
5/17
/200
3
8/18
/200
3
11/1
9/20
03
2/20
/200
4
5/23
/200
4
8/24
/200
4
11/2
5/20
04
2/26
/200
5
5/30
/200
5
8/31
/200
5
12/2
/200
5
3/5/
2006
Nic
kel, μg
/L
Nickel InputNickel Output

Figure D13: Influent and Effluent Sulfate ConcentrationsSD007
0
100
200
300
400
500
600
700
800
900
4/26
/200
0
7/28
/200
0
10/2
9/20
00
1/30
/200
1
5/3/
2001
8/4/
2001
11/5
/200
1
2/6/
2002
5/10
/200
2
8/11
/200
2
11/1
2/20
02
2/13
/200
3
5/17
/200
3
8/18
/200
3
11/1
9/20
03
2/20
/200
4
5/23
/200
4
8/24
/200
4
11/2
5/20
04
2/26
/200
5
5/30
/200
5
8/31
/200
5
12/2
/200
5
3/5/
2006
Sulfa
te, m
g/L
Sulfate InputSulfate Output
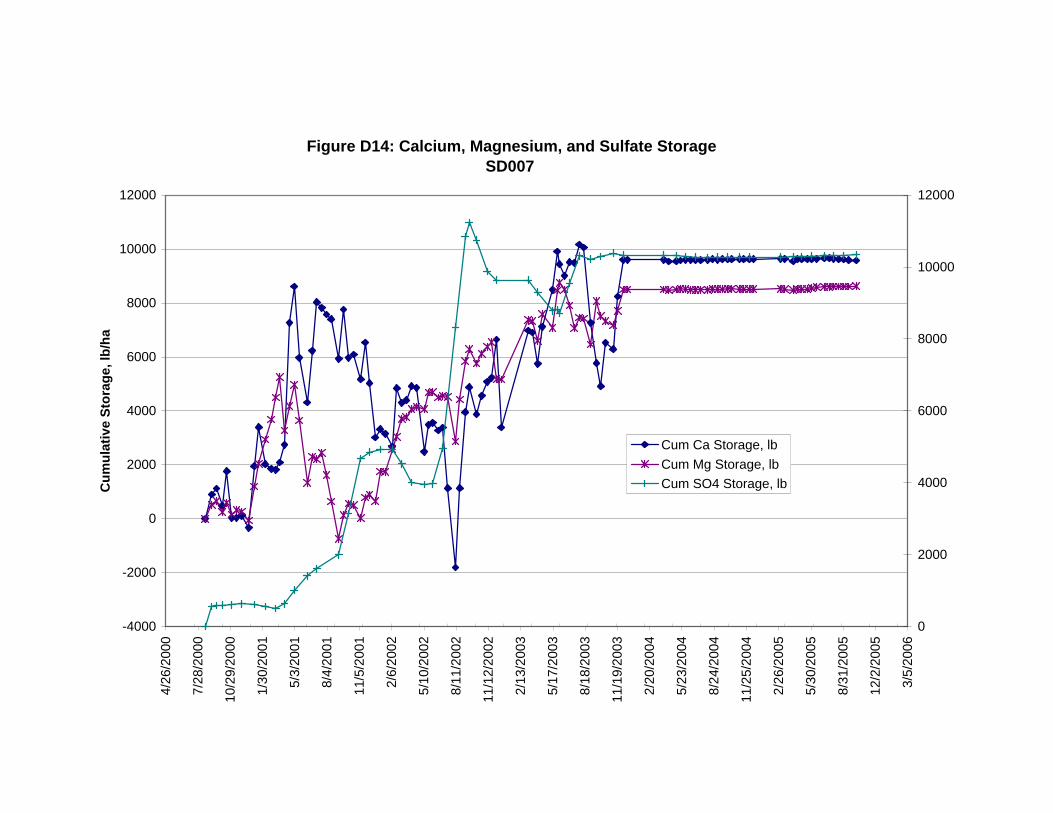
Figure D14: Calcium, Magnesium, and Sulfate StorageSD007
-4000
-2000
0
2000
4000
6000
8000
10000
12000
4/26
/200
0
7/28
/200
0
10/2
9/20
00
1/30
/200
1
5/3/
2001
8/4/
2001
11/5
/200
1
2/6/
2002
5/10
/200
2
8/11
/200
2
11/1
2/20
02
2/13
/200
3
5/17
/200
3
8/18
/200
3
11/1
9/20
03
2/20
/200
4
5/23
/200
4
8/24
/200
4
11/2
5/20
04
2/26
/200
5
5/30
/200
5
8/31
/200
5
12/2
/200
5
3/5/
2006
Cum
ulat
ive
Stor
age,
lb/h
a
0
2000
4000
6000
8000
10000
12000
Cum Ca Storage, lbCum Mg Storage, lbCum SO4 Storage, lb
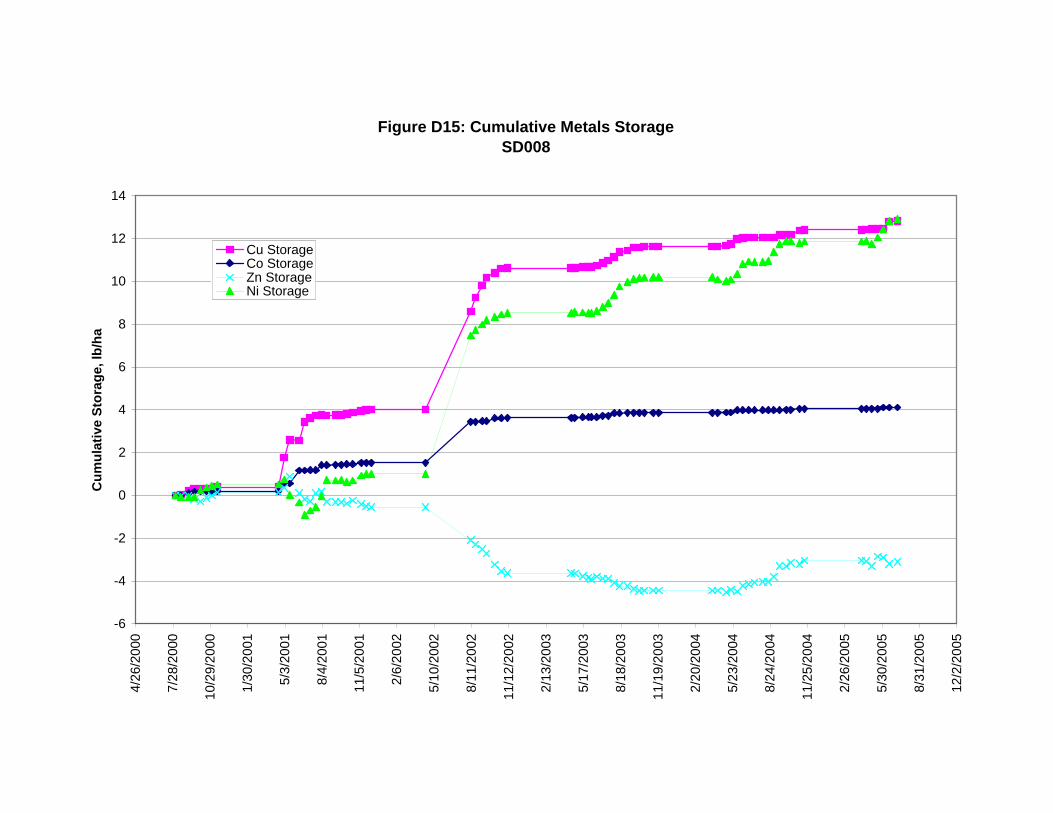
Figure D15: Cumulative Metals StorageSD008
-6
-4
-2
0
2
4
6
8
10
12
14
4/26
/200
0
7/28
/200
0
10/2
9/20
00
1/30
/200
1
5/3/
2001
8/4/
2001
11/5
/200
1
2/6/
2002
5/10
/200
2
8/11
/200
2
11/1
2/20
02
2/13
/200
3
5/17
/200
3
8/18
/200
3
11/1
9/20
03
2/20
/200
4
5/23
/200
4
8/24
/200
4
11/2
5/20
04
2/26
/200
5
5/30
/200
5
8/31
/200
5
12/2
/200
5
Cum
ulat
ive
Stor
age,
lb/h
a
Cu StorageCo StorageZn StorageNi Storage

Figure D16: Influent and Effluent Copper ConcentrationsSD008
0
100
200
300
400
500
600
700
800
900
1000
2/28/2000
6/3/2000
9/7/2000
12/13/2000
3/19/2001
6/23/2001
9/27/2001
1/2/2002
4/8/2002
7/13/2002
10/18/2002
1/22/2003
4/28/2003
8/2/2003
11/7/2003
2/11/2004
5/17/2004
8/21/2004
11/26/2004
3/2/2005
6/6/2005
9/11/2005
12/16/2005
3/22/2006C
oppe
r, μg
/L
Copper InputCopper Output

Figure D17: Influent and Effluent Cobalt ConcentrationsSD008
0
50
100
150
200
250
300
350
400
450
2/28
/200
0
6/3/
2000
9/7/
2000
12/1
3/20
00
3/19
/200
1
6/23
/200
1
9/27
/200
1
1/2/
2002
4/8/
2002
7/13
/200
2
10/1
8/20
02
1/22
/200
3
4/28
/200
3
8/2/
2003
11/7
/200
3
2/11
/200
4
5/17
/200
4
8/21
/200
4
11/2
6/20
04
3/2/
2005
6/6/
2005
9/11
/200
5
12/1
6/20
05
3/22
/200
6
Cob
alt, μg
/L
Cobalt InputCobalt Output

Figure D18: Influent and Effluent Zinc ConcentrationsSD008
0
200
400
600
800
1000
1200
4/26
/200
0
7/28
/200
0
10/2
9/20
00
1/30
/200
1
5/3/
2001
8/4/
2001
11/5
/200
1
2/6/
2002
5/10
/200
2
8/11
/200
2
11/1
2/20
02
2/13
/200
3
5/17
/200
3
8/18
/200
3
11/1
9/20
03
2/20
/200
4
5/23
/200
4
8/24
/200
4
11/2
5/20
04
2/26
/200
5
5/30
/200
5
8/31
/200
5
12/2
/200
5
3/5/
2006
Zinc
, μg/
L
Zinc InputZinc Output

Figure D19: Influent and Effluent Nickel ConcentrationsSD008
0
200
400
600
800
1000
1200
4/26
/200
0
7/28
/200
0
10/2
9/20
00
1/30
/200
1
5/3/
2001
8/4/
2001
11/5
/200
1
2/6/
2002
5/10
/200
2
8/11
/200
2
11/1
2/20
02
2/13
/200
3
5/17
/200
3
8/18
/200
3
11/1
9/20
03
2/20
/200
4
5/23
/200
4
8/24
/200
4
11/2
5/20
04
2/26
/200
5
5/30
/200
5
8/31
/200
5
12/2
/200
5
3/5/
2006
Nic
kel, μg
/L
Nickel InputNickel Output

Figure D20: Influent and Effluent Sulfate ConcentrationsSD008
0
200
400
600
800
1000
1200
1400
4/26
/200
0
7/28
/200
0
10/2
9/20
00
1/30
/200
1
5/3/
2001
8/4/
2001
11/5
/200
1
2/6/
2002
5/10
/200
2
8/11
/200
2
11/1
2/20
02
2/13
/200
3
5/17
/200
3
8/18
/200
3
11/1
9/20
03
2/20
/200
4
5/23
/200
4
8/24
/200
4
11/2
5/20
04
2/26
/200
5
5/30
/200
5
8/31
/200
5
12/2
/200
5
3/5/
2006
Sulfa
te, m
g/L
Sulfate InputSulfate Output

Figure D21: Calcium, Magnesium, and Sulfate StorageSD008
-5000
-4000
-3000
-2000
-1000
0
1000
2000
4/26
/200
0
7/28
/200
0
10/2
9/20
00
1/30
/200
1
5/3/
2001
8/4/
2001
11/5
/200
1
2/6/
2002
5/10
/200
2
8/11
/200
2
11/1
2/20
02
2/13
/200
3
5/17
/200
3
8/18
/200
3
11/1
9/20
03
2/20
/200
4
5/23
/200
4
8/24
/200
4
11/2
5/20
04
2/26
/200
5
5/30
/200
5
8/31
/200
5
12/2
/200
5
Cum
ulat
ive
Stor
age,
lbs/
ha
Ca StorageMg StorageSO4 Storage

Figure D22: Cumulative Metals StorageSD009
-150
-100
-50
0
50
100
150
200
4/26
/200
0
7/28
/200
0
10/2
9/20
00
1/30
/200
1
5/3/
2001
8/4/
2001
11/5
/200
1
2/6/
2002
5/10
/200
2
8/11
/200
2
11/1
2/20
02
2/13
/200
3
5/17
/200
3
8/18
/200
3
11/1
9/20
03
2/20
/200
4
5/23
/200
4
8/24
/200
4
11/2
5/20
04
2/26
/200
5
5/30
/200
5
8/31
/200
5
12/2
/200
5
3/5/
2006
Cum
ulat
ive
Stor
age,
lb/h
a
Cu StorageCo StorageZn StorageNi Storage

Figure D23: Influent and Effluent Copper ConcentrationsSD009
0
100
200
300
400
500
600
700
4/26
/200
0
7/28
/200
0
10/2
9/20
00
1/30
/200
1
5/3/
2001
8/4/
2001
11/5
/200
1
2/6/
2002
5/10
/200
2
8/11
/200
2
11/1
2/20
02
2/13
/200
3
5/17
/200
3
8/18
/200
3
11/1
9/20
03
2/20
/200
4
5/23
/200
4
8/24
/200
4
11/2
5/20
04
2/26
/200
5
5/30
/200
5
8/31
/200
5
12/2
/200
5
3/5/
2006
Cop
per, μg
/L
Copper InputCopper Output

Figure D24: Influent and Effluent Cobalt ConcentrationsSD009
0
20
40
60
80
100
120
4/26
/200
0
7/28
/200
0
10/2
9/20
00
1/30
/200
1
5/3/
2001
8/4/
2001
11/5
/200
1
2/6/
2002
5/10
/200
2
8/11
/200
2
11/1
2/20
02
2/13
/200
3
5/17
/200
3
8/18
/200
3
11/1
9/20
03
2/20
/200
4
5/23
/200
4
8/24
/200
4
11/2
5/20
04
2/26
/200
5
5/30
/200
5
8/31
/200
5
12/2
/200
5
3/5/
2006
Cob
alt, μg
/L
Cobalt OutputCobalt Input

Figure D25: Influent and Effluent Zinc ConcentrationsSD005
0
100
200
300
400
500
600
700
800
900
1000
4/26
/200
0
7/28
/200
0
10/2
9/20
00
1/30
/200
1
5/3/
2001
8/4/
2001
11/5
/200
1
2/6/
2002
5/10
/200
2
8/11
/200
2
11/1
2/20
02
2/13
/200
3
5/17
/200
3
8/18
/200
3
11/1
9/20
03
2/20
/200
4
5/23
/200
4
8/24
/200
4
11/2
5/20
04
2/26
/200
5
5/30
/200
5
8/31
/200
5
12/2
/200
5
3/5/
2006
Zinc
, μg/
L
Zinc InputZinc Output

Figure D26: Influent and Effluent Nickel ConcentrationsSD009
0
200
400
600
800
1000
1200
4/26
/200
0
7/28
/200
0
10/2
9/20
00
1/30
/200
1
5/3/
2001
8/4/
2001
11/5
/200
1
2/6/
2002
5/10
/200
2
8/11
/200
2
11/1
2/20
02
2/13
/200
3
5/17
/200
3
8/18
/200
3
11/1
9/20
03
2/20
/200
4
5/23
/200
4
8/24
/200
4
11/2
5/20
04
2/26
/200
5
5/30
/200
5
8/31
/200
5
12/2
/200
5
3/5/
2006
Nic
kel, μg
/L
Nickel InputNickel Output

Figure D27: Influent and Effluent Sulfate ConcentrationsSD009
0
100
200
300
400
500
600
700
800
4/26
/200
0
7/28
/200
0
10/2
9/20
00
1/30
/200
1
5/3/
2001
8/4/
2001
11/5
/200
1
2/6/
2002
5/10
/200
2
8/11
/200
2
11/1
2/20
02
2/13
/200
3
5/17
/200
3
8/18
/200
3
11/1
9/20
03
2/20
/200
4
5/23
/200
4
8/24
/200
4
11/2
5/20
04
2/26
/200
5
5/30
/200
5
8/31
/200
5
12/2
/200
5
3/5/
2006
Sulfa
te, m
g/L
Sulfate InputSulfate Output

Figure D28: Calcium, Magnesium, and Sulfate StorageSD009
-60000
-50000
-40000
-30000
-20000
-10000
0
10000
20000
30000
4/26
/200
0
7/28
/200
0
10/2
9/20
00
1/30
/200
1
5/3/
2001
8/4/
2001
11/5
/200
1
2/6/
2002
5/10
/200
2
8/11
/200
2
11/1
2/20
02
2/13
/200
3
5/17
/200
3
8/18
/200
3
11/1
9/20
03
2/20
/200
4
5/23
/200
4
8/24
/200
4
11/2
5/20
04
2/26
/200
5
5/30
/200
5
8/31
/200
5
12/2
/200
5
3/5/
2006
Cum
ulat
ive
Stor
age,
lbs/
ha
Ca StorageMg StorageSO4 Storage

Appendix E
Decision Tree for Treatment Wetlands


Appendix F
Detailed Cost Estimates for Mine Site Wastewater Treatment Alternatives

Estimated Estimated Annual Capital BasisItem Unit Unit Cost Quantity Cost Cost for Cost Estimate
Capital CostsTreatment
Flow Equalization LS $200,000 1 $200,000 USACE EM 1110-1-4012Preaeration LS $50,000 1 $50,000Stage 1 Hydroxide PrecipitationReaction Chambers LS $291,000 1 $291,000 USACE EM 1110-1-4012Clarifier LS $515,000 1 $515,000 USACE EM 1110-1-4012Stage 2 Hydroxide PrecipitationReaction Chambers LS $603,000 1 $603,000 USACE EM 1110-1-4012Clarifier LS $1,200,000 1 $1,200,000 USACE EM 1110-1-4012Sludge Holding Tanks (for both stages) LS $350,000 1 $350,000 7 days' storage @ $1 per gallon
Filter Press (for both stages) LS $3,600,000 1 $3,600,000EPA, 1976, pressing gypsum, hydroxide, and carbonate sludge
Recarbonation (inc. calcite clarifier) LS $1,300,000 1 $1,300,000 EPA, 1976 Sub-total for Treatment Equipment $8,109,000
Treatment Process Pumping and PipingConcrete foundations CY $150 600 $90,000 Means, Previous Project ExperienceTreatment Buildings SF $100 5,000 $500,000Pumps LS $200,000 1 $200,000Piping, Sch.40, 10" LF $25 1,000 $25,000 Means, Previous Project ExperiencePiping, Sch.40, 4" LF $10 600 $6,000 Means, Previous Project ExperienceInstallation labor HR $50 5,000 $250,000 Assume 10 person Crew for 12 Weeks Electrical Service Installation and Controls (20% of Treatment Equipment Cost) LS $1,661,800 1 $1,661,800 Previous Project Experience
Sub-total for Pumping/Piping ,Electrical, and Controls $2,732,800
Sub-Total: Line 1 Capital Costs $10,842,000
Engineering & AdministrationPilot Testing LS $500,000 1 $500,000 Previous Project ExperienceTreatment Design (15 % of Total Capital Cost) LS $1,626,000 1 $1,626,000 Previous Project ExperienceConstruction Management MO $35,000 4 $140,000 Previous Project Experience ( Approx 100 Hrs/month)Full Scale Technical Assistance and Start-Up LS $55,000 1 $55,000 Previous Project Experience Sub-total: Engineering & Administration $2,321,000
TOTAL: Capital, Engineering & Administration $13,163,000
Operations & Maintenance Costs Project Management LS $10,000 1 $10,000 Previous Project ExperienceOperating Labor (assumes 2 person years) HR $50 4,000 $200,000 Previous Project ExperienceTreatment Equipment Maintenance (2% of equipment cost) LS $162,180 1 $162,180 Previous Project ExperiencePumping O & M LS $10,000 1 $10,000 Previous Project Experience ( Approx 200 Hrs/month)Electrical Costs (~400 HP average over the year) KW-HR $0.04 2,614,000 $104,600 $0.04 per KWH, 400 HP average annual usage
Chemical Usage - Lime Ton $86 1,150 $98,900
400 mg/L lime Dosage from Preliminary CEMI Report + 2,688 mg/L for gypsum removal @ 170 gpm (yr 10 average, stage 1)
Sludge Trucking to Residue Pile Ton $10 19,000 $190,000 20 percent solids, 15 mile round trip
TOTAL: Annual Costs $775,680
Annual Cost Capital CostTOTAL: Wastewater Treatment - Estimated Cost $775,680 $13,163,000
Net Present Value (20 years @ 5%) $22,830,000
Contingency (20 percent) $4,566,000
Total Cost $27,396,000
Table F-1Cost Estimate for 1,300 gpm Stage 1 and 3,000 gpm Stage 2 Mine Site Water Treatment-Hydroxide Precipitation
NorthMet ProjectPolymet Inc., Hoyt Lakes, MN
P:\Mpls\23 MN\69\2369862\WorkFiles\WO 015 EIS Rpts Studies\RS29T\Draft Report\Appendix F-Cost Tables.xls

Estimated Estimated Annual Capital BasisItem Unit Unit Cost Quantity Cost Cost for Cost Estimate
Capital CostsTreatment
Flow Equalization LS $200,000 1 $200,000 USACE EM 1110-1-4012Preaeration LS $50,000 1 $50,000Stage 1 Hydroxide PrecipitationReaction Chambers LS $291,000 1 $291,000 USACE EM 1110-1-4012Clarifier LS $515,000 1 $515,000 USACE EM 1110-1-4012Recarbonation (inc. calcite clarifier) LS $565,000 1 $565,000 EPA, 1976Stage 1 Sulfide PrecipitationReaction Chambers LS $291,000 1 $291,000 USACE EM 1110-1-4012Clarifier LS $515,000 1 $515,000 USACE EM 1110-1-4012Stage 2 Sulfide PrecipitationReaction Chambers (includes pH adjust and chemical feed) LS $603,000 1 $603,000 USACE EM 1110-1-4012Clarifier LS $1,200,000 1 $1,200,000 USACE EM 1110-1-4012Quenching Tank LS $200,000 1 $200,000Sludge Holding Tanks (both stages) LS $350,000 1 $350,000 7 days' storage @ $1 per gallon
Filter Press (both stages) LS $3,600,000 1 $3,600,000EPA, 1976, pressing gypsum, hydroxide, and carbonate sludge
Sub-total for Treatment Equipment $8,380,000
Treatment Process Pumping and PipingConcrete foundations CY $150 1,000 $150,000 Means, Previous Project ExperienceTreatment Buildings SF $100 6,000 $600,000Pumps LS $100,000 1 $100,000Piping, Sch.40, 10" LF $25 1,000 $25,000 Means, Previous Project ExperiencePiping, Sch.40, 4" LF $10 600 $6,000 Means, Previous Project ExperienceInstallation labor HR $50 5,000 $250,000 Assume 10 person Crew for 12 Weeks Electrical Service Installation and Controls (20% of Treatment Equipment Cost) LS $1,696,000 1 $1,696,000 Previous Project Experience
Sub-total for Pumping/Piping ,Electrical, and Controls $2,827,000
Sub-Total: Line 1 Capital Costs $11,207,000
Engineering & AdministrationPilot Testing LS $500,000 1 $500,000 Previous Project ExperienceTreatment Design (15 % of Total Capital Cost) LS $1,681,000 1 $1,681,000 Previous Project ExperienceConstruction Management MO $35,000 4 $140,000 Previous Project Experience ( Approx 100 Hrs/month)Full Scale Technical Assistance and Start-Up LS $55,000 1 $55,000 Previous Project Experience Sub-total: Engineering & Administration $2,376,000
TOTAL: Capital, Engineering & Administration $13,583,000
Operations & Maintenance Costs Project Management LS $10,000 1 $10,000 Previous Project ExperienceOperating Labor (assumes 2 person years) HR $50 4,000 $200,000 Previous Project ExperienceTreatment Equipment Maintenance (2% of equipment cost) LS $167,600 1 $167,600Pumping O & M LS $10,000 1 $10,000 Previous Project Experience ( Approx 200 Hrs/month)Electrical Costs (~400 HP average over the year) KW-HR $0.04 2,614,000 $104,600 $0.04 per KWH, 400 HP average annual usageChemical Usage -NaHS Ton $900 6 $5,400 15 mg/L NaHS dosage
Chemical Usage-Lime Ton $86 1,150 $98,900
400 mg/L lime Dosage from Preliminary CEMI Report + 2,688 mg/L for gypsum removal @ 170 gpm (yr 10 average, stage 1)
Chemical Usage-FeCl2 Ton $100 10 $1,000 Quench entire NaHS dosageSludge Trucking to Hydromet facility Ton $10 19,000 $190,000 20 percent solids, 15 mile round trip
TOTAL: Annual Costs $787,500
Annual Cost Capital CostTOTAL: Wastewater Treatment - Estimated Cost $787,500 $13,583,000
Net Present Value (20 years @ 5%) $23,397,000
Contingency (20 percent) $4,679,000
Total Cost $28,076,000
Cost Estimate for 1,300 gpm Stage 1 and 3,000 gpm Stage 2 Mine Site Water Treatment-Sulfide PrecipitationNorthMet Project
Table F-2
Polymet Inc., Hoyt Lakes, MN
P:\Mpls\23 MN\69\2369862\WorkFiles\WO 015 EIS Rpts Studies\RS29T\Draft Report\Appendix F-Cost Tables.xls

Estimated Estimated Annual Capital BasisItem Unit Unit Cost Quantity Cost Cost for Cost Estimate
Capital CostsTreatment
Flow Equalization LS $200,000 1 $200,000 USACE EM 1110-1-4012Preaeration LS $50,000 1 $50,000
Stage 1 Hydroxide PrecipitationReaction Chambers LS $291,000 1 $291,000 USACE EM 1110-1-4012Clarifier LS $515,000 1 $515,000 USACE EM 1110-1-4012
Stage 1 Carbonate PrecipitationReaction Chambers LS $587,000 1 $587,000 USACE EM 1110-1-4012Clarifier LS $515,000 1 $515,000 USACE EM 1110-1-4012
Stage 2 Carbonate PrecipitationReaction Chambers LS $603,000 1 $603,000 USACE EM 1110-1-4012Clarifier LS $1,200,000 1 $1,200,000 USACE EM 1110-1-4012Sludge Holding Tanks (for both stages) LS $350,000 1 $350,000 7 days' storage @ $1 per gallon
Filter Press (for both stages) LS $3,600,000 1 $3,600,000EPA, 1976, pressing gypsum, hydroxide, and carbonate sludge
Sub-total for Treatment Equipment $7,911,000
Treatment Process Pumping and PipingConcrete foundations CY $150 350 $52,500 Means, Previous Project ExperienceTreatment Buildings SF $100 3,500 $350,000Pumps LS $100,000 1 $100,000Piping, Sch.40, 10" LF $25 800 $20,000 Means, Previous Project ExperiencePiping, Sch.40, 4" LF $10 300 $3,000 Means, Previous Project ExperienceInstallation labor HR $50 5,000 $250,000 Assume 10 person Crew for 12 Weeks Electrical Service Installation and Controls (20% of Treatment Equipment Cost) LS $1,602,200 1 $1,602,200 Previous Project Experience
Sub-total for Pumping/Piping ,Electrical, and Controls $2,377,700
Sub-Total: Line 1 Capital Costs $10,289,000
Engineering & AdministrationPilot Testing LS $500,000 1 $500,000 Previous Project ExperienceTreatment Design (15 % of Total Capital Cost) LS $1,543,000 1 $1,543,000 Previous Project ExperienceConstruction Management MO $35,000 4 $140,000 Previous Project Experience ( Approx 100 Hrs/month)Full Scale Technical Assistance and Start-Up LS $55,000 1 $55,000 Previous Project Experience Sub-total: Engineering & Administration $2,238,000
TOTAL: Capital, Engineering & Administration $12,527,000
Operations & Maintenance Costs Project Management LS $10,000 1 $10,000 Previous Project ExperienceOperating Labor (assumes 1.5 person years) HR $50 3,200 $160,000 Previous Project ExperienceTreatment Equipment Maintenance (2% of equipment cost) LS $158,220 1 $158,220Pumping O & M LS $10,000 1 $10,000 Previous Project Experience ( Approx 200 Hrs/month)Electrical Costs (~400 HP average over the year) KW-HR $0.04 2,614,000 $104,600 $0.04 per KWH, 400 HP average annual usageChemical Usage-Lime Ton $86 1,150 $98,900
Chemical Usage - Soda Ash Ton $269 2,186 $588,024 Dose to precipitate non-Mg species, Vendor price quoteSludge Trucking to Residue Pile Ton $10 19,000 $190,000 20 percent solids, 15 mile round trip
TOTAL: Annual Costs $1,319,744
Annual Cost Capital CostTOTAL: Wastewater Treatment - Estimated Cost $1,319,744 $12,527,000
Net Present Value (20 years @ 5%) $28,974,000
Contingency (20 percent) $5,795,000
Total Cost $34,769,000
Cost Estimate for 1,300 gpm Stage 1 and 3,000 gpm Stage 2 Mine Site Water Treatment-Carbonate PrecipitationNorthMet Project
Table F-3
Polymet Inc., Hoyt Lakes, MN
P:\Mpls\23 MN\69\2369862\WorkFiles\WO 015 EIS Rpts Studies\RS29T\Draft Report\Appendix F-Cost Tables.xls

Estimated Estimated Annual Capital BasisItem Unit Unit Cost Quantity Cost Cost for Cost Estimate
Capital CostsTreatment
Flow Equalization LS $200,000 1 $200,000 USACE EM 1110-1-4012Preaeration LS $50,000 1 $50,000
Stage 1 Hydroxide PrecipitationReaction Chambers LS $291,000 1 $291,000 USACE EM 1110-1-4012Clarifier LS $515,000 1 $515,000 USACE EM 1110-1-4012Recarbonation (inc. calcite clarifier) LS $565,000 1 $565,000 EPA, 1976
Stage 1 FeS PrecipitationReaction Chambers LS $436,500 1 $436,500 USACE EM 1110-1-4012Clarifier LS $515,000 1 $515,000 USACE EM 1110-1-4012
Stage 2 FeS PrecipitationReaction Chambers (includes pH adjust and chemical feed) LS $904,500 1 $904,500 USACE EM 1110-1-4012Clarifier LS $1,200,000 1 $1,200,000 USACE EM 1110-1-4012Sludge Holding Tanks LS $350,000 1 $350,000 7 days' storage @ $1 per gallon
Filter Press LS $3,600,000 1 $3,600,000EPA 1976, pressing gypsum, hydroxide, and carbonate sludge
Sub-total for Treatment Equipment $8,627,000
Treatment Process Pumping and PipingConcrete foundations CY $150 1,000 $150,000 Means, Previous Project ExperienceTreatment Buildings SF $100 6,000 $600,000Pumps LS $100,000 1 $100,000Piping, Sch.40, 10" LF $25 800 $20,000 Means, Previous Project ExperiencePiping, Sch.40, 4" LF $10 300 $3,000 Means, Previous Project ExperienceInstallation labor HR $50 5,000 $250,000 Assume 10 person Crew for 12 Weeks Electrical Service Installation and Controls (20% of Treatment Equipment Cost) LS $1,745,400 1 $1,745,400 Previous Project Experience
Sub-total for Pumping/Piping ,Electrical, and Controls $2,868,400
Sub-Total: Line 1 Capital Costs $11,495,000
Engineering & AdministrationPilot Testing LS $500,000 1 $500,000 Previous Project ExperienceTreatment Design (15 % of Total Capital Cost) LS $1,724,000 1 $1,724,000 Previous Project ExperienceConstruction Management MO $35,000 4 $140,000 Previous Project Experience ( Approx 100 Hrs/month)Full Scale Technical Assistance and Start-Up LS $55,000 1 $55,000 Previous Project Experience Sub-total: Engineering & Administration $2,419,000
TOTAL: Capital, Engineering & Administration $13,914,000
Operations & Maintenance Costs Project Management LS $10,000 1 $10,000 Previous Project ExperienceOperating Labor (assumes 2 person years) HR $50 4,000 $200,000 Previous Project ExperienceTreatment Equipment Maintenance (2% of equipment cost) LS $172,540 1 $172,540Pumping O & M LS $10,000 1 $10,000 Previous Project Experience ( Approx 200 Hrs/month)Electrical Costs (~400 HP average over the year) KW-HR $0.04 2,614,000 $104,600 $0.04 per KWH, 400 HP average annual usage
Chemical Usage-Lime Ton $86 1,150 $98,900
400 mg/L lime Dosage from Preliminary CEMI Report + 2,688 mg/L for gypsum removal @ 170 gpm (yr 10 average, stage 1)
Chemical Usage -FeSO4 Ton $343 381 $130,882 1:1 stoichiometric ratio of Fe:SChemical Usage-NaHS Ton $900 562 $505,476 4 times stoichiometric requirementSludge Trucking to Hydromet Facility Ton $10 19,000 $190,000 20 percent solids, 15 mile round trip
TOTAL: Annual Costs $1,422,398
Annual Cost Capital CostTOTAL: Wastewater Treatment - Estimated Cost $1,422,398 $13,914,000
Net Present Value (20 years @ 5%) $31,640,000
Contingency (20 percent) $6,328,000
Total Cost $37,968,000
Cost Estimate for 1,300 gpm Stage 1 and 3,000 gpm Stage 2 Mine Site Water Treatment-FeS PrecipitationNorthMet Project
Table F-4
Polymet Inc., Hoyt Lakes, MN
P:\Mpls\23 MN\69\2369862\WorkFiles\WO 015 EIS Rpts Studies\RS29T\Draft Report\Appendix F-Cost Tables.xls

Estimated Estimated Annual Capital BasisItem Unit Unit Cost Quantity Cost Cost for Cost Estimate
Capital CostsTreatment
Flow Equalization LS $200,000 1 $200,000 USACE EM 1110-1-4012Preaeration LS $50,000 1 $50,000
Stage 1 Hydroxide PrecipitationReaction Chambers LS $291,000 1 $291,000 USACE EM 1110-1-4012Clarifier LS $515,000 1 $515,000 USACE EM 1110-1-4012Recarbonation LS $565,000 1 $565,000 EPA, 1976
Stage 1 CaS PrecipitationReaction Chambers LS $436,500 1 $436,500 USACE EM 1110-1-4012Clarifier LS $515,000 1 $515,000 USACE EM 1110-1-4012
Stage 2 CaS PrecipitationReaction Chambers (includes pH adjust and chemical feed) LS $904,500 1 $904,500 USACE EM 1110-1-4012Clarifier LS $1,200,000 1 $1,200,000 USACE EM 1110-1-4012Sludge Holding Tanks LS $350,000 1 $350,000 7 days' storage @ $1 per gallonFilter Press LS $3,600,000 1 $3,600,000 USACE EM 1110-1-4012
Sub-total for Treatment Equipment $8,627,000
Treatment Process Pumping and PipingConcrete foundations CY $150 1,000 $150,000 Means, Previous Project ExperienceTreatment Buildings SF $100 6,000 $600,000Pumps LS $100,000 1 $100,000Piping, Sch.40, 10" LF $25 800 $20,000 Means, Previous Project ExperiencePiping, Sch.40, 4" LF $10 300 $3,000 Means, Previous Project ExperienceInstallation labor HR $50 5,000 $250,000 Assume 10 person Crew for 12 Weeks Electrical Service Installation and Controls (20% of Treatment Equipment Cost) LS $1,745,400 1 $1,745,400 Previous Project Experience
Sub-total for Pumping/Piping ,Electrical, and Controls $2,868,400
Sub-Total: Line 1 Capital Costs $11,495,000
Engineering & AdministrationPilot Testing LS $500,000 1 $500,000 Previous Project ExperienceTreatment Design (15 % of Total Capital Cost) LS $1,724,000 1 $1,724,000 Previous Project ExperienceConstruction Management MO $35,000 4 $140,000 Previous Project Experience ( Approx 100 Hrs/month)Full Scale Technical Assistance and Start-Up LS $55,000 1 $55,000 Previous Project Experience Sub-total: Engineering & Administration $2,419,000
TOTAL: Capital, Engineering & Administration $13,914,000
Operations & Maintenance Costs Project Management LS $10,000 1 $10,000 Previous Project ExperienceOperating Labor (assumes 1 person years) HR $50 4,000 $200,000 Previous Project ExperienceTreatment Equipment Maintenance (2% of equipment cost) LS $172,540 1 $172,540Pumping O & M LS $5,000 1 $5,000 Previous Project Experience ( Approx 100 Hrs/month)Electrical Costs (~400 HP average over the year) KW-HR $0.04 2,614,000 $104,600 $0.04 per KWH, 400 HP average annual usage
Chemical Usage -Lime Ton $86 1,290 $110,975
1:1 stoichiometric ratio of S:Ca + 400 mg/L lime Dosage from Preliminary CEMI Report + 2,688 mg/L for gypsum removal @ 170 gpm (yr 10 average, stage 1)
Chemical Usage-NaHS Ton $900 140 $126,369 15 mg/L NaHS dosageSludge Trucking to Hydromet Facility Ton $10 19,000 $190,000 20 percent solids, 15 mile round trip
TOTAL: Annual Costs $919,484
Annual Cost Capital CostTOTAL: Wastewater Treatment - Estimated Cost $919,484 $13,914,000
Net Present Value (20 years @ 5%) $25,373,000
Contingency (20 percent) $5,075,000
Total Cost $30,448,000
Cost Estimate for 1,300 gpm Stage 1 and 3,000 gpm Stage 2 Mine Site Water Treatment-CaS PrecipitationNorthMet Project
Table F-5
Polymet Inc., Hoyt Lakes, MN
P:\Mpls\23 MN\69\2369862\WorkFiles\WO 015 EIS Rpts Studies\RS29T\Draft Report\Appendix F-Cost Tables.xls

Estimated Estimated Annual Capital BasisItem Unit Unit Cost Quantity Cost Cost for Cost Estimate
Capital CostsTreatment
Flow Equalization LS $200,000 1 $200,000Preaeration LS $50,000 1 $50,000
Stage 1 Hydroxide PrecipitationReaction Chambers LS $244,440 1 $244,440 USACE EM 1110-1-4012Clarifier LS $432,600 1 $432,600 USACE EM 1110-1-4012
Stage 1 Nanofiltration
Nanofiltration Unit LS $1,900,000 1 $1,900,000Vendor Quote, assumes nanofiltration of 1,090 gpm of Stage 1 flow
Stage 2 Hydroxide PrecipitationReaction Chambers LS $500,000 1 $500,000 USACE EM 1110-1-4012Clarifier LS $1,000,000 1 $1,000,000 USACE EM 1110-1-4012Sludge Storage Tanks LS $350,000 1 $350,000 7 days' storage @ $1 per gallonFilter Press LS $3,600,000 1 $3,600,000Recarbonation (inc. calcite clarifier) LS $1,300,000 1 $1,300,000 EPA, 1976
Sub-total for Treatment Equipment $9,577,040
Treatment Process Pumping and PipingConcrete foundations CY $150 300 $45,000 Means, Previous Project ExperienceTreatment Buildings SF $100 3,000 $300,000Pumps LS $100,000 1 $100,000Piping, Sch.40, 10" LF $25 800 $20,000 Means, Previous Project ExperiencePiping, Sch.40, 4" LF $10 300 $3,000 Means, Previous Project ExperienceInstallation labor HR $50 5,000 $250,000 Assume 10 person Crew for 12 Weeks Electrical Service Installation and Controls (20% of Treatment Equipment Cost) LS $1,935,408 1 $1,935,408 Previous Project Experience
Sub-total for Pumping/Piping ,Electrical, and Controls $2,653,408
Sub-Total: Line 1 Capital Costs $12,230,000
Engineering & AdministrationPilot Testing LS $500,000 1 $500,000 Previous Project ExperienceTreatment Design (15 % of Total Capital Cost) LS $1,835,000 1 $1,835,000 Previous Project ExperienceConstruction Management MO $35,000 4 $140,000 Previous Project Experience ( Approx 100 Hrs/month)Full Scale Technical Assistance and Start-Up LS $55,000 1 $55,000 Previous Project Experience Sub-total: Engineering & Administration $2,530,000
TOTAL: Capital, Engineering & Administration $14,760,000
Operations & Maintenance Costs Project Management LS $10,000 1 $10,000 Previous Project ExperienceOperating Labor (assumes 2 person years) HR $50 4,000 $200,000 Previous Project ExperiencePumping O & M LS $10,000 1 $10,000 Previous Project Experience ( Approx 200 Hrs/month)Nanofiltration Unit O&M 1000 GAL $1.00 572,904 $572,900 Vendor EstimateElectrical Costs (~400 HP average over the year) KW-HR $0.04 2,614,000 $104,600 $0.04 per KWH, 400 HP average annual usage
Chemical Usage-Lime Ton $86 1,150 $98,900
400 mg/L lime Dosage from Preliminary CEMI Report + 2,688 mg/L for gypsum removal @ 170 gpm (yr 10 average, stage 1)
Sludge Trucking to Residue Pile Ton $10 19,000 $190,000 20 percent solids, 15 mile round trip
TOTAL: Annual Costs $1,186,400
Annual Cost Capital CostTOTAL: Wastewater Treatment - Estimated Cost $1,186,400 $14,760,000
Net Present Value (20 years @ 5%) $32,997,000
Contingency (20 percent) $6,599,000
Total Cost $39,596,000
Cost Estimate for 1,300 gpm Stage 1 and 3,000 gpm Stage 2Mine Site Water Treatment-NanofiltrationNorthMet Project
Table F-6
Polymet Inc., Hoyt Lakes, MN
P:\Mpls\23 MN\69\2369862\WorkFiles\WO 015 EIS Rpts Studies\RS29T\Draft Report\Appendix F-Cost Tables.xls

Estimated Estimated Annual Capital BasisItem Unit Unit Cost Quantity Cost Cost for Cost Estimate
Capital CostsTreatment
Flow Equalization LS $200,000 1 $200,000Preaeration LS $50,000 1 $50,000
Stage 1 Hydroxide PrecipitationReaction Chambers LS $244,440 1 $244,440 USACE EM 1110-1-4012Clarifier LS $432,600 1 $432,600 USACE EM 1110-1-4012Sludge Storage Tanks LS $350,000 1 $350,000 7 days' storage @ $1 per gallonFilter Press LS $3,600,000 1 $3,600,000Recarbonation (inc. calcite clarifier) LS $565,000 1 $565,000 EPA, 1976
Stage 2 Nanofiltration
Nanofiltration Unit LS $3,000,000 1 $3,000,000Vendor Quote, assumes nanofiltration of 1,700 gpm of Stage 2 flow
Sub-total for Treatment Equipment $8,442,040
Treatment Process Pumping and PipingConcrete foundations CY $150 300 $45,000 Means, Previous Project ExperienceTreatment Buildings SF $100 3,000 $300,000Pumps LS $100,000 1 $100,000Piping, Sch.40, 10" LF $25 800 $20,000 Means, Previous Project ExperiencePiping, Sch.40, 4" LF $10 300 $3,000 Means, Previous Project ExperienceInstallation labor HR $50 5,000 $250,000 Assume 10 person Crew for 12 Weeks Electrical Service Installation and Controls (20% of Treatment Equipment Cost) LS $1,708,408 1 $1,708,408 Previous Project Experience
Sub-total for Pumping/Piping ,Electrical, and Controls $2,426,408
Sub-Total: Line 1 Capital Costs $10,868,000
Engineering & AdministrationPilot Testing LS $500,000 1 $500,000 Previous Project ExperienceTreatment Design (15 % of Total Capital Cost) LS $1,630,000 1 $1,630,000 Previous Project ExperienceConstruction Management MO $35,000 4 $140,000 Previous Project Experience ( Approx 100 Hrs/month)Full Scale Technical Assistance and Start-Up LS $55,000 1 $55,000 Previous Project Experience Sub-total: Engineering & Administration $2,325,000
TOTAL: Capital, Engineering & Administration $13,193,000
Operations & Maintenance Costs Project Management LS $10,000 1 $10,000 Previous Project ExperienceOperating Labor (assumes 2 person years) HR $50 4,000 $200,000 Previous Project ExperiencePumping O & M LS $10,000 1 $10,000 Previous Project Experience ( Approx 200 Hrs/month)Nanofiltration Unit O&M 1000 GAL $0.90 893,520 $804,200 Vendor EstimateElectrical Costs (~400 HP average over the year) KW-HR $0.04 2,614,000 $104,600 $0.04 per KWH, 400 HP average annual usage
Chemical Usage-Lime Ton $86 1,150 $98,900
400 mg/L lime Dosage from Preliminary CEMI Report + 2,688 mg/L for gypsum removal @ 170 gpm (yr 10 average, stage 1)
Sludge Trucking to Residue Pile Ton $10 19,000 $190,000 20 percent solids, 15 mile round trip
TOTAL: Annual Costs $1,417,700
Annual Cost Capital CostTOTAL: Wastewater Treatment - Estimated Cost $1,417,700 $13,193,000
Net Present Value (20 years @ 5%) $30,860,000
Contingency (20 percent) $6,172,000
Total Cost $37,032,000
Cost Estimate for 1,300 gpm Stage 1 and 1,700 gpm Stage 2 Mine Site Water Treatment-NanofiltrationNorthMet Project
Table F-7
Polymet Inc., Hoyt Lakes, MN
P:\Mpls\23 MN\69\2369862\WorkFiles\WO 015 EIS Rpts Studies\RS29T\Draft Report\Appendix F-Cost Tables.xls

Estimated Estimated Annual Capital BasisItem Unit Unit Cost Quantity Cost Cost for Cost Estimate
Capital CostsTreatment
Flow Equalization LS $200,000 1 $200,000Preaeration LS $50,000 1 $50,000
Stage 1 Hydroxide PrecipitationReaction Chambers LS $291,000 1 $291,000 USACE EM 1110-1-4012Clarifier LS $515,000 1 $515,000 USACE EM 1110-1-4012
Stage 1 + Stage 2 Reverse OsmosisPre-Treatment (Ultrafiltration) LS $7,197,400 1 $7,197,400 Vendor QuoteRO Unit LS $3,932,600 1 $3,932,600 Vendor QuoteRO Element-Clean in place skid LS $15,000 1 $15,000 Vendor QuoteBrine Treatment-Lime Reactor LS $102,000 1 $102,000 USACE EM 1110-1-4012, assumes 35% rejectBrine Treatment-Clarifier LS $415,000 1 $415,000 USACE EM 1110-1-4012, assumes 35% rejectSludge Storage Tanks LS $350,000 1 $350,000 7 days' storage @ $1 per gallonFilter Press LS $3,600,000 1 $3,600,000 EPA, 1976
Sub-total for Treatment Equipment $16,668,000
Treatment Process Pumping and PipingConcrete foundations CY $150 300 $45,000 Means, Previous Project ExperienceTreatment Buildings SF $100 3,000 $300,000Pumps LS $100,000 1 $100,000Piping, Sch.40, 10" LF $25 800 $20,000 Means, Previous Project ExperiencePiping, Sch.40, 4" LF $10 300 $3,000 Means, Previous Project ExperienceInstallation labor HR $50 5,000 $250,000 Assume 10 person Crew for 12 Weeks Electrical Service Installation and Controls (20% of Treatment Equipment Cost) LS $3,353,600 1 $3,353,600 Previous Project Experience
Sub-total for Pumping/Piping ,Electrical, and Controls $4,071,600
Sub-Total: Line 1 Capital Costs $20,740,000
Engineering & AdministrationPilot Testing LS $500,000 1 $500,000 Previous Project ExperienceTreatment Design (15 % of Total Capital Cost) LS $3,111,000 1 $3,111,000 Previous Project ExperienceConstruction Management MO $35,000 4 $140,000 Previous Project Experience ( Approx 100 Hrs/month)Full Scale Technical Assistance and Start-Up LS $55,000 1 $55,000 Previous Project Experience Sub-total: Engineering & Administration $3,806,000
TOTAL: Capital, Engineering & Administration $24,546,000
Operations & Maintenance Costs Project Management LS $10,000 1 $10,000 Previous Project ExperienceOperating Labor (assumes 2 person years) HR $50 4,000 $200,000 Previous Project ExperiencePumping O & M LS $5,000 1 $5,000 Previous Project Experience ( Approx 100 Hrs/month)Reverse Osmosis Unit O&M 1000 GAL $1.10 1,559,981 $1,716,000 Vendor EstimateElectrical Costs (~400 HP average over the year) KW-HR $0.04 2,614,000 $104,600 $0.04 per KWH, 400 HP average annual usage
Chemical Usage-Lime Ton $86 1,150 $98,900
400 mg/L lime Dosage from Preliminary CEMI Report + 2,688 mg/L for gypsum removal @ 170 gpm (yr 10 average, stage 1)
Sludge Trucking to Residue Pile Ton $10 19,000 $190,000 20 percent solids, 15 mile round trip
TOTAL: Annual Costs $2,324,500
Annual Cost Capital CostTOTAL: Wastewater Treatment - Estimated Cost $2,324,500 $24,546,000
Net Present Value (20 years @ 5%) $53,514,000
Contingency (20 percent) $10,703,000
Total Cost $64,217,000
Cost Estimate for 1,300 gpm Stage 1 and 3,000 gpm Stage 2 Mine Site Water Treatment-Reverse OsmosisNorthMet Project
Table F-8
Polymet Inc., Hoyt Lakes, MN
P:\Mpls\23 MN\69\2369862\WorkFiles\WO 015 EIS Rpts Studies\RS29T\Draft Report\Appendix F-Cost Tables.xls

Estimated Estimated Annual Capital BasisItem Unit Unit Cost Quantity Cost Cost for Cost Estimate
Capital CostsTreatment
Flow Equalization LS $200,000 1 $200,000Preaeration LS $50,000 1 $50,000
Stage 1 Ion ExchangePre-Treatment (Prefilter) LS $100,000 1 $100,000Pre-Treatment (Carbon Filtration) CF $21 13985 $290,194
Ion Exchange Resin CF $200 27971 $5,594,100Capacity for 1-month of flow, duplicate vessels, 0.5# metals/cf resin
Resin Vessels EA $10,000 6 $60,000 5,000-gal SS tanksRegen Lime Precipitation Reactor LS $20,000 1 $20,000Regen Lime Precipitation Clarifier LS $50,000 1 $50,000
Stage 1 Lime PrecipitationReaction Chambers LS $291,000 1 $291,000 USACE EM 1110-1-4012Clarifier LS $515,000 1 $515,000 USACE EM 1110-1-4012
Stage 2 Lime PrecipitationReaction Chambers LS $603,000 1 $603,000 USACE EM 1110-1-4012Clarifier LS $1,200,000 1 $1,200,000 USACE EM 1110-1-4012Sludge Holding Tanks (for both stages) LS $350,000 1 $350,000 7 days' storage @ $1 per gallon
Filter Press (for both stages) LS $3,600,000 1 $3,600,000EPA 1976 pressing gypsum, hydroxide, and carbonate sludge
Recarbonation (inc. calcite clarifier) LS $1,300,000 1 $1,300,000 EPA, 1976Sub-total for Treatment Equipment $14,223,294
Treatment Process Pumping and PipingConcrete foundations CY $150 300 $45,000 Means, Previous Project ExperienceTreatment Buildings SF $100 3,000 $300,000Pumps LS $100,000 1 $100,000Piping, Sch.40, 10" LF $25 800 $20,000 Means, Previous Project ExperiencePiping, Sch.40, 4" LF $10 300 $3,000 Means, Previous Project ExperienceInstallation labor HR $50 5,000 $250,000 Assume 10 person Crew for 12 Weeks Electrical Service Installation and Controls (20% of Treatment Equipment Cost) LS $2,864,659 1 $2,864,659 Previous Project Experience
Sub-total for Pumping/Piping ,Electrical, and Controls $3,582,659
Sub-Total: Line 1 Capital Costs $17,806,000
Engineering & AdministrationPilot Testing LS $500,000 1 $500,000 Previous Project ExperienceTreatment Design (15 % of Total Capital Cost) LS $2,671,000 1 $2,671,000 Previous Project ExperienceConstruction Management MO $35,000 4 $140,000 Previous Project Experience ( Approx 100 Hrs/month)Full Scale Technical Assistance and Start-Up LS $55,000 1 $55,000 Previous Project Experience Sub-total: Engineering & Administration $3,366,000
TOTAL: Capital, Engineering & Administration $21,172,000
Operations & Maintenance Costs Project Management LS $10,000 1 $10,000 Previous Project ExperienceOperating Labor (assumes 1.5 person years) HR $50 3,200 $160,000 Previous Project ExperiencePumping O & M LS $5,000 1 $5,000 Previous Project Experience ( Approx 100 Hrs/month)Resin Replacement CF $200.00 2,797 $559,400 Assume replacement of 10 percent per yearElectrical Costs (~400 HP average over the year) KW-HR $0.04 2,614,000 $104,600 $0.04 per KWH, 200 HP average annual usageChemical Costs Ton $100.00 1,300 $130,000 Acid RegenCarbon Replacement Ton $1,695.00 175 $296,300
Chemical Usage-Lime Ton $86 1,150 $98,900
400 mg/L lime Dosage from Preliminary CEMI Report + 2,688 mg/L for gypsum removal @ 170 gpm (yr 10 average, stage 1)
Sludge Trucking to Residue Pile Ton $10 19,000 $190,000 20 percent solids, 15 mile round trip
TOTAL: Annual Costs $1,554,200
Annual Cost Capital CostTOTAL: Wastewater Treatment - Estimated Cost $1,554,200 $21,172,000
Net Present Value (20 years @ 5%) $40,540,000
Contingency (20 percent) $8,108,000
Total Cost $48,648,000
Cost Estimate for 1,300 gpm Stage 1 and 3,000 gpm Stage 2 Mine Site Water Treatment-Ion ExchangeNorthMet Project
Table F-9
Polymet Inc., Hoyt Lakes, MN
P:\Mpls\23 MN\69\2369862\WorkFiles\WO 015 EIS Rpts Studies\RS29T\Draft Report\Appendix F-Cost Tables.xls

Estimated Estimated Annual Capital BasisItem Unit Unit Cost Quantity Cost Cost for Cost Estimate
Capital CostsTreatment
Flow Equalization LS $200,000 1 $200,000 Previous project experience, (1)Preaeration LS $50,000 1 $50,000
Stage 1 Hydroxide PrecipitationReaction Chambers LS $291,000 1 $291,000 USACE EM 1110-1-4012Clarifier LS $515,000 1 $515,000 USACE EM 1110-1-4012Recarbonation (inc. calcite clarifier) LS $565,000 1 $565,000 EPA, 1976Sludge Storage LS $350,000 1 $350,000 7 days' storage @ $1 per gallonFilter Press LS $3,600,000 1 $3,600,000
Stage 2 Wetland TreatmentConstructed Wetland-Earthwork AC $5,000 200 $1,000,000 Previous project experience, IWA 2004Constructed Wetland-Liner AC $65,000 200 $13,000,000 Previous project experience, IWA 2004Constructed Wetland-Drainage Gravel (6-inch) AC $12,000 200 $2,400,000 Previous project experience, IWA 2004Constructed Wetland-Bed Media (1-meter depth, 50% compost, 50% onsite granular) AC $60,000 200 $12,000,000 Previous project experience, IWA 2004Constructed Wetland-Vegetation AC $30,000 200 $6,000,000 Previous project experience, IWA 2004
Sub-total for Treatment Equipment $39,971,000
Treatment Process Pumping and PipingPlumbing AC $3,200 600 $1,920,000 Previous project experience, IWA 2004Concrete foundations CY $150 200 $30,000 Means, Previous Project ExperienceTreatment Buildings SF $100 2,000 $200,000Pumps LS $100,000 1 $100,000Piping, Sch.40, 10" LF $25 1,000 $25,000 Means, Previous Project ExperiencePiping, Sch.40, 4" LF $10 600 $6,000 Means, Previous Project ExperienceInstallation labor HR $50 5,000 $250,000 Assume 10 person Crew for 12 Weeks Electrical Service Installation and Controls (20% of Treatment Equipment Cost) LS $161,200 1 $161,200 Previous Project ExperienceControl Structures LS $4,000,000 1 $4,000,000 Previous project experience, IWA 2004
Sub-total for Pumping/Piping ,Electrical, and Controls $6,692,200
Sub-Total: Line 1 Capital Costs $46,663,000
Engineering & AdministrationPilot Testing LS $500,000 1 $500,000 Previous Project ExperienceTreatment Design (15 % of Total Capital Cost) LS $6,999,000 1 $6,999,000 Previous Project ExperienceConstruction Management MO $35,000 10 $350,000 Previous Project Experience ( Approx 100 Hrs/month)Full Scale Technical Assistance and Start-Up LS $55,000 1 $55,000 Previous Project Experience Sub-total: Engineering & Administration $7,904,000
TOTAL: Capital, Engineering & Administration $54,567,000
Operations & Maintenance Costs Project Management LS $10,000 1 $10,000 Previous Project ExperienceOperating Labor (assumes 0.5 person years) HR $50 1,067 $53,333 Previous Project ExperienceTreatment Equipment Maintenance (2% of Stage 1 cost) LS $21,120 1 $21,120 Previous Project ExperiencePumping O & M LS $10,000 1 $10,000 Previous Project Experience ( Approx 200 Hrs/month)Leachate Trucking from Residue Pile GalElectrical Costs (~400 HP average over the year) KW-HR $0.04 2,614,000 $104,600 $0.04 per KWH, 200 HP average annual usage
Chemical Usage - Lime Ton $86 1,150 $98,900
400 mg/L lime Dosage from Preliminary CEMI Report + 2,688 mg/L for gypsum removal @ 170 gpm (yr 10 average, stage 1)
Sludge Trucking to Residue Pile Ton $10 19,000 $190,000 20 percent solids, 15 mile round trip
TOTAL: Annual Costs $487,953
Annual Cost Capital CostTOTAL: Wastewater Treatment - Estimated Cost $487,953 $54,567,000
Net Present Value (20 years @ 5%) $60,648,000
Contingency (20 percent) $12,130,000
Total Cost $72,778,000
Cost Estimate for 1,300 gpm Stage 1 and 1,700 gpm Stage 2 Mine Site Water Treatment-Constructed WetlandNorthMet Project
Table F-10
Polymet Inc., Hoyt Lakes, MN
P:\Mpls\23 MN\69\2369862\WorkFiles\WO 015 EIS Rpts Studies\RS29T\Draft Report\Appendix F-Cost Tables.xls
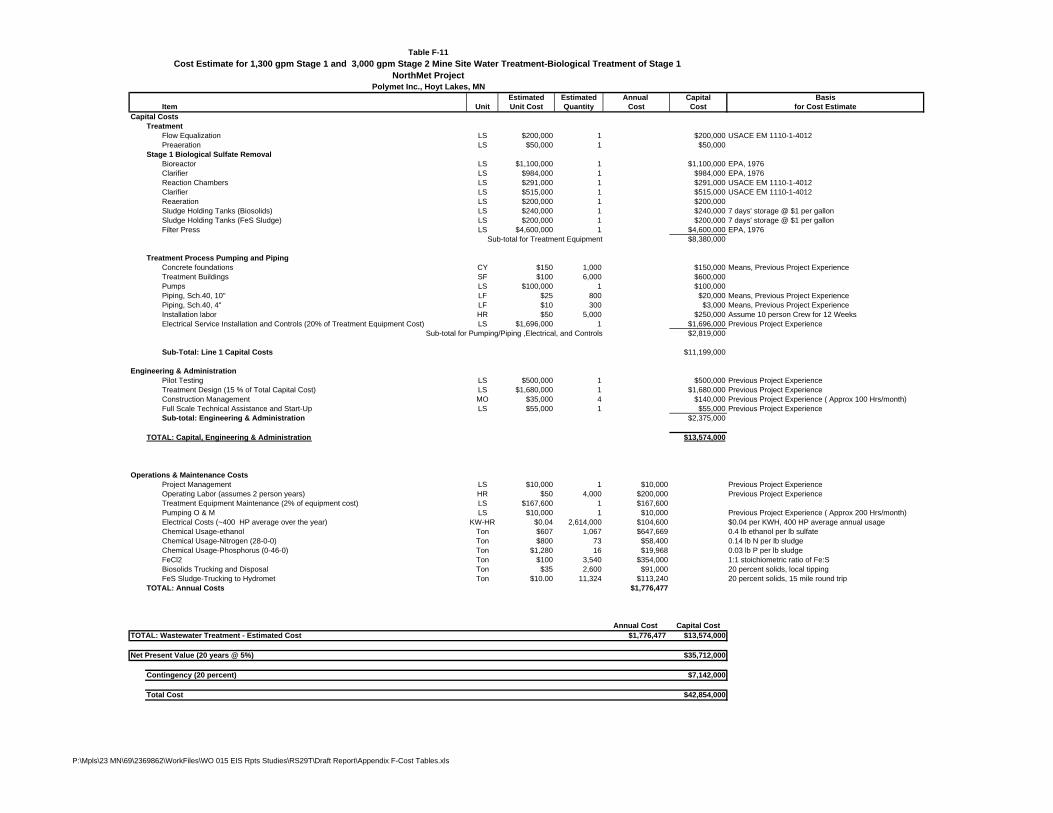
Estimated Estimated Annual Capital BasisItem Unit Unit Cost Quantity Cost Cost for Cost Estimate
Capital CostsTreatment
Flow Equalization LS $200,000 1 $200,000 USACE EM 1110-1-4012Preaeration LS $50,000 1 $50,000
Stage 1 Biological Sulfate RemovalBioreactor LS $1,100,000 1 $1,100,000 EPA, 1976Clarifier LS $984,000 1 $984,000 EPA, 1976Reaction Chambers LS $291,000 1 $291,000 USACE EM 1110-1-4012Clarifier LS $515,000 1 $515,000 USACE EM 1110-1-4012Reaeration LS $200,000 1 $200,000Sludge Holding Tanks (Biosolids) LS $240,000 1 $240,000 7 days' storage @ $1 per gallonSludge Holding Tanks (FeS Sludge) LS $200,000 1 $200,000 7 days' storage @ $1 per gallonFilter Press LS $4,600,000 1 $4,600,000 EPA, 1976
Sub-total for Treatment Equipment $8,380,000
Treatment Process Pumping and PipingConcrete foundations CY $150 1,000 $150,000 Means, Previous Project ExperienceTreatment Buildings SF $100 6,000 $600,000Pumps LS $100,000 1 $100,000Piping, Sch.40, 10" LF $25 800 $20,000 Means, Previous Project ExperiencePiping, Sch.40, 4" LF $10 300 $3,000 Means, Previous Project ExperienceInstallation labor HR $50 5,000 $250,000 Assume 10 person Crew for 12 Weeks Electrical Service Installation and Controls (20% of Treatment Equipment Cost) LS $1,696,000 1 $1,696,000 Previous Project Experience
Sub-total for Pumping/Piping ,Electrical, and Controls $2,819,000
Sub-Total: Line 1 Capital Costs $11,199,000
Engineering & AdministrationPilot Testing LS $500,000 1 $500,000 Previous Project ExperienceTreatment Design (15 % of Total Capital Cost) LS $1,680,000 1 $1,680,000 Previous Project ExperienceConstruction Management MO $35,000 4 $140,000 Previous Project Experience ( Approx 100 Hrs/month)Full Scale Technical Assistance and Start-Up LS $55,000 1 $55,000 Previous Project Experience Sub-total: Engineering & Administration $2,375,000
TOTAL: Capital, Engineering & Administration $13,574,000
Operations & Maintenance Costs Project Management LS $10,000 1 $10,000 Previous Project ExperienceOperating Labor (assumes 2 person years) HR $50 4,000 $200,000 Previous Project ExperienceTreatment Equipment Maintenance (2% of equipment cost) LS $167,600 1 $167,600Pumping O & M LS $10,000 1 $10,000 Previous Project Experience ( Approx 200 Hrs/month)Electrical Costs (~400 HP average over the year) KW-HR $0.04 2,614,000 $104,600 $0.04 per KWH, 400 HP average annual usageChemical Usage-ethanol Ton $607 1,067 $647,669 0.4 lb ethanol per lb sulfateChemical Usage-Nitrogen (28-0-0) Ton $800 73 $58,400 0.14 lb N per lb sludgeChemical Usage-Phosphorus (0-46-0) Ton $1,280 16 $19,968 0.03 lb P per lb sludgeFeCl2 Ton $100 3,540 $354,000 1:1 stoichiometric ratio of Fe:SBiosolids Trucking and Disposal Ton $35 2,600 $91,000 20 percent solids, local tippingFeS Sludge-Trucking to Hydromet Ton $10.00 11,324 $113,240 20 percent solids, 15 mile round trip
TOTAL: Annual Costs $1,776,477
Annual Cost Capital CostTOTAL: Wastewater Treatment - Estimated Cost $1,776,477 $13,574,000
Net Present Value (20 years @ 5%) $35,712,000
Contingency (20 percent) $7,142,000
Total Cost $42,854,000
Cost Estimate for 1,300 gpm Stage 1 and 3,000 gpm Stage 2 Mine Site Water Treatment-Biological Treatment of Stage 1NorthMet Project
Table F-11
Polymet Inc., Hoyt Lakes, MN
P:\Mpls\23 MN\69\2369862\WorkFiles\WO 015 EIS Rpts Studies\RS29T\Draft Report\Appendix F-Cost Tables.xls

Estimated Estimated Annual Capital BasisItem Unit Unit Cost Quantity Cost Cost for Cost Estimate
Capital CostsTreatment
Flow Equalization LS $200,000 1 $200,000 USACE EM 1110-1-4012Preaeration LS $50,000 1 $50,000
Stage 1 Hydroxide PrecipitationReaction Chambers LS $291,000 1 $291,000 USACE EM 1110-1-4012Clarifier LS $515,000 1 $515,000 USACE EM 1110-1-4012Recarbonation (Incl. Clarifier) LS $1,300,000 1 $1,300,000 EPA, 1976Sludge Holding Tanks (Gypsum, calcite) LS $350,000 1 $350,000 7 days' storage @ $1 per gallon
Stage 2 Biological Sulfate RemovalBioreactor LS $2,300,000 1 $2,300,000 EPA, 1976Clarifier LS $1,600,000 1 $1,600,000 EPA, 1976Reaction Chambers LS $603,000 1 $603,000 USACE EM 1110-1-4012Clarifier LS $1,200,000 1 $1,200,000 USACE EM 1110-1-4012Reaeration LS $200,000 1 $200,000Sludge Holding Tanks (Biosolids) LS $50,000 1 $50,000 7 days' storage @ $1 per gallonSludge Holding Tanks (FeS) LS $6,800 1 $6,800 7 days' storage @ $1 per gallonFilter Press LS $3,600,000 1 $3,600,000 EPA, 1976
Sub-total for Treatment Equipment $12,265,800
Treatment Process Pumping and PipingConcrete foundations CY $150 1,000 $150,000 Means, Previous Project ExperienceTreatment Buildings SF $100 6,000 $600,000Pumps LS $100,000 1 $100,000Piping, Sch.40, 10" LF $25 800 $20,000 Means, Previous Project ExperiencePiping, Sch.40, 4" LF $10 300 $3,000 Means, Previous Project ExperienceInstallation labor HR $50 5,000 $250,000 Assume 10 person Crew for 12 Weeks Electrical Service Installation and Controls (20% of Treatment Equipment Cost) LS $2,473,160 1 $2,473,160 Previous Project Experience
Sub-total for Pumping/Piping ,Electrical, and Controls $3,596,160
Sub-Total: Capital Costs $15,862,000
Engineering & AdministrationPilot Testing LS $500,000 1 $500,000 Previous Project ExperienceTreatment Design (15 % of Total Capital Cost) LS $2,379,000 1 $2,379,000 Previous Project ExperienceConstruction Management MO $35,000 4 $140,000 Previous Project Experience ( Approx 100 Hrs/month)Full Scale Technical Assistance and Start-Up LS $55,000 1 $55,000 Previous Project Experience Sub-total: Engineering & Administration $3,074,000
TOTAL: Capital, Engineering & Administration $18,936,000
Operations & Maintenance Costs Project Management LS $10,000 1 $10,000 Previous Project ExperienceOperating Labor (assumes 2 person years) HR $50 4,000 $200,000 Previous Project ExperienceTreatment Equipment Maintenance (2% of equipment cost) LS $245,316 1 $245,316Pumping O & M LS $10,000 1 $10,000 Previous Project Experience ( Approx 200 Hrs/month)Electrical Costs (~400 HP average over the year) KW-HR $0.04 2,614,000 $104,600 $0.04 per KWH, 400 HP average annual usageChemical Usage-Ethanol Ton $607 213 $129,291 0.4 lb ethanol per lb sulfateChemical Usage-Nitrogen (28-0-0) Ton $800 15 $12,000 0.14 lb N per lb sludgeChemical Usage-Phosphorus (0-46-0) Ton $1,280 3 $3,994 0.03 lb P per lb sludgeFeCl2 Ton $100 121 $12,100 1:1 stoichiometric ratio of Fe:S
Chemical Usage-Lime Ton $86 1,150 $98,900
400 mg/L lime Dosage from Preliminary CEMI Report + 2,688 mg/L for gypsum removal @ 170 gpm (yr 10 average, stage 1)
Biological Sludge Trucking and Disposal Ton $35 520 $18,200 20 percent solids, local tipping feeFeS sludge Trucking to Hydromet Ton $10.00 388 $3,880 20 percent solids, 15 mi trip to hydrometGypsum/Calcite Sludge Trucking to Residue Pile Ton $10.00 19,000 $190,000
TOTAL: Annual Costs $1,038,281
Annual Cost Capital CostTOTAL: Wastewater Treatment - Estimated Cost $1,038,281 $18,936,000
Net Present Value (20 years @ 5%) $31,875,000
Contingency (20 percent) $6,375,000
Total Cost $38,250,000
Cost Estimate for 1,300 gpm Stage 1 and 3,000 gpm Stage 2 Mine Site Process Water Treatment-Biological Treatment of Stage 2NorthMet Project
Table F-12
Polymet Inc., Hoyt Lakes, MN
P:\Mpls\23 MN\69\2369862\WorkFiles\WO 015 EIS Rpts Studies\RS29T\Draft Report\Appendix F-Cost Tables.xls

Appendix G
WWTF Treatment Estimates

Stage 2: Nanofiltration
Influent Streams [1]
Parameter Units 1 5 10 15 20
Flow gpm 85.8 99.6 50.1 120.6 120.6Alkalinity mg/L 0.67 72.5 72.5 72.5 72.5Hardness mg/L 0.48 1157 1729 1729 1729F mg/L 0.0040 9.73 55.1 27.6 27.6Cl mg/L 0.058 40.1 84.3 0.0 0.0
SO4 mg/L 0.35 845 2340 2340 2340
Al mg/L 0.013 1.68 1.68 1.68 1.68As mg/L 0.00067 0.71 0.71 0.71 0.71Ba mg/L 0.0013 0.19 0.19 0.19 0.19Be mg/L 0.000015 0.00020 0.00020 0.00020 0.00020B mg/L 0.00059 0.76 0.76 0.76 0.76Cd mg/L 0.0000030 0.00018 0.00018 0.00018 0.00018Ca mg/L 0.15 359 540 540 540Cr mg/L 0.000016 0.0015 0.0015 0.0015 0.0015Co mg/L 0.0000080 0.019 0.052 0.052 0.052Cu mg/L 0.00013 0.092 0.092 0.092 0.092Fe mg/L 0.0023 0.81 0.81 0.81 0.81Pb mg/L 0.0000095 0.023 0.053 0.053 0.053Mg mg/L 0.026 63.4 93.0 93.0 93.0Mn mg/L 0.00015 0.35 0.75 0.75 0.75Hg mg/L 6.81E-07 6.00E-06 6.00E-06 6.00E-06 6.00E-06Mo mg/L 0.0000041 0.0051 0.0051 0.0051 0.0051Ni mg/L 0.000037 0.089 0.51 0.25 0.25
PO4 mg/L 0.0030 0.20 0.20 0.20 0.20
K mg/L 0.11 49.0 49.0 49.0 49.0Se mg/L 0.000016 0.0029 0.0029 0.0029 0.0029
SiO2 mg/L 0.16 8.65 8.65 8.65 8.65
Ag mg/L 0.0000038 0.00070 0.00070 0.00070 0.00070Na mg/L 0.22 543 681 681 681Tl mg/L 0.0000015 0.000020 0.000020 0.000020 0.000020Zn mg/L 0.00020 0.090 0.090 0.090 0.090
NO3 mg-N/L 0.00075 0.52 1.09 0.0 0.0
NH4 mg-N/L 0.00075 0.52 1.09 0.0 0.0
Appendix G, Table G-1
WWTP Influent and Effluent Water Quality Projections
Flow Scenario: Low
YearCategory 1 and 2 Stockpile
RS29T G-1

Appendix G, Table G-1
WWTP Influent and Effluent Water Quality Projections
Flow Scenario: Low
Parameter Units 1 5 10 15 20
Flow gpm 201 774 820 0.0 0.0Alkalinity mg/L 60.6 64.3 63.9 0.0 0.0Hardness mg/L 93.5 73.1 77.4 0.0 0.0F mg/L 0.26 0.26 0.26 0.0 0.0Cl mg/L 1.30 1.31 1.31 0.0 0.0
SO4 mg/L 94.9 41.5 50.9 0.0 0.0
Al mg/L 0.60 0.28 0.33 0.0 0.0As mg/L 0.033 0.012 0.016 0.0 0.0Ba mg/L 0.027 0.017 0.019 0.0 0.0Be mg/L 0.00038 0.00028 0.00030 0.0 0.0B mg/L 0.13 0.10 0.10 0.0 0.0Cd mg/L 0.00068 0.00056 0.00053 0.0 0.0Ca mg/L 23.7 16.2 17.8 0.0 0.0Cr mg/L 0.0011 0.0011 0.0011 0.0 0.0Co mg/L 0.012 0.010 0.0092 0.0 0.0Cu mg/L 0.0094 0.0050 0.0059 0.0 0.0Fe mg/L 2.84 2.46 2.19 0.0 0.0Pb mg/L 0.0016 0.0013 0.0013 0.0 0.0Mg mg/L 8.38 7.95 8.04 0.0 0.0Mn mg/L 0.075 0.056 0.057 0.0 0.0Hg mg/L 5.08E-06 2.76E-06 3.07E-06 0.0 0.0Mo mg/L 0.0046 0.0047 0.0047 0.0 0.0Ni mg/L 0.16 0.13 0.12 0.0 0.0
PO4 mg/L 0.0 0.0 0.0 0.0 0.0
K mg/L 3.28 1.29 1.65 0.0 0.0Se mg/L 0.0020 0.0020 0.0020 0.0 0.0
SiO2 mg/L 0.0 0.0 0.0 0.0 0.0
Ag mg/L 0.00092 0.00095 0.00095 0.0 0.0Na mg/L 21.9 6.66 9.77 0.0 0.0Tl mg/L 0.0017 0.0019 0.0018 0.0 0.0Zn mg/L 0.18 0.16 0.14 0.0 0.0
NO3 mg-N/L 0.085 0.093 0.092 0.0 0.0
NH4 mg-N/L 0.085 0.093 0.092 0.0 0.0
East Pit Dewatering Year
RS29T G-2

Appendix G, Table G-1
WWTP Influent and Effluent Water Quality Projections
Flow Scenario: Low
Parameter Units 1 5 10 15 20
Flow gpm 125 170 263 604 960Alkalinity mg/L 52.2 42.7 42.3 53.7 60.5Hardness mg/L 115 197 210 138 102F mg/L 0.26 0.25 0.25 0.26 0.26Cl mg/L 1.27 1.24 1.25 1.28 1.30
SO4 mg/L 161 356 381 202 107
Al mg/L 1.13 2.15 2.25 1.22 0.65As mg/L 0.075 0.15 0.15 0.083 0.043Ba mg/L 0.061 0.084 0.084 0.052 0.032Be mg/L 0.00045 0.00081 0.00085 0.00053 0.00037B mg/L 0.15 0.27 0.28 0.18 0.13Cd mg/L 0.00044 0.00083 0.00086 0.00054 0.00038Ca mg/L 33.9 62.4 66.6 40.7 27.1Cr mg/L 0.0011 0.0012 0.0012 0.0011 0.0011Co mg/L 0.0057 0.0086 0.0087 0.0061 0.0041Cu mg/L 0.020 0.033 0.035 0.021 0.012Fe mg/L 0.56 1.43 1.37 0.83 0.61Pb mg/L 0.0015 0.0024 0.0025 0.0018 0.0014Mg mg/L 7.33 10.1 10.7 8.99 8.35Mn mg/L 0.074 0.13 0.14 0.087 0.057Hg mg/L 6.00E-06 6.00E-06 6.00E-06 6.00E-06 6.00E-06Mo mg/L 0.0033 0.0037 0.0039 0.0042 0.0046Ni mg/L 0.068 0.11 0.11 0.072 0.045
PO4 mg/L 0.0 0.0 0.0 0.0 0.0
K mg/L 7.76 13.4 14.0 7.70 3.98Se mg/L 0.0019 0.0021 0.0021 0.0021 0.0020
SiO2 mg/L 0.0 0.0 0.0 0.0 0.0
Ag mg/L 0.00070 0.00071 0.00074 0.00083 0.00091Na mg/L 46.4 101 108 56.2 28.5Tl mg/L 0.0010 0.00088 0.00093 0.0013 0.0017Zn mg/L 0.029 0.062 0.056 0.041 0.037
NO3 mg-N/L 0.051 0.043 0.045 0.067 0.082
NH4 mg-N/L 0.051 0.043 0.045 0.067 0.082
West Pit Dewatering/ Haul
Roads/ Central Pit Year
RS29T G-3

Appendix G, Table G-1
WWTP Influent and Effluent Water Quality Projections
Flow Scenario: Low
Parameter Units 1 5 10 15 20
Flow gpm 6.05 6.05 6.05 6.05 6.05Alkalinity mg/L 7.34 7.34 7.34 7.34 7.34Hardness mg/L 34.7 34.7 34.7 34.7 34.7F mg/L 0.058 0.058 0.058 0.058 0.058Cl mg/L 0.16 0.16 0.16 0.16 0.16
SO4 mg/L 32.0 32.0 32.0 32.0 32.0
Al mg/L 0.023 0.023 0.023 0.023 0.023As mg/L 0.0019 0.0019 0.0019 0.0019 0.0019Ba mg/L 0.0083 0.0083 0.0083 0.0083 0.0083Be mg/L 0.00014 0.00014 0.00014 0.00014 0.00014B mg/L 0.015 0.015 0.015 0.015 0.015Cd mg/L 0.000031 0.000031 0.000031 0.000031 0.000031Ca mg/L 10.3 10.3 10.3 10.3 10.3Cr mg/L 0.00014 0.00014 0.00014 0.00014 0.00014Co mg/L 0.0040 0.0040 0.0040 0.0040 0.0040Cu mg/L 0.0074 0.0074 0.0074 0.0074 0.0074Fe mg/L 0.010 0.010 0.010 0.010 0.010Pb mg/L 0.00011 0.00011 0.00011 0.00011 0.00011Mg mg/L 2.16 2.16 2.16 2.16 2.16Mn mg/L 0.032 0.032 0.032 0.032 0.032Hg mg/L 6.00E-06 6.00E-06 6.00E-06 6.00E-06 6.00E-06Mo mg/L 0.000048 0.000048 0.000048 0.000048 0.000048Ni mg/L 0.080 0.08 0.08 0.080 0.080
PO4 mg/L 0.021 0.021 0.021 0.021 0.021
K mg/L 1.47 1.47 1.47 1.47 1.47Se mg/L 0.00016 0.00016 0.00016 0.00016 0.00016
SiO2 mg/L 1.67 1.67 1.67 1.67 1.67
Ag mg/L 0.000035 0.000035 0.000035 0.000035 0.000035Na mg/L 1.52 1.52 1.52 1.52 1.52Tl mg/L 0.000014 0.000014 0.000014 0.000014 0.000014Zn mg/L 0.0030 0.0030 0.0030 0.0030 0.0030
NO3 mg-N/L 0.0021 0.0021 0.0021 0.0021 0.0021
NH4 mg-N/L 0.0021 0.0021 0.0021 0.0021 0.0021
Loadout Year
RS29T G-4

Appendix G, Table G-1
WWTP Influent and Effluent Water Quality Projections
Flow Scenario: Low
Parameter Units 1 5 10 15 20
Flow gpm 418 1050 1139 731 1086Alkalinity mg/L 45.0 61.3 59.0 56.4 61.5Hardness mg/L 79.9 196 180 400 282F mg/L 0.20 1.16 2.67 4.77 3.30Cl mg/L 1.02 4.98 4.94 1.06 1.15
SO4 mg/L 94 169 228 554 355
Al mg/L 0.63 0.72 0.83 1.28 0.76As mg/L 0.038 0.10 0.078 0.19 0.12Ba mg/L 0.032 0.044 0.041 0.074 0.049Be mg/L 0.00032 0.00036 0.00042 0.00048 0.00035B mg/L 0.11 0.19 0.17 0.28 0.20Cd mg/L 0.00046 0.00056 0.00059 0.00047 0.00035Ca mg/L 21.7 56.2 52.0 123 83.9Cr mg/L 0.00087 0.0011 0.0011 0.0012 0.0011Co mg/L 0.0075 0.011 0.011 0.014 0.009Cu mg/L 0.011 0.018 0.016 0.032 0.021Fe mg/L 1.53 2.12 1.93 0.82 0.63Pb mg/L 0.0012 0.0035 0.0039 0.010 0.0071Mg mg/L 6.26 13.5 12.4 22.8 17.7Mn mg/L 0.059 0.10 0.11 0.20 0.13Hg mg/L 4.47E-06 3.61E-06 3.89E-06 6.00E-06 6.00E-06Mo mg/L 0.0032 0.0046 0.0045 0.0043 0.0046Ni mg/L 0.10 0.13 0.13 0.10 0.07
PO4 mg/L 0.0009 0.019 0.009 0.033 0.022
K mg/L 3.94 7.79 6.58 14.5 9.0Se mg/L 0.0015 0.0021 0.0021 0.0022 0.0021
SiO2 mg/L 0.06 0.83 0.39 1.44 0.97
Ag mg/L 0.00065 0.00089 0.00089 0.00080 0.00088Na mg/L 24.5 72.8 61.9 159 101Tl mg/L 0.0011 0.0015 0.0015 0.0011 0.0015Zn mg/L 0.095 0.14 0.12 0.049 0.043
NO3 mg-N/L 0.065 0.15 0.15 0.0 0.0
NH4 mg-N/L 0.065 0.15 0.15 0.0 0.0
Stage 2 Combined Influent Year
RS29T G-5

Appendix G, Table G-1
WWTP Influent and Effluent Water Quality Projections
Flow Scenario: Low
Parameter Units 1 5 10 15 20
Flow gpm 376 945 1025 658 978Alkalinity mg/L 2.62 3.47 3.37 3.47 3.78Hardness mg/L 4.99 11.2 10.5 23.8 17.4F mg/L 0.012 0.065 0.15 0.27 0.19Cl mg/L 0.059 0.28 0.28 0.066 0.072
SO4 mg/L 5.76 9.64 13.1 32.2 21.3
Al mg/L 0.035 0.040 0.047 0.072 0.043As mg/L 0.0022 0.0056 0.0044 0.010 0.0066Ba mg/L 0.0019 0.0025 0.0024 0.0045 0.0031Be mg/L 0.000020 0.000021 0.000025 0.000033 0.000026B mg/L 0.0061 0.011 0.010 0.016 0.012Cd mg/L 0.000026 0.000032 0.000033 0.000028 0.000021Ca mg/L 1.37 3.21 3.02 7.29 5.17Cr mg/L 0.000050 0.000064 0.000064 0.000072 0.000070Co mg/L 0.00048 0.00063 0.00066 0.00094 0.00071Cu mg/L 0.00071 0.0010 0.0010 0.0021 0.0015Fe mg/L 0.085 0.12 0.11 0.046 0.035Pb mg/L 0.000068 0.00020 0.00022 0.00057 0.00040Mg mg/L 0.38 0.77 0.71 1.36 1.09Mn mg/L 0.0038 0.0056 0.0063 0.012 0.0090Hg mg/L 6.24E-07 5.52E-07 5.87E-07 1.39E-06 1.15E-06Mo mg/L 0.00018 0.00025 0.00025 0.00024 0.00026Ni mg/L 0.0067 0.0077 0.0085 0.0093 0.0077
PO4 mg/L 0.00038 0.0012 0.00076 0.0028 0.0023
K mg/L 0.24 0.45 0.38 0.87 0.57Se mg/L 0.000088 0.00012 0.00012 0.00013 0.00013
SiO2 mg/L 0.030 0.061 0.043 0.16 0.14
Ag mg/L 0.000037 0.000049 0.000050 0.000046 0.000051Na mg/L 1.39 4.06 3.46 8.89 5.67Tl mg/L 0.000063 0.000084 0.000086 0.000063 0.000082Zn mg/L 0.0053 0.0077 0.0067 0.0029 0.0025
NO3 mg-N/L 0.0037 0.0084 0.0082 0.0 0.0
NH4 mg-N/L 0.0037 0.0084 0.0082 0.0 0.0
Stage 2 Effluent [5] Year
RS29T G-6

Appendix G, Table G-1
WWTP Influent and Effluent Water Quality Projections
Flow Scenario: Low
Stage 1: Chemical Precipitation
Influent Streams [1]
Parameter Units 1 5 10 15 20
Flow gpm 3.79 14.7 25.3 34.4 10.0Alkalinity mg/L 72.5 72.5 72.5 72.5 72.5Hardness mg/L 1145 1729 5419 5436 5436F mg/L 3.29 9.70 12.2 17.0 85.5Cl mg/L 19.1 12.9 5.74 8.41 53.5
SO4 mg/L 1539 2340 9600 9600 9600
Al mg/L 1.68 1.68 83.0 83.0 83.0As mg/L 0.71 0.71 0.71 0.71 0.71Ba mg/L 0.19 0.19 0.19 0.19 0.19Be mg/L 0.00020 0.00020 0.0023 0.0023 0.0023B mg/L 0.73 0.76 0.76 0.76 0.76Cd mg/L 0.00018 0.00018 0.0149 0.0149 0.0149Ca mg/L 371 540 480 480 480Cr mg/L 0.0015 0.0015 0.0015 0.0015 0.0015Co mg/L 0.052 0.052 15.4 24.0 44.0Cu mg/L 0.092 0.092 21.8 33.9 202Fe mg/L 0.81 0.81 28.7 44.7 235Pb mg/L 0.0092 0.027 0.053 0.053 0.053Mg mg/L 53.1 93.0 1026 1030 1030Mn mg/L 0.75 0.75 47.0 47.0 47.0Hg mg/L 6.00E-06 6.00E-06 6.00E-06 6.00E-06 6.00E-06Mo mg/L 0.0051 0.0051 0.0051 0.0051 0.0051Ni mg/L 0.86 0.86 182 284 762
PO4 mg/L 0.20 0.20 0.20 0.20 0.20
K mg/L 49.0 49.0 38.0 38.0 38.0Se mg/L 0.0029 0.0029 0.0029 0.0029 0.0029
SiO2 mg/L 8.65 8.65 3.88 3.88 3.88
Ag mg/L 0.00070 0.00070 0.00070 0.00070 0.00070Na mg/L 267 681 338 338 338Tl mg/L 0.000020 0.000020 0.000060 0.000060 0.000060Zn mg/L 0.090 0.090 10.5 16.4 26
NO3 mg-N/L 0.20 0.14 0.060 0.088 0.56
NH4 mg-N/L 0.20 0.14 0.060 0.088 0.56
YearCategory 3 Stockpile
RS29T G-7

Appendix G, Table G-1
WWTP Influent and Effluent Water Quality Projections
Flow Scenario: Low
Parameter Units 1 5 10 15 20
Flow gpm 22.7 36.7 33.7 26.2 22.5Alkalinity mg/L 72.5 72.5 72.5 72.5 72.5Hardness mg/L 1432 1729 5436 5436 5436F mg/L 4.11 13.13 28.1 68.2 107Cl mg/L 23.8 9.82 17.7 61.4 31.5
SO4 mg/L 1925 2340 9600 9600 9600
Al mg/L 1.68 1.68 83.0 83.0 83.0As mg/L 0.71 0.71 0.71 0.71 0.71Ba mg/L 0.19 0.19 0.19 0.19 0.19Be mg/L 0.00020 0.00020 0.0023 0.0023 0.0023B mg/L 0.76 0.76 0.76 0.76 0.76Cd mg/L 0.00018 0.00018 0.015 0.015 0.015Ca mg/L 465 540 480 480 480Cr mg/L 0.0015 0.0015 0.0015 0.0015 0.0015Co mg/L 0.052 0.052 38.5 44.0 44.0Cu mg/L 0.092 0.092 54.3 136 202Fe mg/L 0.81 0.81 71.7 180 235Pb mg/L 0.012 0.037 0.053 0.053 0.053Mg mg/L 66.4 93.0 1030 1030 1030Mn mg/L 0.75 0.75 47.0 47.0 47.0Hg mg/L 6.00E-06 6.00E-06 6.00E-06 6.00E-06 6.00E-06Mo mg/L 0.0051 0.0051 0.0051 0.0051 0.0051Ni mg/L 0.86 0.86 455 762 762
PO4 mg/L 0.20 0.20 0.20 0.20 0.20
K mg/L 49.0 49.0 38.0 38.0 38.0Se mg/L 0.0029 0.0029 0.0029 0.0029 0.0029
SiO2 mg/L 8.65 8.65 3.88 3.88 3.88
Ag mg/L 0.00070 0.00070 0.00070 0.00070 0.00070Na mg/L 334 681 338 338 338Tl mg/L 0.000020 0.000020 0.000060 0.000060 0.000060Zn mg/L 0.090 0.090 26.0 26.0 26.0
NO3 mg-N/L 0.25 0.10 0.19 0.65 0.33
NH4 mg-N/L 0.25 0.10 0.19 0.65 0.33
YearCategory 3 LO Stockpile
RS29T G-8

Appendix G, Table G-1
WWTP Influent and Effluent Water Quality Projections
Flow Scenario: Low
Parameter Units 1 5 10 15 20
Flow gpm 2.87 22.9 25.8 23.3 0.92Alkalinity mg/L 4.61 20.3 47.4 63.5 72.5Hardness mg/L 602 2644 4891 5436 5436F mg/L 0.20 0.20 0.20 0.20 0.20Cl mg/L 6.51 11.2 5.63 0.28 16.1
SO4 mg/L 3107 9600 9600 9600 9600
Al mg/L 22.7 83.0 83.0 83.0 83.0As mg/L 0.044 0.19 0.45 0.61 0.71Ba mg/L 0.19 0.19 0.19 0.19 0.19Be mg/L 0.0023 0.0023 0.0023 0.0023 0.0023B mg/L 0.76 0.76 0.76 0.76 0.76Cd mg/L 0.015 0.015 0.015 0.015 0.015Ca mg/L 97.3 427 480 480 480Cr mg/L 0.0015 0.0015 0.0015 0.0015 0.0015Co mg/L 2.39 10.5 24.6 32.9 44.0Cu mg/L 0.29 1.29 3.03 4.06 107Fe mg/L 235 235 235 235 235Pb mg/L 0.053 0.053 0.053 0.053 0.053Mg mg/L 87.4 384 898 1030 1030Mn mg/L 7.67 33.7 47.0 47.0 47.0Hg mg/L 6.00E-06 6.00E-06 6.00E-06 6.00E-06 6.00E-06Mo mg/L 0.0016 0.0051 0.0051 0.0051 0.0051Ni mg/L 34.9 153 358 480 762
PO4 mg/L 0.20 0.20 0.20 0.20 0.20
K mg/L 38.0 38.0 38.0 38.0 38.0Se mg/L 0.0029 0.0029 0.0029 0.0029 0.0029
SiO2 mg/L 3.88 3.88 3.88 3.88 3.88
Ag mg/L 0.00070 0.00070 0.00070 0.00070 0.00070Na mg/L 45.4 199 338 338 338Tl mg/L 0.000060 0.000060 0.000060 0.000060 0.000060Zn mg/L 26.0 26.0 26.0 26.0 26.0
NO3 mg-N/L 0.092 0.16 0.080 0.0040 0.23
NH4 mg-N/L 0.092 0.16 0.080 0.0040 0.23
YearCategory 4 Stockpile
RS29T G-9

Appendix G, Table G-1
WWTP Influent and Effluent Water Quality Projections
Flow Scenario: Low
Parameter Units 1 5 10 15 20
Flow gpm 35.0 35.0 35.0 35.0 35.0Alkalinity mg/L 0.40 6.68 9.62 25.8 20.7Hardness mg/L 51.9 872 1255 3207 2702F mg/L 0.18 0.20 0.20 0.20 0.20Cl mg/L 0.62 0.56 1.41 0.27 1.75
SO4 mg/L 268 4499 6475 9600 9600
Al mg/L 1.96 32.9 47.3 83.0 83.0As mg/L 0.0038 0.06 0.09 0.25 0.20Ba mg/L 0.028 0.19 0.19 0.19 0.19Be mg/L 0.0023 0.0023 0.0023 0.0023 0.0023B mg/L 0.11 0.76 0.76 0.76 0.76Cd mg/L 0.015 0.015 0.015 0.015 0.015Ca mg/L 8.38 141 203 480 436Cr mg/L 0.00066 0.0015 0.0015 0.0015 0.0015Co mg/L 0.21 3.47 4.99 13.4 10.7Cu mg/L 0.025 0.43 0.61 1.65 1.32Fe mg/L 50.6 235 235 235 235Pb mg/L 0.0061 0.053 0.053 0.053 0.053Mg mg/L 7.53 127 182 488 392Mn mg/L 0.66 11.1 16.0 42.8 34.4Hg mg/L 6.00E-06 6.00E-06 6.00E-06 6.00E-06 6.00E-06Mo mg/L 0.00014 0.0023 0.0033 0.0051 0.0051Ni mg/L 3.00 50.5 72.7 195 156
PO4 mg/L 0.097 0.20 0.20 0.20 0.20
K mg/L 8.22 38.0 38.0 38.0 38.0Se mg/L 0.0029 0.0029 0.0029 0.0029 0.0029
SiO2 mg/L 3.88 3.88 3.88 3.88 3.88
Ag mg/L 0.00015 0.00070 0.00070 0.00070 0.00070Na mg/L 3.91 65.8 94.6 254 204Tl mg/L 0.000060 0.000060 0.000060 0.000060 0.000060Zn mg/L 3.19 26.0 26.0 26.0 26.0
NO3 mg-N/L 0.0079 0.0072 0.018 0.0035 0.022
NH4 mg-N/L 0.0079 0.0072 0.018 0.0035 0.022
Lean Ore Surge Pile Year
RS29T G-10

Appendix G, Table G-1
WWTP Influent and Effluent Water Quality Projections
Flow Scenario: Low
Parameter Units 1 5 10 15 20
Flow gpm 41.8 105 114 73.1 109Alkalinity mg/L 427 582 560 536 585Hardness mg/L 759 1860 1715 3801 2681F mg/L 1.94 11.0 25.4 45.3 31.3Cl mg/L 9.7 47.3 47.0 10.1 10.9
SO4 mg/L 898 1602 2165 5259 3369
Al mg/L 5.98 6.80 7.91 12.2 7.20As mg/L 0.36 0.95 0.75 1.76 1.11Ba mg/L 0.30 0.42 0.39 0.71 0.47Be mg/L 0.0031 0.0034 0.0040 0.0045 0.0033B mg/L 1.01 1.78 1.65 2.64 1.93Cd mg/L 0.0044 0.0054 0.0056 0.0045 0.0034Ca mg/L 206 534 494 1167 797Cr mg/L 0.0082 0.011 0.011 0.011 0.011Co mg/L 0.071 0.10 0.10 0.13 0.09Cu mg/L 0.10 0.17 0.16 0.31 0.20Fe mg/L 14.6 20.2 18.3 7.81 5.95Pb mg/L 0.011 0.034 0.037 0.097 0.067Mg mg/L 59.5 129 117 217 168Mn mg/L 0.56 0.92 1.01 1.86 1.27Hg mg/L 4.24E-05 3.43E-05 3.70E-05 5.70E-05 5.49E-05Mo mg/L 0.030 0.043 0.043 0.041 0.044Ni mg/L 0.94 1.19 1.28 0.97 0.65
PO4 mg/L 0.009 0.18 0.08 0.32 0.21
K mg/L 37.5 74.0 62.5 137 85.1Se mg/L 0.015 0.020 0.020 0.021 0.020
SiO2 mg/L 0.53 7.9 3.70 13.7 9.2
Ag mg/L 0.0062 0.0084 0.0084 0.0076 0.0084Na mg/L 233 692 588 1509 957Tl mg/L 0.011 0.014 0.015 0.011 0.014Zn mg/L 0.90 1.31 1.14 0.47 0.41
NO3 mg-N/L 0.62 1.42 1.39 0.0 0.0
NH4 mg-N/L 0.62 1.42 1.39 0.0 0.0
YearStage 2 Brine [5]
RS29T G-11

Appendix G, Table G-1
WWTP Influent and Effluent Water Quality Projections
Flow Scenario: Low
Removal
Parameter Units 1 5 10 15 20 Rate
Flow gpm 106 214 234 192 177 NAAlkalinity mg/L 187 306 298 239 376 0% [4]Hardness mg/L 679 1751 2934 4407 3205 0% [4]F mg/L 1.83 8.35 17.8 29.7 37.7 75% [2]Cl mg/L 10.0 27.0 26.9 13.8 14.2 0% [4]
SO4 mg/L 992 3106 5507 7947 5776 [3]
Al mg/L 4.03 18.0 41.1 56.0 36.5 99% [2]As mg/L 0.32 0.67 0.61 1.01 0.85 50% [3]Ba mg/L 0.18 0.30 0.29 0.39 0.36 0% [4]Be mg/L 0.0021 0.0023 0.0031 0.0031 0.0029 0% [4]B mg/L 0.64 1.26 1.19 1.48 1.48 5% [3]Cd mg/L 0.0071 0.0067 0.010 0.011 0.0078 0% [4]Ca mg/L 199 460 445 742 666 0% [4]Cr mg/L 0.0039 0.0060 0.0059 0.0052 0.0072 0% [4]Co mg/L 0.17 1.75 10.7 16.8 10.5 99.8% [3]Cu mg/L 0.079 0.31 10.7 25.6 38.0 99.5% [2]Fe mg/L 28.9 73.5 83.5 107 94.4 99.9% [2]Pb mg/L 0.011 0.039 0.045 0.070 0.062 0% [4]Mg mg/L 44.4 147 443 622 375 95% [2]Mn mg/L 0.83 6.04 19.9 29.1 16.5 99.9% [3]Hg mg/L 2.04E-05 1.99E-05 2.11E-05 2.54E-05 3.73E-05 0% [4]Mo mg/L 0.013 0.023 0.023 0.019 0.029 0% [4]Ni mg/L 2.51 25.4 136 249 175 99.9% [3]
PO4 mg/L 0.09 0.19 0.14 0.24 0.21 50% [2]
K mg/L 30.7 58.3 50.0 75.8 66.9 0% [4]Se mg/L 0.0075 0.011 0.011 0.010 0.013 0% [4]
SiO2 mg/L 3.75 6.99 3.79 7.6 7.1 0% [4]
Ag mg/L 0.0027 0.0045 0.0045 0.0033 0.0054 0% [4]Na mg/L 175 534 424 769 691 0% [4]Tl mg/L 0.0043 0.0071 0.0071 0.0041 0.0086 0% [4]Zn mg/L 2.13 7.68 12.2 14.6 10.3 90% [3]
NO3 mg-N/L 0.31 0.74 0.72 0.11 0.080 0% [4]
NH4 mg-N/L 0.31 0.74 0.72 0.11 0.080 0% [4]
YearStage 1 Combined Influent
RS29T G-12

Appendix G, Table G-1
WWTP Influent and Effluent Water Quality Projections
Flow Scenario: Low
Parameter Units 1 5 10 15 20
Flow gpm 106 214 234 192 177Alkalinity mg/L 187 306 298 239 376Hardness mg/L 679 1751 2934 4407 3205F mg/L 1.83 2.09 4.45 7.42 9.43Cl mg/L 10.0 27.0 26.9 13.8 14.2
SO4 mg/L 992 1500 1500 1500 1500
Al mg/L 0.040 0.18 0.41 0.56 0.36As mg/L 0.16 0.33 0.30 0.51 0.43Ba mg/L 0.18 0.30 0.29 0.39 0.36Be mg/L 0.0021 0.0023 0.0031 0.0031 0.0029B mg/L 0.61 1.20 1.13 1.40 1.41Cd mg/L 0.0071 0.0067 0.010 0.011 0.0078Ca mg/L 199 460 445 742 666Cr mg/L 0.0039 0.0060 0.0059 0.0052 0.0072Co mg/L 0.00035 0.0035 0.021 0.034 0.021Cu mg/L 0.00040 0.0016 0.053 0.13 0.19Fe mg/L 0.029 0.074 0.084 0.11 0.094Pb mg/L 0.011 0.039 0.045 0.070 0.062Mg mg/L 2.22 7.35 22.2 31.1 18.8Mn mg/L 0.00083 0.0060 0.020 0.029 0.016Hg mg/L 2.04E-05 1.99E-05 2.11E-05 2.54E-05 3.73E-05Mo mg/L 0.013 0.023 0.023 0.019 0.029Ni mg/L 0.0025 0.025 0.14 0.25 0.18
PO4 mg/L 0.045 0.10 0.072 0.12 0.10
K mg/L 30.7 58.3 50.0 75.8 66.9Se mg/L 0.0075 0.011 0.011 0.010 0.013
SiO2 mg/L 3.75 6.99 3.79 7.6 7.1
Ag mg/L 0.0027 0.0045 0.0045 0.0033 0.0054Na mg/L 175 534 424 769 691Tl mg/L 0.0043 0.0071 0.0071 0.0041 0.0086Zn mg/L 0.21 0.77 1.2 1.5 1.0
NO3 mg-N/L 0.31 0.74 0.72 0.11 0.080
NH4 mg-N/L 0.31 0.74 0.72 0.11 0.080
Stage 1 Effluent Year
RS29T G-13

Appendix G, Table G-1
WWTP Influent and Effluent Water Quality Projections
Flow Scenario: Low
Parameter Units 1 5 10 15 20
Flow gpm 482 1159 1259 850 1155Alkalinity mg/L 43.0 59.3 58.0 56.5 60.6Hardness mg/L 153 333 553 1013 505F mg/L 0.41 0.44 0.95 1.88 1.60Cl mg/L 2.24 5.22 5.22 3.16 2.23
SO4 mg/L 222 285 289 363 247
Al mg/L 0.036 0.066 0.114 0.182 0.092As mg/L 0.037 0.066 0.060 0.12 0.071Ba mg/L 0.041 0.058 0.055 0.091 0.057Be mg/L 0.00047 0.00045 0.00060 0.00073 0.00046B mg/L 0.14 0.23 0.22 0.33 0.23Cd mg/L 0.0016 0.0013 0.0020 0.0025 0.0012Ca mg/L 44.8 87.5 85.0 173 106Cr mg/L 0.00089 0.0012 0.0012 0.0012 0.0012Co mg/L 0.00040 0.0011 0.0045 0.0082 0.0037Cu mg/L 0.00055 0.0011 0.011 0.030 0.030Fe mg/L 0.073 0.11 0.10 0.060 0.044Pb mg/L 0.0024 0.0074 0.0085 0.0161 0.0098Mg mg/L 0.76 1.97 4.67 8.00 3.71Mn mg/L 0.0027 0.0055 0.0085 0.015 0.009Hg mg/L 4.67E-06 3.83E-06 4.09E-06 6.00E-06 6.00E-06Mo mg/L 0.0031 0.0045 0.0045 0.0044 0.0046Ni mg/L 0.0048 0.010 0.031 0.061 0.030
PO4 mg/L 0.010 0.018 0.014 0.029 0.017
K mg/L 6.93 11.13 9.57 17.75 10.68Se mg/L 0.0017 0.0022 0.0022 0.0023 0.0022
SiO2 mg/L 0.83 1.33 0.72 1.78 1.14
Ag mg/L 0.00062 0.00087 0.00087 0.00079 0.00087Na mg/L 39.6 102.0 81.4 180 111Tl mg/L 0.00098 0.0014 0.0014 0.00097 0.0014Zn mg/L 0.051 0.15 0.23 0.33 0.16
NO3 mg-N/L 0.071 0.14 0.14 0.024 0.012
NH4 mg-N/L 0.071 0.14 0.14 0.024 0.012
YearStages 1 and 2 Effluents
RS29T G-14

Appendix G, Table G-1
WWTP Influent and Effluent Water Quality Projections
Flow Scenario: Low
Parameter Units 1 5 10 15 20
Overburden Flow gpm 214 237 138 54 0CPS Effluent Flow gpm 696 1396 1397 903 1155Alkalinity mg/L 41.7 69.2 104 138 98.3Hardness mg/L 106 276 498 952 505F mg/L 0.28 0.36 0.85 1.77 1.60Cl mg/L 1.55 4.34 4.70 2.98 2.23
SO4 mg/L 154 237 260 341 247
Al mg/L 0.025 0.055 0.103 0.171 0.092As mg/L 0.026 0.055 0.054 0.12 0.071Ba mg/L 0.029 0.048 0.050 0.085 0.057Be mg/L 0.00033 0.00037 0.00054 0.00069 0.00046B mg/L 0.10 0.19 0.20 0.31 0.23Cd mg/L 0.0011 0.0010 0.0018 0.0023 0.0012Ca mg/L 150 150 150 150 150Cr mg/L 0.00062 0.0010 0.0010 0.0012 0.0012Co mg/L 0.00028 0.0009 0.0040 0.0077 0.0037Cu mg/L 0.00038 0.0009 0.010 0.028 0.030Fe mg/L 0.050 0.091 0.093 0.056 0.044Pb mg/L 0.0017 0.0061 0.0077 0.015 0.0098Mg mg/L 0.53 1.64 4.21 7.52 3.71Mn mg/L 0.0019 0.0046 0.0077 0.014 0.009Hg mg/L 3.24E-06 3.18E-06 3.69E-06 5.64E-06 6.00E-06Mo mg/L 0.0021 0.0038 0.0041 0.0042 0.0046Ni mg/L 0.0033 0.009 0.028 0.057 0.030
PO4 mg/L 0.0069 0.015 0.012 0.027 0.017
K mg/L 4.80 9.24 8.63 16.7 10.7Se mg/L 0.0012 0.0018 0.0019 0.0021 0.0022
SiO2 mg/L 0.57 1.10 0.65 1.68 1.14
Ag mg/L 0.00043 0.00072 0.00078 0.00074 0.00087Na mg/L 27.4 84.7 73.4 170 111Tl mg/L 0.00068 0.0011 0.0013 0.00091 0.0014Zn mg/L 0.035 0.12 0.21 0.31 0.16
NO3 mg-N/L 0.049 0.12 0.13 0.022 0.012
NH4 mg-N/L 0.049 0.12 0.13 0.022 0.012
Notes
[1] Concentrations based upon information presented in RS42 Appendix I.[2] Removal efficiency based upon results of solubility modeling using the USGS Software PHREEQC.[3] Removal efficiency based upon results of treatability study (RS45).[4] Conservative engineering estimate.[5] Stage 2 effluent based upon 90% water recovery and 95% mass removal.
CPS Effluent Flow Year
RS29T G-15
Appendix H
Chemical Balance: Pilot Plant Flotation Process

RS29T H-i
Appendix H Chemical Balance: Pilot Plant Flotation Process
Table of Contents
1.0 Introduction ............................................................................................................................. H-1
2.0 Pilot Plant Water Balance ........................................................................................................ H-1
3.0 Pilot Plant Mass Balance.......................................................................................................... H-2 3.1 Regression Analysis of Pilot Plant Solute Data ................................................................ H-5 3.2 Charge Balance and Saturation Indices........................................................................... H-11
4.0 Conclusion of Analysis of Pilot Plant Flotation Data ............................................................. H-12
5.0 Comparison of Pilot Plant and Proposed Full-Scale Operations............................................. H-12

RS29T H-ii
List of Tables
Table H1 Loading to Process Water at the Conclusion of the Pilot Plant Run Due to Components of the Mass Balance
Table H2 Concentration of Constituents Not Modeled Due to Insufficient Data Points or “No Detect” Readings
Table H3 Solute Concentrations in the Tailings Discharge at the Conclusion of the Pilot Plant Run
Table H4 Corrected Solute Concentrations from Table H3 and Process Water Quality Targets
Table H5 Summary of PHREEQC Modeling Results
Table H6 Summary of Operational Parameters at Pilot and Full-Scale Operation
List of Figures
Figure H1 Regression Curve and Pilot Plant Data for Total Sulfate Concentration in the Process Water
Figure H2 Regression Curve and Pilot Plant Data for Dissolved Copper Concentration in the Process Water
Figure H3 Regression Curve and Pilot Plant Data for Dissolved Nickel Concentration in the Process Water
Figure H4 Regression Curve and Pilot Plant Data for Dissolved Calcium Concentration in the Process Water
Figure H5 Regression Curve and Pilot Plant Data for Dissolved Magnesium Concentration in the Process Water
Figure H6 Regression Curve and Pilot Plant Data for Total Chloride Concentration in the Process Water
Figure H7 Regression Curves and Pilot Plant Data for Dissolved Cobalt Concentration in the Process Water
Figure H8 Regression Curves and Pilot Plant Data for Dissolved Molybdenum Concentration in the Process Water
Figure H9 Regression Curves and Pilot Plant Data for Nitrate + Nitrite Concentration in the Process Water
Figure H10 Regression Curves and Pilot Plant Data for Phenol 4AAP Concentration in the Process Water
List of Attachments
Attachment H1 SDS Lakefield Research Project 11263-001 Report No. 1 (selected pages)
Attachment H2 Environmental Sampling and Analysis Flotation Process Optimization Test (selected pages)
RS29T H-1
1.0 Introduction This appendix contains a summary of the work completed to develop a mathematical model that
describes the water quality of the flotation process water during the operation of the pilot plant by
Lakefield Research Limited in April 2006. The model was developed from a mass balance equation
and used the operating parameters for the pilot plant and the analytical data from samples collected
during the test run to estimate the potential solute loading from the flotation process. The pilot plant
operating data were reported in the SGS Lakefield Research Project 11263-001 Report No. 1 dated
July 5, 2006. Relevant portions of this report are included in Attachment H1. Analytical results for
the process water flows, which were used in conjunction with the mass balance model to develop the
chemical balance, are reported in the Environmental Sampling and Analysis Flotation Process
Optimization Test Report prepared by Barr Engineering in July 2006. Relevant portions of this
report are included in Attachment H2.
The following paragraphs present the development of the hydraulic balance for the pilot test and the
development of the mass balance model for the pilot test. The approach presented in this appendix
addressed the chemical balance of all pollutants measured during the pilot plant operation. This
work was completed based upon agreement with the MDNR that this method was an acceptable
approach. The final phase of this work compares the results of the pilot test to the proposed full-
scale operation.
2.0 Pilot Plant Water Balance The hydraulic operating data for the pilot plant water balance were obtained from SGS Lakefield
Research Project 11263-001 Report No. 1 dated July 5, 2006 (pages 17-27) and addendums dated
August 16, 2006 and August 17, 2006. The flotation pilot plant had a total system volume of 4,632
liters (11263-001 Table 7). Approximately 4,200 L of the total system volume was contained in two
water recycle tanks. The bulk flotation circuit – which included all the pilot-scale processes where
water was in contact with the ore, concentrate, or tailings – had a total volume of approximately
432 L.
The reported flow rate for the water inside the flotation pilot plant was 447 L/h (11263-001
Table 11). The system was operated with one inlet flow and two water losses. The inlet flow was
make-up water at an average rate of 50.8 L/h (August 16 addendum corrected using August 17
addendum). Cake moisture losses in the tailings after filter pressing were 42.5 L/h (August 16

RS29T H-2
addendum). Water exiting the system into the concentrate surge tank was later decanted and added
back into the system. This will not be done in the full-scale operation and may have resulted in
potentially higher concentrations of some parameters as the pilot test compares to full-scale
operations. After dewatering, the moisture content of the concentrate was an average of 52.9 percent,
resulting in water losses of 8.3 L/h (August 17 addendum). No significant spillage was reported
during the testing and evaporation during the test was considered minimal. Sample collection during
the test removed approximately 70 liters of water, or an additional loss of less than 2 L/h.
Based on the total volume (4,632 L) of the system and the inlet water flow rate of 50.8 L/hr, the
recycle ratio of the complete pilot system was 0.89. This system would need to be operated for 8.8
cycles to complete one full exchange of the process water, or approximately 91 hours. Because the
operating time of the pilot system (for parcels PP-2 through PP-6) was 32 hours, this duration may
have limited the potential maximum concentrations that may have been observed in the pilot system.
However, because the active volume of the bulk flotation circuit alone is only 432 L, and the internal
flow rate for this component of the pilot test was 447 L/hr, any mass transfer between the water and
the solid phases in the water in these portions of the pilot test would be limited to fast reactions, and
those reactions would be well-represented in the pilot plant. Long-term dissolution and equilibrium
will need to be addressed in the water quality modeling for the tailings basin (work being completed
by SRK).
3.0 Pilot Plant Mass Balance To estimate the concentration of any substance in solution within the pilot plant process water, a
mass balance equation was used. The mass balance considered the entire volume of the pilot plant to
correspond to the analytical data collected during the pilot testing. Analytical data included the
chemistry of the make-up water and the chemistry of the water that was recycled back to the storage
tanks at the completion of the bulk flotation process. The basic form of the mass balance was as
follows:
(Accumulation) = (Make-up water flow in) – (Tailings filter cake losses) – (Concentrate moisture
losses) + (Mass transfer from ore) + (Reagent addition) (1)
This mass balance can also be expressed mathematically as follows:
( ) ( ) ( )( )F M F s
dC tV F C F C t kV C C t m
dt= − + − + & (2)
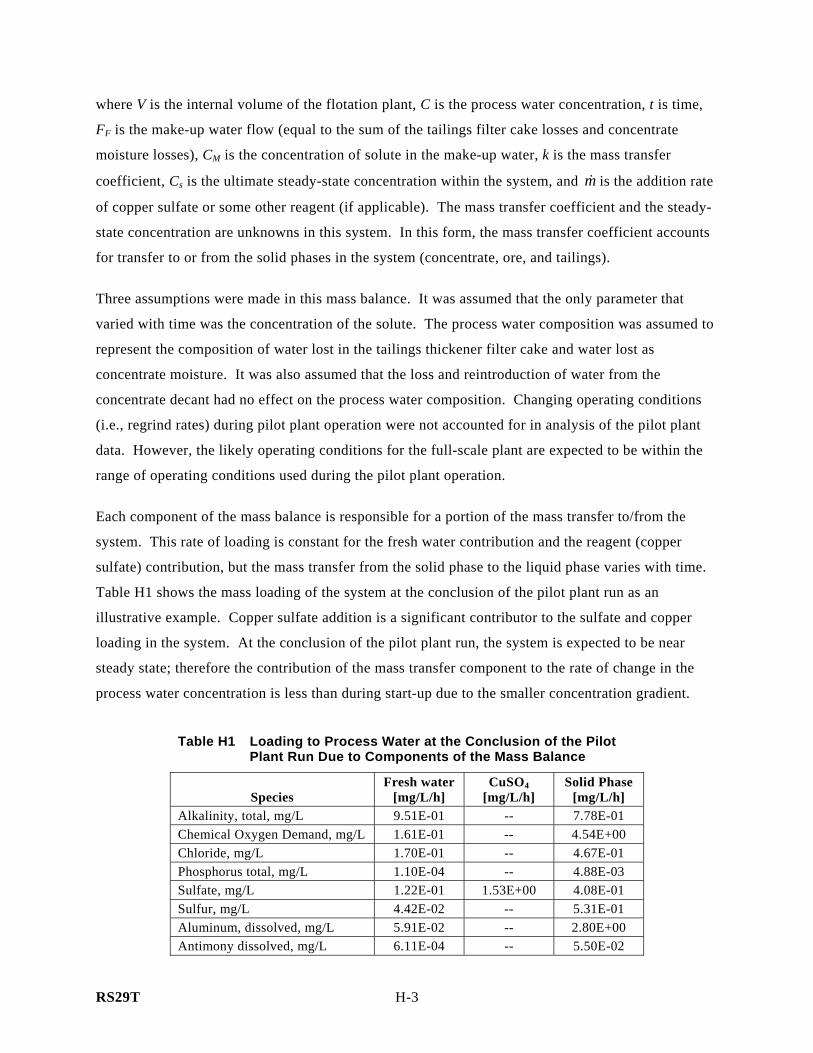
RS29T H-3
where V is the internal volume of the flotation plant, C is the process water concentration, t is time,
FF is the make-up water flow (equal to the sum of the tailings filter cake losses and concentrate
moisture losses), CM is the concentration of solute in the make-up water, k is the mass transfer
coefficient, Cs is the ultimate steady-state concentration within the system, and m& is the addition rate
of copper sulfate or some other reagent (if applicable). The mass transfer coefficient and the steady-
state concentration are unknowns in this system. In this form, the mass transfer coefficient accounts
for transfer to or from the solid phases in the system (concentrate, ore, and tailings).
Three assumptions were made in this mass balance. It was assumed that the only parameter that
varied with time was the concentration of the solute. The process water composition was assumed to
represent the composition of water lost in the tailings thickener filter cake and water lost as
concentrate moisture. It was also assumed that the loss and reintroduction of water from the
concentrate decant had no effect on the process water composition. Changing operating conditions
(i.e., regrind rates) during pilot plant operation were not accounted for in analysis of the pilot plant
data. However, the likely operating conditions for the full-scale plant are expected to be within the
range of operating conditions used during the pilot plant operation.
Each component of the mass balance is responsible for a portion of the mass transfer to/from the
system. This rate of loading is constant for the fresh water contribution and the reagent (copper
sulfate) contribution, but the mass transfer from the solid phase to the liquid phase varies with time.
Table H1 shows the mass loading of the system at the conclusion of the pilot plant run as an
illustrative example. Copper sulfate addition is a significant contributor to the sulfate and copper
loading in the system. At the conclusion of the pilot plant run, the system is expected to be near
steady state; therefore the contribution of the mass transfer component to the rate of change in the
process water concentration is less than during start-up due to the smaller concentration gradient.
Table H1 Loading to Process Water at the Conclusion of the Pilot Plant Run Due to Components of the Mass Balance
Species Fresh water
[mg/L/h] CuSO4
[mg/L/h] Solid Phase
[mg/L/h] Alkalinity, total, mg/L 9.51E-01 -- 7.78E-01 Chemical Oxygen Demand, mg/L 1.61E-01 -- 4.54E+00 Chloride, mg/L 1.70E-01 -- 4.67E-01 Phosphorus total, mg/L 1.10E-04 -- 4.88E-03 Sulfate, mg/L 1.22E-01 1.53E+00 4.08E-01 Sulfur, mg/L 4.42E-02 -- 5.31E-01 Aluminum, dissolved, mg/L 5.91E-02 -- 2.80E+00 Antimony dissolved, mg/L 6.11E-04 -- 5.50E-02

RS29T H-4
Table H1 Loading to Process Water at the Conclusion of the Pilot Plant Run Due to Components of the Mass Balance
Species Fresh water
[mg/L/h] CuSO4
[mg/L/h] Solid Phase
[mg/L/h] Arsenic, dissolved, mg/L 5.48E-03 -- 2.49E+00 Barium, dissolved, mg/L 3.22E-07 -- 4.75E-05 Boron, dissolved, mg/L 1.09E-01 -- 5.74E+00 Cadmium, dissolved, mg/L 2.66E-04 -- 2.40E-02 Calcium, dissolved, mg/L 3.81E-01 -- -7.74E-02 Chromium, dissolved, mg/L 2.22E-03 -- 2.00E-01 Cobalt, dissolved, mg/L 2.30E-06 -- -5.49E-08 Copper, dissolved, mg/L 2.30E-06 9.36E-01 -2.58E-06 Magnesium, dissolved, mg/L 3.86E-02 -- 7.52E-02 Manganese, dissolved, mg/L 2.40E-02 -- 1.09E+01 Molybdenum dissolved, mg/L 2.37E-06 -- 2.63E-04 Nickel, dissolved, mg/L 1.49E-05 -- 3.32E-05 Potassium, dissolved, mg/L 2.19E-02 -- 2.00E-01 Selenium, dissolved, mg/L 1.10E-02 -- 1.68E-02 Silicon, dissolved, mg/L 4.38E+01 -- 5.72E+03 Sodium dissolved, mg/L 1.02E+02 -- 2.95E+03 Zinc, dissolved, mg/L 7.00E-02 -- 3.13E-01 Nitrate + Nitrite, mg/L 3.69E-03 -- 3.40E-01 Nitrogen total kjeldahl, mg/L 4.02E-03 -- -7.30E-04 Phenol 4AAP, mg/L 1.83E-04 -- 9.14E-05 Sulfite, mg/L 2.19E-02 -- 2.14E-01 Surfactants MBAS, mg/L 6.58E-04 -- 9.21E-03 pH, standard units 8.60E-02 -- 7.07E-03 Tetrathionate, mg/L 2.19E-03 -- 1.33E-02 Tetrathionate, filtered, mg/L 2.19E-03 -- 3.68E-03 Thiosulphate, mg/L 2.19E-03 -- 2.91E-01 Thiosulphate, filtered, mg/L 2.19E-03 -- 1.48E-01 Trithionate, mg/L 2.19E-02 -- 2.64E-01 Trithionate, filtered, mg/L 2.19E-02 -- 1.14E-01
The steady-state concentration value for the pilot plant is dependent on the hydraulic retention time
of the system and the kinetics of the mass transfer between the solid phases and the process water. In
the case of a fast reaction, where the reaction time is significantly less than the hydraulic retention
time of the system, the process water would reach a steady-state concentration before the entire
system is flushed one time. In the case of a very slow reaction, where the time to chemical
equilibrium is significantly longer than the hydraulic retention time, the steady-state concentration
will be dependent on the hydraulic retention of the system. Modeling of this system through
32 hours will address all reactions where the mass transfer is not limited by the hydraulic retention of

RS29T H-5
the pilot system. Any additional mass transfer, which would occur over a longer duration, will be
addressed in the water quality modeling for the tailings basin.
Solving this differential equation for concentration as a function of time results in the following
equation:
( ) expF M s F M s FO
F F
F C kVC m F C kVC m F kVC t C tF kV F kV V
⎛ ⎞ ⎡ ⎤+ + + + +⎛ ⎞= + − −⎜ ⎟ ⎜ ⎟⎢ ⎥+ + ⎝ ⎠⎣ ⎦⎝ ⎠
& & (3)
where C0 is the initial concentration of the system. The form of the equation was then reduced to a
simple parametric model of the form:
( ) ( )tDBAtC ⋅⋅+= exp (4)
where A, B, and D are lumped parameters derived from the mass balance equation. As shown in
equation number 3, the time dependence of concentration is non-linear in nature and cannot be
simplified to a linear form due to unknown values within the parameter A.
3.1 Regression Analysis of Pilot Plant Solute Data The MathCAD function ‘genfit’ was used to perform a non-linear regression of the pilot plant data fit
to the form of Equation 4. In addition, the Matlab functions ‘nlinfit’, ‘nlpredci’, and ‘nlparci’ were
used to cross-check the regression results and to obtain confidence intervals. Data from PP-1 were
not used because that run was discontinuous from the subsequent runs and represented only start-up
conditions. Table 1 of Attachment H2 contains a list of the tailings thickener overflow concentration
data, which represents the process water. Table 2 of Attachment H2 contains a summary of the
solute concentrations in the make-up water, which were averaged. The values used in the regression
analyses for the parameters included in this memo are highlighted.
The regression provides values for the parameters A, B, and D for Equation 4. These values together
with the known values in the expression of these parameters (in Equation 3) were then used to
calculate values of the mass transfer coefficient and the steady-state concentration (k and Cs
respectively) in the overall mass balance equation for the pilot plant.
An initial demonstration of the proposed chemical balance modeling approach was performed using
the data sets for six solutes: sulfate (total), chloride (total), nickel (dissolved), copper (dissolved),
calcium (dissolved), and magnesium (dissolved). The lines of the best-fit non-linear regression along

RS29T H-6
with the pilot plant data points for each of these four analytes are shown in Figures H1 through H6.
Total metal concentrations were not modeled. The curves shown on Figures H1 through H6 can be
classified into two different shapes – increasing or decreasing. Sulfate (Figure H1), magnesium
(Figure H5), and chloride (Figure H6) show increasing trends. Copper (Figure H2), nickel
(Figure H3), and calcium (Figure H4) show decreasing trends.
Additional parameters have been modeled to give an overall picture of the process water
composition. Solutes present only in low levels (“no-detect” laboratory results) were not modeled.
Solutes with limited concentration data or little variation in data points (ammonia, total suspended
solids, dissolved sulfite, carbon disulfide, methyl isobutyl alcohol) could not be successfully modeled
with this regression technique due to non-convergence. Table H2 contains information on the
concentration of these solutes. All other solutes were analyzed to identify the most appropriate
model for each on a solute-by-solute basis.
Table H2 Concentration of Constituents Not Modeled Due to Insufficient Data Points or “No Detect” Readings
Parameter Concentration
[mg/L] Alkalinity, (hydrox.) as @CaCO3, mg/L <2 Bromide, mg/L <0.2 Carbonate, mg/L 2 [1] Cyanide <0.01 Fluoride, mg/L <0.4 Nitrogen, ammonia as N 0.9 [1] Solids, total suspended, mg/L 862 [1] Sulfide total, mg/L <2 Sulfide, dissolved, mg/L <2 Sulfite, dissolved, mg/L 3 [1] Chlorine, mg/L <0.1 Thiosalt, mg/L <10 Thiosalt, filtered, mg/L <10 Beryllium, dissolved <0.00002 Iron, dissolved <0.02 Lead, dissolved <0.00002 Mercury, dissolved 0.0000018 [1] Silver, dissolved <0.00002 Thallium dissolved <0.00002 Tin dissolved <0.0001 Titanium dissolved <0.01 1-Pentanol <0.4 2-Pentanol <0.1

RS29T H-7
Table H2 Concentration of Constituents Not Modeled Due to Insufficient Data Points or “No Detect” Readings
Parameter Concentration
[mg/L] 3-Pentanol <0.1 Benzene <0.0005 Carbon disulfide 0.00073 [1] Ethyl benzene <0.0005 Methyl isobutyl alcohol 0.0042 [1] Toluene <0.0005 Xylene m & p <0.0005 Xylene o- <0.0005
[1] Maximum detected value.
Thiosalts may be generated from processing sulfidic ores. The oxidation of thiosalts in tailings
basins is sufficiently slow that the sulfuric acid generated can generally be neutralized. Thiosalts
were below the detection level during pilot plant operation. Therefore, thiosalts are not expected to
significantly contribute to acidity within the tailings basin or the process water loop.
Inspection of the data suggests that most parameters considered for this work appear to be near
steady-state conditions by the completion of the pilot test (i.e., the concentrations are not changing
with time). This implies that the kinetics of the dominant mass transfer processes for these chemical
are faster than the hydraulic retention time of the pilot system. The estimated solute concentrations
at the conclusion of the pilot plant run are shown in Table H3. For each additional parameter, the
general shape of the regression curve (increasing or decreasing) is also noted in Table H3, in lieu of
additional figures.
Table H3 Solute Concentrations in the Tailings Discharge at the Conclusion of the Pilot Plant Run
Species Concentration
[mg/L] 95% Confidence Interval [mg/L] R2 [1] R2 [2]
Increasing / Decreasing
Alkalinity, total, mg/L 157 ( 150, 165 ) 0.97 0.92 Increasing Chemical Oxygen Demand, mg/L 429 ( 383, 474 ) 0.96 0.96 Increasing Chloride, mg/L 52.4 ( 47.3, 57.4 ) 0.97 0.91 Increasing Phosphorus total, mg/L 0.45 ( 0.27, 0.64 ) 0.66 0.63 Increasing Sulfate, mg/L 125 ( 103, 147 ) 0.90 0.33 Increasing Sulfur, mg/L 42.5 ( 36.5, 48.6 ) 0.89 0.47 Increasing Aluminum, dissolved 0.128 ( 0.11, 0.15 ) 0.74 0.38 Increasing Antimony dissolved 0.0032 ( 0.0028, 0.0035 ) -0.77 -0.29 Increasing Arsenic, dissolved 0.0053 ( 0.0046, 0.0061 ) 0.74 0.74 Increasing

RS29T H-8
Table H3 Solute Concentrations in the Tailings Discharge at the Conclusion of the Pilot Plant Run
Species Concentration
[mg/L] 95% Confidence Interval [mg/L] R2 [1] R2 [2]
Increasing / Decreasing
Barium, dissolved 0.0043 ( 0.0039, 0.0046 ) 0.90 0.86 Increasing Boron, dissolved 0.15 ( 0.13, 0.17 ) 0.79 0.37 Increasing Cadmium, dissolved 0.00011 ( 0.00009, 0.00012 ) -0.11 -0.01 Increasing Calcium, dissolved 19.3 ( 18.5, 20.1 ) 0.97 0.94 Decreasing Chromium, dissolved 0.00032 ( 0.00025, 0.00038 ) 0.12 0.07 Decreasing Cobalt, dissolved 0.00020 ( 0.00012, 0.00029 ) 0.00 -0.47 Decreasing Copper, dissolved 0.00051 ( 0.00008, 0.00095 ) 0.54 0.15 Decreasing Magnesium, dissolved 10.4 ( 9.7, 11 ) 0.89 0.78 Increasing Manganese, dissolved 0.0058 ( 0.0055, 0.0061 ) 0.90 0.87 Increasing Molybdenum dissolved 0.024 ( 0.019, 0.029 ) 0.63 -0.57 Increasing Nickel, dissolved, mg/L 0.0043 ( 0.0037, 0.005 ) 0.59 0.59 Decreasing Potassium, dissolved 20.3 ( 17.7, 22.8 ) 0.78 0.34 Increasing Selenium, dissolved 0.0014 ( 0, 0.0028 ) 0.12 0.01 Decreasing Silicon, dissolved 6.74 ( 6.44, 7.03 ) 0.85 0.84 Increasing Sodium dissolved 108 ( 97, 119 ) 0.88 0.64 Increasing Zinc, dissolved 0.0093 ( -0.0117, 0.0303 ) 0.07 0.02 Increasing Nitrate + Nitrite 0.56 ( 0.54, 0.59 ) -1.07 -0.30 Increasing Nitrogen total kjeldahl 0.30 ( 0.21, 0.39 ) 0.16 0.15 Increasing Phenol 4AAP, mg/L 0.025 ( 0.01, 0.04 ) -0.19 -1.35 Increasing Sulfite, mg/L 2.88 ( 2.44, 3.33 ) 0.87 0.83 Increasing Surfactants MBAS, mg/L 0.90 ( 0.53, 1.27 ) 0.63 0.08 Increasing pH, standard units 8.48 ( 8.35, 8.62 ) 0.61 0.59 Increasing Tetrathionate, mg/L 0.56 ( 0.33, 0.79 ) 0.73 0.51 Increasing Tetrathionate, filtered, mg/L 0.39 ( 0.19, 0.59 ) 0.58 0.40 Increasing Thiosulphate, mg/L 9.83 ( 8.16, 11.51 ) 0.94 0.82 Increasing Thiosulphate, filtered, mg/L 9.89 ( 9.31, 10.47 ) 0.99 0.98 Increasing Trithionate, mg/L 7.19 ( 5.17, 9.22 ) 0.86 0.54 Increasing Trithionate, filtered, mg/L 6.80 ( 5.42, 8.18 ) 0.91 0.73 Increasing
[1] Comparison with line of zero slope at the average concentration. [2] Comparison with linear regression model.
Confidence intervals for the non-linear model of each parameter were obtained using the regression
software. Uncertainties of the parameters A, B, and D were given directly by the regression software.
For the period of time covering the pilot plant operation, upper and lower 95 percent confidence
intervals were also given directly by the regression software. Two correlation coefficients were
developed to compare the non-linear regression model to a zero-slope line at the mean of the data
points and a linear regression model, discussed below. This information is also shown in Table H3.

RS29T H-9
Correlation coefficients were developed to quantify the “goodness of fit” of the model, shown in
Table H3.1 For nonlinear regression, the fit of the model was compared to two linear models, a
horizontal line and a linear regression as described below. Neither linear model has a theoretical
basis for application in this type of process. However, the linear models provide a basis for
evaluating the non-linear results obtained from the model.
One linear model was a horizontal (constant value) line at the mean of the data points.
Mathematically, the correlation coefficient between the non-linear regression model and a horizontal
line is defined as
2
2 1
2
1
( )1
( )
n
i regi
n
ii
C CR
C C
=
=
−= −
−
∑
∑ (5)
where Ci is a concentration data point, C is the mean of the concentration data points, and Creg is the
concentration predicted by the model. When the value is equal to zero, the fit is no better than the
linear model which simply uses the average value. This quantity can be less than zero, despite being
identified as a “squared” value, if the fit of the linear model is superior to the proposed model.2 In a
few cases, the R2 value is less than zero, which indicates that the proposed non-linear model does not
provide the best fit to the data. In these cases, the most conservative model (highest modeled
concentration at the end of the pilot plant) will be applied to estimate the process water quality.
The non-linear model was also compared to a linear regression model. A similar R2 value was
derived for comparison of the residuals of the nonlinear regression and the residuals of the linear
regression. In a few cases (cobalt, molybdenum, nitrate+nitrite, and phenol 4AAP), the R2 value is
less than zero, which indicates that the proposed non-linear model does not provide the best fit to the
data. In these cases, the most conservative model was applied to estimate the process water quality.
Corrected results are presented in Table H4, and graphical results for these species are presented in
Figures H7 through H10.
1 http://www.graphpad.com/curvefit/goodness_of_fit.htm 2 http://www.graphpad.com/curvefit/goodness_of_fit.htm

RS29T H-10
Water discharged from the full-scale flotation process will be directed to the tailings basin. This
water will be reused in the process and not discharged to surface water. Additional modeling of the
tailings basin water quality will be completed using the estimated water quality for the full-scale
flotation process. As a preliminary estimate of the potential effect of the process water flows on the
tailings basin water quality, the final estimated concentrations in Table H4 are compared to process
water quality targets for the project as described in Section 3 of RS29T. Based on these process
water quality targets, the process water entering the tailings basin from the flotation operation meets
process water quality targets for all parameters except aluminum. However, it is expected that the
dissolved aluminum analytical results are high due to the presence of aluminum in colloidal particles.
Table H4 Corrected Solute Concentrations from Table H3 and Process Water Quality Targets
Species Concentration
[mg/L] 95% Confidence Interval [mg/L]
Process Water Quality Targets
[mg/L] Alkalinity, total, mg/L 157 ( 150, 165 ) NA Chemical Oxygen Demand, mg/L 429 ( 383, 474 ) NA Chloride, mg/L 52.4 ( 47.3, 57.4 ) 230 Phosphorus total, mg/L 0.45 ( 0.27, 0.64 ) NA Sulfate, mg/L 125 ( 103, 147 ) 250 Sulfur, mg/L 42.5 ( 36.5, 48.6 ) NA Aluminum, dissolved 0.128 ( 0.11, 0.15 ) 0.125 Antimony dissolved 0.0032 ( 0.0028, 0.0035 ) 0.031 Arsenic, dissolved 0.0053 ( 0.0046, 0.0061 ) 0.050 Barium, dissolved 0.0043 ( 0.0039, 0.0046 ) 2.0 Boron, dissolved 0.15 ( 0.13, 0.17 ) 0.50 Cadmium, dissolved 0.00011 ( 0.00009, 0.00012 ) 0.004 Calcium, dissolved 19.3 ( 18.5, 20.1 ) NA Chromium, dissolved 0.00032 ( 0.00025, 0.00038 ) 0.10 Cobalt, dissolved 0.00011 ( 0.00001, 0.00021 ) 0.005 Copper, dissolved 0.00051 ( 0.00008, 0.00095 ) 0.030 Magnesium, dissolved 10.4 ( 9.7, 11 ) NA Manganese, dissolved 0.0058 ( 0.0055, 0.0061 ) 0.050 Molybdenum dissolved 0.035 ( 0.030, 0.040 ) NA Nickel, dissolved, mg/L 0.0043 ( 0.0037, 0.005 ) 0.100 Potassium, dissolved 20.3 ( 17.7, 22.8 ) NA Selenium, dissolved 0.0014 ( 0, 0.0028 ) 0.005 Silicon, dissolved 6.74 ( 6.44, 7.03 ) NA Sodium dissolved 108 ( 97, 119 ) NA Zinc, dissolved 0.0093 ( -0.0117, 0.0303 ) 0.388 Nitrate + Nitrite 0.53 ( 0.47, 0.59 ) 10 Nitrogen total kjeldahl 0.30 ( 0.21, 0.39 ) NA Phenol 4AAP, mg/L 0.033 ( 0.028, 0.037 ) 0.123

RS29T H-11
Table H4 Corrected Solute Concentrations from Table H3 and Process Water Quality Targets
Species Concentration
[mg/L] 95% Confidence Interval [mg/L]
Process Water Quality Targets
[mg/L] Sulfite, mg/L 2.88 ( 2.44, 3.33 ) NA Surfactants MBAS, mg/L 0.90 ( 0.53, 1.27 ) NA pH, standard units 8.48 ( 8.35, 8.62 ) 6.5-8.5 Tetrathionate, mg/L 0.56 ( 0.33, 0.79 ) NA Tetrathionate, filtered, mg/L 0.39 ( 0.19, 0.59 ) NA Thiosulphate, mg/L 9.83 ( 8.16, 11.51 ) NA Thiosulphate, filtered, mg/L 9.89 ( 9.31, 10.47 ) NA Trithionate, mg/L 7.19 ( 5.17, 9.22 ) NA Trithionate, filtered, mg/L 6.80 ( 5.42, 8.18 ) NA
[1] Comparison with line of zero slope at the average concentration. [2] Comparison with linear regression model.
3.2 Charge Balance and Saturation Indices The USGS model PHREEQC was used to perform a charge balance of the results and to calculate
saturation indices for various parameters. Analytical data at the conclusion of the pilot plant run
(Hour 31) and the model predictions at that time were chosen as representative data sets for analysis.
There were minor parameters (i.e., thiosulfate) that PHREEQC did not have the capability to model
and were not included. A summary of the results is shown in Table H5. The charge balance for each
data set was within 20 percent of neutrality. A variety of surface chemistry issues, such as
adsorption/desorption equilibria, and organic matter within the system are complications that
PHREEQC does not adequately account for in its model. As a result, it is unlikely that the
discrepancy in the charge balance can be closed through practical means. Complete PHREEQC
modeling output files are available upon request.
Table H5 Summary of PHREEQC Modeling Results Parameter Analytical Modeled pH 7.979 7.956 pe 6.617 7.134 Activity of water 1 1 Ionic strength 9.05E-03 7.83E-03 Total alkalinity (eq/kg) 1.45E-03 1.44E-03 Electrical balance (eq) 2.45E-03 1.58E-03 Percent error, 100*(Cat-|An|)/(Cat+|An|) 17.84% 13.24%

RS29T H-12
The saturation indices provided by PHREEQC indicate high levels of aluminum dissolved in the
system. Aluminum is not a desired product extracted as concentrate, but is present in the ore.
Therefore, it is not unexpected that aluminum-containing species are at or near levels of saturation.
4.0 Conclusion of Analysis of Pilot Plant Flotation Data The contribution of solute loading to the process water from contact with solids in the flotation
process has been quantified using a mass balance model. The model is capable of predicting steady-
state concentrations within an acceptable confidence interval. The non-linear regression model
provides a superior fit to the pilot plant data compared to a linear regression model and a horizontal
line at the mean of the data points for most solutes. For the other parameters, the most conservative
model was applied to estimate the water quality of the process water. Modeling of the process water
shows an acceptable charge balance and saturation characteristics.
5.0 Comparison of Pilot Plant and Proposed Full-Scale Operations The operation of the full-scale plant will be different from the pilot scale plant in several areas.
These differences will include the extent of weathering of the crude ore prior to processing, the ratio
of water to ore in the flotation plant, reagent addition rates, water recycle ratio, differences in
concentrate handling, make-up water source, and inclusion of the tailings basin in the flotation plant
recycle loop. These differences may result in different mass loading rates in the full-scale plant, and
ultimately different process water quality. Table H6 summarizes the operational parameters for the
pilot scale and full-scale operation.

RS29T H-13
Table H6 Summary of Operational Parameters at Pilot and Full-Scale Operation
Stream Pilot Plant Full-Scale Plant Units
Water Recycle Rate 447 2,231,030 L/h Fresh Water Rate 50.8 250,000 L/h Fraction of Water Recycled 0.89 0.89 L/L Cycles (theoretical) 8.80 8.92 cycles Internal Volume of Flotation Plant 4,632.5 5,201,000 L Ore Rate 0.20 1,343 t/hr CuSO4 Addition Rate 57 55 g/t Process Water/Ore Mass Ratio 2.24 1.66 t/t Cake Moisture Losses/Water To Tailings Basin 42.5 2,205,822 L/h Water Exiting With Concentrate 8.31 25,200 L/h Water From Tailings Basin NA 1,785,006 L/h
To compare the results of the pilot plant operation to the expected full-scale operations, a parallel
analysis of the contribution of pollutants to the process water from the ore was conducted by SRK
using geochemical principles. Sulfate was used as a basis for comparison between the parallel
analyses. SRK predicted that 0.60 tons per day of sulfate will be contributed to the process water
from the ore at full-scale operation. Addition of copper sulfate would also contribute to the sulfate
load in the process water. Using an addition ratio of 55 grams of copper sulfate per ton of ore
processed at 32,000 tons per day of ore processed, 0.68 tons per day of sulfate will be contributed to
the process water from the copper sulfate. Thus, a total of 1.28 tons per day of sulfate will be
contributed to the process water from the flotation plant.
There are two goals for this discussion. The first goal is to demonstrate that this loading rate is
consistent with what was observed during the pilot plant operation. The second goal is to assess
which method is more conservative in predicting pollutant load to the tailings basin. To reach these
goals, the mass loading calculated by SRK was converted to the scale of the pilot plant. The mass
loading of sulfate was also calculated from the regression parameters derived in this memorandum.
The sulfate mass loading rate of 0.68 tons per day was scaled down by using the ore throughput rates
of the pilot plant and the full-scale plant. The ratio between ore throughput rates is 1.50 x 10⁻⁴,
therefore, the equivalent mass loading at the pilot scale is 1.02 x 10⁻⁴ tons of sulfate per day.
The mass loading rate during pilot plant operation was dependent upon the concentration of the
process water C, which is the basis for the mass transfer driving force. The concentration at which

RS29T H-14
the mass loading rate is 1.02 x 10⁻⁴ tons of sulfate per day was back-calculated using the parameters
derived from the regression. The mass transfer coefficient k is 0.07 h-1, the ultimate steady-state
concentration within the system CS is 131 mg/L, and the internal volume used is 4632.5 L. The
calculated value of C, the process water concentration for sulfate, is 117.9 mg/L when the loading
rate is 1.02 x 10⁻⁴ tons of sulfate per day.
Above this concentration, the mass loading calculated using the methods presented in this
memorandum will be less than predicted by SRK due to the decreased driving force. Below this
concentration, the opposite is true. Regression analysis showed that the steady-state concentration of
sulfate was 125 mg/L during pilot plant operation with an ultimate steady-state concentration CS of
131 mg/L. As in the pilot plant, the time it takes to approach steady state will be very small relative
to the total time of operation for the full-scale plant. Based on the existing sulfate concentrations in
the tailings basin, it is expected that the process water concentration will be greater than 118 mg/L
for a much greater period of time than it will be less than 118 mg/L. Therefore, the mass loading
prediction by SRK should be conservative relative to the mass loading predicted by this
memorandum, and may overestimate the sulfate load to the process water loop.
The prediction by SRK has been shown to be conservative, but not by a large margin. These
independent methods of prediction, however, have similar results, which speaks to the validity of
each. The methods and results presented in this memorandum strengthen the predictions of SRK.
It is likely that the pollutant loading of the process water from the ore may be greater in the full-scale
plant than in the pilot plant for other reasons as well. For example, the ore used in the pilot plant was
not subjected to the same treatment as the ore will be in the full-scale plant. Prior to the pilot test,
the ore was kept in a covered building in larger fragments than is typical in a stockpile. Decreasing
ore fragment size increases the surface area available for oxidation and its overall reactivity with
water.
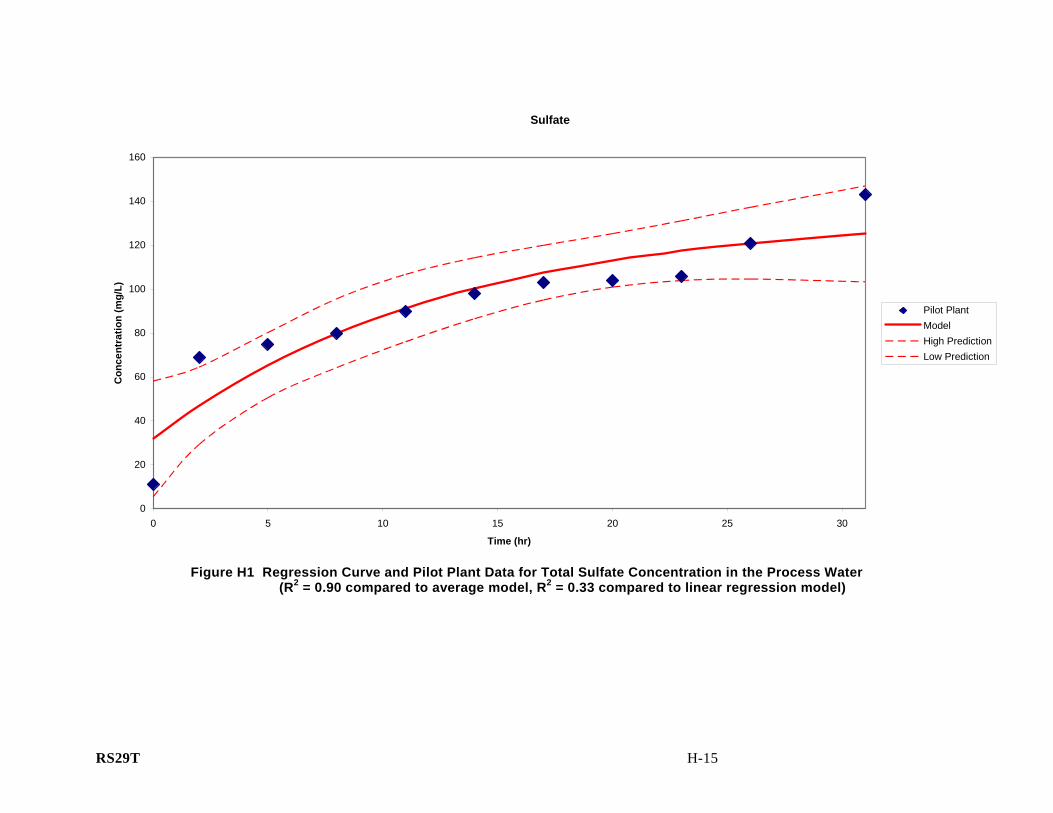
RS29T H-15
Sulfate
0
20
40
60
80
100
120
140
160
0 5 10 15 20 25 30
Time (hr)
Con
cent
ratio
n (m
g/L)
Pilot PlantModelHigh PredictionLow Prediction
Figure H1 Regression Curve and Pilot Plant Data for Total Sulfate Concentration in the Process Water
(R2 = 0.90 compared to average model, R2 = 0.33 compared to linear regression model)

RS29T H-16
Copper (dissolved)
0
0.0002
0.0004
0.0006
0.0008
0.001
0.0012
0.0014
0.0016
0.0018
0.002
0 5 10 15 20 25 30
Time (hr)
Con
cent
ratio
n (m
g/L)
Pilot PlantModelHigh PredictionLow Prediction
Figure H2 Regression Curve and Pilot Plant Data for Dissolved Copper Concentration in the Process Water
(R2 = 0.54 compared to average model, R2 = 0.15 compared to linear regression model)
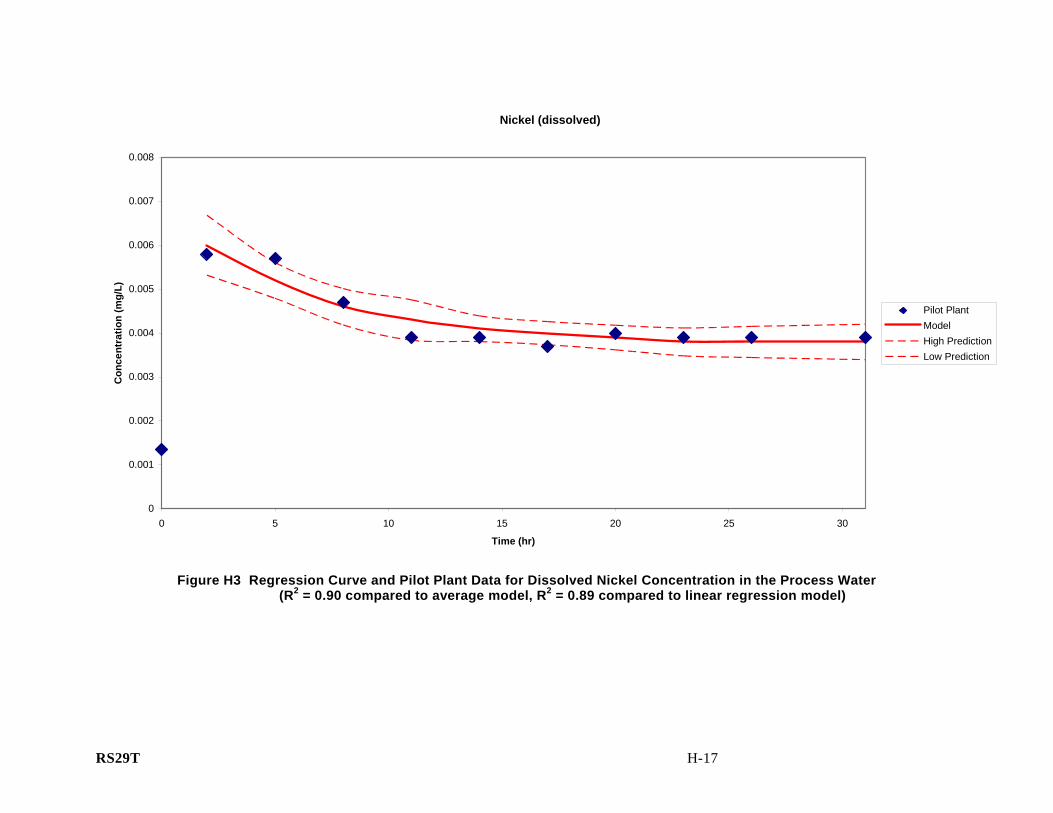
RS29T H-17
Nickel (dissolved)
0
0.001
0.002
0.003
0.004
0.005
0.006
0.007
0.008
0 5 10 15 20 25 30
Time (hr)
Con
cent
ratio
n (m
g/L)
Pilot PlantModelHigh PredictionLow Prediction
Figure H3 Regression Curve and Pilot Plant Data for Dissolved Nickel Concentration in the Process Water
(R2 = 0.90 compared to average model, R2 = 0.89 compared to linear regression model)

RS29T H-18
Calcium (dissolved)
0
5
10
15
20
25
30
35
40
45
0 5 10 15 20 25 30
Time (hr)
Con
cent
ratio
n (m
g/L)
Pilot PlantModelHigh PredictionLow Prediction
Figure H4 Regression Curve and Pilot Plant Data for Dissolved Calcium Concentration in the Process Water (R2 = 0.97 compared to average model, R2 = 0.94 compared to linear regression model)

RS29T H-19
Magnesium (dissolved)
0
2
4
6
8
10
12
14
0 5 10 15 20 25 30
Time (hr)
Con
cent
ratio
n (m
g/L)
Pilot PlantModelHigh PredictionLow Prediction
Figure H5 Regression Curve and Pilot Plant Data for Dissolved Magnesium Concentration in the Process Water (R2 = 0.89 compared to average model, R2 = 0.78 compared to linear regression model)

RS29T H-20
Chloride
0
10
20
30
40
50
60
70
0 5 10 15 20 25 30
Time (hr)
Con
cent
ratio
n (m
g/L)
Pilot PlantModelHigh PredictionLow Prediction
Figure H6 Regression Curve and Pilot Plant Data for Total Chloride Concentration in the Process Water
(R2 = 0.97 compared to average model, R2 = 0.91 compared to linear regression model)

RS29T H-21
Cobalt (dissolved)
0
0.0001
0.0002
0.0003
0.0004
0.0005
0.0006
0 5 10 15 20 25 30
Time (hr)
Con
cent
ratio
n (m
g/L) Pilot Plant
Non-linear ModelHigh PredictionLow PredictionLinear ModelHigh PredictionLow Prediction
Figure H7 Regression Curves and Pilot Plant Data for Dissolved Cobalt Concentration in the Process Water
(R2 = 0.00 compared to average model, R2 = -0.47 compared to linear regression model)

RS29T H-22
Molybdenum (dissolved)
0
0.005
0.01
0.015
0.02
0.025
0.03
0.035
0.04
0.045
0 5 10 15 20 25 30
Time (hr)
Con
cent
ratio
n (m
g/L) Pilot Plant
Non-linear ModelHigh PredictionLow PredictionLinear ModelHigh PredictionLow Prediction
Figure H8 Regression Curves and Pilot Plant Data for Dissolved Molybdenum Concentration in the Process Water
(R2 = 0.63 compared to average model, R2 = -0.57 compared to linear regression model)
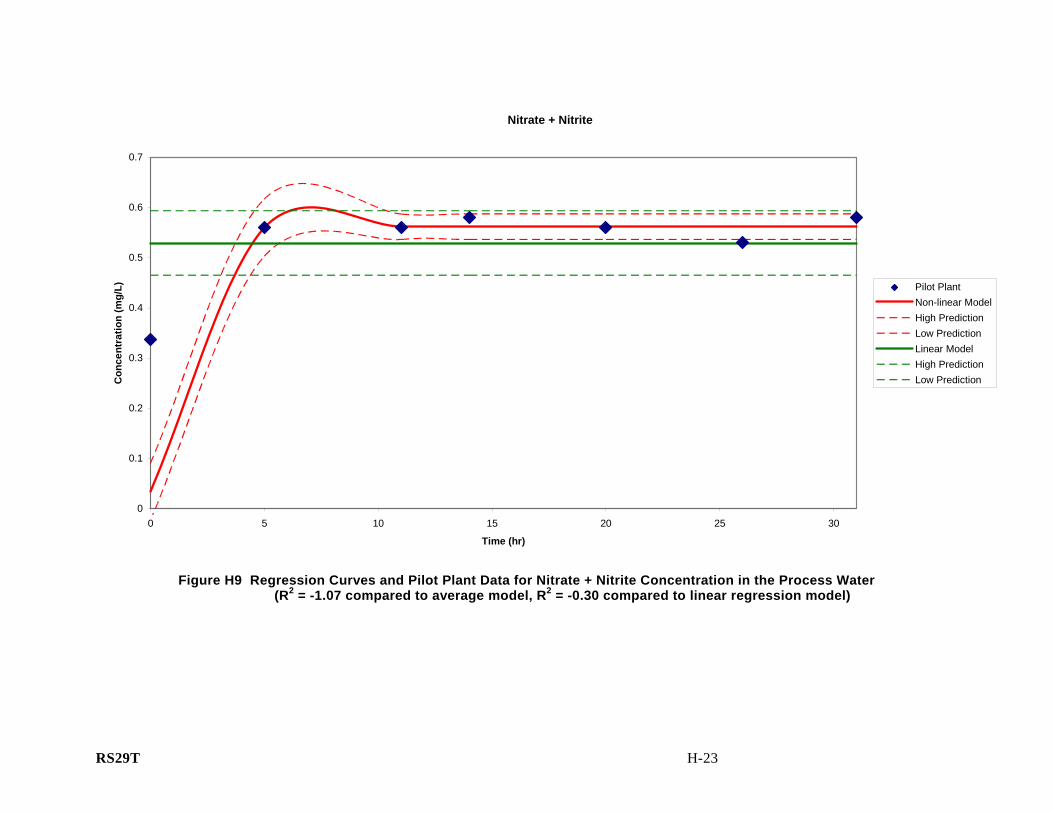
RS29T H-23
Nitrate + Nitrite
0
0.1
0.2
0.3
0.4
0.5
0.6
0.7
0 5 10 15 20 25 30
Time (hr)
Con
cent
ratio
n (m
g/L) Pilot Plant
Non-linear ModelHigh PredictionLow PredictionLinear ModelHigh PredictionLow Prediction
Figure H9 Regression Curves and Pilot Plant Data for Nitrate + Nitrite Concentration in the Process Water
(R2 = -1.07 compared to average model, R2 = -0.30 compared to linear regression model)

RS29T H-24
Phenol 4AAP
0
0.02
0.04
0.06
0.08
0.1
0.12
0.14
0.16
0.18
0.2
0 5 10 15 20 25 30
Time (hr)
Con
cent
ratio
n (m
g/L) Pilot Plant
Non-linear ModelHigh PredictionLow PredictionLinear ModelHigh PredictionLow Prediction
Figure H10 Regression Curves and Pilot Plant Data for Phenol 4AAP Concentration in the Process Water (R2 = -0.19 compared to average model, R2 = -1.35 compared to linear regression model)

Attachment A

SGS Lakefield Research Limited P.O. Box 4300, 185 Concession Street, Lakefield, Ontario, Canada K0L 2H0 Tel: (705) 652-2000 Fax: (705) 652-6365 www.sgslakefield.com www.ca.sgs.com
Member of the SGS Group (SGS SA)
A Pilot Plant Investigation into
BBUULLKK CCOONNCCEENNTTRRAATTEE PPRROODDUUCCTTIIOONN FFRROOMM SSAAMMPPLLEESS OOFF TTHHEE NNOORRTTHHMMEETT DDEEPPOOSSIITT
prepared for
PPOOLLYYMMEETT MMIINNIINNGG IINNCC.. Project 11263-001 - Report No. 1
July 5, 2006
NOTE: This report refers to the samples as received.
The practice of this Company in issuing reports of this nature is to require the recipient not to publish the report or any part thereof without the written consent of SGS Lakefield Research Limited.

Attachment B

Table 1
Analytical Data Summary
Tailings Thickener Overflow Samples
PolyMet Mining Corporation
(concentrations in ug/L, unless noted otherwise)
Location
Tailings Thickener
Overflow
Tailings Thickener
Overflow
Tailings Thickener
Overflow
Tailings Thickener
Overflow
Tailings Thickener
Overflow
Tailings Thickener
Overflow
Date 4/3/2006 4/3/2006 4/5/2006 4/5/2006 4/5/2006 4/5/2006
Time 1:20 PM 4:30 PM 10:00 AM 1:00 PM 4:00 PM 7:00 PM
General Parameters
Alkalinity, (hydrox.) as @CaCO3, mg/L -- <2 -- <2 -- <2
Alkalinity, bicarbonate as CaCO3, mg/L -- 122 b -- 145 b -- 154 b
Alkalinity, total, mg/L -- 124 b -- 145 b -- 154 b
Bromide, mg/L -- <0.2 -- <0.2 -- <0.2
Carbonate, mg/L -- 2 -- <2 -- <2
Chemical Oxygen Demand, mg/L -- 31 -- 466 -- 463
Chloride, mg/L -- 33.3 b -- 37.5 b -- 51.4 b
Cyanide -- <10 -- <10 -- <10
Fluoride, mg/L -- <0.4 -- <0.4 -- <0.4
Nitrate + Nitrite -- 460 b -- 560 b -- 560 b
Nitrogen total kjeldahl -- 200 b -- 300 b -- 200 b
Nitrogen, ammonia as N -- 50 -- 90 -- 90
Phenol 4AAP, mg/L -- <0.01 -- <0.01 -- 0.03
Phosphorus total, mg/L -- 0.06 -- 0.65 * -- 0.42
Solids, total suspended, mg/L 494 60 574 702 259 545
Sulfate, mg/L 62 b 61.5 b 69 b 75 b 80 b 90
Sulfate, dissolved, mg/L 49 48.2 57 67 64 69
Sulfide total, mg/L <2 <2 <2 <2 <2 <2
Sulfide, dissolved, mg/L <2 <2 <2 <2 <2 <2
Sulfite, mg/L 2 <2 <2 2 3 3
Sulfite, dissolved, mg/L 2 <2 <2 2 2 3
Surfactants MBAS, mg/L -- 0.11 -- 0.6 -- 0.7
Chlorine, mg/L -- <0.1 * -- <0.1 -- <0.1 *
pH, standard units 8.64 8.56 8.55 8.58 8.61 8.57
Sulfate, mg/L 53 48 60 67 73 96
Sulfate, dissolved, mg/L 55 49 60 68 73 76
Sulfur, mg/L 20.7 18.3 24.1 26.8 28.7 32.0
Sulfur, filtered, mg/L 31.8 25.3 32.1 36.7 39.7 53.4
Tetrathionate, mg/L 0.6 0.4 0.4 0.4 <0.2 0.3
Tetrathionate, filtered, mg/L 0.5 0.2 0.2 0.4 <0.2 <0.2
Thiosalt, mg/L <10 <10 <10 <10 <10 <10
Thiosalt, filtered, mg/L 14 <10 <10 <10 <10 <10
Thiosulphate, mg/L 6.6 5.8 4.5 5.7 7.0 6.1
Thiosulphate, filtered, mg/L 6.6 6.0 5.5 6 7.0 8.3
Trithionate, mg/L 4 3 3 4 4 4
Trithionate, filtered, mg/L 3 3 3 4 4 5
Metals
Aluminum 30400 3320 20200 26300 15600 64500
Antimony 0.84 2.05 0.83 0.57 1.19 * 0.34 *
Arsenic 9.3 11.2 6.9 7.7 6.4 5.5
Barium 45.2 9.17 57.6 64.8 25.5 72.9
Beryllium 0.20 0.03 0.27 0.28 0.09 0.28
Boron 98.6 104 104 121 105 158
Cadmium 0.23 0.11 0.17 0.25 0.13 0.18
Calcium 41200 23900 47300 51700 32400 57200
Chromium 20.1 2.45 b 19 28.9 12.2 26.4
Cobalt 20.9 2.53 17.8 28 12.2 26.6
Copper 429 26.7 87.1 307 174 543
Iron 23000 2650 24900 41400 16400 42000
Page 1 of 6
11/29/2006 2:59 PM
P:\23\69\862\Lims\282_TTOsum_062206.xls

Table 1
Analytical Data Summary
Tailings Thickener Overflow Samples
PolyMet Mining Corporation
(concentrations in ug/L, unless noted otherwise)
Location
Tailings Thickener
Overflow
Tailings Thickener
Overflow
Tailings Thickener
Overflow
Tailings Thickener
Overflow
Tailings Thickener
Overflow
Tailings Thickener
Overflow
Date 4/3/2006 4/3/2006 4/5/2006 4/5/2006 4/5/2006 4/5/2006
Time 1:20 PM 4:30 PM 10:00 AM 1:00 PM 4:00 PM 7:00 PM
Lead 3.85 0.59 2.07 2.49 2.94 4.09
Magnesium 21100 9690 22200 32100 17800 31200
Manganese 229 29.4 177 221 158 456
Mercury 0.0773 0.0136 0.0072 <0.005 0.006 0.0032
Molybdenum 14.1 14.1 16.3 16.2 16.7 17.6
Nickel 205 22.9 121 228 105 297
Potassium 14300 13800 17200 18800 17800 21000
Selenium 2.7 2.5 2.3 2.7 1.8 1.5
Silicon 70700 17700 95200 127000 55800 141000
Silver 0.26 <0.02 0.15 0.24 0.13 0.26
Sodium 70000 66700 79400 97200 98900 117000
Thallium 0.05 <0.02 0.06 0.08 0.03 0.08
Tin <0.1 <0.1 <0.2 <0.2 <0.1 * <0.1 *
Titanium 338 46.5 424 662 264 728
Zinc 477 7.1 b 21.4 b 30.6 15.7 b* 29.4 b*
Dissolved Metals
Aluminum, dissolved 71.7 110 103 99.1 106 82.1
Antimony dissolved 2.03 2.45 2.8 2.62 2.65 2.70
Arsenic, dissolved 8.2 11.0 6.3 7.1 5.9 5.5
Barium, dissolved 4.14 3.99 4.06 4.97 3.73 3.90
Beryllium, dissolved <0.02 <0.02 <0.02 <0.02 <0.02 <0.02
Boron, dissolved 107 102 113 140 117 124
Cadmium, dissolved 0.14 0.09 0.11 0.11 0.09 0.09
Calcium, dissolved 23900 21700 22600 22100 20200 18900
Chromium, dissolved 0.2 b 0.25 b 0.47 b 0.40 b 0.3 b 0.3 b
Cobalt, dissolved 0.41 0.38 0.39 0.43 0.16 0.14
Copper, dissolved 0.3 b 1.0 1.3 1.6 0.8 b 0.5 b
Iron, dissolved <20 <20 <20 <20 <20 <20
Lead, dissolved <0.02 <0.02 <0.02 <0.02 <0.02 <0.02
Magnesium, dissolved 8970 8410 9710 9660 9230 9550
Manganese, dissolved 6.11 4.79 5.98 5.85 6.11 5.24
Mercury, dissolved 0.002 0.0018 <0.001 0.0017 <0.001 <0.001
Molybdenum dissolved 15.4 14.4 18.2 20 17.8 20.2
Nickel, dissolved 6.0 5.0 5.8 5.7 4.7 3.9
Potassium, dissolved 13300 13600 15000 17400 17200 19000
Selenium, dissolved 2.1 2.4 2.9 3.5 1.4 1.5
Silicon, dissolved 6740 7080 6560 7460 7050 6890
Silver, dissolved <0.02 <0.02 <0.02 <0.02 <0.02 * <0.02 *
Sodium dissolved 59500 65600 70100 87500 90200 97700
Thallium dissolved <0.02 <0.02 <0.02 <0.02 <0.02 <0.02
Tin dissolved <0.1 <0.1 <0.1 <0.1 <0.1 <0.1
Titanium dissolved <10 <10 <10 <10 <10 <10
Zinc, dissolved 2.2 b 2.0 b 2.3 b 4.9 b 1.9 b 2.1 b
SVOCs
1-Pentanol -- <400 -- <400 -- <400
2-Pentanol -- <100 -- <100 -- <100
3-Pentanol -- <100 -- <100 -- <100
VOCs
Benzene -- <0.50 -- <0.50 -- <0.50
Carbon disulfide -- 390 -- 110 -- 600
Ethyl benzene -- <0.50 -- <0.50 -- <0.50
Page 2 of 6
11/29/2006 2:59 PM
P:\23\69\862\Lims\282_TTOsum_062206.xls

Table 1
Analytical Data Summary
Tailings Thickener Overflow Samples
PolyMet Mining Corporation
(concentrations in ug/L, unless noted otherwise)
Location
Tailings Thickener
Overflow
Tailings Thickener
Overflow
Tailings Thickener
Overflow
Tailings Thickener
Overflow
Tailings Thickener
Overflow
Tailings Thickener
Overflow
Date 4/3/2006 4/3/2006 4/5/2006 4/5/2006 4/5/2006 4/5/2006
Time 1:20 PM 4:30 PM 10:00 AM 1:00 PM 4:00 PM 7:00 PM
Methyl isobutyl alcohol -- 3600 -- 4200 -- 3900
Toluene -- <0.50 -- <0.50 -- <0.50
Xylene m & p -- <0.50 -- <0.50 -- <0.50
Xylene o- -- <0.50 -- <0.50 -- <0.50
-- Not analyzed.
b Potential false positive based on blank
data validation procedure.
* Estimated value, QA/QC criteria not met.
Detections are presented in bold.
Page 3 of 6
11/29/2006 2:59 PM
P:\23\69\862\Lims\282_TTOsum_062206.xls

Location
Date
Time
General Parameters
Alkalinity, (hydrox.) as @CaCO3, mg/L
Alkalinity, bicarbonate as CaCO3, mg/L
Alkalinity, total, mg/L
Bromide, mg/L
Carbonate, mg/L
Chemical Oxygen Demand, mg/L
Chloride, mg/L
Cyanide
Fluoride, mg/L
Nitrate + Nitrite
Nitrogen total kjeldahl
Nitrogen, ammonia as N
Phenol 4AAP, mg/L
Phosphorus total, mg/L
Solids, total suspended, mg/L
Sulfate, mg/L
Sulfate, dissolved, mg/L
Sulfide total, mg/L
Sulfide, dissolved, mg/L
Sulfite, mg/L
Sulfite, dissolved, mg/L
Surfactants MBAS, mg/L
Chlorine, mg/L
pH, standard units
Sulfate, mg/L
Sulfate, dissolved, mg/L
Sulfur, mg/L
Sulfur, filtered, mg/L
Tetrathionate, mg/L
Tetrathionate, filtered, mg/L
Thiosalt, mg/L
Thiosalt, filtered, mg/L
Thiosulphate, mg/L
Thiosulphate, filtered, mg/L
Trithionate, mg/L
Trithionate, filtered, mg/L
Metals
Aluminum
Antimony
Arsenic
Barium
Beryllium
Boron
Cadmium
Calcium
Chromium
Cobalt
Copper
Iron
Table 1
Analytical Data Summary
Tailings Thickener Overflow Samples
PolyMet Mining Corporation
(concentrations in ug/L, unless noted otherwise)
Tailings Thickener
Overflow
Tailings Thickener
Overflow
Tailings Thickener
Overflow
Tailings Thickener
Overflow
Tailings Thickener
Overflow
Tailings Thickener
Overflow
4/5/2006 4/6/2006 4/6/2006 4/6/2006 4/6/2006 4/6/2006
10:00 PM 1:00 AM 4:00 AM 7:00 AM 10:00 AM 3:00 PM
<2 -- <2 -- <2 <2
155 b -- 150 b -- 159 b 166 b
155 b -- 150 b -- 159 b 166 b
<0.2 -- <0.2 -- <0.2 <0.2
<2 -- <2 -- <2 <2
444 -- 398 -- 403 398
50.6 -- 47.2 b -- 55.0 b 52 b
<10 -- <10 -- <10 <10
<0.4 -- <0.4 -- 0.4 0.5
580 b -- 560 b -- 530 b 580 b
300 b -- 300 b -- 400 b 300 b
100 -- 80 -- 90 90
0.02 -- 0.02 -- 0.03 0.04
0.47 -- 0.44 -- 0.24 0.51
559 694 626 368 582 862
98 103 104 106 121 143
77 84 81 92 122 118
<2 2 <2 2 2 2
<2 <2 <2 2 2 2
3 3 2 3 3 3
3 3 3 3 -- 3
1.0 -- 1.2 -- 0.7 1.2
<0.1 * -- <0.1 * -- <0.1 <0.1 *
8.47 8.50 8.05 8.60 8.40 8.50
110 110 110 110 130 150
85 88 91 96 110 130
36.3 37.4 38.5 38.2 41.3 48.6
57.2 61.7 59.1 62.8 71.0 77.9
0.4 0.5 0.6 0.4 0.6 0.5
0.3 0.5 0.5 0.3 0.3 0.4
<10 <10 <10 <10 13 10
<10 10 <10 <10 <10 14
5.5 8.2 7.3 8.8 9.1 9.7
8.6 8.8 8.7 9.5 10 9.7
3 4 7 6 6 7
4 7 6 6 6 7
60000 59000 51500 36400 27400 63600
0.40 * 0.49 * 0.61 * 0.94 * 0.92 * 0.59 *
5.0 4.6 5.5 4.8 4.6 4.9
75.2 68.4 63.0 43.3 44.1 78.7
0.27 0.27 0.24 0.17 0.18 0.30
172 178 174 180 172 233
0.18 0.18 0.17 0.17 0.16 0.21
55500 54900 50300 41900 42800 58000
25.7 23.1 23.4 16.6 17.4 b 28.3
25.5 22.6 23.2 16.8 16.2 26.4
522 516 495 368 358 556
41400 37000 35900 24200 23500 42200
Page 4 of 6
11/29/2006 2:59 PM
P:\23\69\862\Lims\282_TTOsum_062206.xls

Location
Date
Time
Lead
Magnesium
Manganese
Mercury
Molybdenum
Nickel
Potassium
Selenium
Silicon
Silver
Sodium
Thallium
Tin
Titanium
Zinc
Dissolved Metals
Aluminum, dissolved
Antimony dissolved
Arsenic, dissolved
Barium, dissolved
Beryllium, dissolved
Boron, dissolved
Cadmium, dissolved
Calcium, dissolved
Chromium, dissolved
Cobalt, dissolved
Copper, dissolved
Iron, dissolved
Lead, dissolved
Magnesium, dissolved
Manganese, dissolved
Mercury, dissolved
Molybdenum dissolved
Nickel, dissolved
Potassium, dissolved
Selenium, dissolved
Silicon, dissolved
Silver, dissolved
Sodium dissolved
Thallium dissolved
Tin dissolved
Titanium dissolved
Zinc, dissolved
SVOCs
1-Pentanol
2-Pentanol
3-Pentanol
VOCs
Benzene
Carbon disulfide
Ethyl benzene
Table 1
Analytical Data Summary
Tailings Thickener Overflow Samples
PolyMet Mining Corporation
(concentrations in ug/L, unless noted otherwise)
Tailings Thickener
Overflow
Tailings Thickener
Overflow
Tailings Thickener
Overflow
Tailings Thickener
Overflow
Tailings Thickener
Overflow
Tailings Thickener
Overflow
4/5/2006 4/6/2006 4/6/2006 4/6/2006 4/6/2006 4/6/2006
10:00 PM 1:00 AM 4:00 AM 7:00 AM 10:00 AM 3:00 PM
3.80 3.35 3.15 2.29 2.25 3.91
31500 29000 28600 21900 22100 32400
447 395 383 257 209 455
0.0034 0.0014 0.0024 0.0023 0.0021 0.0028
20.3 21.3 21.5 23.7 27.2 31.2
283 291 264 203 174 321
24100 24500 22700 23800 25200 29000
1.6 1.6 1.8 1.7 1.8 2.0
134000 140000 120000 96300 99100 135000
0.26 0.24 0.23 0.19 0.16 0.30
117000 118000 116000 117000 132000 153000
0.09 0.07 0.07 0.05 0.04 0.09
<0.1 * <0.1 * <0.1 * <0.1 * <0.1 * <0.1 *
755 718 643 475 478 774
28.3 b* 46.5 * 35.3 * 18.4 b 18.5 b* 29.1 *
143 139 134 149 125 155
2.91 3.20 3.46 3.47 3.74 3.58
5.0 4.4 5.4 4.5 4.3 4.7
4.22 4.10 3.99 4.46 4.29 5.10
<0.02 <0.02 <0.02 <0.02 <0.02 <0.02
138 148 144 150 181 195
0.10 0.09 0.10 0.09 0.11 0.16
18900 19000 18900 18900 18800 19300
0.3 b 0.2 b 0.3 b 0.3 b 0.3 0.3 b
0.15 0.15 0.15 0.15 0.15 0.18
0.5 b 0.8 b 0.5 b 0.6 b 0.6 b 0.6 b
<20 <20 <20 <20 <20 <20
<0.02 <0.02 <0.02 <0.02 <0.02 <0.02
10500 10500 10600 10600 10600 12000
5.34 5.37 5.62 5.77 6.13 6.33
<0.001 <0.001 <0.001 <0.001 <0.001 <0.001
22.8 24.0 24.2 25.7 30.3 36.5
3.9 3.7 4.0 3.9 3.9 3.9
21300 21600 21100 21400 23100 25500
1.7 1.6 1.6 1.2 1.4 1.8
6810 6590 6470 6240 6300 6840
<0.02 * <0.02 * <0.02 * <0.02 * <0.02 * <0.02 *
100000 104000 101000 104000 115000 134000
<0.02 <0.02 <0.02 <0.02 <0.02 <0.02
<0.1 <0.1 <0.1 <0.1 <0.1 <0.1
<10 <10 <10 <10 <10 <10
1.1 b 2.6 b 41.1 4.4 b 2.8 b* 3.9
<400 -- <400 -- <400 <400
<100 -- <100 -- <100 <100
<100 -- <100 -- <100 <100
<0.50 -- <0.50 -- <0.50 <0.50
520 -- 630 -- 730 d 580
<0.50 -- <0.50 -- <0.50 <0.50
Page 5 of 6
11/29/2006 2:59 PM
P:\23\69\862\Lims\282_TTOsum_062206.xls

Location
Date
Time
Methyl isobutyl alcohol
Toluene
Xylene m & p
Xylene o-
-- Not analyzed.
b Potential false positive based on blank
data validation procedure.
* Estimated value, QA/QC criteria not met.
Detections are presented in bold.
Table 1
Analytical Data Summary
Tailings Thickener Overflow Samples
PolyMet Mining Corporation
(concentrations in ug/L, unless noted otherwise)
Tailings Thickener
Overflow
Tailings Thickener
Overflow
Tailings Thickener
Overflow
Tailings Thickener
Overflow
Tailings Thickener
Overflow
Tailings Thickener
Overflow
4/5/2006 4/6/2006 4/6/2006 4/6/2006 4/6/2006 4/6/2006
10:00 PM 1:00 AM 4:00 AM 7:00 AM 10:00 AM 3:00 PM
3900 -- 3400 -- 3000 d 2800
<0.50 b -- <0.50 -- <0.50 <0.50
<0.50 b -- <0.50 -- <0.50 <0.50
<0.50 -- <0.50 -- <0.50 <0.50
Page 6 of 6
11/29/2006 2:59 PM
P:\23\69\862\Lims\282_TTOsum_062206.xls

Table 2
Analytical Data Summary
Make Up Water Samples
PolyMet Mining Corporation
(concentrations in ug/L, unless noted otherwise)
Location Initial Makeup Makeup Makeup Makeup Makeup Makeup Makeup Makeup Makeup
Date 4/3/2006 4/3/2006 4/3/2006 4/5/2006 4/5/2006 4/5/2006 4/5/2006 4/6/2006 4/6/2006 4/6/2006
Time 7:20 AM 3:30 PM 11:30 AM 11:00 AM 3:00 PM 7:00 PM 10:00 PM 3:00 AM 7:00 AM 11:00 AM
General Parameters
Alkalinity, (hydrox.) as @CaCO3, mg/L <2 <2 -- -- <2 -- <2 -- <2 --
Alkalinity, bicarbonate as CaCO3, mg/L 91 b 88 b -- -- 92 b -- 84 b -- 84 b --
Alkalinity, total, mg/L 91 b 88 b -- -- 92 b -- 84 b -- 84 b --
Bromide, mg/L <0.2 <0.2 -- -- <0.2 -- <0.2 -- <0.2 --
Carbonate, mg/L <2 <2 -- -- <2 -- <2 -- <2 --
Chemical Oxygen Demand, mg/L 15 17 -- -- 15 -- 14 -- 15 --
Chloride, mg/L 26.9 b 18.2 b -- -- 16.7 b -- 14.1 b -- 15.8 b --
Cyanide <10 20 -- -- <10 -- <10 -- <10 --
Fluoride, mg/L <0.4 <0.4 -- -- <0.4 -- <0.4 -- <0.4 --
Nitrate + Nitrite 410 b 380 b -- -- 340 b -- 340 b -- 330 b --
Nitrogen total kjeldahl 200 b 700 -- -- 300 b -- 400 b -- 400 b --
Nitrogen, ammonia as N <50 <50 -- -- <50 -- <50 -- <50 --
Phenol 4AAP, mg/L <0.01 <0.01 -- -- 0.03 -- <0.01 -- <0.01 --
Phosphorus total, mg/L 0.01 * 0.01 -- -- 0.01 -- <0.01 -- 0.01 --
Solids, total suspended, mg/L <5 <5 <5 <5 <5 <5 <5 <5 <5 <5
Sulfate, mg/L 14.1 b 11.6 b 11.7 b 11.8 b 11.4 b 11.5 b 10.4 b 11.2 b 11.3 b 11.1 b
Sulfate, dissolved, mg/L 14.0 11.7 11.9 11.9 11.5 11.3 11.4 11.2 11.1 11.2
Sulfide total, mg/L <2 <2 <2 <2 <2 <2 <2 <2 <2 <2
Sulfide, dissolved, mg/L <2 <2 <2 <2 <2 <2 <2 <2 <2 <2
Sulfite, mg/L <2 <2 <2 <2 <2 <2 <2 <2 <2 <2
Sulfite, dissolved, mg/L <2 <2 <2 <2 <2 <2 <2 <2 <2 --
Surfactants MBAS, mg/L 0.05 <0.05 -- -- 0.07 -- <0.05 -- 0.06 --
Chlorine, mg/L <0.1 b <0.1 -- -- <0.1 -- <0.1 -- <0.1 --
pH, standard units 7.90 7.86 7.94 7.80 7.88 7.85 7.87 7.85 7.82 7.80
Sulfate, mg/L 15 12 12 12 11 11 11 11 11 11
Sulfate, dissolved, mg/L 14 12 12 12 11 11 11 10 11 11
Sulfur, mg/L 4.82 4.02 4.11 4.10 4.00 3.94 3.84 4.30 3.86 4.19
Sulfur, filtered, mg/L 4.91 3.94 3.97 4.31 4.54 4.33 4.73 4.11 4.25 4.51
Tetrathionate, mg/L <0.2 <0.2 <0.2 <0.2 <0.2 <0.2 <0.2 <0.2 <0.2 <0.2
Tetrathionate, filtered, mg/L <0.2 <0.2 <0.2 <0.2 <0.2 <0.2 <0.2 <0.2 <0.2 <0.2
Thiosalt, mg/L <10 <10 <10 <10 <10 <10 <10 <10 <10 <10
Thiosalt, filtered, mg/L <10 <10 13 <10 <10 <10 <10 <10 <10 <10
Thiosulphate, mg/L <0.2 <0.2 <0.2 <0.2 <0.2 <0.2 <0.2 <0.2 <0.2 <0.2
Thiosulphate, filtered, mg/L 0.3 <0.2 <0.2 <0.2 <0.2 <0.2 <0.2 <0.2 <0.2 <0.2
Trithionate, mg/L <2 <2 <2 <2 <2 <2 <2 <2 <2 <2
Trithionate, filtered, mg/L <2 <2 <2 <2 <2 <2 <2 <2 <2 <2
Metals
Aluminum 22.9 26.6 34.2 16.1 b 15.1 b 11.6 b 12.2 b 12.7 b 12.8 b 12.5 b
Antimony 0.11 0.07 0.08 0.08 0.06 * <0.05 * 0.06 * 0.07 * <0.05 * 0.06 *
Arsenic 0.5 <0.5 <0.5 <0.5 <0.5 <0.5 <0.5 <0.5 <0.5 <0.5
Barium 32.5 31.5 31.3 33 30.0 29.4 29.1 28.9 29.2 29.4
Beryllium <0.02 <0.02 <0.02 <0.02 <0.02 <0.02 <0.02 <0.02 <0.02 <0.02
Boron 12.4 11.5 11.0 11 8.5 b 8.1 b 8.2 b 7.7 b 7.8 b 8.1 b
Cadmium 0.05 0.03 0.04 0.03 0.02 <0.02 <0.02 0.02 <0.02 <0.02
Calcium 41600 38300 39400 36800 35500 36400 36900 37200 36400 38200
Chromium 0.4 b 0.23 b 0.3 b 0.24 b <0.2 <0.2 <0.2 <0.2 <0.2 <0.2
Cobalt 0.78 0.56 0.59 0.5 0.18 0.17 0.18 0.17 0.18 0.18
Copper 2.9 1.5 1.3 1.3 1.1 1.2 1.1 1.1 1.1 1.0
Iron 172 93 78.4 62.9 61.8 62.1 63.1 62.3 62.9 67.2
Page 1 of 3
11/29/2006 3:02 PM
P:\23\69\862\Lims\282_Makeupsum_062206.xls

Table 2
Analytical Data Summary
Make Up Water Samples
PolyMet Mining Corporation
(concentrations in ug/L, unless noted otherwise)
Location Initial Makeup Makeup Makeup Makeup Makeup Makeup Makeup Makeup Makeup
Date 4/3/2006 4/3/2006 4/3/2006 4/5/2006 4/5/2006 4/5/2006 4/5/2006 4/6/2006 4/6/2006 4/6/2006
Time 7:20 AM 3:30 PM 11:30 AM 11:00 AM 3:00 PM 7:00 PM 10:00 PM 3:00 AM 7:00 AM 11:00 AM
Lead 0.34 0.27 b 0.38 0.18 0.16 0.11 b 0.11 b 0.13 b 0.13 b 0.12 b
Magnesium 4200 3870 3960 3730 3540 3620 3660 3690 3610 3780
Manganese 10.9 6.62 8.04 5.4 6.79 6.58 7.20 6.79 9.21 8.28
Mercury 0.003 0.0012 0.0018 0.0011 0.0016 0.0011 0.0016 0.0026 0.0016 0.001
Molybdenum 0.34 b 0.27 b 0.25 b 0.28 b 0.21 b 0.21 b 0.20 b 0.21 b 0.20 b 0.19 b
Nickel 6.6 0.7 b 0.9 b 0.9 b 1.6 1.6 1.6 1.7 1.6 1.7
Potassium <2000 <2000 <2000 <2000 <2000 2320 <2000 <2000 <2000 <2000
Selenium <1.0 <1 <1.0 <1 <1.0 <1.0 <1.0 <1.0 <1.0 <1.0
Silicon 4470 4330 4450 4230 4170 4290 4290 4380 4310 4500
Silver <0.02 <0.02 <0.02 <0.02 <0.02 <0.02 <0.02 <0.02 <0.02 <0.02
Sodium 15100 12100 10800 10900 10400 9940 9770 9550 9550 9490
Thallium <0.02 <0.02 <0.02 <0.02 <0.02 <0.02 <0.02 <0.02 <0.02 <0.02
Tin <0.1 <0.1 <0.1 <0.1 <0.1 * <0.1 * <0.1 * <0.1 * <0.1 * <0.1 *
Titanium <10 <10 <10 <10 <10 <10 <10 <10 <10 <10
Zinc 14.7 b 8.2 b 10.3 b 6.2 b 6.0 b* 6.2 b* 5.7 b* 6.0 b* 6.7 b* 5.9 b
Dissolved Metals
Aluminum, dissolved 5.4 5.6 8.8 5.6 6.1 5.0 5.6 5.2 5.1 5.1
Antimony dissolved 0.13 b 0.08 0.09 b 0.06 0.06 b 0.06 b 0.05 b 0.06 b <0.05 <0.05
Arsenic, dissolved <0.5 <0.5 <0.5 <0.5 <0.5 <0.5 <0.5 <0.5 <0.5 <0.5
Barium, dissolved 30.8 31.4 30.7 32.2 29.3 28.6 29.3 28.6 28.8 28.5
Beryllium, dissolved <0.02 <0.02 <0.02 <0.02 <0.02 <0.02 <0.02 <0.02 <0.02 <0.02
Boron, dissolved 13.2 13.2 11.4 12.1 8.7 b 9.3 9.9 11.3 9.4 8.8 b
Cadmium, dissolved 0.04 0.04 0.03 0.04 0.03 <0.02 <0.02 <0.02 <0.02 <0.02
Calcium, dissolved 42000 38400 39300 36600 34900 34600 34300 34000 34600 33900
Chromium, dissolved 0.2 b 0.23 b 0.2 b 0.22 b <0.2 <0.2 <0.2 <0.2 <0.2 <0.2
Cobalt, dissolved 0.64 0.53 0.57 0.52 0.17 0.15 0.17 0.15 0.16 0.15
Copper, dissolved 1.9 1.4 1.0 1.2 1.1 1.0 1.0 1.1 0.9 b 0.9 b
Iron, dissolved 72.1 34.8 36.3 36.1 37.0 37.1 38.2 39.5 38.2 37.2
Lead, dissolved 0.10 0.07 0.09 0.08 0.06 0.06 0.05 0.05 0.04 0.05
Magnesium, dissolved 4160 3880 3950 3690 3570 3560 3420 3480 3440 3450
Manganese, dissolved 4.66 2.44 2.65 2.14 2.26 2.14 2.17 2.24 2.22 2.17
Mercury, dissolved 0.0015 <0.001 0.0013 <0.001 0.001 0.0011 0.0012 <0.001 0.0011 0.001
Molybdenum dissolved 0.34 0.27 b 0.28 b 0.24 b 0.22 b 0.22 b 0.21 b 0.24 b 0.18 b 0.20 b
Nickel, dissolved 3.6 0.5 0.4 0.6 1.6 1.4 1.6 1.4 1.5 1.4
Potassium, dissolved <2000 <2000 <2000 <2000 <2000 <2000 <2000 <2000 <2000 <2000
Selenium, dissolved <1.0 <1 <1.0 <1 <1.0 <1.0 <1.0 <1.0 <1.0 <1.0
Silicon, dissolved 4350 4130 4360 4100 4070 3980 3880 3970 4010 3940
Silver, dissolved <0.02 <0.02 <0.02 <0.02 <0.02 * <0.02 * <0.02 * <0.02 * <0.02 * <0.02 *
Sodium dissolved 15200 12400 10800 10800 9600 9280 9040 9000 8930 8700
Thallium dissolved <0.02 <0.02 <0.02 <0.02 <0.02 <0.02 <0.02 <0.02 <0.02 <0.02
Tin dissolved <0.1 <0.1 <0.1 <0.1 <0.1 <0.1 <0.1 <0.1 <0.1 <0.1
Titanium dissolved <10 <10 <10 <10 <10 <10 <10 <10 <10 <10
Zinc, dissolved 12.1 b 7.1 b 9.1 b 6.0 b 5.7 b 5.2 b 6.4 b 10.7 b 6.1 b 4.6 b
SVOCs
1-Pentanol <400 <400 -- -- <400 -- <400 -- <400 --
2-Pentanol <100 <100 -- -- <100 -- <100 -- <100 --
3-Pentanol <100 <100 -- -- <100 -- <100 -- <100 --
VOCs
Benzene <0.50 <0.50 -- -- <0.50 -- <0.50 -- <0.50 --
Carbon disulfide <0.50 <0.50 -- -- <0.50 -- <0.50 -- <0.50 --
Page 2 of 3
11/29/2006 3:02 PM
P:\23\69\862\Lims\282_Makeupsum_062206.xls
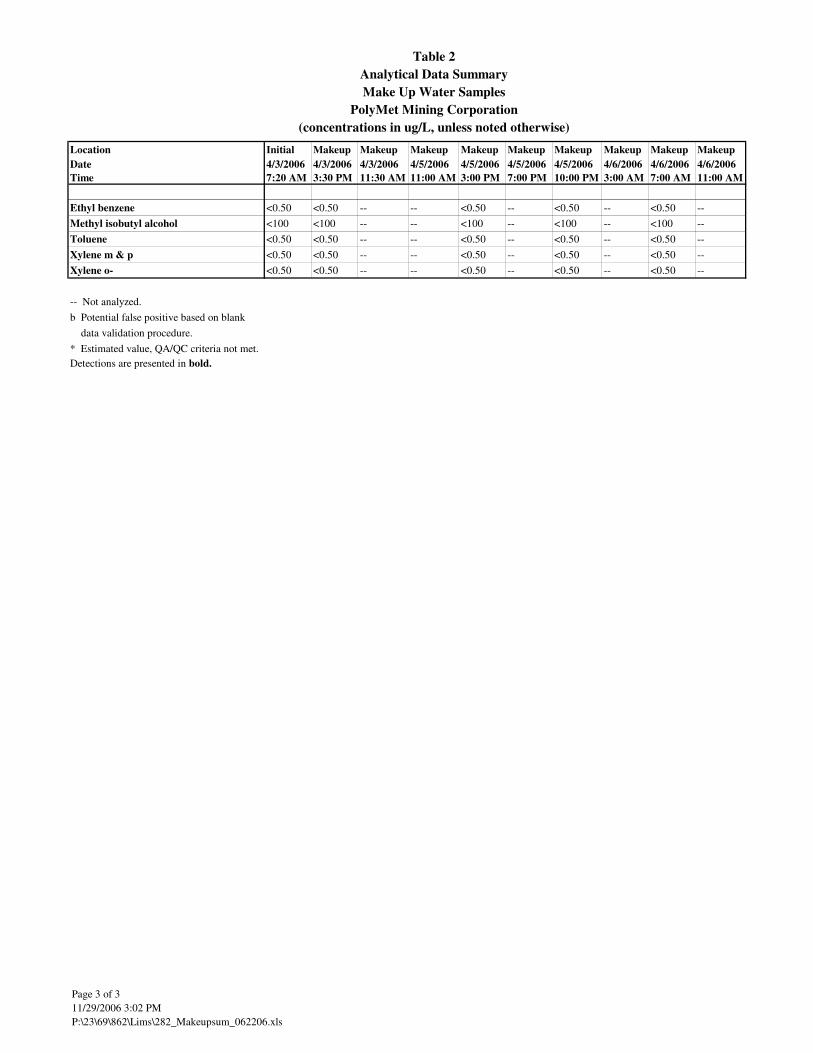
Table 2
Analytical Data Summary
Make Up Water Samples
PolyMet Mining Corporation
(concentrations in ug/L, unless noted otherwise)
Location Initial Makeup Makeup Makeup Makeup Makeup Makeup Makeup Makeup Makeup
Date 4/3/2006 4/3/2006 4/3/2006 4/5/2006 4/5/2006 4/5/2006 4/5/2006 4/6/2006 4/6/2006 4/6/2006
Time 7:20 AM 3:30 PM 11:30 AM 11:00 AM 3:00 PM 7:00 PM 10:00 PM 3:00 AM 7:00 AM 11:00 AM
Ethyl benzene <0.50 <0.50 -- -- <0.50 -- <0.50 -- <0.50 --
Methyl isobutyl alcohol <100 <100 -- -- <100 -- <100 -- <100 --
Toluene <0.50 <0.50 -- -- <0.50 -- <0.50 -- <0.50 --
Xylene m & p <0.50 <0.50 -- -- <0.50 -- <0.50 -- <0.50 --
Xylene o- <0.50 <0.50 -- -- <0.50 -- <0.50 -- <0.50 --
-- Not analyzed.
b Potential false positive based on blank
data validation procedure.
* Estimated value, QA/QC criteria not met.
Detections are presented in bold.
Page 3 of 3
11/29/2006 3:02 PM
P:\23\69\862\Lims\282_Makeupsum_062206.xls