Embed Size (px)
Citation preview

Submitted 26 September 2013Accepted 1 November 2013Published 21 November 2013
Corresponding authorSteven B. Roberts,[email protected]
Academic editorXiang-Jiao Yang
Additional Information andDeclarations can be found onpage 11
DOI 10.7717/peerj.215
Copyright2013 Gavery and Roberts
Distributed underCreative Commons CC-BY 3.0
OPEN ACCESS
Predominant intragenic methylation isassociated with gene expressioncharacteristics in a bivalve molluscMackenzie R. Gavery and Steven B. Roberts
School of Aquatic and Fishery Sciences, University of Washington, Seattle, WA, USA
ABSTRACTCharacterization of DNA methylation patterns in the Pacific oyster, Crassostrea gigas,indicates that this epigenetic mechanism plays an important functional role in generegulation and may be involved in the regulation of developmental processes andenvironmental responses. However, previous studies have been limited to in silicoanalyses or characterization of DNA methylation at the single gene level. Here, wehave employed a genome-wide approach to gain insight into how DNA methylationsupports the regulation of the genome in C. gigas. Using a combination of methyla-tion enrichment and high-throughput bisulfite sequencing, we have been able to mapmethylation at over 2.5 million individual CpG loci. This is the first high-resolutionmethylome generated for a molluscan species. Results indicate that methylationvaries spatially across the genome with a majority of the methylated sites mappingto intra genic regions. The bisulfite sequencing data was combined with RNA-seqdata to examine genome-wide relationships between gene body methylation andgene expression, where it was shown that methylated genes are associated with hightranscript abundance and low variation in expression between tissue types. Thecombined data suggest DNA methylation plays a complex role in regulating genomeactivity in bivalves.
Subjects Aquaculture, Fisheries and Fish Science, Genomics, Molecular BiologyKeywords DNA methylation, Epigenetics, Bivalve, Mollusc, Gene regulation, Methylome
INTRODUCTIONEpigenetic marks such as DNA methylation are important for genome regulation
(Bell & Felsenfeld, 2000; Li, Bestor & Jaenisch, 1992; Hsieh, 1994). DNA methylation has
been well-studied in mammals and plants where it has been shown to play important roles
in temporal and spatial regulation of gene expression (Okano et al., 1999; Zhang et al.,
2006), reduction of transcriptional noise (Bird, 1995), and genome stabilization (Wolffe &
Matzke, 1999). However, the distribution and context of DNA methylation varies greatly
among phylogenetic groups indicating that these functional roles may not be conserved
(Colot & Rossignol, 1999).
In contrast to the heavily methylated vertebrate genomes, invertebrate genomes
exhibit a relatively low level of methylation that is primarily confined to gene bodies
(Zemach et al., 2010). It is perhaps because of these differences that DNA methylation
has remained largely understudied in invertebrates. Recently, however, there has been a
How to cite this article Gavery and Roberts (2013), Predominant intragenic methylation is associated with gene expression characteris-tics in a bivalve mollusc. PeerJ 1:e215; DOI 10.7717/peerj.215

renewed interest in invertebrate DNA methylation patterns as it is now being recognized
that invertebrates are exceptional models to study functions and evolutionary roles of
gene body methylation. Furthermore, it has been shown that DNA methylation mediates
phenotypes in response to environmental cues in the invertebrate Apis mellifera (Kucharski
et al., 2008; Lyko et al., 2010), indicating an important role in integrating environmental
signals. Thus, understanding both the distribution and function of DNA methylation
in diverse invertebrate lineages will contribute significantly to our understanding of the
evolution of genome regulation and environmental physiology.
The focus of the work presented here is to explore the role of DNA methylation in
bivalve molluscs. The presence of DNA methylation has been confirmed in several bivalve
species (Wang et al., 2008; Petrovic et al., 2009; Gavery & Roberts, 2010). A majority
of the research on DNA methylation in molluscs has focused on the Pacific oyster
(Crassostrea gigas), an economically and ecologically important species. Previous studies
in the Pacific oyster identified a relationship between gene function and methylation
pattern. Specifically, it was shown that genes with housekeeping functions are more
methylated than genes involved in inducible functions (i.e., genes involved in response
to environment, embryonic development or tissue-specific functions) (Gavery & Roberts,
2010; Roberts & Gavery, 2012). More recently, Riviere et al. (2013) determined that DNA
methylation plays a critical role in development as indicated by differential methylation
patterns throughout embryogenesis. This was further supported by their observation
that 5-aza-cytidine, a potent demethylating agent, significantly disrupts embryonic
development (Riviere et al., 2013).
These recent studies on DNA methylation in oysters provide important foundational
information on DNA methylation in bivalves. However, previous studies were not able to
provide fine scale resolution of DNA methylation patterns, nor examine the relationship
with gene expression at the genome-wide level. Here, we provide the first high resolution
methylome of a mollusc and examine this in relationship to gene expression data to get a
better understanding of the role of DNA methylation in invertebrates.
METHODSBisulfite treated DNA (BS-Seq) analysisThe cohort of adult oysters used in this study was from Samish Bay, WA, USA. Briefly,
genomic DNA was isolated using DNAzol (Molecular Research Center) from gill tissue
of 8 oysters, pooled, and methylation enrichment performed using the MethylMiner Kit
(Invitrogen) following the manufacturer’s instructions. Specifically, pooled DNA was
sheared by sonication on a Covaris S2 (Covaris) (parameters: 10 cycles at 60 s each, duty
cycle of 10%, intensity of 5, 100 cycles/burst). Approximately 13 µg of sheared DNA was
used as input DNA and incubated with MBD-Biotin Protein coupled to M-280 Strepta-
vidin Dynabeads following the manufacturer’s instructions (MethylMiner (Invitrogen)).
Enriched, methylated DNA was eluted from the bead complex with 1 M NaCl and purified
by ethanol precipitation. This enriched fraction represented approximately 15% of the
total DNA recovered from the enrichment procedure. The DNA library was prepared using
Gavery and Roberts (2013), PeerJ, DOI 10.7717/peerj.215 2/15
the Illumina Tru-Seq system with methylated TruSeq adapters (mean fragment size of
library: 350 bp). Bisulfite treatment was then performed using the EpiTect Bisulfite Kit
(Qiagen) following manufacturer instructions. Library preparation and sequencing was
performed on the Illumina HiSeq 2000 platform at the University of Washington high
throughput sequencing facility (Seattle, WA). High-throughput reads (36 bp single end)
were mapped back to the oyster genome (Fang et al., 2012) using BSMAP software version
2.73 (Xi & Li, 2009). Methylation ratios (i.e., number of unconverted cytosines/the number
of converted and unconverted cytosines at each locus) were extracted from BSMAP output
(SAM) using a Python script (methratio.py) that is distributed with the BSMAP package.
Only cytosines in a CpG context with sufficient sequencing depth (defined here as greater
than or equal to 5× coverage) were retained for further analysis.
DNA methylation landscape of genomic featuresIn order to examine relationships between DNA methylation and genomic features, data
from BSMAP (i.e., methratio) was converted to genomic feature tracks (i.e., generic feature
format [GFF] files). Conversion was done using SQLShare (Howe et al., 2011), with the files
and corresponding query language published (Gavery & Roberts, 2013).
The distribution of methylated CpGs with respect to specific genomic features was
determined using BEDtools (i.e., intersectBED) (Quinlan & Hall, 2010). For this analysis, a
CpG locus was considered methylated if at least half of the reads remained unconverted
after bisulfite treatment. Genomic features that were examined include: exons and
introns (Fang et al., 2012), putative promoters (defined as 1 kb upstream of open reading
frames), and transposable elements. Putative transposable elements were identified using
RepeatMasker (Smit, Hubley & Green, 1996–2010), based on protein similarities to the
Transposable Element Protein Database. At the time of analysis the database contained
5411 predicted proteins. For comparative purposes, total CpG across the entire C. gigas
genome was also examined. Locations of all CpGs were identified using the EMBOSS tool
fuzznuc (Rice, Longden & Bleasby, 2000), and the proportion of total CpG in each of the
genomic features listed above was determined using intersectBED. A Chi-squared test was
performed to determine if the distribution of methylated CpG was different from what
would be expected by a random distribution of the total CpG in the genome (p-value
< 0.05 was considered significant).
Average methylation ratios were determined for full length genes and also the
cumulative exons and cumulative introns comprising a gene. Average methylation was
determined by the number of methylated cytosines divided by the total number of CpG per
region. The correlation between the methylation status of exons and introns of individual
genes was performed using Pearson’s correlation coefficient in SPSS (SPSS Inc.).
The relationship between predicted methylation status, using the CpG observed to
expected ratio (CpGo/e), and the average methylation ratio for each gene was examined to
assess the effectiveness of the CpGo/e method for predicting methylation in bivalve species.
For this analysis, the CpGo/e ratio was calculated for each gene using the method described
Gavery and Roberts (2013), PeerJ, DOI 10.7717/peerj.215 3/15

in Gavery & Roberts (2010). Correlation between CpGo/e and the methylation ratio was
performed using Spearman rank correlation in SPSS (SPSS Inc.).
Gene expression analysisRNA was isolated from gill tissue of the same 8 individuals used for individuals used for
bisulfite sequencing using Tri-Reagent (Molecular Research Center). RNA was pooled
in equal quantities and enriched for mRNA using Sera-Mag oligo dT beads (Thermo
Scientific). First strand synthesis was performed using SuperScript III (Invitrogen) and
the second strand of cDNA was synthesized using dUTP instead of dTTP, making the
library strand-specific. A shotgun library was constructed from double stranded cDNA for
paired end sequencing by end-polishing, A-tailing and ligation of sequencing adaptors.
Sequencing was performed on the Illumina HiSeq 2000 platform at the Northwest
Genomics Center at the University of Washington (Seattle, WA). High-throughput reads
(50 bp paired end) were mapped back to the oyster genome (Fang et al., 2012) using CLC
Genomics Workbench version 6.5 (CLC Bio). Initially, sequences were trimmed based on
quality scores of 0.05 (Phred; Ewing & Green, 1998; Ewing et al., 1998), and the number of
ambiguous nucleotides (>2 on ends). Sequences smaller than 20 bp were also removed.
For RNA-Seq analysis, expression values were measured as RPKM (reads per kilobase of
exon model per million mapped reads) (Mortazavi et al., 2008) with an unspecific match
limit of 10 and maximum number of 2 mismatches.
The RPKM values were used to examine the relationship between gene expression and
DNA methylation in gill tissue. All genes containing at least 1 CpG locus (n= 28,105) were
grouped into deciles according to transcriptomic representation in gill tissue (RPKM) and
the average methylation ratios for each decile were compared. A one-way ANOVA followed
by Tukey’s test for multiple comparisons was performed using R (R Development Core
Team, 2012) and a significance level of p < 0.05 was accepted.
A principal component analysis (PCA) was used as an exploratory tool to identify
relationships between DNA methylation, gene expression profiles and gene attributes such
as length. To explore variables related to gene expression, publicly available RNA-seq data
from a variety of adult C. gigas tissues were leveraged from Zhang et al. (2012). Specifically,
mean transcript abundance and variation in transcript abundance across tissues were
calculated using RPKM values for 7 tissues adult tissues (digestive gland, female and male
gonad, gill, anterior muscle, hemocytes and labial palps). Mean transcript abundance was
calculated using the mean RPKM across all tissues for each gene. Variation in transcript
abundance across tissues was calculated as the coefficient of variation (%CV) of the RPKM
across all 7 tissues for each gene. Other gene attributes that were examined, as they may
associate with DNA methylation, include gene length, number of exons per gene and
number of CpG per gene. In summary, the following attributes were included as variables
in the PCA performed in R (R Development Core Team, 2012): average methylation ratio of
the full length gene (as described above), gene length in base pairs (bp), number of exons,
average transcriptomic representation (average RPKM across 7 adult tissues), coefficient
of variation (%CV) of transcript abundance (RPKM) among tissues. All variables were log
Gavery and Roberts (2013), PeerJ, DOI 10.7717/peerj.215 4/15

Figure 1 Frequency distribution of methylation ratios for CpG dinucleotides in oyster gill tissue.A total of 2,625,745 CpG dinucleotides with ≥5× coverage are represented.
transformed, with the exception of the methylation ratio which was arcsine transformed
prior to analysis. The significance of each principal component was calculated using
Monte-Carlo randomization tests. Principal components were considered significant at
p≤ 0.05. Correlation loadings of≥0.6 were considered significant.
RESULTSDNA methylation mappingBisulfite treated DNA sequence reads (139,728,554 total reads; 36 bp) are available in the
NCBI Short Read Archive under the accession number SRX32737. A total of 120,734,949
reads (86%) mapped to the C. gigas genome. Fifty-six percent of the 164,873,219
cytosines in the C. gigas genome had at minimum of 1× coverage. Of the 9,978,551 CpG
dinucleotides in the genome, 2.6 million (26%) had ≥5× coverage. The distribution of
methylation ratios found at CpG dinucleotides ranged between 0.0 and 1.0, but a majority
of the loci were either heavily methylated or unmethylated. Specifically, 55% (1,453,752)
were methylated (i.e., ≥0.50) and another 28% were unmethylated (i.e.,= 0.0) (Fig. 1).
Genome feature track files (i.e., GFF) representing (1) all CpG dinucleotides and (2)
methylated CpG dinucleotides (>50%) for this dataset were developed and are available
(Gavery & Roberts, 2013).
Methylation landscape of genomic featuresMethylated CpG dinucleotides, defined as having a methylation ratio of 0.5 or greater,
were located predominantly in intragenic regions (exons and introns), but were also
present in putative promoters (defined as 1 kb upstream of TSS), transposable elements
Gavery and Roberts (2013), PeerJ, DOI 10.7717/peerj.215 5/15
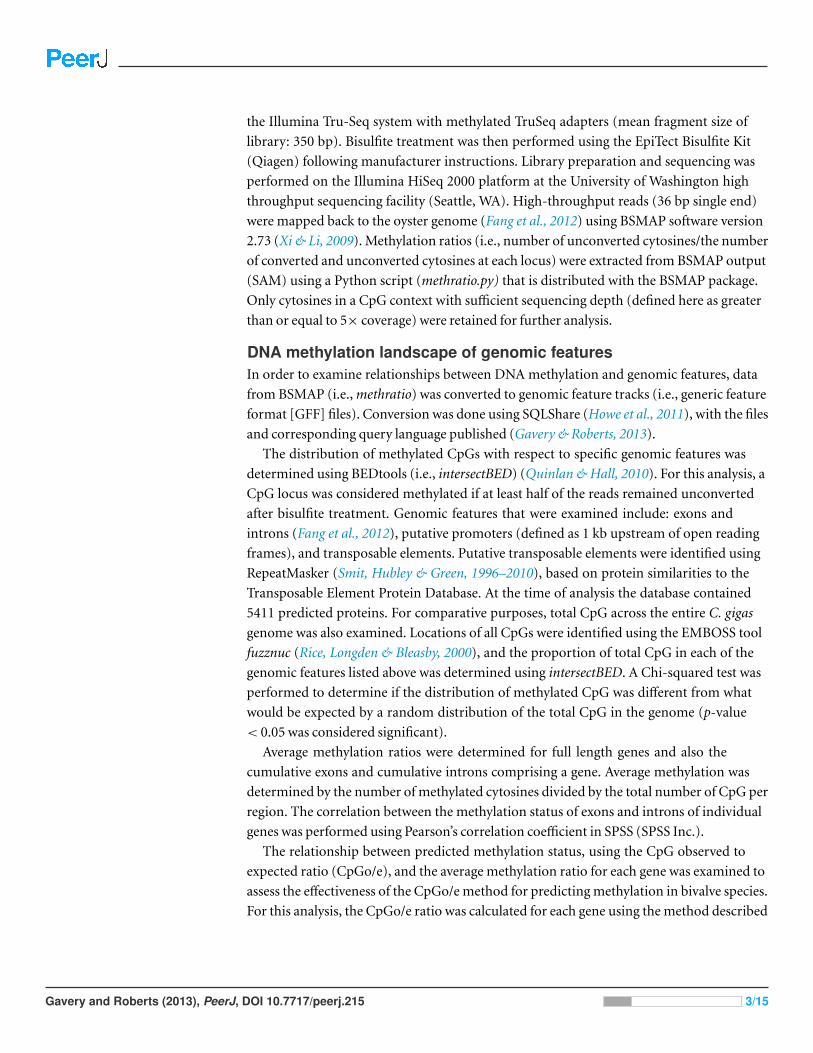
Figure 2 Comparison of the total CpG versus methylated CpG in oyster gill tissue by genomic fea-ture. Proportion of all CpG (blue) and methylated CpG (red) in gill tissue across genomic features ofC. gigas. Percent of CpG dinucleotides in Exons, Introns, Transposable Elements (TE), promoters (Pro)and unannotated intergenic regions (Other) are reported.
and unannotated intergenic regions. The distribution of methylated CpG across
various genomic regions is significantly different than what would be expected if the
methylation were distributed randomly throughout the CpG dinucleotides in the genome
(X2= 513,194.1, df = 4, p < 0.0001). Specifically, DNA methylation appears to be
overrepresented in intragenic regions (64% of methylated CpG in combined exons and
introns) when compared to the proportion of all CpG in the genome (38%) (Fig. 2).
When methylation was examined on a per gene basis a strong positive correlation
(R2: 0.86) was observed between exonic and intronic methylation within a gene.
Additionally, a strong correlation was observed between the gene methylation measured
via high-throughput bisulfite sequencing and the predicted methylation ratio based on the
CpG observed to expected ratio (CpGo/e) (Spearman rho:−0.616, p-value: <1× 10⁻⁴).
Gene expression & DNA methylationAfter quality trimming, 45,751,574 RNA-seq reads mapped to the genome. Raw reads are
available in the NCBI Short Read Archive under the accession number SRX367081.
The relationship between the proportion of methylation in a gene and overall transcript
abundance in gill tissue was characterized (Fig. 3). In general, transcription abundance
increases significantly with increasing DNA methylation until the 40th percentile after
which it remains relatively stable until the 100th percentile when methylation significantly
decreases.
The first two principal components (PC) of the PCA of gene attributes were significant
and explained 76.4% of the variation among the genes. This variation was being driven by
multiple factors, including DNA methylation (Fig. 4 and Table 1). The only variable that
did not contribute significantly to the first two principal components was mean transcript
abundance (correlation loading 0.2). The first PC, which explained 50.2% of the variation
Gavery and Roberts (2013), PeerJ, DOI 10.7717/peerj.215 6/15

Figure 3 DNA methylation among genes with increasing transcript abundances. Expressed genes weregrouped into deciles by transcription abundance. Genes not expressed in gill (i.e., RPKM = 0) are alsoshown (leftmost column). Error bars represent 95% confidence intervals.
Table 1 Summary of PCA for gene attributes.
Principalcomponent
%varianceexplained
Significancevalue
Significant variable loadings
Number of CpG 0.9
Length mRNA 0.9PC1 50.2 <0.001
Number of exons 0.8
Expression %CV −0.6PC2 26.1 <0.0001
Methylation ratio 0.6
was loaded heavily by number of CpG dinucleotides, the length of the mRNA and the
number of exons. The second PC, which explained 26.1% of the variation was loaded
heavily by the %CV of gene expression among tissues and the methylation ratio. DNA
methylation is negatively correlated with transcript variance between tissues (%CV) and
relatively uncorrelated with attributes such as gene length.
DISCUSSIONHere we have used methylation enriched high-throughput bisulfite sequencing in
conjunction with genomic feature annotation and transcriptomic data to gain a better
understanding of the role of DNA methylation in oysters. This work not only provides
new information on DNA methylation in invertebrates but also provides a framework for
characterizing DNA methylation in other taxa.
Gavery and Roberts (2013), PeerJ, DOI 10.7717/peerj.215 7/15

Figure 4 PCA ordination of oyster genes by gene attributes. Variables loadings shown by purplearrows. Variables significantly contributing to PC1 and PC2 include: methylation ratio (Methylation), thecoefficient of variance of expression between tissues (%CV), the number of exons (Exons), the length ofthe mRNA in base pairs (mRNA) and the number of CpG dinucleotides in the gene (CG). Variables thatdid not significantly contributes to PC1 and PC2 include the mean transcript abundance (Expression).Inset depicts ordination of the genes analyzed on PC1 and PC2 (n= 27,181).
The reduced representation approach was selected to obtain a higher coverage of
methylated regions. In addition, since methylation was likely to occur in gene bodies
(Zemach et al., 2010), and because transcriptomic data was the primary genomic resource
for C. gigas at the time of sequencing (the genome was released soon after), it was expected
that methylation enrichment would significantly limit the proportion of unmappable
reads. Quantitative methylation data were obtained for both methylated CpG as well
as unmethylated CpG that were either interspersed with or flanking these more heavily
methylated regions. Therefore, methylation enriched bisulfite-sequencing was effective in
generating a comprehensive invertebrate methylome.
One of our primary findings was the overall level of genome methylation in the oyster.
Here we found that 15% of CpG dinucleotides (2% of total cytosines) are methylated in
gill tissue. This degree of methylation is much lower than the global methylation patterns
seen in mammals where 70%–80% of CpGs are methylated (Bird & Taggart, 1980), but
still higher than what has been reported in other invertebrates. For instance, only 0.8%
of the CpGs are methylated in the brain of A. mellifera (Lyko et al., 2010) and between
0 and 8% of CpGs are methylated in the nematode, Trichinella spiralis, depending on
the life stage (Gao et al., 2012). Although methylation in C. gigas is relatively high for an
Gavery and Roberts (2013), PeerJ, DOI 10.7717/peerj.215 8/15

invertebrate, it is not outside the range of what has been reported in other species by liquid
chromatography-mass spectrometry analysis. For example, similar to the oyster, 2% of
total cytosines are methylated in the mollusc Biomphalaria glabrata (Fneich et al., 2013).
It should be noted that methylation in oysters does likely vary in both a temporal and
possibly tissue specific manner, as clearly indicated by Riviere et al. (2013) by characterizing
differences in total methylation during development. In addition, because the sample
represents a pool of multiple individuals, it cannot be determined whether the variation in
methylation at a particular locus represents hemimethylation or differential methylation
between individuals. In general, the bimodal pattern observed (Fig. 1) indicates that a CpG
locus is either heavily methylated or unmethylated, but future work sequencing individual
oysters would provide valuable information regarding individual epigenetic variation in
oysters.
This work also provided the first direct evidence in oysters that DNA methylation is
prominent in gene bodies (see Fig. 2) and these data are well correlated with previous
investigations using an in silico approach (i.e., CpGo/e) to predict methylation in
C. gigas (Gavery & Roberts, 2010).The predominance of gene body methylation is
consistent with what has been described in other invertebrates (e.g., Suzuki et al., 2007;
Zemach et al., 2010; Lyko et al., 2010) and there is increasing evidence that gene body
methylation is the ancestral pattern (Lechner et al., 2013). The function of gene body
methylation remains unclear, but studies indicate possible active roles in preventing
spurious transcription (Bird, 1995; Huh et al., 2013) and regulating alternative splicing
(Maunakea et al., 2010; Shukla et al., 2011; Foret et al., 2012), as well as a more passive
role for methylation as a byproduct of an open chromatin state (Jjingo et al., 2013). Given
the nature of the study design, we are not able to directly test the hypothesis that DNA
methylation contributes to spurious transcription or the regulation of alternative isoforms
in C.gigas. However, genomic feature tracks have been developed and published (Gavery
& Roberts, 2013) so that genome wide methylation can be easily visualized with respect to
gene expression patterns (exon-specific RPKM).
Exons are the preferential target for gene body methylation for most species (Feng et al.,
2010), and methylation is enriched in exons of the oyster. However, there is also a relatively
large amount of intronic methylation in oysters when compared to other invertebrate
species. For example, DNA methylation occurs almost exclusively in exons in the honey
bee A. mellifera (Lyko et al., 2010). Genome-wide methylation studies in other invertebrate
species also report very low levels of intronic methylation relative to other genomic regions
(e.g., Gao et al., 2012; Bonasio et al., 2012). Similarly, in plants, methylation is preferably
targeted to exons; however, it has been reported that in globally methylated mammalian
genomes gene body methylation is not biased toward exons (Feng et al., 2010), although
exon/intron boundaries can be marked by differences in DNA methylation (Sati et al.,
2012). It appears that bivalves may be unique among the invertebrates examined in terms
of the degree of methylation in introns. Intronic methylation has been implicated to be
involved in gene regulation through the expression of alternative isoforms of genes in other
species (e.g., Maunakea et al., 2010; Foret et al., 2012). Variation in methylation patterns
Gavery and Roberts (2013), PeerJ, DOI 10.7717/peerj.215 9/15

between taxa may indicate that additional model invertebrates are needed to study the
function of these epigenetic marks.
The distribution of DNA methylation in the C. gigas genome is consistent with the
fractionated or ‘mosaic’ pattern of methylation previously described in invertebrates
(Tweedie et al., 1999; Simmen et al., 1999). In oysters, as in other invertebrates, the methy-
lated fraction tends to consist of gene bodies, while other genomic regions exhibit less
methylation (Fig. 2). Interestingly, transposable elements (TE) show little methylation in
oyster gill tissue. This is in contrast to vertebrate genomes where TE are heavily methylated
and function to suppress their activity (Yoder, Walsh & Bestor, 1997). While there is no
general consensus regarding the extent of TE methylation across invertebrate taxa, the
pattern of sparse TE methylation observed in oysters is similar to what has been described
in other invertebrate species (Simmen et al., 1999; Feng et al., 2010; Zemach et al., 2010).
Intragenic DNA methylation is positively correlated with gene expression in C. gigas
with moderately and highly expressed genes showing the highest degree of methylation
(Fig. 3). This relationship is similar to what has been reported for other invertebrate
species (Zemach et al., 2010). Interestingly, Riviere et al. (2013) reported a negative
relationship between DNA methylation and expression of certain homeobox (hox) genes
during embryonic development in C. gigas. The authors hypothesized that the apparent
suppression of hox expression by DNA methylation may be due to repression by DNA
methylation proximal to the transcription start site in these genes. Although the results
reported here and those of Riviere et al. may appear contradictory, it is possible that
depending on the context of the methylation (i.e., whether gene body or promoter
methylation) it may play either a repressive or expressive role. This is referred to as the
DNA methylation paradox (Jones, 1999) and is observed in a wide range of taxa.
We used an ordination approach to explore genomic attributes or groups of attributes
that predictably co-occur with methylated genes in the C. gigas genome. Because multiple
factors may be linked with methylation (either through causative or correlative associa-
tions), this approach allowed us to identify relationships between multiple variables. The
most interesting finding from the PCA analysis is that the amount of methylation in a gene
is related to the variance in expression between tissues. Genes that show the least variation
in expression between tissues have higher DNA methylation levels than those exhibiting
a tissue-specific expression profile (i.e., high %CV between tissues). This observation
provides corroboration for previous reports based on in silico analyses in oysters showing
that housekeeping genes have the highest amount of methylation in C. gigas (Gavery &
Roberts, 2010). Housekeeping genes perform functions required by all cell types, therefore
it’s expected that their expression patterns would show low variation across tissues. The
results of this study are consistent with the expectation that genes with low expression
variation across tissues show a high degree of methylation relative to genes with a more
tissue-specific expression pattern. Again, this study supports previous findings (Gavery
& Roberts, 2010; Roberts & Gavery, 2012) that heavily methylated genes are enriched in
housekeeping functions, which are essential for cellular function. One theory is that the
lack of methylation in genes with tissue-specific expression can contribute to phenotypic
Gavery and Roberts (2013), PeerJ, DOI 10.7717/peerj.215 10/15

plasticity by allowing more transcriptional opportunities through processes such as
allowing access to alternative TSS, facilitating exon skipping or other alternative splicing
mechanisms and allowing for increased sequencing variation (Roberts & Gavery, 2012).
CONCLUSIONSThrough the current effort, quantitative methylation data were obtained for over
2.5 million CpG dinucleotides throughout the genome of Crassostrea gigas. These data
represent the first high resolution methylome in any mollusc and the analytical approaches
provide a framework for DNA methylation characterization in other species. In addition,
the dataset developed here will be beneficial for phylogenetic analysis of DNA methylation
in invertebrates, which will be more robust with the addition of a lophotrochozoan species.
The results of this study highlight similarities in epigenetic profiles of invertebrates such as
a predominance of gene body methylation and a positive relationship between intragenic
methylation and gene expression. In addition, they highlight interesting differences
between invertebrate epigenomes including a higher level of intronic methylation in
bivalves than what has been reported, for example, in insects. Although the functional role
of DNA methylation in bivalves remains elusive, two scenarios could explain our findings.
One possibility is DNA methylation in gene bodies is a byproduct of transcription resulting
from an open chromatin state, as proposed by Jjingo et al. (2013). Thus the methylation
patterns are influenced by transcriptional activity. The second scenario is DNA methy-
lation is involved in regulating gene activity in bivalves. If in fact DNA methylation does
influence transcription, the regulatory role is likely very complex. For instance, DNA
methylation could have both a have direct regulatory effect on certain genes as proposed
by Riviere et al. (2013), as well as facilitating expanded transcriptional opportunities in
other cases. Future studies will certainly be challenging given the dynamic nature of DNA
methylation, but will hopefully help better delineate if DNA methylation plays a functional
role in regulating genome activity in bivalves and what that role might be.
ACKNOWLEDGEMENTSThe authors would like to thank Bill Howe and Daniel Halperin for their assistance with
SQLShare. They would also like to acknowledge Samuel J. White for comments that
improved the manuscript.
ADDITIONAL INFORMATION AND DECLARATIONS
FundingThis work was supported in part by the National Science Foundation (NSF) under Grant
Number 1158119 awarded to SR Roberts, and the U.S. Environmental Protection Agency
(EPA) STAR Fellowship Assistance Agreement no. FP917331 awarded to MR Gavery. Any
opinions, findings, and conclusions or recommendations expressed in this material are
those of the author(s) and do not necessarily reflect the views of NSF or the EPA. The
funders had no role in study design, data collection and analysis, decision to publish, or
preparation of the manuscript.
Gavery and Roberts (2013), PeerJ, DOI 10.7717/peerj.215 11/15

Grant DisclosuresThe following grant information was disclosed by the authors:
Environmental Protection Agency STAR Fellowship Assistance Agreement number:
FP917331.
National Science Foundation Grant Number: 1158119.
Competing InterestsThe authors declare no competing interests.
Author Contributions• Mackenzie R. Gavery conceived and designed the experiments, performed the
experiments, analyzed the data, wrote the paper.
• Steven B. Roberts conceived and designed the experiments, analyzed the data,
contributed reagents/materials/analysis tools.
DNA DepositionThe following information was supplied regarding the deposition of DNA sequences:
NCBI Short Read Archive: accession number SRX32737, SRX367081.
Data DepositionThe following information was supplied regarding the deposition of related data:
Gavery M, Roberts S. 2013. Crassostrea gigas high-throughput bisulfite sequencing
(gill tissue). figshare. [http://dx.doi.org/10.6084/m9.figshare.749728] Retrieved 19:17,
Sep 20, 2013 (GMT).
REFERENCESBell AC, Felsenfeld G. 2000. Methylation of a CTCF-dependent boundary controls imprinted
expression of the Igf2 gene. Nature 405:482–485 DOI 10.1038/35013100.
Bird A. 1995. Gene number, noise reduction and biological complexity. Trends in Genetics11:94–100 DOI 10.1016/S0168-9525(00)89009-5.
Bird AP, Taggart MH. 1980. Variable patterns of total DNA and rDNA methylation in animals.Nucleic Acids Research 8:1485–1497 DOI 10.1093/nar/8.7.1485.
Bonasio R, Li Q, Lian J, Mutti NS, Jin L, Zhao H, Zhang P, Wen P, Xiang H, Ding Y, Jin Z,Shen S, Wang Z, Wang W, Wang J, Berger S, Liebig J, Zhang G. 2012. Genome-wide andcaste-specific DNA methylomes of the ants Camponotus floridanus and Harpegnathos saltator.Current Biology 22:1755–1764 DOI 10.1016/j.cub.2012.07.042.
Colot V, Rossignol JL. 1999. Eukaryotic DNA methylation as an evolutionary device. BioEssays21:402–411 DOI 10.1002/(SICI)1521-1878(199905)21:5<402::AID-BIES7>3.0.CO;2-B.
Ewing B, Hillier L, Wendl MC, Green P. 1998. Base-calling of automated sequencer traces usingphred. I. Accuracy assessment. Genome Research 8:175–185 DOI 10.1101/gr.8.3.175.
Ewing B, Green P. 1998. Base-calling of automated sequencer traces using phred. II. Errorprobabilities. Genome Research 8:186–194 DOI 10.1101/gr.8.3.175.
Gavery and Roberts (2013), PeerJ, DOI 10.7717/peerj.215 12/15

Fang X, Li L, Luo R, Xu F, Wang X, Zhu Y, Yang L, Huang Z. 2012. Genomic data from the Pacificoyster (Crassostrea gigas). GigaScience DOI 10.5524/100030.
Feng S, Cokus SJ, Zhang X, Chen PY, Bostick M, Goll MG, Hetzel J, Jain J, Strauss SH,Halpern ME, Ukomadu C, Sadler KC, Pradhan S, Pellegrini M, Jacobsen SE. 2010.Conservation and divergence of methylation patterning in plants and animals.Proceedings of the National Academy of Sciences of the United States of America 107:8689–8694DOI 10.1073/pnas.1002720107.
Fneich S, Dheilly N, Adema C, Rognon A, Reichelt M, Bulla J, Grunau C, Cosseau C. 2013.5-methyl-cytosine and 5-hydroxy-methyl-cytosine in the Genome of Biomphalaria Glabrata, aSnail Intermediate Host of Schistosoma Mansoni. Parasites & Vectors 6:167DOI 10.1186/1756-3305-6-167.
Foret S, Kucharski R, Pellegrini M, Feng S, Jacobsen SE, Robinson GE, Maleszka R. 2012.DNA methylation dynamics, metabolic fluxes, gene splicing, and alternative phenotypesin honey bees. Proceedings of the National Academy of Sciences of the United States of America109:4968–4973 DOI 10.1073/pnas.1202392109.
Gao F, Liu XS, Wu X-P, Wang X-L, Gong D, Lu H, Song Y, Wang J, Du J, Liu S, Han X, Tang Y,Yang H, Jin Q, Zhang X, Liu M. 2012. Differential methylation in discrete developmental stagesof the parasitic nematode Trichinella spiralis. Genome Biology 13:R100DOI 10.1186/gb-2012-13-10-r100.
Gavery M, Roberts SB. 2010. DNA methylation patterns provide insight into epigenetic regulationin the Pacific oyster (Crassostrea gigas). BMC Genomics 11:483 DOI 10.1186/1471-2164-11-483.
Gavery M, Roberts S. 2013. Crassostrea gigas high-throughput bisulfite sequencing (gill tissue).figshare. Retrieved 18:44, Oct 21, 2013 (GMT) DOI 10.6084/m9.figshare.749728.
Howe B, Cole G, Souroush E, Koutris P, Key A, Khoussainova N, Battle L. 2011. Database-as-a-service for long-tail science. In: Cushing JB, French J, Bowers S, eds. Proceedings of the 23rdinternational conference on scientific and statistical database management (SSDBM’11). Berlin,Heidelberg: Springer-Verlag, 480–489.
Hsieh CL. 1994. Dependence of transcriptional repression on CpG methylation density. Molecularand Cellular Biology 14:5487–5494.
Huh I, Zeng J, Park T, Yi S. 2013. DNA methylation and transcriptional noise. Epigenetics &Chromatin 6:9 DOI 10.1186/1756-8935-6-9.
Jjingo D, Conley AB, Yi SV, Lunyak VV, Jordan IK. 2013. On the presence and role of humangene-body DNA methylation. Oncotarget 3:462–474.
Jones PA. 1999. The DNA methylation paradox. Trends in Genetics 15:34–37 DOI 10.1016/S0168-9525(98)01636-9.
Kucharski R, Maleszka J, Foret S, Maleszka R. 2008. Nutritional control of reproductive status inhoneybees via DNA methylation. Science 319:1827–1830 DOI 10.1126/science.1153069.
Lechner M, Marz M, Ihling C, Sinz A, Stadler PF, Krauss V. 2013. The correlation of genome sizeand DNA methylation rate in metazoans. Theory in Biosciences 132:47–60DOI 10.1007/s12064-012-0167-y.
Li E, Bestor TH, Jaenisch R. 1992. Targeted mutation of the DNA methyltransferase gene resultsin embryonic lethality. Cell 69:915–926 DOI 10.1016/0092-8674(92)90611-F.
Lyko F, Foret S, Kucharski R, Wolf S, Falckenhayn C, Maleszka R. 2010. The honey beeepigenomes: differential methylation of brain DNA in queens and workers. PLoS Biology8:e1000506 DOI 10.1371/journal.pbio.1000506.
Gavery and Roberts (2013), PeerJ, DOI 10.7717/peerj.215 13/15

Maunakea AK, Nagarajan RP, Bilenky M, Ballinger TJ, D’Souza C, Fouse SD, Johnson BE,Hang C, Nielsen C, Zhao Y, Turecki G, Delaney A, Varhol R, Thiessen N, Shchors K,Heine VM, Rowitch DH, Xing X, Fiore C, Schillebeeckx M, Jones SJM, Haussler D,Marra MA, Hirst M, Wang T, Costello JF. 2010. Conserved role of intragenic DNA methylationin regulating alternative promoters. Nature 466:253–257 DOI 10.1038/nature09165.
Mortazavi A, Williams BA, McCue K, Schaeffer L, Wold B. 2008. Mapping and quantifyingmammalian transcriptomes by RNA-Seq. Nature Methods 5:621–628 DOI 10.1038/nmeth.1226.
Okano M, Bell DW, Haber DA, Li E. 1999. DNA methyltransferases Dnmt3a and Dnmt3bare essential for de novo methylation and mammalian development. Cell 99:247–257DOI 10.1016/S0092-8674(00)81656-6.
Petrovic V, Perez-Garcia C, Pasantes JJ, Satovic E, Prats E, Plohl M. 2009. A GC-rich satelliteDNA and karyology of the bivalve mollusk donax trunculus: a dominance of GC-richheterochromatin. Cytogenetic and Genome Research 124:63–71 DOI 10.1159/000200089.
Quinlan AR, Hall IM. 2010. BEDTools: a flexible suite of utilities for comparing genomic features.Bioinformatics 26:841–842 DOI 10.1093/bioinformatics/btq033.
R Development Core Team. 2012. R: a language and environment for statistical computing.Available at http://www.R-project.org.
Rice P, Longden I, Bleasby A. 2000. EMBOSS: the European molecular biology open softwaresuite. Trends in Genetics 16:276–277 DOI 10.1016/S0168-9525(00)02024-2.
Riviere G, Wu GC, Fellous A, Goux D, Sourdaine P, Favrel P. 2013. DNA methylation is crucialfor the early development in the oyster C. gigas. Marine Biotechnology 15:739–753DOI 10.1007/s10126-013-9523-2.
Roberts SB, Gavery MR. 2012. Is there a relationship between DNA methylation and phenotypicplasticity in invertebrates? Frontiers in Physiology 2:116 DOI 10.3389/fphys.2011.00116.
Sati S, Tanwar VS, Kumar KA, Patowary A, Jain V, Ghosh S, Ahmad S, Singh M, Reddy SU,Chandak GR, Raghunath M, Sivasubbu S, Chakraborty K, Scaria V, Sengupta S. 2012. Highresolution methylome map of rat indicates role of intragenic DNA methylation in identificationof coding region. PLoS ONE 7:e31621 DOI 10.1371/journal.pone.0031621.
Shukla S, Kavak E, Gregory M, Imashimizu M, Shutinoski B, Kashlev M, Oberdoerffer P,Sandberg R, Oberdoerffer S. 2011. CTCF-promoted RNA polymerase II pausing links DNAmethylation to splicing. Nature 479:74–79 DOI 10.1038/nature10442.
Simmen MW, Leitgeb S, Charlton J, Jones SJM, Harris BR, Clark VH, Bird A. 1999.Nonmethylated transposable elements and methylated genes in a chordate genome. Science283:1164–1167 DOI 10.1126/science.283.5405.1164.
Smit AFA, Hubley R, Green P. 1996–2010. RepeatMasker Open-3.0. Available at http://www.repeatmasker.org.
Suzuki MM, Kerr ARW, De Sousa D, Bird A. 2007. CpG methylation is targeted to transcriptionunits in an invertebrate genome. Genome Research 17:625–631 DOI 10.1101/gr.6163007.
Tweedie S, Charlton J, Clark V, Bird A. 1999. Methylation of genomes and genes at theinvertebrate–vertebrate boundary. Molecular and Cellular Biology 17:1469–1475.
Wang S, Bao Z, Hu X, Shao M, Zhang L, Hu J. 2008. Two novel elements (CFG1 and PYG1) of maglineage of Ty3/Gypsy retrotransposons from Zhikong Scallop (Chlamys Farreri) and JapaneseScallop (Patinopecten Yessoensis). Genetica 133:37–46 DOI 10.1007/s10709-007-9180-3.
Wolffe AP, Matzke MA. 1999. Epigenetics: regulation through repression. Science 286:481–486DOI 10.1126/science.286.5439.481.
Gavery and Roberts (2013), PeerJ, DOI 10.7717/peerj.215 14/15

Xi Y, Li W. 2009. BSMAP: whole genome Bisulfite Sequence MAPping program. BMCBioinformatics 10:232 DOI 10.1186/1471-2105-10-232.
Yoder JA, Walsh CP, Bestor TH. 1997. Cytosine methylation and the ecology of intragenomicparasites. Trends in Genetics 8:335–340 DOI 10.1016/S0168-9525(97)01181-5.
Zemach A, McDaniel IE, Silva P, Zilberman D. 2010. Genome-wide evolutionary analysis ofeukaryotic DNA methylation. Science 328:916–919 DOI 10.1126/science.1186366.
Zhang G, Fang X, Guo X, Li L, Luo R, Xu F, Yang P, Zhang L, Wang X, Qi H, Xiong Z, Que H,Xie Y, Holland PWH, Paps J, Zhu Y, Wu F, Chen Y, Wang J, Peng C, Meng J, Yang L, Liu J,Wen B, Zhang N. 2012. The oyster genome reveals stress adaptation and complexity of shellformation. Nature 490:49–54 DOI 10.1038/nature11413.
Zhang X, Yazaki J, Sundaresan A, Cokus S, Chan SW, Chen H, Henderson IR, Shinn P,Pellegrini M, Jacobsen SE, Ecker JR. 2006. Genome-wide high-resolution mapping andfunctional analysis of DNA methylation in Arabidopsis. Cell 126:1189–1201DOI 10.1016/j.cell.2006.08.003.
Zilberman D, Gehring M, Tran RK, Ballinger T, Henikoff S. 2007. Genome-wide analysis ofArabidopsis thaliana DNA methylation uncovers an interdependence between methylationand transcription. Nature Genetics 39:61–69 DOI 10.1038/ng1929.
Gavery and Roberts (2013), PeerJ, DOI 10.7717/peerj.215 15/15