Embed Size (px)
Citation preview

Predisposition for and Prevention of Subjective TinnitusDevelopmentSonke Ahlf., Konstantin Tziridis*., Sabine Korn, Ilona Strohmeyer, Holger Schulze
Experimental Otolaryngology, University of Erlangen-Nuremberg, Erlangen, Germany
Abstract
Dysfunction of the inner ear as caused by presbyacusis, injuries or noise traumata may result in subjective tinnitus, but noteveryone suffering from one of these diseases develops a tinnitus percept and vice versa. The reasons for these individualdifferences are still unclear and may explain why different treatments of the disease are beneficial for some patients but notfor others. Here we for the first time compare behavioral and neurophysiological data from hearing impaired Mongoliangerbils with (T) and without (NT) a tinnitus percept that may elucidate why some specimen do develop subjective tinnitusafter noise trauma while others do not. Although noise trauma induced a similar permanent hearing loss in all animals,tinnitus did develop only in about three quarters of these animals. NT animals showed higher overall cortical and auditorybrainstem activity before noise trauma compared to T animals; that is, animals with low overall neuronal activity in theauditory system seem to be prone to develop tinnitus after noise trauma. Furthermore, T animals showed increased activityof cortical neurons representing the tinnitus frequencies after acoustic trauma, whereas NT animals exhibited an activitydecrease at moderate sound intensities by that time. Spontaneous activity was generally increased in T but decreased in NTanimals. Plastic changes of tonotopic organization were transient, only seen in T animals and vanished by the time thetinnitus percept became chronic. We propose a model for tinnitus prevention that points to a global inhibitory mechanismin auditory cortex that may prevent tinnitus genesis in animals with high overall activity in the auditory system, whereas thismechanism seems not potent enough for tinnitus prevention in animals with low overall activity.
Citation: Ahlf S, Tziridis K, Korn S, Strohmeyer I, Schulze H (2012) Predisposition for and Prevention of Subjective Tinnitus Development. PLoS ONE 7(10): e44519.doi:10.1371/journal.pone.0044519
Editor: Iris Schrijver, Stanford University School of Medicine, United States of America
Received May 22, 2012; Accepted August 8, 2012; Published October 2, 2012
Copyright: � 2012 Ahlf et al. This is an open-access article distributed under the terms of the Creative Commons Attribution License, which permits unrestricteduse, distribution, and reproduction in any medium, provided the original author and source are credited.
Funding: This work was supported by the Interdisciplinary Center for Clinical Research (IZKF, project E7) at the University Hospital Erlangen. The funders had norole in study design, data collection and analysis, decision to publish, or preparation of the manuscript.
Competing Interests: The authors have declared that no competing interests exist.
* E-mail: [email protected]
. These authors contributed equally to this work.
Introduction
Diseases of the inner ear leading to hearing loss (HL) may result
in subjective tinnitus [1]. Enigmatically, not everyone suffering
from HL develops a tinnitus percept and conversely not in
everyone who suffers from tinnitus a permanent hearing impair-
ment can be detected [2]. The reasons for these individual
differences are still unclear and may explain why different
treatments of the disease are beneficial for some patients but not
for others [3].
The development of a tinnitus percept is often related to
neuronal plasticity on multiple levels of the central auditory system
including the auditory cortex ([4,5,6,7] for review see [8]). Current
models of tinnitus genesis usually consider damage of cochlear hair
cells that induce an imbalance in lateral inhibition on subsequent
neuronal levels as causal for such central plasticity [9], but even if
the inducing event is identical not every animal or human
subsequently suffers from tinnitus. In this report we follow the
hypothesis that there must be some predisposition in the central
auditory system of some but not all individuals that protects them
from the development of subjective tinnitus. In search of this
predisposition we recorded neuronal activity from the auditory
brainstem and cortex of the same individuals of Mongolian gerbils
before and after an acoustic trauma and compared the data
obtained from animals that showed an acute tinnitus percept in
behavioral testing (group T) with data from those that did not
(group NT). Possible differences in these two groups of animals
may further elucidate the neuronal mechanisms that lead to
subjective tinnitus and thereby may help to find a prophylaxis
against tinnitus development and improve actual treatments for
tinnitus patients (e.g. [10]).
Materials and Methods
Ethics StatementFor the welfare of the animals the researchers were responsible.
The gerbils were housed in a standard animal rack (Bio A.S. Vent
Light, Ehret Labor- und Pharmatechnik, Emmendingen, Ger-
many) in groups of 2 to 3 animals per cage with free access to
water and food at 20 to 24uC room temperature. The use and care
of animals was approved by the state of Bavaria (Regierung-
sprasidium Mittelfranken, Ansbach, Germany).
Behavioral MeasurementsA total of thirty five 8 to 10 weeks old male Mongolian gerbils
(Meriones unguiculatus) purchased by Charles River (Charles River
GmbH, Sulzfeld, Germany) were used in this study. Animals were
handled before the beginning of the experiments and accustomed
to the setup environment to minimize stress. Behavioral testing of
PLOS ONE | www.plosone.org 1 October 2012 | Volume 7 | Issue 10 | e44519

animals was performed in an IAC (Industrial Acoustics Company
GmbH, Niederkruchten, Germany) acoustic chamber on a TMC
(Technical Manufacturing Corporation, Peabody, MA, USA) low-
vibration table. The behavioral setup consisted of a 15 cm long
transparent acrylic tube (inner diameter 4.0 to 4.3 cm, depending
on the body size of the animal) placed 10 cm in front of a speaker
(Canton Plus X Series 2; Canton, Weilrod, Germany) onto a
Honeywell FSG15N1A piezo sensor (Honeywell AG, Offenbach,
Germany). The tube’s front end was closed with a stainless steel
grate (wire mesh width 0.5 mm) allowing acoustic stimulation with
no detectable distortion (signal to noise ratio at least 70 dB,
checked via HP spectrum analyzer: 3563A Control Systems
Analyzer; Hewlett-Packard GmbH, Boblingen, Germany). Sound
pressure level was controlled via a B&K Type 2610 measuring
amplifier fed with a B&K Type 2669 preamplifier/B&K Type
4190 condensor microphone combination (Bruel & Kjaer GmbH,
Bremen, Germany). Stimulus generation and data acquisition was
controlled using custom-made Matlab 2008 programs (Math-
Works, Natick, MA, USA; stimulation/recording sampling rate
20 kHz). For sound generation the frequency response function of
the speaker was calibrated to produce an output spectrum that was
flat within +/21 dB.
Animals were placed in the tube, in which it fits well and is able
to move back and forth roughly 2 cm. We allowed 15 min
habituation time before 3 different types of prepulse inhibition
(PPI) modulated auditory startle response (ASR) paradigms
(Figure 1) were performed, usually in a single 4 h block before
and 5 to 11 days (median 7 days) after the acoustic trauma.
Between different stimulus sets a break of 5 minutes was used to
prevent behavioral adaptation. Interstimulus intervals were varied
randomly (mean 1062.5 sec SD) and each stimulus was repeated
15 times. Stimulation paradigms were: first, an hearing threshold
estimation paradigm to obtain behavioral audiograms (set 1) [11]
consisting of a 90 dB SPL pure tone startle stimulus (duration:
6 ms, with 2 ms cosine-squared rise and fall ramps; 0.5 to 8.0 kHz
in octave steps) preceded by 100 ms by a 0 to 50 dB SPL
prestimulus of the same frequency and length. Stimuli with
different frequencies were presented pseudorandomized in blocks
of different prestimulus intensities starting from 0 dB SPL and
rising to 50 dB SPL (cf. Figure 1, upper panel). Second, two
different forms of gap-noise paradigms were used to demonstrate
the existence of possible tinnitus percepts and to give a rough
estimate of the perceived tinnitus frequencies [12]. The first of
these used a gap-noise paradigm with a white noise background of
50 dB SPL and 90 dB SPL pure tone startle stimuli of 1 to 8 kHz
in octave steps with or without a 15 ms prestimulus-gap in the
noise 100 ms before the stimulus (stimulus set 2, Figure 1, center
panel) with the rationale of utilizing tinnitus related anxiety as
frequency specific factor that induces freezing behavior (cf.
[13,14,15]). Each frequency was presented separately with and
without gap, starting from 1 kHz in ascending steps to 8 kHz. The
last paradigm (stimulus set 3) had an identical timing and
presentation regime as stimulus set 2 with the startle-stimulus
being a click and the noise being bandpass filtered to mean
frequencies ranging from 1 to 16 kHz in octave steps and a width
of 60.5 octave (Figure 1, lower panel) with the rationale of the
tinnitus frequency masking the gap in the noise band that fits its
spectrum best [12]. Both gap-noise paradigms for the detection of
tinnitus percepts yielded similar results (cf. below).
Data of all PPI paradigms were checked by eye: Trials in which
the animals moved within 100 ms before the startle stimulus were
discarded; only responses within the first 50 ms after startle
stimulus onset were used for further analysis. Response data in the
threshold paradigm (stimulus set 1) were fitted with a sigmoidal
Boltzmann function; hearing thresholds were defined as the sound
level at the inflection point of the function at each frequency
before and after trauma (cf. [16]). The data in the two gap-noise
paradigms (sets 2 and 3) were normalized to minimize variance of
the response amplitudes and to avoid possible effects of the
acoustic trauma on different stimulation frequencies. In other
words, we tried to control for differences in the startle amplitudes
resulting from the hearing loss at the trauma frequency. This
normalization also guarantees that the reduced ASR response after
acoustic trauma is not due to hearing loss rather than a tinnitus
percept. The normalization was performed by dividing the actual
amplitude by the median amplitude of the startle stimulus alone
(set 1 pure tone startle stimulus without prestimulus). This was
done for pre and post trauma conditions and all frequencies
separately; then the effect of the PPI relative to pre trauma values
was calculated in percent.
Acoustic Trauma and Auditory Brainstem RecordingsAn acoustic trauma at 2 kHz (115 dB SPL, 75 min) in deep
ketamine-xylazine-anesthesia (mixture of ketamine, xylazine, NaCl
and atropine at a mixing ratio of 9:1:8:2, initial dose: 0.3 ml s.c.)
was used to induce a frequency specific HL in all animals and
possibly the subsequent development of a tinnitus percept. The
tone was generated by a HP 33120A waveform generator,
amplified and presented free-field to both ears by a speaker
placed 5 cm in front of the animal’s head (Canton Plus X Series 2).
Anesthesia during trauma was maintained via subcutaneous
infusion of the anesthetic solution supported by a syringe pump
at a rate of 0.2 to 0.3 ml/h. The animal’s body temperature was
kept constant by a warming pad.
Figure 1. Behavioral paradigms using prepulse inhibition (PPI)of the acoustic startle response (ASR). Upper panel: Hearingthreshold estimation paradigm in silence, with 90 dB pure tone startlestimuli ranging from 0.5 to 16 kHz in octave steps and prestimuli of thesame frequency with intensities ranging from 0 to 50 dB SPL in 10 dBsteps ( = stimulus set 1). Center panel: Behavioral tinnitus test(stimulus set 2, [12]) with white noise background and pure tonestartle stimuli ranging from 1 to 8 kHz (in octave steps) utilizing a silentgap of 15 ms as prestimulus. Lower panel: Behavioral tinnitus test(stimulus set 3, [15]) with bandpass noise (width of 1 octave) of differentcenter frequencies (1 to 16 kHz in octave steps), a click as startlestimulus and a gap as prestimulus.doi:10.1371/journal.pone.0044519.g001
Predisposition for Tinnitus
PLOS ONE | www.plosone.org 2 October 2012 | Volume 7 | Issue 10 | e44519

Auditory brainstem responses (ABR) were measured after the
pre trauma ASR experiments but before surgery (cf. below) and
again directly after the acoustic trauma to measure the acute
trauma effect. Data were obtained via subcutaneously placed thin
silver wire electrodes (0.25 mm diameter) using a Plexon
Multichannel Acquisition Processor (Plexon system with HLK2-
card; Plexon Inc., Dallas, TX, USA) after amplification by a JHM
NeuroAmp 401 (J. Helbig Messtechnik, Mainaschaff, Germany)
and stored with a custom-made Matlab program (10 kHz
sampling rate). Auditory stimuli were generated by a custom-
made Matlab program and presented free field to one ear at a time
via a frequency response function corrected speaker (SinusLive
neo 25S, pro hifi, Kaltenkirchen, Germany) at circa 0.5 cm
distance from the animal’s pinna while the contralateral ear was
tamped with an ear plug (e.g. [17]). Stimuli presented were clicks
(0.1 ms duration) and pure tones (4 ms duration including 1 ms
cosine-squared rise and fall times) ranging from 0.5 to 16.0 kHz in
half-octave steps. 120 stimuli were presented in pairs of two phase
inverted stimuli (intrastimulus interval 100 ms) and an interstim-
ulus interval of 500 ms between stimulus pairs. Stimulation was
pseudo-randomized using a fixed list of all combinations of
stimulus frequencies and sound pressure levels (0 to 90 dB SPL in
5 dB steps). To obtain ABR-based audiograms the mean ABR
waves were compared to the mean amplitude 200 to 100 ms
before the stimulus (baseline). Thresholds were defined automat-
ically by a custom-made Matlab program at the highest
attenuation at which the evoked amplitude raised over 2 standard
deviations of the baseline; data were discarded at frequencies
where this procedure was not possible, e.g., at low signal to noise
ratios. For additional analysis the root mean square (RMS) value
of the ABR signal was calculated from 1 ms to 5 ms after stimulus
onset.
Electrophysiological Unit Recordings in Primary AuditoryCortex (AI)
Recording in AI was chosen, as it is the first and – at least for
the gerbil – most important cortical representation of perceived
sounds. Two to five days after obtaining baseline ASR and ABR
data, i.e., before the acoustic trauma, the skull of the anesthetized
animals was trepanned to expose the left auditory cortex. A 2.5 cm
aluminum head-post and recording chamber was implanted.
Recording began two to four days after surgery. Animals were
again ketamine-xylazine anesthetized, placed on a warming pad
and fixated via the aluminum head-post. Over 2 to 3 sessions every
second day, single and multi-unit responses to tones in 5 to 7 tracks
with 2 to 4 recording locations each in AI were recorded using
tungsten microelectrodes (1 MV impedance, 1–2 mm tip diameter,
Plexon microelectrodes PLX-ME-W-3-PC-3-1.0-A-254). Verifica-
tion of recording sites was done using neuronal response
characteristics (latency, tuning sharpness (Q30), temporal response
patterns (phasic/tonic), tonotopic organization (cf. [18])).
Stimulation consisted of pure tones (200 ms including 1 ms
cosine-squared rise and fall times) ranging from 0.25 to 16.0 kHz
in quarter-octave or half-octave steps presented at 70 dB SPL with
500 ms interstimulus intervals. Additionally to these iso-intensity
measurements, tuning curves were recorded using pure tones in
the mentioned frequency range but at different intensities ranging
from 0 to 90 dB SPL. The recorded unit activity was analyzed
with custom-made Matlab and IDL programs. Best frequency (BF;
frequency with highest discharge rate at 70 dB SPL) as well as
spontaneous rate (mean activity within a time window from 50 ms
before to stimulus onset), evoked rate at BF and evoked rates at all
tested stimulation intensities and frequencies were calculated for
each unit individually.
Results
Assessment of Noise Trauma Induced Hearing Loss andTinnitus Development
Under deep ketamine-xylazine anesthesia a total of 35 animals
received a noise trauma (2 kHz pure tone, cf. Methods) that
produced a spectrally defined acute HL in all animals that could
be detected at least until the end of our experiments (4 animals
exemplarily retested up to 16 weeks after the trauma). HL was
quantified by both ABR and behavioral audiograms before and
after the trauma (cf. below). Animals were also tested for tinnitus
with behavioral tests (cf. Methods and [19,20]). We determined
whether an animal developed a tinnitus percept and if so
approximated the individually perceived frequency. It turned out
that about three quarters (26 out of 35) of the animals developed a
tinnitus percept while the remaining 9 animals did not. This
percept was usually strongest at frequencies at and/or 1 octave
above the trauma frequency in one or both gap-noise paradigms.
Figure 2A depicts the behavioral responses to stimulus set 3 of two
exemplary animals with a spectrally narrow (left) or wide (right)
tinnitus percept, respectively. Narrow tinnitus percepts (16/26,
61.5%) were defined as having only one or two neighboring
frequencies affected, while wide tinnitus percepts had at least three
frequencies affected. The example of an animal with a spectrally
narrow tinnitus percept shown in the left panel of Figure 2A had a
significant PPI impairment (as reflected in increased ASR) at 4 and
8 kHz only (Tukey post-hoc tests after one-factorial ANOVA). In
contrast, for the animal with a spectrally wide tinnitus percept
shown on the right we detected significantly impaired PPI at 4
frequencies. Figure 2B gives an overview across the frequency
distributions of the tinnitus percepts in both groups. The two
distributions are not significantly different from each other
(Kolmogorov-Smirnov test, p = 0.12) with both showing the peak
of the distributions around 2 to 4 kHz. For all further analysis we
therefore combined the data of these two groups again.
Figure 3 compares the results of the two behavioral paradigms
for tinnitus detection. The top panel shows the behavioral data for
stimulus set 2 across all animals, the bottom panel depicts data for
stimulus set 3. Grey bars show post trauma PPI changes in animals
that developed a tinnitus percept (group T), white bars those for
animals that did not develop a tinnitus (group NT). For group T
(narrow and wide tinnitus percept) and stimulation set 2 (Figure 3,
top panel) a significant impairment of PPI as a sign of tinnitus
could be detected at all tested frequencies after the trauma (single
sample t-tests vs. 0 all p,0.001; mean 6 SD at 1 kHz:
25.7695.0%; 2 kHz: 45.76114.7%; 4 kHz: 48.1698.3%;
8 kHz: 25.9649.1%) but was strongest at 2 and 4 kHz (Tukey-
tests after significant one-factorial ANOVA). NT animals on the
other hand showed no impairment or even a significant
improvement of PPI (1 kHz: 6.5693.0%; 2 kHz: 28.2672.0%;
4 kHz: 217.6635.4%, p,0.001; 8 kHz: 22.2632.8%). In
stimulation set 3 (Figure 3, bottom panel) T animals showed a
significant impairment of PPI at all tested frequencies after the
trauma (single sample t-tests vs. 0 all p,0.001 except 2 kHz where
p = 0.002; 1 kHz: 24.56126.9%; 2 kHz: 23.26158.1%; 4 kHz:
19.6686.4%; 8 kHz: 16.3624.8%; 16 kHz: 13.4619.8%) while
the distribution – without any clear peak as indicated by the non-
significant one-factorial ANOVA – was not identical to the one
shown above (Kolmogorov-Smirnov test, p,0.05). NT animals
again showed no impairment or even improved their PPI
responses significantly (1 kHz: 29.1623.8%, p,0.001; 2 kHz:
221.9628.7%, p,0.001; 4 kHz: 28.9633.5%, p = 0.002; 8 kHz:
21.5614.9%; 16 kHz: 3.7613.3%). In other words, whereas
group T developed significantly impaired PPI as a sign of tinnitus
Predisposition for Tinnitus
PLOS ONE | www.plosone.org 3 October 2012 | Volume 7 | Issue 10 | e44519

Figure 2. Frequency distributions of perceived tinnitus frequencies. A Data from two exemplary animals tested with stimulus set 3 withnarrow (left panel) and wide tinnitus percepts (right panel), respectively. In both cases the one-factorial ANOVAs indicated frequency dependency ofthe PPI changes relative to pre trauma but in the first case only for two and in the second case for four frequencies. Whiskers indicate standard errorof the mean (SEM) B Frequency distributions for narrow (16 animals) and wide tinnitus percepts (10 animals) with observation frequency given inpercent. Both distributions are not significantly different from each other.doi:10.1371/journal.pone.0044519.g002
Predisposition for Tinnitus
PLOS ONE | www.plosone.org 4 October 2012 | Volume 7 | Issue 10 | e44519
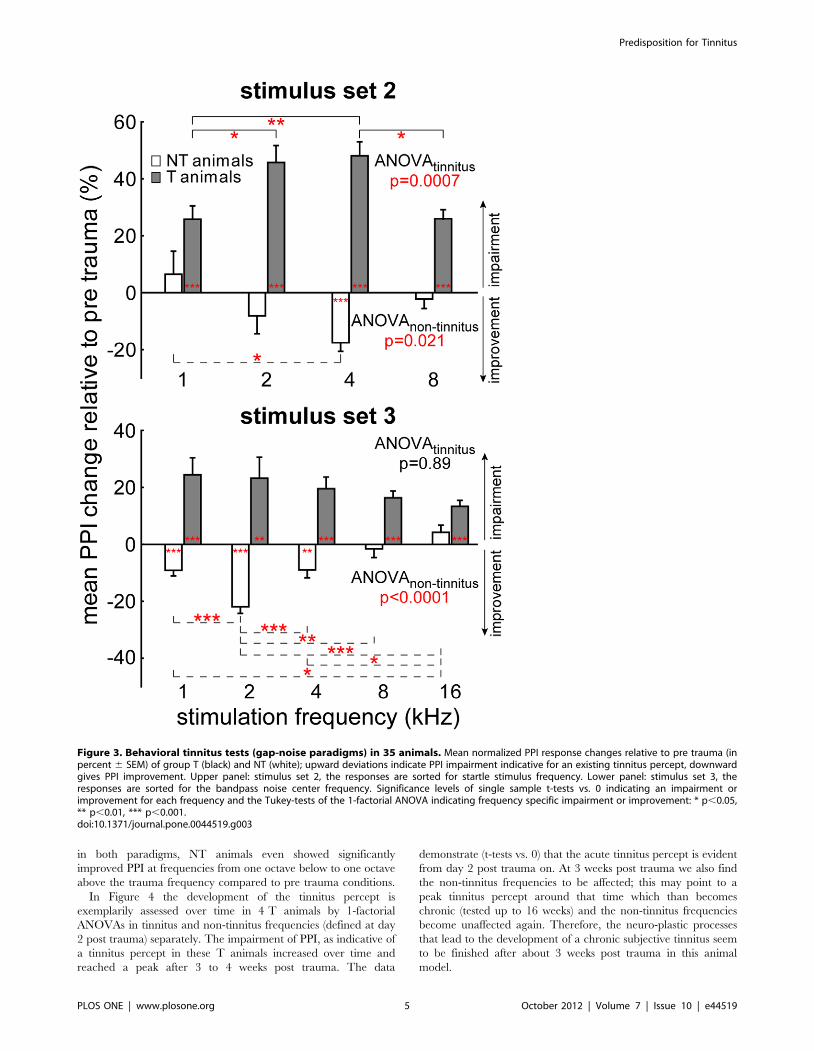
in both paradigms, NT animals even showed significantly
improved PPI at frequencies from one octave below to one octave
above the trauma frequency compared to pre trauma conditions.
In Figure 4 the development of the tinnitus percept is
exemplarily assessed over time in 4 T animals by 1-factorial
ANOVAs in tinnitus and non-tinnitus frequencies (defined at day
2 post trauma) separately. The impairment of PPI, as indicative of
a tinnitus percept in these T animals increased over time and
reached a peak after 3 to 4 weeks post trauma. The data
demonstrate (t-tests vs. 0) that the acute tinnitus percept is evident
from day 2 post trauma on. At 3 weeks post trauma we also find
the non-tinnitus frequencies to be affected; this may point to a
peak tinnitus percept around that time which than becomes
chronic (tested up to 16 weeks) and the non-tinnitus frequencies
become unaffected again. Therefore, the neuro-plastic processes
that lead to the development of a chronic subjective tinnitus seem
to be finished after about 3 weeks post trauma in this animal
model.
Figure 3. Behavioral tinnitus tests (gap-noise paradigms) in 35 animals. Mean normalized PPI response changes relative to pre trauma (inpercent 6 SEM) of group T (black) and NT (white); upward deviations indicate PPI impairment indicative for an existing tinnitus percept, downwardgives PPI improvement. Upper panel: stimulus set 2, the responses are sorted for startle stimulus frequency. Lower panel: stimulus set 3, theresponses are sorted for the bandpass noise center frequency. Significance levels of single sample t-tests vs. 0 indicating an impairment orimprovement for each frequency and the Tukey-tests of the 1-factorial ANOVA indicating frequency specific impairment or improvement: * p,0.05,** p,0.01, *** p,0.001.doi:10.1371/journal.pone.0044519.g003
Predisposition for Tinnitus
PLOS ONE | www.plosone.org 5 October 2012 | Volume 7 | Issue 10 | e44519
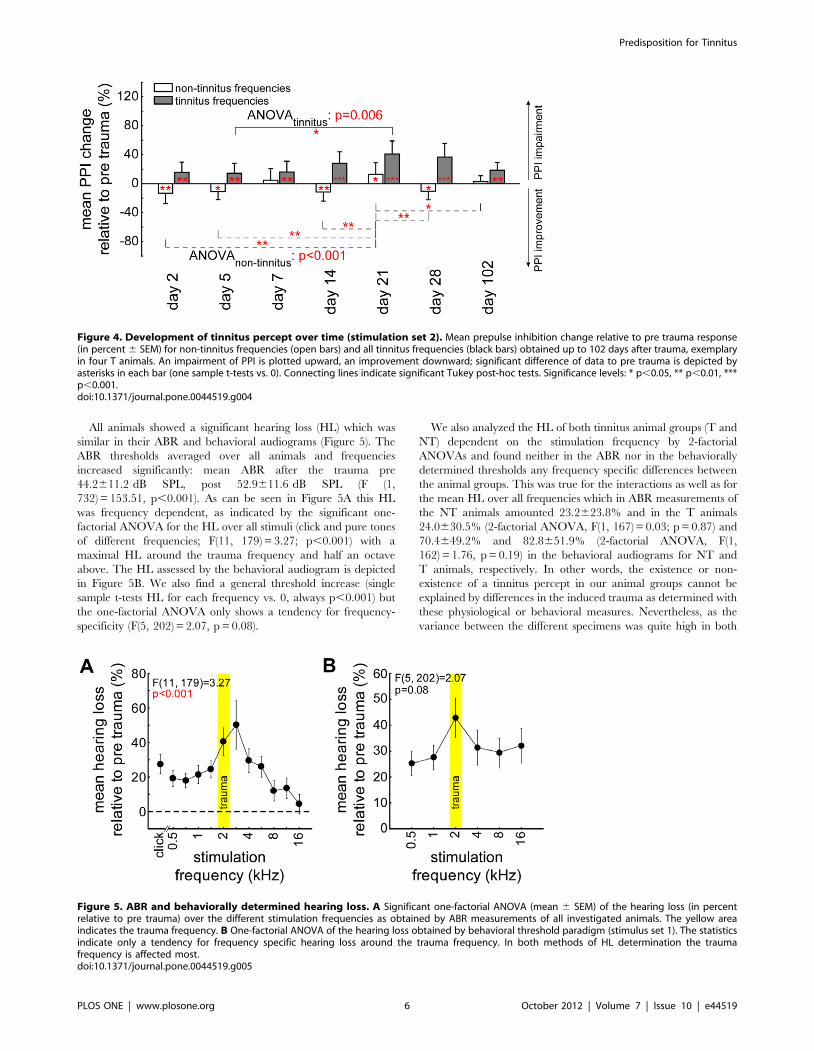
All animals showed a significant hearing loss (HL) which was
similar in their ABR and behavioral audiograms (Figure 5). The
ABR thresholds averaged over all animals and frequencies
increased significantly: mean ABR after the trauma pre
44.2611.2 dB SPL, post 52.9611.6 dB SPL (F (1,
732) = 153.51, p,0.001). As can be seen in Figure 5A this HL
was frequency dependent, as indicated by the significant one-
factorial ANOVA for the HL over all stimuli (click and pure tones
of different frequencies; F(11, 179) = 3.27; p,0.001) with a
maximal HL around the trauma frequency and half an octave
above. The HL assessed by the behavioral audiogram is depicted
in Figure 5B. We also find a general threshold increase (single
sample t-tests HL for each frequency vs. 0, always p,0.001) but
the one-factorial ANOVA only shows a tendency for frequency-
specificity (F(5, 202) = 2.07, p = 0.08).
We also analyzed the HL of both tinnitus animal groups (T and
NT) dependent on the stimulation frequency by 2-factorial
ANOVAs and found neither in the ABR nor in the behaviorally
determined thresholds any frequency specific differences between
the animal groups. This was true for the interactions as well as for
the mean HL over all frequencies which in ABR measurements of
the NT animals amounted 23.2623.8% and in the T animals
24.0630.5% (2-factorial ANOVA, F(1, 167) = 0.03; p = 0.87) and
70.4649.2% and 82.8651.9% (2-factorial ANOVA, F(1,
162) = 1.76, p = 0.19) in the behavioral audiograms for NT and
T animals, respectively. In other words, the existence or non-
existence of a tinnitus percept in our animal groups cannot be
explained by differences in the induced trauma as determined with
these physiological or behavioral measures. Nevertheless, as the
variance between the different specimens was quite high in both
Figure 4. Development of tinnitus percept over time (stimulation set 2). Mean prepulse inhibition change relative to pre trauma response(in percent 6 SEM) for non-tinnitus frequencies (open bars) and all tinnitus frequencies (black bars) obtained up to 102 days after trauma, exemplaryin four T animals. An impairment of PPI is plotted upward, an improvement downward; significant difference of data to pre trauma is depicted byasterisks in each bar (one sample t-tests vs. 0). Connecting lines indicate significant Tukey post-hoc tests. Significance levels: * p,0.05, ** p,0.01, ***p,0.001.doi:10.1371/journal.pone.0044519.g004
Figure 5. ABR and behaviorally determined hearing loss. A Significant one-factorial ANOVA (mean 6 SEM) of the hearing loss (in percentrelative to pre trauma) over the different stimulation frequencies as obtained by ABR measurements of all investigated animals. The yellow areaindicates the trauma frequency. B One-factorial ANOVA of the hearing loss obtained by behavioral threshold paradigm (stimulus set 1). The statisticsindicate only a tendency for frequency specific hearing loss around the trauma frequency. In both methods of HL determination the traumafrequency is affected most.doi:10.1371/journal.pone.0044519.g005
Predisposition for Tinnitus
PLOS ONE | www.plosone.org 6 October 2012 | Volume 7 | Issue 10 | e44519
groups (large standard deviations) an effect on the individual HL
level cannot completely be ruled out.
Neurophysiological Correlates of HL and Tinnitus inPrimary Auditory Cortex Field AI
The behavioral differences in T and NT animals were
paralleled by different plastic changes of neuronal responses in
primary auditory cortex field AI: We recorded pure tone responses
from a total of 627 single and multi-units (490 units in T and 137
units in NT group). Out of these, 331 units were recorded before
(278 in T, 53 in NT group) and 296 units after the acoustic trauma
(212 in T, 84 in NT group) over several recording sessions, usually
2 sessions before and 3 after the trauma.
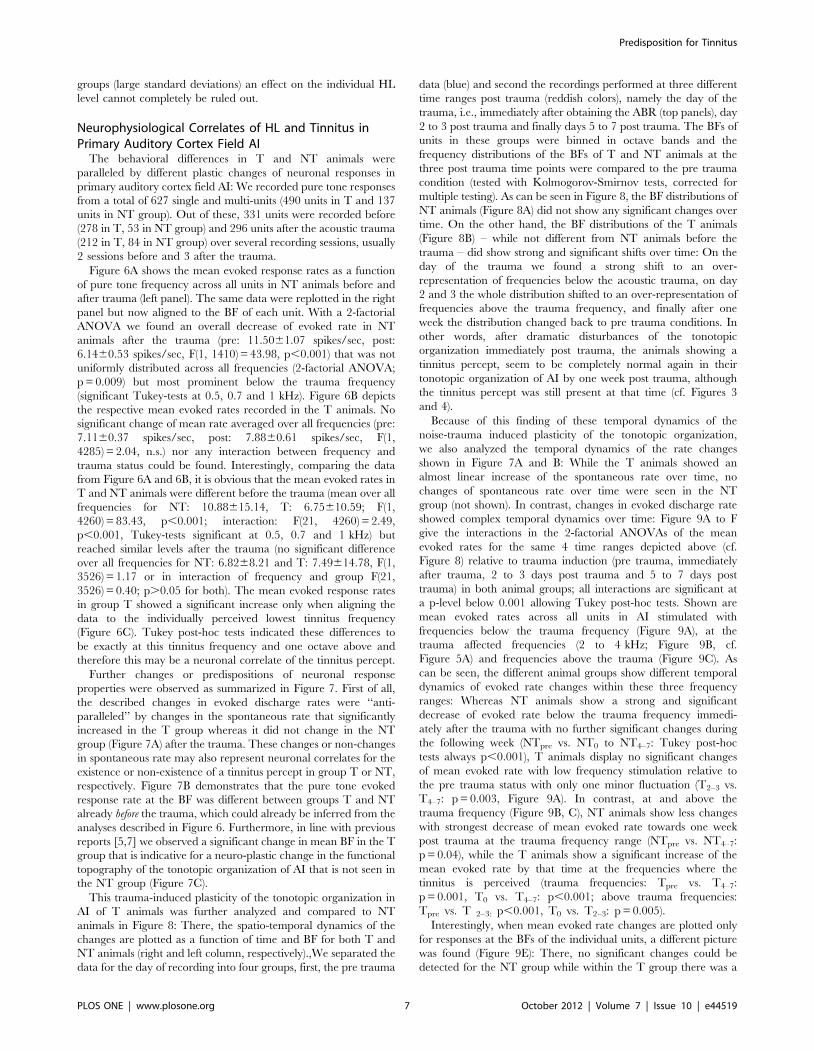
Figure 6A shows the mean evoked response rates as a function
of pure tone frequency across all units in NT animals before and
after trauma (left panel). The same data were replotted in the right
panel but now aligned to the BF of each unit. With a 2-factorial
ANOVA we found an overall decrease of evoked rate in NT
animals after the trauma (pre: 11.5061.07 spikes/sec, post:
6.1460.53 spikes/sec, F(1, 1410) = 43.98, p,0.001) that was not
uniformly distributed across all frequencies (2-factorial ANOVA;
p = 0.009) but most prominent below the trauma frequency
(significant Tukey-tests at 0.5, 0.7 and 1 kHz). Figure 6B depicts
the respective mean evoked rates recorded in the T animals. No
significant change of mean rate averaged over all frequencies (pre:
7.1160.37 spikes/sec, post: 7.8860.61 spikes/sec, F(1,
4285) = 2.04, n.s.) nor any interaction between frequency and
trauma status could be found. Interestingly, comparing the data
from Figure 6A and 6B, it is obvious that the mean evoked rates in
T and NT animals were different before the trauma (mean over all
frequencies for NT: 10.88615.14, T: 6.75610.59; F(1,
4260) = 83.43, p,0.001; interaction: F(21, 4260) = 2.49,
p,0.001, Tukey-tests significant at 0.5, 0.7 and 1 kHz) but
reached similar levels after the trauma (no significant difference
over all frequencies for NT: 6.8268.21 and T: 7.49614.78, F(1,
3526) = 1.17 or in interaction of frequency and group F(21,
3526) = 0.40; p.0.05 for both). The mean evoked response rates
in group T showed a significant increase only when aligning the
data to the individually perceived lowest tinnitus frequency
(Figure 6C). Tukey post-hoc tests indicated these differences to
be exactly at this tinnitus frequency and one octave above and
therefore this may be a neuronal correlate of the tinnitus percept.
Further changes or predispositions of neuronal response
properties were observed as summarized in Figure 7. First of all,
the described changes in evoked discharge rates were ‘‘anti-
paralleled’’ by changes in the spontaneous rate that significantly
increased in the T group whereas it did not change in the NT
group (Figure 7A) after the trauma. These changes or non-changes
in spontaneous rate may also represent neuronal correlates for the
existence or non-existence of a tinnitus percept in group T or NT,
respectively. Figure 7B demonstrates that the pure tone evoked
response rate at the BF was different between groups T and NT
already before the trauma, which could already be inferred from the
analyses described in Figure 6. Furthermore, in line with previous
reports [5,7] we observed a significant change in mean BF in the T
group that is indicative for a neuro-plastic change in the functional
topography of the tonotopic organization of AI that is not seen in
the NT group (Figure 7C).
This trauma-induced plasticity of the tonotopic organization in
AI of T animals was further analyzed and compared to NT
animals in Figure 8: There, the spatio-temporal dynamics of the
changes are plotted as a function of time and BF for both T and
NT animals (right and left column, respectively).,We separated the
data for the day of recording into four groups, first, the pre trauma
data (blue) and second the recordings performed at three different
time ranges post trauma (reddish colors), namely the day of the
trauma, i.e., immediately after obtaining the ABR (top panels), day
2 to 3 post trauma and finally days 5 to 7 post trauma. The BFs of
units in these groups were binned in octave bands and the
frequency distributions of the BFs of T and NT animals at the
three post trauma time points were compared to the pre trauma
condition (tested with Kolmogorov-Smirnov tests, corrected for
multiple testing). As can be seen in Figure 8, the BF distributions of
NT animals (Figure 8A) did not show any significant changes over
time. On the other hand, the BF distributions of the T animals
(Figure 8B) – while not different from NT animals before the
trauma – did show strong and significant shifts over time: On the
day of the trauma we found a strong shift to an over-
representation of frequencies below the acoustic trauma, on day
2 and 3 the whole distribution shifted to an over-representation of
frequencies above the trauma frequency, and finally after one
week the distribution changed back to pre trauma conditions. In
other words, after dramatic disturbances of the tonotopic
organization immediately post trauma, the animals showing a
tinnitus percept, seem to be completely normal again in their
tonotopic organization of AI by one week post trauma, although
the tinnitus percept was still present at that time (cf. Figures 3
and 4).
Because of this finding of these temporal dynamics of the
noise-trauma induced plasticity of the tonotopic organization,
we also analyzed the temporal dynamics of the rate changes
shown in Figure 7A and B: While the T animals showed an
almost linear increase of the spontaneous rate over time, no
changes of spontaneous rate over time were seen in the NT
group (not shown). In contrast, changes in evoked discharge rate
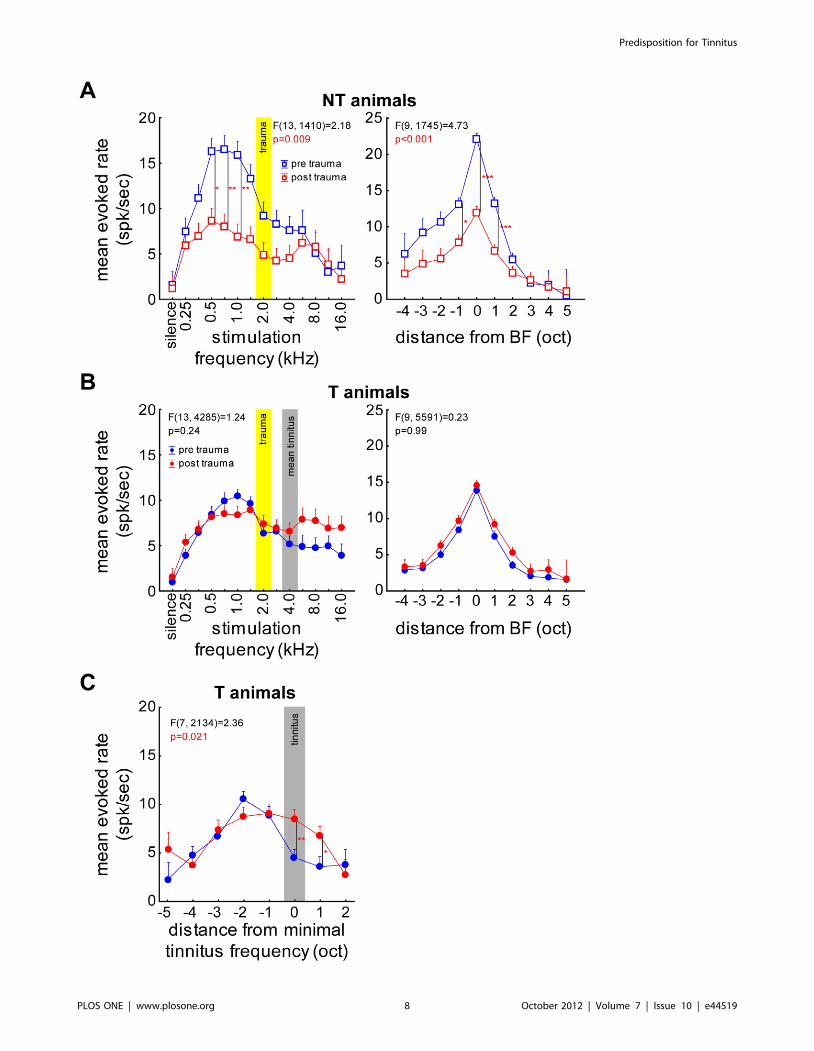
showed complex temporal dynamics over time: Figure 9A to F
give the interactions in the 2-factorial ANOVAs of the mean
evoked rates for the same 4 time ranges depicted above (cf.
Figure 8) relative to trauma induction (pre trauma, immediately
after trauma, 2 to 3 days post trauma and 5 to 7 days post
trauma) in both animal groups; all interactions are significant at
a p-level below 0.001 allowing Tukey post-hoc tests. Shown are
mean evoked rates across all units in AI stimulated with
frequencies below the trauma frequency (Figure 9A), at the
trauma affected frequencies (2 to 4 kHz; Figure 9B, cf.
Figure 5A) and frequencies above the trauma (Figure 9C). As
can be seen, the different animal groups show different temporal
dynamics of evoked rate changes within these three frequency
ranges: Whereas NT animals show a strong and significant
decrease of evoked rate below the trauma frequency immedi-
ately after the trauma with no further significant changes during
the following week (NTpre vs. NT0 to NT4–7: Tukey post-hoc
tests always p,0.001), T animals display no significant changes
of mean evoked rate with low frequency stimulation relative to
the pre trauma status with only one minor fluctuation (T2–3 vs.
T4–7: p = 0.003, Figure 9A). In contrast, at and above the
trauma frequency (Figure 9B, C), NT animals show less changes
with strongest decrease of mean evoked rate towards one week
post trauma at the trauma frequency range (NTpre vs. NT4–7:
p = 0.04), while the T animals show a significant increase of the
mean evoked rate by that time at the frequencies where the
tinnitus is perceived (trauma frequencies: Tpre vs. T4–7:
p = 0.001, T0 vs. T4–7: p,0.001; above trauma frequencies:
Tpre vs. T 2–3: p,0.001, T0 vs. T2–3: p = 0.005).
Interestingly, when mean evoked rate changes are plotted only
for responses at the BFs of the individual units, a different picture
was found (Figure 9E): There, no significant changes could be
detected for the NT group while within the T group there was a
Predisposition for Tinnitus
PLOS ONE | www.plosone.org 7 October 2012 | Volume 7 | Issue 10 | e44519
Predisposition for Tinnitus
PLOS ONE | www.plosone.org 8 October 2012 | Volume 7 | Issue 10 | e44519

strong significant increase of mean BF-evoked rate immediately
after the trauma that returned back to normal on day 2 to 3 post
trauma (T0 vs. Tpre and T2–3: p,0.001, T0 vs. T4–7: p = 0.02). For
stimulation frequencies at least one octave below BF, no significant
changes were seen for T animals while there was a decrease in
response rate for NT animals (NTpre vs. NT0: p = 0.03, NTpre vs.
NT4–7: p = 0.01, Figure 9D), and for frequencies at least one
octave above BF (Figure 9F) there was a significant increase in
mean response rate in T animals, but this change was only seen
after the changes at BF had vanished again, i.e., from day 2–3 on
(Tpre vs. T2–3: p = 0.01, Tpre vs. T4–7: p = 0.002, T0 vs. T2–3:
p = 0.04). For the NT animals, again a decrease in response rate
over time was seen at this frequency range (NTpre vs. NT0:
p = 0.006, NTpre vs. NT4–7: p = 0.001).
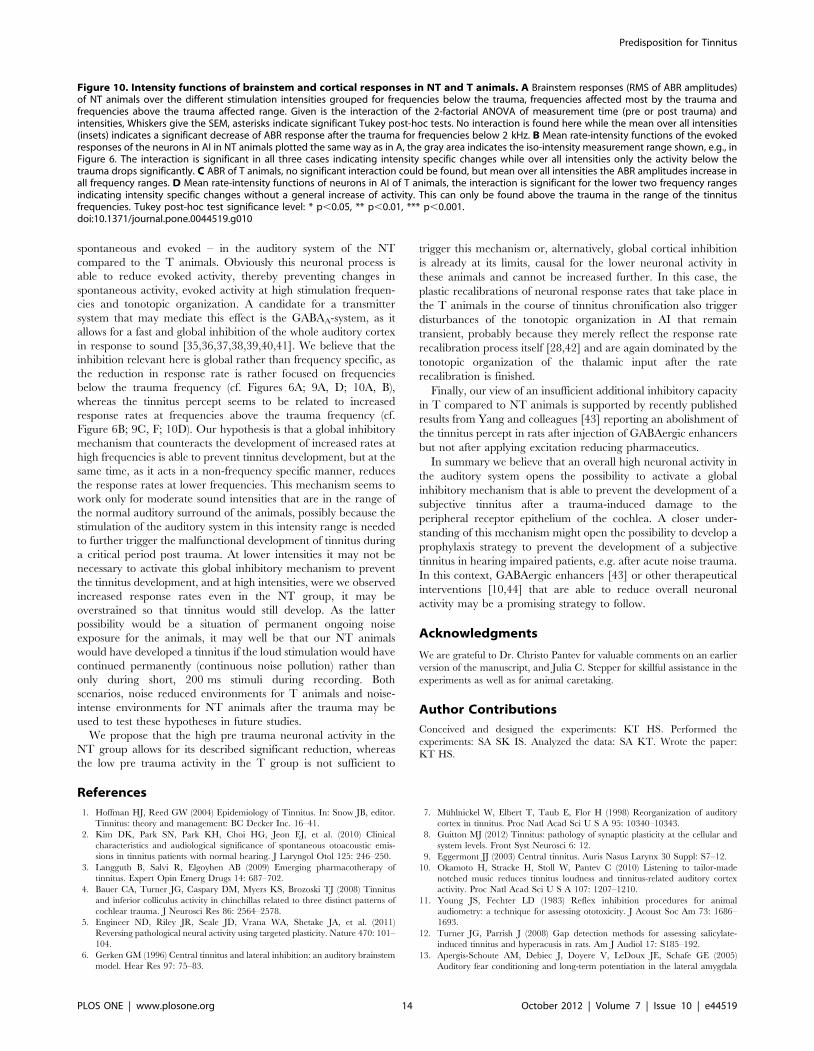
Figure 10 finally depicts mean ABR strength (root-mean-square
(RMS) values of ABR amplitudes; A, C) and evoked rate (rate-
intensity functions; B, D) as a function of sound intensity in T (C,
D) and NT animals (A, B). We compared data measured before
and directly after the trauma by 2-factorial ANOVAs for three
frequency bands, namely below the trauma frequency (left
column), the frequencies most affected by the trauma (2 to
4 kHz; middle column, cf. Figure 5A) and the frequencies above
this affected range (right column).
Interestingly, the significant decrease in mean response rate of
AI neurons of the NT group that was shown in Figure 6A
could only be detected for moderate sound pressure levels (grey
area in Figure 10B) and was only significant for frequencies
below the trauma frequency (Figure 10B, left panel inset). For
high sound pressure levels of 90 dB SPL, we found the inverse
effect in group NT, namely a general increase in mean response
rate after the trauma across all tested frequency ranges
(Figure 10B). In contrast, no such changes were seen in the T
group: There, we observed only minor changes in mean
response rate in the rate-intensity functions for frequencies up to
4 kHz (Figure 10D, left and middle panels), but a strong and
general increase of almost 50% across all intensities for
frequencies above 4 kHz with a parallel shift of the whole
mean rate-intensity function. In general, there was no such shift
but rather a change in the shape of the rate-intensity functions
in the NT animals (from a sigmoidal to an exponential curve
progression; Figure 10B).
Comparing these changes of cortical rate-intensity functions to
the ABR data we found that the observed changes of cortical
response rates were in general paralleled by similar changes in
ABR strength, with the exception that significantly strengthened
responses in the T animals after trauma were seen in all frequency
ranges and not only above 4 kHz (Figure 10C). Therefore it may
be concluded that at least some of the changes we observed in AI
simply reflect changes that occur already at levels of the auditory
pathway downstream of the auditory cortex, although top-down
influences are also conceivable (cf. [21,22]).
Finally, comparing the overall level of mean ABR strength
and evoked discharge rate between T and NT animals
(Fig. 10 A vs. C and B vs. D, respectively), we found generally
smaller ABR amplitudes (F(1, 14888) = 1296.7, p,0.001) and
the lower spike rates in AI (F(1, 32637) = 65.57, p,0.001)
before and after trauma in the T compared to the NT animals.
Figure 6. Neuronal evoked response to iso-intensity pure tone stimulation. Mean response (+SEM) of all recorded neurons of groups NTand T during 70 dB SPL stimulation. A left panel Shown is the interaction of the 2-factorial ANOVA of trauma status (blue: before; red: after) overfrequencies (trauma: yellow area) of the pure tone evoked response rates in group NT. right panel Interaction of the 2-factorial ANOVA of traumastatus and frequencies (octaves) of mean response rates aligned to the BF of each individual unit. NT animals show a strong decrease in evoked ratebelow 2 kHz and around the BF after the trauma. B left panel Same display as in A for group T with the mean minimal tinnitus frequency (grey bar).right panel Same display as in A, data aligned to the BF of each unit. Note that in this group the BF shifts after the trauma towards higherfrequencies (cf. panel C). T animals do not show this reduction of evoked rate that NT animals exhibit. C Interaction of frequency (octaves) and traumastatus of data from group T aligned to individual minimal tinnitus frequency now becomes significant with increased mean evoked rate after thetrauma at the tinnitus frequency and one octave above. T animals show a frequency specific increase of evoked response after the trauma withaligning the recorded data to the behaviorally determined tinnitus frequency. Tukey post-hoc test significance level: * p,0.05, ** p,0.01, ***p,0.001.doi:10.1371/journal.pone.0044519.g006
Figure 7. Trauma induced changes of neuronal response parameters. Interactions of the ANOVAs of the mean values (6 SEM) of neuronalresponse parameters in groups T (filled circles) and NT (open squares) before and after acoustic trauma. A Significant interaction of trauma status andanimal group in the spontaneous rate with an increase in activity after the trauma in T animals only. B Evoked rate at BF is different before but notafter the trauma between both groups. C BF of all recorded units changes only in T animals after the trauma indicating a reorganization of tonotopicmaps. Tukey post-hoc test significance levels: * p,0.05, *** p,0.001.doi:10.1371/journal.pone.0044519.g007
Predisposition for Tinnitus
PLOS ONE | www.plosone.org 9 October 2012 | Volume 7 | Issue 10 | e44519

Discussion
Methodological ConsiderationsIn this report we aimed to understand why different individuals
suffering from similar peripheral auditory impairment often but
not always do develop a tinnitus percept. Therefore it is crucial to
this study to undoubtedly identify those animals that did develop a
tinnitus percept after noise trauma and distinguish them from
those who did not. To achieve this goal we employed a multistep
procedure: First, we quantified the noise trauma induced hearing
Figure 8. Changes in BF frequency distributions over time. A Comparison of the frequency distribution of BF (observations in %) binned inone octave steps of NT animals before the trauma (blue) with the data obtained on 3 different time points post trauma, from top to bottom: day oftrauma, 2 to 3 days after trauma, 5 to 7 days after trauma. Distributions are tested by Kolmogorov-Smirnov tests corrected for multiple comparisons.The distributions do not change over time. B Comparison of the BF distributions of T animals on the same three time points. The distributions showstrong shifts over time. Kolmogorov-Smirnov significance levels: ** p,0.01, *** p,0.001.doi:10.1371/journal.pone.0044519.g008
Predisposition for Tinnitus
PLOS ONE | www.plosone.org 10 October 2012 | Volume 7 | Issue 10 | e44519
Predisposition for Tinnitus
PLOS ONE | www.plosone.org 11 October 2012 | Volume 7 | Issue 10 | e44519

loss using both electrophysiological (ABR) and behavioral
approaches (PPI of ASR) which led to similar estimates of hearing
loss (cf. Figure 5; [16]). Only those animals were included in the
study that showed a hearing impairment of at least 15 dB at the
trauma frequency of 2 kHz to prevent any effect of hidden hearing
loss [23]. Thereby, the paradigm we used to induce this hearing
loss was relatively mild, which in recent studies turned out to be
ideal to induce the development of tinnitus in rodent models
compared to severe acoustic traumata, probably because in the
latter case the hearing loss is less restricted to a certain frequency
range and therefore the effect on decreased lateral inhibition is
spectrally less focused. [24,25]. Second, we used two different
behavioral approaches to detect a tinnitus percept in our animals,
namely the gap-noise modulated PPI paradigm adapted from
Turner and colleagues [12,20,26] and fear-potentiation modulated
PPI paradigms, e.g., inspired from Guitton and colleagues [15].
Although the two methods yield slightly different estimates of
tinnitus frequency (cf. Figure 3), the outcome was highly
comparable with respect to the question if there was a tinnitus
percept at all or not as all animals displayed a tinnitus percept in
both paradigms with at least one overlapping frequency. We
normalized all PPI responses individually for all frequencies tested
to counteract the effects of the different perception thresholds and
of the trauma. We then grouped the animals according to their
behavior into individuals with and without tinnitus and investi-
gated the pure tone responses of neurons within AI. Finally, we
correlated the neurophysiological data (ABR and AI recordings)
with the behavioral data. The fact that we could describe a
number of highly significant differences in the neuronal responses
pre and post trauma between animals classified behaviorally as
having a tinnitus percept (group T) or not (group NT) further
strengthens the results of the behavioral tinnitus detection
procedures employed here (cf. Figures 6 to 10). Therefore, based
on this combination of behavioral and electrophysiological
parameters collected in this report it is very likely that the
individual specimen tested here were correctly grouped into T and
NT animals.
Predisposition for Subjective Tinnitus DevelopmentThe most prominent pre trauma differences in T and NT
animals were the higher sound-evoked activities within the
auditory system (as apparent in both ABR and AI recordings) of
the NT group compared to the T group (cf. Figures 6; 7B; 9 and
10). Obviously this higher neuronal activity allows the auditory
system of animals in the NT group to differently react to noise-
induced peripheral damage compared to the T animals. One
might speculate on the different neuronal mechanisms that lead,
after a noise trauma, to the development or prevention of tinnitus
in T and NT animals, respectively:
In T animals the trauma-induced damage to the receptor
epithelium of the cochlea obviously triggers a number of
neuroplastic changes throughout the auditory system that may
be either transient or permanent (cf. [27,28]). In our model, the
plastic reorganization of the tonotopic organization of the primary
auditory cortex that has already been described by a number of
studies [29,30,31,32,33,34] turned out to be only transient, but
showed complex temporal dynamics: A shift of the BF-represen-
tation to lower frequencies immediately after trauma was followed
by a shift to higher frequencies a few days later and back to normal
after about one week post trauma (cf. Figure 8). Intriguingly, these
changes in tonotopic organization in AI were accompanied by
significantly but also transiently increased response rates at the BF
of the units (Figure 9E). As changes at off-BF frequencies appeared
later and were permanent rather that transient (Figure 9F), this
points to a mechanism of plastic changes that affect the tonotopic
organization and which are active within the receptive field of the
units during a short, transient post trauma period. During this
temporal disturbance of the tonotopic organization in AI obviously
some further plastic changes take place that stay permanent even
after the tonotopic order is back to pre trauma conditions. These
seem to be most prominent at frequencies above BF, i.e. above the
center of the spectral receptive field. In our data, these plastic
changes are represented by a number of increased (spontaneous
and evoked) neuronal response rates that are in part stimulation
frequency specific and correlated to the behaviorally estimated
perceived tinnitus frequencies (cf. Figures 6C; 7A; 9C, F; 10C, D).
We believe that these neurophysiological changes described during
the first week post trauma reflect the transition from an acute to a
chronic state of subjective tinnitus in the T group, as the tinnitus
percept is still present after the plastic reorganizations are finished
(cf. Figure 4). Finally, as the changes of the tonotopic represen-
tation in AI and evoked rates at BF were transient in the T animals
whereas the increases in neuronal discharge rate – spontaneous
and at high, tinnitus-related frequencies – persisted beyond one
week post trauma, we believe that the latter are the neurophys-
iological correlates of the tinnitus percept rather than the former.
Tinnitus PreventionIn NT animals we saw a different picture, as the noise-trauma
induced neuroplastic changes were completely different compared
to the T group: In the NT group, coming from a higher overall
level of sound induced activity in the auditory system, we
measured a significant decrease in evoked response rates both in
AI and ABR recordings (cf. Figures 6A; 7B) but no change in
spontaneous rate (cf. Figure 7A) or tonotopic organization (cf.
Figures 7C; 8A). Interestingly it turned out that this reducing effect
on evoked response rate could only be seen at moderate sound
intensities, while there were no changes for low intensities and
even increased evoked responses for the highest intensity testes
(90 dB SPL; cf. Figure 10A, B). Based on these observations we
propose the following model of tinnitus prevention in NT animals:
We believe that there is an active neuronal process that is able to
prevent the development of a tinnitus percept in the NT group,
whereas it is not in the T group. Based on our data the main
predisposition for this ability to prevent tinnitus development
seems to be the higher overall neuronal activity – both
Figure 9. Changes in mean evoked rate over time. Results of the 2-factorial ANOVAs of mean evoked rates of all recorded units as a function ofrecording time and animal group (green = NT, black = T) separately for different frequency ranges; all interactions are significant with p,0.001,asterisks indicate significant Tukey post-hoc tests, whiskers give the SEM. A Mean evoked rate of all units stimulated with frequencies below thetrauma; only NT animals show a decrease in responses relative to pre trauma. B Mean evoked rate at trauma affected frequencies; increase ofresponse over time only in T animals. C Mean evoked rate above the trauma frequencies; again, only T animals show increase of response rates overtime. D Mean evoked rate of frequencies at least 1 octave below the individual BF of every unit; only NT animals show decrease of activity relative topre trauma. E BF responses of all recorded units; in T animals a significant increase of response strength can be found only at the day of the trauma,immediately post trauma. F Mean evoked rates at least one octave above BF; in T animals an increase of response can be found only from day 2–3 on,while in NT animals the responses decrease already at the day of the trauma. Tukey post-hoc test significance levels: * p,0.05, ** p,0.01, ***p,0.001.doi:10.1371/journal.pone.0044519.g009
Predisposition for Tinnitus
PLOS ONE | www.plosone.org 12 October 2012 | Volume 7 | Issue 10 | e44519

Predisposition for Tinnitus
PLOS ONE | www.plosone.org 13 October 2012 | Volume 7 | Issue 10 | e44519
spontaneous and evoked – in the auditory system of the NT
compared to the T animals. Obviously this neuronal process is
able to reduce evoked activity, thereby preventing changes in
spontaneous activity, evoked activity at high stimulation frequen-
cies and tonotopic organization. A candidate for a transmitter
system that may mediate this effect is the GABAA-system, as it
allows for a fast and global inhibition of the whole auditory cortex
in response to sound [35,36,37,38,39,40,41]. We believe that the
inhibition relevant here is global rather than frequency specific, as
the reduction in response rate is rather focused on frequencies
below the trauma frequency (cf. Figures 6A; 9A, D; 10A, B),
whereas the tinnitus percept seems to be related to increased
response rates at frequencies above the trauma frequency (cf.
Figure 6B; 9C, F; 10D). Our hypothesis is that a global inhibitory
mechanism that counteracts the development of increased rates at
high frequencies is able to prevent tinnitus development, but at the
same time, as it acts in a non-frequency specific manner, reduces
the response rates at lower frequencies. This mechanism seems to
work only for moderate sound intensities that are in the range of
the normal auditory surround of the animals, possibly because the
stimulation of the auditory system in this intensity range is needed
to further trigger the malfunctional development of tinnitus during
a critical period post trauma. At lower intensities it may not be
necessary to activate this global inhibitory mechanism to prevent
the tinnitus development, and at high intensities, were we observed
increased response rates even in the NT group, it may be
overstrained so that tinnitus would still develop. As the latter
possibility would be a situation of permanent ongoing noise
exposure for the animals, it may well be that our NT animals
would have developed a tinnitus if the loud stimulation would have
continued permanently (continuous noise pollution) rather than
only during short, 200 ms stimuli during recording. Both
scenarios, noise reduced environments for T animals and noise-
intense environments for NT animals after the trauma may be
used to test these hypotheses in future studies.
We propose that the high pre trauma neuronal activity in the
NT group allows for its described significant reduction, whereas
the low pre trauma activity in the T group is not sufficient to
trigger this mechanism or, alternatively, global cortical inhibition
is already at its limits, causal for the lower neuronal activity in
these animals and cannot be increased further. In this case, the
plastic recalibrations of neuronal response rates that take place in
the T animals in the course of tinnitus chronification also trigger
disturbances of the tonotopic organization in AI that remain
transient, probably because they merely reflect the response rate
recalibration process itself [28,42] and are again dominated by the
tonotopic organization of the thalamic input after the rate
recalibration is finished.
Finally, our view of an insufficient additional inhibitory capacity
in T compared to NT animals is supported by recently published
results from Yang and colleagues [43] reporting an abolishment of
the tinnitus percept in rats after injection of GABAergic enhancers
but not after applying excitation reducing pharmaceutics.
In summary we believe that an overall high neuronal activity in
the auditory system opens the possibility to activate a global
inhibitory mechanism that is able to prevent the development of a
subjective tinnitus after a trauma-induced damage to the
peripheral receptor epithelium of the cochlea. A closer under-
standing of this mechanism might open the possibility to develop a
prophylaxis strategy to prevent the development of a subjective
tinnitus in hearing impaired patients, e.g. after acute noise trauma.
In this context, GABAergic enhancers [43] or other therapeutical
interventions [10,44] that are able to reduce overall neuronal
activity may be a promising strategy to follow.
Acknowledgments
We are grateful to Dr. Christo Pantev for valuable comments on an earlier
version of the manuscript, and Julia C. Stepper for skillful assistance in the
experiments as well as for animal caretaking.
Author Contributions
Conceived and designed the experiments: KT HS. Performed the
experiments: SA SK IS. Analyzed the data: SA KT. Wrote the paper:
KT HS.
References
1. Hoffman HJ, Reed GW (2004) Epidemiology of Tinnitus. In: Snow JB, editor.
Tinnitus: theory and management: BC Decker Inc. 16–41.
2. Kim DK, Park SN, Park KH, Choi HG, Jeon EJ, et al. (2010) Clinical
characteristics and audiological significance of spontaneous otoacoustic emis-
sions in tinnitus patients with normal hearing. J Laryngol Otol 125: 246–250.
3. Langguth B, Salvi R, Elgoyhen AB (2009) Emerging pharmacotherapy of
tinnitus. Expert Opin Emerg Drugs 14: 687–702.
4. Bauer CA, Turner JG, Caspary DM, Myers KS, Brozoski TJ (2008) Tinnitus
and inferior colliculus activity in chinchillas related to three distinct patterns of
cochlear trauma. J Neurosci Res 86: 2564–2578.
5. Engineer ND, Riley JR, Seale JD, Vrana WA, Shetake JA, et al. (2011)
Reversing pathological neural activity using targeted plasticity. Nature 470: 101–
104.
6. Gerken GM (1996) Central tinnitus and lateral inhibition: an auditory brainstem
model. Hear Res 97: 75–83.
7. Muhlnickel W, Elbert T, Taub E, Flor H (1998) Reorganization of auditory
cortex in tinnitus. Proc Natl Acad Sci U S A 95: 10340–10343.
8. Guitton MJ (2012) Tinnitus: pathology of synaptic plasticity at the cellular and
system levels. Front Syst Neurosci 6: 12.
9. Eggermont JJ (2003) Central tinnitus. Auris Nasus Larynx 30 Suppl: S7–12.
10. Okamoto H, Stracke H, Stoll W, Pantev C (2010) Listening to tailor-made
notched music reduces tinnitus loudness and tinnitus-related auditory cortex
activity. Proc Natl Acad Sci U S A 107: 1207–1210.
11. Young JS, Fechter LD (1983) Reflex inhibition procedures for animal
audiometry: a technique for assessing ototoxicity. J Acoust Soc Am 73: 1686–
1693.
12. Turner JG, Parrish J (2008) Gap detection methods for assessing salicylate-
induced tinnitus and hyperacusis in rats. Am J Audiol 17: S185–192.
13. Apergis-Schoute AM, Debiec J, Doyere V, LeDoux JE, Schafe GE (2005)
Auditory fear conditioning and long-term potentiation in the lateral amygdala
Figure 10. Intensity functions of brainstem and cortical responses in NT and T animals. A Brainstem responses (RMS of ABR amplitudes)of NT animals over the different stimulation intensities grouped for frequencies below the trauma, frequencies affected most by the trauma andfrequencies above the trauma affected range. Given is the interaction of the 2-factorial ANOVA of measurement time (pre or post trauma) andintensities, Whiskers give the SEM, asterisks indicate significant Tukey post-hoc tests. No interaction is found here while the mean over all intensities(insets) indicates a significant decrease of ABR response after the trauma for frequencies below 2 kHz. B Mean rate-intensity functions of the evokedresponses of the neurons in AI in NT animals plotted the same way as in A, the gray area indicates the iso-intensity measurement range shown, e.g., inFigure 6. The interaction is significant in all three cases indicating intensity specific changes while over all intensities only the activity below thetrauma drops significantly. C ABR of T animals, no significant interaction could be found, but mean over all intensities the ABR amplitudes increase inall frequency ranges. D Mean rate-intensity functions of neurons in AI of T animals, the interaction is significant for the lower two frequency rangesindicating intensity specific changes without a general increase of activity. This can only be found above the trauma in the range of the tinnitusfrequencies. Tukey post-hoc test significance level: * p,0.05, ** p,0.01, *** p,0.001.doi:10.1371/journal.pone.0044519.g010
Predisposition for Tinnitus
PLOS ONE | www.plosone.org 14 October 2012 | Volume 7 | Issue 10 | e44519

require ERK/MAP kinase signaling in the auditory thalamus: a role for
presynaptic plasticity in the fear system. J Neurosci 25: 5730–5739.14. Ben Mamou C, Gamache K, Nader K (2006) NMDA receptors are critical for
unleashing consolidated auditory fear memories. Nat Neurosci 9: 1237–1239.
15. Guitton MJ, Pujol R, Puel JL (2005) m-Chlorophenylpiperazine exacerbatesperception of salicylate-induced tinnitus in rats. Eur J Neurosci 22: 2675–2678.
16. Walter M, Tziridis K, Ahlf S, Schulze H (2012) Context Dependent AuditoryThreshold Determined by Brainstem Audiometry and Prepulse Inhibition in
Mongolian Gerbils. Open Journal of Acoustics 2: 34–49.
17. Stuermer IW, Scheich H (2000) Early unilateral auditory deprivation increases2-deoxyglucose uptake in contralateral auditory cortex of juvenile Mongolian
gerbils. Hear Res 146: 185–199.18. Thomas H, Tillein J, Heil P, Scheich H (1993) Functional organization of
auditory cortex in the mongolian gerbil (Meriones unguiculatus). I. Electro-physiological mapping of frequency representation and distinction of fields.
Eur J Neurosci 5: 882–897.
19. Campeau S, Davis M (1992) Fear potentiation of the acoustic startle reflex usingnoises of various spectral frequencies as conditioned stimuli. Animal Learning &
Behavior 20: 177–186.20. Turner JG, Brozoski TJ, Bauer CA, Parrish JL, Myers K, et al. (2006) Gap
detection deficits in rats with tinnitus: a potential novel screening tool. Behav
Neurosci 120: 188–195.21. Bajo VM, Moore DR (2005) Descending projections from the auditory cortex to
the inferior colliculus in the gerbil, Meriones unguiculatus. J Comp Neurol 486:101–116.
22. Budinger E, Heil P, Scheich H (2000) Functional organization of auditory cortexin the Mongolian gerbil (Meriones unguiculatus). IV. Connections with
anatomically characterized subcortical structures. Eur J Neurosci 12: 2452–
2474.23. Schaette R, McAlpine D (2011) Tinnitus with a normal audiogram:
physiological evidence for hidden hearing loss and computational model.J Neurosci 31: 13452–13457.
24. Devarajan K, Gassner D, Durham D, Staecker H (2012) Effect of Noise
Exposure Duration and Intensity on the Development of Tinnitus. ARO. Abs.593.
25. Turner J, Larsen D (2012) Relationship Between Noise Exposure StimulusProperties and Tinnitus in Rats: Results of a 12-Month Longitudinal Study.
ARO. Abs. 594.26. Turner JG (2007) Behavioral measures of tinnitus in laboratory animals. Prog
Brain Res 166: 147–156.
27. Norena AJ, Tomita M, Eggermont JJ (2003) Neural changes in cat auditorycortex after a transient pure-tone trauma. J Neurophysiol 90: 2387–2401.
28. Kotak VC, Fujisawa S, Lee FA, Karthikeyan O, Aoki C, et al. (2005) Hearingloss raises excitability in the auditory cortex. J Neurosci 25: 3908–3918.
29. Dietrich V, Nieschalk M, Stoll W, Rajan R, Pantev C (2001) Cortical
reorganization in patients with high frequency cochlear hearing loss. Hear Res158: 95–101.
30. Eggermont JJ (2006) Cortical tonotopic map reorganization and its implications
for treatment of tinnitus. Acta Otolaryngol Suppl: 9–12.
31. Eggermont JJ, Roberts LE (2004) The neuroscience of tinnitus. Trends Neurosci
27: 676–682.
32. Norena AJ, Eggermont JJ (2003) Changes in spontaneous neural activity
immediately after an acoustic trauma: implications for neural correlates of
tinnitus. Hear Res 183: 137–153.
33. Norena AJ, Moffat G, Blanc JL, Pezard L, Cazals Y (2010) Neural changes in
the auditory cortex of awake guinea pigs after two tinnitus inducers: salicylate
and acoustic trauma. Neuroscience 166: 1194–1209.
34. Weisz N, Muller S, Schlee W, Dohrmann K, Hartmann T, et al. (2007) The
neural code of auditory phantom perception. J Neurosci 27: 1479–1484.
35. Foeller E, Vater M, Kossl M (2001) Laminar analysis of inhibition in the gerbil
primary auditory cortex. J Assoc Res Otolaryngol 2: 279–296.
36. Horikawa J, Hosokawa Y, Kubota M, Nasu M, Taniguchi I (1996) Optical
imaging of spatiotemporal patterns of glutamatergic excitation and GABAergic
inhibition in the guinea-pig auditory cortex in vivo. J Physiol 497 (Pt 3): 629–
638.
37. Middleton JW, Kiritani T, Pedersen C, Turner JG, Shepherd GM, et al. (2011)
Mice with behavioral evidence of tinnitus exhibit dorsal cochlear nucleus
hyperactivity because of decreased GABAergic inhibition. Proc Natl Acad
Sci U S A 108: 7601–7606.
38. Kurt S, Moeller CK, Jeschke M, Schulze H (2008) Differential effects of
iontophoretic application of the GABAA-antagonists bicuculline and gabazine
on tone-evoked local field potentials in primary auditory cortex: interaction with
ketamine anesthesia. Brain Res 1220: 58–69.
39. Browne CJ, Morley JW, Parsons CH (2012) Tracking the Expression of
Excitatory and Inhibitory Neurotransmission-Related Proteins and Neuroplas-
ticity Markers after Noise Induced Hearing Loss. PLoS One 7: 11.
40. Kurt S, Deutscher A, Crook JM, Ohl FW, Budinger E, et al. (2008) Auditory
cortical contrast enhancing by global winner-take-all inhibitory interactions.
PLoS One 3: e1735.
41. Moeller CK, Kurt S, Happel MF, Schulze H (2010) Long-range effects of
GABAergic inhibition in gerbil primary auditory cortex. Eur J Neurosci 31: 49–
59.
42. Pinto DJ, Hartings JA, Brumberg JC, Simons DJ (2003) Cortical damping:
analysis of thalamocortical response transformations in rodent barrel cortex.
Cereb Cortex 13: 33–44.
43. Yang S, Weiner BD, Zhang LS, Cho S, Bao S (2011) Homeostatic plasticity
drives tinnitus perception in an animal model. Proc Natl Acad Sci U S A 108:
14974–14979.
44. Flor H, Hoffmann D, Struve M, Diesch E (2004) Auditory discrimination
training for the treatment of tinnitus. Appl Psychophysiol Biofeedback 29: 113–
120.
Predisposition for Tinnitus
PLOS ONE | www.plosone.org 15 October 2012 | Volume 7 | Issue 10 | e44519
![Home [] · pela transformação do acufeno — fenómeno sensorial, em acufeno — fenómeno afectivo. Através dos estudos ... Subjective idiopathic tinnitus is a very annoying and](https://img.dokumen.tips/doc/110x75/5fff19fa99100213ad78557a/home-pela-transformao-do-acufeno-a-fenmeno-sensorial-em-acufeno-a.jpg)