Embed Size (px)
DESCRIPTION
Komba
Citation preview

International Journal of Education ISSN 1948-5476
2012, Vol. 4, No. 4
www.macrothink.org/ije 247
Investigation of the Predictive Validity of
Communication Skills Examination on University
Students’ Overall Academic Performance in Tanzania
Sotco Claudius Komba1,* & Eugenia Joseph Kafanabo2
1Department of Social Sciences, Sokoine University of Agriculture, Morogoro, Tanzania
2Department of Educational Psychology and Curriculum Studies, University of Dar es Salaam, Dar es Salaam, Tanzania
*Corresponding author: Department of Social Sciences, Sokoine University of Agriculture, P. O. Box 3038 Chuo Kikuu, Morogoro, Tanzania. E-mail: [email protected].
Received: October 24, 2012 Accepted: December 4, 2012 Published: December 19, 2012
doi:10.5296/ije.v4i4.2557 URL: http://dx.doi.org/10.5296/ije.v4i4.2557
Abstract
This article is about the Predictive Validity of the University Communication Skills (CS) examination on the Students’ Overall Academic Performance. It is based on the study which was conducted at the Sokoine University of Agriculture (SUA). The objectives of the study were: firstly, to determine the extent to which the CS examination predicts the overall performance expressed in terms of the University GPAs; secondly, to identify whether the predictive validity varies by sex, type of school, and type of degree programme; and thirdly, to examine whether the CS examination is a better predictor for the university GPAs than students’ entry qualifications. The respondents were 358 finalists from six programmes selected randomly out of the 20 degree programmes at SUA. The findings indicated that the University CS examination positively predicted the overall students’ performance expressed in terms of GPAs (r=0.416, p< 0.01). Furthermore, the predictive validity of the CS examination scores on the University GPAs varied by sex and was higher for males (r=0.483, p<0.01) than females (r=0.272, p<0.01). Moreover, the CS examination scores predicted the University GPAs better than the students’ university entry points. However, the type of school attended at both CSEE and ACSEE levels and type of degree programme enrolled at SUA had insignificant influence on the predictive validity of the CS examination.
Keywords: predictive validity; communication skills examination; academic performance; Tanzania

International Journal of Education ISSN 1948-5476
2012, Vol. 4, No. 4
www.macrothink.org/ije 248
1. Introduction
Literature on language policy indicates that after independence in 1961, Tanzania adopted a form of bilingual education in which Kiswahili would be used as the medium of instruction in the school career alongside English (Tibategeza, 2009; Neke, 2003). In 1967, Kiswahili was declared a national language and a language of instruction in primary schools while English was declared a co-official language and it was supposed to be taught as a compulsory subject in all primary schools (Mlama and Materu, 1978). In addition, English was also declared a language of instruction at post primary school levels, including the university.
Studies indicate that there is a link between academic achievements and proficiency in the language of instruction. For example, the poor performance of secondary school students in their national examinations in Tanzania has always been attributed to their low proficiency in the language of instruction, which is English (Malekela, 2003; Rubagumya, 1990; Mvungi, 1980). This implies that, one of the major factors which determine students’ success in academic is proficiency in the language of instruction, which facilitates communication between teachers and students. In other words, if students do not have adequate communication skills, effective learning cannot take place (Fakeye and Ogunsiji, 2009; Neke, 2003). This view is supported by Malekela (2003), who argued that if the learner is handicapped in the language of instruction, learning may not take place since both the instructor and learners will not be communicating.
If we look at the history of Tanzania, the country is a multilingual society with about 120 different ethnic groups speaking different languages. Malekela (2003) observed that very few Tanzanians (less than 10 percent of the population) who have been through formal schooling have learned English. The majority of the students start learning English for the first time as a ‘subject’ at primary school level, then as a subject as well as language of instruction at secondary school level and thereafter. A few would have had an exposure to English language as a medium of instruction from pre-primary school level and thereafter and yet very few would have had the exposure to English language from home and thereafter throughout schooling time. Therefore, it is not surprising to find that most of the students enrolled in Tanzanian universities experience communication problems as the language of instruction is solely English (Mohamed, 2006; Malekela, 2003; Ishumi, 1994).
Despite the fact that students who join the Tanzanian universities have studied English from primary to O-level, and English being the medium of instruction at the O- and A-levels, literature indicates that most of them are not proficient enough in the language when they join the university (Mohamed, 2006; Malekela, 2003; Ishumi, 1994). Since the medium of instruction at university level is English, all Tanzanian universities offer a course in Communication Skills (CS) to all first year undergraduate students as a remedy to the observed communication problems (Komba, 2008; Mohamed, 2006). The implementation of Communication Skills courses at universities and colleges has been based on the assumption that a threshold level of English proficiency is necessary for students to succeed in their academic work. For example, in writing skills, students ought to be able to relate subject with verb (i.e. subject-verb agreement), to write complete and meaningful sentences, to use

International Journal of Education ISSN 1948-5476
2012, Vol. 4, No. 4
www.macrothink.org/ije 249
details/examples to support or illustrate ideas, and to write proper paragraphs. In addition, they have also to be able to use appropriate tenses (i.e. simple present, simple past etc.), and punctuation marks such as full stops, commas, question marks, hyphens, colons, and semicolons. Unfortunately, majority of the students joining Tanzanian universities are unable to display most of these basic abilities despite the fact that they were supposed to have acquired while in secondary schools (Wilson, 2011; Puja, 2003). Therefore, the teaching of Communication Skills course at the university is seen as a remedy to such communication problems facing students (Cripper and Davies, 1988; Cripper and Dodd, 1984).
Looking at the global perspective, the teaching and learning of CS course can be traced back as far as the mid 1970s in the vocational centres in England (Carroll, 1980). It was the poor academic performance of students especially those from overseas (Africa, Arabia, Asia and other non-English speaking countries) which necessitated the introduction of the course. By then, it was believed that such poor performance was a result of students’ limited knowledge of English. Therefore, as Carroll (1980) noted, the course was meant to be a remedial strategy to help non-English speaking students improve their academic performance by improving their level of English language competency.
In the context of Tanzanian universities, Communication Skills course was introduced for the first time at the University of Dar es Salaam in 1978 (Mlacha and Rea, 1985). The course was purposely introduced in order to improve students’ ability to learn efficiently and effectively through the medium of English (Mlacha and Rea, 1985; UDSM, 1983). A similar reason is stipulated in the course outlines for Communication Skills course of the Muslim University of Morogoro, Mzumbe University, University of Dodoma, St. Augustine University of Tanzania, and Tumaini University, to mention but a few.
At SUA, CS course was introduced in 1987 (SUA, 1988). The reason for introducing CS course at SUA is not different from elsewhere in the Tanzanian universities. All first year undergraduate students who get admitted at SUA have to take a CS course (SUA 2009/2010 Prospectus) which contributes 2 credits of the 12 minimum credits each undergraduate student has to accumulate in a semester (SUA Prospectus 2009/2010).
Students’ examinations records at SUA indicate that the students’ performance in the CS examinations is generally good. Since majority of students have been performing fairly well in the CS course, in which various skills about listening to lectures, note taking, academic writing, and seminar presentations and discussions are taught, such students would be expected to perform better in other subjects which contribute to their university Grade Point Averages (GPAs). However, when the students’ examination results for other courses were retrieved, they were grouped into three categories. These included students with very good performance, those with moderate performance, and those who failed in their courses.
However, it was unknown whether all students who performed very well in the CS course also did significantly better in other courses and/or those who performed poorly in the CS course also did not do well in other courses. In other words, the relationship between the CS examination performance and performance in other courses was not known. In view of this, the

International Journal of Education ISSN 1948-5476
2012, Vol. 4, No. 4
www.macrothink.org/ije 250
researcher was interested to find out the extent to which CS examination could predict performance in other subjects, hence a need to undertake this predictive validity study.
1.1 Objectives of the Study
In view of the above, this study sought to achieve three specific objectives which were:
1) To determine the extent to which the university CS examination predicts performance in other subjects which contribute to the University GPAs.
2) To identify whether the predictive validity varies by (i) sex (ii) type of school and (iii) type of degree programme.
3) To examine whether the university CS examination is a better predictor for the University GPAs than students’ entry qualifications.
1.2 Research Hypotheses
The study was also guided by three research hypotheses which were:
1) There is no significant relationship between the students’ university CS examination scores and their corresponding University GPAs.
2) The predictive validity of the University CS examination on students’ university GPAs does not vary by sex, type of school attended at CSEE and ACSEE, and degree programme enrolled at SUA.
3) The university CS examination does not predict the University GPAs better than students’ entry qualifications.
2. Literature Review
2.1 The Role of Prediction Studies
Prediction studies play a significant role in educational research. Gall et al (1996) points out that many prediction studies are done by educational researchers to identify variables that forecast academic and vocational success. Usually, there are types of information provided by prediction studies: the extent to which a criterion behaviour pattern can be predicted; data for developing a theory about the determinants of the criterion behaviour pattern; and the evidence about the predictive validity of the test or tests that were correlated with the criterion behaviour pattern (Gall et al, 1996). The type of information the researcher is most interested in obtaining, determines the type of prediction study. A researcher may carry out a prediction study for either of the following purposes; to determine good predictors which may be applied to practical problems, such as students’ selection and /or any other educational decision; to determine the theoretical significance of the findings; and to test development.
Many prediction studies have aimed at short term prediction of students’ performance in a specific course of study, and others have aimed at long term prediction of general success, hence making a major contribution to educational practice (Gall et al, 1996). The findings of

International Journal of Education ISSN 1948-5476
2012, Vol. 4, No. 4
www.macrothink.org/ije 251
many prediction studies have aided school personnel to identify the students most likely to succeed in the particular academic environment or course of study.
It worth noting that prediction studies are similar to relationship studies (Gall et al, 1996). This is because both prediction and relationship studies involve computing correlations between a complex behaviour pattern (the criterion) and variables which are thought to be related to the criterion. The distinction between the two types of studies is on the measurement point in time of the variables involved. While in prediction studies, the predictor variables are measured sometime before the criterion behaviour occurs, in relationship studies the criterion behaviour and other variables are often measured at the same point in time. Furthermore, prediction studies are more concerned with maximizing the correlation between the predictor and variables and the criterion, whereas relationship studies seek to describe the extent of relationship i.e. high, moderate, or low (Gall et al, 1996).
2.2 Predictive Validity Studies in Tanzania and Elsewhere
Many predictive validity studies are done by educational researchers to identify variables that can be used to predict academic and vocational success. Literature indicates that some predictive validity studies have aimed at short term prediction of students’ performance in a specific course of study, and others have aimed at long term prediction of general success, hence making a major contribution to educational practice (Gall et al, (1996). According to Callif (1986), predictive validity is referred to as the extent to which a score on a scale or test predicts scores on some criterion measure. It is quantified by the correlation coefficient between two sets of paired measurements obtained for the same target population to indicate the degree of linear relationship between two variables: the predictor variable and criterion variable. For example, a researcher may be interested to find out whether or not the Primary School Leaving Examination (PSLE) scores can predict the Form Two Secondary Education Examination (FTSEE) performance. For this case, the predictor variable will be the PSLE scores which will have to be paired with their corresponding criterion variable, the FTSEE scores to determine the extent of relationship.
There are some predictive validity studies that have been done in the context of Tanzania (Kasuga, 2009; Lema, 2004; Sambayukha 2001; Ndabi, 1987). For example, Kasuga (2009) carried out a study to investigate whether the Form Two Secondary Education Examinations (FTSEE) could be used as predictors of performance in the Certificate of Secondary Education Examinations (CSEE). The findings revealed that the Form Two Secondary Education Examinations were not better predictors of performance in the Certificate of Secondary Education Examinations.
Furthermore, Lema (2004) did a study which sought to find out whether the Advanced Certificate of Secondary Education Examinations had better selection validities for university entry than the matriculation examination. In this study, the researcher found out that the Advanced Certificate of Secondary Education Examinations had better selection validities for university entry for science students than the matriculation examination and matriculation examination was a better predictor for arts students than science students.

International Journal of Education ISSN 1948-5476
2012, Vol. 4, No. 4
www.macrothink.org/ije 252
In addition, Sambayukha (2001) conducted another predictive validity study in which the general objective was to find out whether the Certificate of Secondary Education Examinations for science subjects could be used to predict students’ performance in Technical Colleges. The findings revealed that the Certificate of Secondary Education Examinations for science subjects were strong predictors of students’ performance in Technical Colleges.
Moreover, Ndabi (1987) carried out another study which sought to investigate whether the Certificate of Secondary Education Examinations were better predictors on their Advanced Certificate of Secondary Education Examinations. It was concluded that the Certificate of Secondary Education Examinations were better predictors on their Advanced Certificate of Secondary Education Examinations.
From these studies, it shows that certain examinations may have a strong predictive value on other examinations (Sambayukha, 2001). It also implies that some examinations may have good predictive values to some groups of individuals and not others (Lema, 2004). However, it is also evident from these studies that there are other examinations which may have a weak predictive value (Kasuga, 2009).
Many scholars have also conducted predictive validity studies on educational issues outside Tanzania (Omirin and Ale, 2008; Emery, 2007; Obioma and Salau, 2007; Doney, 2006; Jenkins, 2004; Njabili, 1997). For instance, Omirin and Ale, (2008) conducted a study in Nigeria to find out whether English and Mathematics mock examinations can be used to predict success in academic performance of students in the final West African School Certificate Examinations (WASCE). It was concluded that mock English and Mathematics examinations helped significantly in predicting the success in academic performance of students in WASCE.
Also, Emery (2007) did a study to find out if Cambridge University Students’ Continuous Assessment could be used to predict students’ final scores. A significant correlation (r= 0.42, p<0.01) was found out, hence it was concluded that students’ continuous assessments predicted university final achievements.
In addition, Obioma and Salau (2007) conducted a predictive validity study of public examinations in Nigeria. In this study, one of the objectives was to determine the extent to which scores in examinations conducted by the West African Examination Council (WASSCE), National Examinations Council (SSCE) and National Business and Technical Examination Board (NBCE/NTCE) in conjunction with the Joint Admissions and Matriculation Board (UME) predicted future academic achievement of students in university degree examinations. The study revealed that there was a low but positive relationship (0.118 ≤ r ≤ 0.298) between each of the predictor variables under study.
Furthermore, Doney (2006) conducted a study on the International English Language Testing System (IELTS) as a predictor of future university academic performance. In this study, the researcher concluded that the IELTS test had a good predictive value.
Another predictive validity study was done by Jenkins (2004) in the Republic of South Africa. In this study, the researcher’s objective was to investigate the validity of the General

International Journal of Education ISSN 1948-5476
2012, Vol. 4, No. 4
www.macrothink.org/ije 253
Scholastic Aptitude Test (GSAT) as a tool for predicting future academic success. It was concluded that the GSAT had some merit in predicting academic success, although with differing rates of usefulness across different demographic groupings.
These studies justify that predictive validity studies have widely been used in education as one of the ways of explaining the nature of relationships among different variables which determine students’ academic achievements. However, it is worth noting that none of these studies had investigated on the Predictive Validity of Communication Skills Examination on Students’ Overall Academic Performance in the context of Tanzanian universities.
3. Research Design
This study adopted a quantitative approach in which a cross-sectional research design was used. The design allows data to be collected once at a single point in time and to be used in a descriptive analysis and for the determination of relationships between variables (Gall et al, 1996). This design was chosen because the researcher sought to have an understanding of the relationship between different variables through correlation analysis. The study was carried out at the Sokoine University of Agriculture (SUA) which is located in Morogoro Region of the Tanzania mainland. The target population was all finalist degree programme students enrolled in 20 degree programmes at SUA in the 2010/2011 academic year. A simple random sampling technique was used to select six degree programmes which were equivalent to one-third of the target population of the 20 degree programmes at the university. A total of 358 students were involved in the study. The required sets of data included the communication skills examination grades, students’ University GPAs, students’ University entry qualifications, type of school attended at CSEE and ACSEE levels, students’ sex, and type of degree programme enrolled at the university. The data were mainly secondary which were collected through documentary analysis. The main documents which were analysed included booklets containing students’ admission lists, and printed students’ examinations records.
The collected data were analyzed using computer software, Statistical Package for Software System (SPSS), Version 18 using the Pearson’s Product-Moment Correlation Coefficient (r) technique. The Pearson’s Product-Moment Correlation Coefficient is said to be the most stable technique of all other bivariate correlation techniques and usually yields smallest standard error (Gall, Borg, and Gall, 1996). The University CS Examination grades were paired against the corresponding university GPAs and correlated using the Pearson’s Product Moment Correlation Coefficient to determine the relationship between the selected variables. Firstly, the correlation was done for the whole sample to obtain the value of r for all respondents. Secondly, the correlation was done according to sex, type of degree programmes to which the respondents were enrolled, and type of school the respondents attended at CSEE and ACSEE levels. The researcher was also interested to determine the best predictor for university GPAs between students’ CS examination grades and students’ entry qualifications in terms of entry points at ACSEE level. In this regard, each of the two variables was correlated with the university GPAs to determine the best predictor.

International Journal of Education ISSN 1948-5476
2012, Vol. 4, No. 4
www.macrothink.org/ije 254
The hypotheses of the study were tested using Chi-square test, Z-test, and T-test for independent samples and in the overall interpretation, the significance of the relationships was tested at p< 0.05 level using a two tailed test.
4. Results
4.1 Students’ Performance in the Communication Skills Examination and the Overall Academic Performance in Grade Point Averages
The first objective for this study sought to determine the extent to which CS examination performance predicted performance in other subjects which contributed to the university GPAs. In order to achieve this, data were collected from 358 respondents who were from six different degree programmes. Frequencies and percentages of students’ performance in the CS examination and the overall academic performance were computed and the results were as presented in Table 1.
Table 1: Communication Skills Examination Performance and Overall Academic Performance
CS Examination Performance Overall Academic Performance
Grade
Range
Frequency Percent
GPA Range
Frequenc
y
Percent
A (70-100) 34 9.5 4.4-5.0 (First) 3 0.9
B+(65-69) 82 22.9 3.5-4.3 (Upper) 171 47.5
B (60-64) 106 29.6 2.7-3.4 (Lower) 147 41.2
C (50-59) 114 31.8 2.0-2.6 (Pass) 37 10.4
D (40-49) 22 6.2 0-1.9 (Fail) 0 0
Total 358 100.0 Total 358 100
Table 1 indicates that students’ performance in the CS examination was generally good as 93.8% of all respondents had scored grade C and above in the examination. However, 6.2% of all respondents had failed the CS examination. With regard to the overall academic performance, all students (100%) had passed their courses which contributed to the university GPAs in which 89.6% of all respondents had GPAs which ranged from 2.7 (Lower Second Class) to 5.0 (First Class). These results show that (93.8%) of the respondents who had passed the CS examination did well in other courses which count for the university GPAs because 89.6% of all respondents had GPAs of 2.7 and above. An interesting observation was that while 6.2% of all respondents had failed the CS examination, there were no respondents who had GPAs ranging from 0 to 1.9 which would be classified as Fail. It means that some students who had failed the CS examination passed other courses which added up to their university GPAs to give them an overall pass. Furthermore, the analysis of data was made by correlating CS examination grades with their corresponding university GPAs. This was done by using the Pearson’s Product Moment

International Journal of Education ISSN 1948-5476
2012, Vol. 4, No. 4
www.macrothink.org/ije 255
Correlation Coefficient to determine the extent of relationship between the CS examination grades and GPAs. The results were as shown in Table 2.
Table 2: The Pearson’s Product Moment Correlation Coefficient (r) for CS Grades and GPAs
CS Grades GPAs
CS Grades Pearson Correlation 1 0.416**
Sig. (2-tailed) 0.000
N 358 358
GPAs Pearson Correlation 0.416** 1
Sig. (2-tailed) 0.000
N 358 358
**. Correlation is significant at the 0.01 level (2-tailed).
Table 2 shows the results for the Pearson’s Product Moment Correlation Coefficient (r) for the paired CS examination grades against their GPAs. The results indicate that there was a positive significant relationship between CS examination grades and GPAs as the correlation coefficient (r) was found to be r=0.416, p< 0.01 in a two-tailed test.
It was hypothesized that “there would be no significant relationship between students’ CS grades and their corresponding GPAs”. At the significance level (alpha = 0.05), degree of freedom (df = 356), and two-tailed test, it was possible to compare the absolute correlation coefficient (r) value with the critical value. As it can be seen from Table 2 above, the observed correlation coefficient (r) value was r= 0.416. The critical value of the correlation coefficient (r) was r=0.113 which is less than the observed value r= 0.416. Since the observed value of the correlation coefficient (r) was greater than the critical value, the researcher rejected the null hypothesis and accepted the alternative hypothesis that there was a significant relationship between the students’ CS examination grades and their corresponding university GPAs given the specified parameters.
4.2 The Predictive Validity of Communication Skills Examination According to Sex, Type of School, and Type of Degree Programme
In this study, sex, type of school attended at CSEE and ACSEE, and type of degree programme enrolled at SUA were considered as intervening variables which would influence the predictive validity of the CS examination on the university GPAs.
4.2.1 The Predictive Validity of Communication Skills Examination According to Sex
As part of the second objective for this study, the researcher sought to investigate whether or not sex could influence the predictive validity of the CS examination on university GPAs. Therefore, the performance of both males and females in the CS examination and university GPAs was investigated. The number of male respondents who participated in this study was 251 and that of females was 107. The CS examination grades were correlated with their corresponding university GPAs on the basis of sex using the Pearson’s Product Moment

International Journal of Education ISSN 1948-5476
2012, Vol. 4, No. 4
www.macrothink.org/ije 256
Correlation Coefficient (r) to determine the extent to which CSE grades predicted GPAs. The results for both males and females were as shown in Table 3.
Table 3: The Pearson’s Product Moment Correlation Coefficient (r) for CS Grades and University GPAs According to Sex
Males
CS
Grades
GPAs
CS Grades Pearson
Correlation
1 0.483**
Sig. (2-tailed) 0.000
N 251 251
GPAs Pearson
Correlation
0.483** 1
Sig. (2-tailed) 0.000
N 251 251
**. Correlation is significant at the 0.01 level (2-tailed).
Females
CS Grades GPAs
CS Grades Pearson
Correlation
1 0.272**
Sig. (2-tailed) 0.005
N 107 107
GPAs Pearson
Correlation
0.272** 1
Sig. (2-tailed) 0.005
N 107 107
**. Correlation is significant at the 0.01 level (2-tailed).
As it can be seen from Table 3, a positive relationship was found between the CS examination grades and university GPAs regardless of sex. The correlation coefficient (r) for males was found to be r=0.483 while for females was r=0.272. Both values were significant at 0.01 level in a two-tailed test. It was hypothesized that there would be no significant relationship between the students’ CS examination grades and their corresponding GPAs for both males and females. Since the observed values of the correlation coefficient (r) for both males and females (i.e. r=0.483 and r=0.272 respectively) were greater than their corresponding critical value (r=0.195), the null hypothesis was rejected. Instead, the alternative hypothesis was accepted that there was a significant relationship between students’ CS examination grades and their corresponding university GPAs regardless of sex.
The correlation coefficients (r) for both males and females were compared by using Z-test to find out whether or not the difference between them was statistically significant. As indicated above, the correlation coefficient for males was r=0.483 and N= 251, and for females the correlation coefficient was r=0.272 and N=107. The resulting Z-statistic was 2.1217 and the associated p-value was 0.0339. Since the p-value was less than alpha 0.05, it was concluded

International Journal of Education ISSN 1948-5476
2012, Vol. 4, No. 4
www.macrothink.org/ije 257
that the difference between males and females in the relationship between CSE grades and university GPAs was statistically significant. Therefore, on the basis of these findings, it was concluded that the predictive validity of the CS examination grades on university GPAs varied with sex as it was higher for males than females.
4.2.2 The Predictive Validity of the Communication Skills Examination According to Type of School Attended
As pointed out earlier, students who join SUA do not have a homogeneous background in terms of secondary schools attended at the Certificate of Secondary Education Examination (CSEE) and Advanced Certificate of Secondary Education Examination levels (ACSEE). This is due to the fact that they attended either government or private secondary schools. In the course of data collection, the schools were categorized as government and private secondary schools. The government schools are those which are owned by the government while the private schools are owned by private firms, organizations, or individuals. Firstly, the analysis was done for students who attended either private or government schools at CSEE level and secondly, for students who attended in both categories of schools at ACSEE level.
With regard to the type of school attended by students at CSEE level, the CS examination grades were correlated with their corresponding university GPAs and the results were as shown in Table 4.
Table 4: The Pearson’s Product Moment Correlation Coefficient (r) for CS Grades and University GPAs According to Type of School at CSEE Level
Government
CS Grades GPAs
CS Grades Pearson
Correlation
1 0.399**
Sig. (2-tailed) 0.000
N 287 287
GPAs Pearson
Correlation
0.399** 1
Sig. (2-tailed) 0.000
N 287 287
**. Correlation is significant at the 0.01 level (2-tailed).
Private
CS Grades GPAs
CS Grades Pearson
Correlation
1 0.494**
Sig. (2-tailed) 0.000
N 71 71
GPAs Pearson
Correlation
.494** 1
Sig. (2-tailed) .000
N 71 71
**. Correlation is significant at the 0.01 level (2-tailed).

International Journal of Education ISSN 1948-5476
2012, Vol. 4, No. 4
www.macrothink.org/ije 258
The results in Table 4 indicate that the correlation coefficient (r) between the CS examination grades and university GPAs for students who attended government secondary schools at CSEE level was r= 0.399, p<0.01. This was to some extent lower than that for private students whose correlation coefficient was r= 0.494, p<0.01.
However, the correlation coefficients (r=0. 0.399, p<0.01 for government students, and r=0. 0.494, p<0.01 for private school students at CSEE level) were further compared to determine whether or not the difference between them was statistically significant. In this light, a Z-test was used and the resulting Z-statistic was -0.8805 which was significant at p = 0.3786 level. Since the p-value 0.3786 was greater than alpha 0.05, it was concluded that the difference in correlation coefficients (r) between the CS examination grades and university GPAs for government and private students at CSEE level was statistically insignificant. On the basis of these findings, it was concluded that the predictive validity of the CS examination on University GPAs did not significantly differ with regard to the type of school attended at CSEE level.
The correlation between the CS examination grades and University GPAs for both private and government students at ACSEE level were as shown in Table 5.
Table 5: The Pearson’s Product Moment Correlation Coefficient (r) for CS Grades and University GPAs According to Type of School at ACSEE Level
Government
CS Grades GPAs
CS Grades Pearson
Correlation
1 0.421**
Sig. (2-tailed) 0.000
N 294 294
GPAs Pearson
Correlation
0.421** 1
Sig. (2-tailed) 0.000
N 294 294
**. Correlation is significant at the 0.01 level (2-tailed).
Private
CS Grades GPAs
CS Grades Pearson
Correlation
1 0.409**
Sig. (2-tailed) 0.001
N 64 64
GPAs Pearson
Correlation
.409** 1
Sig. (2-tailed) .001
N 64 64
**. Correlation is significant at the 0.01 level (2-tailed).
As seen from Table 5, the correlation coefficient (r) between the CS examination grades
International Journal of Education ISSN 1948-5476
2012, Vol. 4, No. 4
www.macrothink.org/ije 259
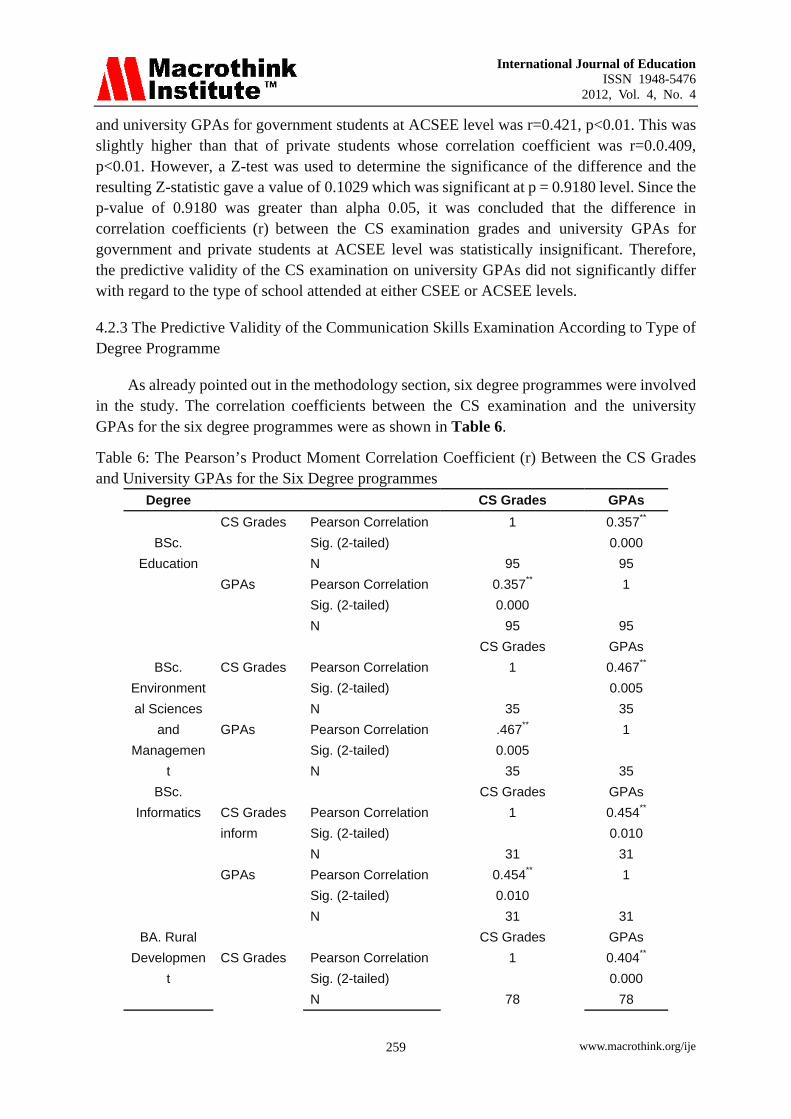
and university GPAs for government students at ACSEE level was r=0.421, p<0.01. This was slightly higher than that of private students whose correlation coefficient was r=0.0.409, p<0.01. However, a Z-test was used to determine the significance of the difference and the resulting Z-statistic gave a value of 0.1029 which was significant at p = 0.9180 level. Since the p-value of 0.9180 was greater than alpha 0.05, it was concluded that the difference in correlation coefficients (r) between the CS examination grades and university GPAs for government and private students at ACSEE level was statistically insignificant. Therefore, the predictive validity of the CS examination on university GPAs did not significantly differ with regard to the type of school attended at either CSEE or ACSEE levels.
4.2.3 The Predictive Validity of the Communication Skills Examination According to Type of Degree Programme
As already pointed out in the methodology section, six degree programmes were involved in the study. The correlation coefficients between the CS examination and the university GPAs for the six degree programmes were as shown in Table 6.
Table 6: The Pearson’s Product Moment Correlation Coefficient (r) Between the CS Grades and University GPAs for the Six Degree programmes
Degree CS Grades GPAs
BSc.
Education
CS Grades Pearson Correlation 1 0.357**
Sig. (2-tailed) 0.000
N 95 95
GPAs Pearson Correlation 0.357** 1
Sig. (2-tailed) 0.000
N 95 95
BSc.
Environment
al Sciences
and
Managemen
t
CS Grades GPAs
CS Grades Pearson Correlation 1 0.467**
Sig. (2-tailed) 0.005
N 35 35
GPAs Pearson Correlation .467** 1
Sig. (2-tailed) 0.005
N 35 35
BSc.
Informatics
CS Grades GPAs
CS Grades
inform
Pearson Correlation 1 0.454**
Sig. (2-tailed) 0.010
N 31 31
GPAs Pearson Correlation 0.454** 1
Sig. (2-tailed) 0.010
N 31 31
BA. Rural
Developmen
t
CS Grades GPAs
CS Grades Pearson Correlation 1 0.404**
Sig. (2-tailed) 0.000
N 78 78

International Journal of Education ISSN 1948-5476
2012, Vol. 4, No. 4
www.macrothink.org/ije 260
GPAs Pearson Correlation 0.404** 1
Sig. (2-tailed) 0.000
N 78 78
Bachelor of
Tourism
Managemen
t
CS Grades GPAs
CS Grades
rural
Pearson Correlation 1 0.379**
Sig. (2-tailed) 0.001
N 78 78
GPAs Pearson Correlation o.379** 1
Sig. (2-tailed) 0.001
N 78 78
BSc.
Agricultural
Economics
and
Agribusines
s
CS Grades GPAs
CS Grades Pearson Correlation 1 0.513**
Sig. (2-tailed) 0.001
N 41 41
GPAs Pearson Correlation 0.513** 1
Sig. (2-tailed) 0.001
N 41 41
**. Correlation is significant at the 0.01 level (2-tailed).
Table 6 indicates that there was a positive significant relationship between the CS examination and the University GPAs for students in the six degree programmes. All the correlation coefficients were significant at the 0.01 level (2-tailed). However, it is worth noting that the correlation coefficients for the six degree programmes differed as they ranged from r=0.357 (BSc. with Education) to r=0.513 (Bachelor of Tourism Management). In this light, a Chi-square test was used to determine the significance of the difference among the observed correlation coefficients. Given that r1=0.357, r2=0.379, r3=0.404, r4=0.454, r5=0.467, and r6=0.513, the resulting Chi-square statistics was 1.29436 which was associated with the p-value of 0.936. Since the observed p-value (0.936) was greater than alpha 0.05, it was concluded that the predictive validity of the CS examination on university GPAs did not significantly differ with regard to the type of degree programme in which students were enrolled at SUA.
4.3 Comparison between the CS Examination Grades and Students’ University Entry Qualifications as Predictors for the University Grade Point Averages
Like other universities, there are specified entry requirements which prospective SUA students ought to meet before obtaining admission to pursue various academic programmes offered at the university. The requirements include good performance at ACSEE levels. For example, a candidate must have at least two principal level passes in the Advanced Certificate of Secondary Education Examinations (ACSEE) that add up to a minimum of 3.0 points for science programmes and 4.5 points for social science programmes (SUA Prospectus, 2010/2011).
In addition to the CS examination being a predictor for performance at the university, the researchers were also interested in examining if students’ university entry points obtained at

International Journal of Education ISSN 1948-5476
2012, Vol. 4, No. 4
www.macrothink.org/ije 261
ACSEE level could as well predict their performance at the university. After collecting data on students’ performance in the CS examination and university entry points, the two variables were each correlated with the university GPAs to determine the best predictor. The correlation results were as shown in Table 7.
Table 7: The Pearson’s Product Moment Correlation Coefficients (r) Between the Communication Skills Grades (CSG) and ACSEE Points and University GPAs
CS Grades
CS Grades GPAs
CSG Pearson
Correlation
1 0.416**
Sig. (2-tailed) 0.000
N 358 358
GPAs Pearson
Correlation
0.416** 1
Sig. (2-tailed) 0.000
N 358 358
**. Correlation is significant at the 0.01 level (2-tailed).
ACSEE
Points
ACSEEP GPA
ACSEEP Pearson
Correlation
1 -0.077
Sig. (2-tailed) .146
N 358 358
GPA Pearson
Correlation
-0.077 1
Sig. (2-tailed) .146
N 358 358
**. Correlation is significant at the 0.01 level (2-tailed).
Table 7 shows a positive correlation coefficient between the CS examination grades and university GPAs was r = 0.416, p < 0.01 in a two-tailed test. This means that there was a positive relationship between the two variables. With regard to the ACSEE points, their correlation coefficient with the University GPAs was r = -0.077, p>0.01. In order to determine their significance, both correlation coefficients were compared with the critical values in the Pearson’s correlation coefficient table. In the case of the CS examination grades, given that df = 356 and 0.05 level of significance, the critical value was 0.113 which is less than the observed value (0.416). Since the observed value was greater than the critical value, it was concluded that there was a statistically significant relationship between the CS examination grades and the university GPAs, r = 0.416, p < 0.01.
With regard to ACSEE points, given that df = 356 and 0.05 level of significance, the critical value was 0.113 which is greater than the observed value (-0.077). Since the observed value was less than the critical value, it was concluded that there was a statistically insignificant relationship between the ACSEE points and the university GPAs, r = -0.077, p>0.01. On the basis of these findings, the null hypothesis (i.e. CS examination grades does not

International Journal of Education ISSN 1948-5476
2012, Vol. 4, No. 4
www.macrothink.org/ije 262
predict the university GPAs better than students’ entry qualifications) was rejected and it was generally concluded that the CS examination grades predicted the university GPAs better than students’ entry qualifications.
5. Discussion
The findings that the students’ performance in the University Communication Skills examination correlates positively with the University Grade Point Averages at SUA agree with those of other studies conducted elsewhere. For example, Black (1991) correlated students’ grades received in the English as Second Language (ESL) courses with the overall academic averages and found out a positive correlation between the performance in the written English and the overall academic achievement. Similarly, Buttler and Castellon-Wellington (2000), as cited in Fakeye and Ogunsiji (2009), compared the students’ performance in the content areas of their subjects of specialization to concurrent performance in a language proficiency test. The results indicated that the language proficiency test performance correlated positively with performance in content areas of their subjects of specialization. Other studies carried out elsewhere have also given similar findings that there is a link between students’ academic achievement and their proficiency in language skills (Maleki, 2010; Brooks and Adams, 2009; Maleki and Zangani, 2007; Doney, 2006; Geene, 2006; Ho and Spinks, 2004).
It has been pointed out that if students do not have adequate communication skills, effective learning cannot take place (Fakeye and Ogunsiji, 2009; Neke, 2003; Graham, 1987). For example, the poor performance of secondary school students in their national examinations in Tanzania has always been attributed to their low proficiency in the language of instruction, which is English (Malekela, 2003; Rubagumya, 1990; Mvungi, 1980). The findings in this study showing low correlation between the University Communication Skills examination performance and the University GPAs, r=0.416, p< 0.01 could mean that the University Grade Point Average has been influenced by other factors other than the English language skills (García-Vázquez, Vázquez, and López, 1997).
6. Conclusion and Recommendations
This study found that there was a significant positive relationship between the students’ University Communication Skills examination scores and the corresponding university GPAs, r=0.416, p< 0.01. Therefore, students’ abilities in the CS play a significant role in their overall academic performance.
It has also been revealed that the predictive validity of the university CS examination grades on the University GPAs differed with regard to sex as it was higher for males (r=0.483) than females (r=0.272). This implies that female students’ performance at SUA was lower than that of male students. However, the predictive validity did not significantly differ with regard to the type of school attended at CSEE and ACSEE and type of degree programme in which

International Journal of Education ISSN 1948-5476
2012, Vol. 4, No. 4
www.macrothink.org/ije 263
students were enrolled at SUA. The findings that the predictive validity of the CS examination on university GPAs did not significantly vary with regard to the type of school at both CSEE and ACSEE levels could be attributed to the fact that majority of students had the same background in terms of schools attended at either CSEE or ACSEE level.
Lastly, it was found that the university CS examination grades predicted the University GPAs better than students’ entry qualifications. In this light it seemed that the ACSEE examinations were not realistic measures of students’ aptitude in their subjects of specialization at ACSEE level. Therefore, students’ performance at ACSEE level should not be the only criterion for admission into the universities.
On the basis of the findings of this study, it is recommended that SUA should carry out a study to review objectives, materials, and methodologies for the teaching and learning of the CS course. This could help in improving the CS course at the University. Also, a study should be carried out to determine other criteria for students’ admission into Tanzania universities besides the ACSEE points. This is because ACSEE results have proved to be poor predictors of performance at the university.
References
Brooks, G., & Adams, M. (2009). Spoken English proficiency and academic performance: Is there a relationship? A Project Report. Macquarie University, Sydney, Australia.
Butler, F. A., & Castellon-Wellington, M. (2000). Students' Concurrent performance on tests of English language proficiency and academic achievement in the validity of administrating large-scale content assessments to English language learners: An investigation from three perspectives. National Center for Research on Evaluation, Standards, and student testing. University of California, Los Angeles.
Callif, A. (1986). Measurement and Evaluation in Secondary Schools. Georgia: Prentice Inc.
Carroll, D. (1980). Am I communicating? An examination of the rise of communication skills in further education. Journal of Further and Higher Education, 4(2), 1-10.
Cipper, C., & Dodd, W. (1984). A report on the teaching of English language and its uses as medium in education. Dar es Salaam: The British Council.
Cripper, C., & Davies, A. (1988). An ELTS validation project report 1 (I). Cambridge: The British Council and University of Cambridge Local Examinations Syndicate.
Doney, P. (2006). An investigation into the predictive validity of the IELTS test as an indicator of future academic success. In K. Martin, N. Stanley and N. Fakeyeson (Eds.), Teaching in the Disciplines/Learning in Context, (pp.127-143). Sydney, Pratax Inc.
Emery, L., (2007). A report on the predictive validity of the BAMT (2004) for first year examinations performance on the veterinary medicine course at the University of Cambridge. Cambridge: University of Cambridge.

International Journal of Education ISSN 1948-5476
2012, Vol. 4, No. 4
www.macrothink.org/ije 264
Fakeye, D.O., & Ogunsiji, Y. (2009). English language proficiency as a predictor of academic achievement among EFL students in Nigeria. Journal of Scientific Research, 37(3), 490-495.
Gall, D.M, Borg, W.R., & Gall, J.P. (1996). Educational Research: An Introduction. New York: Longman Publishers.
García-Vázquez, E., Vázquez, L.A., & López, I.C. (1997). Language proficiency and academic success: Relationships between proficiency in two languages and achievement among Mexican American students. Bilingual Research Journal, 21(4), 334-347. http://dx.doi.org/10.1080/15235882.1997.10162712
Gene, J. (2006). The predictive validity of an ESL placement test: A mixed methods approach. Journal of Mixed Methods Research, 2, 366-389.
Ho, D.Y.F., & Spinks, J.A. (2004). Multivariate prediction of academic performance by Hong Kong university students. Contemporary Education Psychology, 10(3), 249-259. http://dx.doi.org/10.1016/0361-476X(85)90021-9
Ishumi, A.G.M. (1994). 30 years of learning: Educational development in eastern and southern Africa from independence to 1990, Ottawa: International Development Research Centre.
Jenkins, D.J. (2004). The predictive validity of the general scholastic aptitude test as a tool for first year students in information technology. Unpublished M.Ed. Dissertation. University of Zululand, Republic of South Africa.
Kasuga, E.A. (2009). The predictive validity of form two secondary education examinations (FTSEE) on students’ performance in the certificate of secondary education examinations (CSEE) in Tanzania for mathematics and Kiswahili subjects. Unpublished M.A. Education Dissertation. University of Dar es Salaam, Tanzania.
Komba, S. (2008). The impact of communication skills course on students’ development of communicative abilities. Unpublished M.A. Education Dissertation. University of Dar es Salaam, Tanzania.
Lema, G.S. (2004). The differential predictive validities of university entrance examinations in Tanzania. Unpublished M.Ed. Science Education Dissertation. University of Dar es Salaam, Tanzania.
Malekela, G.A. (2003). English as a medium of instruction in post-primary education in Tanzania: Is it a fair policy to the learners? In B. Brock-Utne, Z. Desai, and M. Qorro (Eds.), Language of instruction in Tanzania and South Africa, (pp. 102-111).Dar es Salaam: EandD Limited.
Maleki, A., & Zangani, E. (2007). A Survey on the relationship between English language proficiency and the academic achievement of Iranian EFL students. Asian EFL Journal, 9(1), 164-176.

International Journal of Education ISSN 1948-5476
2012, Vol. 4, No. 4
www.macrothink.org/ije 265
Mlacha, Y.Y., & Rea, P. (1985). The impact of communication skills in English courses with special reference to students in the faculty of arts and social sciences. Papers in Education and Development, 10, 61-64.
Mlama, P., & Materu, M. (1978). Haja ya kutumia Kiswahili kufundishia katika elimu ya juu. Dar es Salaam: BAKITA.
Mohamed, H.I. (2006). Academic writing as social practice: A critical discourse analysis of student writing in higher education in Tanzania. Unpublished PhD Thesis. University of the Western Cape, Republic of South Africa.
Mvungi, M.M. (1980). Relationship between performance in instructional medium and performance in selected school subjects in Tanzanian secondary schools. Unpublished PhD. Thesis. University of Dar es Salaam, Tanzania.
Ndabi, D. (1987). The predictive validity of secondary education examinations. Dar es Salaam: National Examinations Council of Tanzania.
Neke, S.M. (2003). English in Tanzania: An anatomy of hegemony. Unpublished PhD Thesis. Ghent University, Belgium.
Njabili, A.F. (1997). Predictive validity of the 1995 IGCSE mock results as a criterion for provisional admission to the university of Namibia (UNAM) 1996 Academic Year. Windhoek: University of Namibia.
Njabili, A.F. (1999). Public Examinations: A Tool for Curriculum Evaluation. Dar es Salaam: Mture Educational Publishers, 3rd Edition.
Obioma, G., & Salau, M. (2007). The predictive validity of public examinations: A case of Nigeria. Nigerian Educational Research and Development Council, Garki, Abuja, Nigeria.
Omirin, M.S., & Ale, V.M. (2008). Predictive validity of English and mathematics mock examination results of senior secondary school students’ Performance in WASCE in Ekit-State, Nigeria. Pakistan Journal of Social Sciences, 5(2), 139-141.
Puja, G.K. (2003). Kiswahili and higher education in Tanzania: Reflections based on a sociological study from three Tanzanian university campuses. In B. Brock-Utne, Z. Desai, and M. Qorro (Eds.), Language of instruction in Tanzania and South Africa, (pp. 102-111).Dar es Salaam: E and D Limited.
Rubagumya C.M. (1986). Language planning in the Tanzanian educational system: Problems and prospects. Journal of Multilingual and Multicultural Development, 7(4), 283-300. http://dx.doi.org/10.1080/01434632.1986.9994245
Rubagumya C.M. (1990). Language promotion for education purposes: The example of Tanzania. International Review of Education, 37(1), 67-85. http://dx.doi.org/10.1007/BF00598168
Rubagumya C.M. (1997). Disconnecting education: Language as a determinant of the quality

International Journal of Education ISSN 1948-5476
2012, Vol. 4, No. 4
www.macrothink.org/ije 266
of education in Tanzania. A Journal of Linguistics and Language in Education, 3(New Series), 81-93.
Sambayukha, G. (2001). Predictors of academic performance of students in technical colleges in Tanzania. Unpublished M.A. Education Dissertation. University of Dar es Salaam, Tanzania.
Tibategeza, E.R. (2009). Language-in-education planning in tanzania: A sociolinguistic analysis. Unpublished PhD Thesis. The University of the Free State, the United Republic of South Africa.
Wilson, J. (2011). English language proficiency and academic achievement in Tanzanian secondary schools. Unpublished M.A. Linguistics Dissertation. University of Dar es Salaam, Tanzania.
Copyright Disclaimer
Copyright reserved by the author(s).
This article is an open-access article distributed under the terms and conditions of the Creative Commons Attribution license (http://creativecommons.org/licenses/by/3.0/).

Copyright of International Journal of Education is the property of Macrothink Institute, Inc. and its content may
not be copied or emailed to multiple sites or posted to a listserv without the copyright holder's express written
permission. However, users may print, download, or email articles for individual use.