Embed Size (px)
Citation preview

1845
Korean J. Chem. Eng., 31(10), 1845-1858 (2014)DOI: 10.1007/s11814-014-0133-0
INVITED REVIEW PAPER
pISSN: 0256-1115eISSN: 1975-7220
INVITED REVIEW PAPER
†To whom correspondence should be addressed.
E-mail: [email protected]
Copyright by The Korean Institute of Chemical Engineers.
Predictions of wet natural gases condensation rates via multi-component
and multi-phase simulation of supersonic separators
Seyed Heydar Rajaee Shooshtari and Akbar Shahsavand†
Department of Chemical Engineering, Faculty of Engineering, Ferdowsi University of Mashhad, Mashhad, Iran(Received 1 December 2013 • accepted 7 May 2014)
Abstract−Proper correction of water and heavy hydrocarbon dew points of sweet natural gases is essential from vari-
ous technical and economical standpoints. Supersonic separators (3S) are proved to be capable of achieving these tasks
with maximum reliability and minimal expenses. The majority of the previous articles have focused on the flow behavior
of pure fluids across a 3S unit. Multicomponent fluid flow inside 3S accompanied with condensation phenomenon
will drastically increase the complexity of the simulation process. We tackle this issue by considering a proper com-
bination of fundamental governing equations and phase equilibrium calculations to predict various operating conditions
and composition profiles across two multi-component and multi-phase 3S units. Various Iranian sweet gases are used
as real case studies to demonstrate the importance of 3S unit practical applications. Simulation results clearly illustrate
the effectiveness of 3S units for faithful dehydration of various natural gases, while successfully controlling its dew
point, suitable for any practical applications. Conventional HYSYS simulation software is used to validate the simulation
results.
Keywords: Supersonic Separator, Natural Gas, Dew Point Correction, Condensation, Flash Calculation
INTRODUCTION
Novel supersonic separators (3S units) are proved to be benefi-
cial for many gas conditioning applications such as combined dehu-
midification and extraction of heavy hydrocarbons from various
natural gases. Water and heavy hydrocarbon dew point corrections
are essential for proper transportation and economical aspects. Fur-
thermore, 3S units are reported to have other potential applications,
including separation of carbon dioxide and hydrogen sulfide from
natural gases and production of liquefied natural gas (LNG) [1].
Traditionally, refrigeration, membrane, adsorption and absorption
processes are used as conventional processes for water and hydro-
carbon dew point corrections. These processes are usually expen-
sive and require large operational facilities, including complex sys-
tems with many adverse environmental effects due to the use of
various chemical compounds [2]. Supersonic separators can elimi-
nate a variety of impurities from various natural gas streams in a
single compact device. It is reported to enjoy astonishingly high
reliability as large as 99% due to the lack of any moving device [3].
In contrast to other conventional separators, the inlet gas stream may
enter the 3S unit as a single phase stream. Then two or more phases
can be created due to the condensations of water or heavier hydro-
carbon species inside the device at extremely low temperatures re-
sulted from adiabatic expansion. This phenomenon can ultimately
lead to separation of liquid and gas phases and a single gas stream
leaves the 3S unit after proper pressure recovery. Fig. 1 clearly illus-
trates this issue.
Twister BV (Netherlands) engineers pointed out various poten-
tial applications of supersonic separators including natural gas dehy-
dration, hydrocarbon dew point control, deep liquid recovery and
hydrogen sulfide removal [1,4-6].
Liu et al. [7] described a 3S based natural gas dehydration unit
and presented the corresponding structure and its working princi-
ples. Their test results for an indoor 3S rig revealed that the pressure
loss ratio, the shock wave location and the fluid flow rate had im-
mense effect on the overall dehydration characteristics of the entire
process.
Jassim et al. [8,9] studied the flow behavior of high-pressure natu-
ral gas in various supersonic nozzles by resorting to computational
fluid dynamic (CFD) technique. The effects of real gas property,
nozzle geometry and vorticity on the performance of Laval nozzle
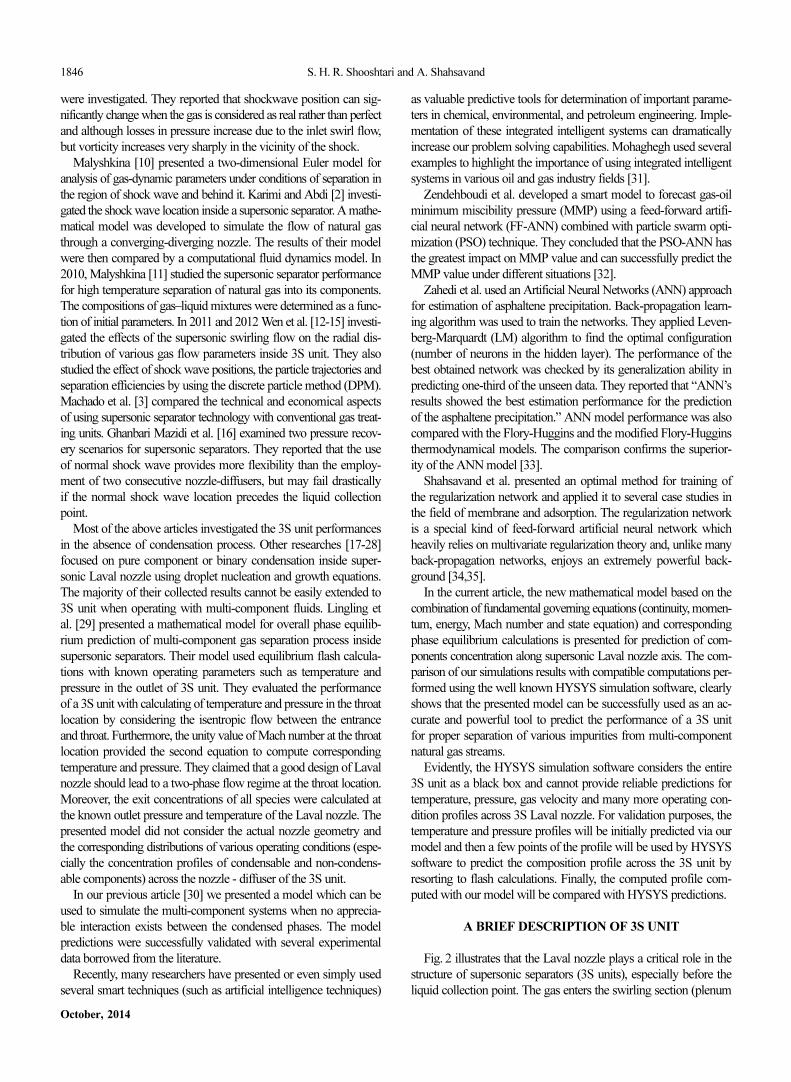
Fig. 1. Typical phase envelope of a retrograde natural gas, dem-onstrating liquid collection potential of a 3S from a singlephase gas stream.
1846 S. H. R. Shooshtari and A. Shahsavand
October, 2014
were investigated. They reported that shockwave position can sig-
nificantly change when the gas is considered as real rather than perfect
and although losses in pressure increase due to the inlet swirl flow,
but vorticity increases very sharply in the vicinity of the shock.
Malyshkina [10] presented a two-dimensional Euler model for
analysis of gas-dynamic parameters under conditions of separation in
the region of shock wave and behind it. Karimi and Abdi [2] investi-
gated the shock wave location inside a supersonic separator. A mathe-
matical model was developed to simulate the flow of natural gas
through a converging-diverging nozzle. The results of their model
were then compared by a computational fluid dynamics model. In
2010, Malyshkina [11] studied the supersonic separator performance
for high temperature separation of natural gas into its components.
The compositions of gas–liquid mixtures were determined as a func-
tion of initial parameters. In 2011 and 2012 Wen et al. [12-15] investi-
gated the effects of the supersonic swirling flow on the radial dis-
tribution of various gas flow parameters inside 3S unit. They also
studied the effect of shock wave positions, the particle trajectories and
separation efficiencies by using the discrete particle method (DPM).
Machado et al. [3] compared the technical and economical aspects
of using supersonic separator technology with conventional gas treat-
ing units. Ghanbari Mazidi et al. [16] examined two pressure recov-
ery scenarios for supersonic separators. They reported that the use
of normal shock wave provides more flexibility than the employ-
ment of two consecutive nozzle-diffusers, but may fail drastically
if the normal shock wave location precedes the liquid collection
point.
Most of the above articles investigated the 3S unit performances
in the absence of condensation process. Other researches [17-28]
focused on pure component or binary condensation inside super-
sonic Laval nozzle using droplet nucleation and growth equations.
The majority of their collected results cannot be easily extended to
3S unit when operating with multi-component fluids. Lingling et
al. [29] presented a mathematical model for overall phase equilib-
rium prediction of multi-component gas separation process inside
supersonic separators. Their model used equilibrium flash calcula-
tions with known operating parameters such as temperature and
pressure in the outlet of 3S unit. They evaluated the performance
of a 3S unit with calculating of temperature and pressure in the throat
location by considering the isentropic flow between the entrance
and throat. Furthermore, the unity value of Mach number at the throat
location provided the second equation to compute corresponding
temperature and pressure. They claimed that a good design of Laval
nozzle should lead to a two-phase flow regime at the throat location.
Moreover, the exit concentrations of all species were calculated at
the known outlet pressure and temperature of the Laval nozzle. The
presented model did not consider the actual nozzle geometry and
the corresponding distributions of various operating conditions (espe-
cially the concentration profiles of condensable and non-condens-
able components) across the nozzle - diffuser of the 3S unit.
In our previous article [30] we presented a model which can be
used to simulate the multi-component systems when no apprecia-
ble interaction exists between the condensed phases. The model
predictions were successfully validated with several experimental
data borrowed from the literature.
Recently, many researchers have presented or even simply used
several smart techniques (such as artificial intelligence techniques)
as valuable predictive tools for determination of important parame-
ters in chemical, environmental, and petroleum engineering. Imple-
mentation of these integrated intelligent systems can dramatically
increase our problem solving capabilities. Mohaghegh used several
examples to highlight the importance of using integrated intelligent
systems in various oil and gas industry fields [31].
Zendehboudi et al. developed a smart model to forecast gas-oil
minimum miscibility pressure (MMP) using a feed-forward artifi-
cial neural network (FF-ANN) combined with particle swarm opti-
mization (PSO) technique. They concluded that the PSO-ANN has
the greatest impact on MMP value and can successfully predict the
MMP value under different situations [32].
Zahedi et al. used an Artificial Neural Networks (ANN) approach
for estimation of asphaltene precipitation. Back-propagation learn-
ing algorithm was used to train the networks. They applied Leven-
berg-Marquardt (LM) algorithm to find the optimal configuration
(number of neurons in the hidden layer). The performance of the
best obtained network was checked by its generalization ability in
predicting one-third of the unseen data. They reported that “ANN’s
results showed the best estimation performance for the prediction
of the asphaltene precipitation.” ANN model performance was also
compared with the Flory-Huggins and the modified Flory-Huggins
thermodynamical models. The comparison confirms the superior-
ity of the ANN model [33].
Shahsavand et al. presented an optimal method for training of
the regularization network and applied it to several case studies in
the field of membrane and adsorption. The regularization network
is a special kind of feed-forward artificial neural network which
heavily relies on multivariate regularization theory and, unlike many
back-propagation networks, enjoys an extremely powerful back-
ground [34,35].
In the current article, the new mathematical model based on the
combination of fundamental governing equations (continuity, momen-
tum, energy, Mach number and state equation) and corresponding
phase equilibrium calculations is presented for prediction of com-
ponents concentration along supersonic Laval nozzle axis. The com-
parison of our simulations results with compatible computations per-
formed using the well known HYSYS simulation software, clearly
shows that the presented model can be successfully used as an ac-
curate and powerful tool to predict the performance of a 3S unit
for proper separation of various impurities from multi-component
natural gas streams.
Evidently, the HYSYS simulation software considers the entire
3S unit as a black box and cannot provide reliable predictions for
temperature, pressure, gas velocity and many more operating con-
dition profiles across 3S Laval nozzle. For validation purposes, the
temperature and pressure profiles will be initially predicted via our
model and then a few points of the profile will be used by HYSYS
software to predict the composition profile across the 3S unit by
resorting to flash calculations. Finally, the computed profile com-
puted with our model will be compared with HYSYS predictions.
A BRIEF DESCRIPTION OF 3S UNIT
Fig. 2 illustrates that the Laval nozzle plays a critical role in the
structure of supersonic separators (3S units), especially before the
liquid collection point. The gas enters the swirling section (plenum

Predictions of wet natural gases condensation rates via multi-component and multi-phase simulation of supersonic separators 1847
Korean J. Chem. Eng.(Vol. 31, No. 10)
chamber) of 3S with a relatively low velocity and high pressure at
near ambient temperature. A set of static vanes are positioned in
the plenum chamber to induce massive swirling motion inside pro-
cess fluid. The gas velocity increases to extremely high values (Ma>1)
when it passes through the diffuser section of the Laval nozzle. Evi-
dently, the fluid pressure drops erratically due to the huge transfor-
mation of potential energy into kinetic energy [36]. Moreover, the
gas temperature dramatically is reduced across the Laval nozzle
due to the adiabatic expansion phenomenon and all condensable
species (e.g., water or heavy hydrocarbons) condense in extremely
cooled supersonic section of the Laval nozzle.
Immense centrifugal accelerations (300,000-500,000 g) are antic-
ipated due to the combination of supersonic flow of the gas stream
and strong swirling motion induced by the plenum chamber. Under
such extreme centrifugal forces, even submicron liquid droplets (water
or condensable hydrocarbon species) will be thrown away towards
the diffuser wall, leaving the 3S by a circumferential passage at collec-
tion point. The relatively liquid-free gas stream passes the separa-
tion point with extremely low temperature and pressure, while still
retaining its very high velocity (Ma>1). Since higher operating pres-
sure and temperature are desired for proper transmission of natural
gas after separation of liquid phases from the gas stream, the fluid
should be decelerated after collection point for pressure recovery
purposes. This task can be achieved by using various scenarios such
as normal shock wave occurrence or recruiting a second Laval nozzle
as described in our previous article [16].
Note that the condensed water phase touches the 3S unit wall
due to its higher density while the condensed liquid hydrocarbon
flows over it. By proper adjustment of the liquid collection edge,
any desired rate of liquid hydrocarbons can be separated (to retain
the heating value of the exit gas stream), while removing the entire
condensed water (to achieve the dehydration standard of 7 lbs water
per 1MMSCF dry natural gas [37]).
MATHEMATICAL MODEL (FROM ENTRANCE
TO COLLECTION POINT)
Assuming steady state flow condition, the one-dimensional gov-
erning equations for multi-phase flow of a condensable stream over
any differential segment of an incremental distance dx inside a con-
verging-diverging nozzle can be summarized as follows.
1. Continuity
Assuming negligible area occupied by liquid droplets (the upcom-
ing simulation results clearly shows that less than 0.02% of the flow
are will be occupied by the gas phase), the continuity equation in
each section can be written as:
(1)
where is the total mass flow rate, is the liquid mass flow rate,
ρG is the gas phase density, A is the cross-sectional area of nozzle
at any segment and UG is the gas velocity. Differentiating Eq. (1)
leads to:
(2)
2. Momentum Equation
The one-dimensional momentum changes across each segment
can be expressed as:
(3)
where f is the friction factor and de is the hydraulic diameter. As-
suming no slippage between the gas and liquid phases (UG=UL) and
dividing Eq. (3) by (A×P), the momentum equation can be simpli-
fied and rearranged as:
(4)
3. Equation of State
The Peng-Robinson equation of state (EOS) can be written as:
(5)
where VG is the specific volume of gas phase, and a, α and b are
the Peng-Robinson parameters (which are presented in Appendix A).
On differentiation and using 1/ρG instead of VG, Eq. (5) becomes:
(6)
Evidently, all PR parameters depend on composition of both gas
and liquid phases and may dramatically change along the entire length
of 3S unit in the x direction. For this reason, such parameters should
be updated after calculation of temperature, pressure and composi-
tion of both phases for each spatial increment. This issue is shown
in Fig. 3.
4. Energy Equation
The energy equation for steady state adiabatic flow at any section
can be written as:
(7)
where hG and hL are the gas and liquid enthalpies, respectively. The
change of enthalpy of the vapor phase can be expressed by:
m· t = m· L + ρGAUG
m· t m· L
dρG
ρG
--------- +
dA
A------- +
dUG
UG
---------- +
dm· L
m· t − m· L
----------------- = 0
d m· GUG + m· LUL[ ] = − AdP −
fAρGUG
2
2de
--------------------dx
dP
P------ = −
fρGUG
2
2P---------------
dx
de
------ −
mtUG
AP-------------
dUG
UG
----------
P =
RTG
VG − b--------------- =
aα
VG VG + b( ) + b VG − b( )-------------------------------------------------------
dP
P------ − X
dρG
ρG
--------- − YdTG
TG
--------- = 0
X =
B1+ 2B2ρG + ρG
dB1
dρG
--------- + ρG
2 dB2
dρG
---------
B1+ B2ρG
--------------------------------------------------------------------
Y =
B1+ B2ρG + ρGTG
dB2
dTG
---------
B1+ B2ρG
---------------------------------------------------
B1=
1
1− bρG
----------------
B2 = −
aα
RTG 1+ bρG + b − b2ρG( )
--------------------------------------------------------
d m· G hG +
UG
2
2-------
⎝ ⎠⎛ ⎞
+ m· L hL +
UL
2
2------
⎝ ⎠⎛ ⎞
= 0
Fig. 2. Schematic diagram of a supersonic separator.

1848 S. H. R. Shooshtari and A. Shahsavand
October, 2014
(8)
Dividing Eq. (7) by cpTG and replacing latent heat (hG−hL) with
hfg and using Eq. (8) for dhG, leads to the following equation:
(9)
5. Mach Number
The square of Mach number equation can be written as:
(10)
where γ is the ratio of specific heats. Differentiating Eq. (10) and
rearranging it leads to:
(11)
6. Prediction of Hydrocarbon Condensation Rate
In each segment, before solving fundamental governing equa-
tions, the liquid molar flow rate and concentration of components
should be computed via phase equilibrium calculations. The total
and components mole balances can be written as [38,39]:
dhG =
∂hG
∂TG
---------⎝ ⎠⎛ ⎞
P
dTG +
∂hG
∂P---------⎝ ⎠⎛ ⎞
TG
dP = cPdTG
+ VG − TG
∂VG
∂TG
----------⎝ ⎠⎛ ⎞
P
dP = cPdTG +
1
ρG
------ 1−
Y
X----
⎝ ⎠⎛ ⎞
m· t
dTG
TG
--------- +
P
ρGcpTG
----------------- 1−
Y
X----
⎝ ⎠⎛ ⎞dP
P------ +
UG
2
cpTG
-----------dUG
UG
---------- −
hfg
CpTG
------------dm· L
m· t
---------- = 0
Ma2
=
UG
2
γ
P/ρG
--------------
d Ma2( )
Ma2( )
----------------- = 2dUG
UG
---------- +
dρG
ρG
--------- −
dP
P------
Fig. 3. Computation algorithm for calculation of operating parameters across each segment.

Predictions of wet natural gases condensation rates via multi-component and multi-phase simulation of supersonic separators 1849
Korean J. Chem. Eng.(Vol. 31, No. 10)
(12)
(13)
where zi, xi and yi are the mole fractions of “i” component in the
feed stream, liquid and gas phases, respectively. The mole fraction
of liquid and gas phases are related to each other via equilibrium
constant.
yi=Kixi (14)
Combination of Eqs. (12) to (14) and the fact that the sum of the
mole fractions in each of liquid and gas phases is unity, results in:
(15)
The equilibrium constant can also be calculated from the following
equation:
(16)
where φi is the fugacity coefficient and can be computed via Peng-
Robinson equation of state (EOS):
(17)
In this EOS, the z factor can be estimated by solving the following
cubic equation:
z3−(1−B')z2+(A'−2B'−3B'2)z−(A'B'−B'
2−B'3)=0 (18)
Parameters, A', B', A''i and B''
i are Peng-Robinson constants and
should be computed for both liquid and gas phases separately, since
each phase has its own composition.
For saturated systems, the above equation has three real roots
for each of gas and liquid phases. The smaller root belongs to liquid
phase compressibility factor, while the larger root corresponds to
gas (vapor) compressibility factor. By substituting the values of z-
factor for gas and liquid phases in Eq. (17), the fugacity coefficient
of two phases can be easily computed.
As a first trial, a set of initial values should be assigned for all
equilibrium constants, to compute an estimate of liquid and gas com-
positions for each segment. The following (Wilson) equation pro-
vides a convenient choice for this purpose [38]:
(19)
where Pc, Tc and ωi are the fluid critical pressure, temperature and
acentric factor, respectively.
7. Prediction of Water Vapor Condensation Rate
Since water is immiscible in the mixture of liquid hydrocarbons,
therefore, in the presence of water vapor the ordinary flash calcula-
tion should be performed by neglecting water as a component. The
mole fraction of water vapor at each segment and before flash cal-
culation can be computed via the following criteria:
(20)
where Pwin and ywin are the water vapor partial pressure and its mole
fraction at the segment inlet, while Pw* is the water vapor pressure
at the corresponding segment temperature. By definition, the mole
fraction of water vapor can be computed as:
(21)
where and are the water vapor and hydrocarbon gas flow
rates. Combination of Eqs. (20) and (21) provides for known
value of at inlet condition. Afterwards, the condensed liquid
water rate can be computed via simple mole balance at each seg-
ment as:
(22)
Fig. 3 illustrates the complete computational algorithm used for multi-
component simulation of Laval nozzle of 3S unit during the con-
densation of water and hydrocarbon species.
REAL CASE STUDIES DESCRIPTION
Two different real case studies are presented in this section. The
first one belongs to the methane-rich sweetened natural gas pro-
duced in the Khangiran gas refinery, which does not provide appre-
ciable condensation of heavier hydrocarbons inside the Laval nozzle
while sufficiently dehydrates the gas stream upon passing through
3S unit. The second case study involves the South Pars sweetened
natural gas, which contains relatively large amounts of heavy hydro-
carbons. Evidently, both water and hydrocarbon phases condense
inside the Laval nozzle, which creates a more challenging case for
multi-component simulation.
1. Case 1: Khangiran Natural Gas Refinery
Table 1 provides the composition of the Khangiran gas refinery
sweetened natural gas on a carbon dioxide-free basis. The CO2 is
excluded because its existence has several effects on the overall per-
formance of the 3S unit. It can condense at extremely low temper-
atures and moderately high pressures around the collection point.
Furthermore, the uncondensed CO2 can dissolve in condensed water
and severely affect the corresponding equilibria, which greatly in-
creases the complexity of the entire modeling. For simplicity and
as a first trial, the CO2 free basis system was considered. The dry
m· L + m· G = m· t
zim·t = xim
·L + yim
·G
xi =
m· tzim· t + m· G Ki −1( )----------------------------------- =1
Ki =
φLi
φgi------
φi = − z − B'( )ln + z −1( )B''
iln
−
A'
21.5
B'------------- A''
i − B''i( ) z + 21/2
+1( )B'
z − 21/2
−1( )B'
---------------------------------ln
Ki =
Pci
P------ 5.37 1+ ω i( ) 1−
Tci
T------
⎝ ⎠⎛ ⎞
⎝ ⎠⎛ ⎞exp
yw =
ywin Pwin Pw*<
Pw* /Pt Pwin Pw
*≥⎩⎨⎧
yw =
m· Gw
m· Gw + m· GHC
----------------------------
m· Gw m· GHC
m· Gw
m· GHC
m· Lw = m· tw − m· Gw
Table 1. The sweetened Khangiran refinary natural gas compo-sition (on a carbon dioxide free basis and saturated withwater vapor)
Component Mole fraction
Methane 0.9839
Ethane 0.0066
Propane 0.0007
Iso-Butane 0.0003
n-Butane 0.0003
Iso-Pentane 0.0004
n-Pentane 0.0004
n-Hexane & heavier 0.0012
Water vapor 0.0013
Nitrogen 0.0049

1850 S. H. R. Shooshtari and A. Shahsavand
October, 2014
natural gas is initially saturated with water vapor at 315 K and 64.9
atm using conventional steam tables.
At the present time, five adsorption dehumidification units are
used to dry around 55MMSCMD (≈1942 MMSCFD) of such sweet-
ened gas produced at the peak capacity of Khangiran gas refinery gas
treating units (GTUs). Each unit consists of four adsorption towers,
packed with two grades of silica gels. Each tower has around 2.5
meters diameter and more than 12 meters height. At each instance,
two towers undergo the unsteady state adsorption process while the
third and fourth ones are used for cooling and heating purposes.
The present highest capacity of each dehumidification unit at the peak
condition is around 11MMSCMD. Considering the future expan-
sions of Khangiran GTU’s, each adsorption dehumidification units is
assumed to be replaced by a supersonic separation system of 13.4
MMSCMD. Table 2 provides the converging - diverging (Laval)
nozzle geometries of such a 3S unit which can be used to control
both hydrocarbon and water dew points. Evidently, such a 3S unit
can easily outperform the conventional adsorption dehumidification
units while occupying much smaller space, even with all its auxil-
iary equipment (e.g., pre- and post-cyclone separators and hydrate
prevention system).
Each 1 MMSCF of the dried natural gas should contain less than
seven pounds of water vapor. The initial saturated gas at 315 K con-
tains around 60 pounds of water vapor per 1 MMSCF of wet gas.
Therefore, more than 88 percent of the water vapor content of satu-
rated gas should be removed to meet the above standard value. On
the other hand, as shown in Table 1, the sweetened natural gas is
actually free of heavy hydrocarbon. At the present time, the gross
heating value (GHV) of Khangiran sweetened natural gas is around
34,700 kJ/SCM, which is the lowest heating value in the entire Mid-
dle-East region. Further separation of C2
+ components will lead to
extremely lower heating values, which would not be desirable. There-
fore, only water dew point correction will be achieved in this case
study.
In the second real case study, a typical South Pars sweetened wet
gas stream is used to demonstrate the successful performance of 3S
unit on simultaneous water and hydrocarbon dew point corrections.
2. Case 2: South Pars Natural Gas Refineries
Table 3 presents the composition of South Pars natural gas field
sweetened on a carbon dioxide-free basis and saturated with water
vapor at 297 K and 67.1 atm.
At the present time, the South Pars refineries include ten operat-
ing phases. Each phase contains two adsorption dehumidification
units to dry around 25MMSCMD (≈883 MMSCFD) sweetened
gas described in Table 3. Each dehydration unit consists of three
adsorption towers, packed with two grades of silica gels. At each
instance, two towers undergo the adsorption process, while the third
one is cooled after a heating cycle. Evidently, each dehumidifica-
tion unit dries around 12.5MMSCMD. Such large drying facilities can
be avoided by replacing them with two parallel supersonic separa-
tors for each phase. Table 2 provides the corresponding nozzle geom-
etries for each 3S unit which can receive around 13.1 MMSCMD
wet sweetened natural gas. The saturated feed gas at 297 K con-
tains around 20 pounds of water vapor per 1 MMSCF of wet gas. To
achieve the standard value (7 pounds water vapor per 1 MMSCF
dried gas), around 65 percent of the water content of the wet gas
should be removed.
Due to the relatively large concentrations of heavy hydrocarbons
available in the sweetened South Pars natural gas stream, simulta-
neous condensation of the both water and hydrocarbon phases will
occur. Our in-house simulation package considers this issue and
computes the water vapor and all hydrocarbon species concentra-
tion profiles across the entire length of supersonic separator.
SIMULATION RESULTS
The detailed algorithm of section 2 is applied to both case studies
described in the previous section. The corresponding simulation
results regarding water and/or hydrocarbon dew point corrections
Table 2. Nozzle parameters
Parameter Unit Value
Inlet radius m2 0.0513
Inlet area m2 0.0083
Throat radius m2 0.0500
Throat area m2 0.0079
Outlet radius m2 0.0808
Outlet area m2 0.0205
Nozzle (converging) length m2 0.1000
Diffuser (diverging) length m2 0.7000
Table 3. South pars sweetened natural gas compositions (on a car-bon dioxide free basis and saturated with water vapor)
Component Mole fraction
Methane 0.8748
Ethane 0.0559
Propane 0.0204
Iso-Butane 0.0035
n-Butane 0.0053
Iso-Pentane 0.0014
n-Pentane 0.0012
n-Hexane & heavier 0.0014
Water vapor 0.0004
Nitrogen 0.0357
Table 4. Carbon dioxide free basis composition of Khangirandried natural gas (prior to collection point)
Component Mole fraction
Methane 0.98845
Ethane 0.00625
Propane 0.00032
Iso-Butane 0.00003
n-Butane 0.00001
Iso-Pentane 2.4e-6
n-Pentane 1.1e-6
n-Hexane & heavier 2.2e-7
Water vapor 1.2e-9
Nitrogen 0.00493

Predictions of wet natural gases condensation rates via multi-component and multi-phase simulation of supersonic separators 1851
Korean J. Chem. Eng.(Vol. 31, No. 10)
via using 3S unit are provided in the following sections.
1. Case 1
As previously mentioned, water dew point correction (in the ab-
sence of heavy hydrocarbons condensation) was the main objec-
tive of our first case study. Table 4 provides the mole fractions of
all species at the outlet of Laval nozzle before collection point is
reached. As can be seen, large amounts of heavy hydrocarbons are
condensed at the prevailing outlet temperature and pressure (167 K
and 6.5 atm.). Evidently, such large heavy hydrocarbon condensa-
tion rates are not desirable. As mentioned earlier, by proper adjust-
ment of the liquid collection edge, any desired rate of liquid hydro-
carbons can be separated (to retain the heating value of the exit gas
stream).
Fig. 4(a) illustrates the corresponding simulation results for the
computed temperature and pressure profiles across the Laval noz-
zle. Fluid encounters extremely low temperatures at the collection
point, which provides appropriate conditions for the condensation
of many hydrocarbons and water vapor. Evidently, at excessively
low temperatures of around 170 K (≅−100 oC) and in the presence
of liquid condensed water, the situation is ideal for the formation of
methane hydrate even at moderate pressures of around 10 atmo-
spheres. Fortunately, this troubling phenomenon does not occur due
to exceptionally small residence time inside 3S unit (0.002 to 0.005
seconds), which is not sufficient for successful hydrate formation.
Fig. 4(b) shows similar velocity and Mach number distributions
along the Laval nozzle. Note that the outlet Mach number reaches
to more than 2.3, which is responsible for such large drop in tem-
perature and pressure of the gas and liquid streams. After separation
of liquid phases from the gas stream, the fluid should be decelerated
for pressure recovery purposes via normal shock wave or any other
facility [16]. Decreasing the Mach number and velocity will increase
both gas pressure and temperature which would be desirable for
proper transmission purposes. The current modeling uses an isen-
tropic model to simulate the flow behavior prior to normal shock
position.
Since Khangiran sweetened natural gas contains small amounts
of heavy hydrocarbons, further condensation of hydrocarbon species
(C2
+) reduces its poor heating value, which is not actually desirable.
Therefore, the sole reason for using a 3S unit is to reduce the water
content of the gas stream to standard value of 7 lbs water per one
MMSCF of dried gas. As clearly shown in Fig. 5, only five percent
of the diffuser length is required to achieve the standard value (yw=
0.00014). So, the collection point can be situated at about 10 percent
of the diffuser length from throat location. The remaining length
can be used for pressure recovery purposes. Interestingly, at this
new location of the collection point, the fluid temperature and pres-
sure are around 270 K and 32 atm. respectively. Evidently, at such
condition, negligible amounts of existing hydrocarbons will be con-
densed.
As mentioned earlier, HYSYS simulation software cannot pro-
vide any prediction for various operating condition profiles (e.g., T
and P) across the 3S Laval nozzle. The initial feed entering the 3S
unit is flashed via HYSYS software at the computed temperature
and pressure profiles calculated by the procedure shown in Fig. 3.
The HYSYS predictions are then compared with our present model
in Figs. 5 to 7 and 9 to 10. In the absence of experimental data, these
comparisons of the results obtained from two independent meth-
ods are used for validation purposes.
Fig. 6 shows the computed distribution of cumulative liquid flow
rate inside the Laval nozzle. As can be observed, a small kink can
be detected. The pre-kink rise belongs to the condensation of water
Fig. 4. Simulation results of case1 for distribution of operating parameters across Laval nozzle.(a) Temperature and pressure distribution, (b) Velocity and Mach number distribution
Fig. 5. Water concentration profile across Laval nozzle shows thatthe collection point can be moved towards throat location.

1852 S. H. R. Shooshtari and A. Shahsavand
October, 2014
vapor while the second post-kink rise represents the condensation
of heavy hydrocarbons. A second notable point in this figure is the
change of its slope across the Laval nozzle. Before the start of hy-
drocarbon condensation (pre-kink location), the slope tends to zero
because the water content of the gas stream drops quickly. This phe-
nomenon cannot be observed for hydrocarbon phase, because the
lighter hydrocarbons start to condense as the temperature drops addi-
tionally. Two assumptions in mathematical modeling were made,
which were negligible area occupied by liquid droplets and no slip-
page between the gas and liquid phases. As mentioned in the pervi-
ous section, each supersonic separator for the first case study will
receive 13.4 MMSCMD wet gas, which has a real volume of about
1.13 MMCMD (13.08 CMS) at the end of Laval nozzle (T≅170 K,
P≅7 atm, see Fig. 4(a)). From Fig. 6, the maximum condensation
rate is around 0.0425 kgmole/s, which corresponds to a volumetric
flow rate of about 0.0027 CMS. Therefore, the condensed phase
(both water and hydrocarbon) always occupies less than 0.02% of
the total cross sectional area of the Laval nozzle. Furthermore, the
gas velocity at the end of nozzle is about 700 m/s (as shown in Fig.
4(b)), and therefore these extremely small and submicron liquid
droplets will be carried directly by the gas stream with the same
velocity, which verifies the no-slip condition.
Fig. 6. Simulation results of case1 for distribution of cumulativeliquid flow rate.
Fig. 7. Simulation results of case1 for distribution of components mole fraction across Laval nozzle.
Fig. 7 provides concentration distributions for all condensable
species and methane along the Laval nozzle. Clearly, the reductions
in the slope of mole fractions for heavier hydrocarbons are larger
than lighter hydrocarbons. Furthermore, the mole fraction of meth-
ane increases due to the condensation of other species. The heating

Predictions of wet natural gases condensation rates via multi-component and multi-phase simulation of supersonic separators 1853
Korean J. Chem. Eng.(Vol. 31, No. 10)
value of any natural gas depends on its heavy hydrocarbons content.
On the other hand, large quantities of heavy hydrocarbons may cause
problems in the gas transportation system due to creation of two-
phase flow. Therefore, in an ideal situation, maximum heating value
of the natural gas should be preserved while avoiding the creation
of two phase region. Since the natural gas heating value of the first
case study was relatively small, the water vapor content should be
reduced to its permissible value without appreciable condensation
of heavy hydrocarbons. One of the advantages of supersonic sepa-
rators is selective removal of impurities via suitable adjustment of
the collection point. This selective removal is based on the different
condensation points. As can be seen in Fig. 7, the water vapor content
reaches under 7 lbs/MMSCF of dried gas (yw=0.00014) at around
0.1 m distance from throat. At this point, almost all of heavy hy-
drocarbons remain in the natural gas stream as vapor, and therefore
separation of water vapor without condensation of heavy hydro-
carbons can be achieved.
2. Case2
As reported in Table 3, the South Pars sweetened natural gas con-
tains relatively large amounts of heavier hydrocarbons (C2
+). There-
fore, in addition to water dew point correction, the separation of
heavy hydrocarbons is also important. Table 5 illustrates the simu-
lation results for species mole fractions at the outlet of Laval nozzle.
The water vapor mole fraction is reduced much lower than its permis-
sible value. Furthermore, the appreciable decrease in mole fractions
of C2
+ components indicates that large amounts of these heavier hy-
drocarbons are also condensed inside the diffuser section. As pre-
viously, since the water vapor content of natural gas reaches its de-
sired standard value just after the throat location, therefore the actual
length of the entire Laval nozzle should be selected based on the
preferred C2
+ concentrations.
Fig. 8(a) illustrates the temperature and pressure distributions along
both diverging and converging sections of the Laval nozzle when
the South Pars sweetened natural gas enters the 3S unit. Fig. 8(b)
also depicts similar profiles for the corresponding fluid axial velocity
and gas Mach number. As in case 1, the 3S unit provides extremely
low temperature and pressures necessary for condensation of both
hydrocarbons and water vapor phases. The large Mach number at
the outlet condition is responsible for these large temperature and
pressure drops. It should be emphasized that the same nozzle geom-
etry is used for both case studies. Different inlet conditions (e.g.,
Table 5. Carbon dioxide free basis composition of south pars driednatural gas before collection point of 3S unit
Component Mole fraction
Methane 0.91888
Ethane 0.03996
Propane 0.00298
Iso-Butane 0.00010
n-Butane 0.00007
Iso-Pentane 3.4e-6
n-Pentane 1.5e-6
n-Hexane & heavier 1.7e-7
Water vapor 1.8e-8
Nitrogen 0.03800
Fig. 8. Simulation results for various operating parameters profiles across Laval nozzle.(a) Temperature and pressure distributions, (b) Velocity and Mach number distributions
Fig. 9. Simulation results for cumulative liquid flow rate across lavalnozzle.

1854 S. H. R. Shooshtari and A. Shahsavand
October, 2014
pressure and temperature) lead to different velocity and Mach num-
ber distributions, even when same nozzle geometry was used. To
achieve a unit Mach number at the throat location, the inlet gas vel-
ocity of cases1 and 2 should be 315 m/s and 280 m/s, respectively.
Fig. 9 presents the cumulative liquid flow rate distribution along
the Laval nozzle. Similar to the previous case, the water vapor ini-
tially condenses and leads to a sudden rise in liquid flow rate profile.
However, the large condensation rate of heavy hydrocarbons sup-
presses the water vapor condensation and the sudden rise due water
liquefaction is not distinguishable. This point is demonstrated in
the magnified view of Fig. 9. Relatively large amounts of condensed
liquid hydrocarbons can be collected due to higher concentration
of heavy hydrocarbons at the inlet stream. Although liquid phase
flow is much higher than in the previous case, it still occupies less
than 0.013% of the cross sectional area. Each supersonic separator
receives 13.1 MMSCMD wet gas, which has a real volume of about
1.22MMCMD (14.12 CMS) at the end of nozzle condition (T≅180
K, P≅6.71 atm, refer to Fig. 8(a)). Fig. 9 shows that the maximum
condensation rate is around 0.475 kgmole/s, which occupies about
0.00175 CMS. Therefore, the maximum liquid flow rate occupies
less than 0.013% of the total cross sectional area at the end of Laval
nozzle.
Fig. 10 provides the distributions of various species mole frac-
tions along the Laval nozzle of 3S unit. As mentioned, in contrast
to the previous case study, hydrocarbon dew point correction is also
important in this case because of the relatively large amounts of
heavier hydrocarbons available in the inlet natural gas stream. So,
the collection point should be positioned at the proper point where the
outlet natural gas stream has the required heating value. Evidently,
based on such distributions of species concentrations, a successful
design of 3S unit can be achieved to provide the desired concentra-
tions of water vapor and heavier hydrocarbons at the outlet condition.
It should be emphasized that HYSYS software can provide proper
predictions only when correct temperatures and pressures across
the entire 3S Laval nozzle are used. It is not capable of finding any
temperature or pressure distribution. Figs. 11 and 12 clearly demon-
strate this issue. In these figures, cases 1 and 2 represent the simula-
tions results obtained with our present model in the presence and
absence of condensation, respectively. In other words, the equilib-
rium calculations are performed in each step for case 1 while it was
neglected in case 2. As can be seen, the HYSYS software may pro-
vide unrealistic results when inadequate temperature and pressure
distributions are used as the inputs. This issue will be more severe
when the condensation rate is relatively high (e.g., South Pars data)
when compared to other cases, such as Khangiran gas which has a
much smaller condensation rate.
Fig. 10. Simulation results for various components mole fractions profiles across Laval nozzle.

Predictions of wet natural gases condensation rates via multi-component and multi-phase simulation of supersonic separators 1855
Korean J. Chem. Eng.(Vol. 31, No. 10)
Fig. 11. The effect of latent heat on distribution of various param-eters for Khangiran gas.(a) Temperature, (b) Pressure, (c) Liquid flow rate
Fig. 12. The effect of latent heat on distribution of various param-eters for South Pars gas.(a) Temperature, (b) Pressure, (c) Liquid flow rate

1856 S. H. R. Shooshtari and A. Shahsavand
October, 2014
CONCLUSION
Water and heavy hydrocarbon dew point corrections of natural
gas streams are essential for safe transportation purposes and pre-
serving their heating values. Supersonic separators can achieve both
tasks with high reliability, minimal operating costs and small oper-
ational facilities requirements.
Despite the complexity of multi-component multiphase systems,
the present approach recruited a combination of fundamental gov-
erning equations and phase equilibrium calculations to predict vari-
ous operating conditions profiles and different components mole
fractions distributions along the entire length of 3S unit Laval nozzle
for multi-component and multi-phase system. The simulation results
indicate that the 3S units can be used successfully to remove almost
the entire water content of natural gas for two real case studies. It
was also clearly shown that the 3S units are able to successfully
reduce the heavier hydrocarbon concentrations to the desired values
necessary for practical applications. The simulation results were vali-
dated by resorting to other independent methods such as HYSYS
simulation software.
Finally, the existence of carbon dioxide has several effects on the
overall performance of the 3S unit. It can condense at extremely
low temperatures and moderately high pressures around collection
point. Furthermore, the uncondensed CO2 can dissolve in condensed
water and severely affect the corresponding equilibria which greatly
increases the complexity of the entire modeling. For simplicity, and
as a first trial, the CO2 free basis system was considered. It can be
investigated as an independent factor in our future work.
NOMENCLATURE
a, A', A''i, b, B', B''
i : Peng-Robinson parameters
A : area [m2]
B1, B2: function of temperature, density and PR parameters in EOS
Cp : specific heat at constant pressure [j/kgmol k]
de : hydraulic diameter [m]
dx : incremental distance [m]
F : friction factor
H : enthalpy [j/kg]
hfg : latent heat [j/kgmol]
Ki : equilibrium constant of component i
: mass flow rate [kgmol/s]
Ma : mach number
P : pressure [Pa]
P* : saturation pressure [Pa]
Pc : critical pressure [Pa]
R : gas constant
T : temperature [k]
Tc : critical temperature [k]
U : velocity [m/s]
VG : specific volume of gas phase
X : function of temperature and density in equation of state
xi : mole fraction in liquid phase
Y : function of temperature and density in equation of state
yi : mole fraction in gas phase
Z : compressibility factor
zi : components mole fraction in the inlet
ρ : density [kgmol/m3]
ω : acentric factor
φ : fugacity coefficient
γ : ratio of specific heats
Subscripts
G : gas phase
HC : hydrocarbon
i : component i
in : inlet
L : liquid phase
t : total
W : water
Superscripts
* : saturation
REFERENCES
1. M. Betting and H. D. Epsom, World Oil Mag., 254, 197 (2007).
2. A. Karimi and M. A. Abdi, Chem. Eng. Process., 48, 560 (2009).
3. P. B. Machado, J. G. M. Monteiro, J. L. Medeiros, H. D. Epsom and
O. Q. F. Araujo, J. Nat. Gas. Sci. Eng., 6, 43 (2012).
4. F. Okimoto and J. M. Brouwer, World Oil Mag., 223, 89 (2002).
5. V. I. Alferov, L. A. Baguirov, L. Dmitriev, V. Feygin, S. Imaev and
J. R. Lace, Oil Gas J., 103, 53 (2005).
6. P. Schinkelshoek and H. Epsom, in Proc. GPA 87th Annual Conven-
tion, TX (2008).
7. H. Liu, Z. Liu, Y. Feng, K. Gu and T. Yan, Chin. J. Chem. Eng., 13,
9 (2005).
8. E. Jassim, M. A. Abdi and Y. Muzychka, Pet. Sci. Technol., 26, 1757
(2008).
9. E. Jassim, M. A. Abdi and Y. Muzychka, Pet. Sci. Technol., 26, 1773
(2008).
10. M. M. Malyshkina, High Temp., 46, 69 (2008).
11. M. M. Malyshkina, High Temp., 48, 244 (2010).
12. C. Wen, X. Cao and Y. Yang, Chem. Eng. Process., 50, 644 (2011).
13. C. Wen, X. Cao, Y. Yang and J. Zhang, Chem. Eng. Technol., 34,
1575 (2011).
14. C. Wen, X. Cao, Y. Yang and W. Li, Energy, 37, 195 (2012).
15. C. Wen, X. Cao, Y. Yang and J. Zhang, Adv. Powder Technol., 23,
228 (2012).
16. M. Ghanbari Mazidi, A. Shahsavand and B. M. Vaziri, J. Pet. Tech-
nol., In press.
17. F. Bakhtart and M. T. Mohammadi Tochai, Int. J. Heat Fluid Flow,
2, 5 (1980).
18. A. Guha and J. B.Young, I Mech E Conf. Publ., 167 (1991).
19. G. Cinar, B. S. Yilbas and M. Sunar, Int. J. Multiphase Flow, 23, 1171
(1997).
20. A. J. White and M. J. Hounslow, Int. J. Heat Mass Transfer, 43, 1873
(2000).
21. S. Dykas, Task Q., 5, 519 (2001).
22. A. G. Gerber and M. J. Kermani, Int. J. Heat Mass Transfer, 47, 2217
(2004).
23. M. R. Mahpeykar and A. R. Teymourtash, Sci. Iran., Trans. B., 11,
269 (2004).
24. Y. Yang and Sh. Shen, Int. Commun. Heat Mass Transfer, 36, 902
m·

Predictions of wet natural gases condensation rates via multi-component and multi-phase simulation of supersonic separators 1857
Korean J. Chem. Eng.(Vol. 31, No. 10)
(2009).
25. S. Dykas and W. Wroblewski, Int. J. Heat Mass Transfer, 53, 933
(2012).
26. G. Cinar, B. S. Yilbas and M. Sunar, Int. J. Multiphase Flow, 23, 1171
(1997).
27. Q. F. Ma, D. P. Hu, J. Z. Jiang and Z. H. Qiu, Int. J. Comput. Fluid
Dyn., 23, 221 (2009).
28. Q. F. Ma, D. P. Hu, J. Z. Jiang and Z. H. Qiu, Int. J. Comput. Fluid
Dyn., 24, 29 (2010).
29. B. Lingling, L. Zhongliang, L. Hengwei, J. Wenming, Z. Ming and
Z. Jian, Sci. China Technol. Sci., 53, 435 (2010).
30. S. H. Rajaee Shooshtari and A. Shahsavand, J. Sep. Purif. Technol.,
116, 458 (2013).
31. S. D. Mohaghegh, J. Pet. Technol., 57, 8691 (2005).
32. S. Zendehboudi, M. A. Ahmadi, A. Bahadori, A. Shafiei and T.
Babadagli, Can. J. Chem. Eng., 91, 1325 (2013).
33. G. Zahedi, A.R. Fazlali, S.M. Hussein, G.R. Pazuki and L. Sheikhat-
tar, J. Pet. Sci. Eng., 68, 218 (2009).
34. A. Shahsavand and A. Ahmadpour, Comput. Chem. Eng., 29, 2134
(2005).
35. A. Shahsavand and M. Pourafshari Chenar, J. Membr. Sci., 297, 59
(2007).
36. B. M. Vaziri, A. Shahsavand, H. Rashidi and M. G. Mazidi, in Proc.
13th Iranian National Chemical Engineering Cong. & 1st Int. Regional
Chemical and Petroleum Engineering, Kermanshah, Iran (2010).
37. A. Kohl and R. Nielsen, Gas Purification. 5th Ed., Gulf Pub. Co.,
Houston, Texas (1997).
38. T. H. Ahmed, Hydrocarbon phase behavior, 1st Ed., Gulf Pub. Co.,
USA (1989).
39. W. D. Mccain, The properties of petroleum fluid, 2nd Ed., Pennwell
Pub. Co., Tlsu, Oklahoma, USA (1990).
APPENDIX A. PARAMETERS OF PENG-ROBINSON
EQUATION OF STATE
The Peng-Robinson equation of state is presented in Eq. (A1)
[34]:
(A1)
Where VG is the specific volume of gas phase, and aT and b are the
Peng-Robinson parameters and can be calculated from following
equations using mixing rule.
(A2)
(A3)
(A4)
aij=aciαj (A5)
(A6)
(A7)
In the above equations, yi is the mole fraction of component “i”, Tc
is critical temperature, Pc is critical pressure, δij is binary interaction
parameter between components “i” and “j”, Tr is reduced tempera-
ture and ωj is acentric factor.
In this EOS, fugacity coefficient, z factor and their parameters
can be computed by following equations:
(A-8)
z3−(1−B')z2+(A'−2B'−3B'2)z−(A'B'−B'
2−B'3)=0 (A-9)
(A10)
(A11)
(A12)
(A13)
APPENDIX B. PHYSICAL PROPERTIES
OF COMPONENTS
B.1. Heat capacities:
(B-1)
P =
RTG
VG − b--------------- −
aTVG VG + b( ) + b VG − b( )-------------------------------------------------------
b = yjbjj∑
bj = 0.07780RTcj
Pcj
----------
aT = yiyj aTiaTj( )1/2 1− δij( )j∑
i∑
aci = 0.45724R
2Tcj
2
Pcj
------------
αj
1/2 =1+ 0.37464 +1.54226ω j − 0.26992ω j
2( ) 1− Trj
1/2( )
φi = − z − B'( )ln + z −1( )B''iln
−
A'
21.5
B'------------- A''
i − B''
i( ) z + 21/2
+1( )B'
z − 21/2
−1( )B'
---------------------------------ln
A' =
aTP
R2T2
------------
B' =
bP
RT-------
B''i =
bi
b----
A''
j =
1
aT---- 2aTj
1/2yiaTi
1/21− δij( )
i∑⎝ ⎠
⎛ ⎞
Cp j/kmolk( ) = C1+ C2
C2/T k( )C3/T k( )( )sinh
---------------------------------⎝ ⎠⎛ ⎞
2
+ C4
C5/T k( )C5/T k( )( )cosh
----------------------------------⎝ ⎠⎛ ⎞
2
Table B.1. Values of heat capacities constants
Component C1×10−5 C2×10−5 C3×10−3 C4×10−5 C5 Tmin (k) Tmax (k)
Methane 0.3330 0.7993 2.0869 0.4160 −991.96 050 1500.00
Ethane 0.4033 1.3422 1.6555 0.7322 −752.87 200 1500.00
Propane 0.5192 1.9245 1.6265 1.1680 −723.60 200 1500.00
n-Butane 0.7134 2.4300 1.6300 1.5033 −730.42 200 1500.00
i-Butane 0.6549 2.4776 1.5870 1.5750 −706.99 200 1500.00
n-Pentane 0.8805 3.0110 1.6502 1.8920 −747.60 200 1500.00
i- Pentane 0.7460 3.2650 1.5450 1.9230 −666.70 200 1500.00
n-Hexane 1.0440 3.5230 1.6946 2.3690 −761.60 200 1500.00
Water 0.3336 0.2679 2.6105 0.0890 1169.00 100 2273.15

1858 S. H. R. Shooshtari and A. Shahsavand
October, 2014
B.2. Critical constants and Acentric factors: B.3. Latent heats:
B.3.1. Hydrocarbons latent heats:
(B-2)
(B-3)
B.3.2. Water latent heat:
248k<T<313k (B-4)
Hfg j/kmol( ) = C1 1− Tr( )C2+C3 Tr+C4× Tr Tr×××
Tr =
T
Tc
-----
Hfg j/kmol( ) = −1.08T k( )3 + 913.8T k( )2
− 3 105T k( ) + 8.078 10
7××
Table B.2. Values of heat critical constants and acentric factors
Component Tc (k) Pc×10−6 (Pa) Acentric factor
Methane 190.564 04.59 0.011
Ethane 305.32 04.85 0.098
Propane 369.83 04.21 0.149
n-Butane 425.12 03.77 0.197
i-Butane 408.14 03.62 0.177
n-Pentane 469.70 03.36 0.251
i- Pentane 460.43 03.37 0.226
n-Hexane 507.60 03.04 0.304
Water 647.13 21.94 0.343
Table B.3. Values of latent heats constants
Component C1×10−7 C2 C3 C4 Tmin (k) Tmax (k)
Methane 1.0194 0.26087 −0.14694 0.22154 090.69 190.56
Ethane 2.1091 0.60646 −0.55492 0.32799 090.35 305.32
Propane 2.9209 0.78237 −0.77319 0.39246 085.47 369.83
n-Butane 3.6238 0.83370 −0.82274 0.39613 134.86 425.12
i-Butane 3.1667 0.38550 0.0000 0 113.54 408.14
n-Pentane 3.9109 0.38681 0.0000 0 143.42 469.70
i- Pentane 3.7700 0.39520 0.0000 0 113.25 460.43
n-Hexane 4.4544 0.39002 0.0000 0 177.83 507.60