Embed Size (px)
Citation preview

Yousif : Prediction Of Ultimate Load Capacity Of High-Strength Reinforced Concrete
12
Prediction Of Ultimate Load CapacityOf High-Strength Reinforced Concrete Corbels
Ali Ramadhan YousifAssist. Professor
Civil Engineering Department/College of Engineering/university of Salahaddin-Erbil/Iraq
AbstractA study on the behavior of reinforced high-strength concrete corbels is carried out
using nonlinear finite element analysis and a simplified softened strut-and-tie model. In thenumerical analysis, eight-node isoparametric plane stress elements are employed to model theconcrete material. An elastic-strain hardening plasticity approach combined with crackingdamage is used in modeling the concrete behavior. The reinforcing bars are treated asembedded elements and are considered as elastic-perfectly plastic material. In the analyticalmethod, the analysis is based on truss analogy following the provisions of Appendix A of theACI 318-05 Code. Strength predictions of both methods correlate well with the 34 test resultsof corbels available from the literature. It was concluded that the adopted finite elementmodel is a powerful tool for the analysis of such disturbed region. Also the simple trussmodel used proved to be a suitable design tool for these members. The finite element methodcan be used in conjunction with the truss analogy for optimum design.
Keywords: corbels; deep beams; finite element; non-flexural members; plasticity; shearstrength; strut-and-tie models.
-
// -/
.-
.-.
A ACI 318-05 . .
. .
.
Received 12 March 2007 Accepted 15 Oct. 2008

Al-Rafidain Engineering Vol.17 No.4 August 2009
13
IntroductionCorbels are brackets that project from the face of columns and are used extensively in
precast concrete construction to support primary beams and girders. Because of theprevalence of precast concrete, the design of corbels has become increasingly important. Theterm “corbel” is generally restricted to cantilevers having shear span-depth ratio less thanunity. Such a small ratio causes the strength of corbels to often be controlled by shear, whichis similar to deep beams.
Corbels are designed mainly to provide the vertical reaction Vu at the end of asupported beam, but unless special precautions are taken to avoid horizontal forces caused byrestrained shrinkage, creep (in the case of prestressed beams), or temperature change, theymust also resist a horizontal force Hu. Steel bearing plates or angles are generally used on thetop surface of the corbels to provide a uniform contact surface and to distribute the reaction.A corresponding steel bearing plate or angle is usually provided at the lower corner of thesupported member. Even with Teflon or elastomeric bearing pads, frictional forces willdevelop due to volumetric change.
In tests, corbels display several modes of failure, the most common of which areyielding of the tension reinforcement, crushing or splitting of the compression strut thatdevelops between the loading plate and the junction of the column and the sloping face of thecorbel, and localized bearing or shearing failure under the loading plate. Typically,reinforcement for the corbel has consisted of primary tension steel, horizontal hoops, andframing bars.
The researchers who conducted experimental studies using normal-strength concrete[1-6] concluded that the shear strength is a function of: (1) Shear-span-to-depth ratio; (2)reinforcement ratio; (3) concrete strength; and (4) the ratio of the horizontal to verticalcomponents of the applied loads. A minimum amount of horizontal stirrup reinforcementmust be provided to avoid diagonal tension failure. It was also reported that in most cases theprimary reinforcement steel yielded before failure. Based on these results, shear-span-to-depth(a/d) and reinforcement ratios were chosen as the primary variables.
Increase in concrete strength can be expected to increase the shear strength of thecorbel. However, since high-strength concrete is typically more brittle than normal-strengthconcrete, it should be ascertained that higher strength can be used without leading tocatastrophic brittle failure. Yielding of steel reinforcement prior to failure and extensivecracking typically lead to ductile failure.
The researchers who conducted experimental studies using high-strength concrete [7-10] concluded that the behavior of high-strength concrete corbels is similar to that of normal-strength concrete corbels, and that the increase in concrete strength does not adversely affectthe ductility of the corbel provided that a nominal amount of stirrup reinforcement is used.
Research SignificanceWhile a considerable amount of research has been performed on corbels in general,
little exists in conjunction with high-strength concrete. This paper presents numerical andanalytical investigations of the ultimate load capacity of corbels made of high-strengthconcrete. Different parameters such as shear-span-to-depth ratio, primary reinforcement ratio,secondary reinforcement ratio, and concrete compressive strength have been studied. Thestudy shows that the finite element method is a suitable tool for the analysis of high-strengthconcrete corbels, and that the strut-and-tie model is a simple and effective design tool for suchdisturbed member.

Yousif : Prediction Of Ultimate Load Capacity Of High-Strength Reinforced Concrete
14
Analysis Methods
1-Numerical AnalysisNonlinear analysis is a very powerful tool that satisfies, at every load stage,
displacement compatibility and equilibrium. From the constitutive laws for concrete and steel,the complete behavior of a structure can be predicted until collapse. However, such analysiswill generally require extensive use of computer procedures and enormous amount of data,which in general, is not compatible with practicability and time demands. Nonlinear analysisrequires also the initial definition of geometry and reinforcement. Therefore it should beregarded as an almost accurate tool to verify the safety of a structure for both service andultimate loads. A brief description of the nonlinear finite element model used in this study forthe analysis of corbels (disturbed region) made of high-strength concrete is presented here.
Model DescriptionDescription of the highly complex behavior of concrete is a difficult task and to date
generally accepted constitutive equations do not exist. A variety of models have beenproposed to characterize the stress-strain relations and failure behavior of concrete materialunder multi-axial stress states [11]. All these models have certain inherent advantages ordisadvantages, which depend to a large degree, on the particular application considered [12].Details of the approach adopted here are given in Ref. [12] and only a brief summary isprovided here.
Experimental evidence indicates that the stress-strain relationship for concrete isnonlinear even for low stress levels. The inelastic deformation may be separated intorecoverable and irrecoverable components. In the present model, elasticity theory is used forthe recoverable strain components and a strain-hardening plasticity approach is employed tomodel the irrecoverable parts of the deformation.
Compressive Behavior of ConcreteFour conditions have to be established to be able to evaluate the nonlinear
compressive behavior of concrete, these are: the yield condition, the flow rule, the hardeningrule, and the crushing condition.
(a) The yield condition:Under a triaxial stress state the yield criterion for concrete is generally assumed to be
dependent on the three stress invariants (I1, J2, J3). A dependence of the yield function on themean normal stress invariant I1 and the shear stress invariant J2, has proved to be adequate formost practical applications [12]. The yield criterion adopted here is of such type [12], and canbe written as:
f(I1,J2)={ (3J2) + I1}½ = 0 --------------------------------------------- ( 1 )
where and are two material parameters and 0 is the equivalent effective stress. For planestress problems, I1 and J2 are given by [11]:I1 = x+ y ; J2 = 1/3 { 2
x+ 2y - x y} + 2
xyIf Kupfer’s [13] results are employed (fbc = 1.16 f c ), the material constants for plain concreteare: = 0.355 0 ; = 1.355This resulting yield criterion compared well with the experimental results of Kupfer et al. [13]in biaxial stress space [12,14].
Al-Rafidain Engineering Vol.17 No.4 August 2009
15
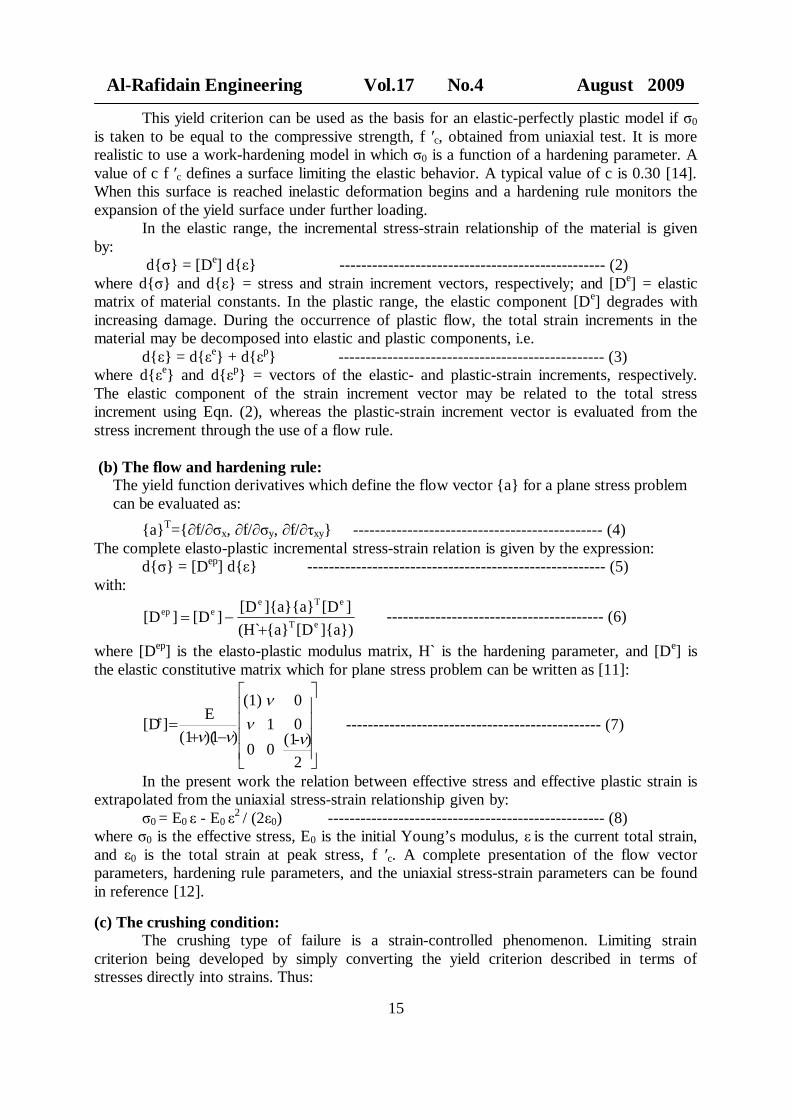
This yield criterion can be used as the basis for an elastic-perfectly plastic model if 0is taken to be equal to the compressive strength, f c, obtained from uniaxial test. It is morerealistic to use a work-hardening model in which 0 is a function of a hardening parameter. Avalue of c f c defines a surface limiting the elastic behavior. A typical value of c is 0.30 [14].When this surface is reached inelastic deformation begins and a hardening rule monitors theexpansion of the yield surface under further loading.
In the elastic range, the incremental stress-strain relationship of the material is givenby:
d{ } = [De] d{ } ------------------------------------------------- (2)where d{ } and d{ } = stress and strain increment vectors, respectively; and [De] = elasticmatrix of material constants. In the plastic range, the elastic component [De] degrades withincreasing damage. During the occurrence of plastic flow, the total strain increments in thematerial may be decomposed into elastic and plastic components, i.e.
d{ } = d{ e} + d{ p} ------------------------------------------------- (3)where d{ e} and d{ p} = vectors of the elastic- and plastic-strain increments, respectively.The elastic component of the strain increment vector may be related to the total stressincrement using Eqn. (2), whereas the plastic-strain increment vector is evaluated from thestress increment through the use of a flow rule.
(b) The flow and hardening rule:The yield function derivatives which define the flow vector {a} for a plane stress problemcan be evaluated as:
{a}T={ f/ x, f/ y, f/ xy} ---------------------------------------------- (4)The complete elasto-plastic incremental stress-strain relation is given by the expression:
d{ } = [Dep] d{ } ------------------------------------------------------- (5)with:
]{a})[D{a}(H`][D]{a}{a}[D][D][D eT
eTeeep ---------------------------------------- (6)
where [Dep] is the elasto-plastic modulus matrix, H` is the hardening parameter, and [De] isthe elastic constitutive matrix which for plane stress problem can be written as [11]:
2)-(100
010(1)
)1)((1E][De ----------------------------------------------- (7)
In the present work the relation between effective stress and effective plastic strain isextrapolated from the uniaxial stress-strain relationship given by:
0 = E0 - E02 / (2 0) --------------------------------------------------- (8)
where 0 is the effective stress, E0 is the initial Young’s modulus, is the current total strain,and 0 is the total strain at peak stress, f c. A complete presentation of the flow vectorparameters, hardening rule parameters, and the uniaxial stress-strain parameters can be foundin reference [12].
(c) The crushing condition:The crushing type of failure is a strain-controlled phenomenon. Limiting strain
criterion being developed by simply converting the yield criterion described in terms ofstresses directly into strains. Thus:
Yousif : Prediction Of Ultimate Load Capacity Of High-Strength Reinforced Concrete
16
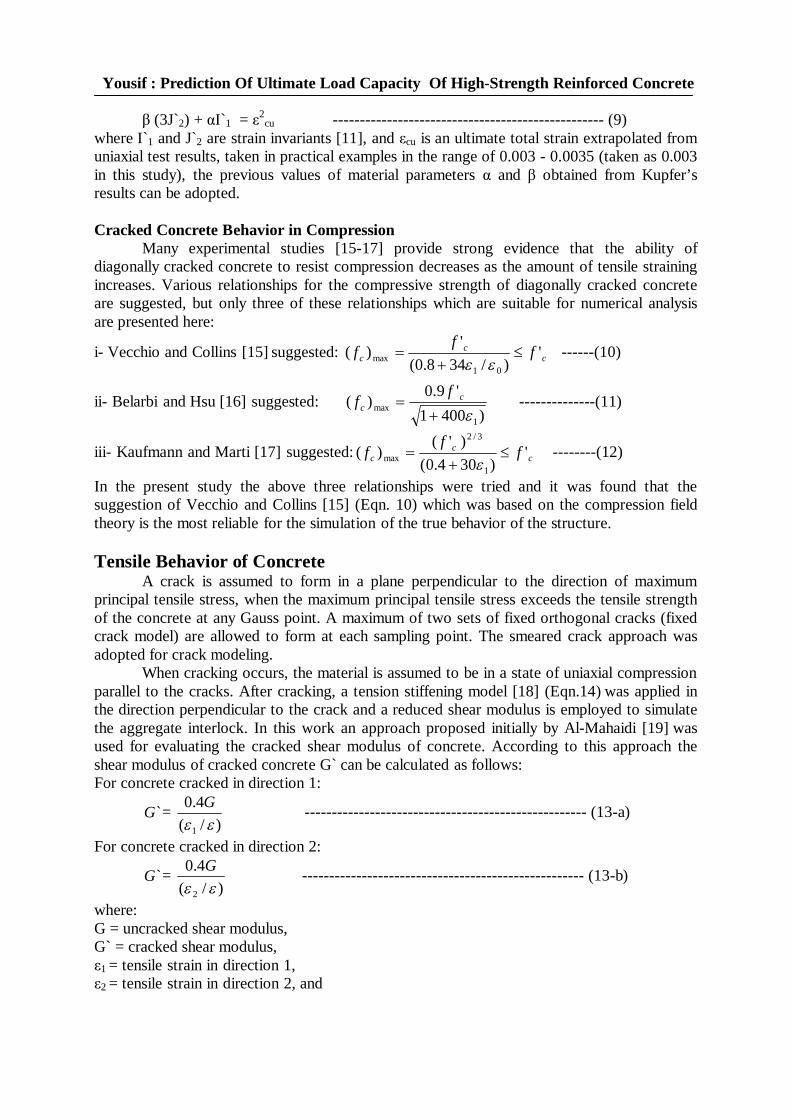
(3J`2) + I`1 = 2cu -------------------------------------------------- (9)
where I`1 and J`2 are strain invariants [11], and cu is an ultimate total strain extrapolated fromuniaxial test results, taken in practical examples in the range of 0.003 - 0.0035 (taken as 0.003in this study), the previous values of material parameters and obtained from Kupfer’sresults can be adopted.
Cracked Concrete Behavior in CompressionMany experimental studies [15-17] provide strong evidence that the ability of
diagonally cracked concrete to resist compression decreases as the amount of tensile strainingincreases. Various relationships for the compressive strength of diagonally cracked concreteare suggested, but only three of these relationships which are suitable for numerical analysisare presented here:
i- Vecchio and Collins [15] suggested: cc
c fff ')/348.0(
')(
01max ------(10)
ii- Belarbi and Hsu [16] suggested:)4001
'9.0)(
1max
cc
ff --------------(11)
iii- Kaufmann and Marti [17] suggested: cc
c ff
f ')304.0(
)'()(
1
3/2
max --------(12)
In the present study the above three relationships were tried and it was found that thesuggestion of Vecchio and Collins [15] (Eqn. 10) which was based on the compression fieldtheory is the most reliable for the simulation of the true behavior of the structure.
Tensile Behavior of ConcreteA crack is assumed to form in a plane perpendicular to the direction of maximum
principal tensile stress, when the maximum principal tensile stress exceeds the tensile strengthof the concrete at any Gauss point. A maximum of two sets of fixed orthogonal cracks (fixedcrack model) are allowed to form at each sampling point. The smeared crack approach wasadopted for crack modeling.
When cracking occurs, the material is assumed to be in a state of uniaxial compressionparallel to the cracks. After cracking, a tension stiffening model [18] (Eqn.14) was applied inthe direction perpendicular to the crack and a reduced shear modulus is employed to simulatethe aggregate interlock. In this work an approach proposed initially by Al-Mahaidi [19] wasused for evaluating the cracked shear modulus of concrete. According to this approach theshear modulus of cracked concrete G` can be calculated as follows:For concrete cracked in direction 1:
`G =)/(
4.0
1
G ---------------------------------------------------- (13-a)
For concrete cracked in direction 2:
`G =)/(
4.0
2
G ---------------------------------------------------- (13-b)
where:G = uncracked shear modulus,G` = cracked shear modulus,
1 = tensile strain in direction 1,2 = tensile strain in direction 2, and
Al-Rafidain Engineering Vol.17 No.4 August 2009
17
= cracking strain of plain concrete. If the strain normal to the crack drops to a negative value(compression case), i.e. the crack is closed, the uncracked shear modulus is again used in thecorresponding direction.
For plain concrete, the relationship between stress and strain after cracking was givenby [18]:
i = f ̀ t{( i – m) / ( t – m)}2 ----------------------------------------------- (14)where:f `t = the tensile strength of concrete, MPa, and equal to 0.3 (f c)2/3 [20] when the tensilestrength of concrete is not specified,
t = the tensile strain at maximum tensile stress, mm/mm,m = the maximum tensile strain, mm/mm,
m = {3Gc / (hf t)} + t ---------------------------------------------------- (15)
Gc = the fracture energy of plain concrete, N/m, and equal to ad fcu0.7 [20],
ad = a factor reflecting the influence of maximum aggregate size, dmax:
ad = 6 for dmax=16 mm, 10 for dmax= 32 mm, (ad = 6 in this study), and
fcu = concrete cube compressive strength, MPa.
Finite Element FormulationEight-node serendipity plane stress elements are used in this study. This isoparametric
element has been proved to simulate the structural behavior successfully and gives reasonableresults. Its formulation can be found elsewhere [21]. A 2x2 Gauss point integration rule(reduced rule) was found to give more accurate results than the full (3x3) integration rule forthis type of structure. The smeared crack approach with two orthogonal cracks (fixed crackingmodel) was used for crack representation.
The reinforcing bars are represented as embedded bars anywhere within the concreteelements with elastic-perfectly plastic behavior. Perfect bond was assumed between thereinforcement and the surrounding concrete. This type of representation allows thereinforcement to be treated as an integral part of the basic element, and its stiffnesscontribution can be evaluated by the principles of superposition. The computer program usedis that of reference [18] (where applied to fibrous concrete) with little modifications toaccount for non-fibrous high-strength concrete.
For the purposes of brevity, a typical finite element mesh, loading, and supportconditions are shown for a half (due to symmetry) of corbel PF2 in Fig. 1. The modifiedNewton-Raphson method with incremental-iterative procedure was used in the numericalanalysis. Table 1 and Fig. 2 give details of the test specimens.
Comparisons of the results (crack patterns, deflection, main steel strain, and ultimateloads) obtained from the numerical analysis with those obtained from experiments for anumber of typical specimens are shown in Figs. (3-8). The figures show reasonableagreements.
During the tests of some corbels (corbels: E1, E2, and E3), relatively thin plates (6mm thick) were used at the supports. The results of the numerical analysis showed that morereliable results can be obtained if the supports were simulated (the fact which was recognizedby other researchers [18,22]) by applying a portion of the load (in this study 0.11 of theapplied load) at the two corners of the bearing plates in the reverse direction. While thesimulation at the loading point was as shown in Fig. 1.

Yousif : Prediction Of Ultimate Load Capacity Of High-Strength Reinforced Concrete
18
(a) Experimental
The results of the analysis in terms of Vtest / Vcalculated are shown in Table 2. It can beseen that the adopted finite element model predicts the load capacity of the corbels very well,and that this is a powerful technique for investigating such disturbed regions.
Fig.(1)- Finite element mesh and layout of steel bars for corbel PF2
Fig.(2)- Details of test specimens
Fig.(3)- Crack pattern for coreFig.(3)- Crack pattern for corbel PF2 at failure

Al-Rafidain Engineering Vol.17 No.4 August 2009
19
Yousif : Prediction Of Ultimate Load Capacity Of High-Strength Reinforced Concrete
20
2-Strut-and-Tie Model (Truss Analogy)Strut-and-tie models are most appropriately used for the design of disturbed regions,
or D regions. These D regions are characterized by a complex flow of internal stresses andinclude regions adjacent to discontinuities caused by abrupt changes of cross section or thepresence of concentrated loads or reactions (corbels, deep beams, dapped-end beams, andanchorage zones at the end of prestressed beams). In the design of these disturbed regions, itis inappropriate to assume that plane sections remain plane or that the shear stress is uniformover the depth of the member, therefore the standard design rules for flexure and shear do notapply. The structural damage as reported by Reineck [23] and Fung and Ing [24], has shownthat it is unsatisfactory to rely on empirical approaches and rule of thumb for the design ofsuch important regions. It was found [25-31] that the use of reasonable strut-and-tie models issuitable for the design of such regions. ACI 318-02 and later codes [32] permitted the use ofstrut-and-tie models for the design of discontinuity regions.
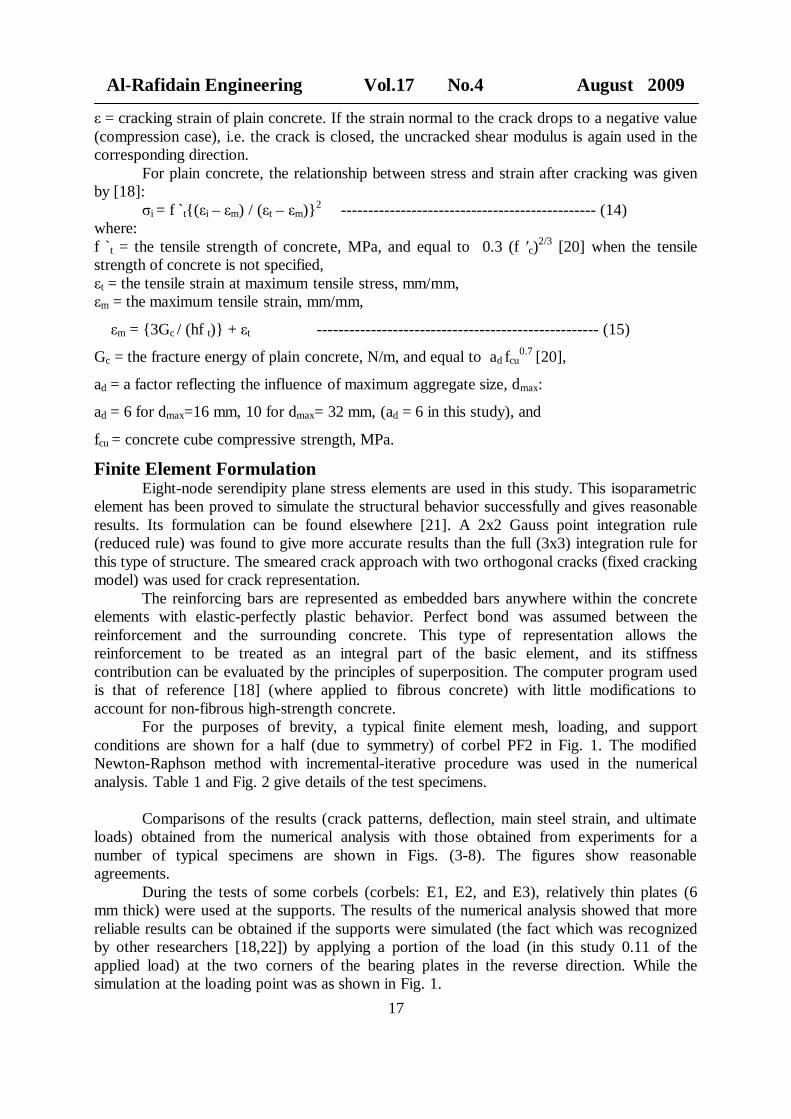
In this study a simple strut-and-tie model was used for the prediction of the maximumload capacity of high-strength reinforced concrete corbels. The plastic truss model, shown inFig. 9, consists of prismatic compression struts in uniaxial compression with a uniformdistribution of stress across the struts and a tension tie. The strut width ws is defined by thegeometry of the nodes [32] (see Fig. 9b):
Fig.(9)- Simulation of a corbel by a strut –and-tie model
At top: wst = wb sin + wt cos ----------(16-a)At bottom: wsb = w2 sin + w1 cos ----(16-b)
Where:wst = width of the inclined strut at the top node, mm,wsb = width of the inclined strut at the bottom node, mm,wb =width of the bearing plate at the support, mm,wt = width of the horizontal tie, mm,w2 = width of the vertical strut at the bottom node, mm,w1 = width of the horizontal strut at the bottom node, mm, and = inclination of the inclined strut (C3), degree.
This model is chosen due its simplicity. In this model, only two failure modes arepossible: failure by crushing of the concrete in the compression struts (usually the inclinedstrut) and failure by yielding of the tension tie. Other types of failure such as bearing and
Al-Rafidain Engineering Vol.17 No.4 August 2009
21
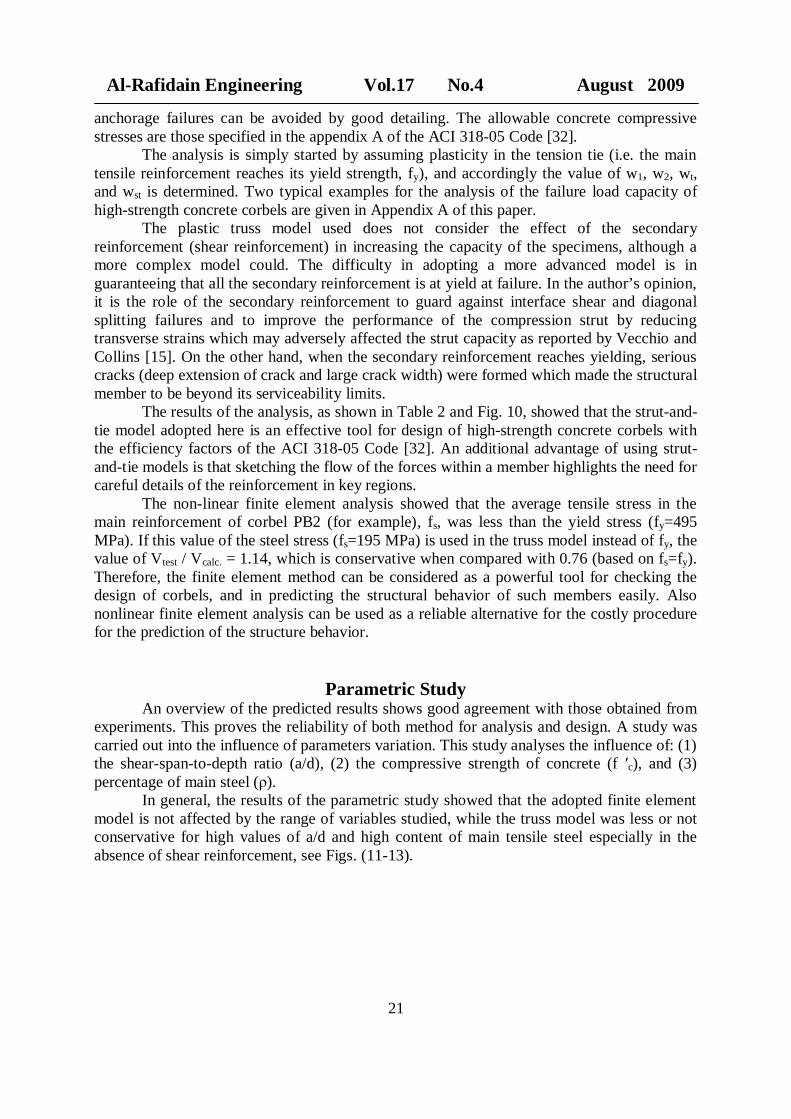
anchorage failures can be avoided by good detailing. The allowable concrete compressivestresses are those specified in the appendix A of the ACI 318-05 Code [32].
The analysis is simply started by assuming plasticity in the tension tie (i.e. the maintensile reinforcement reaches its yield strength, fy), and accordingly the value of w1, w2, wt,and wst is determined. Two typical examples for the analysis of the failure load capacity ofhigh-strength concrete corbels are given in Appendix A of this paper.
The plastic truss model used does not consider the effect of the secondaryreinforcement (shear reinforcement) in increasing the capacity of the specimens, although amore complex model could. The difficulty in adopting a more advanced model is inguaranteeing that all the secondary reinforcement is at yield at failure. In the author’s opinion,it is the role of the secondary reinforcement to guard against interface shear and diagonalsplitting failures and to improve the performance of the compression strut by reducingtransverse strains which may adversely affected the strut capacity as reported by Vecchio andCollins [15]. On the other hand, when the secondary reinforcement reaches yielding, seriouscracks (deep extension of crack and large crack width) were formed which made the structuralmember to be beyond its serviceability limits.
The results of the analysis, as shown in Table 2 and Fig. 10, showed that the strut-and-tie model adopted here is an effective tool for design of high-strength concrete corbels withthe efficiency factors of the ACI 318-05 Code [32]. An additional advantage of using strut-and-tie models is that sketching the flow of the forces within a member highlights the need forcareful details of the reinforcement in key regions.
The non-linear finite element analysis showed that the average tensile stress in themain reinforcement of corbel PB2 (for example), fs, was less than the yield stress (fy=495MPa). If this value of the steel stress (fs=195 MPa) is used in the truss model instead of fy, thevalue of Vtest / Vcalc. = 1.14, which is conservative when compared with 0.76 (based on fs=fy).Therefore, the finite element method can be considered as a powerful tool for checking thedesign of corbels, and in predicting the structural behavior of such members easily. Alsononlinear finite element analysis can be used as a reliable alternative for the costly procedurefor the prediction of the structure behavior.
Parametric StudyAn overview of the predicted results shows good agreement with those obtained from
experiments. This proves the reliability of both method for analysis and design. A study wascarried out into the influence of parameters variation. This study analyses the influence of: (1)the shear-span-to-depth ratio (a/d), (2) the compressive strength of concrete (f c), and (3)percentage of main steel ( ).
In general, the results of the parametric study showed that the adopted finite elementmodel is not affected by the range of variables studied, while the truss model was less or notconservative for high values of a/d and high content of main tensile steel especially in theabsence of shear reinforcement, see Figs. (11-13).

Yousif : Prediction Of Ultimate Load Capacity Of High-Strength Reinforced Concrete
22
ConclusionsBased on the available test results in the literature and their comparisons with the
numerical method (finite element) and analytical method (strut-and-tie model), the followingconclusions can be made:
1-The reinforced-concrete plasticity model combined with concrete cracking model, tensionstiffening, compression softening, and cracked concrete shear modulus proved to be asuitable model when used in the finite element method for the analysis of high-strengthreinforced concrete corbels.
2-The parametric study showed that the finite element model used is equally applicable forthe range of the variables studied, i.e. the results are not affected whether the variables havelow or high values. Therefore, it can be concluded that the method is a powerful tool for theanalysis of such disturbed region, and to assure the safety requirements for dangerouslocations. The numerical analysis is also helpful in constructing reasonable strut-and-tiemodels for these structures.
3-Strut-and-tie modeling provides the designer with a simple, yet powerful tool for the designof nonflexural reinforced concrete members. The flow of forces in such members isidealized as a truss consisting of concrete struts and steel reinforcement ties connected atnodes.
4-The results indicated that the proposed simple truss model is effective and gives reasonablepredictions of the failure load capacity of high-strength reinforced concrete corbels.

Al-Rafidain Engineering Vol.17 No.4 August 2009
23
5-Unlike the finite element model adopted, the strut-and-tie model was affected by the valuesof the variables. Also it was affected by absence or the presence of the web reinforcement.Conservative results were obtained when the corbel specimen contains web reinforcementand has low percentage of main reinforcement especially for low shear span-to-depth ratio.In general, the results are more or less conservative when the corbel contains highpercentage of main steel and without shear reinforcement; such corbels fail before the mainsteel reaches yielding. Therefore, a minimum amount of shear reinforcement, specified bythe codes of practice, should be provided when the design is performed by the truss analogy(strut-and-tie model).
Table 1- Details and dimensions of test specimens
Corb.No.
f 'c,
MPa
Dimensions, mm Mainreinforcement
Secondaryreinforcement
a c d* wbThick
t A fy,MPa B fy,
MPaRef.No. 8SC1-2 90.0 300 425 600 125 125 6 20 430 Nil ----SC1-3 90.0 300 425 600 125 125 6 12 430 12 6 420SC1-4 90.0 330 425 600 125 125 6 12 430 Nil ----SC2-1 62.0 300 425 600 125 125 6 20 430 12 6 420SC2-2 62.0 300 425 600 125 125 6 20 430 Nil ----SC2-3 62.0 300 425 600 125 125 6 12 430 12 6 420SC2-4 62.0 300 425 600 125 125 6 12 430 Nil ----SD1 95.0 300 425 600 100 125 6 20 430 12 6 420SD2 65.0 300 425 600 125 125 6 20 430 12 6 420PA1 53.0 300 400 500 100 150 6 20 450 Nil ----PA2 53.0 300 400 500 100 150 6 20 450 10 10 360PB1 105.0 300 400 500 100 150 6 28 495 Nil ----PB2 105.0 300 400 500 100 150 6 28 495 10 10 360PC1 53.0 150 300 500 100 150 6 12 420 Nil ----PC2 53.0 150 300 500 100 150 6 12 420 10 10 360PD2 71.0 200 300 500 100 150 3 28 450 10 10 360PE1 71.0 450 550 450 100 150 3 36 480 Nil ----PE2 71.0 450 550 450 100 150 3 36 480 10 10 360PF1 105.0 150 300 500 100 150 6 12 420 Nil ----PF2 105.0 150 300 500 100 150 6 12 420 10 10 360PG1 45.0 300 450 500 100 150 6 20 415 8 6 490PG2 94.0 300 450 500 100 150 6 20 415 8 6 490Ref.No. 7
E1 62.1 89 254 356 90 254 4 16 420 4 10 420E2 64.9 89 254 356 90 254 4 16 420 4 10 420
E3 79.5 89 254 356 90 254 2 25+ 1 18 420 8 10 420
F1 82.2 178 254 356 90 254 5 16 420 6 10 420F2 62.5 178 254 356 90 254 2 30 420 8 10 420
Ref.No. 9
C1 59.6 69 250 220 100 150 3 12 419 Nil ----C5 59.6 115 250 220 100 150 3 12 419 Nil ----C9 59.2 173 250 220 100 150 3 12 419 Nil ----C13 52.3 69 250 220 100 150 3 12 419 4 4 431C17 52.3 115 250 220 100 150 3 12 419 4 4 431C21 59.1 173 250 220 100 150 3 12 419 4 4 431C25 60.5 69 250 220 100 150 3 12 419 2 8 289C29 60.5 115 250 220 100 150 3 12 419 2 8 289C33 59.1 173 250 220 100 150 3 12 419 2 8 289
(h-d)=100 mm for corbels of Ref. 8; =50 mm for corbels of Ref. 7; =40 mm for corbels of Ref. 9.

Yousif : Prediction Of Ultimate Load Capacity Of High-Strength Reinforced Concrete
24
Table 2- Comparison of Experimental and Analytical Results
CorbelNo. a/d f 'c,
MPa bdA s
*100 Vtest ,KN
Vtest / Vcalc.
FEM Truss analogy
SC1-2 0.50 90.0 2.512 950.0 0.92 0.91SC1-3 0.50 90.0 0.904 700.0 1.00 1.34SC1-4 0.50 90.0 0.904 470.0 0.98 0.98SC2-1 0.50 62.0 2.512 980.0 1.11 1.19SC2-2 0.50 62.0 2.512 700.0 0.84 0.86SC2-3 0.50 62.0 0.904 580.0 0.95 1.16SC2-4 0.50 62.0 0.904 490.0 0.89 0.98SD1 0.50 95.0 2.512 1000.0 0.96 1.07SD2 0.50 65.0 2.512 1000.0 1.05 1.18PA1 0.60 53.0 2.512 550.0 0.95 0.75PA2 0.60 53.0 2.512 800.0 0.95 1.09PB1 0.60 105.0 4.920 1180.0 1.08 0.78PB2 0.60 105.0 4.920 1150.0 1.00 0.76PC1 0.30 53.0 0.904 650.0 0.98 1.16PD2 0.40 71.0 2.460 960.0 0.94 1.07PE1 1.00 71.0 4.534 680.0 1.00 0.72PE2 1.00 71.0 4.534 710.0 1.00 0.75PF1 0.30 105.0 0.904 750.0 1.02 1.04PF2 0.30 105.0 0.904 1050.0 1.00 1.35PG1 0.60 45.0 2.512 674.0 1.00 1.04PG2 0.60 94.0 2.512 1050.0 0.94 1.05E1 0.25 62.1 0.885 697.8 0.96 1.09E2 0.25 64.9 0.885 785.1 1.00 1.22E3 0.25 79.5 1.441 1057.7 0.95 1.05F2 0.50 62.5 1.813 828.7 0.94 0.99C1 0.31 59.6 1.145 403.9 1.11 1.13C5 0.52 59.6 1.145 273.1 1.02 1.08C9 0.78 59.2 1.145 196.0 0.95 1.09C13 0.31 52.3 1.145 420.0 1.11 1.21C17 0.52 52.3 1.145 286.4 0.98 1.16C21 0.78 59.1 1.145 210.7 0.94 1.17C25 0.31 60.5 1.145 490.1 1.17 1.36C29 0.52 60.5 1.145 308.1 1.01 1.22C33 0.78 59.1 1.145 218.0 0.94 1.22
Mean 0.99 1.065Standard Deviation 0.066 0.170
Coefficient of Variation (C.O.V.) 6.7 16.0 *As represents the area of main tensile steel
References1- Kriz, L. B., and Raths, C. H., " Connections in Precast Concrete Structures-Strength of
Corbels ", PCI Journal, Vol.10, No.1, February, 1965, pp. 16-61.2- Clark, J. L., " Behavior and Design of Small Continuous Corbels ", Technical Report
No.42-513, Cement and Concrete Association, Wexham Springs, March, 1976, 11 pp.3- Mattock, A. H., Cheng, K. C., and Soongswang, K., " The Behavior of Reinforced
Concrete Corbels ", PCI Journal, March-April, 1976, pp. 53-77.4- Futtuhi, N. I., " Corbels with Shear Reinforcement in the Form of Stirrups or Fibers ",
Proceeding, RILEM Symposium on Developments in Fiber Reinforced Cement andConcrete, University of Sheffield, July, 1986, Vol.2, Paper No.8.8.
5- Chakarbarti, P. R., Farahani, D. J., and Kashou, S. I., " Reinforced and PrecompressedConcrete Corbels-An Experimental Study ", ACI Structural Journal, Vol.86, No.4,July-August, 1989, pp. 405-412.
6- Futtuhi, N. I., and Hughes, B. P., " Ductility of Reinforced Concrete CorbelsContaining either Steel Fibers or Stirrups ", ACI Structural Journal, Vol.86, No.6,November-December, 1989, pp. 644-651.

Al-Rafidain Engineering Vol.17 No.4 August 2009
25
7- Yong, Y-K., and Balaguru, P., " Behavior of Reinforced High-Strength ConcreteCorbels ", Journal of Structural Engineering, ASCE, Vol.120, No.4, April, 1994, pp.1182-1201.
8- Foster, S. J., Powell, R. E., and Selim, H. S., " Performance of High-Strength ConcreteCorbels ", ACI Structural Journal, Vol.93, No.5, September-October, 1996, pp. 555-563.9- Muhammad, A. H., " Behavior and Strength of High-Strength Fiber Reinforced Concrete CorbelsSubjected to Monotonic or Cyclic Loading ", Ph.D. Thesis, University of Technology, Iraq, December,
1998.10- Othman, Z. S., " Shear Strength and Behavior of Reinforced High-Strength Concrete
Corbels ", M.Sc. Thesis, University of Salahaddin-Erbil, Iraq, September, 2005.11- Chen, W. F., " Plasticity in Reinforced Concrete ", McGraw-Hill Book Company,
1982.12- Figueiras, J. A., " Practical Approach for Modeling the Nonlinear Response of RC
Shells ", in Computational Modeling of Reinforced Concrete Structures, edited by E.Hinton and R. Owen, Pineridge Press Limited, Swansea, 1986, pp. 217-253.
13- Kupfer, H., Hilsdorf, H. K., and Rush, H., " Behavior of Concrete under BiaxialStresses ", ACI Journal, Vol.66, No.8, August, 1969, pp. 656-666.
14- Cervera, M., and Hinton, E., " Nonlinear Analysis of Reinforced Concrete Plates andShells Using a Three Dimensional Model ", in Computational Modeling of ReinforcedConcrete Structures, edited by E. Hinton and R. Owen, Pineridge Press Limited,Swansea, 1986, pp. 327-370.
15- Vecchio, F. J., and Collins, M. P., " The Modified Compression Field Theory forReinforced Concrete Elements Subjected to Shear ", ACI Journal, Vol.83, No.2,March-April, 1986, pp. 219–231.
16- Belarbi, A., and Hsu, T. T. C., " Constitutive Laws of Softened Concrete in BiaxialTension-Compression ", ACI Structural Journal, Vol.92, No.5, September-October,1995, pp. 562-573.
17- Kaufmann, W., and Marti, P., " Structural Concrete: Cracked Membrane Model ",Journal of the Structural Division, ASCE, Vol.124, No.12, December, 1998, pp. 1467–1475.
18- Abdul-Razzak, A. A., " Nonlinear Finite Element Analysis of Fibrous ReinforcedConcrete Structural Members ", Ph.D. Thesis, Mosul University, Iraq, 1996.
19- Al-Mahaidi, R. S. H., " Nonlinear Finite Element Analysis of Reinforced ConcreteDeep Members ", Ph.D. Thesis, Dept. of Structural Engineering, Cornell University,Ithaca, New York, May 1978.
20- Dong, Z., and Keru, W., " Fracture Properties of High-Strength Concrete ", Journalof Materials in Civil Engineering, ASCE, Vol.127, No.1, January-February, 2001, pp.86–88.
21- Hinton, E., and Owen, D. R. J., " Finite Element Programming ", Academic Press Inc.,3rd Printing, 1980.
22- Mahmood, M. N., " Nonlinear Finite Element Analysis of Reinforced Concrete DeepBeams ", M.Sc. Thesis, Mosul University, Iraq, September, 1986.
23- Reineck, K. H., " Rational Methods for Detailing and Design; Strut-and-Tie Modeling", Large Concrete Building, England, 1996.
24- Fung, I. K., and Ing, Y. L. M., " Strut-and-Tie Modes for the Design of StructuralConcrete ", Workshop, Tainan, 1996.
25- Schlaich, J., Schafer, K., and Jennewein, M., " Toward a Consistent Design ofStructural Concrete ", PCI Journal, Vol.32, No.3, May-June, 1987, pp. 74-150.

Yousif : Prediction Of Ultimate Load Capacity Of High-Strength Reinforced Concrete
26
26- Marti, P., " Basic Tools of Reinforced Concrete Beam Design ", ACI Journal, Vol.82,No.1, January-February, 1985, pp. 46-56.
27- Hwang, S-J., and Lee, H-J., " Strength Prediction for Discontinuity Regions bySoftened Strut-and-Tie Model ", Journal of Structural Engineering, ASCE, Vol.128,No.12, December, 2002, pp. 818–828.
28- Foster, S. J., " Design of Non-Flexural Members for Shear ", Cement and ConcreteComposites, Elsevier Science Ltd., 20, 1998, pp. 465-475.
29- Foster, S. J., and Gilbert, R. I., " The Design of Non-Flexural Members with Normaland High-Strength Concrete ", ACI Structural Journal, Vol.93, No.1, January-February,1996, pp. 3–10.
30- Hwang, S-J., Lu, W-Y., and Lee, H-J., " Shear Strength Prediction for ReinforcedConcrete Corbels ", ACI Structural Journal, Vol.97, No.4, July-August, 2000, pp. 543–552.
31- ACI Subcommittee 445-1, " Examples for the Design of Structural Concrete withStrut-and-Tie Models ", ACI SP-208, Edited by Karl-Heinz Reineck, AmericanConcrete Institute, Farmington Hills, M1, 2002.
32- ACI Committee 318, " Building Code Requirements for Structural Concrete and
Commentary ACI 318–05 ", American Concrete Institute, 2005.
Appendix A
Corbel PG2 – Vertical Load:f 'c=94 MPa; a=300 mm; d=500 mm; a/d=0.6; wb=100 mm; corbel thickness=150 mm;As=6 20; fy=415 MPa; Ah=8 6; Vtest=1050 kN.Based on Fig.9: T=As.fy=6(314)(415)x10-3=781.86 kN; C1=0.85ßn. f'c.w1.t ;C1=0.85(1.0)(94)(w1)(150)x10-3 = 11.985 w1 kN. Note: ßn = 1.0 for C-C-C node. Fx = 0
C1 = T w1 =65.2 mm; T = 0.85 ßn. f 'c .wt .t wt =81.54 mm ; Note: ßn = 0.80 for C-C-T node.C2 = 0.85 ßn. f 'c .w2 .t =0.85(1.0)(94)(w2)(150)x10-3 = 11.985 w2 kN.
M=0 at the upper node C1(d-w1/2)=C2(a+w2/2) w2=88.6 mm; =tan-1{(d-w1/2)/(a+w2/2)}=53.6 degree. At top: wst b sin + wt cos = 100 sin53.6 + 81.54cos53.6 =128.9 mm C3t=0.85(0.80)(94)(128.9)(150)x10-3 = 1235.9 kN.At bottom: wsb = w2 sin + w1 cos = 88.6 sin53.6 + 65.2 cos53.6 = 110 mmC3b = 0.85(1.0)(94)(110)(150)x10-3 = 1318.4 kN > 1235.9 C3 = 1235.9 kN.At the top node: Fx = 0 C3cos = T C3 = 1317.6 kN > 1235.9 kN C3 = 1235.9 kN.At the top node: Fy = 0 C3 sin = Vn Vn = 1235.9 sin53.6 = 994.8 kN;Vtest/Vcalc. =1050/994.8 = 1.05.
Corbel E1 – Vertical and Horizontal Loads:f 'c=62.1 MPa; a=89 mm; d=356 mm; a/d=0.25; wb=90 mm; corbel thickness=254 mm;As=800 mm2; fy=420 MPa; Ah=4 10; Ptest=711.6 kN.Based on Fig.9: T=As.fy=800(420)x10-3=336 kN; C1=0.85ßn.f'c.w1.t ;C1=0.85(1.0)(62.1)(w1)(254)x10-3 =13.407 w1 kN. Note: ßn=1.0 for C-C-C node. Fy=0 C2=Vn ; C2=0.85ßn. f 'c.w2.t ; C2=0.85(1.0)(62.1)(w2)(254)x10-3 =13.407 w2; Hn=0.2 Vn(specified in the test program); Hn=2.681w2 kN; Fx = 0 C1 = T-Hn 13.407 w1 = 336- 2.681 w2 ------- (1) ;
Al-Rafidain Engineering Vol.17 No.4 August 2009
27
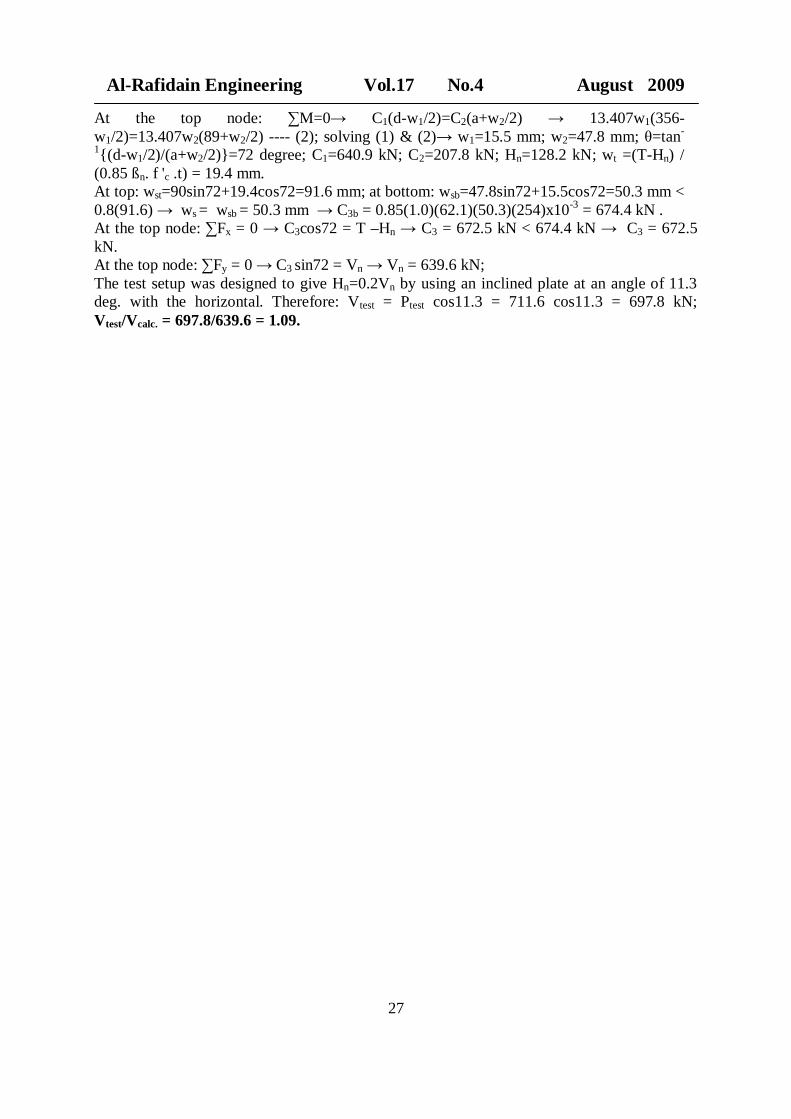
At the top node: M=0 C1(d-w1/2)=C2(a+w2/2) 13.407w1(356-w1/2)=13.407w2(89+w2/2) ---- (2); solving (1) & (2) w1=15.5 mm; w2=47.8 mm; =tan-
1{(d-w1/2)/(a+w2/2)}=72 degree; C1=640.9 kN; C2=207.8 kN; Hn=128.2 kN; wt =(T-Hn) /(0.85 ßn. f 'c .t) = 19.4 mm.At top: wst=90sin72+19.4cos72=91.6 mm; at bottom: wsb=47.8sin72+15.5cos72=50.3 mm <0.8(91.6) ws = wsb = 50.3 mm C3b = 0.85(1.0)(62.1)(50.3)(254)x10-3 = 674.4 kN .At the top node: Fx = 0 C3cos72 = T –Hn C3 = 672.5 kN < 674.4 kN C3 = 672.5kN.At the top node: Fy = 0 C3 sin72 = Vn Vn = 639.6 kN;The test setup was designed to give Hn=0.2Vn by using an inclined plate at an angle of 11.3deg. with the horizontal. Therefore: Vtest = Ptest cos11.3 = 711.6 cos11.3 = 697.8 kN;Vtest/Vcalc. = 697.8/639.6 = 1.09.


![[10] Buckling and Ultimate Strength](https://img.dokumen.tips/doc/110x75/577cdce11a28ab9e78aba484/10-buckling-and-ultimate-strength.jpg)


