Embed Size (px)
Citation preview
2010-08-26
1
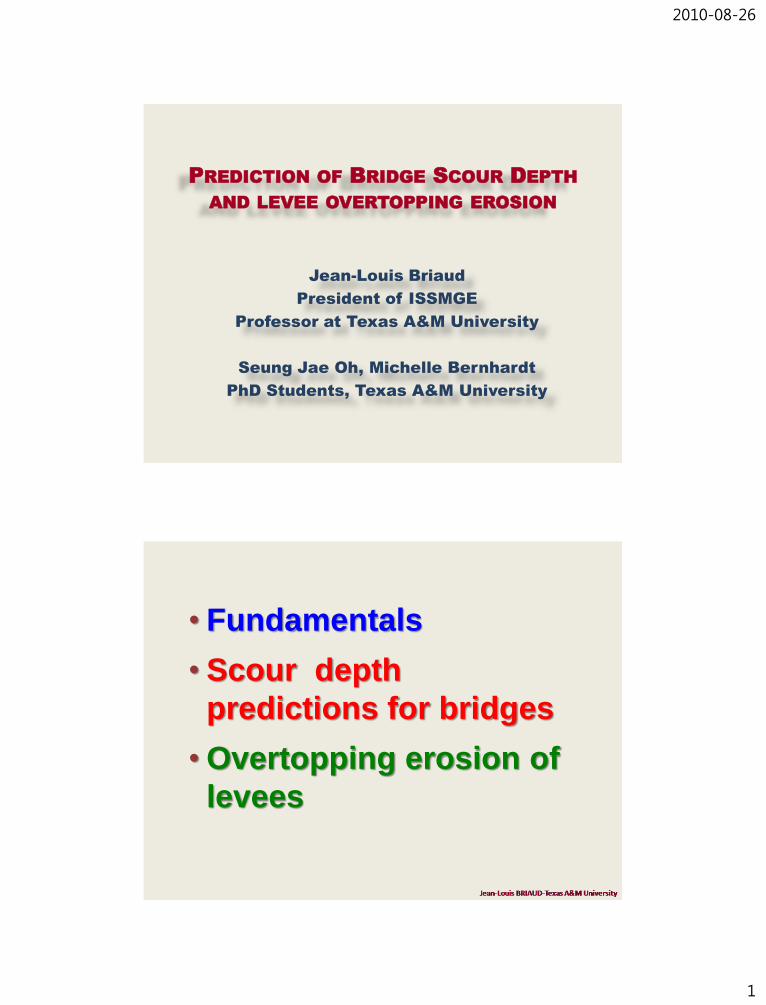
PREDICTION OF BRIDGE SCOUR DEPTH
AND LEVEE OVERTOPPING EROSION
Jean-Louis Briaud
President of ISSMGE
Professor at Texas A&M University
Seung Jae Oh, Michelle Bernhardt
PhD Students, Texas A&M University
• Fundamentals
• Scour depth
predictions for bridges
• Overtopping erosion of
levees

2010-08-26
2
Erosion process

2010-08-26
3
Erosion process
RANS Equations Continuity equation
Momentum (RANS) Equations
Energy Equation
0)U(t
m,
m
m,
i
n,
mn
m,
imimmnmi
mn
nm
lmn
ilim
m,
i
m,
mi
Ugpgg
Ueg2RUUt
U
uuUUgguuUU
Dt
DpKTgTuTU
t
TC
j
n
i
m
j
n
i
m
mn
ij
n
m
m
n
n
m
m
n
mn
mn
m
m
m
m
p
,,,,,,,,
,,,,

2010-08-26
4
Reynolds Stresses Transport Equations
• Production
• Diffusion by um
• Diffusion by p
• Viscous Diffusion
• Pressure-Strain
• Dissipation
ijijij
v
ij
p
ij
u
ijij
m,
mij
DDDPRUt
R
j
n,
i
m,
mnij
i
m,
jmj
m,
imij
ij
mn,
mnij
v
m,
jim
m,
ijmij
p
m,
jimij
u
injljnilm
lmn
i
m,
jmj
m,
imij
uug2
)ugug)(/'p(
RgD
)/ρ'pu(g)/ρ'pu(gD
)uuu(D
)RgRg(e2
)URUR(P
Two-Layer k- ModelOuter Layer (Fully Turbulent Region)
2b31
m,
n,tmn
m,
m
b
m,
n,
k
tmn
m,
m
CPCPCk
gUt
PPkgkUt
k
Inner Layer (Near-Wall Region)
AR1yC ;AR1yC
kC ;k
PPkgkUt
k
yy
t
3/2
b
m
n
k
tmn
m
m
/exp/exp
,
,,
Compute wall shear stress directly without wall function approximation

2010-08-26
5
222
b
cb
cbcb
cb
WVUq n
q
0
cZ
ZZ
;
,
,
),(
Scour Rate Equation

2010-08-26
6
CHEN 3D
Testing for erodibility (EFA)
EFA (Erosion Function Apparatus)

2010-08-26
7
Testing for erodibility (EFA)
Testing for erodibility (EFA)
Erosion function for a fine sand

2010-08-26
8
Testing for erodibility (EFA)
Erosion function for a low PI clay
Testing for erodibility (PET)
PET (Pocket Erodometer Test)

2010-08-26
9
Jean-Louis BRIAUD – Texas A&M University
17NIAGARA FALLS
11000 m of lateral erosion from Lake Ontario
towards Lake Erie in 12000 years or 0.1 mm/hr
From Google Earth
http://www.iaw.com/~falls/origins.html
http://www.samizdat.qc.ca/cosmos/origines/niagara/niagara.htm
Lake Erie
Lake Ontario
Niagara River
1841
1841
2006
Niagara Falls
Jean-Louis BRIAUD – Texas A&M University
18
GRAND CANYON
1600 m of vertical erosion by the Colorado River
in 10 Million years or 0.00002 mm/hr

2010-08-26
10
Jean-Louis BRIAUD – Texas A&M University
19
If your faucet drips on a pebble for 20 million years, will there be
a hole in the pebble?
Jean-Louis BRIAUD – Texas A&M University
20
EFA test on
Creamy Peanut Butter
Su = 1.8 kPa
Vc = 1.4 m/s
0.1
1
10
100
1000
10000
100000
0.1 1.0 10.0 100.0
Velocity (m/s)
Very High
Erodibility
I
High
Erodibility
II
Medium
Erodibility
III
Low
Erodibility
IV
Very Low
Erodibility
V
Erosion
Rate
(mm/hr)
0.1
1
10
100
1000
10000
100000
0 1 10 100 1000 10000 100000
Shear Stress (Pa)
Very High
Erodibility
I
High
Erodibility
IIMedium
Erodibility
IIILow
Erodibility
IV
Very Low
Erodibility
V
Erosion
Rate
(mm/hr)
2010-08-26
11
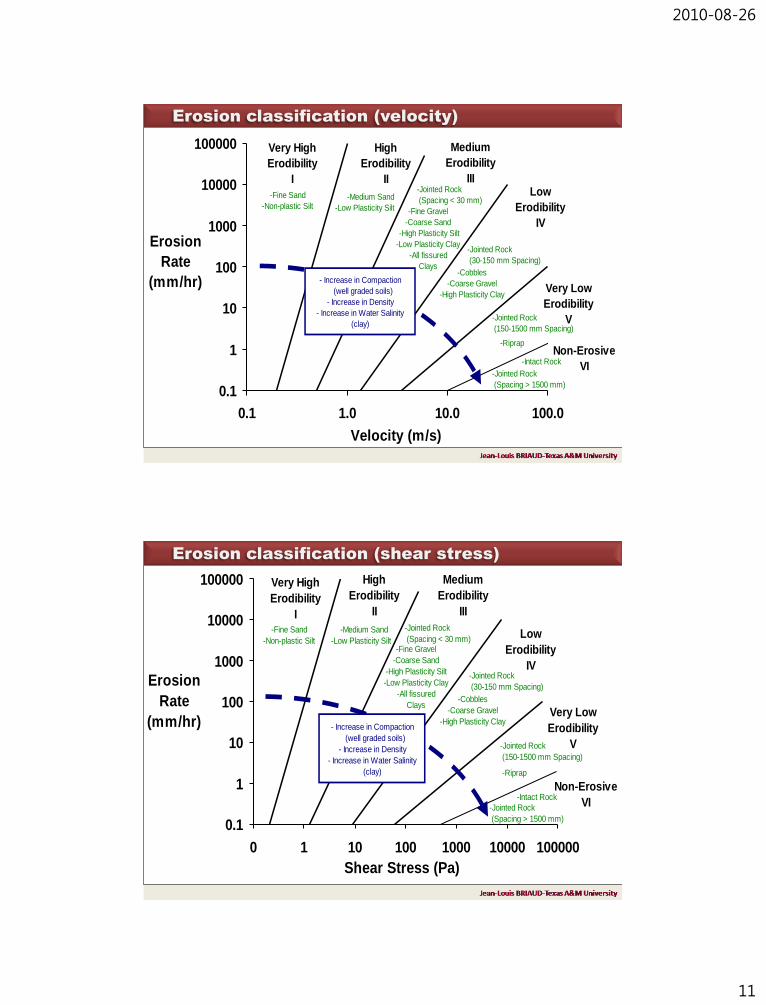
Erosion classification (velocity)
0.1
1
10
100
1000
10000
100000
0.1 1.0 10.0 100.0
Velocity (m/s)
Very High
Erodibility
I
High
Erodibility
II
Medium
Erodibility
IIILow
Erodibility
IV
Very Low
Erodibility
V
Erosion
Rate
(mm/hr)
-Fine Sand
-Non-plastic Silt -Medium Sand
-Low Plasticity Silt -Fine Gravel
-Coarse Sand
-High Plasticity Silt
-Low Plasticity Clay
-All fissured
Clays-Cobbles
-Coarse Gravel
-High Plasticity Clay
-Riprap
- Increase in Compaction
(well graded soils)
- Increase in Density
- Increase in Water Salinity
(clay)
Non-Erosive
VI-Intact Rock
-Jointed Rock
(Spacing < 30 mm)
-Jointed Rock
(30-150 mm Spacing)
-Jointed Rock
(150-1500 mm Spacing)
-Jointed Rock
(Spacing > 1500 mm)
Erosion classification (shear stress)
0.1
1
10
100
1000
10000
100000
0 1 10 100 1000 10000 100000
Shear Stress (Pa)
Very High
Erodibility
I
High
Erodibility
II
Medium
Erodibility
III
Low
Erodibility
IV
Very Low
Erodibility
V
Erosion
Rate
(mm/hr)
-Fine Sand
-Non-plastic Silt
-Medium Sand
-Low Plasticity Silt-Fine Gravel
-Coarse Sand
-High Plasticity Silt
-Low Plasticity Clay
-All fissured
Clays-Cobbles
-Coarse Gravel
-High Plasticity Clay
-Riprap
- Increase in Compaction
(well graded soils)
- Increase in Density
- Increase in Water Salinity
(clay)
Non-Erosive
VI-Intact Rock
-Jointed Rock
(Spacing < 30 mm)
-Jointed Rock
(30-150 mm Spacing)
-Jointed Rock
(150-1500 mm Spacing)
-Jointed Rock
(Spacing > 1500 mm)

2010-08-26
12
• Fundamentals
• Scour depth
predictions for bridges
• Overtopping erosion of
levees
Jean-Louis BRIAUD – Texas A&M University
24
60% of BRIDGE FAILURESARE DUE TO SCOUR
0
100
200
300
400
500
600
700
800
900
1000
Co
nstr
ucti
on
Co
ncre
te
Dete
rio
rati
on
Eart
hq
uake
Natu
ral
Ste
el
Fir
e
Mis
c.
Ov
erl
oa
d
Co
llis
ion
Hy
dra
uli
c
Cause
Nu
mb
er
of
Failu
res f
rom
1966 t
o 2
005 (
1502 T
ota
l)
0%
10%
20%
30%
40%
50%
60%
Perc
en
t

2010-08-26
13
Austin 2010-3-19
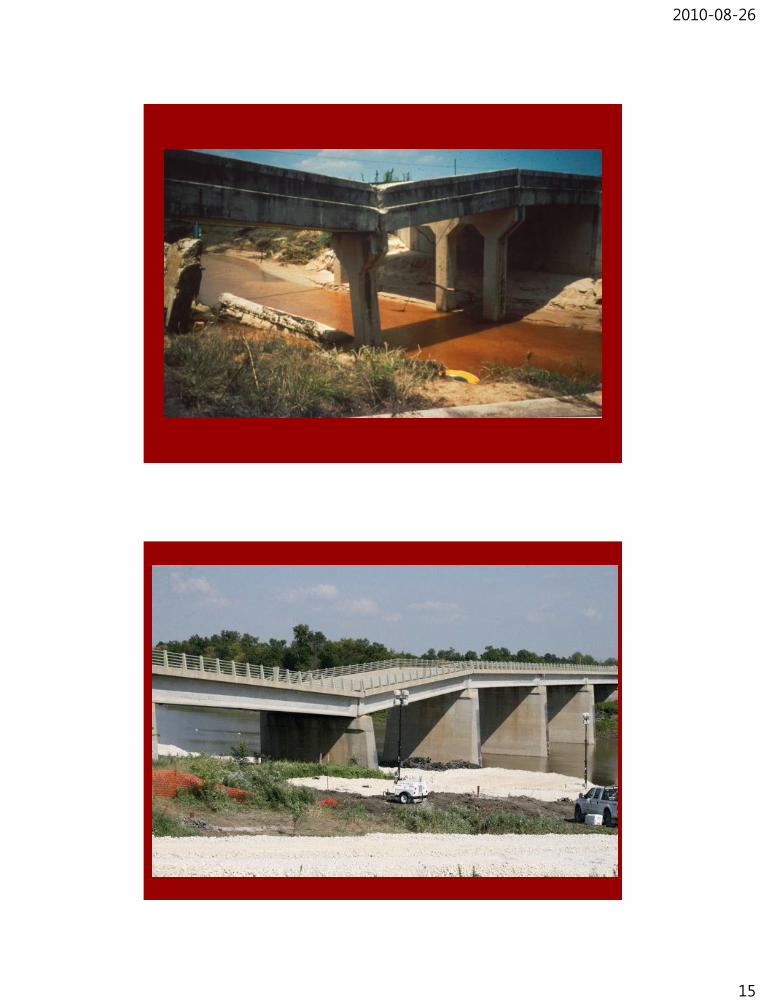
Observed failure modes of bridge due to scour
(based on failure photos in Briaud’s files)
25
Case 1 - Big Scour Hole
26% Observed Occurrence Case 2 – Settlement of Pier
32% Observed Occurrence
Case 3 - Loss of Deck
5% Observed Occurrence
Case 4 - Loss of Pier
37% Observed Occurrence
Courtesy of the University of Kentucky at Louisville

2010-08-26
14
2010-08-26
15

2010-08-26
16
Hatchie River Bridge, Tennessee

2010-08-26
17

2010-08-26
18

2010-08-26
19

2010-08-26
20
Austin 2010-3-19
Tie the two decks
with cables
40
Increase the support
length

2010-08-26
21
Scour types
Normal Water Level
Probable Flood Level
y s(Abut) Applies
is Abutment Scour Depth
is Contraction Scour Depth
is Pier Scour Depth
Where,
y s(Abut)
y s(pier)
y s(Cont) Applies
y s(Cont)
y s(Abut)
y s(Cont)
y s(pier)
CL
J.-L. Briaud, Texas A&M University
FOUNDATION DESIGN

2010-08-26
22
J.-L. Briaud, Texas A&M University
J.-L. Briaud, Texas A&M University

2010-08-26
23
J.-L. Briaud, Texas A&M University
J.-L. Briaud, Texas A&M University

2010-08-26
24
J.-L. Briaud, Texas A&M University
J.-L. Briaud, Texas A&M University

2010-08-26
25
J.-L. Briaud, Texas A&M University
J.-L. Briaud, Texas A&M University

2010-08-26
26
J.-L. Briaud, Texas A&M University
Maximum pier scour (Oh, 2009)
where,
0.7( )
1 ( ) ( )2.2 2.6'
s Pier
w spL pier c pier
yK K K K Fr Fr
a
0.33
1 10.89 , for 1.43' '
1.0 , else
w
y y
K a a
1
1.0 , for 30
Value in following Table , elseK
1.0, for whole range of /LK L a
0.91
2.9 , for 3.42' '
1.0 , else
sp
S S
K a a
Shape of pier nose Shape of pier nose
Square nose 1.1 Circular cylinder 1.0
Round nose 1.0 Sharp nose 0.9
1K1K

2010-08-26
27
Maximum pier scour (Oh, 2009)
y = 1.0003x + 0.0013R² = 0.8031
0
1
2
3
4
5
6
0 1 2 3 4 5 6
ys(pier)/a
2.2(2.6Fr(pier)-Frc(pier))0.7
y/a= 16 y/a = 6.4 y/a = 6.6 y/a=5.33 y/a = 3.4
y/a = 2.13 y/a = 2.0 y/a = 1.67 y/a = 1.43
Maximum and uniform contraction scour

2010-08-26
28
Jean-Louis Briaud – Texas A&M University
Jean-Louis Briaud – Texas A&M University
B2/B1 = 0.75

2010-08-26
29
Jean-Louis Briaud – Texas A&M University
B2/B1 = 0.5
Jean-Louis Briaud – Texas A&M University
B2/B1 = 0.25

2010-08-26
30
y = 0.9985x - 0.0011R² = 0.9502
0
0.5
1
1.5
2
2.5
0 0.5 1 1.5 2 2.5
ys(Cont)/y
m1
Li (Long contraction) (2002)
WW in rect.
Best Fit
21.27 1.83 m mcFr Fr
Maximum and uniform contraction scour (Oh, 2009)
( )
2
1
1.27 1.83s Cont
m mc
m
yFr Fr
y
Maximum abutment scour (Briaud et al. 2009)

2010-08-26
31
Maximum abutment scour (Briaud et al. 2009)
Maximum abutment scour (Briaud et al. 2009)

2010-08-26
32
Maximum abutment scour (Briaud et al. 2009)
Maximum abutment scour (Briaud et al. 2009)
y = 1.000xR² = 0.972
0
0.5
1
1.5
2
2.5
3
3.5
4
4.5
5
0 1 2 3 4 5
ys
(ab
ut)
/ y
f1
27.94 1.65 f fcFr Fr
( )
1 2 Re 2
1
7.94 1.65s Abut
L G f fc
f
yK K K K K Fr Fr
y
2010-08-26
33
0
10
20
30
40
50
60
0 50 100 150 200 250
Time(hr)
Sco
ur
Dep
th (
mm
)
Measurement
Hyperbola
iZ
Zmax
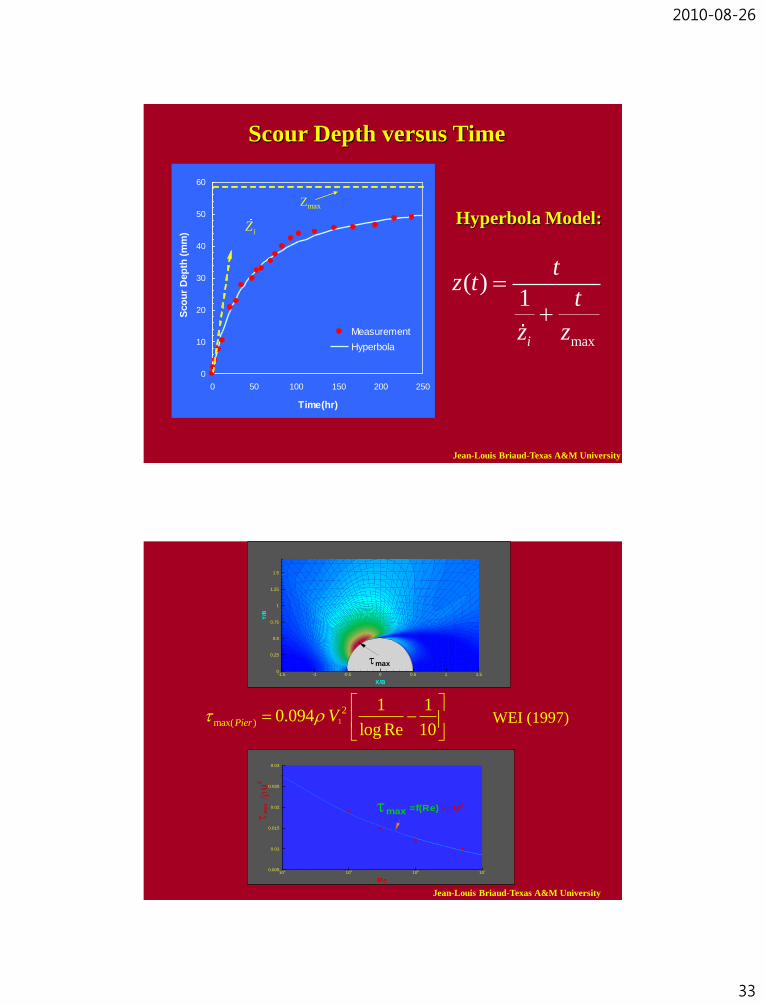
Hyperbola Model:
max
( )1
i
tz t
t
z z
Scour Depth versus Time
Jean-Louis Briaud-Texas A&M University
X/B
Y/B
-1.5 -1 -0.5 0 0.5 1 1.50
0.25
0.5
0.75
1
1.25
1.5
max
Re
104
105
106
1070.005
0.01
0.015
0.02
0.025
0.03
max =f(Re)
ma
x
U2
U
2
WEI (1997)
Jean-Louis Briaud-Texas A&M University
1
2
max( )
1 10.094
log Re 10Pier V

2010-08-26
34
Time dependent predictions
0
200
400
600
800
1000
0 10 20 30 40
(mm/hr)
z
(Pa)
3.9 Pac
max
iz
Jean-Louis Briaud-Texas A&M University

2010-08-26
35
Flood 1
V1
Flood 2
V2
t1 t2
V
Multi-flood System
Equivalent time te:
The time required for a flood
in the hydrograph to create
the same scour depth as the
one created by all previous
floods in the hydrograph.
Small flood followed
by big flood
Jean-Louis Briaud-Texas A&M University
Layer 1
Layer 2
Z1
Multi-layer System
Equivalent time te:
The time required for a flood
in the hydrograph to create
the same scour depth as the
one created by all previous
floods in the hydrograph.
V
Z2
Hard soil layer over
soft soil layer
Jean-Louis Briaud-Texas A&M University

2010-08-26
36
kR=contraction ratio factor
ka=transition angle factor
kWa=contraction length factor
kw=water depth factor (=1)
* kR, k, kL,kw are the correction factors for max
SRICOS-EFA Method
Pier Scour Contraction Scour
General Information
(Units, Analysis period)
General Information
(Units, Analysis period)
General Information
(Units, Analysis period)
GeometryPier Parameters: Dimensions, Spacing, Attack angle, etc.
GeometryAbutment Parameters: Dimensions, Shape, water depth,
channel configuration,etc.
GeometryChannel Information: Channel widths, Lengths,
Transition angle, etc.
WaterHydraulic Information: Hydro grapth, Manning value,
River hydraulic radius, Velocity, Water depth, etc.
1.5
1.0 0.990
a
2
0.77 1.36 1.98' '
a aW W
L L
( )
2( )
1
2.21 1.31s Cont
Cont mc
m
yFr Fr
y
1
2 2 3max( ) 1Cont R Wa w hk k k k n V Ra
2 0.45
max( ) 112.45 ReAbut Cr sh Fr s sk L ok k k k k k k V
* max Calculation Factors
kCr=conveyance ratio factor
ksh=aspect ratio factor
kFr=Froude number factor
ks=shape factor
ksk=skew angle factor(=1)
kL=abutment location factor
ko=overtoppting factor
* ys(Abut) Calculation Factors
K1=shape factor
K2=skew angle factor
KL=abutment location factor
Kp=pressure flow factor = ko
' '
1 1
0.37 1.55 , <1.5
1.0 , otherwise
f f
f f
L L L L
y y
1.22 for VW
1.0 for WW
0.73 for ST
2
1
3.65 2.91q
q
0.24'
0.85a
L
W
2.07 0.8 Fr>0.1
1.0 Fr 0.1
Fr
1.0 for VW
0.65 for WW and ST
Result
Abutment Scour
Result
1
2
max( )
1 10.094
log Re 10pier w sh spk k k k Va
Note:a: width of pier a’ : projected pier width a: contraction transition angle d1: distance from water surface to low chord of bridge deck Fr: Froude number (based on V1 and yf1)
Fr(pier): Froude number (based on V1 and a’’) Frc(pier): Froude number (based on Vc and a’’) Fr2(Cont): Froude number (based on V2 and ym1) Frmc: Froude number (based on Vmc
and ym1) Fr2(Abut): Froude number (based on Vf2 and yf1) Frfc: Froude number (based on Vfc and yf1) h: distance from low chord of bridge deck to toe of abutment
L: length of pier L’: length of abutment projected to normal to flow Lf: width of floodplain n: Manning’s coefficient : Attack angle q1: approach unit
discharge q2: unit discharge around the abutment : unit mass of water at 20C Rh: Hydraulic radius Re: Reynolds number (based on a or Wa) S: spacing of group pier
V1: approach average velocity Wa: width of bridge crest or length of channel contraction yf1: floodplain water depth before contractionfor open channel or h for pressure flow
ym1: main channel water depth before contraction ys(Pier): maximum pier scour depth ys(Cont): maximum contraction scour depth ys(Abut): maximum
abutment scour depth
0.7( )
1 ( ) ( )2.2 2.6'
s Pier
sp L w pier c pier
yK K K K Fr Fr
a
max Calculation Factors
ksh = shape factor
k = attack angle factor
kw = water depth fractor
ksp = spacing factor
* ys(Pier) Calculation Factors
K1 = shape factor
Kw = water depth factor
Ksp = spacing factor
KL = aspect ratio in rectangular pier (=1)
4
1.15 7L
ae
0.57
1 1.590
1.1
1 5S
ae
4
1 16y
ae
1.1 for rectangular nose
1.0 for round nose & cylinder
0.35
1 10.89 , for < 1.43' '
1.0 , for otherwise
y y
a a
0.91
2.9 , for < 3.2' '
1.0 , for otherwise
S S
a a
WaterHydraulic Information: Hydro graph, Manning’s n,
Velocity, Water depth, etc.
SoilInput EFA Curve
SoilInput EFA Curve
Result
WaterHydraulic Information: Hydro grapth, Manning value,
River hydraulic radius, Velocity, Water depth, etc.
SoilInput EFA Curve
1.75
2
1
0.62 0.38q
q
1 1
2
1 1 1
1
2.75 / 1, / 0.33
1.83 / 3.76 / 2.97, 0.33 / 1.0
1.0, 1.0 /
d h if d h
d h d h if d h
if d h
'
' '
' '
'
1.0 / 2
0.6( ) / 1.2 2 ( ) / 0
1.2( ) / 1.2 0 ( ) / 1
1.0 1 ( ) /
f f
f f f f
f f f f
f f
L L y
L L y L L y
L L y L L y
L L y
1.0 0.005 90 60 120
0.85
for
otherwise
( ) 0.28
1 2 2 2
1
243 Re 1.65s Abut
L G p f f fc
f
yK K K K K Fr Fr
y
http://ceprofs.tamu.edu/briaud/
Woodrow Wilson Bridge Hydrography
0
2000
4000
6000
8000
10000
12000
1960 1963 1966 1970 1973 1976 1979 1983 1986 1989 1992 1995 1999
Time (year)
Disc
harg
e (m
3 /sec)
Scour Depth Vs Time
0
1000
2000
3000
4000
5000
6000
7000
1960 1965 1970 1975 1980 1985 1990 1995
Time (year)
Scou
r Dep
th (m
m)
Jean-Louis Briaud-Texas A&M University

2010-08-26
37
Hydrograph (Add 500year flood)
0
3000
6000
9000
12000
15000
18000
1960 1970 1980 1990 2000
Time (Year)
Strea
mflo
w (m
3 /s)
Scour Depth Vs. Time (Add 500year flood)
0
2
4
6
8
10
12
1960 1970 1980 1990 2000
Time (Year)
Scou
r Dep
th (m
)
Jean-Louis Briaud-Texas A&M University
Q100 – Q500 APPROACH
d’
P(d’)
ds
P[d’>ds]

2010-08-26
38
0
2000
4000
6000
8000
10000
12000
1960 1970 1980 1990 2000S
trea
m f
low
(m
3/s
)
Time (Year)
0
1
2
3
4
5
6
7
8
9
1960 1970 1980 1990 2000
Scou
r Dep
th (m
)
Time (Year)
Flow vs. Time
Pier scour depth vs.
Time
What is the frequency of occurrence and probability of
exceedance for Q100 = 12,629 m3/s, Q500 = 16,639 m3/s , and Lt =
75 yrs?
Frequency of
Occurrence vs. Scour
Depth
Probability of
exceedance vs. Scour
Depth

2010-08-26
39
Jean-Louis BRIAUD – Texas A&M University
77
New
Woodrow Wilson
Bridge
Jean-Louis BRIAUD – Texas A&M University
78

2010-08-26
40
Jean-Louis BRIAUD – Texas A&M University
79
Bascule Pier Layout (M1)
Direction
of Flow
Pedestal
Arch Rib
39
.2 m
26.5 m
1.8 m Dia.
open ended
steel pipe pile
EL. 4 m (500 yr)
EL. 3 m (100 yr)
EL. 0.6 m (Ave.)
EL. -10.5 m (River Bottom)
Estimated Tip EL. -68.6 m
58.1
m5
.9 m
0
2000
4000
6000
8000
10000
12000
1960 1970 1980 1990 2000
Str
eam
flo
w (
m3/s
)
Time (Year)
0
1
2
3
4
5
6
7
8
9
1960 1970 1980 1990 2000
Scou
r Dep
th (m
)
Time (Year)
Flow vs. Time
Pier scour depth vs.
Time

2010-08-26
41
Jean-Louis BRIAUD – Texas A&M University
81
0.0
5.0
10.0
15.0
20.0
25.0
30.0
35.0
HEC-18
Sand
(Pile
Width)
HEC-18
Sand
(Pile
Cap)
Salim-
Jones
HEC-18
Clay
(Texas
A&M)
Erodibility
Index
Large
Scale
Flume
Test
Small
Scale
Flume
Test
Selected
Scour
Scour
Depth
(m
)
Comparison of Scour Predictions
Bascule Pier M1 (500yr Flood)
Jean-Louis BRIAUD – Texas A&M University
82
NOT TO SCALE
NEW BRIDGE WITH STRATIGRAPHY
TO SCALE

2010-08-26
42
Verification
• Maximum complex pier scour equation
0
1
10
100
0.1 1 10 100
Pre
dic
tio
n (
m)
Measurement (m)
Prediction vs. Froehlich’s pier scour
database (1988)
Prediction vs. Muller and Lander’s pier
scour database (1996)
0
1
2
3
4
5
6
7
8
9
10
0 1 2 3 4 5 6 7 8
Pre
dic
tio
n (m
)
Measurement (m)
Verification
• Uniform contraction scour
0
5
10
15
20
25
30
35
40
45
50
55
0 5 10 15 20 25 30 35 40 45 50 55
Pre
dic
ted
sco
ur
de
pth
by
Eq.(
7.7
)(m
m)
Measurement (mm)
Prediction vs. Gill’s uniform contraction scour
database (1981)
2010-08-26
43
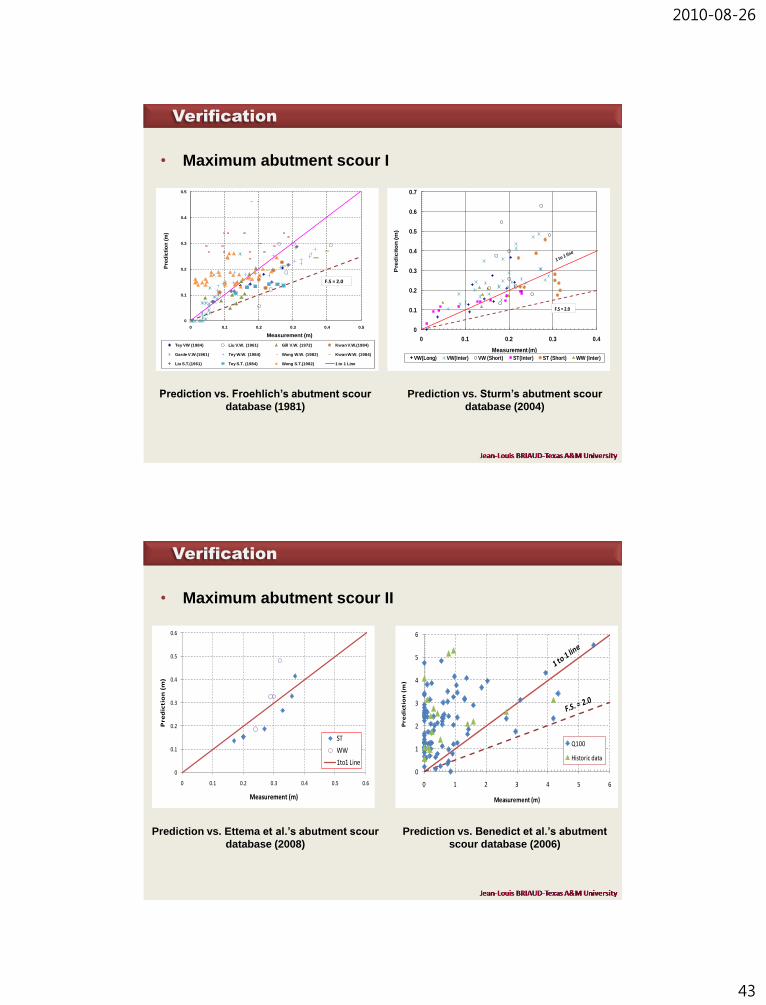
Verification
• Maximum abutment scour I
Prediction vs. Froehlich’s abutment scour
database (1981)
Prediction vs. Sturm’s abutment scour
database (2004)
0
0.1
0.2
0.3
0.4
0.5
0 0.1 0.2 0.3 0.4 0.5
Pre
dic
tio
n (
m)
Measurement (m)
Tey VW (1984) Liu V.W. (1961) Gill V.W. (1972) Kwan V.W.(1984)
Garde V.W.(1961) Tey W.W. (1984) Wong W.W. (1982) Kwan W.W. (1984)
Liu S.T.(1961) Tey S.T. (1984) Wong S.T.(1982) 1 to 1 Line
F.S = 2.0
0
0.1
0.2
0.3
0.4
0.5
0.6
0.7
0 0.1 0.2 0.3 0.4
Pre
dic
ito
n (m
)
Measurement (m)
VW(Long) VW(Inter) VW (Short) ST(Inter) ST (Short) WW (Inter)
F.S = 2.0
Verification
• Maximum abutment scour II
Prediction vs. Ettema et al.’s abutment scour
database (2008)
Prediction vs. Benedict et al.’s abutment
scour database (2006)
0
0.1
0.2
0.3
0.4
0.5
0.6
0 0.1 0.2 0.3 0.4 0.5 0.6
Pre
dic
tio
n (
m)
Measurement (m)
ST
WW
1to1 Line0
1
2
3
4
5
6
0 1 2 3 4 5 6
Pre
dic
tio
n (
m)
Measurement (m)
Q100
Historic data

2010-08-26
44
• Fundamentals
• Scour depth
predictions for bridges
• Overtopping erosion of
levees
Earthen Embankment Case
Overtopping Erosion
2010-08-26
45
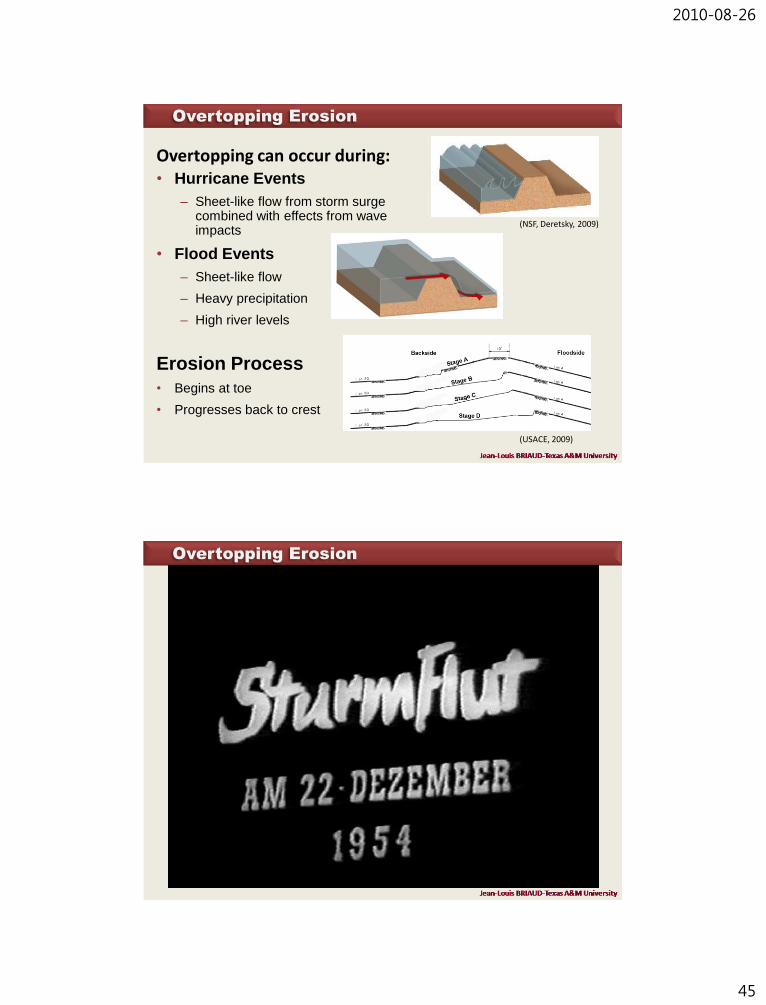
Overtopping Erosion
(NSF, Deretsky, 2009)
Overtopping can occur during:• Hurricane Events
– Sheet-like flow from storm surge combined with effects from wave impacts
• Flood Events
– Sheet-like flow
– Heavy precipitation
– High river levels
Erosion Process
• Begins at toe
• Progresses back to crest
(USACE, 2009)
Overtopping Erosion

2010-08-26
46
Overtopping Erosion
Overtopping During Hurricane Events
Hurricane Katrina
New Orleans, Louisiana
Overtopping Erosion
THE EVENT
• 250 miles in diameter
• 25 miles per hour
• 6000 wave cycles
• Storm surge 10 hours
• Duration over a bridge or levee = 10 hours

2010-08-26
47
Overtopping Erosion
Storm Surge
8.5 m
4.6 m
3.0 m
Overtopping Erosion
Storm Surge

2010-08-26
48
Overtopping Erosion
Overtopping Erosion

2010-08-26
49
Overtopping Erosion
Overtopping ErosionFrom Raymond B. SEED

2010-08-26
50
Overtopping Erosion
From Raymond B. SEED
Overtopping Erosion

2010-08-26
51
Overtopping Erosion
THE INVESTIGATION
Testing for erodibility (EFA)
EFA (Erosion Function Apparatus)
2010-08-26
52
Jean-Louis BRIAUD – Texas A&M University
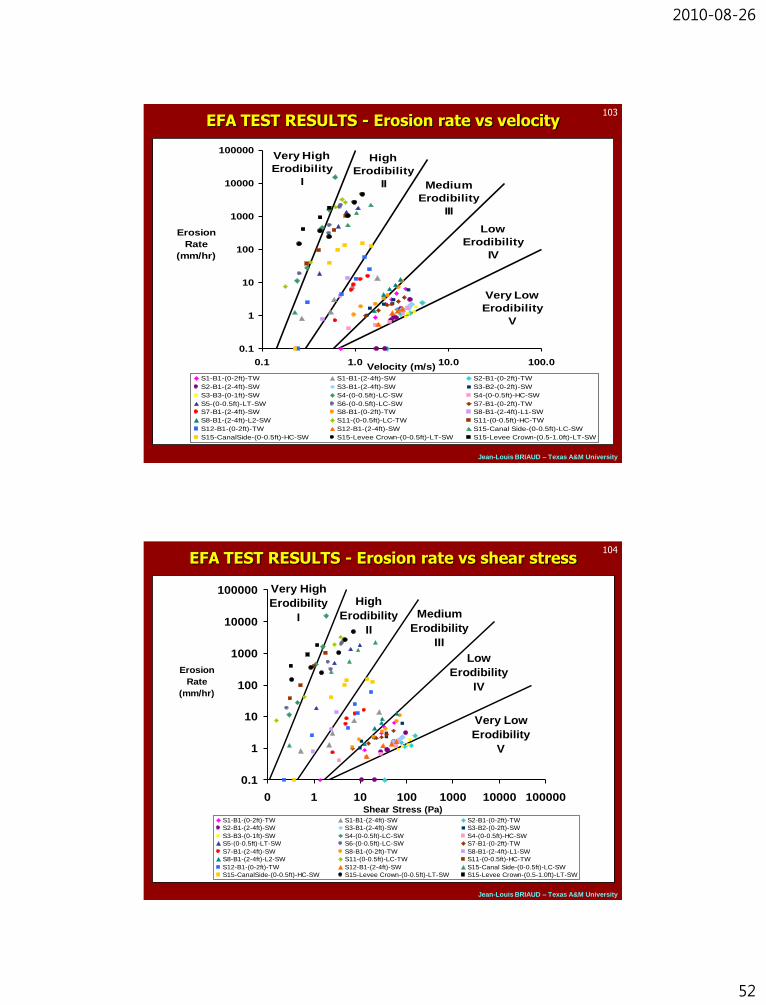
103EFA TEST RESULTS - Erosion rate vs velocity
0.1
1
10
100
1000
10000
100000
0.1 1.0 10.0 100.0Velocity (m/s)
S1-B1-(0-2ft)-TW S1-B1-(2-4ft)-SW S2-B1-(0-2ft)-TW
S2-B1-(2-4ft)-SW S3-B1-(2-4ft)-SW S3-B2-(0-2ft)-SW
S3-B3-(0-1ft)-SW S4-(0-0.5ft)-LC-SW S4-(0-0.5ft)-HC-SW
S5-(0-0.5ft)-LT-SW S6-(0-0.5ft)-LC-SW S7-B1-(0-2ft)-TW
S7-B1-(2-4ft)-SW S8-B1-(0-2ft)-TW S8-B1-(2-4ft)-L1-SW
S8-B1-(2-4ft)-L2-SW S11-(0-0.5ft)-LC-TW S11-(0-0.5ft)-HC-TW
S12-B1-(0-2ft)-TW S12-B1-(2-4ft)-SW S15-Canal Side-(0-0.5ft)-LC-SW
S15-CanalSide-(0-0.5ft)-HC-SW S15-Levee Crown-(0-0.5ft)-LT-SW S15-Levee Crown-(0.5-1.0ft)-LT-SW
Very High
Erodibility
I
High
Erodibility
II Medium
Erodibility
III
Low
Erodibility
IV
Very Low
Erodibility
V
Erosion
Rate
(mm/hr)
Jean-Louis BRIAUD – Texas A&M University
104EFA TEST RESULTS - Erosion rate vs shear stress
0.1
1
10
100
1000
10000
100000
0 1 10 100 1000 10000 100000Shear Stress (Pa)
S1-B1-(0-2ft)-TW S1-B1-(2-4ft)-SW S2-B1-(0-2ft)-TW
S2-B1-(2-4ft)-SW S3-B1-(2-4ft)-SW S3-B2-(0-2ft)-SW
S3-B3-(0-1ft)-SW S4-(0-0.5ft)-LC-SW S4-(0-0.5ft)-HC-SW
S5-(0-0.5ft)-LT-SW S6-(0-0.5ft)-LC-SW S7-B1-(0-2ft)-TW
S7-B1-(2-4ft)-SW S8-B1-(0-2ft)-TW S8-B1-(2-4ft)-L1-SW
S8-B1-(2-4ft)-L2-SW S11-(0-0.5ft)-LC-TW S11-(0-0.5ft)-HC-TW
S12-B1-(0-2ft)-TW S12-B1-(2-4ft)-SW S15-Canal Side-(0-0.5ft)-LC-SW
S15-CanalSide-(0-0.5ft)-HC-SW S15-Levee Crown-(0-0.5ft)-LT-SW S15-Levee Crown-(0.5-1.0ft)-LT-SW
Very High
Erodibility
I
High
Erodibility
II
Medium
Erodibility
III
Low
Erodibility
IV
Very Low
Erodibility
V
Erosion
Rate
(mm/hr)

2010-08-26
53
Jean-Louis BRIAUD – Texas A&M University
105
NUMERICAL SIMULATION
Jean-Louis BRIAUD – Texas A&M University
106
t = 0.80 sec
t = 1.28 sec
t = 1.60 sec
t = 1.92 sec
t = 2.39 sec

2010-08-26
54
Jean-Louis BRIAUD – Texas A&M University
107SHEAR STRESSES ON LEVEE SURFACE
Jean-Louis BRIAUD – Texas A&M University
108EFA TEST RESULTS - Erosion rate vs shear stress
0.1
1
10
100
1000
10000
100000
0 1 10 100 1000 10000 100000Shear Stress (Pa)
S1-B1-(0-2ft)-TW S1-B1-(2-4ft)-SW S2-B1-(0-2ft)-TW
S2-B1-(2-4ft)-SW S3-B1-(2-4ft)-SW S3-B2-(0-2ft)-SW
S3-B3-(0-1ft)-SW S4-(0-0.5ft)-LC-SW S4-(0-0.5ft)-HC-SW
S5-(0-0.5ft)-LT-SW S6-(0-0.5ft)-LC-SW S7-B1-(0-2ft)-TW
S7-B1-(2-4ft)-SW S8-B1-(0-2ft)-TW S8-B1-(2-4ft)-L1-SW
S8-B1-(2-4ft)-L2-SW S11-(0-0.5ft)-LC-TW S11-(0-0.5ft)-HC-TW
S12-B1-(0-2ft)-TW S12-B1-(2-4ft)-SW S15-Canal Side-(0-0.5ft)-LC-SW
S15-CanalSide-(0-0.5ft)-HC-SW S15-Levee Crown-(0-0.5ft)-LT-SW S15-Levee Crown-(0.5-1.0ft)-LT-SW
Very High
Erodibility
I
High
Erodibility
II
Medium
Erodibility
III
Low
Erodibility
IV
Very Low
Erodibility
V
Erosion
Rate
(mm/hr)
2010-08-26
55
Jean-Louis BRIAUD – Texas A&M University
109
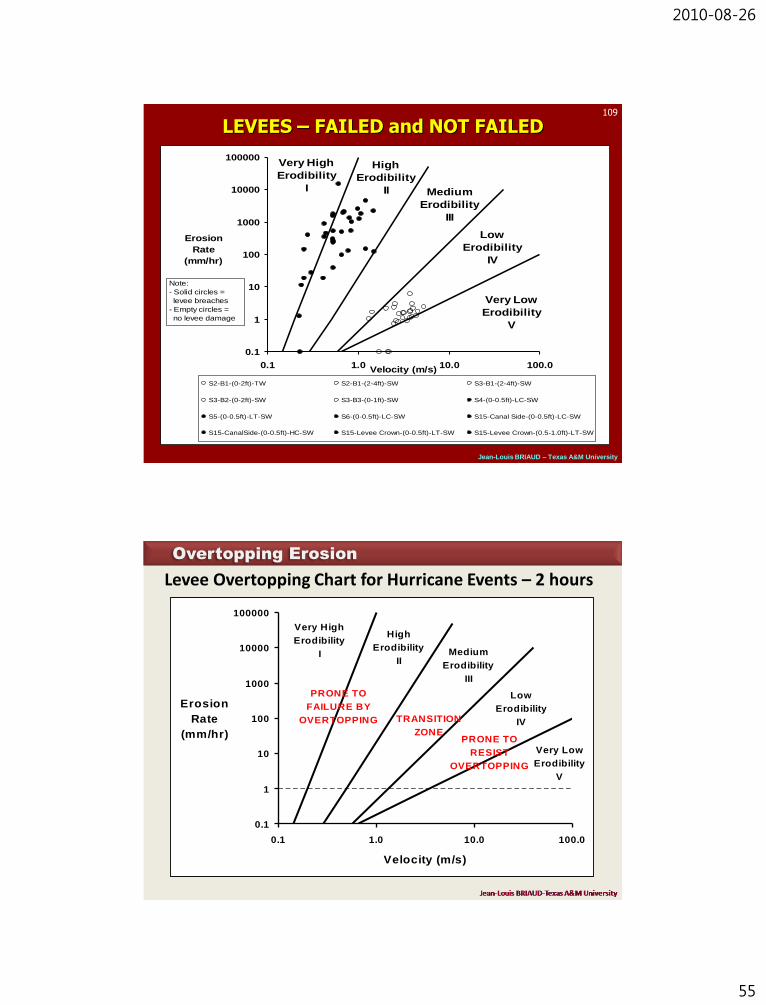
LEVEES – FAILED and NOT FAILED
0.1
1
10
100
1000
10000
100000
0.1 1.0 10.0 100.0Velocity (m/s)
S2-B1-(0-2ft)-TW S2-B1-(2-4ft)-SW S3-B1-(2-4ft)-SW
S3-B2-(0-2ft)-SW S3-B3-(0-1ft)-SW S4-(0-0.5ft)-LC-SW
S5-(0-0.5ft)-LT-SW S6-(0-0.5ft)-LC-SW S15-Canal Side-(0-0.5ft)-LC-SW
S15-CanalSide-(0-0.5ft)-HC-SW S15-Levee Crown-(0-0.5ft)-LT-SW S15-Levee Crown-(0.5-1.0ft)-LT-SW
Very High
Erodibility
I
High
Erodibility
II Medium
Erodibility
III
Low
Erodibility
IV
Very Low
Erodibility
V
Erosion
Rate
(mm/hr)
Note:
- Solid circles =
levee breaches
- Empty circles =
no levee damage
Overtopping Erosion
Levee Overtopping Chart for Hurricane Events – 2 hours
0.1
1
10
100
1000
10000
100000
0.1 1.0 10.0 100.0
Velocity (m/s)
Erosion
Rate
(mm/hr)
Very High
Erodibility
I
High
Erodibility
IIMedium
Erodibility
III
Low
Erodibility
IV
Very Low
Erodibility
V
TRANSITION
ZONE
PRONE TO
FAILURE BY
OVERTOPPING
PRONE TO
RESIST
OVERTOPPING

2010-08-26
56
Overtopping Erosion
Overtopping During
Floods Events
Midwest Levees
Summer 2008
Flow Frequency Analysis
7 year flood
1000 year flood
13 year flood
6 year flood
Overtopping Erosion

2010-08-26
57
Winfield – Pin OakOvertopping Erosion
Brevator (Did Not Fail)Overtopping Erosion

2010-08-26
58
Overtopping Erosion
Overtopping Erosion

2010-08-26
59
Overtopping Erosion
Sample Collection
Overtopping Erosion

2010-08-26
60
In-situ testing
Overtopping Erosion
Testing for erodibility (EFA)
EFA (Erosion Function Apparatus)

2010-08-26
61
Overtopping Erosion
EFA test results – Erosion rate versus water velocity
Overtopping Erosion
LEVEES – Failed and Not Failed

2010-08-26
62
Overtopping Erosion
Levee Overtopping Chart for Flood Events – 2 days
Vegetative ArmorOvertopping Erosion
Good grass type and coverage Poor grass type and coverage

2010-08-26
63
Vegetative Armor
Recommendations:
• Mat-like, sod-forming root system
• Perennial grasses
• Dense consistent coverage
• Height above 0.3 m during flood season
• Trees limited to 15 m beyond levee toe
Overtopping Erosion
Overtopping Erosion
ELEVATED HOUSES

2010-08-26
64
Overtopping Erosion
Overtopping Erosion
ESCAPE STRUCTURES

2010-08-26
65
Briaud’s Web Site
http://ceprofs.tamu.edu/briaud/
International Conference on Scour and ErosionSan Francisco, 7-10 November 2010
www.icse-5.org
International Society for Soil Mechanics and Geotechnical Engineering
http://www.issmge.org/