Embed Size (px)
Citation preview

This work is licensed under a
Creative Commons Attribution-NonCommercial-NoDerivatives 4.0 International licence
Newcastle University ePrints - eprint.ncl.ac.uk
Ahmad Z, Zhang J, Kashiwao T, Bahadori A. Prediction of absorption and
stripping factors in natural gas processing industries using feed forward
artificial neural network. Petroleum Science and Technology 2016, 34(2), 105-
113.
Copyright:
This is an Accepted Manuscript of an article published by Taylor & Francis in Petroleum Science and
Technology on 22-02-16, available online:
http://www.tandfonline.com/10.1080/10916466.2015.1122628
Date deposited:
05/04/2016
Embargo release date:
22 February 2017

For Peer Review O
nly
Prediction of absorption and stripping factors in natural gas processing industries using feed forward artificial neural
network
Journal: Petroleum Science and Technology
Manuscript ID LPET-2015-0860
Manuscript Type: Original Papers
Date Submitted by the Author: 06-Nov-2015
Complete List of Authors: Bahadori, Alireza; Southern Cross University, Ahmad, Zainal ; Universiti Sains Malaysia Zhang, Jie ; University of Newcastle KASHIWAO, Tomoaki; National Institute of Technology, Niihama College, Department of Electronics and Control Engineering
Keywords: natural gas processing, absorption, stripping, modeling, artificial neural network
URL: http://mc.manuscriptcentral.com/lpet Email: [email protected]
Petroleum Science and Technology

For Peer Review O
nly
Prediction of absorption and stripping factors in
natural gas processing industries using feed
forward artificial neural network
Zainal Ahmad1 and Jie Zhang 2, Tomoaki Kashiwao3, Alireza Bahadori** 4
1School of Chemical Engineering, , Engineering Campus, Universiti Sains Malaysia ,Seri Ampangan, 14300,
Nibong Tebal, Penang, Malaysia
E-mail: [email protected]
2School of Chemical Engineering and Advanced Materials, University of Newcastle, Newcastle upon Tyne NE1
7RU, UK
E-mail: [email protected]
3Department of Electronics and Control Engineering, National Institute of Technology, Niihama College, 7-1
Yagumo-cho, Niihama, Ehime 792-8580, Japan
**4
School of Environment, Science and Engineering, Southern Cross University, Lismore, NSW, Australia
Email: [email protected], Tel: +61 2 6626 9347
Abstract
In dynamic simulators, mathematical models are applied in order to study the time-
dependent behaviour of a system, meaning the system process units and the
corresponding control units. Absorption and stripping are the unit operations which are
widely used in the natural gas processing industries. Many attempts have been made to
define an average absorption factor method to short-cut the time consuming rigorous
calculation procedures. One of the options for this complex engineering modelling
problem is artificial intelligent (AI) approach. Artificial neural networks (ANN) have
been shown to be able to approximate any continuous non-linear functions and have been
used to build data base empirical models for non-linear processes. In this study,
feedforward neural networks (FANN) models were used to model the absorption
efficiency. The mean square error (MSE), residue analysis and coefficient determination
based on the observed and prediction output is chosen as the performance criteria of
model. It was found that the developed feedforward neural networks (FANN) models
provided satisfactory model with the MSE and coefficient determination of 0.0003 and
0.9998 for new unseen data from literature respectively.
Keywords: Artificial Intelligent (AI), Feedforward Neural Network (FANN), Absorption;
Absorption efficiency, Absorption stages, stripping
1. Introduction
Absorption is one of the unit operations which is widely used in the natural gas processing
industries [1]. In an absorption column, rich gas enters the bottom of the absorber and flows
Page 1 of 16
URL: http://mc.manuscriptcentral.com/lpet Email: [email protected]
Petroleum Science and Technology
123456789101112131415161718192021222324252627282930313233343536373839404142434445464748495051525354555657585960
For Peer Review O
nly
upward contacting the counter-current lean oil stream. The lean oil preferentially absorbs the
heavier components from the gas and is then termed as "rich oil" [2].
The rich oil is sent to a stripper (or still) where the absorbed components are removed by
heating and/or stripping with steam. The lean oil is recycled to the absorber to complete the
process loop [2]. For a given gas, the fraction of each component in the gas that is absorbed
by the oil is a function of the equilibrium phase relationship of the components and lean oil,
the relative flow rates, and the contact stages [2, 3].
With currently available computing power, the process unit models in a dynamic simulator
still need to be simplified in comparison to steady-state models for the purpose of real-time
process optimisation and control [4]. The challenge is to model the complex phenomena
associated with the absorber unit without losing important information.
Another challenge is the validation of a dynamic model, because relevant dynamic data from
existing plants are not available. However, steady-state performance can be validated since
there are more adequate data and advanced models available [4].
Dynamic modelling and simulation has been a very time-consuming and labour intensive
activity, one requiring highly skilled systems engineers and computer applications specialists
[5]. Therefore one of the solution in dynamics modelling and simulation for the above
problem is by utilising the capability of artificial intelligence (AI).
One of the most popular AI methods is Artificial Neural Networks (ANN) specsically using
feedforward artificial neural network (FANN). These kind of models are inspired from the
neurological system of humans and used to mimic the human neurological system. After all,
it shows a remarkable success in the modeling and prediction of highly nonlinear systems [6].
Artificial neural networks have been shown to be able to approximate any continuous non-
linear functions and have been used to build data base empirical models for non-linear
processes [7]. Hence what is a neural network? According to [8].
A neural network is a massive parallel-distributed processor that has a natural
capability for storing experiential knowledge and making it available for use. It resembles the
brain in two respects knowledge is acquired by the networks through a learning process.
Interneuron connection strengths known as synaptic weights are used to store the knowledge’
Furthermore, the main advantage of neural network based process models is that they are
easy to build. This feature is particularly useful when modelling complicated processes where
detailed mechanistic models are difficult to develop. The greatest strength of neural network
is that it has the ability to learn the system from the historical data.
The growing interest in applying FANN are due to the computing system that growth rapidly
which enable the behaviour of the complex system to be modelled and predicted accurately.
Furthermore the characteristic of neural network models being able to learn from examples
themselves rather than having to programme the complex system also contributed the
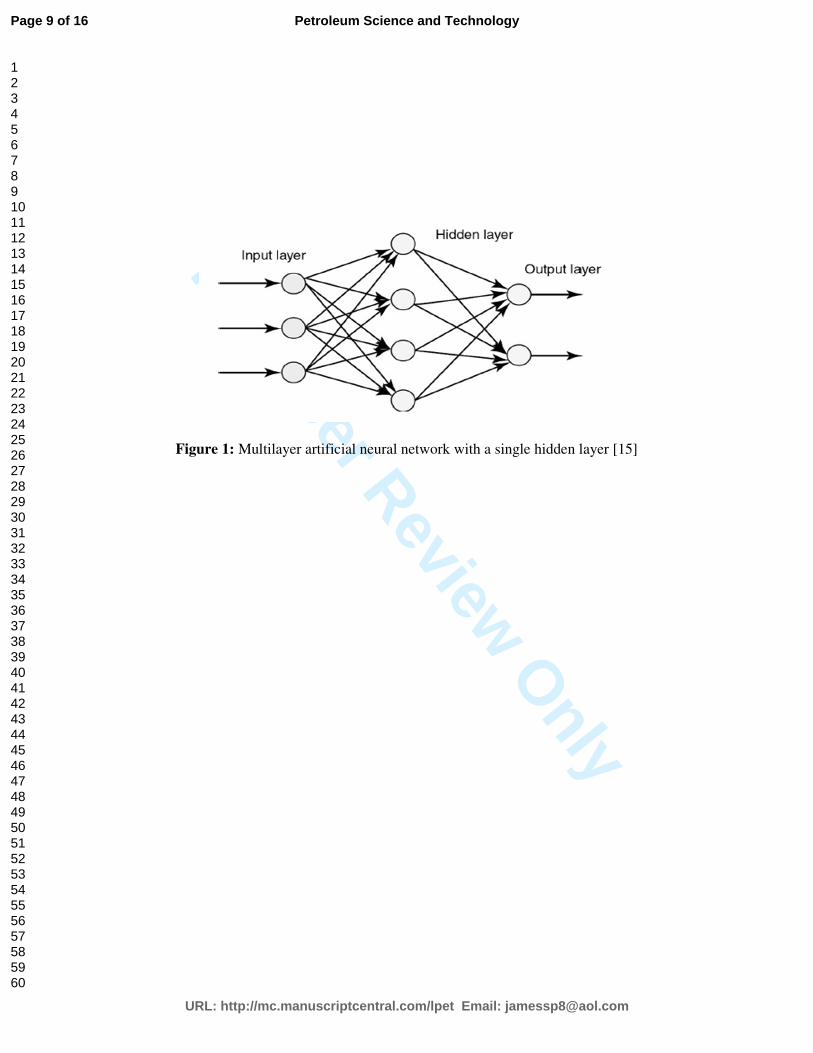
application of the models. The architecture of FANN vary from multilayer perceptron as
shown in Figure 1, to radial basis function (RBF) and also recurrent neural networks models
[9]. Most of the applications of FANN are concentrated on the modelling and control of
chemical processes using multilayer perceptron networks.
Page 2 of 16
URL: http://mc.manuscriptcentral.com/lpet Email: [email protected]
Petroleum Science and Technology
123456789101112131415161718192021222324252627282930313233343536373839404142434445464748495051525354555657585960

For Peer Review O
nly
The common systems used in the chemical processes are distillation columns, absorption and
reactor systems (continuous stirred tank reactor (CSTR), bioreactor, and neutralising reactor).
These processes are usually very nonlinear and nonlinear models have to be developed.
Currently, applications of FANN in process modeling and control are quite significant in
industry especially in model based predictive control (MBPC) [10,11] and this is due to the
ability of neural networks in modeling nonlinear processes [12].
FANN has also been used to model complex systems in bioprocess, for example
FANN are used as a biosensor to predict the glucose and ethanol in certain range of substrate
and the accuracy of the estimation was quite good [13].
Further, [14] apply FANN with the extended Kalman filter in the training to predict
the production of the penicillin in a batch process. It is shown that FANN predictions are
quite good even in the real data. Therefore the FANN modelling approach is implemented in
this paper with the aim of enhancing the model accuracy of the absorption efficiency model
prediction.
This paper is organised as follows. Section 2 presents the case study or the process covering
the absorber and stripper calculation. The concept of feedforward neural network (FANN)
modelling is presented in Section 3. The result and discussion of the proposed modelling are
presented in Section 4. Finally, the last section concludes this paper.
2. Trays or packed Column Absorber
2.1 Absorber Calculations
Absorber and stripper calculations, like fractionation column calculations, can be
accomplished with tray-by-tray material and energy balance models [2]. However, hand
calculations can be performed to estimate the absorption of components in a lean oil
absorber. The stripping operation is essentially the reverse of absorption and can be handled
in a similar fashion. Many attempts have been made to define an "average" absorption factor
method to short-cut the time consuming rigorous calculation procedures [2].
The sole restriction of such a method is how well the average factor, as it is defined, will
represent the absorption that actually occurs. One of the simplest definitions of an average
absorption factor AF is by [16, 17], where the average absorption factor is defined as:
1+
=
navg
O
FVK
LA (1)
Or
1+××=
navgFVKA
oL
(2)
Using an average absorption factor, the extraction of any component from a rich gas can be
described by:
Page 3 of 16
URL: http://mc.manuscriptcentral.com/lpet Email: [email protected]
Petroleum Science and Technology
123456789101112131415161718192021222324252627282930313233343536373839404142434445464748495051525354555657585960

For Peer Review O
nly
an
F
F
n
F
n
n EA
AA
YY
YY=
−
−=
−
−
+
+
+
+
11
1
01
11 (3)
Where
Proposed predictive tool can also be used to determine the number of trays required for a
given lean oil rate or to calculate recoveries with a given oil rate and number of trays. Most
problems in absorber operation are centred on oil quality and rates. Proper stripping of the oil
is necessary to minimize lean oil losses to the gas and to maximize absorption capacity.
2.2 Stripper Calculations
In a calculation sense, a stripper is simply an upside-down absorber wherein solute is stripped
from liquid into the gas. For hand calculations, a stripping factor is defined [2]:
L
KVST = (4)
Then:
sm
T
T
m
T
m
m ES
SS
XX
XX=
−
−=
−
−
+
+
+
+
11
1
01
11 (5)
The proposed predictive tool can be used to perform stripper calculations in a similar manner
to absorber calculations. The present steady state absorber/stripper model can be applied to
study operability in absorber plants during the course of steady operation. However, in a
dynamic model, mathematical models are applied in order to study the time-dependent
behavior of a system, meaning the system process units and the corresponding control units.
3. Feed Forward Neural Network (FANN) Model Development
In this case study, 1620 sampling instances were generated from the absorption process with
the model inputs being the number of stripping stages (or number of absorption stages) and
the absorption (or stripping) factor. The model output is the absorption (or stripping)
efficiency. Modelling data are from the case study given in the previous section and
additional testing of the model is carried out on the new unseen data from [17].
All the data was normalized to zero mean with unit standard deviation to cope with the
different magnitudes in the input and output data. Then, the input data were divided randomly
using MatlabTM
command divideint into three sets of data which are 70% (1134 samples)
for training, 15% (243 sample) for testing, and 15% (243 sample) for unseen validation as
show in Figures 2,3 and 4 respectively.
Then the individual networks were trained by the Levenberg-Marquardt optimisation
algorithm with regularisation and “early stopping”. All weights and biases were randomly
initialised in the range from –0.1 to 0.1. The individual networks are single hidden layer feed
Page 4 of 16
URL: http://mc.manuscriptcentral.com/lpet Email: [email protected]
Petroleum Science and Technology
123456789101112131415161718192021222324252627282930313233343536373839404142434445464748495051525354555657585960
For Peer Review O
nly
forward neural networks (FANN). Hidden layer neurons use the logarithmic sigmoid
activation function whereas output layer neurons use the linear activation function.
The number of hidden neurons was determined using cross validation. The numbers of
hidden nodes is increased from 1 to 20 and the MSE and R2 value for the training and testing
data are calculated for each nodes respectively.
Then, the MSE and R2 is plotted against the number of nodes. Different number of hidden
neurons will gives the different MSE and R2 value in training and testing data. The network
with the lowest mean squared errors (MSE) on the training and testing data was considered as
having the best network topology for this prediction. In addition, in assessing the developed
models, MSE on the unseen validation data is used as the performance criterion as well as the
new unseen data from the literature.
For this case study, the FANN is developed based on the discrete time of the process as the
prediction output at time (t), y(t), is predicted based on the process input at time t, u(t), as
follows:
)](),....,(),([)(ˆ21 tututufty m= (6)
where u(t) is the process input at time (t), where for this case study is striping stages and
stripping factors, )(ˆ ty is the predicted process output at time t, which is the stripping
efficiency while m is the number of the model inputs respectively where for this case study
number of inputs is 2.
4. Results and discussions
It was found that using 8 hidden neurons gives the least MSE on the training and testing data
as shown in Table 1. Based on this, the final selected neural network has 8 hidden neurons.
Thus, the performance of the final selected model based on the unseen data will be evaluated
based on this final structures as well.
The data for model building, 1134 samples, were randomly partitioned into training data
(70%), testing data (15%), and unseen validation data (15%). By using the Levenberg-
Marquardt optimization method, the training stopped after 100 iterations with the mean
square error (MSE) value of 0.0009 and the coefficient determination, R2 equal to 0.9992.
The trained network was simulated by feeding it with all of the 70% percent training data.
Then, the model was tested using 30 % data points which contains 243 data points. The
testing prediction data was observed with the MSE value of 0.0006 and R2 equal to 0.9994
respectively.
Figure 5 presents a plot of the true and predicted stripping efficiency values on the training
and testing data. It can be seen from Figure 5 that all the predicted values are close to the
Page 5 of 16
URL: http://mc.manuscriptcentral.com/lpet Email: [email protected]
Petroleum Science and Technology
123456789101112131415161718192021222324252627282930313233343536373839404142434445464748495051525354555657585960

For Peer Review O
nly
corresponding actual values, which means that the network has learned the input–output
mappings with a good degree of accuracy. The model has been validated using 15 % from the
total data as an unseen data which is not included in the model development process as shown
in Figure 6. In addition to that, another literature data was also used as a new unseen data to
further evaluate the generalisation capability of the developed model. Those 2 validation data
sets will be used to determine whether the generalization capability of the model developed
using training and testing data is acceptable for this case study.
Figure 6 shows the model predictions and actual outputs in the validation data for FANN. It
can clearly be seen that the FANN model performs quite well. The model predictions are
almost the same as the experiment data. This clearly shows that the FANN is able to capture
the underlying relationship between the process input and output variables. The residue
analysis also shows that the offset in each data point is very small and is close to zero.
In order to test further the performance of the model, statistical analysis was carried out in
terms of the mean squared errors (MSE), coefficient of determination (R2 analysis), and
residue and p-value analysis. The overall statistical analysis results of MSE and coefficient of
determination are shown in Table 2. It clearly shows that the MSE is relatively small and the
coefficient determination (R2) is close to 1 for the new unseen data. The p-values is very
small, smaller than 0.05, indicating that the model and actual data are in 95 % confident limit
and this were supported by the residue analysis in Figure 6. It is shown that the FANN model
is able to generalize on new unseen data and predict significantly well even though using real
process data from literature.
5. Conclusions
A feedforward neural network (FANN) was developed to model the performance of
an absorption process using experimental data, which was subjected to a series of different
process operating conditions. The inputs to the network are the absorption or stripping stages
and absorption or stripping factors, and the output is the absorption or stripping stage
efficiency. The Levenberg–Marquardt optimization technique was used together with the
‘early stopping’ and regularisation methods to improve the robustness of the network.
Application to the additional unseen data from the literature shows that feedforward neural
networks (FANN) is able to capture and generalize the real process. The SSE is very small
and the coefficient of determination is closed to 1. These results are consistent with the p-
values and residue analysis. The presented study indicates that feedforward neural networks
(FANN) can effectively model this process.
Acknowledgement
The authors would like to acknowledge the support received from the Universiti Sains Malaysia
(USM) and Newcastle University, United Kingdom.
Nomenclature:
Page 6 of 16
URL: http://mc.manuscriptcentral.com/lpet Email: [email protected]
Petroleum Science and Technology
123456789101112131415161718192021222324252627282930313233343536373839404142434445464748495051525354555657585960

For Peer Review O
nly
FA : Absorption factor
:aE Absorption efficiency
:sE Stripping efficiency
K: K-value
:OL liquid reflux rate, moles/unit time
:L liquid rate, moles/unit time
:1+mL rich oil entering the stripper, moles/unit time
m : number of stripping stages
n : number of absorber stages
N m : minimum number of theoretical stages
R : reflux ratio, moles of reflux divided by moles of net overhead product
S : number of stages
S T : stripping factor
X : liquid rate, moles/unit time
X 1+m : moles of a component in the rich oil entering a stripper per mole of rich oil entering
the stripper
X 1 : moles of a component in the lean oil per mole of rich oil
Xo : moles of a component in the liquid in equilibrium with the stripping medium per mole of
entering rich oil
Y i : moles of any component in the lean gas leaving the absorber per mole of rich gas
Y 1+n : moles of any component in the entering rich gas per mole of rich gas
Yo : moles of any component in the gas in equilibrium with the entering lean oil, per mole of
rich gas
Subscripts
Avg: average
i : any component
L : liquid
m : number of stripping stages
n : number of absorber stages
6. References
Oyenekan B. A.,and Rochelle G. T. “
Alternative stripper configurations for CO2 capture
by aqueous amines”, AIChE Journal 53 (12)(2007)pp. 3144 – 3154.
GPSA Engineering Databook, 2004
Bahadori A, Vuthaluru HB, Simple methodology for sizing of absorbers for TEG
(triethylene glycol) gas dehydration systems, Energy 34 (2009a) 1910–1916.
Page 7 of 16
URL: http://mc.manuscriptcentral.com/lpet Email: [email protected]
Petroleum Science and Technology
123456789101112131415161718192021222324252627282930313233343536373839404142434445464748495051525354555657585960

For Peer Review O
nly
Kvamsdal, H.M. . Jakobsen J.P and Hoff, K.A. , Dynamic modeling and simulation of a
CO2 absorber column for post-combustion CO2 capture, Chemical Engineering and
Processing 48 (2009) 135–144.
Bahadori, a & Vuthaluru, HB 2010, 'A new method for prediction of absorption/stripping
factors', Computers & Chemical Engineering, vol. 34, no. 10, pp 1731-1736.
Khuan, L. Y., Hamzah, N., & Jailani, R. (2002). Prediction of water quality index (WQI)
based on artificial neural network (ANN). In 2002 Student Conference on Research and
Development Proceedings, Shah Alam, Malaysla (pp. 157–161). IEEE.
doi:10.1109/SCORED.2002.1033081
Hertz J, Krogh A and Palmer R G., Introduction to the Theory of Neural Computation,
Addison-Wesley, Redwood City, CA, 1991.
Haykin S. Neural Networks, Macmillan College Publication Company, 1994.
Hagan M T, Demuth H B and De Jesus O. 2002. An introduction to the use of neural
networks in control system. International Journal of Robust and Nonlinear Control 12:
959-985.
Chen J and Yea Y. 2002. Neural network-based predictive control for multivariables
processes. Chemical Engineering and Communication 189: 866-894.
Xiong Q and Jutan A. 2002. Grey-box modelling and control of chemical processes.
Chemical Engineering Science 57: 1027-1039.
Shaw A M, Doyle F J and Schwaber J S. 1997. A dynamic neural networks approach to
nonlinear process modelling. Computers and Chemical Engineering 21(4): 371-385.
Lobanov A V, Borisov I A, Gordon S H, Greene R V, Leathers T D and Reshetilov A N.
2001. Analysis of ethanol-glucose mixtures by two microbial sensors: applications of
chemometrics and artificial neural networks for data processing. Biosensor and
Bioelectronics 16: 1001-1007.
Scheffer R and Filho M. 2001. Process identification of a fed-batch penicilin production
process-training with the extended Kalman filter. Mujtaba I M and Hussain M A (Eds). In
Application of Neural Networks and Other Learning Technologies in Process
Engineering, Imperial College Press, London:99-118.
Hitsov, I, Maere, T and Desitter, K. 2015. Modelling approaches in membrane
distillation: a critical review, Separation and Purification Technology, 142:48-64
Kremser, A., "Theoretical analysis of absorption process", National Petro. News,
22(21)(1930), 48,.
Brown, G. G., and Souders, M., "Fundamental design of absorbing and stripping columns
for complex vapors", Ind. Eng. Chem. 24 (1932), 519.
Page 8 of 16
URL: http://mc.manuscriptcentral.com/lpet Email: [email protected]
Petroleum Science and Technology
123456789101112131415161718192021222324252627282930313233343536373839404142434445464748495051525354555657585960
For Peer Review O
nly
Figure 1: Multilayer artificial neural network with a single hidden layer [15]
Page 9 of 16
URL: http://mc.manuscriptcentral.com/lpet Email: [email protected]
Petroleum Science and Technology
123456789101112131415161718192021222324252627282930313233343536373839404142434445464748495051525354555657585960

For Peer Review O
nly
Figure 2: Scaled input and output training data
0 200 400 600 800 1000 1200-5
-4
-3
-2
-1
0
1
Samples
Scale
d S
trip
pin
g E
ffic
iency
0 200 400 600 800 1000 1200-2
-1
0
1
2
3
Samples
Scale
d S
trip
pin
g s
tages
and s
trip
pin
g f
acto
rs
Stripping stages
Stripping factors
Page 10 of 16
URL: http://mc.manuscriptcentral.com/lpet Email: [email protected]
Petroleum Science and Technology
123456789101112131415161718192021222324252627282930313233343536373839404142434445464748495051525354555657585960

For Peer Review O
nly
Figure 3: Scaled input and output for testing data
0 50 100 150 200 250-5
-4
-3
-2
-1
0
1
Samples
Scale
d S
trip
pin
g E
ffic
iency
0 50 100 150 200 250-2
-1
0
1
2
3
Samples
Scale
d S
trip
pin
g S
tages
and S
trip
pin
g F
acto
rs
Stripping Stages
Stripping Factors
Page 11 of 16
URL: http://mc.manuscriptcentral.com/lpet Email: [email protected]
Petroleum Science and Technology
123456789101112131415161718192021222324252627282930313233343536373839404142434445464748495051525354555657585960

For Peer Review O
nly
Figure 4: Scaled input and output for validation data
Page 12 of 16
URL: http://mc.manuscriptcentral.com/lpet Email: [email protected]
Petroleum Science and Technology
123456789101112131415161718192021222324252627282930313233343536373839404142434445464748495051525354555657585960

For Peer Review O
nly
Figure 5: Actual and predicted for training and testing data
Page 13 of 16
URL: http://mc.manuscriptcentral.com/lpet Email: [email protected]
Petroleum Science and Technology
123456789101112131415161718192021222324252627282930313233343536373839404142434445464748495051525354555657585960

For Peer Review O
nly
Figure 6: Actual and predicted for validation data
1 2 3 4 5 6 7 8 9 10 11-4
-2
0
2
4
6
8
10
12
14
x 10-3
Samples
Resid
ue A
naly
sis
Page 14 of 16
URL: http://mc.manuscriptcentral.com/lpet Email: [email protected]
Petroleum Science and Technology
123456789101112131415161718192021222324252627282930313233343536373839404142434445464748495051525354555657585960

For Peer Review O
nly
Table 1: MSE for neural networks with different numbers of hidden neurons
Hidden nodes MSE (Training) MSE (Testing) MSE (Train+Test)
1 0.0007 0.0002 0.0009
2 0.0014 0.0012 0.0026
3 0.0009 0.0007 0.0016
4 0.0006 0.0003 0.0009
5 0.0015 0.0013 0.0028
6 0.0023 0.0022 0.0046
7 0.0007 0.0004 0.0011
8 0.0005 0.0003 0.0008
9 0.0006 0.0003 0.0010
10 0.0005 0.0002 0.0008
11 0.0006 0.0004 0.0010
12 0.0091 0.0062 0.0152
13 0.0009 0.0007 0.0016
14 0.0011 0.0009 0.0020
15 0.0100 0.0059 0.0159
16 0.0092 0.0064 0.0156
17 0.0178 0.0145 0.0323
18 0.0179 0.0147 0.0325
19 0.5023 0.4315 0.9338
20 0.5080 0.4352 0.9433
Page 15 of 16
URL: http://mc.manuscriptcentral.com/lpet Email: [email protected]
Petroleum Science and Technology
123456789101112131415161718192021222324252627282930313233343536373839404142434445464748495051525354555657585960

For Peer Review O
nly
Table 2: FANN model performance on the new unseen data and Statistical analysis for new
unseen data [2, 16, and 17]
Number of
absorption/stripping
stages
Absorption or
stripping factor
Reported absorption
or stripping
efficiency (fraction)
[2,16,17]
FANN
predicted
values
Absolute
deviation
percentage
0.4 10 0.631503793 0.628851496 0.420
0.6 20 0.845671811 0.844852747 0.097
0.8 1.2 0.487758561 0.480022454 1.586
1 6 0.868347362 0.862613684 0.660
1.2 10 0.946202581 0.946956599 0.080
1.4 16.8 0.983512804 0.984065285 0.056
1.6 19.6 0.994966419 0.993026541 0.195
2 14 0.993515174 0.99612215 0.262
2.5 1.2 0.77627358 0.769239411 0.906
5 0.8 0.732181329 0.730986621 0.163
10 1 0.909949504 0.898050404 1.308
Average Absolute Deviation percentage (AADP) 0.521
Details Values
R2 0.9999
MSE 0.0003
p-value 7.5257× 10⁻¹⁶
Page 16 of 16
URL: http://mc.manuscriptcentral.com/lpet Email: [email protected]
Petroleum Science and Technology
123456789101112131415161718192021222324252627282930313233343536373839404142434445464748495051525354555657585960