Embed Size (px)
Citation preview

EXTENDED REPORT
Predicting the severity of joint damage in rheumatoidarthritis; the contribution of genetic factorsHanna W van Steenbergen,1 Roula Tsonaka,2 Tom WJ Huizinga,1 Saskia le Cessie,2,3
Annette HM van der Helm-van Mil1
Handling editor Tore K Kvien
▸ Additional material ispublished online only. To viewplease visit the journal online(http://dx.doi.org/10.1136/annrheumdis-2013-204277).1Department of Rheumatology,Leiden University MedicalCenter, Leiden,The Netherlands2Department of MedicalStatistics, Leiden UniversityMedical Center, Leiden,The Netherlands3Department of ClinicalEpidemiology, Leiden UniversityMedical Center, Leiden,The Netherlands
Correspondence toHW van Steenbergen,Department of Rheumatology,Leiden University MedicalCenter, P.O. Box 9600, Leiden2300 RC, The Netherlands;[email protected]
Received 12 July 2013Revised 4 December 2013Accepted 21 December 2013
To cite: vanSteenbergen HW,Tsonaka R, Huizinga TWJ,et al. Ann Rheum DisPublished Online First:[please include Day MonthYear] doi:10.1136/annrheumdis-2013-204277
ABSTRACTBackground The severity of radiologic progression isvariable between rheumatoid arthritis (RA) patients.Recently, several genetic severity variants have beenidentified and were replicated, these belong to 12 loci.This study determined the contribution of the identifiedgenetic factors to the explained variance in radiologicprogression and whether genetic factors, in addition totraditional risk factors, improve the accuracy of predictingthe severity of radiologic progression.Methods 426 early RA patients with yearly radiologicfollow-up were studied. The main outcome measure wasthe progression in Sharp-van der Heijde score (SHS) over6 years, assessed as continuous outcome or categorisedin no/little, moderate or severe progression. Assessedwere improved fit of a linear mixed model analysis onserial radiographs, R2 using linear regression analyses,C-statistic and the net proportion of patients that wasadditionally correctly classified when adding genetic riskfactors to a model consisting of traditional risk factors.Results The genetic factors together explained12–18%. When added to a model including traditionalfactors and treatment effects, the genetic factorsadditionally explained 3–7% of the variance(p value R2change=0.056). The percentage of patients thatwas correctly classified increased from 56% to 62%; thenet proportion of correct reclassifications 6% (95% CI 3to 10%). The C-statistic increased from 0.78 to 0.82.Sensitivity analyses using imputation of missingradiographs yielded comparable results.Conclusions Genetic risk factors together explained12–18% of the variance in radiologic progression.Adding genetic factors improved the predictive accuracy,but 38% of the patients were still incorrectly classified,limiting the value for use in clinical practice.
INTRODUCTIONThe severity of rheumatoid arthritis (RA) is com-monly expressed by the extent of damage of handand feet joints. Joint damage can be measuredobjectively with validated scoring methods and isassociated with long-term functional disability.1
The severity is highly variable between patients;many patients show mild progression and fewsevere progression. The processes underlying thesedifferences are partly understood. The observationthat the heritability of radiologic progression is 45–58%2 underlined the notion that genetic factorsplay a role. Presently, several genetic risk factors forradiologic progression have been identified andreplicated. Some of these variants were also asso-ciated with differences in mRNA or protein
expression.3–6 Here, we aimed to explore the rele-vance of currently known genetic risk factors withregards to (1) explaining the interindividual vari-ance in radiologic progression and (2) improvingthe accuracy of predicting radiologic progressionfor individual patients.Known traditional risk factors explain about
one-third of the variance in joint damage after5 years of disease; the majority of these risk factorswere related to patient characteristics (age, gender),inflammation (acute phase reactants, swollen jointcounts) and the presence of auto-antibodies.7 Thecontribution of the genetic risk factors to theexplained variance has not been explored.Prediction of RA-severity on the level of individ-
ual patients is not yet accurate. Several matrices topredict rapid radiologic progression have beenderived, consisting of three or four risk factors.Most of these matrices are not validated in thegeneral RA population, and failed to correctly clas-sify ∼50% of patients. In particular, the patientswho developed progressive disease were not recog-nised.8–13 Consequently, the value of these matricesfor clinical practice is still limited. Whether theaddition of genetic factors improves prediction isunknown.This study examined the variance in joint
damage progression explained by recently identi-fied genetic risk factors and their value in improv-ing the prediction of the severity of joint damageprogression. We assessed traditional performancemeasures of prediction models and the net propor-tion of RA-patients that is additionally correctlyclassified when adding risk factors to a predictionmodel consisting of known risk factors.
PATIENTS AND METHODSPatientsBetween 1993 and 2006, 600 RA patients(1987-ACR-criteria) were included in the LeidenEarly Arthritis Clinic (EAC).7 Inclusion in the EACtook place when arthritis was confirmed at physicalexamination and symptom duration was less than2 years. At first visit, patients and rheumatologistsfilled questionnaires, 66-swollen and 68-tenderjoint counts were performed (66-SJC and68-TJC14), and blood samples were taken. Patientswere followed yearly. The initial treatment strategydiffered for different inclusion periods: patientsincluded in 1993–1995 were initially treated withNSAIDs, patients included in 1996–1998 were ini-tially treated with hydroxychloroquine or sulpha-salazine, and patients included since 1999 were
van Steenbergen HW, et al. Ann Rheum Dis 2014;0:1–7. doi:10.1136/annrheumdis-2013-204277 1
Clinical and epidemiological research ARD Online First, published on January 15, 2014 as 10.1136/annrheumdis-2013-204277
Copyright Article author (or their employer) 2014. Produced by BMJ Publishing Group Ltd (& EULAR) under licence.
group.bmj.com on August 21, 2014 - Published by ard.bmj.comDownloaded from

promptly treated with methotrexate. The severity of radiologicprogression differed for these three treatment groups; therefore,treatment effects were incorporated in the analyses. The trad-itional risk factors studied were age, gender, symptom durationat first visit, localisation initial joint symptoms, 66-SJC, presenceof anti-citrullinated-peptide-antibodies (ACPA), presence ofrheumatoid factor (RF) and erythrocyte sedimentation rate(ESR).
Selection of genetic risk factors and genotypingWe selected single nucleotide polymorphisms (SNPs) using thefollowing criteria: the SNP was studied in relation to the sever-ity of radiologic progression in several cohorts and the associ-ation was independently replicated or found significant in ameta-analysis including all published data. Based on these cri-teria, we came to a selection of genetic variants that is presentedin table 1. Notably, rs4810485 in CD40 and rs7607479 inSPAG16 were identified as risk factors for radiologic progressiononly in ACPA-positive RA. Genotypings in the EAC were donewith allele-specific kinetic PCR analysis,15 Illumina Golden Gateplatform,3 4 16 17 Illumina Immunochip,5 18 Sequenom iPLEX6
and LightSnp (Roche).19 Quality control of genotyping was per-formed as described previously.3–6 15–19 426 patients had com-plete data on all evaluated traditional and genetic risk factors(figure 1).
Radiologic outcomeX-rays were taken at baseline and with yearly intervals. Totally,over 7 years, 2680 X-ray sets of hands and feet of 426 patientswere made and scored by one experienced reader using Sharp–van der Heijde scores (SHSs) blinded to any clinical or geneticdata (intraclass correlation coefficient 0.91). The numbers ofpatients with radiologic data at baseline and over 4, 5, 6 and7 years were, respectively, 321, 286, 239 and 206. The mainoutcome measure in this study was radiologic progression in thefirst 6 years after inclusion (ΔSHS0–6 years=SHS6 years–SHS0 years).
Although radiologic data was known up till 7 years, the progres-sion over 6 years was chosen as main outcome as fewer patientscompleted 7 years of follow-up. For some accuracy measures thecontinuous outcome was categorised in three groups of progres-sion over 6 years: ΔSHS0–6 years ≤6, 7–30 and >30 units, indi-cating no/little, moderate and severe radiologic progression(figure 3A). The first cut-off was chosen as progression of ≤1
Table 1 Genetic variants studied, and the R2 of each variant for radiologic progression over six years
Genetic variant (risk allele) Located in/nearby gene(s) Chr. MAF* Tested model*R2 ΔSHS0–6 years (%) inRA (n=239)
R2 ΔSHS0–6 years (%) inACPA-pos RA (n=144)
SE (28) HLA-DRB1 6 0.39 Add 4.0 <0.01rs4810485 (T) (15) CD40 20 0.24 Rec 0.1 <0.01rs7667746 (G) (16) IL-15 4 0.33 Rec 2.6 3.9rs7665842 (G) (16) IL-15 4 0.40 Rec 2.7 3.7rs4371699 (A) (16) IL-15 4 0.19 Rec 0.3 1.0rs6821171 (C) (16) IL-15 4 0.29 Rec 0.1 1.4rs1896368 (G) (4) DKK-1 10 0.47 Add 0.3 1.1rs1896367 (A) (4) DKK-1 10 0.41 Add 0.4 0.7rs1528873 (A) (4) DKK-1 10 0.47 Add 2.1 3.0rs2104286 (C) (18) IL2RA 10 0.24 Add 0.3 <0.1rs8192916 (A) (3) GRZB 14 0.42 Rec 0.8 1.4rs1119132 (A) (17) IL-4R 16 0.13 Rec 0.5 1.1rs7607479 (C) (6) SPAG16 2 0.33 Add 0.6 2.5rs26232 (T) (19) C5orf30 5 0.29 Add 0.3 <0.1
rs11908352 (A) (5) MMP-9 20 0.21 Add 4.7 1.3rs451066 (A) (5) rs1465788 14 0.20 Add 1.1 0.2rs1485305 (T) (Knevel, 2013, unpublished) OPG 8 0.44 Add 1.4 0.6
The presented R2 s were based on univariate analyses for each individual risk factor.*The MAFs and tested models are presented as reported in the previous studies.ACPA, anticitrullinated peptide antibody; Add, additive; Chr, Chromosome; DKK-1, dickkoph-1; GRZB, granzyme-B; HLA, human leucocyte antigens; IL-15, interleukin-15; IL2RA,interleukin-2 receptor α; IL-4R, interleukin-4 receptor; MAF, minor allele frequency; MMP-9, metalloproteinase-9; NP, not presented; OPG, osteoprotegerin; R2, proportion of explainedvariance; RA, rheumatoid arthritis; Rec, recessive; SE, shared epitope; ΔSHS0–6 years, progression in Sharp–van der Heijde score over six years; SPAG-16, sperm associated antigen-16.
Figure 1 Flow chart of patient selection. RA, rheumatoid arthritis;EAC, early arthritis clinic; RMA, repeated measurement analysis; R2,proportion of explained variance. Baseline characteristics of theincluded (n=426) and excluded patients (n=174) were not different(data not shown). The patients with follow-up until six years (n=239)were younger compared to the patients without complete follow-upuntil six years (n=187) (mean (SD) 53.9 (14.5) versus 60.0 (15.7) years,p<0.001), had a higher 66-swollen joint count (median (IQR) 9 (5–16)versus 8 (3–13), p=0.009) at baseline and were more frequentanticitrullinated-peptide-antibodies (ACPA)-positive (60.3% vs 44.4%,p=0.001).
2 van Steenbergen HW, et al. Ann Rheum Dis 2014;0:1–7. doi:10.1136/annrheumdis-2013-204277
Clinical and epidemiological research
group.bmj.com on August 21, 2014 - Published by ard.bmj.comDownloaded from

SHS-unit per year is minimal; the latter cut-off was chosenbecause rapid radiologic progression is generally defined as anincrease of 5 SHS-units per year.8–10 In all analyses, the differ-ence in SHS was log10-transformed to approximate a normaldistribution.
AnalysesThe performance of prediction models can be evaluated usingdifferent aspects, see table 2.20 21 Inherent to the method ofdetermining these aspects, the radiologic progression rate over6 years was studied as a continuous or categorised outcome.
Improved fit. First, a linear mixed model analysis was usedwith serial log10-transformed SHS over 6 years as response vari-able and time and risk factors as variables. The ARH1 covari-ance matrix was used as suggested previously by Knevel et al.22
Valuable of this repeated measurement analysis (RMA) is that ittakes advantage of within-patient correlations of serial X-raysand allows the inclusion of patients with missing X-rays atcertain time-points (figure 1). The improved fit of the modelwhen adding treatment effects, traditional risk factors, geneticrisk factors or combinations of these to a model consisting ofonly time effect was measured as the relative increase in theNagelkerke R2 between the models with the risk factors of inter-est and with only the time effect.23 Importantly, this is not adirect measure of the explained variance, which cannot be
determined in RMA such as linear mixed model analysis.Therefore, the R2 was subsequently determined in linear regres-sion analyses.
R2. This reflects the absolute proportion of the variance thatis explained by the factors in the model and was determinedusing linear regression analyses with ΔSHS0–6 years as outcome.A limitation of this outcome is that only patients with completefollow-up could be studied (figure 1). Regression models werefitted that included treatment effects, traditional risk factors,genetic risk factors or combinations of these. Because addingmore variables to a model will increase the fit of a model andthus the R2, the adjusted R2 was also calculated. This includes acorrection for the number of variables in the regression model.
C-statistic. Harrel’s C-statistic was assessed as described in theonline supplementary methods.24 It reflects the accuracy of dis-criminating patients with and without the outcome and doesnot reflect the absolute risk on an outcome. For clinical risk pre-diction it is more relevant that a new model can more accuratelystratify individuals into risk categories. Hence, calibration(agreement between observed and predicted outcomes) andreclassification have gained popularity.25 26
Calibration and Reclassification. First, the observed ΔSHS0–6 years
was plotted against the ΔSHS0–6 years that was predicted by linearregression models including treatment effects and traditionalfactors or including treatment effects, traditional and genetic
Figure 2 Proportions of explained variance (R2) (A–C) and adjusted explained variance (adjusted R2) (D–F) in progression in Sharp–van der Heijdescore over six years (ΔSHS0–6 years) by treatment effects and traditional risk factors (A and D), genetic risk factors (B and E), and treatment effects,traditional and genetic risk factors (C and F). The treatment strategy differed for different inclusion period. Therefore, the effects of treatment weredetermined before adding traditional and genetic factors (A, C, D and F). The studied traditional risk factors are presented in table 3 and included age,gender, symptom duration at first visit, localisation initial joint symptoms, 66-swollen joint count, Body Mass Index (BMI), anticitrullinated-peptide-antibodies (ACPA)-positivity, IgM-RF-positivity and erythrocyte sedimentation rate (ESR). The studied genetic risk factors are presented in table 1 andincluded genetic variants in human leucocyte antigens (HLA)-DRB1, CD40, IL-15, DKK-1, IL2RA, granzyme-B (GRZB), IL-4R, SPAG16, C5orf30, MMP-9and osteoprotegerin (OPG). The data presented are based on the patients with complete data over six years (n=239). Analyses on all patients afterimputation of missing data (n=427) revealed similar results, see online supplementary table S2B. The p value for change in R2 after adding geneticfactors was 0.056 for patients with complete data.
van Steenbergen HW, et al. Ann Rheum Dis 2014;0:1–7. doi:10.1136/annrheumdis-2013-204277 3
Clinical and epidemiological research
group.bmj.com on August 21, 2014 - Published by ard.bmj.comDownloaded from
factors (calibration plot). Then the actual observed ΔSHS0–6 years
and the predicted ΔSHS0–6 years were categorised in three severitygroups (ΔSHS0–6 years ≤6, 7–30 and >30 units). To assess theimprovement in predictive performance gained by adding geneticinformation to the prediction model, the proportion of patientsthat was not correctly reclassified (correct reclassifications minusincorrect reclassifications) was determined. This was done for thetotal population and for each severity group separately.
Sensitivity analysesThe R2 depends on the variance of the outcome. Therefore, theR2 may change in case other follow-up durations are studied. Toassess the influence of this effect, the R2 was also determinedfor radiologic progression over 4, 5 and 7 years (ΔSHS0–4 years,ΔSHS0–5 years and ΔSHS0–7 years).
Only 239 of the 426 patients had complete radiologic data tillyear 6. As missing was not completely at random, we repeatedthe linear regression analyses with missing radiologic dataimputed. We performed single conditional mean imputation byreplacing missing values with the values predicted by the RMAwith SHSs over 7 years of disease as outcome, and time and alltraditional and genetic risk factors as variables. Subsequently, theR2 and reclassifications were again determined.
Some of the genetic variants were identified as risk factors forradiologic progression in ACPA-positive RA, the more severesubset of RA. Therefore, the analyses of R2 and reclassificationswith ΔSHS0–6 years as outcome were repeated in theACPA-positive subgroup (n=144).
Analyses were performed using SPSS V.20.0 and Stata V.12.
RESULTSPatients and traditional risk factorsPatient characteristics are presented in table 3. The median SHSat baseline was 5.0 (IQR 2.0–10.0) and at year 6 it was 22.3
(IQR 9.0–47.0); the median ΔSHS0–6 years was 14.0 (IQR 4.5–39.0). Treatment effects explained 7.1% of the variance ofradiologic progression over 6 years (ΔSHS0–6 years). The R2 ofthe individual traditional risk factors, determined in univariateregression analyses showed the highest values for ACPA and RF(R2 22.8% and 19.4%, respectively, table 3). All traditional riskfactors together explained 31.2% of the variation and treatmenteffects and traditional risk factors combined explained 36.5%(figure 2A, see online supplementary table S2A). The adjustedR2s were respectively 28.5% and 33.7% (figure 2D).
Genetic risk factorsImproved fitFirst, all radiologic data of 426 patients were assessed usingRMA. Models without and with genetic risk factors were com-pared, revealing that the model including the genetic risk factorshad a 3.2% better fit in predicting radiologic progression com-pared to a model including only treatment effects and trad-itional risk factors (see online supplementary table S1). Sincethis measure is difficult to interpret, we continued with deter-mining the R2.
R2
The R2 of individual genetic risk factors was determined in uni-variate analyses (table 1). Rs11908352 in MMP-9 and the humanleucocyte antigens-shared epitope (HLA-SE) alleles had thelargest R2 (4.7% and 4.0%, respectively). All genetic risk factorstogether explained 18.1% of the variance in ΔSHS0–6 years
(figure 2B). The adjusted R2 was 11.8% (figure 2E). Next, it wasstudied to what extent the genetic risk factors increased the R2
compared to a model including treatment effects and traditionalrisk factors. A model including all factors (treatment effects,traditional and genetic risk factors) resulted in an R2 of 43.9%and adjusted R2 of 36.7%. As the R2 of the model, including
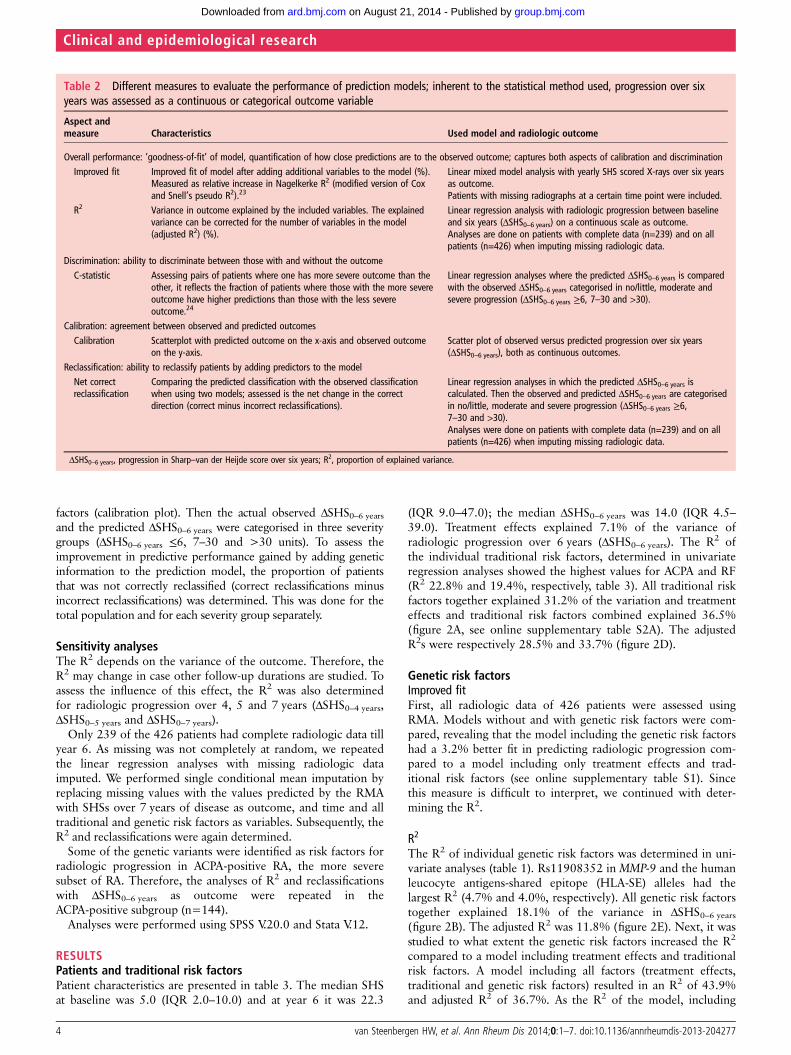
Table 2 Different measures to evaluate the performance of prediction models; inherent to the statistical method used, progression over sixyears was assessed as a continuous or categorical outcome variable
Aspect andmeasure Characteristics Used model and radiologic outcome
Overall performance: ‘goodness-of-fit’ of model, quantification of how close predictions are to the observed outcome; captures both aspects of calibration and discriminationImproved fit Improved fit of model after adding additional variables to the model (%).
Measured as relative increase in Nagelkerke R2 (modified version of Coxand Snell’s pseudo R2).23
Linear mixed model analysis with yearly SHS scored X-rays over six yearsas outcome.Patients with missing radiographs at a certain time point were included.
R2 Variance in outcome explained by the included variables. The explainedvariance can be corrected for the number of variables in the model(adjusted R2) (%).
Linear regression analysis with radiologic progression between baselineand six years (ΔSHS0–6 years) on a continuous scale as outcome.Analyses are done on patients with complete data (n=239) and on allpatients (n=426) when imputing missing radiologic data.
Discrimination: ability to discriminate between those with and without the outcomeC-statistic Assessing pairs of patients where one has more severe outcome than the
other, it reflects the fraction of patients where those with the more severeoutcome have higher predictions than those with the less severeoutcome.24
Linear regression analyses where the predicted ΔSHS0–6 years is comparedwith the observed ΔSHS0–6 years categorised in no/little, moderate andsevere progression (ΔSHS0–6 years ≥6, 7–30 and >30).
Calibration: agreement between observed and predicted outcomesCalibration Scatterplot with predicted outcome on the x-axis and observed outcome
on the y-axis.Scatter plot of observed versus predicted progression over six years(ΔSHS0–6 years), both as continuous outcomes.
Reclassification: ability to reclassify patients by adding predictors to the modelNet correctreclassification
Comparing the predicted classification with the observed classificationwhen using two models; assessed is the net change in the correctdirection (correct minus incorrect reclassifications).
Linear regression analyses in which the predicted ΔSHS0–6 years iscalculated. Then the observed and predicted ΔSHS0–6 years are categorisedin no/little, moderate and severe progression (ΔSHS0–6 years ≥6,7–30 and >30).Analyses were done on patients with complete data (n=239) and on allpatients (n=426) when imputing missing radiologic data.
ΔSHS0–6 years, progression in Sharp–van der Heijde score over six years; R2, proportion of explained variance.
4 van Steenbergen HW, et al. Ann Rheum Dis 2014;0:1–7. doi:10.1136/annrheumdis-2013-204277
Clinical and epidemiological research
group.bmj.com on August 21, 2014 - Published by ard.bmj.comDownloaded from

treatment effects and traditional risk factors was 36.5%,the increase in the R2 by genetic risk factors was 7.4%(p value R2change=0.056, figure 2C, see online supplementarytable S2A). When comparing adjusted R2s, genetic factorsincreased the R2 with 3.0% (figure 2F).
C-statisticThe C-statistic increased from 0.78 (95% CI 0.73 to 0.82) for amodel with treatment and traditional factors to 0.82 (95% CI0.77 to 0.86) for a model including treatment, traditional andgenetic factors.
Table 3 Characteristics of patients and the R2 of each individual characteristic for radiologic progression over six years
All patients (n=426) R2 ΔSHS0–6 years (%) in RA (n=239) R2 ΔSHS0–6 years (%) ACPA-pos RA (n=144)
Age, mean (SD), years 56.6 (15.3) <0.1 <0.1Female gender, n (%) 290 (68.1%) 1.7 0.9Symptom duration at first visit, median (IQR), months 4.4 (2.4–8.6) 2.3 0.7Localisation initial joint symptoms <0.1 0.1Upper extremities, n (%) 204 (47.9%)Lower extremities, n (%) 57 (13.4%)Upper and lower extremities, n (%) 165 (38.7%)
66-SJC, median (IQR), n 8 (4–14) 2.0 <0.1BMI, median (IQR), n 25.4 (23.0–27.6) 3.1 1.8ACPA-positive, n (%) 227 (53.3%) 22.8 -IgM-RF positive, n (%) 248 (58.2%) 19.4 0.3ESR, median (IQR), mm/h 33.0 (18.0–55.0) 2.7 2.0
R2, proportion of explained variance; ΔSHS0–6 years, progression in Sharp–van der Heijde score over six years; RA, rheumatoid arthritis; ACPA, anti-citrullinated peptide antibody; SJC,66-swollen joint count; BMI, Body Mass Index; IgM-RF, immunoglobulin M-rheumatoid factor; ESR, erythrocyte sedimentation rate; mm/h, millimetre per hour.The presented R2 s were based on univariate analyses of each individual risk factor.239 patients of the total included 426 patients completed follow-up until six years, 144 of these patients were ACPA-positive.
Figure 3 Distribution of observedradiologic progression over six years(A), predicted versus observedradiologic progression over six years bya model consisting of treatment effects,traditional and genetic risk factors(B) and numbers of patients percategorised observed and predictedΔSHS over six years by models withoutand with genetic risk factors, resultingin the net proportion of correctreclassifications (C). ΔSHS, progressionin Sharp–van der Heijde score. (B) Thedots in the boxes represent the 148 ofthe 239 patients in whom the severityof radiologic progression over six yearswas correctly predicted by the model,including treatment effects, traditionaland genetic risk factors. (C) The modelwithout genetic risk factors correctlyclassified 134 of 239 patients (56.1%)and the model with genetic risk factorscorrectly classified 148 of 239 patients(61.9%), resulting in a total netproportion of correct reclassifications of5.8% (95% CI 3.2 to 9.6%). Evaluatingreclassifications per severity groupshowed, respectively, no net change (5correct and 5 incorrect reclassifications,0/72), a 5.1% net increase (10 correctand 5 incorrect reclassifications, 5/99)and a 13.2% net increase (14 correctand 5 incorrect reclassification, 9/68) incorrect classifications for the groupswith no/little, moderate and severeprogression (see also onlineSupplementary table S3).
van Steenbergen HW, et al. Ann Rheum Dis 2014;0:1–7. doi:10.1136/annrheumdis-2013-204277 5
Clinical and epidemiological research
group.bmj.com on August 21, 2014 - Published by ard.bmj.comDownloaded from

Calibration and reclassificationObserved progression rates were plotted against predicted pro-gression rates by a linear regression model with treatmenteffects and traditional risk factors as variables. When categoris-ing patients in three groups (ΔSHS0–6 years ≤6, 7–30 and >30units) 134 of 239 patients (56.1%) were correctly classified.When genetic factors were added, 148 out of 239 patients(61.9%) were correctly classified by the model (figure 3B,C).Hence in total this concerned a net increase in correctly classi-fied patients (proportion of correct reclassifications) of 5.9%(95% CI 3.2 to 9.6%). Evaluating the reclassifications per sever-ity group, showed no net change for the group with no/littleprogression, a 5.1% net increase in correctly classified patientsfor the group with moderate progression, and a 13.2% netincrease in correctly classified patients for the group with severeprogression (figure 3C, see online supplementary table S3).Thus, the proportion of patients that was correctly reclassifiedwhen adding genetic factors increased in particular in the mostsevere patient group.
Sensitivity analysesTo check for consistency, ΔSHS0–4 years, ΔSHS0–5 years, andΔSHS0–7 years were also assessed as outcomes. Adding geneticrisk factors to a model with treatment effects and traditional riskfactors yielded an increase in R2 of 5.5% for ΔSHS0–4 years
(p value R2change=0.085), 7.1% for ΔSHS0–5 years (p value R2change=0.035) and 9.8% for ΔSHS0–7 years (p value R2change=0.026) (seeonline supplementary table S2A).
When missing SHSs were imputed and all 426 patients werestudied, the increase in R2 when adding genetic factors to amodel with treatment and traditional risk factors andΔSHS0–6 years as outcome was 5.3% (p value R2change=0.001)(see online supplementary table S2B). The net proportion ofpatients that was correctly reclassified was 5.4% (95% CI 3.5 to8.0%); for the groups with no/little, moderate and severe pro-gression these were respectively 1.3%, 6.6% and 9.5%. Theproportion of correctly classified patients was 286/426 (67.1%)(see online supplementary table S4).
In the subset of ACPA-positive patients, the median SHS at year6 was 32.5 (IQR 17.3–65.8), and the median ΔSHS0–6 years 24.0(IQR 10.6–57.5). The genetic factors together explained 17.1%of the variance in ΔSHS0–6 years. Adding genetic factors to a modelalready including treatment effects and traditional risk factorsincreased the R2 with 15.1% (p value R2change 0.11, see onlinesupplementary table S5). The net proportion of correctly reclassi-fied patients was 4.9% (95% CI 2.0 to 9.8%); for three severitygroups, these were 0%, 3.1% and 8.6%. The model including allfactors classified 91/144 (63.2%) of the ACPA-positive patientscorrectly (see online supplementary table S6).
DISCUSSIONNew genetic risk factors for radiologic progression in RA havebeen identified recently. This study evaluated how much of thevariance in radiologic progression is explained by these geneticfactors together and whether these genetic factors improve pre-dicting the severity of the disease course. We observed thatgenetic risk factors together explained 12–18% of the variancein joint destruction, and that adding the genetic factors to a pre-diction model already consisting of treatment effects and trad-itional risk factors resulted in a net increase of correctlyclassified patients of 6%. This increase was largely due toimproved identification of patients with severe progression.
Based on the Icelandic RA-population, the heritability of radio-logic progression was estimated at 45–58%.2 Our observation thatstudied genetic factors explained around 18% suggest that part ofthe heritability is still missing. Several explanations may account forthis. Part of the relevant genetic variants may still be unidentified orgene-gene interactions may play a role. The heritability in theIcelandic and Dutch RA-population may also be dissimilar, prohi-biting a direct comparison of percentages.
Adding genetic factors to a model with known risk factorshad a small but independent contribution (3–7%) to theexplained variance in radiologic progression. An explanationthat this increase is less than the 12–18% of variation found forgenetics alone is that part of the genetic factors are associatedwith traditional risk factors that were already included in themodel. Probably these genetic factors relate to the outcome bymediating through these traditional risk factors and, therefore,they do not contribute to the model when the intermediate riskfactors are also included. This observation differs from previousobservations done for RA-susceptibility where identified geneticsusceptibility factors did not contribute independently to pre-dicting the development of RA using a model with traditionalfactors, among which is ACPA.27 The variants that had thelargest independent contribution to the increase in R2 werers1528873(DKK-1), rs7607479(SPAG16) and rs11908352(MMP-9) (data not shown). Intriguingly, all these proteins areinvolved in bone metabolism or cartilage destruction, processesthat were not represented by the assessed traditional factors.Notably, due to the strong correlation between ACPA andHLA-SE, adding only HLA-SE to a model already containingACPA was not helpful (R2 change 0.1%, p value R2change=0.63).Conversely, the R2 change when adding the non-HLAvariants to the model including traditional factors was 7.3%(p value R2change=0.045).
The existing prediction matrices for rapid radiologic progres-sion consist of a few traditional risk factors, were developed in aselected set of severe RA patients, could not adequately classify∼50% of the patients and had difficulties with identifying thepatients with severe progression in particular.8–13 We evaluatednine traditional factors in a general population of RA patients,and observed that also here, 46% of RA patients were incor-rectly classified. When evaluating traditional and genetic factors62% of RA patients were correctly classified and 38% misclassi-fied. Assuming that clinicians prefer to have at least 80% of thepatients correctly predicted, the derived models includinggenetic variants were still insufficient for use in clinical practice.Importantly, with the help of genetic factors, the correct identi-fication of especially those RA patients with severe radiologicprogression increased.
We have chosen to study genetic variants that were replicatedin independent studies or found significant in meta-analysisincluding all published data. Variants that were associated withradiologic progression in only one or two cohorts but not repli-cated or significant in meta-analyses were not included.(Krabben et al, 2013, unpublished review) Potentially, futureresearch will reveal more severity factors for RA and mightincrease the predictive accuracy.
Because of the negative implication of our conclusion, we didnot seek for external validation or internal validation using cross-validation. The observed R2 values may have been overestimatedas many variables were included. Controlling for overfitting wasdone by determining the adjusted R2 (correcting for the numberof variables). However, some variables were correlated (for SNPsthe correlation coefficients were <0.8) and, consequently, thecorrection may have been too stringent and the adjusted R2
6 van Steenbergen HW, et al. Ann Rheum Dis 2014;0:1–7. doi:10.1136/annrheumdis-2013-204277
Clinical and epidemiological research
group.bmj.com on August 21, 2014 - Published by ard.bmj.comDownloaded from
values underestimated. Presumably, the actual explained variancelies between the presented R2 and adjusted R2 values.
Several sensitivity analyses were done to check for the consist-ency of the results on the R2. Because missing radiologic data maybe due to selection bias, analyses were also repeated after imput-ation of missing radiographs. Nonetheless, the consistent results inall sensitivity analyses indicate the reliability of our results.
Because some of the genetic risk factors were identified inACPA-positive RA, we also performed subanalyses onACPA-positive patients. Compared to the total RA population,the R2 of the traditional risk factors was smaller (this may beexplained by absence of the effect of ACPA) and the increase inR2 when adding genetic factors was larger. Importantly, the R2
values between the total and ACPA-positive population cannotbe directly compared, as the total variance in ΔSHS0–6 years dif-fered. The number of ACPA-positive patients was relativelysmall, providing another limitation.
In conclusion, all genetic severity factors together explained12–18% of the variance in radiologic progression. Additionaluse of genetic factors resulted in increased correct classificationof patients in severity risk groups. Nonetheless, 38% of thepatients were still not correctly classified. Therefore, we consid-ered the predictive performance of the derived predictionmodel insufficient for use in clinical practice.
Acknowledgements This work was supported by a Vidi-grant of The NetherlandsOrganisation for Scientific Research, BTCURE and Masterswitch.
Contributors HvS substantially contributed to the conception of the work, theacquisition, analysis and interpretation of data and drafted the work. RT, TH and SlCsubstantially contributed to the analysis and interpretation of data and revised thework critically for important intellectual content. AvdH substantially contributed tothe conception of the work, the acquisition, analysis and interpretation of data,drafted and revised the work critically for important intellectual content. All authorsgave approval to submit this final version of the manuscript and agreed to beaccountable for all aspects of the work in ensuring that questions related to theaccuracy or integrity of any part of the work are appropriately investigated andresolved.
Competing interests None.
Patient consent Obtained.
Ethics approval Medical ethics committee Leiden University Medical Center.
Provenance and peer review Not commissioned; externally peer reviewed.
REFERENCES1 Odegard S, Landewe R, van der Heijde D, et al. Association of early radiographic
damage with impaired physical function in rheumatoid arthritis: a ten-year,longitudinal observational study in 238 patients. Arthritis Rheum 2006;54:68–75.
2 Knevel R, Grondal G, Huizinga TW, et al. Genetic predisposition of the severity ofjoint destruction in rheumatoid arthritis: a population-based study. Ann Rheum Dis2012;71:707–9.
3 Knevel R, Krabben A, Wilson AG, et al. A genetic variant in granzyme B isassociated with progression of joint destruction in rheumatoid arthritis. ArthritisRheum 2013;65:582–9.
4 de Rooy DP, Yeremenko NG, Wilson AG, et al. Genetic studies on components ofthe Wnt signalling pathway and the severity of joint destruction in rheumatoidarthritis. Ann Rheum Dis 2013;72:769–75.
5 de Rooy DP, Zhernakova A, Tsonaka R, et al. A genetic variant in the region ofMMP-9 is associated with serum levels and progression of joint damage inrheumatoid arthritis. Ann Rheum Dis Published Online First: 21 May 2013.doi:10.1136/annrheumdis-2013–203375.
6 Knevel R, Klein K, Somers K, et al. Identification of a genetic variant for jointdamage progression in autoantibody-positive rheumatoid arthritis. Ann Rheum DisPublished Online First: 16 Aug 2013. doi:10.1136/annrheumdis-2013–204050.
7 de Rooy DP, van der Linden MP, Knevel R, et al. Predicting arthritis outcomes--whatcan be learned from the Leiden Early Arthritis Clinic? Rheumatology (Oxford)2011;50:93–100.
8 Visser K, Goekoop-Ruiterman YP, de Vries-Bouwstra JK, et al. A matrix risk modelfor the prediction of rapid radiographic progression in patients with rheumatoidarthritis receiving different dynamic treatment strategies: post hoc analyses from theBeSt study. Ann Rheum Dis 2010;69:1333–7.
9 Vastesaeger N, Xu S, Aletaha D, et al. A pilot risk model for the prediction of rapidradiographic progression in rheumatoid arthritis. Rheumatology (Oxford)2009;48:1114–21.
10 Fautrel B, Granger B, Combe B, et al. Matrix to predict rapid radiographicprogression of early rheumatoid arthritis patients from the community treated withmethotrexate or leflunomide: results from the ESPOIR cohort. Arthritis Res Ther2012;14:R249.
11 Syversen SW, Gaarder PI, Goll GL, et al. High anti-cyclic citrullinated peptide levelsand an algorithm of four variables predict radiographic progression in patients withrheumatoid arthritis: results from a 10-year longitudinal study. Ann Rheum Dis2008;67:212–17.
12 Lillegraven S, Paynter N, Prince FH, et al. Performance of matrix-based risk modelsfor rapid radiographic progression in a cohort of patients with establishedrheumatoid arthritis. Arthritis Care Res (Hoboken) 2013;65:526–33.
13 Durnez A, Vanderschueren G, Lateur L, et al. Effectiveness of initial treatmentallocation based on expert opinion for prevention of rapid radiographic progressionin daily practice of an early RA cohort. Ann Rheum Dis 2011;70:634–7.
14 van Riel PLCM, Fransen J, Scott DL. Eular handbook of clinical assessments inrheumatoid arthritis. 2004. Alphen aan den Rijn, Van Zuiden Communications BV2004:10–21.
15 van der Linden MP, Feitsma AL, le Cessie S, et al. Association of a single-nucleotidepolymorphism in CD40 with the rate of joint destruction in rheumatoid arthritis.Arthritis Rheum 2009;60:2242–7.
16 Knevel R, Krabben A, Brouwer E, et al. Genetic variants in IL15 associate withprogression of joint destruction in rheumatoid arthritis: a multicohort study. AnnRheum Dis 2012;71:1651–7.
17 Krabben A, Wilson AG, de Rooy DP, et al. Brief report: Association of geneticvariants in the IL4 and IL4R genes with the severity of joint damage in rheumatoidarthritis: a study in seven cohorts. Arthritis Rheum 2013;65:3051–7.
18 Knevel R, de Rooy DP, Zhernakova A, et al. Association of variants in IL2RA withprogression of joint destruction in Rheumatoid Arthritis. Arthritis Rheum2013;65:1684–93.
19 Teare MD, Knevel R, Morgan MD, et al. Allele-dose association of the C5orf30rs26232 variant with joint damage in rheumatoid arthritis. Arthritis Rheum2013;65:2555–61.
20 Cook NR, Ridker PM. Advances in measuring the effect of individual predictors ofcardiovascular risk: the role of reclassification measures. Ann Intern Med2009;150:795–802.
21 Steyerberg EW, Vickers AJ, Cook NRG, et al. Assessing the performance ofprediction models: a framework for traditional and novel measures. Epidemiology2010;21:128–38.
22 Knevel R, Tsonaka R, le Cessie S, et al. Comparison of methodologies for analysingthe progression of joint destruction in rheumatoid arthritis. Scand J Rheumatol2013;42:182–9.
23 Harrell FE Jr. Regression Modeling Strategies: With Applications to Linear Models,Logistic Regression, and Survival Analysis. New York: Springer-Verlag, 2001:204.
24 Harrell FE Jr, Lee KL, Mark DB. Multivariable prognostic models: issues indeveloping models, evaluating assumptions and adequacy, and measuring andreducing errors. Stat Med 1996;15:361–87.
25 Pencina MJ, D’Agostino RB Sr, D’Agostino RB Jr, et al. Evaluating the addedpredictive ability of a new marker: from area under the ROC curve to reclassificationand beyond. Stat Med 2008;27:157–72.
26 Cook NR. Use and misuse of the receiver operating characteristic curve in riskprediction. Circulation 2007;115:928–35.
27 van der Helm-van Mil AH, Toes RE, Huizinga TW. Genetic variants in the predictionof rheumatoid arthritis. Ann Rheum Dis 2010;69:1694–6.
28 van der Helm-van Mil AH, Huizinga TW, Schreuder GM, et al. An independent roleof protective HLA class II alleles in rheumatoid arthritis severity and susceptibility.Arthritis Rheum 2005;52:2637–44.
van Steenbergen HW, et al. Ann Rheum Dis 2014;0:1–7. doi:10.1136/annrheumdis-2013-204277 7
Clinical and epidemiological research
group.bmj.com on August 21, 2014 - Published by ard.bmj.comDownloaded from

doi: 10.1136/annrheumdis-2013-204277 published online January 15, 2014Ann Rheum Dis
Hanna W van Steenbergen, Roula Tsonaka, Tom WJ Huizinga, et al. genetic factorsrheumatoid arthritis; the contribution of Predicting the severity of joint damage in
http://ard.bmj.com/content/early/2014/01/15/annrheumdis-2013-204277.full.htmlUpdated information and services can be found at:
These include:
Data Supplement http://ard.bmj.com/content/suppl/2014/01/15/annrheumdis-2013-204277.DC1.html
"Supplementary Data"
References http://ard.bmj.com/content/early/2014/01/15/annrheumdis-2013-204277.full.html#ref-list-1
This article cites 22 articles, 10 of which can be accessed free at:
P<P Published online January 15, 2014 in advance of the print journal.
serviceEmail alerting
the box at the top right corner of the online article.Receive free email alerts when new articles cite this article. Sign up in
(DOIs) and date of initial publication. publication. Citations to Advance online articles must include the digital object identifier citable and establish publication priority; they are indexed by PubMed from initialtypeset, but have not not yet appeared in the paper journal. Advance online articles are Advance online articles have been peer reviewed, accepted for publication, edited and
http://group.bmj.com/group/rights-licensing/permissionsTo request permissions go to:
http://journals.bmj.com/cgi/reprintformTo order reprints go to:
http://group.bmj.com/subscribe/To subscribe to BMJ go to:
group.bmj.com on August 21, 2014 - Published by ard.bmj.comDownloaded from

CollectionsTopic
(677 articles)Radiology (diagnostics) � (986 articles)Radiology �
(1118 articles)Clinical diagnostic tests � (2778 articles)Rheumatoid arthritis �
(4233 articles)Musculoskeletal syndromes � (4326 articles)Immunology (including allergy) �
(3959 articles)Degenerative joint disease � (3639 articles)Connective tissue disease �
Articles on similar topics can be found in the following collections
Notes
(DOIs) and date of initial publication. publication. Citations to Advance online articles must include the digital object identifier citable and establish publication priority; they are indexed by PubMed from initialtypeset, but have not not yet appeared in the paper journal. Advance online articles are Advance online articles have been peer reviewed, accepted for publication, edited and
http://group.bmj.com/group/rights-licensing/permissionsTo request permissions go to:
http://journals.bmj.com/cgi/reprintformTo order reprints go to:
http://group.bmj.com/subscribe/To subscribe to BMJ go to:
group.bmj.com on August 21, 2014 - Published by ard.bmj.comDownloaded from