Embed Size (px)
Citation preview

ROWETT INSTITUTE OF NUTRITION AND HEALTH
Predicting the impact of diet on the human intestinal microbiota
Sylvia H. Duncan and Harry J. Flint
Microbiology Group, Rowett Institute of Nutrition and Health, University of Aberdeen, UK

metabolism of dietary components
immune function, inflammation
pathogenesis
modification of host secretions (mucin, bile, gut receptors..)
Systemic health
Energy supply, satiety
Diabetes
Heart disease
Autoimmune disorders
Gut function, gut disorder
Infection, irritable bowel syndrome,
colitis, colorectal cancer
barrier function energy, nutrient supply
Impact of the gut microbiota on health

Anti-oxidant Molecules
Heterocyclic Amines
N-Nitrosamines
Polyamines
Bile Acids
Indoles Anti-Inflammatory Molecules
N
N N H
2 N H 2
O H
O H
O
O H
H
H
H H
N
N N
N H 2
O O H
O H
N N
O
O H
O
O H O
O H
Phytoestrogens
O
O H
Short Chain Fatty Acids
Damaging Protective
O H
O
O
O H O H
H
O H
Microbially derived metabolites

Human gut microbiota
Factors that impact on bacterial
persistence in the colon Host factors
-Microbiota acquired at birth; aging -Host immune response

Changes in the composition of the human colonic microbiota with aging
Proteobacteria E. coli F. prausnitzii
[Duncan and Flint, Maturitas 2013]

Human gut microbiota
Factors that impact on bacterial
persistence in the colon Host factors
-Microbiota acquired at birth; aging -Host immune response
Gut environmental factors nutrient availability/diet macronutrient and micronutrient
availability pH bile gut transit (wash out) anaerobiosis

Interplay between diet and microbiota on gut health
Protection against
colorectal cancer and
colitis
Exposure to metabolites and bacteria that promote
disease
Interplay between diet and microbiota
phenols, amines, indoles, N-nitroso compounds, H2S, amines, bile acids, faecapentaenes, heme
Nutrient supply to mucosa Barrier against infection
Release of phytochemicals

Principal substrates available for utilization by intestinal microbes
[from Cummings & Macfarlane (1991)]
Resistant starch
Non-starch polysaccharides
Unabsorbed sugars
Oligosaccharides
Dietary protein
Enzymes / secretions / mucus
50 40 30 20 10 Amount [gram per day]
Of dietary & intestinal origin: range

Fermentation of dietary macronutrients in the large intestine
Absorption
Short Chain Fatty Acids + H2 + CO2 + CH4
fermentation Dietary
Polysaccharides
Acetate Propionate Butyrate
1011/ g gut contents (large intestine) Outnumber human cells in the body by 10:1 Several hundred bacterial species colonise each individual Most are oxygen sensitive, but can be cultured

Overview of the microbiology of the human large intestine
Bacterial Groups
Bacteroidetes
Clostridial cluster IV
Clostridial cluster XIVa
Other clostridial clusters
Actinobacteria
Proteobacteria
Verrucomicrobia
10 20 30 40 50
Proportion of total bacteria (%)
Range
Red bars indicate Gram –ve bacterial groups and blue bars for Gram +ve groups
Several hundred bacterial species inhabit the large intestine
Approx. 99 % of colonic bacteria belong to 4 phyla •Bacteroidetes •Firmicutes •Actinobacteria •Proteobacteria

Faecalibacterium prausnitzii
Eubacterium rectale
Colinsella aerofaciens
Clostridium clostridioforme
Bacteroides vulgatus
Anaerostipes hadrus
Ruminococcus bromii
Eubacterium hallii
Blautia wexleri
Bacteroides dorei
Roseburia faecis
Dorea longicatena
Subdoligranulum variabile
Bacteroides uniformis
Ruminococcus obeum
Bacteroides ovatus
Blautia luti
Parabacteroides distasonis
sp nov A2-166
sp nov SR1/5
Lachnospira pectinoschiza
sp nov 80/3
Dialister invisus
Roseburia inulinivorans
Ruminococcus callidus
others
25 cultured species accounted for
approximately 50% of 16S rRNA sequences
Walker AW et al ISME J (2011)
Flint HJ et al Gut Microbes (2012)
Other 50% - 295 phylotypes
(72% uncultured)
Dominant species of human colonic bacteria (26 faecal samples - 6 overweight male volunteers)

16S rRNA sequence analysis of faecal samples
6 volunteers x 4 diets x approx 250 clones per library = 5,920 clones
10 dominant phylotypes phylum % clones Faecalibacterium prausnitzii * Firmicutes (IV) 7.98% Eubacterium rectale* Firmicutes (XIVa) 4.43% Clostridium clostridioforme Firmicutes (XIVa) 3.83% Collinsella aerofaciens Actinobacteria 3.67%
Bacteroides vulgatus Bacteroidetes 3.21% Anaerostipes hadrus* # Firmicutes (XIVa) 2.25% Ruminococcus bromii Firmicutes (IV) 2.11% Eubacterium hallii* Firmicutes (XIVa) 2.00% Blautia wexleri Firmicutes (XIVa) 1.89% Bacteroides dorei Bacteroidetes 1.67% * = butyrate producers Sum 33.0%
# =new species [Allen-Vercoe, et al. 2012]

4 pyruvate
acetyl- P
3 butyryl-CoA
3 butyrate
acetate
4 lactate
4 CO2
ATP
ADP
8 [H]
4 CoA
acetyl-CoA
2 NADH2
2 NAD
2 Fd 2 FdH2
Pi CoA
6 [H]
3 CoA
3 H2O 6 [H]
2 FdH2
4 Fd
2 H2
4 acetyl-CoA
2 acetyl-CoA +
2 acetate
Butyrate formation from lactate and acetate by Eubacterium hallii and Anaerostipes spp.
[Duncan et al, 2004] 4mols lactate+2 mols acetate 3 mols butyrate+4 mols CO2
0
5
10
15
20
25
30
Controls Quiescentcolitis
Mild colitis Moderatecolitis
Severecolitis
Con
cent
ratio
n (m
M)
Lactate accumulation in stool samples of colitis patients (Vernia et al., 1988)
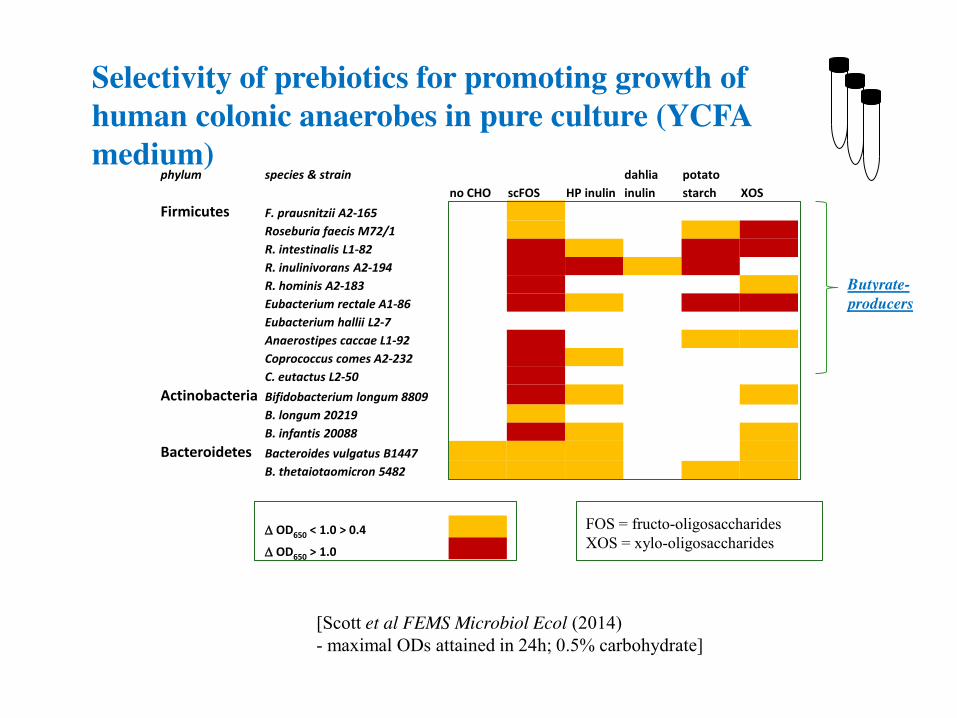
phylum species & strain dahlia potato
no CHO scFOS HP inulin inulin starch XOS Firmicutes F. prausnitzii A2-165
Roseburia faecis M72/1
R. intestinalis L1-82
R. inulinivorans A2-194
R. hominis A2-183
Eubacterium rectale A1-86
Eubacterium hallii L2-7 Anaerostipes caccae L1-92
Coprococcus comes A2-232
C. eutactus L2-50
Actinobacteria Bifidobacterium longum 8809
B. longum 20219
B. infantis 20088
Bacteroidetes Bacteroides vulgatus B1447
B. thetaiotaomicron 5482
' OD650 < 1.0 > 0.4
' OD650 > 1.0
[Scott et al FEMS Microbiol Ecol (2014) - maximal ODs attained in 24h; 0.5% carbohydrate]
Selectivity of prebiotics for promoting growth of human colonic anaerobes in pure culture (YCFA medium)
FOS = fructo-oligosaccharides XOS = xylo-oligosaccharides
Butyrate-producers

Impact of low carbohydrate weight loss diets-human studies
18 human male volunteers; (av. Age 37 y); (av. BMI 35 kg/m2)
low CHO M
moderate CHO
moderate CHO
low CHO
4 weeks 4 weeks 1 week
M
Amount of dietary carbohydrate in the diet

Impact of diet on microbial metabolites in obese human subjects
Carbohydrate g
NSP g
Starch g
Protein g
Fat g
High carbohydrate 400 28 187 94 123 Moderate carbohydrate 170 12 95 127 74
Low carbohydrate 23 6 3 120 126
18 male volunteers (av. Age 37 y); obese (av. BMI 35 kg/m2)

Response of the major phylogenetic groups of human gut bacteria to dietary change
[Duncan, S.H, et al., AEM]
% Eubacterial (Eub338) count in faeces
***
****
***
*
*
0
5
10
15
20
25
30
35
40
Bac303
Fprau645
Rfla729 + Rbro730
Bif164
Erec482
Prop853
Rrec584
Erec - Rrec
log 10 total
Bacterial group (probe)
% Eu
b338
or E
ub33
8 /g
HighModerateLow
*** P < 0.001 * P< 0.05
Diet Carbohydrate Total SCFA Butyrate Butyrate (g) (mM) (mM) (%) High CHO 400 114 18 16 Moderate CHO 170 74 9 12 Low CHO 23 56 4 7

-5
0
5
10
15
20
25
30
8.0 8.5 9.0 9.5 10.0 10.5
log10 Rrec
But
yr
BuKBuMBuNKregression
Relationship between faecal butyrate concentration and bacteria detectable in faeces with the Rrec584 probe in obese human subjects
Diet M – ‘normal’ (high carb);; NK – high protein, medium carb; K – high protein, low carb
Correlation 0.68 (P<0.001)

Impact of diets upon bacterial fermentation products
0.00
5.00
10.00
15.00
20.00
25.00
propionate
butyrate
valer
ate
isova
lerate
isobutyr
ate
% to
tal S
CFA
M
MC
LC
Significant increases in branch chain fatty acids on high protein diets – from amino acid breakdown (leucine, valine, isoleucine)
* p < 0.005
*
* *
* *
*
Comparison of maintenance diet with week 4 mean values for :- medium carbohydrate high protein, low carbohydrate high protein diets

Impact of high protein low carbohydrate diet
low carbohydrate
medium carbohydrate
maintenance
Increase of N-nitrosocompounds on high-protein diet:
0
500
1000 1500
2000
2500
3000
ATNC
(ug/
kg)
¾Low carbohydrate high-protein diets may increase the risk of disease → increase in genotoxic metabolites
[P<0.001]

Major fibre derived phenolics in faecal samples
2
4
6
8
10
12
Ferulic acid 3OMe4OHPPA 3,4OHPPA 3OHPPA
Maintenance Diet Low Carb. Diet 20+/-1 days Low Carb. Diet 27+/-1 days
Major fibre-associated phenolics
P < 0.05 P < 0.001
P < 0.05
Conc
entra
tion
(ug
cm-3
) (ferulic acid derivatives)
8 volunteers
[Russell et al, 2011] O
O H
O HO
O H
O O H
O H
O O H
O
O H
O O H
O
O H
O
O H
O O H
HO
O H
O O H
O
O H
O O H
hydrogenation demethylation dehydroxylation
0
10
20
30
40
50
Bact Erec Rrec2 Rrec1 Ehal Clep Fprau Rum CoAT Bifids
% o
f uni
vers
al 1
6S rR
NA g
ene
copi
es
background control inulin
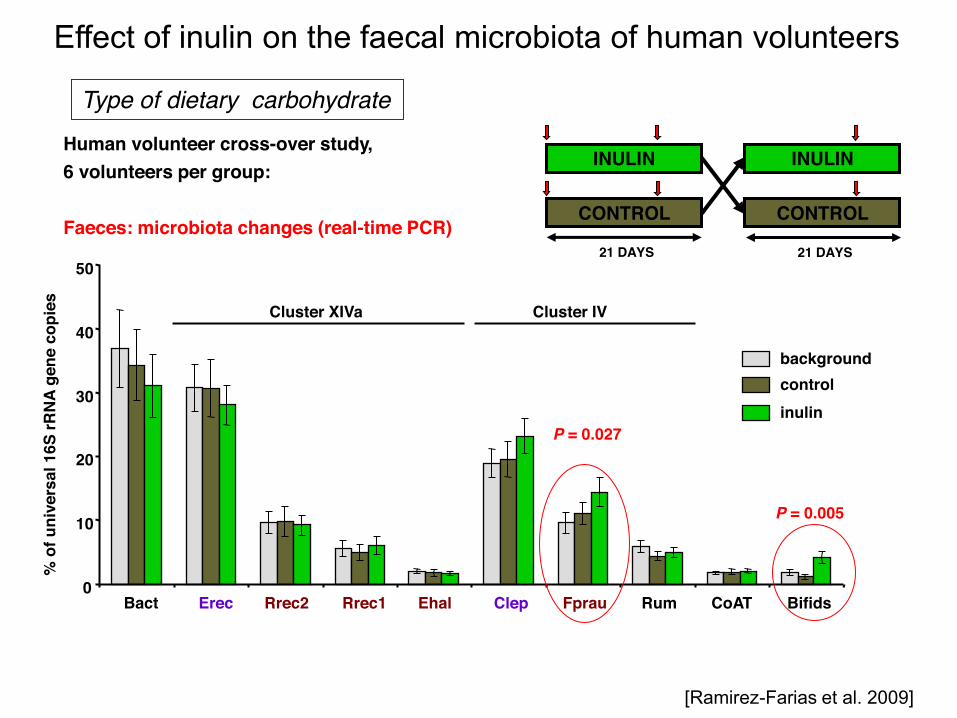
Effect of inulin on the faecal microbiota of human volunteers
Cluster XIVa Cluster IV
P = 0.005
P = 0.027
INULIN
CONTROL
INULIN
CONTROL
21 DAYS 21 DAYS
Human volunteer cross-over study, 6 volunteers per group: Faeces: microbiota changes (real-time PCR)
[Ramirez-Farias et al. 2009]
Type of dietary carbohydrate

14 male volunteers with metabolic syndrome (mean age 54 years, mean BMI 39.4 kg/m2) M: maintenance diet NSP: high non-starch polysaccharide, low RS RS: high resistant starch, low NSP HPMC: high protein, moderate carbohydrate
M NSP RS HPMC 1 wk 3 wks 3 wks 3 wks
Collection of faeces
M NSP RS HPMC Mean dietary intake [g/d]: M 427 230 5 28 103 126 NSP 427 138 2 42 102 136 RS 434 275 26 13 109 127 HPMC 201 110 3 22 144 63
CHO: carbohydrate
Diet CHO starch RS NSP protein fat
Walker et al. 2011, ISME J
Resistant starch compared to non-starch polysaccharide diet
Weight maintenance Weight loss
added wheat bran
added type III resistant starch

Impact of dietary non-digestible carbohydrate
Human volunteer trial – 14 obese males
Res Starch M
Wheat bran
Wheat bran
Res Starch
3 weeks 3 weeks 1 week 3 weeks
Weight loss
Weight loss
M (n =7)
(n =7)
[+ P <0.001]
[Walker A.W. et al (2011) ISME J 5, 220-230]
Impact on the gut microbiota :-

[Walker et al. ISME J 2011]
Cluster IV Ruminococcus spp.
M NSP
WL
RS
0
10
20
30
40
50
0 10 20 30 40 50 60 70
M NSP RS HPMC
% o
f uni
vers
al 1
6S rR
NA g
ene
copi
es
11
12
17
18
19
23
24
Volunteer
0
10
20
30
40
50
60
70
80
0 10 20 30 40 50 60 70
M RS NSP HPMC 14 15 16 20 22 25 26
Volunteer
0
20
40
60
80
100
14 15 16 20 22 25 26 11 12 17 18 19 23 24 volunteer
% s
tarc
h di
gest
ibili
ty
RS diet NSP diet
Time (d) Time (d)

0%
20%
40%
60%
80%
100%
0 10 20 30 40 50
Time (h)
Volunteer 25 %
of r
esid
ual s
tarc
h
no addition
+ B. adolescentis + E. rectale
+ R. bromii
+ B. thetaiotaomicron
mean level of controls
R. bromii is a keystone species essential for extensive
RS fermentation
[Ze et al, ISME J 2012]
Ability of Ruminococcus bromii to restore resistant starch degradation

Human gut microbiota
Factors that impact on bacterial
persistence in the colon Host factors
-Microbiota acquired at birth -Host immune response
Gut environmental factors nutrient availability/diet macronutrient and micronutrient
availability pH bile gut transit (wash out) anaerobiosis

Large intestinal pH
Proximal colon lumen pH 5.2-6.5
Main site of carbohydrate fermentation
Transverse + distal colon lumen pH 6.0-7.0
Available carbohydrates slowly fermentable
Diet (fibre/starch)
GUT HEALTH/ GUT DISORDER
Microbial activity
Colonic pH
Microbial community structure
Gut transit
pH influences the composition of the colonic microbiota

pH responses of two Bacteroides spp. and two butyrate-producing Firmicutes in pure culture (Duncan SH et al Environ Microbiol 2009)
Bacteroides thetaiotaomicron Bacteroides vulgatus Eubacterium rectale Roseburia inulinivorans

continuous flow fermentor (Walker AW et al AEM 2005 Duncan SH et al Env Micro 2009)
Short chain fatty acids -
5.5Community profile (16S rRNA) -
6.5
Impact of pH on SCFA formation by the human colonic microbiota
Bacteroides E. rectale/Roseburia
0
10
20
30
40
50
60
70
0 50 100 150 200 250 300 350
Time (hours)
SCFA
Con
c. (m
M)
FormateAcetatePropionateI - ButyrateButyrateI - ValerateValerateLactateSuccinateCaproateTotal
butyrate
propionate
acetate
total
pH 5.5 pH 6.56.2
[substrate – dietary polysaccharides (mainly starch)]
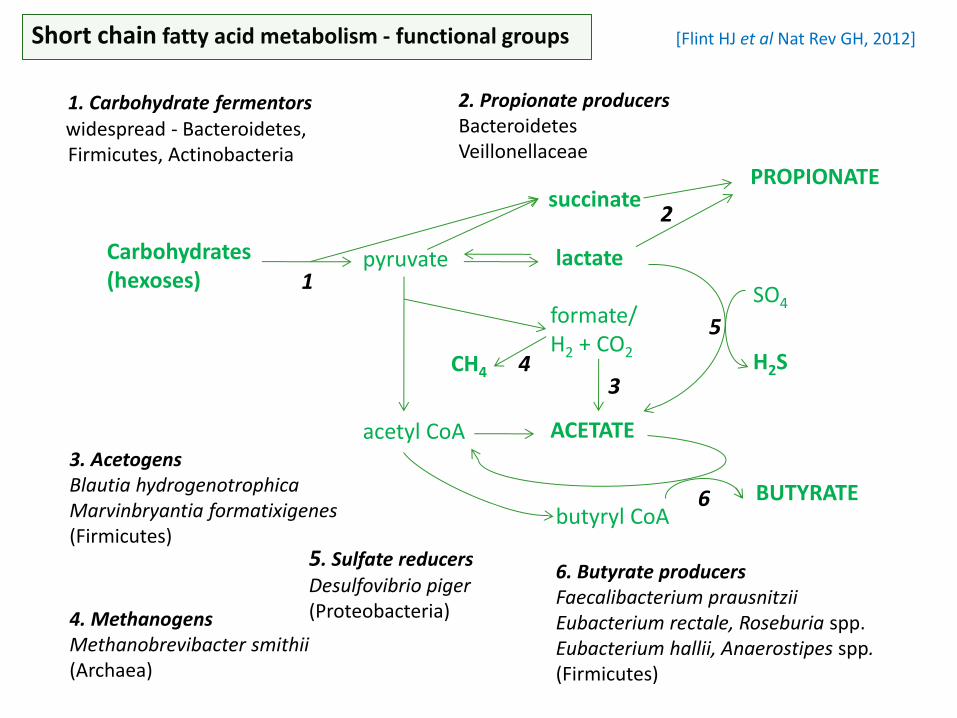
Carbohydrates (hexoses)
lactate
formate/
H2 + CO
2
ACETATE
butyryl CoA
PROPIONATE
BUTYRATE
6. Butyrate producers Faecalibacterium prausnitzii Eubacterium rectale, Roseburia spp.
Eubacterium hallii, Anaerostipes spp. (Firmicutes)
3. Acetogens Blautia hydrogenotrophica Marvinbryantia formatixigenes (Firmicutes)
4. Methanogens Methanobrevibacter smithii (Archaea)
5. Sulfate reducers Desulfovibrio piger (Proteobacteria)
1. Carbohydrate fermentors widespread - Bacteroidetes,
Firmicutes, Actinobacteria
2. Propionate producers Bacteroidetes
Veillonellaceae
pyruvate
acetyl CoA
3
2
1
5 CH4 4
SO4
H2S
6
Short chain fatty acid metabolism - functional groups
succinate
[Flint HJ et al Nat Rev GH, 2012]

NSP starch protein
propionate
Modelling the impact of diet on microbial fermentation in the colon*
H2 + CO2
oligo-saccharides, sugars
lactate
butyrate
acetate
succinate
formate
CH4
B10 B9
B7
B2, B4, B5 B3, B6 B1
B5, B6 B8
PEP
pyruvate
acetyl CoA
B1-B9
B1
B1-B9
B3, B1
(*Kettle H et al, 2014 “Modelling the emergent dynamics of communities of human colonic microbiota: response to pH and peptide” -
Bacterial functional groups :- B1 = Bacteroidetes B2 = Firmicutes (eg. R. bromii) B3 = Firmicutes (eg. E. eligens) B4 = Actinobacteria B5 = Roseburia group B6 = F. prausnitzii B7 = Negativicutes B8 = E. hallii, Anaerostipes B9 = acetogens B10 = methanogens
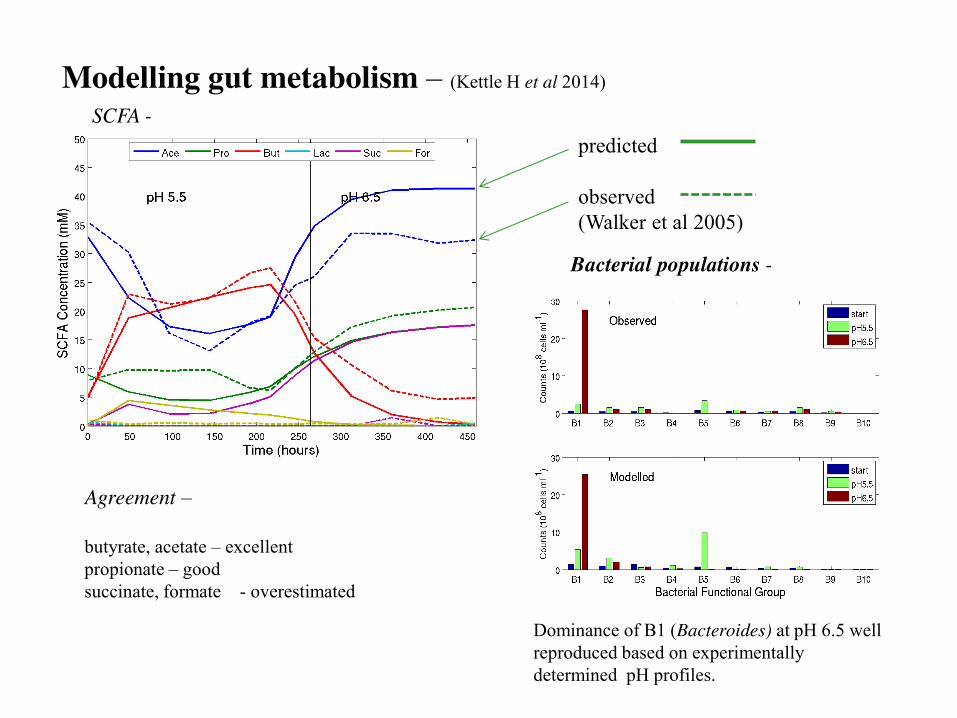
Modelling gut metabolism – (Kettle H et al 2014)
predicted observed (Walker et al 2005)
Agreement – butyrate, acetate – excellent propionate – good succinate, formate - overestimated
Bacterial populations -
Dominance of B1 (Bacteroides) at pH 6.5 well reproduced based on experimentally determined pH profiles.
SCFA -
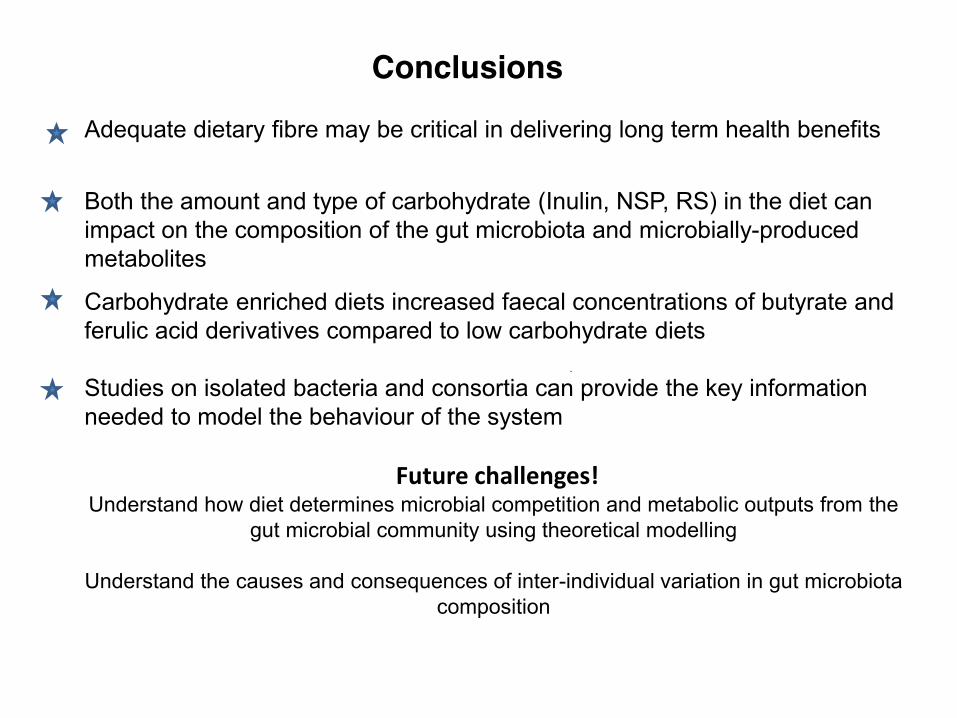
Conclusions Adequate dietary fibre may be critical in delivering long term health benefits
Both the amount and type of carbohydrate (Inulin, NSP, RS) in the diet can impact on the composition of the gut microbiota and microbially-produced metabolites
Carbohydrate enriched diets increased faecal concentrations of butyrate and ferulic acid derivatives compared to low carbohydrate diets Studies on isolated bacteria and consortia can provide the key information needed to model the behaviour of the system
Future challenges! Understand how diet determines microbial competition and metabolic outputs from the
gut microbial community using theoretical modelling
Understand the causes and consequences of inter-individual variation in gut microbiota composition

Microbial Ecology Harry Flint (Head of group)
Faith Chung
Xiaolei Ze
Alvaro Belenguer
Shui Ping Wang
Jenny Laverde
Alan Walker
Petra Louis
Freda Farquharson
Karen Scott
Jenny Martin
OMH, HNU Gerald Lobley
Alex Johnstone
Molecular Nutrition Wendy Russell
BioSS
Helen Kettle
Grietje Holtrop
Collaborators:
Julian Parkhill, Trevor Lawley (Sanger Institute, Cambridge, UK)
Hermie Harmsen, Gjalt Welling (U. Groningen, The Netherlands)
Mireia Lopez-Siles and Jesus Garcia Gill (U. Girona, Spain)
Jerry Wells and Oriana Rossi (U. Wageningen, The Netherlands)
George Macfarlane (U. Dundee, UK)
Annick Bernalier and Christophe Chassard (INRA, Clermont Ferrand, France)
Acknowledgements