Embed Size (px)
Citation preview

The Analysis of Verbal Behavior 2003, 19, 55-89
Predicting Taxonomic and ThematicRelational Responding
J. Grayson Osborne and John HeathUtah State University
Pairs of pictures were classified by the authors and others as related by identity (A-A), basic taxonomy(A-B), superordinate taxonomy (A-C), or by theme (A-D). Two-choice matching-to-sample trial typeswere composed of these same picture pairs in which the sample was common to the two stimulus pairs ineach configuration and, together with the sample, each comparison exemplified one of the relations in thepicture pair; that is: A(AB), A(AC), A(AD), A(BC), A(BD), and A(CD). In five experiments, for eachpicture pair, college students classified the relation (as taxonomic or thematic) and rated its strength (Exps1, 3) or its similarity (Exp 4); others matched to sample the foregoing trial types only (Exps 2, 5), or theyclassified and rated, too (Exp 3). With exceptions, students classed most pairs as the authors did. They alsocollectively ordered relational strengths from (1) identity, (2) basic taxonomy, and (3) theme, to (4)superordinate taxonomy based, in part, on the similarity of sample and comparison. Subjects chose thecomparisons of the more strongly related picture pairs in the matching-to-sample task on 90 percent ormore of the configurations. Subjects' selections in two-choice, matching-to-sample configurations usingnatural stimuli may be based on existing stimulus control topographies such as those exhibited by ratingsof the relations in a configuration.
Humans are said to relate natural stimulicharacteristically at different ages (Denney,1974: Denney & Ziobrowsky, 1972; Smiley &Brown, 1979). Early in life it is supposed thatthey relate natural stimuli thematically, whilelater during school and adult years they relatethem taxonomically. In still later life they mayagain more often relate natural stimuli themati-cally (Smiley & Brown, 1979). The evidencefor these changes in relational responding be-tween and among natural stimuli consists ofaggregated responses averaged across subjectsfrom two general, but distinct, procedures, onein which a subject is given picture (or real ob-ject) stimuli and asked to sort them. Ifarrange-ments result in which cause appears to relatethe stimuli (e.g., horses and riders together),the subject is said to relate the stimuli themati-
Reprints can be obtained from J. Grayson Osborne,Department of Psychology, Utah State University,2810 Old Main Hill, Logan, UT 84322-2810. JohnHeath is now in the PhD program in Psychology atAuburn University. The authors thank LeslieEngstrom (now at Southern Illinois University),Loetta Wood, Michael Warde, Ryan Ward (now atUniversity ofNew Hampshire), Michael Evans, andMarcia Phillips for their help in constructing thestimuli and running Experiments 4 and 5.
cally. Ifthe subject categorizes (e.g., horses areplaced with other horses), the subject is said torelate the stimuli taxonomically.A second procedure-more structured-is to
engage the subject in the generic conditionaldiscrimination known as matching to sample(cf. Sidman & Tailby, 1982) using similarstimuli. In this task the subject is presented apicture (or real object) sample and two picture(or real object) comparison stimuli, one thatrelates to the sample taxonomically and theother that relates to the sample thematically(Osborne & Calhoun, 1998). Selection of acomparison related to the sample taxonomi-cally or a comparison related to the sample the-matically permits the inference of a stimulus-stimulus (or just stimulus) relation betweensample and comparison that is taxonomic orthematic, respectively (Osborne & Calhoun,1998). Thus, matching-to-sample configura-tions such as these contain two potential stimu-lus relations, only one of which controls com-parison selection on any trial. Using this task,the data less typically support the age-relatedhypothesis. Rather, selection of comparisonstimuli relates to contextual variables such asreinforcement for one type of selection (Bauer& Mandler, 1989; Osborne & Koppel, 2001),observation of a model differentially selectingcomparisons ofone kind or another (Smiley &
55

56 OSBORNE AND HEATH
Brown, 1979), receipt of instructions that sug-gest taxonomic selection (Osborne & Calhoun,1998; Waxman & Namy, 1997), or control byspecific contextual stimuli (Osborne & Koppel,2001). Moreover, individual subjects exhibitdifferential frequencies of taxonomic or the-matic selections (Dunham & Dunham, 1995:Osborne & Calhoun, 1998). Finally, individualmatching-to-sample configurations may differ-entially evoke thematic or taxonomic compari-son selections by most subjects (Osborne &Calhoun, 1998). It is this last finding that is ofinterest here.Responding on taxonomic/thematic tasks has
been of considerable theoretical significanceto those involved in developmental and cogni-tive psychology (e.g., Markman & Hutchinson,1984; Markman, 1991). The so-called thematicpreference has been attributed to children'scognitive competence at early age-the impli-cations being that they are either not taxonomi-cally competent in early life (Bruner, Goodnow,& Austin, 1956; Inhelder & Piaget, 1964;Vygotsky, 1962) or that their performance failsto evidence such competence (Gelman, 1978;Gelman & Greeno, 1989). It is now understoodthat even very young infants are taxonomicallycompetent and that taxonomic/thematic re-sponding is context dependent (Bauer &Mandler, 1989; Waxman & Namy, 1997). Butwhat is (are) the context(s) upon which suchresponding depends? As mentioned above, onone level, reinforcement contingencies, mod-eling, and instructions all provide contexts. Onanother level, contexts can also be providedby arbitrary stimuli that enable taxonomic orthematic selections on individual configura-tions (Osborne & Koppel, 2001). Absent all ofthese contexts there remains only the individualtrial configuration and that too appears to pro-vide its own context (Osborne & Calhoun,1998). Unanswered to this point is what it isabout a particular matching-to-sample stimu-lus configuration that may evoke taxonomicor thematic selection, absent other contextualvariables.Which stimulus relation in a particular con-
figuration controls comparison selection mayin part depend on how similar a comparison isto the sample (Fenson, Cameron, & Kennedy,1988). Additionally, the two stimulus relationsin a configuration may be differentially relevantor familiar in terms ofthe subjects' experiences.One way to capture these experiences is to have
subjects respond to the individual stimulus re-lations that comprise a matching-to-sampleconfiguration. Ifsubjects differentially respondto the individual stimulus relations in a taskthat is not matching to sample, such differen-tial responding might presage systematic re-sponding to the entire matching-to-sample con-figuration.
Operationalizing the foregoing, in a condi-tional discrimination that contains two stimu-lus relations-one that exemplifies taxons andone that exemplifies themes-it should be pos-sible to predict selection based on what sub-jects say, via ratings, is the strongest of the tworelations. Subject ratings ofthe strengths ofthestimulus relations comprising the configurationofstimuli on any matching-to-sample trial mayidentify particular stimulus control topogra-phies (Mcllvane & Dube, 1992). If the stimu-lus control topographies of the stimulus rela-tions in the two tasks cohere, then differentialresponding in one should predict differentialresponding in the other. If comparison selec-tion in matching to sample were shown to re-late to prior behavior another contextual vari-able, the stimulus relations comprising the in-dividual configuration, would be shown to ac-count for individual variability in this condi-tional discrimination.
Three Types of Taxonomic Matching toSample
A second purpose of the present studies wasto construct matching-to-sample trial types toreflect potentially different strengths of taxo-nomic and thematic relations. To that end wereflect on some of the different kinds of taxo-nomic relations that may be compared in amatching-to-sample format utilizing naturalstimuli.Matching to sample in trial types contain-
ing A as sample and A as one comparison:A(AX).1 There are at least three types of taxo-nomic relations between natural stimuli: In thefirst, a stimulus is related to itself (cf. Sidman& Tailby, 1982). For example, a picture of acow is related to the identical picture of the
' The first letter (A) denotes the sample in a match-ing-to-sample task. The first letter in the parenthe-ses denotes a comparison in a matching-to-sampletask. The second letter in the parentheses denotes asecond comparison. X = a generic comparison.

PREDICTING RELATIONAL CONTROL 57
cow. The conditionally discriminated responsein which the subject matches a stimulus withitself, in its generalized form exemplifies thelogical property called reflexivity (Sidman &Tailby, 1982). Given that the features of thetwo stimuli that are matched in these trial typesare identical, responding on this type ofmatch-ing to sample has been called identity match-ing (but cf., Sidman & Tailby, 1982). As trialtypes that exemplify A(AX) are presented earlyand often to children, in situations where morethan one controlling relation exists (see below),the stimuli comprising theA-A relation shouldcontrol subjects' selections over other types ofrelation (A-X). Furthermore, the stimulus re-lation operationalized by an A sample and anA comparison should be judged by subjects asmost strongly related. The high strength ofA-A relations may result from the perceptual simi-larity (indeed, the perceptually identical nature)of the two stimuli comprising the relation(Baldwin, 1992; Fenson et al., 1988).What the functionally controlling stimulus
relation is in the matching-to-sample trial typesexemplified by A(AX) may be difficult to dis-cern because there are several stimulus con-trol topographies that exist in these trial types.One source ofstimulus control relates the iden-tity of the stimuli. That is, though the stimulialso exemplify a taxon (e.g., cowl to cowl),the taxonomic relation need not be functional.Alternately, it is also theoretically possible thatthe stimulus control topography in this trial typeis taxonomic exclusive ofthe identical featuresof the two stimuli (cf. Lowenkron, 1998). Athird possibility is that the stimulus control to-pography in this trial type is if ... then (Carter& Werner, 1978), that is, if Al, select Bl. Inthis last instance, the subject's comparison se-lections could be under the control of neitherthe identical physical features, nor the taxo-nomic relation exemplified by the stimuli, butonly the if ... then relation established by thecontingencies in a conditional discrimination.Thus, even given the subject's consistent se-lection of the A-A relation, the coexistingstimulus control topographies make the reasonfor the selection on the A(AX) trial type am-biguous.Matching to sample in trial types contain-
ing A as sample and B as a basic taxonomiccomparison: A(BX). A second type of taxo-nomic matching to sample occurs when thestimuli that are related taxonomically are not
identical, but are of the same basic kind. Forexample, a picture ofa guernsey cow is relatedto a picture of a different cow, say a holstein.The cows have the same general shape but aredifferent in the details (e.g., horns, color, as-pect, etc). In these trial types also, multiplestimulus control topographies make the func-tionally controlling stimulus relation ambigu-ous because the stimuli can be related in thesame several ways: perceptual similarity, ba-sic taxonomy, and if ... then. Given that per-ceptual similarity between the sample (A) andone comparison stimulus (B) in configurationsexemplifying A(BX) matching to sample is stillhigh, A-B stimulus relations should also bejudged strong, but, perhaps not as strong asrelations based on perceptual identity (A-A).Matching to sample in trial types contain-
ingA as sample andC as a superordinate taxo-nomic comparison: A(CX).A third type oftaxo-nomic matching to sample results when thesample (A) in a stimulus configuration relatesto one comparison stimulus at a superordinatelevel (C); for example, the subject matches acow (sample) with a horse (comparison) sinceboth are mammals. In A(CX) trial types, per-ceptual similarity is lower than in A(AX) andA(BX) trial types. The controlling relations inA(CX) trial types should be comparatively lessstrong than those either in A(AX) or in A(BX)because there is less perceptual similarity be-tween sample (A) and comparison (C) (e.g.,cow as sample and whale as comparison).
In A(CX) configurations as well there aremultiple stimulus control topographies, andresponding could occur based on if ... then,similarity, and taxonomic relations between thestimuli. Similarity, while lower than in the otherkinds of taxonomic matching, may not be ab-sent. For example, a subject may be more likelyto relate two stimuli that exemplify animals ifboth have eyes or any minimally comparablebody parts, especially if the remaining stimuliin the trial type have no features in commonwith the sample (e.g., they are plants) (Baldwin,1992).Thematic, A(DX), Matching to Sample
A fourth kind ofmatching to sample involvesa relation between sample (A) and compari-son (D) based on theme, exemplified by sample(dog) and comparison (bone), or sample (horse)and comparison (saddle). As noted above, thistype ofrelation between stimuli has been called

58 OSBORNE AND HEATH
thematic by developmental psychologists. InA-D relations there is no perceptual similaritybetween the sample and the comparison. Su-perficially, it would seem that the strength ofthese relations may be somewhat lower thanthose of taxonomic relations where similaritymay relate the stimuli. However, humans areexposed early and often to stories that relatesuch stimuli.There is little information from a behavior
analytic framework about the stimulus controltopographies extant in the foregoing trial types.It is possible that a hierarchy of stimulus con-trol topographies is exemplified by the fore-going trial types in which stimulus relationsexemplifying identity, basic taxonomy,superordinate taxonomy, and theme are con-trasted.Given the foregoing rationales, in the experi-
ments that follow, it is determined: 1) whethersubjects consistently order the frequencies oftheir taxonomic classifications, e.g., from A-A to A-D; 2) whether subjects consistentlyorder the strength ratings of the relations, e.g.,fromA-A to A-D; and 3) whether prior or sub-sequent subject ratings of relation strengths inpicture pairs exemplifying A-A, A-B, A-C,andA-D relations relate to prior or subsequentrelation selections in matching-to-sample trialtypes composed ofthe stimulus pairs with com-mon samples, that is, A(AB), A(AC), A(AD),A(BC), A(BD), and A(CD).
EXPERIMENT 1
The purpose of this experiment was to testsubject responses to 80 picture pairs in whichthe pairs exemplified an identity relation (A-A), a basic taxonomic relation (A-B), asuperordinate taxonomic relation (A-C), or athematic relation (A-D). Subjects were to clas-sify each pair of pictures as exemplifying ei-ther a taxonomic or a thematic relation and thento rate the strength of the relation between thepictures on a 5-point Likert scale. It was pre-dicted that taxonomic classifications would bemost frequent during A-A pair types and lessfrequent in each pair type thereafter, i.e., A-B,A-C, and A-D. It was further predicted thatrelation strength ratings would be strongest forA-A pairs and less strong for each pair typethereafter, i.e., A-A, A-B, A-C, and A-D.
METHOD
Subjects
Subjects (N = 27) volunteered from a fresh-man psychology class at Utah State Univer-sity. Mean age of the subjects was 20.7 yrs.Subjects were offered extra credit for their par-ticipation in the experiment. The experimentwas conducted in a classroom of the univer-sity and utilized computer controlled audio vi-sual equipment.
Stimuli
Stimuli consisted ofcolored pictures ofcom-mon objects selected from "Corel Magic200,000" software (C 1997 Corel Corporationand Corel Corporation, Limited). Each trialconsisted of a slide showing a pair of pictureshorizontally arrayed, one picture that wouldeventually function as a sample (in matchingto sample), and a second that would eventu-ally function as a comparison that could bematched to the sample. An example of two ofthe stimulus pairs and the matching-to-sampleconfiguration they could become is shown inFigure 1.
Eighty slides were produced of these pairsof pictures. Each slide was composed of a to-be-sample stimulus and a second stimulus re-lated to the first in one of four ways, in theauthors' judgment, i.e., by identity with it (A-A); by a basic taxonomic relation with it (A-B); by a superordinate taxonomic relation withit (A-C); or by a thematic relation with it (A-D) . Table 1 lists all of the picture stimuli.
Procedure
When all the subjects were in the classroomeach was given an informed consent form toread and sign, and each completed personalinformation on optically readable forms(Scantron F262).
Pre-training. After the experimenter (JH) in-troduced himself, subjects were told they wereto decide whether a slide illustrated a taxonomicor a thematic relation after which they were torate the strength of the relation between thestimulus pairs in each slide by marking theirScantron forms. The subjects were then showna slide oftwo dogs, an example ofa taxonomicrelation. The experimenter stated, "It can be

PREDICTING RELATIONAL CONTROL 59
Figure 1. A representation of the two kinds oftasks in theexperiments. In the upper panels the two stimulus pairs(cow and milk bottles; cow and horse) represent two ofthearrangements, observed in single pairs, when the subjectsjudged the kind of relation between the stimuli and thenrated the strength of the relation. Cow and milk bottlesdepict a thematic relation (Al -Dl); cow and horse depicta superordinate taxonomic relation (Al-Cl) (see Table 1).The bottom panel depicts a matching-to-sample configu-ration composed ofthe common stimulus ofthe two stimu-lus relations in the top panels as sample, and the remainingstimuli (milk bottles and horse) as comparisons. Eachmatching-to-sample configuration in the studies was com-posed in this fashion from combining two of the stimuluspairs with common samples (Table 1).
classed taxonomic because the two dogs be-long to the same class; that is, they are bothdogs." Next, a slide ofa dog and cat was shown.The experimenter stated, "Here is a sample ofanother taxonomic relation. Again they are inthe same class, i.e., they are both mammals."The next slide showed a dog and a piece ofmeat. The experimenter stated, "Here is an ex-
ample of a thematic relation. It is a thematicrelation because there is a theme connectingthe two pictures; that is, dogs eat meat." Next,the subjects were shown three further exampleslides-lock and key, cigarette and cigarette,and cigarette and pipe. After showing each slidethe subjects were asked to raise their hands ifthey thought the relation was taxonomic or the-matic. This procedure was used to indicatewhether or not the subjects understood the dif-ference between taxonomic and thematic se-lection. All subjects indicated in each case thatthey understood.The penultimate introductory slide was a
representation ofthe Scantron form so that pre-cise recording instructions could be given,while the ultimate introductory slide was anexample of the instructions that would be oneach slide to indicate to the subjects on whichline of the Scantron to record their selection.Each slide showed a stimulus from Table 1,column A (1A-20A) to the left of the slide,with a stimulus from the same or one of theother columns horizontally aligned with thestimulus from column A to the right side oftheslide (Figure 1, upper panels). The picture pairused approximately the top half the slide. Be-low were instructions on how to mark theScantron form, e.g. "Use Scantron line #1: 1 =Taxonomic; 2 = Thematic. Scantron line #2: 1= Not related; 2 = Very poorly related; 3 =Poorly related; 4 = Well related; 5 = Very wellrelated. Following this, slides of the pairs ofpicture stimuli were presented. Each was pre-sented for approximately 20 seconds or until itwas apparent that all the subjects had filled intheir Scantron forms. The order of the picturepairs was randomized with restrictions that thepicture on the left of the pair could not appeartwice consecutively and the exemplified rela-tion could occur no more than twice, consecu-tively. The picture pairs were placed into "CorelPresentation 8" in the randomized order. In-cluding 9 for pre-training, there were a total of89 slides. At the end of the presentation, theScantron forms were collected by an assistanttogether with the consent forms. The subjectswere thanked for their participation and dis-missed.
Results
Classification. The classification results areshown in Table 2. There was 100% judgment

60 OSBORNE AND HEATH
Table 1. The 80 Stimuli Used in Experiments 1-3.
Sample Sample Basic Taxon Superordinate Theme (D)No. Stimulus (A) Taxon (B) Taxon (C)
1 Cow 1 Cow 2 Horse Milk bottles
2 Frog 1 Frog 2 Turtle Fly
3 Ladybug 1 Ladybug 2 Beetle Lettuce head
4 Chicken 1 Chicken 2 Duck Nest with egg
5 Apple 1 Apple 2 Pear Fruit tree
6 Fish 1 Fish 2 Shrimp Fisherman with pole
7 Soda can 1 Soda can 2 Soda bottle Hamburger
8 Bread loaf 1 Bread loaf 2 Doughnut Jar ofjam
9 Green pepper 1 Green pepper 2 Onions Shish kabob on plate
10 Car 1 Car 2 Pickup truck 1 Engine part
11 Sailboat 1 Sailboat 2 Row boat Life jacket
12 Motorcycle 1 Motorcycle 2 Moped Motorcycle helmet
13 Snowmobile 1 Snowmobile 2 Sled House window c snow
14 Semi-truck 1 Semi-truck 2 Pickup truck 2 Gas can
15 Light bulb 1 Light bulb 2 Candle c holder Book and spectacles
16 Violin 1 Violin 2 Harp Orchestra conductor
17 Toaster 1 Toaster 2 Kitchen stove Homemade jam
18 Upholstered Upholstered Sofa Television setchair 1 chair 2
19 Backpack 1 Backpack 2 Coolers Tent
20 Hair comb 1 Hair comb 2 Hair brush Mirror
in favor ofthe taxonomic class givenA-A pairs,99.4%judgment in favor ofthe taxonomic classgiven the A-B pairs, 92.0% judgment in favorof the taxonomic class given the A-C pairs,and 88.3% judgment in favor of the thematic
class given A-D pairs. There was one stimuluspair (19A-19C) from the taxonomic pairs (i.e.,A-A, A-B, A-C) in which a slight majority ofsubjects judged the relation as thematic (19A= backpack; 19C = two coolers). Also, A-D
PREDICTING RELATIONAL CONTROL 61
Table 2. Classification Frequencies for the 80 Stimulus Pairs (Experiment 1).
PairNo. A B C DTax Theme Tax Theme Tax Theme Tax Theme
1 27 0 27 0 25 2 0 272 27 0 26 1 26 1 2 253 27 0 27 0 25 2 0 274 27 0 27 0 26 1 3 245 27 0 27 0 25 2 5 226 27 0 27 0 25 2 0 277 27 0 26 1 27 0 15 128 27 0 27 0 25 2 5 229 27 0 27 0 23 4 10 1710 27 0 27 0 25* 1 1 2611 27 0 27 0 27 0 1 2612 27 0 27 0 26 1 1 2613 27 0 27 0 24 3 3 2414 27 0 27 0 27 0 0 2715 27 0 26 1 26 1 0 2716 27 0 27 0 25 2 0 2717 27 0 27 0 24 3 1 2618 27 0 27 0 25 2 3 2419 27 0 27 0 13 14 6 2120 27 0 27 0 27 0 2 25
Sums 540 0 537 3 496 43 63 477
°/% 100 0 99.4 0.6 92.0 8.0 11.7 88.3
* One response to lOC was omitted by a subject.
pair, 7A-7D (7A = soda bottle; 7D = ham-burger), was judged taxonomic by a majorityof subjects.
Relation strength. Table 3 shows the meanrelation strength for each of the stimulus pairsin the four pair types as judged by the subjects.A-A pairs were rated 5 by all but one subject(Mean ofMeans = 4.99; SD = 0.17); A-B pairsslightly lower (Mean of Means = 4.63; SD =0.51); and A-C pairs slightly lower yet (Meanof Means= 3.64; SD = 0.82). Thematic (A-D)pairs were rated about the same as thesuperordinate pairs (Mean ofMeans= 3.68: SD= 1.13) but there was greater variation in theA-D ratings.A one-way, within-subjects, analysis ofvari-
ance ofrelation strength was run with each typeof stimulus pair as factors. There was a signifi-cant effect oftype ofstimulus pair on the meanrelation strength ratings, Wilks' X = .20; F (3,532) = 688.98; p < .001; r2 = .79. Follow-up,pair-wise comparisons showed that mean rela-
tion strength ratings differed between all pairsof means (p < .001) except for A-C(superordinate) and A-D (thematic).
Discussion
The stimulus pairs were more likely to bejudged as taxonomic the more similar thestimuli in the pair appeared to be. Subjects'judgments of relation strength decreased in anorderly fashion, as apparent similarity betweenthe stimuli in the pairs decreased across thekinds of taxonomic relations with thematicstrength ratings being no different than thoseof the superordinate stimulus pairs.
EXPERIMENT 2
Next, we were interested in how anothergroup of subjects would respond to the fore-going picture pairs when those picture pairscomprised a conditional discrimination task,

62 OSBORNE AND HEATH
Table 3. Mean Strength Ratings for Stimulus Pairs (Experiment 1).
Stimulus Mean Stimulus Mean Stimulus Mean Stimulus MeanPair Strength Pair Strength Pair Strength Pair Strength(An-An) Rating (An-Bn) Rating (An-Cn) Rating (An-Dn) Rating
Al-Al 5.00 Al-BI 4.48 Al-Cl 3.44 Al-Dl 4.59A2-A2 5.00 A2-B2 4.59 A2-C2 3.30 A2-D2 3.93A3-A3 5.00 A3-B3 4.59 A3-C3 3.92 A3-D3 2.67A4-A4 5.00 A4-B4 4.54 A4-C4 3.33 A4-D4 4.63A5-A5 5.00 A5-BS 4.81 A5-C5 3.81 A5-D5 4.67A6-A6 5.00 A6-B6 4.55 A6-C6 3.26 A6-D6 4.44A7-A7 5.00 A7-B7 4.22 A7-C7 4.44 A7-D7 3.44A8-A8 5.00 A8-B8 4.74 A8-C8 3.11 A8-D8 4.07A9-A9 5.00 A9-B9 4.96 A9-C9 3.33 A9-D9 3.44AIO-AIO 5.00 AIO-BIO 4.55 AIO-CIO 3.65 AIO-DIO 3.44All-All 5.00 All-Bll 4.78 All-Cll 4.07 All-Dll 3.59A12-A12 4.85 A12-B12 4.55 A12-C12 3.70 A12-D12 4.33A13-A13 5.00 A13-B13 4.81 A13-C13 3.37 A13-D13 2.41A14-A14 5.00 A14-B14 4.67 A14-C14 3.67 A14-D14 3.74A15-A15 5.00 A15-B15 4.59 A15-C15 3.41 A15-D15 3.00A16-A16 5.00 A16-B16 4.37 A16-C16 3.96 A16-D16 3.89A17-A17 5.00 A17-B17 4.78 A17-C17 3.41 A17-D17 2.44A18-A18 5.00 A18-B18 4.48 A18-C18 4.07 A18-D18 3.33A19-A19 5.00 A19-B19 4.74 A19-C19 3.33 A19-D19 3.78A20-A20 5.00 A20-B20 4.74 A20-C20 4.15 A20-D20 3.74
Means 4.99 Means 4.64 Means 3.63 Means 3.67
i.e., matching to sample, ofdifferent trial types.Each matching-to-sample configuration wascomposed of three stimuli: one, a sample, andtwo others-comparisons. In some trial typesone comparison related to the sample taxo-nomically and the other related to the samplethematically (e.g., Figure 1, lower panel), andin other trial types, with the common sample,each comparison exemplified a different typeoftaxonomic relation. The taxonomic relationswere identity (A-A), ordinate (A-B), andsuperordinate (A-C). We could then observewhether there were systematic selections ofidentical, basic, or superordinate, taxonomi-cally related comparisons and/or thematicallyrelated comparisons in the various trial types.Finally, it could be determined if the strengthratings generated in Experiment 1 related tocomparison selection in this experiment.
METHODSubjects
Subjects (N = 10) were again volunteers frombeginning undergraduate psychology classes
at Utah State University. Mean age of the sub-jects was 20.8 yrs. Subjects were again offeredextra credit for their participation in the experi-ment.
Stimuli
Two hundred forty slides were composedfrom the stimuli described in Table 1. Eachslide, a matching-to-sample configuration, con-tained three pictures, one of which-a samplestimulus-was always a stimulus from ColumnA of Table 1. The sample stimulus was placedat the top center ofthe slide. The two compari-son stimuli, which were all possible combina-tions of pairs of stimuli from Columns Athrough D ofTable 1 from the same row as thesample, were placed at the bottom left and righthand corners of the slide (Figure 1, lowerpanel). Together the three stimuli formed arough equilateral triangle with the sample asapex. Trial types were A(AB), A(AC), A(AD),A(BC), A(BD), and A(CD), where A was thesample,Awas an identical taxonomic compari-son, B was a basic taxonomic comparison, C

PREDICTING RELATIONAL CONTROL
Table 4. Frequencies of Selection of Comparisons (Experiment 2).
Sample CO:AB CO:AC CO:AD CO:BC CO:BD CO:CD(A)
Al A1= 18* A1=17* A1=12* B=19* B1=14B1=2 C1=3 D1=8 C= Dl-6
C1=4D1=16*
A2 A2=19* A2=18* A2=16* B2=15* B2=12* C2=8B2=1 C2=2 D2=4 C2=5 D2=8 D2=12*
A3 A3=20* A3=18* A3=16* B3=18* B3=16* C3=16*B3=0 C3=2 D3=4 C3=2 D3=4 D3=4
A4 A4=13* A4=20* A4=15* B4=20* B4=16B4=7 C4=0 D4=5 C4=0 D4=4
C4=7D4=13*
A5 A5=18* A5=16* A5=16* B5=16* B5=15* C5=8B5=2 C5=4 D5=4 C5=4 D5=5 D5=12*
A6 A6=19* A6=17* A6=15* B6=19* B6=12* C6=3B6=1 C6=3 D6=5 C6=1 D6=8 D6=17*
A7 A7=18* A7=20* A7=16* B7=18 B7=10B7=2 C7=0 D7=4 C7=2 D7=10
C7=13*D7=7
A8 A8=18* A8=17* A8=16* B8=17* B8=13* C8=5B8=2 C8=3 D8=4 C8=3 D8=7 D8=15*
A9 A9=18* A9=16* A9=16* B9=16* B9=16* C9=12B9=2 C9=4 D9=4 C9=4 D9=4 D9=8
AIO A1O=17* A1O=17* A1O=15* B10=17* B1O=18* C1O=18*B10=3 C10-3 D1O=5 C10=3 D1O=2 D1O=2
All All=14* A1l=17*B11=6 C11=3
A12 A12=18* A12=19*B12=2 C12=1
A13 A13=17* A13=20*B13=3 C13=0
A14 A14=20* A14=18*B14=0 C14=2
A15 A15=19* A15=19*B15=1 C15=1
A16 A16=17* A16=18*B16=3 C16=2
A17 A17=19* A17=16*B17=1 C17=4
A11=19* 811=18*Dll=l C11=2
A12=16* 812=18*D12=4 C12=2
A13=18* 813=20*D13=2 C13=0
A14=18* 814=18*D14=2 C14=2
A15=16* 815=16*D15=4 C15=4
A16=18* 816=20*D16=2 C16=0
A17=16* B17=16*D17=4 C17=4
811=18* C18=16*DI11=2 D11=4
812=17* CB12=5D12=3 D12=15*
813=19* C13=14*D13=1 D13=6
814=17* B14=18D14=3 1=
B15=15* C15=14*D15=5 D15=6
B16=17* C12=5D16=3 D12=15
B17=15* C15=14D17=5 D17=10
(Continued, p. 64)
63

64 OSBORNE AND HEATH
Table 4 (continued).Sample CO:AB CO:AC CO:AD CO:BC CO:BD CO:CD(A)
A18 A18=19* A18=14* A18=14* B18=15* B18=16* C18=17*B18=1 C18=6 D18=6 C18=5 D18=4 D18=3
A19 A19=18* A19=17* A19=17* B19=16* B19=14* C19=2B19=2 C19=3 D19=3 C19=4 D19=6 D19=18*
A20 A20=17* A20=16* A20=16* B20=17* B20=16* C20=15*B20=3 C20=4 D20=4 C20=3 D20=4 D20=5
Totals A=356 A=350 A=321 B=349 B=306 C=208(89.0%) (87.5%) (80.3%) (87.2%) (76.5%) (52.0%)B=44 C-50 D=79 C-51 D=94 D=192(11.0%) (12.5%) (19.7%) (12.8%) (23.5%) (48.0%)
% Hits 100% 100% 100% 95% 85% 80%
*Matching-to-sample outcome predicted by mean strength of relation rating from Table 3. The eight cells of the tablethat are outlined are not predicted by the results of Table 3.
was a superordinate taxonomic comparison,and D was a thematic comparison.
Procedure
Each slide was given a number visible to thesubjects in the bottom left hand corner thatcorresponded with the order in which it waspresented. Each configuration was presentedtwice, once with each comparison stimulus inthe left or right position. The slides were sortedinto a quasi-random order with the criteria thatno two slides with the same sample followedone another and that not more than two in-stances of one trial type could occur succes-sively. The slides were then inserted into CorelPresentation 8 to present to the subjects viacomputer, projector, and screen.The experimenter (JH) told the subjects, "In
a few minutes you are going to see a numberofslides with pictures on them. Each slide con-tains three pictures, one on the top of the slideand two at the bottom which are side by side.Your task is to look first at the picture at thetop, second at the two bottom pictures, then todecide which one of the bottom two picturesgoes best with the top picture. In front of you,you have a Scantron form. Ifyou think that theleft picture goes best with the picture at thetop, you will mark the Scantron in column 1.Ifyou think the right picture goes best with the
picture at the top, you will mark the Scantronin column two. The number in the bottom lefthand corner ofthe slide will tell you which lineon the Scantron to mark your selection."The subjects were then shown an example
of how the slides would be presented-a pic-ture of a dog as sample, a picture of a similardog as the left side comparison and a pictureof a piece of meat as the right side compari-son. They were then told by the experimenter,"Here is a slide with three pictures on it. Ifyouthink the dog at the bottom goes best with thedog at the top, then you would mark column 1on line 1 of your Scantron. You will note thenumber 1 on the slide to indicate the Scantronline. If you think that the meat goes best withthe dog at the top, then you would mark col-umn two on your Scantron."The slides were then presented automatically
on a large screen in the front of the classroomat intervals of 15 s. With the presentation ofslides 60, 120, and 180 the subjects were re-minded ofwhat line ofthe Scantron they shouldbe marking.
Results
Table 4 shows the collected responses ofthesubjects to each trial type (columns) for eachsample (rows). The table shows that for trialtypes A(AB), A(AC), and A(AD) where the

PREDICTING RELATIONAL CONTROL 65
sample stimulus could be matched with itself,that is, A was a sample and the same A was acomparison, subjects most frequently chose A.Whenever an arbitrary match was required-on trial types A(BC), A(BD), andA(CD)-sub-jects chose B when B and C were compari-sons; chose B when B and D were compari-sons; and chose C and D about equally oftenwhen C and D were comparisons (see columntotals).
Table 4 also shows the'results of relating re-lation selection with the ratings that were pro-duced in Experiment 1. Each ofthe two stimu-lus pairs that comprised a configuration in thematching-to-sample trials in Experiment 2 hada relation strength rating from Experiment 1(Table 3). For example, in configurationAl(AIB1) in Table 4, the choice of relationAl-Al was predicted from the difference be-tween the mean strength ratings in Table 3,where the strength rating for Al-Al = 5.0 andfor A1-B1 = 4.48. Each cell in Table 4 wascompared with two cells in Table 3 in this way.The more strongly rated relation in Table 3 wasused to predict relation selection in the match-ing-to-sample task. If the more strongly ratedrelation in Table 3 was selected more frequentlyin Table 4, then the cell in Table 4 contains anasterisk. Cells in Table 4 in which the lessstrongly rated relation in Table 3 was selectedmore frequently are outlined and boldfaced. Allcells in Table 4 contain asterisks for trial typesA(AB), A(AC), and A(AD); 19 of 20 cells fortrial types A(BC); 17 of 20 cells for trial typesA(BD); and 16 of20 cells for trial types A(CD).
Discussion
Overall, the more strongly related ofthe tworelations was selected on 112 ofthe 120 arrays(93.33%). Configurations in the A(CD) trialtype were composed of one thematic (A-D)and one (superordinate) taxonomic relation (A-C). Given that similarity between sample andcomparison is only an issue for A-C but notforA-D relations in this trial type, did strengthratings relate to comparison selection here aswell? In fact, eight of 10 more strongly ratedA-D relations were selected while the lessstrongly ratedA-C relation was selected on twoothers. The more strongly rated A-C relationwas selected eight times, while the less stronglyrated A-D relation was selected twice. If rela-tion strength only reflected similarity between
sample and comparison, there should have beenno correct A-D selections. The foregoing not-withstanding, subjects appeared to match onthe basis ofperceptual similarity ofsample andcomparison on trial types where that was pos-sible.
EXPERIMENT 3
The prior two experiments used differentsubjects for the strength ratings (Exp 1) andthe matching to sample (Exp 2). In this experi-ment subjects experienced both proceduresfrom the prior experiments. Half the subjectsexperienced the prior conditions in the orderof Experiments 1 and 2 (classify and rate;match to sample) and half experienced thoseconditions in the reversed order (match tosample; classify and rate).
METHOD
Subjects
College students were selected as they werein the prior two experiments. Thirty-sevencompleted the two procedures in two sittingsof about an hour each. Their average age was18.6 yrs. Subjects who completed both proce-dures were paid $10 because the time commit-ment was such that initial attempts to get sub-jects to sit solely for extra credit failed. Eigh-teen subjects matched to sample first and clas-sified and rated strength second, while 19 sub-jects classified and rated first and matched tosample second.
Procedures
The procedures of this experiment were thesame as those of the prior two experiments.
Results Classification.
The classification results for all subjects areshown in Table 5. There was 100% judgmentin favor ofthe taxonomic class givenA-A pairs,96.3%judgment in favor ofthe taxonomic classgiven the A-B pairs, 75.1% judgment in favorof the taxonomic class given the A-C pairs,and 93.2% judgment in favor of the thematicclass given A-D pairs. There was one stimulus

66 OSBORNE AND HEATH
Table 5. Categorization Frequencies for the 80 Stimulus Pairs (Experiment 3).PairNo. A B C D
Tax Theme Tax Theme Tax Theme Tax Theme1 37 0 37 0 31 6 1 362 37 0 35 2 28 9 1 363 37 0 36 1 33 4 1 364 37 0 35 2 29 8 6 315 37 0 35 2 32 5 6 316 37 0 36 1 25 12 1 367 37 0 37 0 33 4 7 308 37 0 36 1 26 11 3 349 37 0 36 1 25 12 11 2610 37 0 36 1 33 4 1 3611 37 0 36 1 35 2 1 3612 37 0 35 2 30 7 2 3513 37 0 36 1 24 13 2 3514 37 0 35 2 35 2 1 3615 37 0 34 3 25 12 0 3716 37 0 34 3 26 11 0 3617 37 0 37 0 20 17 1 3618 37 0 36 1 33 4 2 3519 37 0 35 2 4 33 3 3420 37 0 36 1 29 8 0 37Sums 740 0 713 27 556 184 50 690°/% 100 0 96.3 3.7 75.1 24.9 6.8 93.2
pair (Al 9-C 19) from the taxonomic pairs inwhich a majority of subjects classified the re-lation as thematic (19A = backpack; 19C = twocoolers).
Relation strength. Table 6 shows the meanrelation strength ratings for each of the stimu-lus pairs in the four categories for all subjects.All but 4 A-A pairs were rated 5 (Mean ofMeans = 4.99; SD= 0.03); A-B pairs were ratedlower (Mean of Means = 4.37; SD= 0.09); andA-C pairs were rated lower yet (Mean ofMeans= 3.48; SD= 0.37). Thematic (A-D) pairswere rated higher than the superordinate pairs(Mean of Means= 3.59; SD = 0.59).Two, one-way, within-subjects, analyses of
variance of relation strength were conductedwith each type of stimulus pair as factors-one for each group. For the group that matchedfirst and classified and rated second, there wasa significant effect of type of stimulus pair onthe mean relation strength ratings, Wilks' A =.21; F (3, 355) = 453.2; p < .001; rl2 = .79.
Follow-up, pair-wise comparisons showed thatmean relation strength ratings differed betweenall pairs of means (p < .001). For the groupthat classified and rated first, and matched tosample second, there was also a significant ef-fect of type of stimulus pair on the mean rela-tion strength ratings, Wilks' A = .18; F (3, 376)= 559.52; 2 = .82. Follow up pair-wise com-parisons showed that mean relation strengthdiffered between all pairs of means (p < .001),except A-C and A-D (p < .07).
Table 7 shows the collected comparison re-sponses of the subjects in both groups to eachtrial type (columns) for each sample (rows) inthe matching-to-sample task. The table showsthat for trial types A(AB), A(AC), and A(AD),where the sample stimulus could be matchedwith itself, subjects mostly chose A. Wheneveran arbitrary match was required-A(BC),A(BD), and A(CD)-subjects more frequentlychose B when B and C were comparisons; morefrequently chose B when B and D were com-

PREDICTING RELATIONAL CONTROL 67
Table 6. Mean Strength Ratings for Stimulus Pairs (Experiment 3).
Stimulus Mean Stimulus Mean Stimulus Mean Stimulus MeanPair Strength Pair Strength Pair Strength Pair Strength(An-An) Rating (An-Bn) Rating (An-Cn) Rating (An-Dn) Rating
Al-Al 5.00 Al-Bl 4.43 Al-Cl 3.21 Al-DI 4.37A2-A2 5.00 A2-B2 4.38 A2-C2 2.86 A2-D2 3.84A3-A3 5.00 A3-B3 4.40 A3-C3 3.50 A3-D3 2.63A4-A4 5.00 A4-B4 4.27 A4-C4 2.86 A4-D4 4.37A5-A5 5.00 A5-B5 4.54 A5-C5 3.56 A5-D5 4.47A6-A6 5.00 A6-B6 4.32 A6-C6 3.46 A6-D6 4.47A7-A7 5.00 A7-B7 4.25 A7-C7 4.24 A7-D7 3.00A8-A8 5.00 A8-B8 4.51 A8-C8 3.08 A8-D8 3.79A9-A9 5.00 A9-B9 4.50 A9-C9 3.54 A9-D9 3.58AIO-AIO 5.00 AIO-BIO 4.32 AIO-CIO 3.72 AIO-DIO 3.37All-All 5.00 All-Bll 4.48 All-Cll 3.81 All-DII 3.79A12-A12 5.00 A12-B12 4.40 A12-C12 3.26 A12-D12 4.05A13-A13 4.97 A13-B13 4.26 A13-C13 3.27 A13-D13 2.68A14-A14 5.00 A14-B14 4.37 A14-C14 3.34 A14-D14 3.42A15-A15 5.00 A15-B15 4.32 A15-C15 3.24 A15-D15 2.79A16-A16 4.91 A16-B16 4.35 A16-C16 3.87 A16-D16 3.89A17-A17 4.97 A17-B17 4.40 A17-C17 3.19 A17-D17 2.81A18-A18 5.00 A18-B18 4.18 A18-C18 3.97 A18-D18 3.26A19-A19 4.89 A19-B19 4.30 A19-C19 3.41 A19-D19 3.74A20-A20 5.00 A20-B20 4.27 A20-C20 4.11 A20-D20 3.63
Means 4.99 Means 4.37 Means 3.48 Means 3.59
parisons; and when C and D were comparisonschose C and D about equally (see column to-tals).
Table 7 also shows the results ofpredictionsbased on the mean strength of relation ratingsthat these same subjects produced. These pre-dictions were generated as they were in Ex-periment 2 and are presented the same way.All cells in Table 7 contain asterisks for trialtypes A(AB), A(AC), and A(AD), and A(BC);for 17 of 20 cells for trial type A(BD); and for17 of 20 cells for trial type A(CD).
Individual Ss
Figure 2 shows the numbers of selections ofthe most strongly rated stimulus relation forall 18 subjects who matched to sample first andrated second, for each of the six matching-to-sample trial types. The same analysis of rela-tion strength that was applied collectivelyabove was applied to the individual subjects.As each ofthe 20 configurations was presentedtwice within each trial type, there were 40 pos-
sible selections ofthe strongest relation per trialtype, across the six trial types. The horizontalmidline in each panel in Figure 2 identifies 20selections of the most strongly rated relationswhich, in this two-choice task, would be chance(50%). The last panel to the right of the bot-tom row depicts means for each trial type forthe group.Viewing the panels as wholes, 11 of the 18
subjects' selections ofthe stronger relation weregreater than 50% on all the trial types. Second,vertically dividing each panel in halfpermits acomparison ofA(AX) and arbitrary matching-to-sample trial types-A(BC), A(BD), A(CD).Fourteen of the 18 subjects' selections of thestronger relation on the A(AX) trial types weregreater than 50% and 13 of the 18 subjects'selections of the stronger relation on the arbi-trary matching-to-sample trial types were alsoabove 50%. Third, selection ofthe stronger re-lation on the A(CD) trial type was above 50%for 17 of the 18 subjects. Fourth, collectively,the panel depicting the means shows that, foreach trial type, selection of the strongest rela-

OSBORNE AND HEATH
Table 7. Frequencies of Comparison Selections (Experiment 3).Sample CO:AB CO:AC CO:AD CO:BC CO:BD CO:CD(A)
Al A1=64* A1=68* A1=58* B1=69* B1=49B=10 C1=6 D1=16 Cl=5 D1=25
C1=13D1=61*
A2 A2=68* A2=73* A2=66* B2=70* B2=56* C2=23B2=6 C2=1 D2=8 C2=4 D2=18 D2=51 *
A3 A3=72* A3=73* A3=67* B3=67* B3=67* C3=59*B3=2 C3=1 D3=7 C3=7 D3=7 D3=15
A4 A4=63* A4=74* A4=60* B4=73* B4=53B4=11 C4=0 D4=14 C4=1 |D4=21|
C4=13D4=61 *
A5 A5=66* A5=72* A5=56* B5=71* B5=63* C5=22B5=8 C5=2 D5=18 C5=3 D5=11 D5=52*
A6 A6=72* A6=73* A6=59* B6=70* B6-53B6=2 C6=1 D6=15 C6=4 [D6=21
C6=10D6=64*
A7 A7=72* A7=69* A7=57* B7=51* B7=53* C7=55*B7=2 C7=5 D7=17 C7=23 D7=21 D7=19
A8 A8=72* A8=70* A8=61* B8=73* B8=46* C8=17B8=2 C8=4 D8=13 C8=1 D8=28 D8=57*
A9 A9=71 * A9=67* A9=68* B9=64* B9=62* |C9=40|B9=3 C9=7 D9=6 C9=10 D9=12 [D9=34
AIO A1O=70* A1O=70* A1O=66*B10=4 C10=4 D1O=8
All A1l=65* A11=74* A11=60*B11=9 C11=0 Dl1=14
A12 A12=66* A12=72* A12=56*B12=8 C12=2 D12=18
A13 A13=67* A13=69* A13=68*B13=7 C13=5 D13=6
A14 A14=69* A14=73* A14=65*B14=5 C14=1 D14=9
A15 A15=69* A15=73* A15=61*B15=5 C15=1 D15=13
A16 A16=64* A16=63* A16=63*B16=10 C16=11 D16=11
A17 A17=72* A17=63* A17=65*B17=2 C17=11 D17=9
B10=70* B10=66* C1O=61*C10=4 D10=8 D10=13
Bl1=70* Bl1=59*|Cll=47Cll=4 Dll=15 D11=27
B12=71* B12=49* C12=20C12=3 D12=25 12=54*
B13=69* B13=66* C13=60*C13=5 D13=8 D13=14
B14=73* B14=62*|C14-52C14=1 D14=12 D14=22
B15=71* B15=60* C15=46*C15=3 D15=14 D15=28
B16=62* B16=53* C16=33C16=12 D16=21 16=41*
B17=63* B17=55* C17=41*C17=11 D17=19 D17=33
(Continued, p. 69)
68
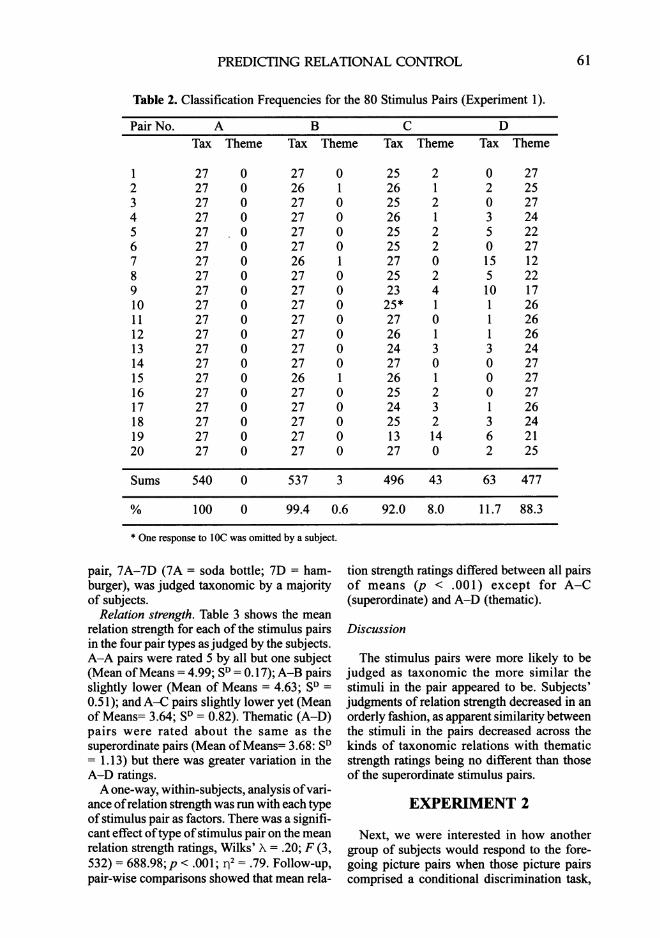
PREDICTING RELATIONAL CONTROL 69
Table 7 (continued). Frequencies of Comparison Selections.Sample CO:AB CO:AC CO:AD CO:BC CO:BD CO:CD(A)A18 A18=70* A18=59* A18=60* B18=52* B18=51* C18=62*
B18=4 C18=15 D18=14 C18=22 D18=23 D18=12
A19 A19=70* A19=67* A19=62* B19=67* B19=48* C19=4B19=4 C19=7 D19=12 C19=7 D19=26 D19=70*
A20 A20=66* A20=59* A20=56* B20=60* B20=59* C20=63*B20-8 C20=15 D20-18 C20=14 D20=15 D20=11
Totals A= 1,368 A=1,380 A=1,233 B=1,336 B=1,130 C=741(92.4%) (93.2%) (89.9%) (90.3%) (76.3%) (50.1%)B= 112 C=100 D=247 C=144 D=350 D=739(7.6%) (6.8%) (10.1%) (9.7%) (23.7%) (49.9%)
% 100% 100% 100% 100% 92.5% 92.5%Hits
*Matching-to-sample outcome predicted by mean strength rating from Table 6. The six cells of the table that are out-lined are not predicted by the results of Table 6.
tion was above 50%. A binomial test was runto determine that overall predictions of sub-jects' comparison selections did not differ fromchance (i.e., 120 of240 predictions). The num-bers of correct predictions statistically ex-ceeded 120 for all subjects (p < .01).
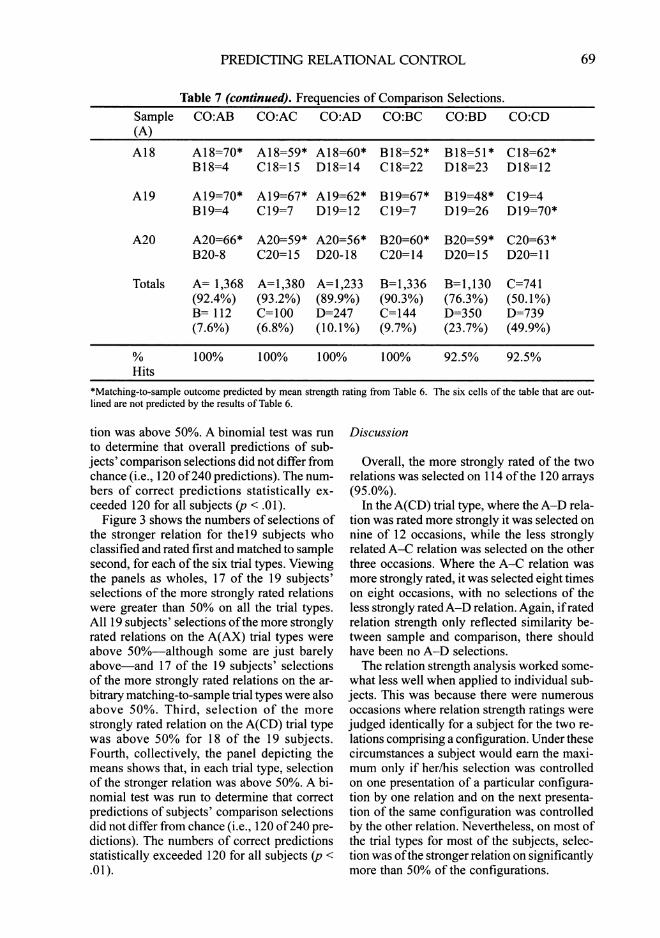
Figure 3 shows the numbers of selections ofthe stronger relation for thel9 subjects whoclassified and rated first and matched to samplesecond, for each of the six trial types. Viewingthe panels as wholes, 17 of the 19 subjects'selections of the more strongly rated relationswere greater than 50% on all the trial types.All 19 subjects' selections ofthe more stronglyrated relations on the A(AX) trial types wereabove 50%-although some are just barelyabove and 17 of the 19 subjects' selectionsof the more strongly rated relations on the ar-bitrary matching-to-sample trial types were alsoabove 50%. Third, selection of the morestrongly rated relation on the A(CD) trial typewas above 50% for 18 of the 19 subjects.Fourth, collectively, the panel depicting themeans shows that, in each trial type, selectionof the stronger relation was above 50%. A bi-nomial test was run to determine that correctpredictions of subjects' comparison selectionsdid not differ from chance (i.e., 120 of240 pre-dictions). The numbers of correct predictionsstatistically exceeded 120 for all subjects (p <.01).
Discussion
Overall, the more strongly rated of the tworelations was selected on 114 ofthe 120 arrays(95.0%).
In the A(CD) trial type, where the A-D rela-tion was rated more strongly it was selected onnine of 12 occasions, while the less stronglyrelated A-C relation was selected on the otherthree occasions. Where the A-C relation wasmore strongly rated, it was selected eight timeson eight occasions, with no selections of theless strongly ratedA-D relation. Again, ifratedrelation strength only reflected similarity be-tween sample and comparison, there shouldhave been no A-D selections.The relation strength analysis worked some-
what less well when applied to individual sub-jects. This was because there were numerousoccasions where relation strength ratings werejudged identically for a subject for the two re-lations comprising a configuration. Under thesecircumstances a subject would earn the maxi-mum only if her/his selection was controlledon one presentation of a particular configura-tion by one relation and on the next presenta-tion of the same configuration was controlledby the other relation. Nevertheless, on most ofthe trial types for most of the subjects, selec-tion was ofthe stronger relation on significantlymore than 50% of the configurations.

70 OSBORNE AND HEATH
dO JODw P AO _MPdmo _po: Pin
a o so iA ifSoa o e oS~~~~~~~~~~~~~~~~~~
S SdP B S_ w w W P
Fiur 2-Frqec ditiuin oftenmes o oprsnslcin htare ihpeitosbsdo h
! ~ -r| I - --I I---_a ^I0i5I F R o s a 0 5
eIlpdNlpJ:IWNP IIN I N
mqpd~uP flCWPW UWd Pa ammo _
most strongly rated relation across the six matching-to-sample trial types for the 18 subjects in Experiment 3 whomatched to sample first and classified and rated second. The panel marked Means is composed of the means of all 18subjects for each trial type.
There was considerable similarity betweenthe results of Experiment 3 and those of Ex-periment 1. With respect to classification
(Tables 2 and 5), in both experiments all sub-jects classified all A-A pairs as taxonomic.Subjects sporadically classified A-B pairs as

PREDICTING RELATIONAL CONTROL 71
g~~a -$a a S .....Is I'
_1
32 0g3gNi S *I N
SUOIpgpWd iflAOO SU00IPW SOIO UOPOIPSd SOUOQ SUOPOIPd PSLI00 U0OP63SW0WPaD
e~~~~~ a aJ: 1 : 3PJ upp4_9:2
Figur Pwdeuny itiuioso hPamberofM& compriso selection thatJCSI ee withV pre Udicin baedonth
classifidan aedPaD fistad athd tosmple* second.The*)&pae akd MeansiscmoeIftemasof al 1
osu ctstifor the 19 type.
clssfedan atd t ndmtcedt smpeseon.Th pnl are Man s omoed oftemas efal1sujetsfo ec tril I
thematic and did so more in Experiment 3 thanin Experiment 1, where 17 versus three con-figurations showed at least one selection as the-
matic. But, collectively, all A-B pairs wereclassed as taxonomic. Almost all A-C pairswere occasionally classified as thematic, but

72 OSBORNE AND HEATH
in both experiments 19 of 20 were classed astaxonomic by a majority of subjects. A19-C 19was an exception in both experiments. In Ex-periment 1, 19 of 20 and in Experiment 3, 20of 20 A-D pairs were classed as thematic.
In both experiments, mean strength ratingsof the stimulus pairs were ordinally identical:A-A pairs strongest; A-B pairs next;A-D pairsthird; and the A-C pairs last. In both Experi-ments 2 and 3, in matching-to-sample trial typesA(AB), A(AC), and A(AD), comparison selec-tion was controlled by A-A (Tables 4 and 7).There was overlap from Experiments 2 to 3with respect to selection of the less stronglyrated relation in the A(BD) and A(CD) trialtypes, viz, A1(B lD1), A4(B4D4), A9(C9D9),and A14(C14D14).
Visual inspection ofFigures 2 and 3 suggeststhat there were more selections of the strongerrelations by subjects who classified and ratedfirst (Figure 3) than there were by those whomatched to sample first (Figure 2). Indeed, theratios of correct predictions (out of 240) werehigher for the former (t = 3.34; df= 35; p =.002). Order of presentation of the two experi-ences (classifying/rating and matching tosample) may be responsible.
EXPERIMENT 4
Subjects in the first three experiments wereexposed to the 80 stimuli in Table 1 in the clas-sification and strength ratings and in the match-ing to sample. To this point, then, the general-ity of the results and the validity of the analy-sis are restricted to the stimuli on which thefirst three experiments were conducted. In thepresent experiment a new set of stimuli wasconstructed to determine whether the resultsof Experiments 1 to 3 could be replicated withdifferent stimuli.Moreover, in the prior experiments it was
presumed (but not evaluated) that a continuumof similarity existed across the types of stimu-lus pairs, roughly described as running fromA-A, A-B, A-C, to B-C, and from A-D, B-D,to C-D in which A-A stimuli were most simi-lar (indeed, they were identical) and C-Dstimuli were the least similar. This presump-tion was evaluated in the present experimentby having subjects rate the stimulus pairs onthe basis of similarity.
METHOD
Subjects
College students were selected as they werein the prior experiments. Given the number ofstimulus pairs to rate, five different groups ofsubjects were recruited (total = 265). The firstthree groups (N = 150) classified the stimuluspairs (taxonomic or thematic) and rated thestrength of the relation portrayed in each pairas in Experiment 1. The last two groups (n =115) rated the similarity of the stimuli com-prising each pair. The average age of the sub-jects was 21.0 yrs.
Procedures
Stimuli. An additional 184 stimuli were se-lected from Corel Magic 200,000 and arrayedin pairs as in Experiment 1. Three hundredtwenty-two slides were produced that containedthese pairs, ordered by the number of the to-be-sample stimulus (i.e., 1A-46A) and secondby the putative relation to the sample of thesecond stimulus (A-A, A-B, A-C, A-D, B-C,B-D, C-D). Table 8 lists all of these picturestimuli.
Classification and strength rating. The sub-jects in the first three groups experienced theprocedures of Experiment 1 with the newstimulus set. Additionally, their procedureswere different from Experiment 1 in two otherways. First, rather than rate all 322 stimuluspairs, the set was divided into three subsets ofstimulus pairs of 107-108 each and each ofthe groups of subjects rated one of these sub-sets. Second, for these subjects, the 1-5 strengthrating scale was projected via transparency andoverhead projector on a screen to the left ofthe screen on which the pairs of stimuli werepresented. The stimulus pairs were alone onthe remaining screen except for the number ofthe slide to identify the correct line to mark onthe Scantron.
Similarity rating. The subjects in the last twogroups experienced the procedures of Experi-ment 1 with the new stimulus set but their in-structions differed. For these groups, on an-other transparency, the overhead projector por-trayed a 5-item Likert scale, but it stated: 5 =so similar they are identical; 4 = very similar;3 = somewhat similar; 2 = a little bit similar; 1= not similar. Subjects in these two groups were
PREDICTING RELATIONAL CONTROL
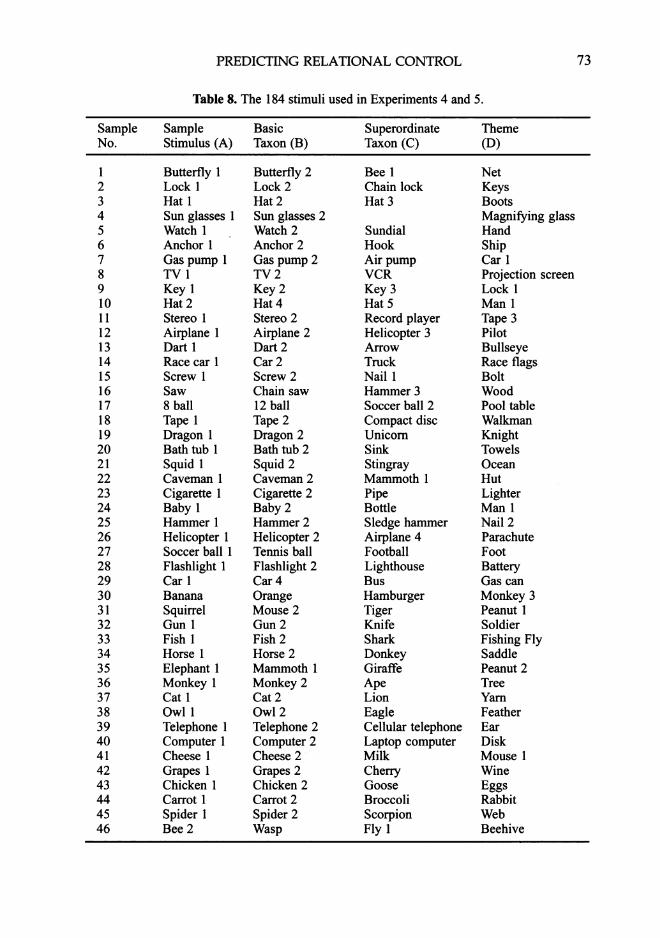
Table 8. The 184 stimuli used in Experiments 4 and 5.
Sample Sample Basic Superordinate ThemeNo. Stimulus (A) Taxon (B) Taxon (C) (D)
1 Butterfly 12 Lock 13 Hat 14 Sun glasses 15 Watch 16 Anchor 17 Gas pump 18 TV 19 Key I10 Hat211 Stereo 112 Airplane 113 Dart 114 Race car 115 Screw 116 Saw17 8 ball18 Tape 119 Dragon 120 Bath tub 121 Squid 122 Caveman 123 Cigarette 124 Baby 125 Hammer 126 Helicopter 127 Soccer ball 128 Flashlight 129 Car 130 Banana31 Squirrel32 Gun 133 Fish 134 Horse 135 Elephant 136 Monkey 137 Cat 138 Owl 139 Telephone 140 Computer 141 Cheese 142 Grapes 143 Chicken 144 Carrot 145 Spider 146 Bee 2
Butterfly 2Lock 2Hat 2Sun glasses 2Watch 2Anchor 2Gas pump 2TV 2Key 2Hat 4Stereo 2Airplane 2Dart 2Car 2Screw 2Chain saw12 ballTape 2Dragon 2Bath tub 2Squid 2Caveman 2Cigarette 2Baby 2Hammer 2Helicopter 2Tennis ballFlashlight 2Car 4OrangeMouse 2Gun 2Fish 2Horse 2Mammoth 1Monkey 2Cat 2Owl 2Telephone 2Computer 2Cheese 2Grapes 2Chicken 2Carrot 2Spider 2Wasp
Bee 1Chain lockHat 3
SundialHookAir pumpVCRKey 3Hat 5Record playerHelicopter 3ArrowTruckNail 1Hammer 3Soccer ball 2Compact discUnicornSinkStingrayMammoth 1PipeBottleSledge hammerAirplane 4FootballLighthouseBusHamburgerTigerKnifeSharkDonkeyGiraffeApeLionEagleCellular telephoneLaptop computerMilkCherryGooseBroccoliScorpionFly 1
NetKeysBootsMagnifying glassHandShipCar 1Projection screenLock 1Man 1Tape 3PilotBullseyeRace flagsBoltWoodPool tableWalkmanKnightTowelsOceanHutLighterMan 1Nail 2ParachuteFootBatteryGas canMonkey 3Peanut 1SoldierFishing FlySaddlePeanut 2TreeYarnFeatherEarDiskMouse 1WineEggsRabbitWebBeehive
73

74 OSBORNE AND HEATH
Table 9. Classification Frequencies for the 322 Stimulus Pairs (Experiment 4).Pair No. A B C D
Tax Theme Tax Theme Tax Theme Tax Theme
1 28 2 25 5 46 31 2 282 77 2 70 9 17 12 0 383 78 1 27 3 17 13 3 274 27 2 27 3 21 54 1 285 38 1 26 4 46 34 4 756 78 0 76 2 16 14 1 297 29 1 25 5 11 17 0 388 38 0 36 1 11 19 3 269 80 0 35 4 75 4 2 3710 37 1 74 6 34 4 1 7911 39 0 37 2 16 13 29 112 39 0 76 4 30 8 5 7213 80 0 76 4 22 8 6 7414 77 2 24 5 52 26 0 3915 29 1 76 1 35 44 6 2416 79 0 34 5 14 15 0 2917 29 1 26 4 25 14 7 3218 79 1 74 5 36 42 3 3619 72 3 79 1 9 29 3 7620 79 0 28 11 17 20 7 3121 29 1 27 3 14 15 2 2822 29 1 61 18 3 35 1 2823 29 1 27 3 29 9 3 3524 80 0 65 14 40 39 1 3725 38 1 37 1 69 11 0 3926 29 1 35 3 47 33 8 7127 77 1 31 8 20 9 1 7828 80 0 34 2 24 56 3 3629 28 2 77 1 14 16 9 7130 29 1 15 15 10 20 2 2831 78 1 70 7 6 24 1 7832 75 2 26 4 6 24 2 7733 77 1 33 6 31 6 3 2734 79 0 29 1 15 15 10 6935 29 1 60 18 28 52 0 3736 28 2 26 4 34 4 2 7837 78 1 73 7 51 29 1 3838 29 1 73 6 64 13 6 7439 39 0 35 4 37 2 0 3840 79 1 28 2 26 4 3 2741 80 0 25 5 8 22 1 3742 39 0 37 2 9 28 5 3443 28 2 28 2 32 7 2 2844 76 2 38 1 18 12 3 2745 28 0 28 1 9 21 3 2646 78 1 68 11 17 13 12 67
Sums 2,480 42 2,037 233 1,211 940 167 2,032Percent 98.3 1.7 89.7 10.3 56.3 43.7 7.6 92.4

PREDICTING RELATIONAL CONTROL 75
instructed that: "We want you tojudge the simi-larity ofpairs of objects such as you see on thescreen to your right. These are two dogs; sincethey are identical, you would mark a 5 on yourScantron form. A 5 means what the screen toyour left says. Please don't mark the Scantronform until I say so. Here are two different dogs;they are not identical but they are very similar,so you would mark a 4 on your Scantron; nowhere are a dog and a cat; they are similar butnot so much; so they might get a rating of 3 ora rating of 2; finally, here are a dog and a pieceof meat. They are not similar at all, so theywould get a rating of 1. You willjudge the simi-larity of quite a few of these pairs. In order toknow where you are, there are numbers on theleft hand lower comer of each slide (pointedto). That number tells you what line to be mark-ing on the Scantron. We'll occasionally an-nounce the line also to keep everyone together.The slides will come up automatically. Anyquestions? Start on Answer 1. Let's begin."The 322 stimulus pairs were divided in two
and one subset of 161 stimulus pairs was pre-sented to each of the last two groups. For allthe groups, slides were presented at the rate ofone every 7.5 s. As in the prior experiments,the presentation order of the pictures was ran-domized with restrictions that the picture onthe left of the pair could not appear twice con-secutively and the type ofexemplified relationcould occur no more than twice consecutively.
Results
Classification. The classification results areshown in Table 9. There was 98.3% judgmentin favor ofthe taxonomic class givenA-A pairs,89.7%judgment in favor ofthe taxonomic classgiven the A-B pairs, 56.3% judgment in favorof the taxonomic class given the A-C pairs,and 92.4% judgment in favor of the thematicclass given A-D pairs. Ofthe 46 A-C pairs, 16were classed by a majority as thematic (i.e.,A4-C4; A15-C15; A16-C16; A18-C18; A19-C19; A20-C20; A21-C21; A22-C22; A28-C28; A29-C29; A30-C30; A31-C31; A35-C35; A41-C41; A42-C42; A45-C45) and thesubjects evenly divided on A34-C34. A 1-DI1was the only A-D pair judged taxonomic bythe majority.
Relation strength. Table 10 shows the meanrelation strength for each of the stimulus pairsin the seven categories as judged by the sub-
jects. With this set ofstimuli, the mean strengthrating of the A-A pairs was less than 5 (Meanof Means = 4.32; SD = 0.09). A-B pairs werejudged lower (Mean of Means = 3.82; SD =0.31) and A-C pairs were judged lower yet(Mean of Means= 3.33; SD = 0.27) with B-Cpairs about the same (Mean of Means = 3.32;SD = 0.32). Thematic A-D pairs were ratedsomewhat stronger than the superordinate pairs(i.e., A-C; B-C) (Mean ofMeans = 3.68; SD =0.32). Thematic B-D pairs rated about the sameas thematic A-D pairs (Mean ofmeans = 3.53;SD = 0.45), while the lowest strength ratingswent to the thematic C-D pairs (Mean ofmeans= 2.95; SD = 0.56). The additional strength rat-ings in this experiment that are shown in Table10 (i.e., B-C, B-D, and C-D ratings) are notused in eventual matching-to-sample predic-tions because B and C stimuli were never usedas samples in that task. Different from Experi-ments 1 through 3, strength ratings on thesepairs were necessary in this experiment to com-pare with similarity ratings on the same pairs.(See below.)Because subjects experienced different pair
types and there were different numbers of sub-jects in each of the three groups, three, one-way, within-subjects, analyses of variance ofthe relation strength ratings were conductedwith each type of stimulus pair as factors. Foreach factor, there was a statistically significanteffect of type of stimulus pair on the mean re-lation strength ratings. For Group 1, Wilks'Lambda = .61 1; F (6, 24) = 2.55; p < .05; r2 =.39. Follow up, pair-wise comparisons showedthat ofthe 21 post hoc contrasts, mean relationstrength differed statistically between 17 pairsof means (p < .05), and did not differ statisti-cally on 4 contrasts, i.e., A-B v A-D (p < .80),A-C v B-D (p < .09), A-C v B-C (p < .50),B-C v B-D (p < .06). For Group 2, Wilks' A =.44; F (6, 74) = 15.93; p < .001; r 2 = .56. Fol-low up, pair-wise comparisons showed that ofthe 21 post hoc contrasts, the mean relationstrength ratings differed statistically between20 pairs of means (p < .05) and did not differstatistically for one, A-D v B-D (p = .17). ForGroup 3, Wilks' A= .53; F(6, 33) =4.95;p =.001; r2 = .47. Follow-up, pair-wise compari-sons showed that of the 21 post hoc contrasts,mean relation strength ratings differed statisti-cally between 20 pairs of means (p < .05) anddid not differ statistically for one, A-C v B-C(p = .06).

OSBORNE AND HEATH
Table 10. Mean Strength Ratings for Stimulus Pairs in Experiment 4.
Pair AA AB AC AD BC BD CDNo.
1 4.23 3.70 3.06 3.47 2.90 3.47 3.332 4.38 3.75 3.37 3.87 3.44 3.23 3.133 4.38 3.60 3.23 3.90 3.15 3.66 2.224 4.20 3.67 2.81 3.31 3.04 3.79 3.115 4.31 3.55 3.42 3.09 2.97 2.43 2.416 4.27 4.06 3.10 3.83 3.07 3.65 3.517 4.33 3.77 3.03 3.47 3.07 3.13 3.108 4.23 3.56 3.37 3.50 3.36 4.03 3.189 4.47 4.10 3.91 4.00 3.90 3.88 3.5410 4.21 3.95 3.54 2.84 3.72 2.87 2.0411 4.18 3.87 3.10 3.44 3.17 3.90 3.4612 4.38 4.04 3.69 3.79 3.56 3.97 3.6913 4.47 4.10 3.37 4.15 3.59 4.07 3.4014 4.40 3.30 3.43 3.97 3.36 2.72 2.5415 4.33 4.31 3.27 3.87 3.20 3.80 2.9016 4.40 3.82 3.03 3.30 2.93 3.20 3.2317 4.30 3.77 3.26 4.00 3.30 3.97 2.7418 4.40 4.10 3.63 4.00 3.20 3.50 2.9719 4.19 4.07 3.10 3.47 3.15 3.45 2.7020 4.46 4.18 3.46 3.73 3.40 3.92 3.7421 4.33 3.47 3.37 3.40 3.30 3.20 3.2122 4.27 3.72 3.26 3.40 3.44 3.24 3.0323 4.33 3.97 3.87 3.87 3.85 3.90 3.5324 4.41 3.60 3.25 4.05 3.41 3.33 1.7925 4.23 4.23 3.83 4.13 3.90 4.00 3.7426 4.30 4.23 3.69 2.79 3.52 3.21 3.0127 4.19 3.64 3.33 3.85 3.08 2.90 3.6428 4.44 4.26 2.99 3.74 2.79 3.71 2.0529 4.30 3.50 3.27 3.85 2.97 3.71 3.0030 4.33 3.37 3.17 3.93 3.23 2.09 1.6931 4.41 3.08 2.67 3.37 2.63 3.15 2.1332 4.35 3.8 3.17 3.67 3.51 3.00 2.9733 4.10 3.46 3.34 3.63 3.33 3.27 2.5334 4.41 3.30 3.23 3.45 3.54 3.55 3.2035 4.30 3.59 2.85 3.82 2.49 3.68 2.4636 4.30 4.11 3.72 3.35 3.87 3.74 3.0637 4.33 4.08 3.32 3.33 3.41 4.18 1.8638 4.33 3.85 3.30 3.68 3.41 3.67 3.7339 4.36 3.95 3.87 3.90 3.83 3.95 3.6240 4.46 3.87 3.43 3.57 3.79 3.83 3.6241 4.41 3.97 3.40 3.92 3.40 3.56 2.0742 4.33 4.15 3.18 4.08 3.21 3.64 2.9243 4.30 3.77 3.51 3.90 3.28 4.08 2.7744 4.33 4.23 3.27 3.83 3.27 3.67 3.2345 4.20 3.10 3.26 3.80 3.47 3.90 2.7746 4.32 3.92 3.23 3.86 3.37 3.95 2.99
Means 4.32 3.82 3.33 3.68 3.32 3.53 2.95
76

PREDICTING RELATIONAL CONTROL 77
VI~~~~~~
Yam iiA--i -:-uWsIo A*qlu9-
VI~ ~ ~ -
I- I-~~~~~~~~~~~~~~~~~~~~~~~V
* ~~~~~0
4~ ~~-_- I
VV 0
~~~.9 .9._a _ ............. ..I<"n_: ~~~~ | - 1 -9S~~NI .N..........__B....
.uwA. $ O Apl. - A-X---|--- ----- I - 9 -1- --||--1-~~~~. - --.9~g I§
_C-relat a tax c a a .
I-l',!i-l-9l-i - 9=-'i.-f ... .9 ,- 0 .9 _ -
,-l~ ~ IlI - r
~~~.9 .9 , ___,hl..9.............. ,_..__ ...... ......... .. _0w __._................. ,.,w ,.....N
~~~~~~~... .9 . , -.9_. ...s .............."I_ ....
~~~~9 _=_-
_ - - - -- ? _ -S-|- ,' -- 9-s, - o
_ _ .9 .' 0* .9 .9 9- 0 _ .9 (4
Figure 4. Mean similarity ratings by the subjects of Experiment 4 ofthe 322 stimulus pairs divided into seven sets of pairtypes (i.e., A-A, A-B, etc.). Pair types A-A, A-B, and A-C relate taxonomic stimuli, while pair types A-D, B-D, andC-D relate a taxonomic and a thematic stimulus.
Similarity.
The results ofthe similarity ratings are shownin Figure 4. Each panel shows the mean simi-larity ratings for each of the 46 pairs of stimuli
that comprised each ofthe seven pair types (i.e.,A-A, A-B, etc.). An orderly relation can beobserved across the pair types with the highestsimilarity ratings given to the A-A pairs andthe lowest given to the C-D pairs.
78 OSBORNE AND HEATH
"4
.- .. _..
01
AA AB AC BC AD BD CDPair Type
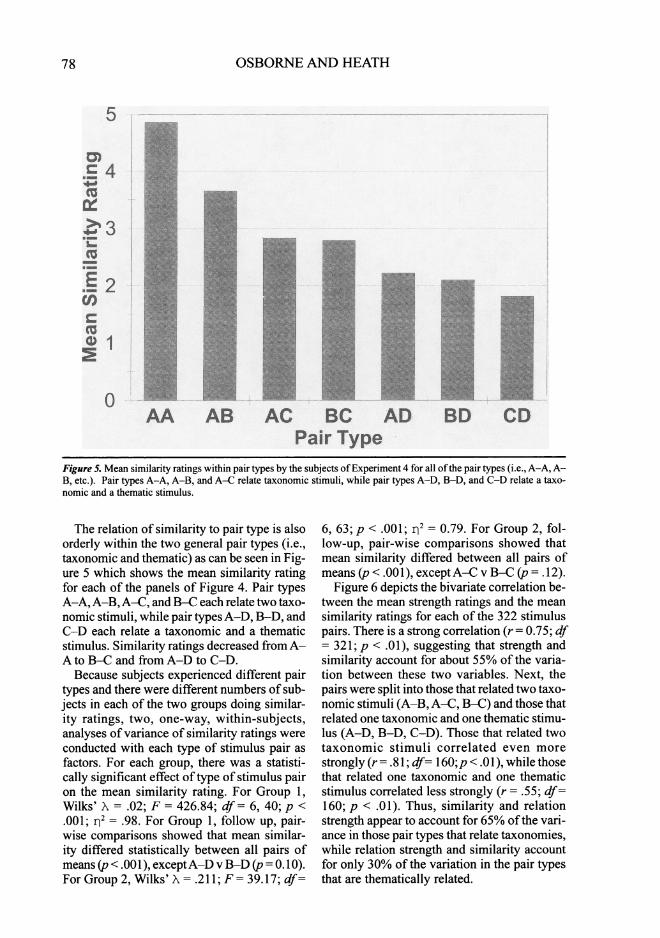
Figure 5. Mean similarity ratings within pair types by the subjects ofExperiment 4 for all ofthe pair types (i.e., A-A, A-B, etc.). Pair types A-A, A-B, and A-C relate taxonomic stimuli, while pair types A-D, B-D, and C-D relate a taxo-nomic and a thematic stimulus.
The relation of similarity to pair type is alsoorderly within the two general pair types (i.e.,taxonomic and thematic) as can be seen in Fig-ure 5 which shows the mean similarity ratingfor each of the panels of Figure 4. Pair typesA-A, A-B, A-C, and B-C each relate two taxo-nomic stimuli, while pair types A-D, B-D, andC-D each relate a taxonomic and a thematicstimulus. Similarity ratings decreased fromA-A to B-C and from A-D to C-D.Because subjects experienced different pair
types and there were different numbers of sub-jects in each of the two groups doing similar-ity ratings, two, one-way, within-subjects,analyses of variance of similarity ratings wereconducted with each type of stimulus pair asfactors. For each group, there was a statisti-cally significant effect of type of stimulus pairon the mean similarity rating. For Group 1,Wilks' A = .02; F = 426.84; df = 6, 40; p <.001; p2 = .98. For Group 1, follow up, pair-wise comparisons showed that mean similar-ity differed statistically between all pairs ofmeans (p < .00 1), exceptA-D v B-D (p = 0.10).For Group 2, Wilks'XA= .21 1; F = 39.17; df=
6, 63; p < .001; r2 = 0.79. For Group 2, fol-low-up, pair-wise comparisons showed thatmean similarity differed between all pairs ofmeans (p < .001), exceptA-Cv B-C (p = .12).
Figure 6 depicts the bivariate correlation be-tween the mean strength ratings and the meansimilarity ratings for each of the 322 stimuluspairs. There is a strong correlation (r = 0.75; df= 321; p < .0 1), suggesting that strength andsimilarity account for about 55% of the varia-tion between these two variables. Next, thepairs were split into those that related two taxo-nomic stimuli (A-B, A-C, B-C) and those thatrelated one taxonomic and one thematic stimu-lus (A-D, B-D, C-D). Those that related twotaxonomic stimuli correlated even morestrongly (r= .81; df= 160;p < .01), while thosethat related one taxonomic and one thematicstimulus correlated less strongly (r = .55; df=160; p < .01). Thus, similarity and relationstrength appear to account for 65% ofthe vari-ance in those pair types that relate taxonomies,while relation strength and similarity accountfor only 30% of the variation in the pair typesthat are thematically related.

PREDICTING RELATIONAL CONTROL 79
>7.3~~~~~~~~~~~d
S~~~~~~~~~~~~~.d
Figure 6. Scatterplot of the relation (r .75) between similarity and strength ratings in Expeniment 4.
Discussion
In this experiment a new set of stimuli wascomposed by different experimenters, essen-tially without regard for (but with knowledgeof the framework of) the set of stimuli used inExperiments 1 through 3. With this new set ofstimuli, the results for the classification andstrength ratings replicate those ofthe prior ex-periments. From A-A pairs, judged mostlytaxonomic, taxonomic judgments decreaseduntil on A-C pairs, fully 35% were classed bya majority of subjects as thematic-the size ofthis outcome unforeseen-while almost all A-D pairs were classed thematic. Subjects' judg-ments of relation strength rated the A-A pairsmost strongly and the strength ratings de-creased across the pair types in orderly fash-ion until they increased again for the A-D the-matic ratings.The similarity ratings paralleled the strength
ratings withA-A pairs rated most similar. Simi-larity then decreased from basic taxon throughsuperordinate taxon. The taxonomic pairs (A-A, A-B, A-C, B-C) were rated higher on simi-
larity than the thematic pairs (A-D, B-D, C-D).The higher correlation between similarity
and strength ratings for the taxonomic pairtypes suggests that similarity could be more ofa controlling factor on those pair types than onthe thematic pair types.
EXPERIMENT 5
In this experiment we wanted to systemati-cally replicate Experiment 2 with the new setof picture pairs used in Experiment 4 by plac-ing those picture pairs into a conditional dis-crimination task, i.e., matching to sample, ofdifferent trial types with common samples.Again we wanted to determine whether therewould be systematic selections of identical,basic, or superordinate, taxonomically relatedcomparisons and/or thematically related com-parisons in the various trial types; and, if thestrength ratings generated in Experiment 4 re-lated to comparison selection in this experi-ment.

80 OSBORNE AND HEATH
METHOD
Subjects
As before, subjects (N = 63 ) were volun-teers from beginning undergraduate classes atUtah State University. Inadvertently, subjects'ages were not coded. Subjects were again of-fered extra credit for their participation in theexperiment.
Stimuli
Five hundred fifty-two slides were composedfrom the stimuli described in Table 8 as theywere in Experiment 2.
Procedure
The procedure was the same as Experiment2 except that the subjects were subdivided intothree groups, all of whom matched-to-sample250 configurations of the 552-the scoringlimit of the Scantron form. Group 1 matchedconfiguration numbers 1-250, Group 2 num-bers 402-552, and Group 3 numbers 200-450.
Results
Table 11 shows the collected responses ofthe subjects to each trial type (columns) foreach sample (rows). The table shows that fortrial types A(AB), A(AC), and A(AD) wherethe sample stimulus could be matched with it-self, that is, A was a sample and the same Awas a comparison, subjects most frequentlychose A. Whenever an arbitrary match was re-quired-on trial types A(BC), A(BD), andA(CD)-subjects chose B when B and C werecomparisons; chose B when B and D were com-parisons; and chose C less frequently than Dwhen C and D were comparisons (see columntotals).
Table 11 also shows the results of relatingcomparison selection with the mean strengthof relation ratings that were produced in Ex-periment 4. Again, the more strongly rated re-lation was used to predict comparison selec-tion in the matching-to-sample task. The cellsin Table 11 contain asterisks for 45 of the 46configurations on trial type A(AB), 46 of 46configurations on trial types A(AC) andA(AD);44 of 46 configurations for trial type A(BC);
35 of 46 configurations for trial type A(BD);and 34 of 46 configurations for trial typeA(CD).
Discussion
Collectively, the stronger stimulus relationwas chosen on 97.8% of the configurations onthe matching to sample when the trial type wasA(AB); on 100% when the trial types wereA(AC) and A(AD); on 95.6% of the configu-rations when the trial type was A(BC); on76.1% when the trial type was A(BD); and on73.9% when the trial type was A(CD). In twoconfigurations, A 14(B 14C 14) andA45(B45C45), B was selected thoughA-B wasthe more weakly rated relation. Uniquely, theA25-A25 and A25-B25 relations tied instrength ratings (Table 10), but all but five re-sponses were selections of A25-A25 on theA25(A25B25) configuration. On the 11 incor-rect predictions for the A(BD) trial type, eightwere selections of A-B when A-D was themore strongly rated relation, two were selec-tions ofA-D whenA-B was the more stronglyrated relation, and one was an equal selectionofA-B and A-D when A-B was the (slightly)more strongly rated relation. Overall, the morestrongly rated ofthe two relations was selectedon 250 of the 276 configurations (90.6%).When the relation strength rating is not pre-dictive, similarity between sample and com-parison may prevail.On configurations of the A(CD) trial type
where similarity between sample and compari-son is less an issue, 41 of the 46 A-D relationswere rated stronger than their comparable A-C relations. The differential strength analysispredicted comparison selection on 29 of these41 correctly (70.7%). Four of the A-C rela-tions were rated stronger than their comparableA-D relations. All four were predicted cor-rectly (100%). One set of relations (A23-C23and A23-D23) was tied in strength ratings(Table 10). There were 63 total responses tothe A23(C23D23), configuration so that giventhe odd number, a strict tie was not possible.The A23-D23 relation was selected 32 timesand theA23-C23 relation was selected 31 times(Table 1 1), as close to a tie as was possible. Toreiterate, in the A(CD) trial type, ifthe strengthrelation only reflected similarity betweensample and comparison, there should have beenno correct A-D predictions.

PREDICTING RELATIONAL CONTROL
Table 11. Frequencies of Selection of Comparisons (Experiment 5).
Sample CO:AB CO:AC CO:AD CO:BC CO:BD CO:CD(A)
Al Al=63* Al=59* Al=51* Bl=44* B1=19* Cl=34Bl=O C1=4 Dl=7 Cl=6 Dl=17 Dl=45*
A2 A2=77* A2=57* A2=45* B2=68* B2=401 C2=25B2=2 C2=6 D2=18 C2=11 D2=23 D2=38*
A3 A3=74* A3=71* A3=45* B3=44* B3=17 C3=8B3=5 C3=3 D3=18 C3=6 D3=35 D3=21*
A4 A4=44* A4=55* A4=35* B4=54* B4=60* C4=34B4=3 C4=13 D4=12 C4=7 D4=14 D4=28
AS A5=49* A5=56* A5=55* B5=70* B5=32* C5=34*B5=1 C5=2 D5=8 C5=4 D5=15 D5=29
A6 A6=57* A6=77* A6=27* B6=95* B6=39* C6=18B6=6 C6=2 D6=9 C6=2 D6=11 D6=40*
A7 A7=61* A7=65* A7=48* B7=56* B7=51* C7=24B7=2 C7=3 D7=20 C7=5 D7=17 D7=50*
A8 A8=57* A8=76* A8=46* B8=89* B8=61* C8=24B8=4 C8=3 D8=6 C8=8 D8=30 D8=55*
A9 A9=72* A9=44* A9=36* B9=43* B9=39* C9=33B9=2 C9=3 D9=11 C9=2 D9=24 D9=25
AIO A1O=58* A1O=59* A1O=38* B10=51* B1O=54* C1O=40*B10=1 ClO=4 D1O=7 C10=1 D1O=9 D1O=33
All A11=53* A11=51* A11=71* B11=49* B11=66* C11=23B11=5 C11=1 D11=8 C11=1 D11=13 D11=38*
A12 A12=100* A12=61* A12=37* B12=30* B12=60* C12=23B12=8 C12=2 D12=13 C12=4 D12=14 D12=24*
A13 A13=31* A13=34* A13=34* B13=45* B13=17 C13=22B13=3 C13=0 D13=8 C13=7 D13=19* D13=51*
A14 A14=35* A14=29* A14=36* |B14=44 B14=10 C14=14B14=1 C14=3 D14=9 C14=19 D14=37* D14=44*
A15 A15=30* A15=34* A15=23* B15=32* B15=34* C15=15B15=4 C15=2 D15=6 C15=4 D15=13 D15=58*
A16 A16=25 A16=94* A16=76* B16=35* B16=38* C16=8B16=4 C16=9 D16=16 C16=10 D16=9 D16=10*
A17 A17=70* A17=59* A17=23* B17=56* B17=31 C17=17B17=4 C17=4 D17=11 C17=5 D17=16 D17=62*
(Continued, p. 82)
81

OSBORNE AND HEATH
Table 11. Frequencies of Selection of Comparisons (continued).
Sample CO:AB CO:AC CO:AD CO:BC CO:BD CO:CD(A)
A18 A18=57* A18=50* A18=12* B188=49* B18=26 C18=12B18=6 C18=2 D18=6 C18=3 D18=26 D18=46*
A19 A19=54* A19=50* A19=51* B19=39* B19=45* [C19=9B19=4 C19=4 D19=12 C19=6 D19=13 D19=9
A20 A20=86* A20=59* A20=33* B20=59* B20=46* C20=36B20=4 C20=4 D20=12 C20=15 D20=15 D20=27
A21 A21=29* A21=43* A21=50* B21=34* B21=53* C21=68B21=3 C21=4 D21=7 C21=2 D21=12 D21=35
A22 A22=72* A22=106* A22=69* B22=35* B22=33 C22=18B22=7 C22=13 D22=23 C22=12 D22=35 D22=45*
A23 A23=39* A23=45* A23=38* B23=52* B23=40* C23=31*B23=8 C23=2 D23=9 C23=10 D23=17 D23=32*
A24 A24=53* A24=57* A24=61* B24=25* B24=8 C24=10B24=5 C24=5 D24=13 C24=7 D24=20 D24=53*
A25 A25=53 A25=28* A25=60* B25=47* B25=36* C25=15B25=5 C25=6 D25=14 C25=5 D25=22 D25=37*
A26 A26=27* A26=45* A26=18* B26=43* B26=16* C26=52*B26=2 C26=5 D26=0 C26=6 D26=2 D26=11
A27 A27=64* A27=58* A27=60* B27=29* B27=4 C27=25B27=4 C27=5 D27=13 C27=23 D27=14* D27=33*
A28 A28=69* A28=58* A28=27* B28=40* B28=38* C28=28B28=5 C28=5 D28=9 C28=4 D28=14 D28=35*
A29 A29=61* A29=64* A29=53* B29=82* B29=40| C29=17B29=7 C29=3 D29=8 C29=5 D29=22 D29=17
A30 A30=56* A30=46* A30=49* B30=33* B30=16 C30=5B30=7 C30=1 D30=14 C30=1 D30=18* D30=42*
A31 A31=63* A31=74* A31=13* B31=44* B31=14 C31=8B31=5 C31=5 D31=3 C31=3 D31=22* D31=39*
A32 A32=58* A32=72* A32=38* B32=53* B32=45* C32=13B32=3 C32=2 D32=9 C32=5 D32=18 D32=21*
A33 A33=47* A33=47* A33=64* B33=39* B33=67| rC33=B33=3 C33=5 D33=10 C33=23 D33=23 D33=29
(Continued, p. 83)
82

PREDICTING RELATIONAL CONTROL
Table 11. Frequencies of Selection of Comparisons (continued).
Sample COAB CO:AC COAD CO:BC CO:BD CO:CD(A)
II E~ I
A34=68* A34=59* A34=39* B34=49*B34=6 C34=2 D34=8 C34=3
A35=71* A35=70* A35=54* B35=51*B35=3 C35=4 D35=9 C35=7
B34=24D34=12B35=20D35=12
C34=46D34=44C35=20D35=30*
A36=46* A36=33* A36=38* B36=26* B36=30* C36=28*B36=6 C36=1 D36=9 C36=3 D36=17 D36=19
A37=43* A37=29* A37=52* B37=23* B37=51* C37=38B37=2 C37=5 D37=6 C37=13 D37=23 D37=28A38=87* A38=102* A38=47* B38=48* B38=30* C38=42B38=9 C38=6 D38=5 C38=2 D38=4 D38=16A39=59* A39=27* A39=57* B39=64* B39=52* C39=38B39=4 C39=2 D39=6 C39=16 D39=9 D39=9A40=50* A40=57* A40=26* B40=55* B40=71* C40=20B40=2 C40=6 D40=10 C40=6 D40=26 D40=16A41=59* A41=59* A41=65* B41=44* B41=8 C41=21B41=9 C41=4 D41=14 C41=3 ID41=10I D41=42*
A42=31 * A42=88* A42=52* B42=59* B42=29*B42=3 C42=2 D42=11 C42=4 D42= 18A43=57* A43=45* A43=23* B43=33* B43=38B43=6 C43=0 D43=11 C43=3 D43=23A44=53* A44=0** A44=37* B44=46* B44=32*B44=5 C44=0 D44=6 C44=6 D44= 1 5
A45=56* A45=62* A45=50* B45=60 B45=33B45=4 C45=1 D45=13 C45=8 D45=30A46=61* A46=107* A46=52* B46=18* B46=44*B46=2 C46=5 D46=11 C46=0 D46=29
C42=13D42=34*
C43=15D43=30*
C44=23D44=39*
C45=1D45=35*
C46=1 1D46=22*
Totals A=2,585 A=2,621 A=2,014 B=2,184 B=1,666 C=1,110(93.0%) (93.9%) (80.8%) (87.7%) (66.6%) (42.1%)B=194 C=171 D=478 C=306 D=837 D=1,526(7.0%) (6.1%) (19.2%) (12.3%) (33.4%) (57.9%)
% 97.8 100.0 100.0 95.6 76.1 73.9Hits
*Matching-to-sample outcome predicted by mean strength ofrelation rating from Table 10. The 26 cells ofthe table thatare outlined are not predicted by the results of Table 10.
**A44(A44C44) and A44(C44A44) were inadvertently omitted from the presentation.
A34
A35
A36
A37
A38
A39
A40
A41
A42
A43
A44
A45
A46
83

84 OSBORNE AND HEATH
As with the earlier set of stimuli, subjectsappeared to match on the basis of perceptualsimilarity of sample and comparison on trialtypes where that was possible. This is inferredfrom the A(AX) trial types. And it can also beinferred from the arbitrary matching-to-sampletrial types as well. As B comparisons were, in-deed, rated more perceptually similar toA com-parisons than C comparisons, subjects choseB comparisons to match with A in the A(BC)trial type. As B comparisons were rated moreperceptually similar to A comparisons than Dcomparisons were, subjects chose B compari-sons to match with A in the A(BD) trial type.Finally, where there was little or no similaritybetween A samples and C or D comparisons,selections were evenly distributed between Ccomparisons and D comparisons in the A(CD)trial type.
GENERAL DISCUSSION
Developmental Psychology and TheseStudies
In two-choice matching to sample utilizingnatural stimuli that are related by theme ortaxon, college students frequently select thestimulus relation that is-by themselves or byothers like them-the most strongly rated. Re-lation strength ratings may relate to compari-son selection in this matching-to-sample taskonly in the absence of modeling or reinforce-ment, because the latter two variables exert con-siderable control when present (Bauer &Mandler, 1989; Osborne & Koppel, 2001;Smiley & Brown, 1979). In the present stud-ies, there was no formal modeling, and withthe exception of the presentation of a subse-quent trial, there were no systematic outcomesthat were a result of responding. To this pointit is interesting to note that in the Smiley &Brown (1979) study, the model was observedin a first session, and the model's behavior wasinfluential in providing a context for subjectbehavior as either thematic or taxonomic. Inthe next session, in the absence of the model,subjects tended to revert to the type of selec-tions they had made prior to observing themodel in the prior session (Smiley & Brown,1979). Explicit or implicit ratings of relationstrength may be valid only in the absence of(programmed) reinforcement and modeling.As age was not manipulated, generalization
ofthe utility ofthis ratings strength analysis toother ages is unwise until such time as it isshown to apply there as well. However,Osborne and Calhoun (1998) showed thatyoung children (29-73 mos), across a numberofexperiments using a similar task-2-choicematching to sample in which the configurationswere primarily of the A(CD) type-tended torespond similarly across experiments to indi-vidual configurations. That is, on some con-figurations most of the children selected taxo-nomically, on others most selected thematically,and on still others they were, collectively, in-different (see also Bauer & Mandler, 1989).These results occurred independently of thekind of taxon, instructions, general praise forresponding or its absence, or the presence of athird unrelated comparison in the matching-to-sample task. However, Osborne and Calhoun(1998) did not ask their subjects to rate thestimulus relations in the matching-to-sampletask.The present results suggest one reason why
taxonomic or thematic selection prevails on agiven configuration or trial type. Subjects arenot necessarily more taxonomically or themati-cally oriented. Rather, there are configurationswhere they are more likely to choose themati-cally and configurations where they are morelikely to choose taxonomically (Osborne &Calhoun, 1998). The results ofthe present stud-ies suggest that this differential likelihood re-lates to the different strength ratings of thestimulus relations that comprise each configu-ration. That is, each matching-to-sample con-figuration comprises its own context for eachsubject given the subjects' histories with thestimulus relations therein.
Experimental Analysis ofHuman Behaviorand These Studies
The present experiments are hybrids in thesense that they relate to what has been an issuefor developmental psychologists, but they doso from the framework of behavior analysisand have implications for behavior analysis aswell. To developmental psychologists issuessurrounding taxonomic and thematic relationalresponding may be thought to be settled bydemonstrations that such responding relatescollectively to reinforcement and modeling(Bauer & Mandler, 1989; Smiley & Brown,1979) and verbal justification by subjects as to

PREDICTING RELATIONAL CONTROL 85
why they selected a particular comparison in aparticular configuration (e.g., Baldwin, 1992).To the present authors, the question of rela-tional responding in this conditional discrimi-nation task is not settled, until-as withWatson's goal-knowing the effective stimu-lus (relation), we can predict the response rea-sonably well. The ratings strength analysis at-tempts a closer approach to that goal.
Further, the experiments herein constitutefunctionally direct or systematic replicationsof one another-indeed, replications in whichthe results on several levels were nearly iden-tical (e.g., relation classification; strength rat-ings; correct predictions). These replicationssuggest the irrelevance of subject history, al-though subject history was not directly manipu-lated (except for immediate history in Experi-ment 3) and the subjects in each experimentwere from the same age and cultural popula-tion. Indeed, one of the replications suggeststhe generality of the results (and the analysis)across different sets of stimuli.Natural and other stimuli. The use of natu-
ral stimuli in experimental analysis has solidprecedent. Such stimuli are useful in the studyof conceptual and verbal behavior and reason-ing (e.g., Herrnstein, Loveland, & Cable, 1976;Premack, 1983). However, the tendency ofmost experimental analysts of human behav-ior is to avoid the use of natural stimuli sincethey are difficult to describe in the language ofphysics, and they have meaning to human sub-jects. Meaning may be thought to confoundacquisition. In the acquisition of conditionaldiscriminations, this has led to the use of arbi-trary stimuli and symbols from other languageswhich are assumed to have no meaning to mostwesterners (e.g., Gatch & Osborne, 1989;Sidman & Tailby, 1982). Yet, the fact that natu-ral stimuli have meaning to human subjects iscritical to the examination of such relations astaxons and themes (see also, Bush, Sidman, &deRose, 1989). Moreover, it is difficult to seehow taxonomic and thematic stimulus relationscould be examined without resorting to the useof natural stimuli. In any case, acquisition wasnot a question in the present studies.
Multiple stimulus control topographies. Withlimited exceptions (Dube & McIlvane, 1996;Lowenkron, 1998), behavior analytic explana-tions ofmatching-to-sample appear-by omis-sion-to consider that a single stimulus rela-tion is functional on any trial. That is, responses
to Al-BI in a configuration composed ofAl (B 1B2) are reinforced and behavior analystsconsider primarily the development of the sin-gularA1-B1 relation and ignore Al-B2 ifpos-sible (sometimes with peril, e.g., Carrigan &Sidman, 1992; Stromer & Osborne, 1982).Even when responses to Al-Cl are reinforcedto set the stage for the emergence of transitiverelations, Al-C2 is ignored where possible.Control by stimulus relations not specified bythe experimenter suggests the existence of dif-fering stimulus control topographies (Mcllvane& Dube, 1992).Most directly related to the present experi-
ments are configurations such asAl (B 1 C1) af-ter the foregoing training. That is, Al(BIC1)is a configuration with two functional stimu-lus relations with a somewhat equivalent rela-tional history-the kinds of configurationsused in the present studies. Responses to suchconfigurations are necessarily forced choiceand we say that one relation controlled on thatparticular trial even though both relations arepotentially functional. Where it has been dem-onstrated that more than one relation exists, andselection of one or the other comparison oc-curs, the construct of selective attention is in-voked (Ray, 1969), which describes, but doesnot explain, the resulting stimulus controlwhere there is more than one possible control-ling relation. In the natural environment, itseems reasonable to consider the existence ofmatching-to-sample configurations that consistof more than one functional stimulus relation,only one ofwhich can be functional on an oc-casion because the subject can only make oneresponse. Such configurations constitute achoice task and the variables known to be func-tional in choice tasks-for example, reinforce-ment history, quality of, and time to, reinforce-ment-should be functional (Dube &McIlvane, 1996). Again, such configurationssuggest multiple stimulus control topographies.
Is it possible that the ratings strength analy-sis proposed herein might constitute a partialexplanation of relation selection in the condi-tional discrimination task more broadly thanin the present experiments? Such an analysiswould not necessarily fly in the face of estab-lished explanations for responding in match-ing to sample (Carter & Werner, 1978;Cumming & Berryman, 1965) for non humansubjects in which responding in the conditionaldiscrimination is controlled by stimulus rela-

86 OSBORNE AND HEATH
tions of the type if ... then (i.e., if Al, thenBi) and the conditional discrimination isthought to be composed of a successive dis-crimination (between samples) followed by asimultaneous discrimination (between com-parisons), that is, is composed of two, three-term contingencies (Sidman, 2000).
In the present studies the subjects, by theirratings, the initial instructions, and their histo-ries, were familiar with both of the relations inthe matching-to-sample configurations. Wherethere are two functional stimulus relations thatshare a common stimulus it is reasonable toconsider that the stimulus common to each mustcode for both of the stimuli to which it relates.As such, Lowenkron's (1998) analysis of se-lection in conditional discrimination tasks mayrelate to the present task. In his conception, se-lections in conditional discriminations that arerelationally based are mediated by verbal re-sponses such as tacts, self-echoics, self-duplics,and autoclitics. The mediating verbal responseidentifies which kind of relation is exempli-fied by the two stimuli. In this conception,autoclitics that are produced by each of thepairs of stimuli in a matching-to-sample con-figuration cycle until one eventually leads tothe selection response. Left in question is whatends the cycle. Could the differential strengthsof the stimulus relations answer?
In the present set of studies two sets of oper-ants were shown to be highly correlated. Sub-jects' behavioral ratings ofthe strengths ofpairsof stimuli in one task related to the subsequentbehaviors of the same and different subjects ina task that used the same pairs of stimuli in aconditional discrimination. The behaviors ofrating the strengths of stimulus pairs were atdifferent times both conceptually and tempo-rally prior to the selections of relations in thesubsequent matching-to-sample task and atother times came after matching to sample. Thatsuch responses are so highly correlated maysuggest that the stimulus control topographiesin each cohere. In other words, the subjectswere essentially emitting different behaviorsin the two tasks that were controlled by thesame stimulus relations. Logically, this makessense given the assumption that the same stimu-lus relations are operationally present in the twotasks and may be similarly functional therein.
Hypothetical constructs. It might be arguedthat the relationship between these operants isassumed and hypothetical, but that is not so.
Both strength ratings and comparison selec-tions were publically emitted, were related sta-tistically, and were found to be well correlateddependent variables. To functionally relatethese operants would necessitate the manipu-lation ofone or the other-presumably first thestrength judgments of the subjects-and todetermine that such manipulations related func-tionally to subjects' subsequent relation selec-tions in the matching-to-sample task. Then,secondly, directed responding in the matchingto sample, say by reinforcing selections oftaxo-nomic or thematic comparisons, would presum-ably result in different strength ratings. Thecurrent studies contain several approximationsto the former objective. First, an indirect ma-nipulation of relation strength involved theconstruction of the stimulus sets in all of theexperiments. No particular care was taken todesign these stimulus sets other than to selectrecognizable stimuli and to give the stimulusrelations the stimulus pairs were supposed toportray face validity. As such there was no de-sign with respect to the construction of thestimulus pairs that led systematically to onerelation being identified as stronger than anyother, a priori. Relation strength ratings werefree to vary in this context as were the differ-ences between relations in terms of their ratedstrengths. As such, there was change of ratedstrengths within and across stimulus pairtypes-the manipulation of a parameter of anindependent variable akin to exposing subjectsto a random set of values of a particular pa-rameter of an independent variable. Second,the use of a different set of stimuli (Experi-ments 4 and 5)-again constructed in the ab-sence ofprior design with respect to individualconfigurations-is a step closer to the system-atic manipulation of an independent variablein these experiments. Such a change is equiva-lent to presenting a new random set of valuesof the same independent variable. Finally, thedifference in the order ofprocedure in Experi-ment 3 constitutes another approximation toan independent variable. The subjects in Ex-periment 3 who had the experience of classi-fying and judging the strengths ofthe relationsin their matching-to-sample configurationsbefore they saw those configurations selectedthe stronger of the two stimulus relations morefrequently than did the subjects in Experiment3 who matched first and rated second. Thisoutcome suggests that whatever stimulus con-
PREDICTING RELATIONAL CONTROL 87
trol topography was produced by classifyingand rating facilitated the matching to samplein a particular way.Incomplete research designs. The absence of
complete research designs in these experimentstaken individually is not detrimental to the re-sulting inferences which attain generality viareplications across experiments. Consider theabsence of complete research designs in suchdemonstration experiments as those byHerrnstein et al. (1976) with respect to pigeonconceptual behavior and Premack (1983) withrespect to reasoning by chimpanzees. InHermstein et al. 's (1976) experiments there wasno direct manipulation ofan independent vari-able. Generalization of outcome was achievedvia systematic replication of the pigeons' con-ceptual behavior with more than one concept-akin to using more than one stimulus set in thepresent experiments. In the present experi-ments, when a new set of stimuli was con-structed, the results were largely the sameacross experiments, suggesting the generalityof the outcomes and the analysis that led tothem. Moreover, having subjects classify andrate the strength of stimulus pairs prior to theinclusion ofthose same stimulus pairs in match-ing-to-sample configurations appeared to re-late to subjects more frequently selecting thecomparisons in the more strongly rated stimu-lus pairs than was the case for their peers whoclassified and rated strength after they did thematching to sample. In sum, from the presentexperiments, it is possible to infer that strengthratings constitute operants of similar stimuluscontrol topography to the stimulus control to-pography involved in the subsequent selectionofstimulus relations in the matching-to-sampletask. Moreover, this conception is possiblewithout considering ratings strength as a hy-pothetical construct. It is, rather, a derived de-pendent variable in its own right that is highlycorrelated with operants that follow.
Conditional discriminations: To be or not tobe. And, finally, are the trial types used in thepresent experiments really conditional dis-criminations? In a typical conditional discrimi-nation, the sample instructs which one of twoor more concurrently presented comparisonstimuli are discriminative for reinforcement. Inthe present experiments the sample could in-dicate that both comparison stimuli were dis-criminative for reinforcement-were there anyreinforced trials, which there were not-be-
cause selection of either comparison in thepresent experiments was consistent with oneor the other relations postulated by the experi-menters. Under these circumstances one can-not call this task a conditional discriminationsince the sample is not necessary to the selec-tion of any one comparison. In other words,procedurally, samples herein do not appear tohave an instructional function (Cumming &Berryman, 1965). However, this proceduralabsence does not necessarily translate to theabsence of an instructional function of thesample in this task. Consider any conditionaldiscrimination, where as above, in the configu-ration Al(B 1 B2) selection ofB1 is reinforced;and in the configuration Al (Cl C2) selectionof C 1 is reinforced. In each case Al instructsthe selection ofa different comparison. In thosetwo configurations Al's instructional functionoccurs as a result of differential reinforcementand the different comparisons shown with iton a particular trial. After such training wespeak of relations between Al and Cl and be-tweenAl and B 1. What then ofa trial on whichwe presentA I (B 1C 1) after such training? Doessuch a trial do away with the conditionality ofthe conditional relation? Procedurally, it wouldappear to. But such a conclusion neglects thesubject's most recent history in which, acrosstrials, samples are instructional. The select-one-relation-only condition continues on anAl(BICI) trial, since after a selection of ei-ther comparison, the trial ends. The sequenceof the experiment does not change. These con-ditions permit the inference of a generalizedfunction (as instructor or selector of discrimi-nations) of the sample, notwithstanding theabsence of conditionality owing to both com-parisons being consistent with previously re-inforced relations.There are several ways to circumvent the
conditionality dilemma argumentatively, all ofwhich involve demonstrations of the instruc-tional function of the sample in this same task.In one, differential reinforcement oftaxonomicor thematic selections gives the samples an in-structional function (i.e., select taxonomic com-parisons or select thematic comparisons).Osborne and Koppel (2001) demonstrated sucha function. They reinforced college studentselections of either taxonomic or thematic re-lations on a set of trial types ofthe A(CD) type(with A-C = superordinate taxonomic relationsand A-D = thematic relations). After being

88 OSBORNE AND HEATH
trained to criterion on one set ofconfigurations,subjects were tested (in the absence of feed-back) on a new set of configurations of thesame type. The feedback contingencies werethen reversed. Where subjects were given feed-back for selecting taxonomically, they weregiven feedback for selecting thematically, andvice versa. After each ofseveral reversals, sub-jects were exposed to new sets of configura-tions of the same type, in the absence of feed-back. On the new sets of configurations, thesamples instructed the kind of comparison se-lection that had been reinforced most recently.Another way around the conditionality di-
lemma is to have each sample instruct differ-entially by placing it, too, under stimulus con-trol, that is, under the control of a contextualstimulus (Sidman, 1986). Osborne and Koppel(2001) did this also in a related experimentusing the same task. In this experiment, twoadditional stimuli (CS1 and CS2) were em-ployed as contextual stimuli. On trials in whichCS1 was present, responses to A-C relationswere reinforced, while on trials in the presenceof CS2, responses to A-D relations were rein-forced. The instruction altering functions ofCS1 and CS2 were noted by the differentialselection ofrelations on configurations that thesubject had never seen before in the absenceof reinforcement. CS 1 and CS2 functioned asgeneralized contextual stimuli instructingsamples as to the related comparisons.
Finally, the function ofthe sample was indi-rectly shown by Osborne and Calhoun (1998)in this same task. In most of Osborne andCalhoun's five experiments, two-choice match-ing to sample was employed and the trial typeswere eitherA(BD) orA(CD). To counter specu-lation about the possibility of S-control(Stromer & Osborne, 1982), Osborne andCalhoun (Exp. 2) utilized a third comparisonthat was not related to the sample in any waythat they could see. In this experiment, match-ing-to-sample configurations were composedof a taxonomic relation (eitherA-B or A-C), ataxonomic relation (A-D), and a third selec-tion ostensively not related to the sample (A -/- E). On these trial types the young children ofthat experiment, rarely selected the unrelatedcomparison. This outcome suggests that thethird comparison functionally was in no rela-tion to the sample, that the other comparisonswere, and that the sample instructed compari-son selection that evidenced one of the two
known relations. Therefore, although thepresent experiments contained no conditionsthat prove conditionality, generalization fromsimilar experiments which used similar sub-jects (college students) and similar tasks sup-ports the inference that the task herein is func-tionally a conditional discrimination.
REFERENCES
Baldwin, D. (1992). Clarifying the role ofshapein children's taxonomic assumption. Jour-nal ofExperimental Child Psychology, 54,392-416.
Bauer, P. J., & Mandler, J. M. (1989). Taxono-mies and triads: Conceptual organization inone- to two-year-olds. Cognitive Psychol-ogy, 21, 156-184.
Brunow, J. S., Goodnow, J. J., & Austin, G. A.(1956). A study of thinking. New York:Wiley.
Bush, K. M., Sidman, M., & deRose, T. (1989).Contextual control ofemergent equivalencerelations. Journal of the ExperimentalAnalysis ofBehavior, 51, 29-45.
Carrigan, P., & Sidman, M. (1992). Conditionaldiscrimination and equivalence relations: Atheoretical analysis of control by negativestimuli. Journal ofthe Experimental Analy-sis ofBehavior, 58, 183-204.
Carter, D. E., & Werner, T. J. (1978). Complexlearning and information processing by pi-geons: A critical analysis. Journal of theExperimentalAnalysis ofBehavior, 29, 565-601.
Cumming, W. W., & Berryman, R. (1965). Thecomplex discriminated operant: Studies ofmatching to sample and related problems.In D. J. Mostofsky (Ed.), Stimulus gener-alization (pp. 284-330). Stanford, CA:Stanford University Press.
Denney, N. (1974). Evidence for developmen-tal changes in categorization criteria for chil-dren and adults. Human Development, 17,41-53.
Denney, N., & Ziobrowski, M. (1972). Devel-opmental changes in clustering criteria.Journal ofExperimental Child Psychology,13, 275-282.
Dube, W. V., & Mcllvane, W. J. (1996). Someimplications of a stimulus control topogra-phy analysis for emergent behavior andstimulus classes. In T. R. Zentall & P. M.Smeets (Eds.), Stimulus class formation in

PREDICTING RELATIONAL CONTROL 89
humans and animals (pp. 197-218).Amsterdam: Elsevier.
Dunham, P., & Dunham, F. (1995). Develop-mental antecedents of taxonomic and the-matic strategies at 3 years of age. Develop-mental Psychology, 31, 483-493.
Fenson, L., Cameron, M. S., & Kennedy, M.(1988). Role of perceptual and conceptualsimilarity in category matching at age twoyears. Child Development, 59, 897-907.
Gatch, M. B., & Osborne, J. G. (1989). Trans-fer of contextual stimulus function viaequivalence class development. Journal ofthe Experimental Analysis ofBehavior, 51,369-378.
Gelman, R. (1978). Cognitive development.AnnualReview ofPsychology, 29, 297-332.
Gelman, R., & Greeno, J. G. (1989). On thenature ofcompetence: Principles for under-standing in a domain. In L. B. Resnick (Ed.),Knowing, learning, and instruction: Essaysin honor of Robert Glaser (pp. 125-186).Hillsdale, NJ: Erlbaum.
Herrnstein, R. J., Loveland, D. H., & Cable, C.(1976). Natural concepts in pigeons. Jour-nal of Experimental Psychology: AnimalBehavior Processes, 50, 461-467.
Inhelder, B., & Piaget, J. (1964). The earlygrowth of logic in the child. New York:Norton.
Lowenkron, B. (1998). Some logical functionsofjoint control. Journal of the Experimen-tal Analysis ofBehavior, 69, 327-354.
Markman, E. M. (1991). The whole-object,taxonomic, and mutual exclusivity assump-tions as initial constraints on word mean-ings. In S. A. Gelman & J. P. Byrnes (Eds.),Perspectives on language and thought: In-terrelations in development (pp. 72-106).NY: Cambridge University Press.
Markman, E. M., & Hutchinson, J. E. (1984).Children's sensitivity to constraints on wordmeaning: Taxonomic versus thematic rela-tions. Cognitive Psychology, 16, 1-27.
Mcllvane, W. J., & Dube, W. V. (1992). Stimu-lus control shaping and stimulus controltopographies. The BehaviorAnalyst, 89-94.
Osborne, J. G., & Calhoun, D. 0. (1998).Themes, taxons, and trial types in children'smatching to sample: Methodological con-siderations. Journal ofExperimental ChildPsychology, 68, 35-50.
Osborne, J. G., & Koppel, L. (2001). Acquisi-tion, generalization, and contextual controlof taxonomic and thematic relational re-sponding. The Psychological Record, 51,185-205.
Premack. D. (1983). The codes of man andbeasts. Behavioral and Brain Sciences, 6,125-167.
Ray, B. (1969). Selective attention: the effectsof combining stimuli which control incom-patible behavior. Journal ofthe Experimen-tal Analysis ofBehavior, 12, 539-550.
Sidman, M. (1986). Functional analysis ofemergent verbal classes. In T. Thompson &M. D. Zeiler (Eds.), Advances and integra-tion of behavioral units (pp. 213-245).Hillsdale, NJ: Erlbaum.
Sidman, M. (2000). Equivalence relations andthe reinforcement contingency. Journal ofthe Experimental Analysis ofBehavior, 74,127-146.
Sidman, M., & Tailby, W. (1982). Conditionaldiscrimination vs matching to sample: Anexpansion of the testing paradigm. Journalof the Experimental Analysis of Behavior,37, 5-22.
Smiley, S. S., & Brown, A. L. (1979). Concep-tual preference for thematic or taxonomicrelations: A nonmonotonic age trend frompreschool to old age. Journal ofExperimen-tal Child Psychology, 28, 249-257.
Stromer, R., & Osborne, J. G. (1982). Controlof adolescents' arbitrary matching-to-sample by positive and negative stimulusrelations. Journal of the ExperimentalAnalysis ofBehavior, 37, 329-348.
Vygotsky, L. (1962). Thought and language.Cambridge, MA: MIT Press.
Waxman, S. R., & Namy, L. L. (1997). Chal-lenging the notion of a thematic preferencein young children. Developmental Psychol-ogy, 33, 555-567.


![7 Referências - DBD PUC RIO · [Sidman & Tailby, 1982] SIDMAN, M.; TAILBY, W. Conditional discrimination vs. Matching-to- sample: An expansion of the testing paradigma. Journal of](https://img.dokumen.tips/doc/110x75/5ade0a757f8b9a9a768dbbf0/7-referncias-dbd-puc-sidman-tailby-1982-sidman-m-tailby-w-conditional-discrimination.jpg)


![094-0057-20 [Unlocked by Www.freemypdf.com]](https://img.dokumen.tips/doc/110x75/577c83031a28abe054b32f1f/094-0057-20-unlocked-by-wwwfreemypdfcom.jpg)