Embed Size (px)
Citation preview

Predicting Survey Responses: How and Why SemanticsShape Survey Statistics on Organizational BehaviourJan Ketil Arnulf1*, Kai Rune Larsen2, Øyvind Lund Martinsen1, Chih How Bong3
1 Department of Leadership and Organizational Behaviour, BI Norwegian Business School, Oslo, Norway, 2 Management and Entrepreneurship Division, Leeds School of
Business, University of Colorado at Boulder, Boulder, Colorado, United States of America, 3 Faculty of Computer Science and Information Technology, University of
Malaysia at Sarawak, Sarawak, Malaysia
Abstract
Some disciplines in the social sciences rely heavily on collecting survey responses to detect empirical relationships amongvariables. We explored whether these relationships were a priori predictable from the semantic properties of the surveyitems, using language processing algorithms which are now available as new research methods. Language processingalgorithms were used to calculate the semantic similarity among all items in state-of-the-art surveys from OrganisationalBehaviour research. These surveys covered areas such as transformational leadership, work motivation and work outcomes.This information was used to explain and predict the response patterns from real subjects. Semantic algorithms explained60–86% of the variance in the response patterns and allowed remarkably precise prediction of survey responses fromhumans, except in a personality test. Even the relationships between independent and their purported dependent variableswere accurately predicted. This raises concern about the empirical nature of data collected through some surveys if resultsare already given a priori through the way subjects are being asked. Survey response patterns seem heavily determined bysemantics. Language algorithms may suggest these prior to administering a survey. This study suggests that semanticalgorithms are becoming new tools for the social sciences, opening perspectives on survey responses that prevalentpsychometric theory cannot explain.
Citation: Arnulf JK, Larsen KR, Martinsen ØL, Bong CH (2014) Predicting Survey Responses: How and Why Semantics Shape Survey Statistics on OrganizationalBehaviour. PLoS ONE 9(9): e106361. doi:10.1371/journal.pone.0106361
Editor: Ramin Homayouni, University of Memphis, United States of America
Received March 26, 2014; Accepted August 6, 2014; Published September 3, 2014
Copyright: � 2014 Arnulf et al. This is an open-access article distributed under the terms of the Creative Commons Attribution License, which permitsunrestricted use, distribution, and reproduction in any medium, provided the original author and source are credited.
Data Availability: The authors confirm that all data underlying the findings are fully available without restriction. All data are unrestrictedly available onpersonal contact with the corresponding author: [email protected]. Due to copyright issues affecting parts of the surveys used (the MLQ), we can only share thesemantic values and the survey responses, but not the survey item wordings, which are the property of Mindgarden Inc. However, the items are purchasable fromMindgarden.com, and we used the form ‘‘MLQ 360 Form 5X Short’’. Any interested researchers should be able to use our data freely, but need to take properresponsibility in their use of the MLQ items. We will therefore avoid a publicly accessible repository, but promise to offer interested parties all informationnecessary to reproduce our findings or apply them to other materials. The prerequisite is a clarifying dialogue with the corresponding author.
Funding: The authors thank the United States National Science Foundation for research support under grant NSF 0965338 and the National Institutes of Healththrough Colorado Clinical and Translational Sciences Institute for research support under NIH/CTSI 5 UL1 RR025780. The funders had no role in study design, datacollection and analysis, decision to publish, or preparation of the manuscript.
Competing Interests: The authors have declared that no competing interests exist.
* Email: [email protected]
Introduction
In this study, we explore how survey response patterns may be
predicted using information available prior to conducting a survey.
Such techniques have several interesting consequences for theory
development and testing in the social sciences.
Many social science disciplines acquire data from surveys. The
focus of interest is usually in how different variables relate to each
other, allowing exploration of relationships such as those between
leadership, motivation and work outcomes. To understand how
these variables are related, researchers have hypothesised the
existence of ‘latent variables’ – hidden sources of quantitative
variation stemming from variables such as different types of
leadership and motivation [1].
The Achilles heel of this research is the nature of variation in
survey scores. The most common input to the computational tools
is the inter-item correlation matrix, or the degree to which any two
items in the survey tend to co-vary in a systematic way [2].
Commonly, the non-random patterns in survey responses are
understood to reflect the systematic influence of some psycholog-
ical or social variables on the respondents.
However, a fundamentally different explanation is possible. The
main source of quantitative variation in the surveys may instead be
the degree of semantic overlap among the items. We will attempt
to show empirically how a semantic theory of survey response(STSR) allows an alternative interpretation of survey data from
areas such as leadership, motivation and self-reported work
outcomes, affecting views on theory formation, research methods
and empirical data.
A Theory of Semantic Survey Response
Empirical, psychological, and semantic components ofvariance in survey data
The statistical treatment of survey data in the social sciences has
developed as a discipline often referred to as ‘psychometrics’,
originally developed from research on intelligence [3,4]. Intelli-
gence tests consist of (often non-verbal) tasks to be solved, and
responses are recorded fairly objectively as ratings of error
PLOS ONE | www.plosone.org 1 September 2014 | Volume 9 | Issue 9 | e106361
frequency or response speed, and are therefore not susceptible to
semantically determined responses. Later, Rensis Likert intro-
duced a method familiar to most people today – having
respondents rate a statement on a scale from ‘‘strongly approve’’
to ‘‘strongly disapprove’’ or similar [5]. Seemingly akin to
intelligence tests, this is something altogether different and the
origins and nature of the recorded variance are debatable [6–8].
We cannot know a priori how a respondent will rate a given
item, e.g. ‘‘I like to work here’’. But once the respondent has
chosen a value, the values for the next items may probably be
given to some extent. To take an example: ‘‘Today is Monday’’.
Someone rating this as ‘‘very true’’ is very likely to give the same
rating to ‘‘Tomorrow is Tuesday’’. Most items are not as obviously
linked. But someone affirming that ‘‘I like to work here’’ may with
a similar probability endorse ‘‘I do not want to quit this job’’.
This semantic linkage of items is the core of what we believe to
be a misunderstanding in survey-based research, demonstrable
through semantic research. General psychometric theory asserts
that some semantic overlap is necessary to create intra-scale
consistency, usually measured by the formula called ‘Cronbach’s
alpha’ [1]. But the semantic overlap needs to stop there. If the
semantic overlap continues across scales, it is regarded as a
contamination of the data since one scale will automatically
correlate with another. To prevent this, prevalent psychometric
practices call for statistical procedures called exploratory and
confirmatory factor analysis (CFA). By convention, the proper
conduction of such analyses is taken as proof that relationships
among variables are empirical and not self-evident [9].
As we will show empirically, this assumption does not hold. The
semantic relationships hold across different scales despite their
apparent separation by factor analysis. The resulting inter-item
correlations can be explained by their semantic relationships. This
is unfortunate because it undermines the value of factor analysis in
establishing scale independency and also raises fundamental
questions about the empirical object of such techniques.
Our concerns are not new in research on surveys and
psychometric theory. More than five decades ago, Coombs and
Kao [10] demonstrated that factor analysis in itself will always
produce an extra factor that they called the ‘‘social utility
function’’. This factor determines the data structure simply due
to the meaning of the items, which all respondents would need to
interpret in order to answer the survey. Coombs developed this
function into a psychometric theory called ‘‘unidimensional
unfolding’’. As Coombs predicted, this has been shown to
influence factor analyses [11,12]. More importantly, experiments
have shown that the quantitative properties of surveys are created
by the semantic properties of items and their answering categories
[8]. This may explain how independent research has shown
respondents to provide responses where they in reality hold no
opinion, or even to totally fictitious topics [6,7].
The need of the digital community to store, search, index and
extract large amount of texts has stimulated the development of
techniques that are sufficiently reliable and developed to take on
survey research [13]. The task at hand is theoretically straightfor-
ward: If the overlap of meaning between any two survey items can
be estimated quantitatively, the estimate can be used to explore the
degree to which respondents are actually answering according to
what is semantically expected.
We have chosen two types of text algorithms for this task. One is
called latent semantic analysis (LSA), which has previously been
shown to perform very similarly to human language learning using
large chunks of text as its input. The second type of algorithm is
corpus-based, which means that it uses a lexical database and
knowledge about sentence syntax structure as input. The one we
use here will be referred to as ‘MI’, a term used by its developers
(MI is just a name for the algorithm) [14,15]. Both types of
algorithm explore the semantic similarity of two different texts and
return a measure expressing probable degree of semantic overlap.
The team of authors has access to more advanced and efficacious
techniques, but LSA and MI are used because they have been
previously published, are well understood, allow easy replication,
and remove uniqueness of algorithms as an explanation for our
findings. We will refer to these two techniques together as semanticanalyses and their numerical output as semantic similarity indices.
LSA functions by analysing texts to create a high-dimensional
‘semantic space’ in which all terms have specific locations,
represented as vectors. LSA can then ‘understand’ new texts as
combinations of term vectors in this space. LSA aggregates the
word contexts in which a given word does/does not appear and
provides a set of constraints that determines the similarity of
meanings of words and sets of words. Thus, when two terms occur
in contexts of similar meaning –even in cases where they never
occur in the same passage –the reduced-dimension solution
represents them as similar. Similarity is indicated by the cosines
of the vectors in semantic space, taking on values between 21 and
1. Some practical examples: The two sentences ‘‘doctors operate
on patients’’ and ‘‘physicians do surgery’’ have no words in
common, but a commonly used LSA semantic space called TASA
(Touchstone Applied Science Associates) estimates their overlap in
meaning at .80. Furthermore, sentences with similar words do not
necessarily appear as similar. For example, the LSA cosine for the
two expressions ‘‘the radius of spheres’’ and ‘‘a circle’s diameter’’ is
.55, but the cosine for the sentence pair ‘‘the radius of spheres’’
and ‘‘the music of spheres’’ is only .01 [16].
LSA represents a sparse matrix of documents (columns) vs.
terms-in-those-documents (rows). The matrix is generally set to
downweigh common words. It is sometimes normalized before
using an algorithm –singular value decomposition –similar to
factor analysis. LSA then yields the aforementioned semantic
space. This method now has well-documented text-recognition
applications [17,18]. LSA works across languages. It is viable in
both research and commercial contexts, and it performs almost as
well as humans on complex knowledge-management and integra-
tion tests [19]. The usefulness of this technique has been
documented in determining identities of a wide range of constructs
in the Information Systems discipline [13,20].
Our approach was to let LSA detect accumulated knowledge
and semantic relationships within texts relevant to respondents of
organisational surveys. We defined relevant texts as articles from
three different domains of media: Business-press texts, general
newspaper texts, and PR-related texts.
The business-press texts were excerpts from The Wall StreetJournal, Business Week, Forbes and Fortune. These excerpts
covered a total of 84,836 texts from the years 1998–2007, covering
a total of 45,816,686 words with 169,235 unique words.
The news excerpts were from The New York Times, Los AngelesTimes, Chicago Tribune, The Washington Post, The Boston Globe,
USA Today, Houston Chronicle, San Francisco Chronicle and TheDenver Post. The years covered were again 1998–2007, including
162,929 texts covering 107,239,064 total words with 286,312
unique words.
The PR statements were taken from PR Newswire, covering the
years 2003–2007. This sample included 212,484 texts with
151,450,055 total words and 423,001 unique words.
These materials allowed us to create three distinct ‘semantic
spaces’, i.e. high-dimensional spaces in which all terms have a
specific vector or location, allowing LSA to ‘understand’ the text of
survey items. Every survey item in the study was projected into
How Semantics Shape Predictable Survey Statistics
PLOS ONE | www.plosone.org 2 September 2014 | Volume 9 | Issue 9 | e106361

each semantic space to generate its mathematical representation
(vector). These representations were, in turn, compared to each
other, allowing computation of cosine angles between all the item
vectors, with higher cosines indicating higher similarity between
items. This procedure was repeated for all three semantic spaces.
While LSA ‘extracts’ meaning from the way words are used in
texts, the MI algorithm [21] uses a lexical database called
WordNet [22–24]. Briefly explained, MI derives the meaning of a
text from knowledge already existing in WordNet [15,21]. Similar
to LSA, the MI algorithm produces an index of semantic identity
ranging from 0 to 1. However, MI differs from LSA in that its
values reflect only lexical knowledge encoded by a team of linguists
between 1990 and 2007, for a set of 147,278 unique words; thus,
MI ‘knows’ little about special terms used by professional
communities whereas LSA can target specific semantic spaces
belonging to defined groups of speakers, such as in the business
press or PR Newswire linguistic community.
More detailed descriptions of these algorithms may be found in
the Methods section. Together, LSA and MI may cover multiple
aspects of actual language usage. If these algorithms can
significantly explain the observed correlations of surveys, it implies
that the main source of variance in these surveys is language. This
is problematic because semantics then determine the relationship
between independent and dependent variables, as we will show
below.
‘Leadership’, ‘motivation’ and ‘outcomes’ in semanticsand in theory
Particularly salient examples of our theory are found in research
on constructs such as ‘leadership’, ‘motivation’ and their purported
outcomes. These constructs are prevalent in the research field
known as Organisational Behaviour (OB), where central research
topics are different types of leadership and their relationship to
psychological processes in workplace behaviours. One of the most
well-researched and popular theories of leadership during the
recent decades has been ‘transformational leadership’, belonging
to a set of leadership theories called ‘neo-charismatic leadership’
[25–29]. In a thorough review of these neo-charismatic leadership
theories, Van Knippenberg and Sitkin [30] outline several serious
problems that render these theories inaccessible to empirical
investigation. One such important problem is the conflation of
cause and effect in both definitions and measurement models.
There is no universally accepted definition of ‘leadership’ as a
scientific construct, but most definitions and practical usages
somehow imply the achievement of results. Insofar as organisa-
tional success is a definition of leadership, the construct remains
tautological as both cause (independent variable) and effect
(dependent variable) are semantically given through definitions
and operationalisations.
We will argue that the analysis of Van Knippenberg and Sitkin
is applicable to other theories of leadership as well, at least as long
as surveys are used for measurement.
The concept of ‘motivation’ is a good case in point. An
examination of the semantic network of ‘leadership’ in the lexical
database WordNet shows how leadership is related not only to
outcomes but also to motivation; some popular definitions of
‘leadership’ are precisely acquired through motivating people to
rally around some objective [24], whereas ‘motivation’ is a general
descriptor for incidents or states that elicit acts. Leadership is
thereby more tightly linked to motivation than to outcomes,
whereas motivation is linked equally to outcomes and leadership.
Were one to create a structural equation of these relationships, one
might argue theoretically and semantically that motivation should
mediate the relationship between leadership and outcomes.
There are different ways to assure consistency in scales. Some
scholars have argued that items should sample from a wide, non-
synonymous domain to avoid semantically caused alpha coeffi-
cients [31]. This principle is sometimes adopted in personality
tests. We therefore expect that our semantic theory may not apply
to correlation patterns from a statistically firmly grounded
personality test built on the Five-Factor Model [32].
Our proposal is therefore that the quantitative relationships
among these variables as surveyed are largely determined by their
semantic properties. The psychometric validation of latent
variables usually depends on the following steps of statistical
analysis:
1) Establishing that every scale used is coherent, using
Cronbach’s alpha or similar;
2) Verifying that the scales are semantically independent of each
other, using factor analytic techniques;
3) Establishing a quantitative model of how the variables are
related to each other, usually involving structural equation
models or some kind of statistical ‘mediation’ effect signalling
that the findings are part of a larger nomological network; and
4) Using various statistical procedures to establish fit indices,
used to determine the statistical significance of the whole
model as such, compared to contrasting explanations or
chance.
In the following sections, we will show how all these steps may
be replicable in four large different samples using language
algorithms applied to state-of-the art survey scales on leadership,
motivation, outcomes and personality. We hope thereby to show
that new technologies may be developed to illuminate this field,
and also to substantiate our claim that psychometric assumptions
about the origin of quantitative variation need to be revised.
Ethics statementThe following four sections all contain their own description of
methods. We declare that for all of them, data from human
subjects were collected according to the ethical regulations for
doing research in Norway, where the data were obtained. All
respondents consented to take part voluntarily and were informed
that they could withdraw from the study at any time. This research
is not health related, but only asks participants to anonymously fill
out survey forms with non-sensitive questions. Norway has no
specific ethics committee to oversee this kind of non-clinical
research, but a governmental body called the Norwegian Data
Protection Authority (NDPA) rules whether such projects must be
approved and registered to guarantee the legal and ethical
protection of participants. We asked NDPA about the data
collection (inquiry no. 28024 in 2006). The NDPA ruled that
anonymous participation, i.e. submitting a completed survey
questionnaire, is taken as sign of consent in three of these studies,
as the procedure was seen as harmless, the questions were deemed
not sensitive, and there were no way of tracing either answers or
non-compliance back to individual respondents. In Study 4, the
NDPA stated that an official approval needed to be obtained,
being the only data collection with personally related content (a
personality test). This approval and the subsequent registering and
overseeing of the project was done by the Norwegian Social
Scientific Data Services, which is the organization entrusted by the
authorities to carry out this task. The approval for Study 4 data
collection was given in the year 2006 and most recently renewed l
in 2012 under the project number 27022, ref no. 27022/3/MSS.
Data from this study were collected after written consent, and the
written consent is kept as a variable in the original dataset
How Semantics Shape Predictable Survey Statistics
PLOS ONE | www.plosone.org 3 September 2014 | Volume 9 | Issue 9 | e106361

collected through a survey website. These practices are entirely
compatible with Norwegian law, research ethics and the ethical
principles of the institution where the data were collected. The
procedure is approved by the NDPA which is the designated
regulating body for non-clinical research involving human
respondents.
Methods
LSA algorithm calculationsOnly an overview is given of the four core steps of the LSA
process because of the careful treatment of LSA elsewhere,
including a publication by one of the authors [33].
Step 1. Preparing term-document matrix. LSA starts by
creating a term-document matrix, A, containing a weighted count
of how many times a word, i, appears inside a document, j. The
weighting method employed here, log-entropy, has been found
generally to outperform other LSA weighting schemes [17,34].
Step 2. Creating semantic space. After appropriate prep-
aration (weighting, normalisation, etc.), this matrix is decomposed
using ‘singular value decomposition’, a mathematical algorithm
similar to a factor analysis, with the result being a semantic space
of a given dimension represented as three matrices: U, a term-by-
dimension matrix representing words; S, a singular value matrix;
and V, a document-by-dimension matrix representing documents.
The equation can be written as:
A&USVT
where U and V are orthogonal matrices whereas S is a diagonal
matrix with main diagonal entries sorted in decreasing order. In
practice, A could be approximated with Ak by preserving the first
k singular values and the corresponding first k columns in U and
V. The approximation can be written as:
Ak&UkSkVTk
where Uk is a term-by-k matrix, Sk is a k-by-k matrix and Vk is a
document-by-k matrix. This approximation estimates A with
minimal error and also translates the term-by-document matrix
into a correlated semantic space. Thus, each row vector of UkSk
represents a word in the semantic space and has k columns which
give the vector of the word in the semantic space. Likewise, each
row of VkSk represents a document vector that correlates topics in
the semantic space. By preserving the first k diagonal elements in
S, the low-rank approximation produces the mutual constraints
among words in different documents.
Step 3. Projecting items into the semantic space. Given
the query q, which is a survey item, query vector q is obtained
through an aggregation of word vectors relevant to the item. In
our research, every item is projected into the semantic space as a
query vector,~qq, and that vector is saved as qn for future item-item
analysis, where n is the total number of items.
Step 4. Calculating the similarity of items. To find similar
items to~qq the query vector is then compared against all the items
stored inside the semantic space, ~qqn, using the cosine similarity
measurement, where n is the total number of stored items:
Similar qð Þ~Sincos(~qq,~qqn):
MI algorithm calculationsThe MI sentence similarity measure is computed for two
candidate sentences, S1 and S2, as follows.
Step 1. Identify part-of-speech (POS). The process begins
with tokenisation and POS tagging of all the words in the survey
item with their respective word classes (noun, verb, adverb,
adjective and cardinal, which also plays a very important role in
text understanding).
Step 2. Calculate word similarity. Each word in the
sentence is measured against all the words from the other sentence
to find the highest semantic similarity (maxSim) from six word-
similarity metrics originally created to measure concept likeness
rather than word likeness. The metrics are adapted here to
compute word similarity by computing the shortest distance of
given words’ synsets in the WordNet hierarchy. Word-word
similarity is computed only on words from the same word class,
which are either from noun or verb word classes because WordNet
contains separate semantic trees for nouns and verbs. Thus, it is
not possible to obtain similarity between nouns and verbs using
WordNet distance. For other word classes such as adverb,
adjective, cardinal, and unknown words, whole-word matching
is used instead. The word-word similarity measure is directional. It
begins with each word in S1 being computed against each word in
S2 and then vice versa.
Step 3. Calculating sentence similarity. Once the highest
semantic similarity (maxSim) for each word in the sentences is
computed, it is normalised by applying ‘inverse document
frequency’ (IDF) to the British National Corpus to weight rare
and common terms. The normalised scores are then summed up
for a sentence similarity score, SimMI, as follows:
SimMI (S1,S2)~1
2xS(w[s1)max Sim(w,S2)xIDF (w)
S(w[s1)IDF (w)z
S(w[s2)max Sim(w,S1)xIDF (w)
S(w[s2)IDF (w)
where maxSim(w, S2) is the score of the most similar word in S2 to
w and IDF (w) is the IDF of word w.
The problem of signsNeither LSA nor MI discriminates well between negative or
positive assertions, and MI does not take negative values at all.
The two sentences ‘‘It is raining’’ and ‘‘It is not raining’’ are
indexed as very similar with high positive semantic scores, and
both of them are very different from ‘‘The cat is on the mat’’.
The handling of positive and negative values is of principal
importance in the following analysis, and we need to dedicate
some attention to this issue. The relationship between two series of
numbers depends greatly on the distribution of signs. Appropriate
handling of the direction (sign) of the correlations is crucially
important to estimating the true mutual variance between
semantic similarity indices and observed survey correlations.
In the case of backward-scored items, to prevent biases from
response sets in the respondents, these are easily corrected.
However, one of the surveys we apply here–the Multifactor
Leadership Questionnaire (MLQ, see further explanation below)–
does not contain such scores. Within this survey, 264 (26.7%) of
990 pairs of items are negatively correlated. Theory suggests that
two scales, ‘laissez-faire’ and ‘passive management by exception’,
are likely to relate negatively to effective leadership. Common
sense seems to indicate that pairing items from these scales with
items from other scales would correlate negatively. One typical
example of negative correlation is between a) an item stating that a
How Semantics Shape Predictable Survey Statistics
PLOS ONE | www.plosone.org 4 September 2014 | Volume 9 | Issue 9 | e106361
manager is unapproachable when needed and b) another item
stating that the same person uses appropriate methods of
leadership. The surveyed responses to these items correlated 2
.42 in our sample, but the semantic identity values range between
.38 and .75. There is no a priori reason to assume that these
correlations should be positive. Theory predicts this variance, in
the way one may use one-tailed significance tests if there is no
reason to assume both-way variation. Based on this, we allowed
the signs of semantic identity scores to be negative for all pairs of
items from ‘laissez-faire’ and ‘passive management by exception’
(except from among themselves), using available theoretical
knowledge even before beginning the empirical survey (correctly
identifying 255 of the 264 negative correlations, p,.001).
Study 1
Measures and sampleWe chose the Multifactor Leadership Questionnaire (MLQ) due
to its widespread use and central position in leadership research
over the recent decades [35]. It was administered to 1,649
respondents from geographically dispersed units of a financial
company. For 424 (25%), no demographic characteristics were
available. Among those whose background was known, 51.1%
were males, and the average age was 46 years (SD = 11 years).
Two percent belonged to top management, 26% were middle
managers, and 71% did not hold management positions. All
participants rated their immediate supervisor. The survey was
conducted in Norway, using a Norwegian translation of the MLQ.
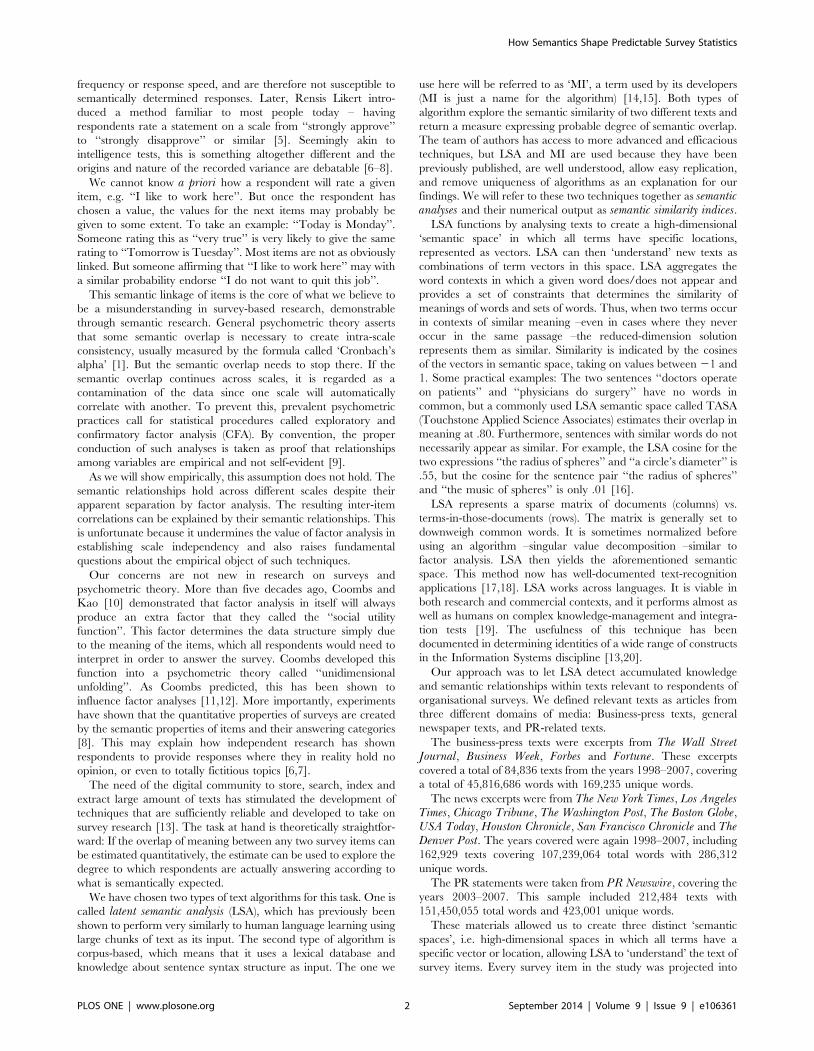
Table 1. Alpha values for the MLQ subscales, by surveyed and semantically obtained data.
Cronbach’s a by source of data
MLQ scale Empirically observed a MI semantic a a from semantically predicted correlations
Idealised influence attributes 0.85 0.82 0.80
Idealized influence behavior 0.87 0.79 0.81
Inspiring motivation 0.61 0.45 0.51
Intellectual stimulation 0.87 0.79 0.79
Individualized consideration 0.88 0.85 0.83
Conditional reward 0.83 0.82 0.81
Mgmnt by exception active 0.72 0.85 0.83
Mgmnt by exception passive 0.60 0.83 0.81
Laissez-Faire 0.83 0.83 0.80
Extra effort 0.89 0.77 0.78
Effective group 0.76 0.84 0.84
All outcomes 0.92 0.90 0.91
doi:10.1371/journal.pone.0106361.t001
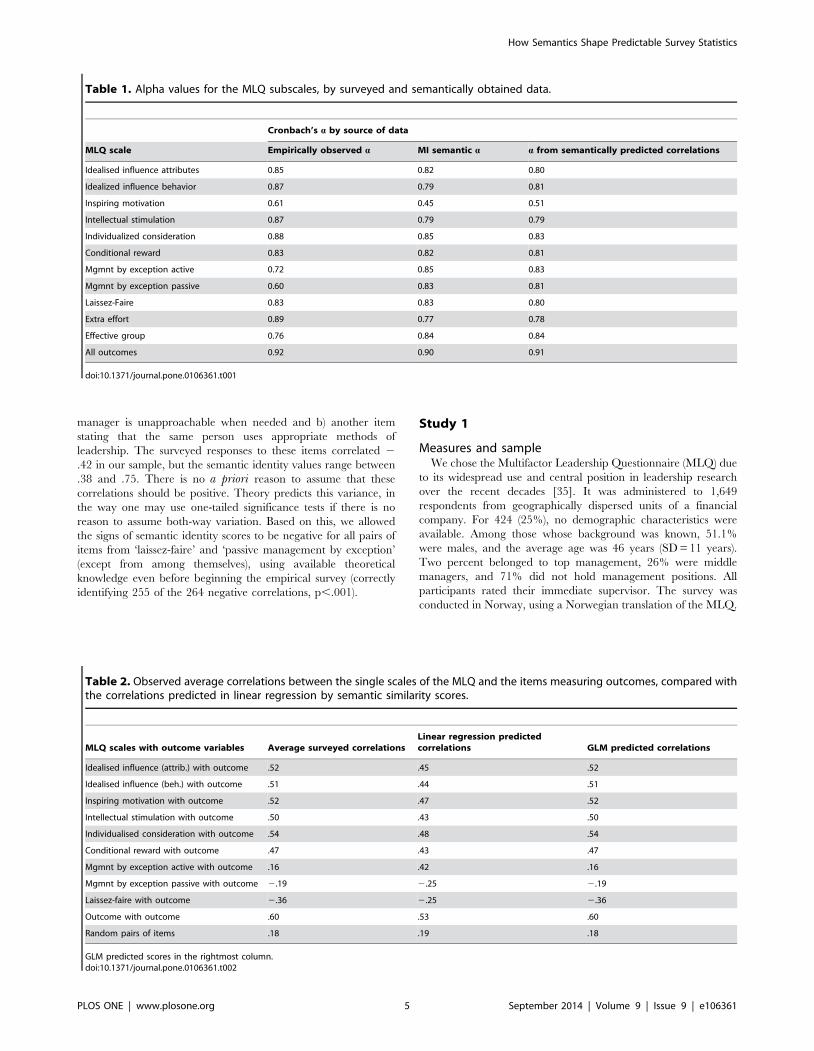
Table 2. Observed average correlations between the single scales of the MLQ and the items measuring outcomes, compared withthe correlations predicted in linear regression by semantic similarity scores.
MLQ scales with outcome variables Average surveyed correlationsLinear regression predictedcorrelations GLM predicted correlations
Idealised influence (attrib.) with outcome .52 .45 .52
Idealised influence (beh.) with outcome .51 .44 .51
Inspiring motivation with outcome .52 .47 .52
Intellectual stimulation with outcome .50 .43 .50
Individualised consideration with outcome .54 .48 .54
Conditional reward with outcome .47 .43 .47
Mgmnt by exception active with outcome .16 .42 .16
Mgmnt by exception passive with outcome 2.19 2.25 2.19
Laissez-faire with outcome 2.36 2.25 2.36
Outcome with outcome .60 .53 .60
Random pairs of items .18 .19 .18
GLM predicted scores in the rightmost column.doi:10.1371/journal.pone.0106361.t002
How Semantics Shape Predictable Survey Statistics
PLOS ONE | www.plosone.org 5 September 2014 | Volume 9 | Issue 9 | e106361

ResultsTable 1 shows the alpha values of the MLQ as computed from
the surveyed data and semantic similarity indices. The first column
shows alphas obtained using survey responses. The middle column
displays alphas computed from the MI values alone, which shows
the internal consistency of the purely semantic representations of
item pairs. The rightmost column show alphas computed from
predicted correlations, i.e. the item-pair correlations saved as
predictions when regressing semantic scores on the observed
scores. These alphas would be those obtained if we use correlations
predicted by semantic algorithms. Of 12 comparisons, in only one
case did the semantically predicted alphas fall into a different
tolerance range from those empirically observed. Despite the low
number of items in each scale (3 to 5), all but one of the
semantically predicted alphas fell into the acceptable or good
ranges [31], and the survey-score alpha for the exception was also
insufficient. The magnitudes of the survey-obtained alphas
correlated .56 with the semantically predicted alphas (one-tailed
p,.05, N = 12).
We regressed the semantic similarity indices on the empirically
observed correlations among the MLQ items, which yielded an R2
of .79, p,.01. Finally, we computed a General Linear Model
(GLM) with: a) MLQ correlations as dependent; b) semantic
indices as covariates; and c) knowledge about scale belongingness
as a fixed variable (making complete use of the knowledge that is
accessible prior to running a survey). This model yielded an R2 of
.86, p,.01. For both regression models, we saved the predicted
values and residuals. Table 2 compares the actually observed
mean correlations with those predicted in the two regression
models. The table shows that linear regression predicts the
Table 3. Relationships between leadership behaviours, motivation and outcomes as rated by the MLQ.
Main constructrelationships Scale relationship
Average observedcorrelations
Average correlationspredicted from linearregression
GLM predictedcorrelations
Leadership to motives: Transformat. leadersh.REconomic exchg. 2.10 2.07 2.10
Transformat. leadersh.RIntrinsic motiv. .18 .15 .18
Transformat. leadersh.RSocial exchg. .15 .11 .15
Transactional leadersh.REconomic exchg. .01 .01 .01
Transactional leadersh.RIntrinsic motiv. .03 .08 .03
Transactional leadersh.RSocial exchg. .05 .06 .05
Laissez-faireREconomic exchg. .11 .17 .11
Laissez-faireRIntrinsic motiv. 2.11 2.07 2.11
Laissez-faireRSocial exchg. 2.07 2.03 2.07
Motives to outcomes: Intrinsic motiv.ROCB .20 .24 .20
Intrinsic motiv.RTurnover int. 2.22 2.16 2.22
Intrinsic motiv.RWork effort .26 .24 .26
Intrinsic motiv.RWork quality .21 .22 .21
Social exchg.ROCB .12 .18 .12
Social exchg.RTurnover intent. 2.14 2.08 2.14
Social exchg.RWork effort .13 .15 .13
Social exchg.RWork quality .05 .16 .05
Economic exchg.ROCB 2.15 2.19 2.15
Economic exchg.RTurnover int. .13 .23 .13
Economic exchg.RWork effort 2.17 2.15 2.17
Economic exchg.RWork quality 2.09 2.14 2.09
Leadership to outcomes: Transformat. leadersh.ROCB .10 .16 .10
Transformat. leadersh.RTurnover int. 2.16 2.07 2.16
Transformat. leadersh.RWork effort .09 .15 .09
Transformat. leadersh.RWork quality .07 .16 .07
Transactional leadersh.RTurnover int. .05 .08 .05
Transactional leadersh.RTurnover int. 2.07 .02 2.07
Transactional leadersh.RWork effort .06 .08 .06
Transactional leadersh.RWork quality .07 .08 .07
Laissez-faireROCB 2.01 2.09 2.01
Laissez-faireRTurnover int. .11 .16 .11
Laissez-faireRWork effort 2.03 2.09 2.03
Laissez-faireRWork quality .01 2.08 .01
Observed correlations and values obtained through semantic analysis.doi:10.1371/journal.pone.0106361.t003
How Semantics Shape Predictable Survey Statistics
PLOS ONE | www.plosone.org 6 September 2014 | Volume 9 | Issue 9 | e106361

observed values remarkably well, with the exception of ‘Mgmnt by
exception active’. The predicted values from the GLM were
precisely identical to the observed correlations (in this case, N
equals the number of item pairs, in this case 990 unique item
pairs).
CFA of all 10 MLQ subscales in the present sample yielded a
comparative fit index (CFI) of .93, a root mean square error of
approximation (RMSEA) of .05, and a standardized root mean
square residual (SRMR) of .07. The error terms were not
correlated, and these figures are usually interpreted as indicative
of an acceptable model [36].
Study 2
Measures and sampleAgain, the first 36 items describing leadership behaviours from
the MLQ [35] were administered along with seven items
measuring economic-exchange perceptions, eight items measuring
social-exchange perceptions [37], and six items measuring intrinsic
motivation [38]. The outcome variables were the additional nine
outcome measures from the MLQ, seven items measuring
organisational citizenship behaviour (OCB) [39], five items
measuring turnover intention (TI) [40], and self-rated work
quality and work effort, each measured by five items [38].
The sample consisted of 255 employees at a governmental
research agency, mostly scientists and engineers. Of these, 66.7%
were male, and the mean age was 38 years. One quarter rated
themselves as managers, and the rest termed themselves as
‘‘project team members’’.
ResultsUsing observed correlations, the alphas ranged from .53–.96,
mean = .85. For the semantic alphas, these numbers were .58–.97,
mean = .86, and for the predicted correlations, .35–.91,
mean = .72. These latter values correlated (.91 and .92) with the
alphas obtained empirically (p,.01).
We regressed the semantic similarity indices on the observed set
of inter-item correlations, obtaining an adjusted R2 of .53 (p,.01).
A second analysis applied a GLM model with information about
scale belongingness, bringing the adjusted R2 to .68 (p,.01).
Saving the predicted values and residuals from the regression
equations, Table 3 lists all relationships from leadership to
motivation, from motivation to outcomes, and from leadership
behaviours to outcomes. As in the previous study, linear regression
alone predicted the relationships among the scales in the survey
(rho = .90, p,.01), and when using the GLM approach, the
predicted values again become identical to the observed correla-
tions from human survey respondents.
To explore how semantic values can explain claims of
‘mediation’ among survey variables, we ran hierarchical regression
analyses with the organisational-outcome variables as dependent
variables: Transformational leadership as independent in Step 1,
and intrinsic motivation as independent in Step 2. Satisfying
criteria for mediation, transformational leadership significantly
predicted work effort, work quality, OCB, and TI in the first step
(p,.01), but these relationships were rendered insignificant when
intrinsic motivation was added in the analysis. Table 4 shows the
aggregated-level correlations among the variables and lists the
results of the mediation analysis. We mapped this situation using
only semantic information in Figure 1. As can be seen, the
semantic values fit the pattern compatible with mediation.
This dataset contains 16 individual scales. Ideally, a CFA should
identify all of them with good fit. That did not happen, as a CFA
for 16 factors returned a CFI of .82, a RMSEA of .05 and an
SRMR of .07. If one allows the MLQ to be left out, the indices
improve to a marginal fit (CFI = .89, RMSEA = .06, SRMR = .06),
indicating some cross-loadings among items [36].
Study 3
Measures and sampleThis study compared semantic indices with responses to a broad
range of leadership and motivation scales. Transformational
leadership was measured with the 20 items from the MLQ [35];
leader-member social exchange was used to measure leader-
member-exchange (LMX) [41]; and the Ohio State Leadership 2-
factor theory was assessed by a subsample of 10 items measuring
initiation of structure and 10 items measuring consideration from
the Leadership Behavior Development Questionnaire (LBDQ)
[42].
We used eight items of affective organisational commitment
published by Meyer, Allen, and Smith [43] and three items
measuring job satisfaction published by Cammann, Fichman,
Jenkins, and Klesh [44]. The outcome variables were TI [40], self-
rated work quality and work effort, each measured by five items
[38]. These scales were administered as a Norwegian-language
web-based survey of 981 civilian and military employees in the
Royal Norwegian Armed Forces. No demographics were available
in the latter sample, but they reflect a random selection of military
professionals, with a majority of males and a mean age somewhere
in the 30s. Most respondents are likely to be military officers and
thus to have had personal leadership training and experience.
ResultsAlphas from observed correlations ranged from .86–1.00,
mean = .94. For semantic alphas, these numbers were .84–.99,
Table 4. Correlations between transformational leadership, intrinsic motivation and outcome variables, with tests of mediatingrelationships from hierarchical regression.
Variables Transf. Leadership Intrinsic motivation Mediated by intrinsic motivation:
Intrinsic motiv. .32**
Work effort .17** .42** Fully
Work quality .13* .33** Fully
Org. Citizen. Behav. .19** .33** Fully
Turnover Intention 2.30** 2.35** Partly
**Correlation is significant at the .01 level (2-tailed).*Correlation is significant at the .05 level (2-tailed).doi:10.1371/journal.pone.0106361.t004
How Semantics Shape Predictable Survey Statistics
PLOS ONE | www.plosone.org 7 September 2014 | Volume 9 | Issue 9 | e106361

mean = .94 and for the predicted correlations .71–.99, mean = .89.
These latter values correlated (.88 and .72) with the alphas
obtained through the survey (p,.01).
Regressing the semantic similarity indices on the observed
correlations, we obtained an adjusted R2 of.47 (p,.01). When
scale belongingness was entered as a fixed factor in GLM, the
adjusted R2 was .87 (p,.01). The predicted values and residuals
were saved and are displayed in Table 5, showing the mean
correlations among leadership variables, motivational states and
outcome variables, along with the predicted values from the two
types of regression equations. Again, the predicted values from
GLM were identical to the observed correlations.
The data from a CFA of this full dataset displayed the following
values: CFI was .85, the RMSEA was .06 and the SRMR was .06.
The considerable cross-loadings were expected due to the
conceptual overlap of many of the scales and individual items
included in this study.
Study 4
Measures and sampleWe used an officially translated, Norwegian version of a
commonly used five-factor model inventory called the NEO-FFI
(the name NEO stems from the three first factors, ‘neuroticism’,
‘extraversion’ and ‘openness’) [32,45]. The FFI-version of the
NEO is a short form, which we administered using a web-based
survey form to 5,332 students from a leading business school in
Norway. The mean age was 25 years, and 44.7% were male. This
version has 60 items, yielding a total of 1,770 unique pairs of item
correlations.
ResultsThe alphas of the NEO-FFI ranged from .94 to .96, which are
considered excellent [31]. Alphas computed by semantic values
(MI) ranged .37–.88 with a mean of .64, which we considered
questionable. The semantically obtained alphas for ‘extraversion’
and ‘neuroticism’ were not bad (.88), but the three others were
much lower and not satisfactory.
Regressing the semantic similarity indices on the empirically
obtained correlation values as the dependent variable, we found an
R2 of only .004 (p,.05). The model as such reached only marginal
significance. The saved and predicted values from the regression
did not produce any recognisable patterns, see Table 6.
The scree plot from an exploratory factor analysis of the survey
data indicated the usual five factors very clearly in the sample
responses (see Figure 2). A CFA expecting five factors in this
Figure 1. Direct and ‘‘mediated’’ semantic relationships between transformational leadership, intrinsic motivation andorganizational outcomes (direct semantic relationships from transformational leadership to outcomes in brackets).doi:10.1371/journal.pone.0106361.g001
How Semantics Shape Predictable Survey Statistics
PLOS ONE | www.plosone.org 8 September 2014 | Volume 9 | Issue 9 | e106361

Table 5. Relationships among three theoretical leadership models, motivation and outcomes, using empirically surveyedcorrelations and correlations predicted by semantic values.
Main constructrelationships Scale pairs
Mean observedcorrelations
Predicted correlationsin lin. regression
Correlations predicted inGLM
Leadership to Leadersh. Consideration R Consideration .55 .29 .55
Consideration R Initiate struct. .23 .32 .23
Consideration R LMX .47 .28 .47
Consideration R Transform. lead. .47 .29 .47
Initiate struct. R Initiate struct. .33 .34 .33
Initiate struct. R LMX .27 .29 .27
Initiate struct.RTransform. lead. .34 .31 .34
LMXRLMX .63 .37 .63
LMX R Transform. lead. .47 .27 .47
Transform. lead. RTransform. lead. .56 .29 .56
Mean absolute values .43 .31 .43
Leadership to Motives Consideration R Affective comm. .21 .34 .21
Initiate struct. R Affective comm. .13 .35 .13
LMX- . Affective comm. .20 .31 .20
Transform. lead. R Affective comm. .22 .30 .22
Consideration R Job sat. .36 .31 .36
Initiate struct. R Job sat. .19 .34 .19
LMX R Job sat. .33 .32 .33
Transform. lead. R Job sat. .32 .30 .32
Mean absolute values .24 .32 .24
Leadership to Outcomes Consideration R Turnover int. 2.26 2.17 2.26
Consideration R Work effort .16 .31 .16
Consideration R Work quality .11 .32 .11
Initiate struct. R Turnover int. 2.13 2.20 2.13
Initiate struct. R Work effort .12 .35 .12
Initiate struct.R Work quality .10 .34 .10
LMX R Turnover int. 2.24 2.17 2.24
LMX R Work effort .15 .32 .15
LMX R Work quality .14 .31 .14
Transform. lead. R Turnover int. 2.23 2.16 2.23
Transform. lead. R Work effort .17 .30 .17
Transform. lead.R Work quality .14 .32 .14
Mean absolute values .16 .27 .16
Motive to Motive Affective comm. R Affective comm. .43 .40 .43
Affective comm. R Job sat. .40 .34 .40
Job sat. R Job sat. .68 .45 .68
Mean absolute values .50 .40 .50
Motive to Outcome Affective comm. R Turnover int. 2.37 2.20 2.37
Affective comm. R Work effort .22 .33 .22
Affective comm. R Work quality .14 .34 .14
Job sat. R Turnover int. 2.49 2.22 2.49
Job sat. R Work effort .31 .38 .31
Job sat. R Work quality .17 .36 .17
Mean absolute values .28 .31 .28
Outcome to Outcome Turnover int. R Turnover int. .62 .38 .62
Turnover int. R Work effort 2.15 2.22 2.15
Turnover int. R Work quality 2.08 2.22 2.08
Work effort R Work effort .54 .42 .54
How Semantics Shape Predictable Survey Statistics
PLOS ONE | www.plosone.org 9 September 2014 | Volume 9 | Issue 9 | e106361

dataset showed a poor CFI (.85) but good RMSEA (.04) and
SRMR (.03). The theoretically assumed five factors were obviously
present in the data, but not well detected by either semantics or
factor analysis.
Discussion and Implications
Applying the text algorithms LSA and MI to a wide range of
survey scales commonly used in management research, we were
able to significantly explain the major part of variation in surveys.
The correlations we predicted in multiple regression were similar
to those created by human respondents. Allowing the algorithms
to ‘know’ the context in GLM, we actually obtained correlations
identical to those of human subjects. We were able to show that
semantic relations not only predict the intra-scale coherence
measured by Cronbach’s alpha, but also the observed correlation
relationships and proposed ‘mediating’ relationships among the
variables. The factor-analytical fit indices were generally better the
more semantics seemed to determine the correlation matrix. In
this sense, CFA did not detect or prevent the pervasive influence of
semantic commonalities. In fact, our results indicate that
constructing a survey on mere semantic relationships among the
items is an easy way to obtain good fit indices in CFA.
The personality test results in our study were not significantly
explained by semantics. We expected this, since personality test
scores are constructed to vary more freely, but still reflect the
underlying construct and allow differentiated descriptions of
people. This also shows that the long-proposed ‘‘lexical hypoth-
esis’’ [46] in personality research has no immediate relevance to a
STSR. While it is highly unlikely that our results were due to
chance, one should bear in mind that the text analysis algorithms
are steadily developing. Future algorithms are likely to make more
advanced use of available information, creating even better and
more differentiated estimates than ours. As explained earlier, the
simplicity and well-documented functioning of the selected
semantic algorithms strengthens the findings of this research.
Psychometric principles for construct validation seem, at least in
their present form, as frequently applied in organisational
psychology, to need revision to incorporate our findings. The
semantic properties seem to pervade survey responses throughout
many parts of the data analysis from the alpha coefficients to the
CFA. This represents a fundamental problem to the understand-
ing of psychometric principles in scientific research. Our study
shows that the relationship between independent and dependent
variables may be semantically determined a priori to conducting
the survey since it follows from the wording of the items. This is in
accordance with the previous theoretical analysis of van Knippen-
berg and Sitkin [30]. A more troubling finding is that this
confounding of variables was not restricted to leadership, but
appeared in other OB measures as well, such as motivation, job
satisfaction, and work outcomes. It also affected the relationships
between surveys from different leadership theories, casting doubt
on the claims that some of these matter more than others [47], as
they are simply different ways of stating the same propositions.
Table 5. Cont.
Main constructrelationships Scale pairs
Mean observedcorrelations
Predicted correlationsin lin. regression
Correlations predicted inGLM
Work effort R Work quality .35 .36 .35
Work quality R Work quality .48 .41 .48
Mean absolute values .37 .33 .37
doi:10.1371/journal.pone.0106361.t005
Table 6. Scale relationships in the five factors of the NEO-FFI, observed survey correlations and semantically predicted values.
Scale Observed correlations Correlations predicted in linear regression
ARA .18 .05
CRA .05 .04
CRC .28 .05
ERA .04 .04
ERC .09 .05
ERE .23 .05
NRA 2.02 .04
NRC 2.10 .05
NRE 2.10 .05
NRN .21 .05
ORA .02 .05
ORC .03 .05
ORE .05 .05
ORN .00 .04
ORO .20 .05
doi:10.1371/journal.pone.0106361.t006
How Semantics Shape Predictable Survey Statistics
PLOS ONE | www.plosone.org 10 September 2014 | Volume 9 | Issue 9 | e106361

At present, it is difficult to assess the pervasiveness of the
problems we have detected here. In our study, all the commonly
used measures from the field of OB were substantially affected by
semantics, whereas the personality test showed very little influence.
It is possible that some social scientific concepts are more abstract
than others, thus being rendered more vulnerable to mere
semantic relationships. It has been known for some years that
common method variance usually leads to more inflated statistics
in this field than in other fields [9,48–50]. The phenomenon we
have detected here may be less problematic in other disciplines.
The core of the problem seems to be an uncritical assumption that
statistical methods separating signal from noise in survey responses
are sufficient to ascertain the objective existence of a construct, a
practice that has been criticised on theoretical grounds [51–54]. It
may be that survey responses collecting less abstract responses,
grounded on observations of behaviour instead of cognition
[55,56], are less prone to semantic calculations of the kind
demonstrated here.
But ultimately, the only way of ruling out semantic influences as
a major source of co-variation in survey data is to identify this
influence in advance. Relationships among surveyed variables are
commonly tested with 0-hypothesis statistics, implying the
expectations that survey items are randomly related. Our findings
instead suggest that all items are likely to be related though
semantic commonalities. Perhaps replacing the 0-hypothesis with
the semantic hypothesis is a more solid way of separating the
empirical information from a merely semantic relationship in
surveys.
Our findings have the following major implications:
1) Technologies for digital text analysis have advanced to a point
of offering important and interesting usages to the social
sciences. Text algorithms and similar procedures play an
important role in indexing, storing and developing knowledge
in the social sciences. Such knowledge is already in use for
industrial purposes and we are taking it some steps further
into the field of psychological research, such as OB. We
believe this is now emerging as a promising field with many
possible applications in our increasingly digitalised scientific
society.
2) The fact that surveys seem predictable before the questioning
of real subjects seems bewildering to many. And yet, our data
show beyond reasonable doubt that this is possible. This opens
up opportunities for experimental research on people’s ability
to understand logical propositions and our capacity to differ
between logical and empirical statements. As shown in
research on cognition, advanced forms of thinking in humans
is an energy-consuming and partially unpleasant activity [57].
The semantic network of language may function as a guide for
thinking that creates uniform effects on most speakers, but
with little meta-cognition in the speakers themselves.
3) Cross-cultural research using surveys needs to be re-examined
in view of the present findings. Our findings were obtained
using semantic similarity indices computed in American
English, regressed on scores obtained from surveys in
Norwegian. As long as the results are explained by semantics,
Figure 2. Scree plot of the NEO-FFI.doi:10.1371/journal.pone.0106361.g002
How Semantics Shape Predictable Survey Statistics
PLOS ONE | www.plosone.org 11 September 2014 | Volume 9 | Issue 9 | e106361

all we can know about survey results being similar across
cultures was that the survey was correctly translated. This
pertains directly to the relationship among logical and
empirical propositions: While the same propositions may be
stated in different languages, their empirical implications in
terms of behaviour dynamics may not be the same.
Acknowledgments
We are grateful to Julia I. Lane and Randy Ross for their support and for
the feedback from Russel S. Cropanzano, Maw Der Foo, Kishen Iyengar
and Tom Hilton. We are grateful to Thore Egeland and faculty at the
Norwegian Business School for invitations to present earlier versions of this
work and for the feedback that followed, especially from Tor J. Larsen and
Svein Andersen.
Author Contributions
Conceived and designed the experiments: JKA KRL. Performed the
experiments: JKA KRL ØLM CHB. Analyzed the data: JKA KRL CHB.
Contributed reagents/materials/analysis tools: JKA ØLM CHB. Contrib-
uted to the writing of the manuscript: JKA KRL ØLM.
References
1. Nunnally JC, Bernstein IH (2010) Psychometric theory. New York, NY:
McGraw-Hill.
2. Joreskog KG (1993) Testing structural equation models. In: Bollen KA, Long JS,
editors. Testing structural equation models. Newbury Park: Sage. pp. 294–316.
3. Thurstone LL (1947) Multiple Factor Analysis. Chicago: University of Chicago
Press.
4. Spearman C (1904) General intelligence, objectively determined and measured.American Journal of Psychology 15: 201–293.
5. Likert R (1932) A technique for the measurement of attitudes. Archives ofpsychology 140: 1–55.
6. Feldman JM, Lynch JGJ (1988) Self-generated validity and other effects ofmeasurement on belief, attitude, intention, and behavior. Journal of Applied
Psychology 73: 421–435.
7. Schwarz N (1999) Self-reports: How the questions shape the answers. AmericanPsychologist 54: 93–105.
8. Michell J (1994) Measuring dimensions of belief by unidimensional unfolding.Journal of mathematical psychology 38: 244–273.
9. MacKenzie SB, Podsakoff PM, Podsakoff NP (2011) Construct measurementand validation procedures in MIS and behavioral research: integrating new and
existing techniques. Mis Quarterly 35: 293–334.
10. Coombs CH, Kao RC (1960) On a connection between factor analysis andmultidimensional unfolding. Psychometrika 25: 219–231.
11. Coombs CH (1964) A theory of data. New York: Wiley.
12. van Schuur WH, Kiers HAL (1994) Why factor analysis often is the incorrect
model for analyzing bipolar concepts, and what models to use instead. Appliedpsychological measurement 18: 97–110.
13. Larsen KR, Nevo D, Rich E (2008) Exploring the Semantic Validity ofQuestionnaire Scales; 2008; Waikoloa, Hawaii. pp. 1–10.
14. Mihalcea R, Corley C, Strapparava C (2006) Corpus-based and knowledge-
based measures of text semantic similarity. AAAI 6: 775–780.
15. Mohler M, Mihalcea R (2009) Text-to-text Semantic Similarity for Automatic
Short Answer Grading; 2009; Athens, Greece. Association for ComputationalLinguistics. pp. 567–575.
16. Dennis S, Landauer T, Kintsch W, Quesada J (2003) Introduction to latentsemantic analysis. 25th Annual Meeting of the Cognitive Science Society.
Boston, Mass.
17. Nakov P, Popova A, Mateev P (2001) Weight functions impact on LSAperformance; 2001; Tzigov Chark, Bulgaria. pp. 187–193.
18. Dumais ST, Furnas GW, Landauer TK, Deerwester S, Harshman R. (1988)Using Latent Semantic Analysis to Improve Access to Textual Information;
1988; Washington, D.C. ACM. pp. 281–285.
19. Landauer TK, Foltz PW, Laham D (1998) An introduction to latent semantic
analysis. Discourse Processes 25: 259–284.
20. Larsen KR, Bong CH (2013) Construct identity detection. Leeds SchoolWorking Paper Series. Boulder, CO: University of Colorado, Boulder. pp. 1–70.
21. Mihalcea R, Corley C, Strapparava C (2006) Corpus-based and knowledge-based measures of text semantic similarity; 2006. AAAI Press. pp. 775–780.
22. Miller G (1995) WordNet: a lexical database for English. Communications of theACM 38: 39–41.
23. Leacock C, Miller GA, Chodorow M (1998) Using corpus statistics and
WordNet relations for sense identification. Computational Linguistics 24: 147–165.
24. Poli R, Healy M, Kameas A (2010) WordNet. In: Fellbaum C, editor. Theoryand applications of ontology: Computer applications. New York: Springer. pp.
231–243.
25. Bass BM, Avolio BJ, editors (1994) Improving organizational effectiveness
through transformational leadership. Thousand Oaks, CA: Sage.
26. Dumdum UR, Lowe KB, Avolio BC (2002) A meta analysis of thetransformational and transactional leadership correlates of effectiveness and
satisfaction: an update and extension. In: Avolio BJ, Yammarino FJ, editors.Transformational and charismatic leadership: the road ahead. Amsterdam: JAI
Press. pp. 35–66.
27. Judge TA, Piccolo RF (2004) Transformational and transactional leadership: A
meta-analytic test of their relative validity. Journal of applied psychology 89:
755–768.
28. House RJ, Aditya RN (1997) The Social Scientific Study of Leadership: QuoVadis? Journal of Management 23: 409–473.
29. Wang G, Oh I-S, Courtright SH, Colbert AE (2011) TransformationalLeadership and Performance Across Criteria and Levels: A Meta-Analytic
Review of 25 Years of Research. Group & Organization Management 36: 223–270.
30. Van Knippenberg D, Sitkin SB (2013) A critical assessment of charismatic-transformational leadership research: Back to the drawing board? The Academy
of Management Annals 7: 1–60.
31. Kline P (2000) Handbook of psychological testing. London: Routledge.
32. Costa PT, McCrae RR (1992) Revised NEO personality Inventory: Professionalmanual. Odessa, Fl: Psychological Assessment Resources.
33. Larsen KR, Monarchi DE (2004) A mathematical approach to categorizationand labeling of qualitative data: The latent categorization method. Sociological
Methodology 34: 349–392.
34. Dumais ST (1991) Improving the retrieval of information from external sources.
Behavior Research Methods, Instruments, & Computers 23: 229–236.
35. Avolio BJ, Bass BM, Jung DI (1995) Multifactor Leadership Questionnaire
technical report. Redwood City, CA.: Mind Garden.
36. Hu L, Bentler PM (1999) Cutoff criteria for fit indexes in covariance structure
analysis: Conventional criteria versus new alternatives. Structural EquationModeling 6: 1–55.
37. Shore LM, Tetrick LE, Lynch P, Barksdale K (2006) Social and economicexchange: Construct development and validation. Journal of Applied Social
Psychology 36: 837–867.
38. Kuvaas B (2006) Work performance, affective commitment, and work
motivation: The roles of pay administration and pay level. Journal ofOrganizational Behavior 27: 365–385.
39. Van Dyne L, LePine JA (1998) Helping and voice extra-role behaviors: Evidenceof construct and predictive validity. Academy of Management Journal 41: 108–
119.
40. Kuvaas B (2006) Performance appraisal satisfaction and employee outcomes:
Mediating and moderating roles of motivation. The International Journal ofHuman Resource Management 17: 504–522.
41. Bernerth JB, Armenakis AA, Feild HS, Giles WF, Walker HJ (2007) Leader–member social exchange (LMSX): development and validation of a scale.
Journal of Organizational Behavior 28: 979–1003.
42. Stogdill RM (1963) Manual for the Leader Behavior Description Questionnaire,
form XII. Columbus, OH: Bureau of Business Research, Ohio State University.
43. Meyer JP, Allen NJ, Smith CA (1993) Commitment to organizations and
occupations: Extension and test of a three-component conceptualization. Journalof Applied Psychology 78: 538–551.
44. Cammann C, Fichman M, Jenkins D, Klesh J (1979) The Michiganorganizational assessment questionnaire. University of Michigan: University of
Michigan.
45. Martinsen ØL, Nordvik H, Østbø L (2003) Norske versjoner av NEO PI - R og
NEO FFI (Norwegian versions of the NEO PI-R and NEO FFI). Oslo:
Gyldendal Akademisk forlag.
46. Digman JM (1990) Personality structure: Emergence of the five-factor model.Annual Review of Psychology 41: 417–440.
47. Piccolo RF, Bono JE, Heinitz K, Rowold J, Duehr E, et al. (2012) The relativeimpact of complementary leader behaviors: Which matter most? The leadership
Quarterly 23: 567–581.
48. Podsakoff PM, MacKenzie SB, Podsakoff NP (2012) Sources of method bias in
social science research and recommendations on how to control it. In: Fiske ST,
Schacter DL, Taylor SE, editors. Annual Review of Psychology, Vol 63. PaloAlto: Annual Reviews. pp. 539–569.
49. Podsakoff PM, Organ DW (1986) Self-reports in organizational research -problems and prospects. Journal of management 12: 531–544.
50. Bagozzi RP (2011) Measurement and meaning in information systems and
organizational research: Methodological and philosophical foundations. Mis
Quarterly 35: 261–292.
51. Michell J (2013) Constructs, inferences, and mental measurement. New Ideas in
Psychology 31: 13–21.
52. Slaney KL, Racine TP (2013) Constructing an understanding of constructs. New
Ideas in Psychology 31: 1–3.
How Semantics Shape Predictable Survey Statistics
PLOS ONE | www.plosone.org 12 September 2014 | Volume 9 | Issue 9 | e106361

53. Smedslund J (1988) What is measured by a psychological measure. Scandinavian
Journal of Psychology 29: 148–151.54. Smedslund J (1994) Nonempirical and empirical components in the hypotheses
of 5 social-psychological experiments. Scandinavian Journal of Psychology 35:
1–15.55. Prinz W, Aschersleben G, Koch I (2009) Cognition and Action. In: Morsella E,
Bargh JA, Gollwitzer PM, editors. Oxford Handbook of Human Action. Boston:Oxford University Press, Inc.
56. Parks-Stamm EJ, Oettingen G, Gollwitzer PM (2010) Making sense of one’s
actions in an explanatory vacuum: The interpretation of nonconscious goal
striving. Journal of Experimental Social Psychology 46: 531–542.
57. Kahneman D (2011) Thinking, fast and slow. New York: Farrar, Straus and
Giroux.
How Semantics Shape Predictable Survey Statistics
PLOS ONE | www.plosone.org 13 September 2014 | Volume 9 | Issue 9 | e106361


![Untitled-1 [mason.gmu.edu]mason.gmu.edu/~sdeleeuw/portfolio/images/notre-dame-transcript.pdfa black and white transcript is not official transcript guide printed on reverse date issued:](https://img.dokumen.tips/doc/110x75/602c82eabbb54e0b9e715812/untitled-1-masongmuedumasongmuedusdeleeuwportfolioimagesnotre-dame-a.jpg)