Embed Size (px)
Citation preview
Predicting Responses of Arctic Plants to Warming
with Species Distribution MapsJenny Liebig, Jeremy May & Bob Hollister
GVSU Student Scholars Day 2010
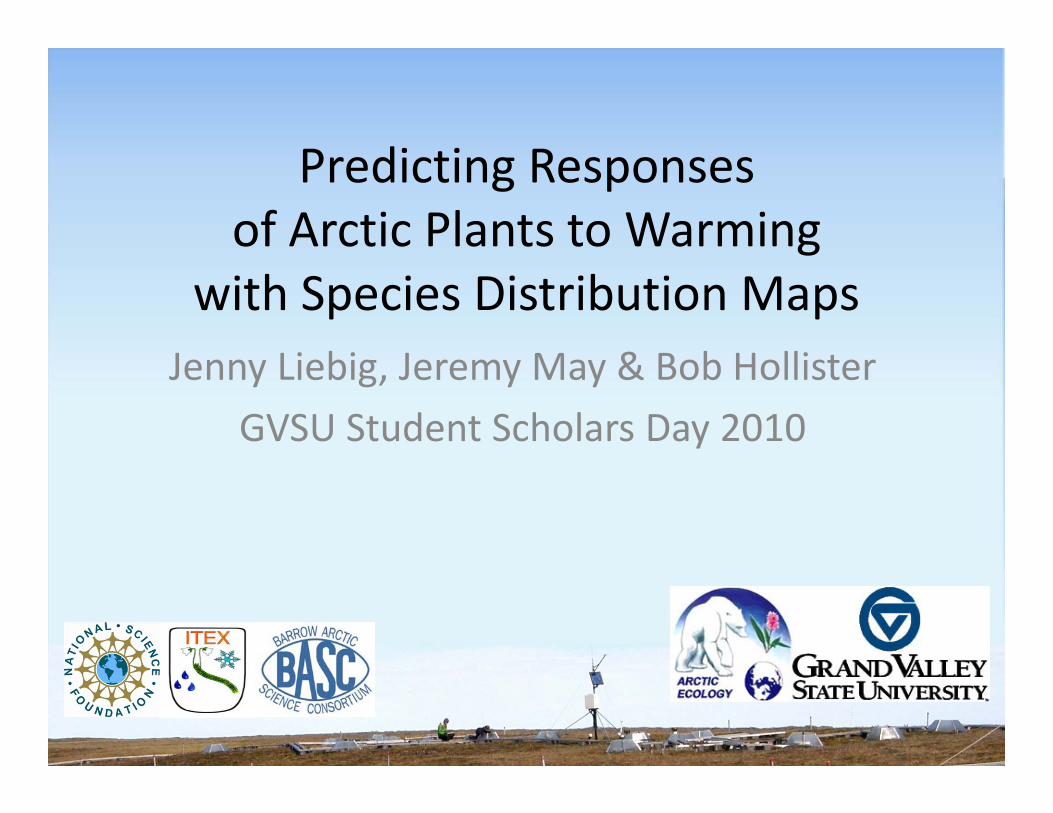
Arctic Conditions (2002) Projected Change (2080‐2100)
Source: IPCC 2007
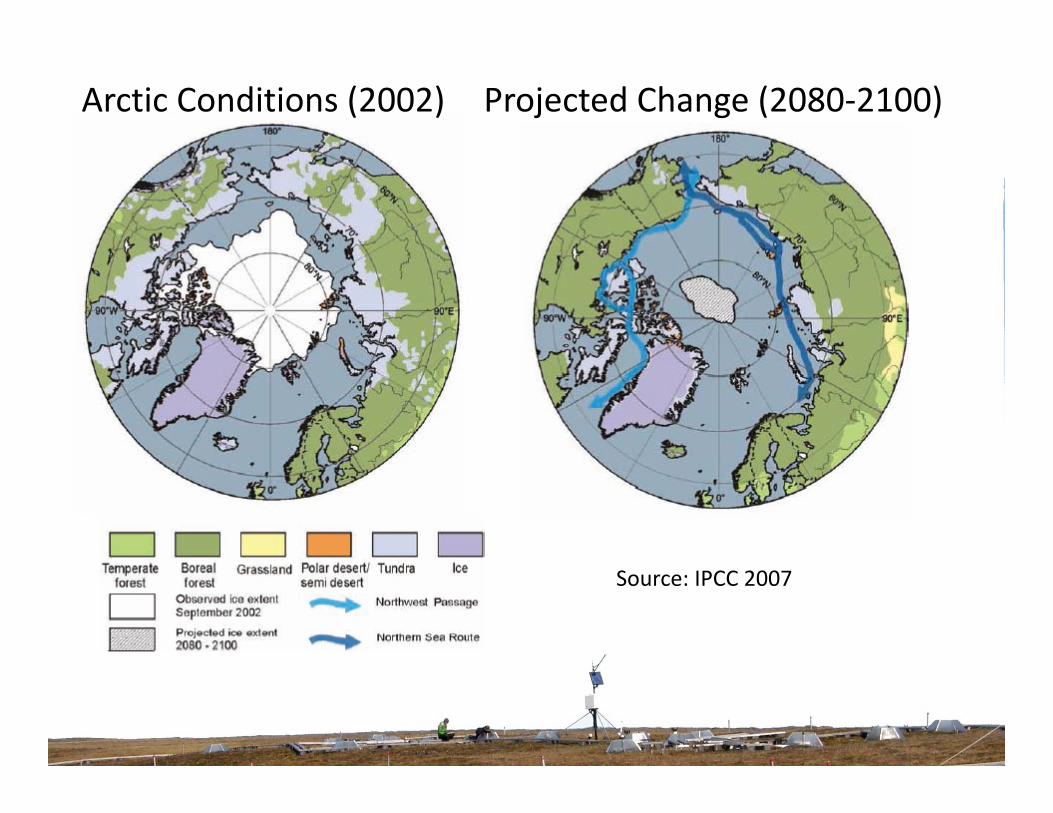
Site LocationsSite Locations
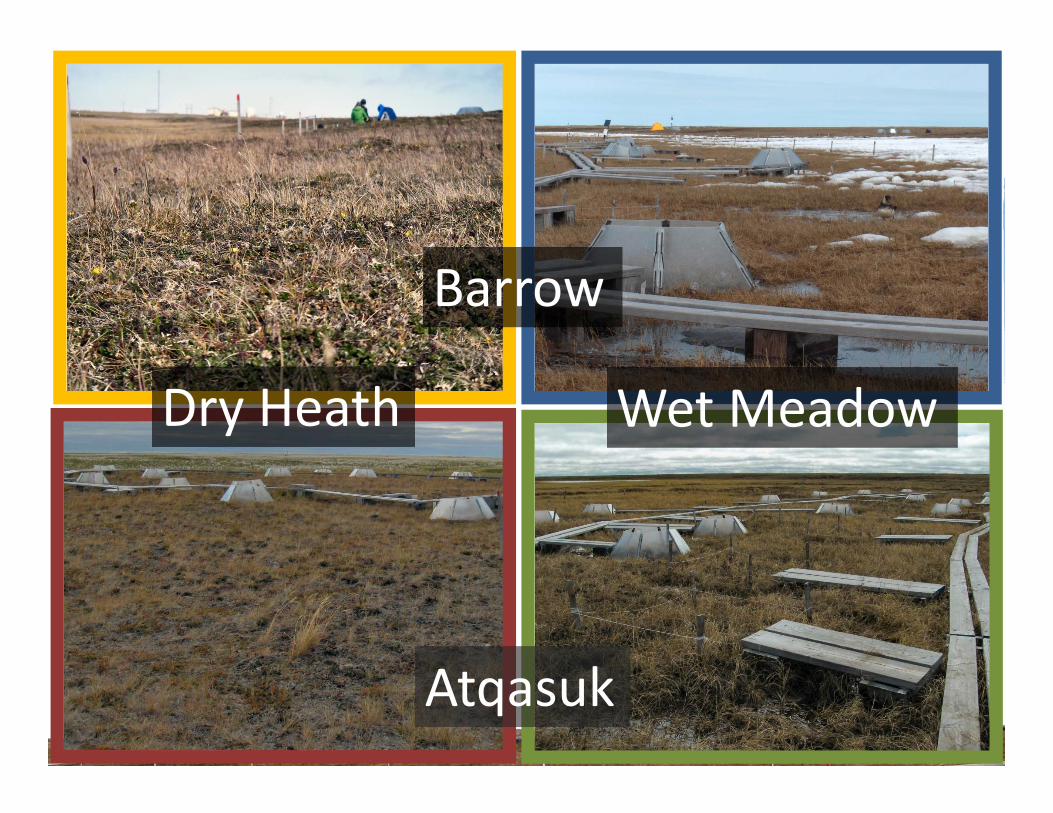
Barrow
Atqasuk
Wet MeadowDry Heath
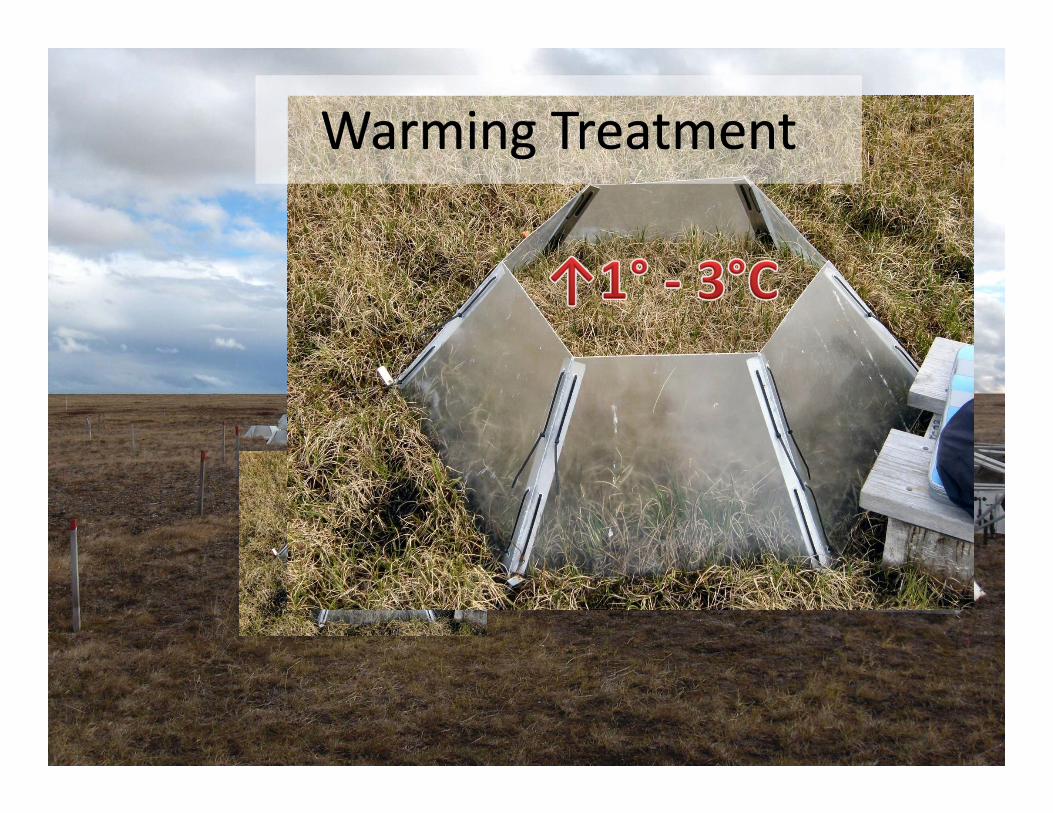
Warming TreatmentWarming Treatment
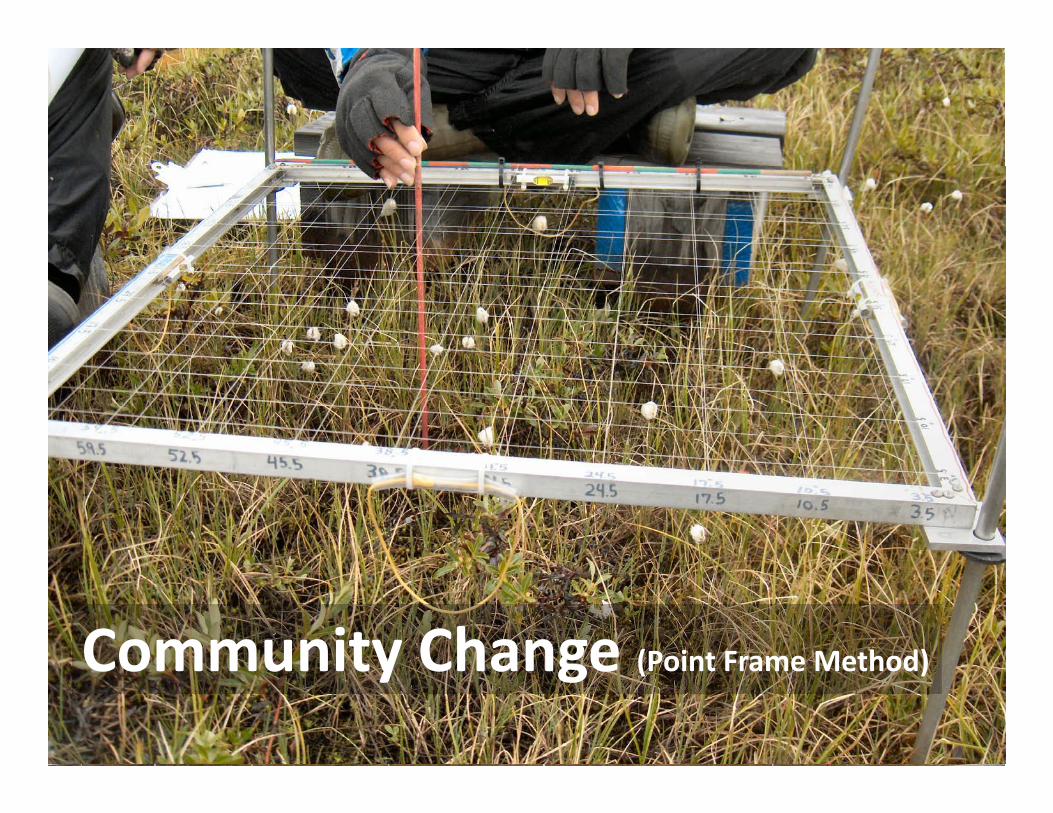
Community Change (Point Frame Method)
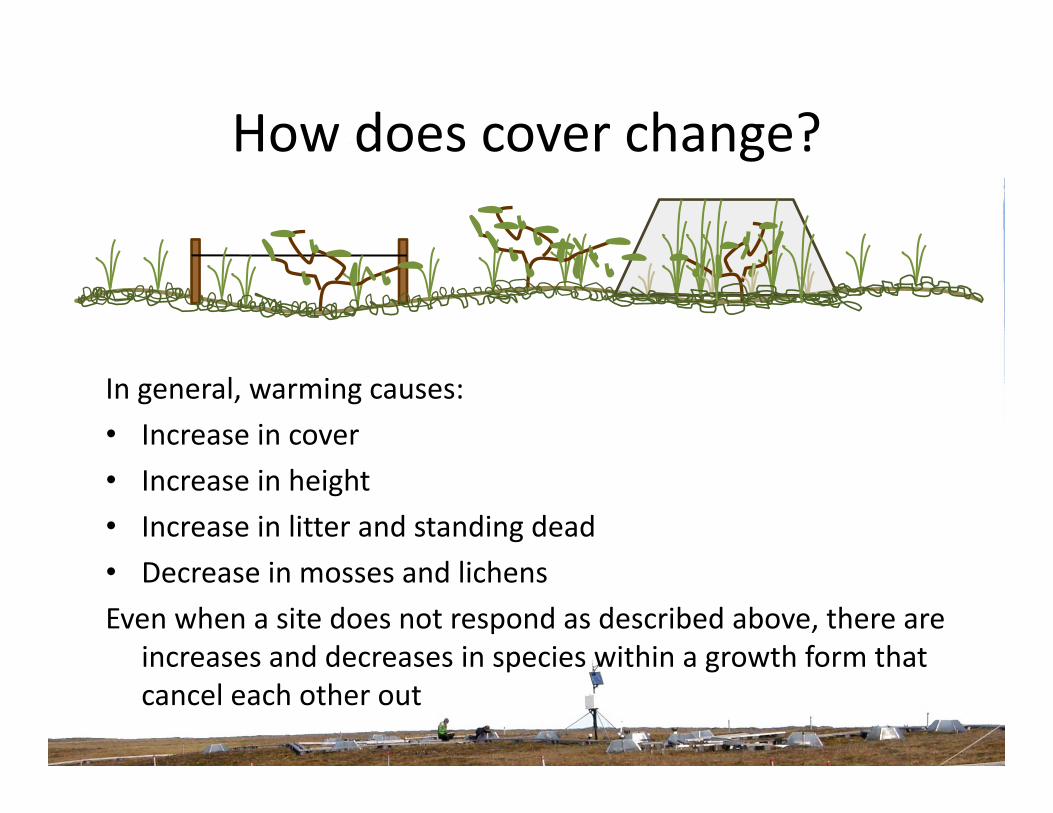
How does cover change?
In general, warming causes:• Increase in cover• Increase in height• Increase in litter and standing dead• Decrease in mosses and lichensEven when a site does not respond as described above, there are
increases and decreases in species within a growth form that cancel each other out
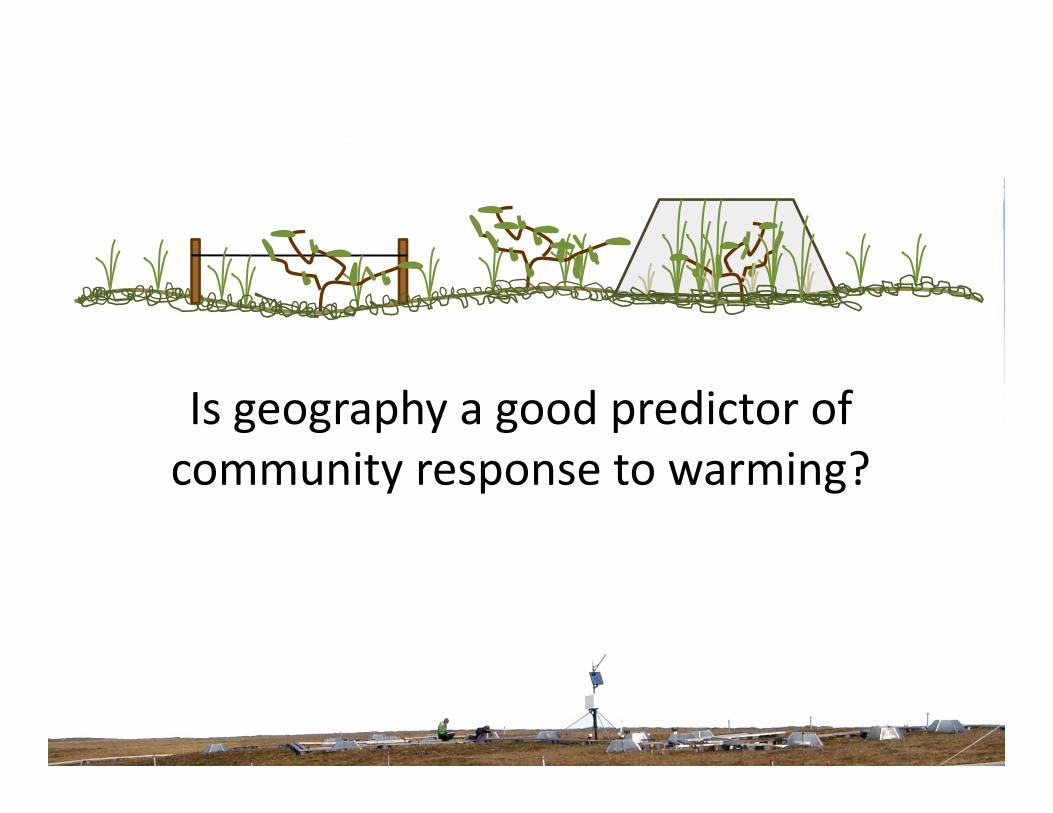
Is geography a good predictor of community response to warming?

Eric Hultén : Flora of Alaska and Neighboring Territories (1968)
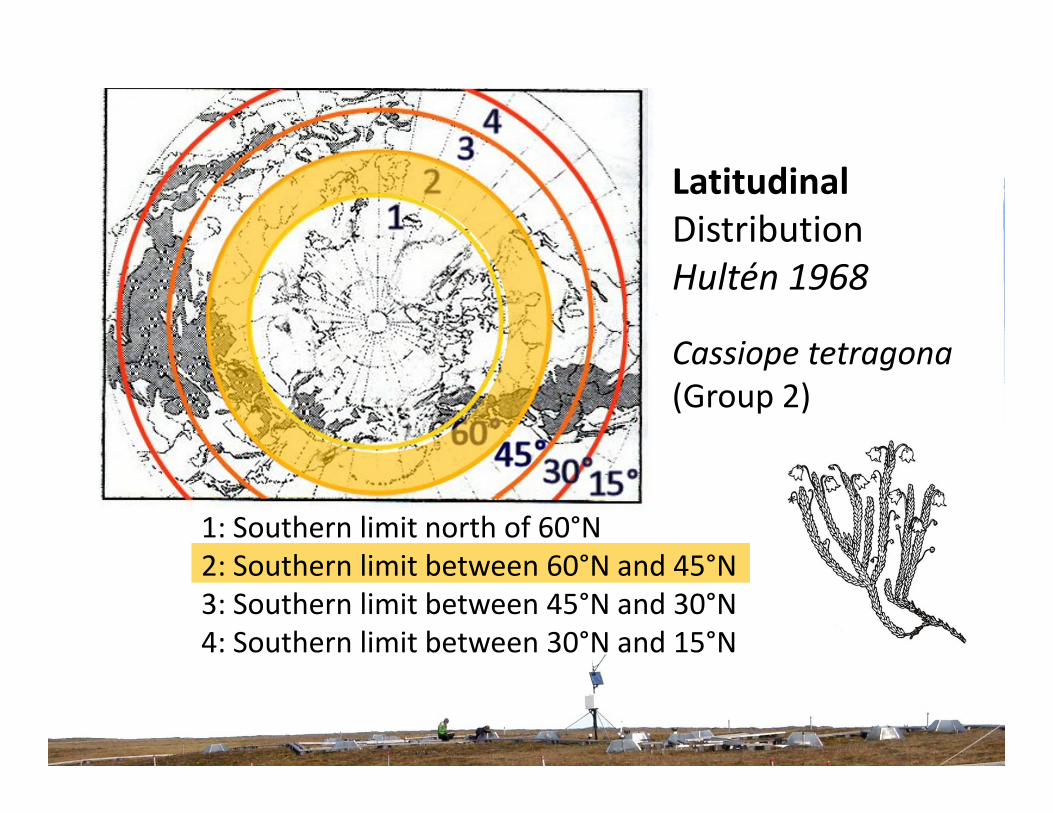
Cassiope tetragona(Group 2)
1: Southern limit north of 60°N 2: Southern limit between 60°N and 45°N3: Southern limit between 45°N and 30°N4: Southern limit between 30°N and 15°N
Latitudinal DistributionHultén 1968
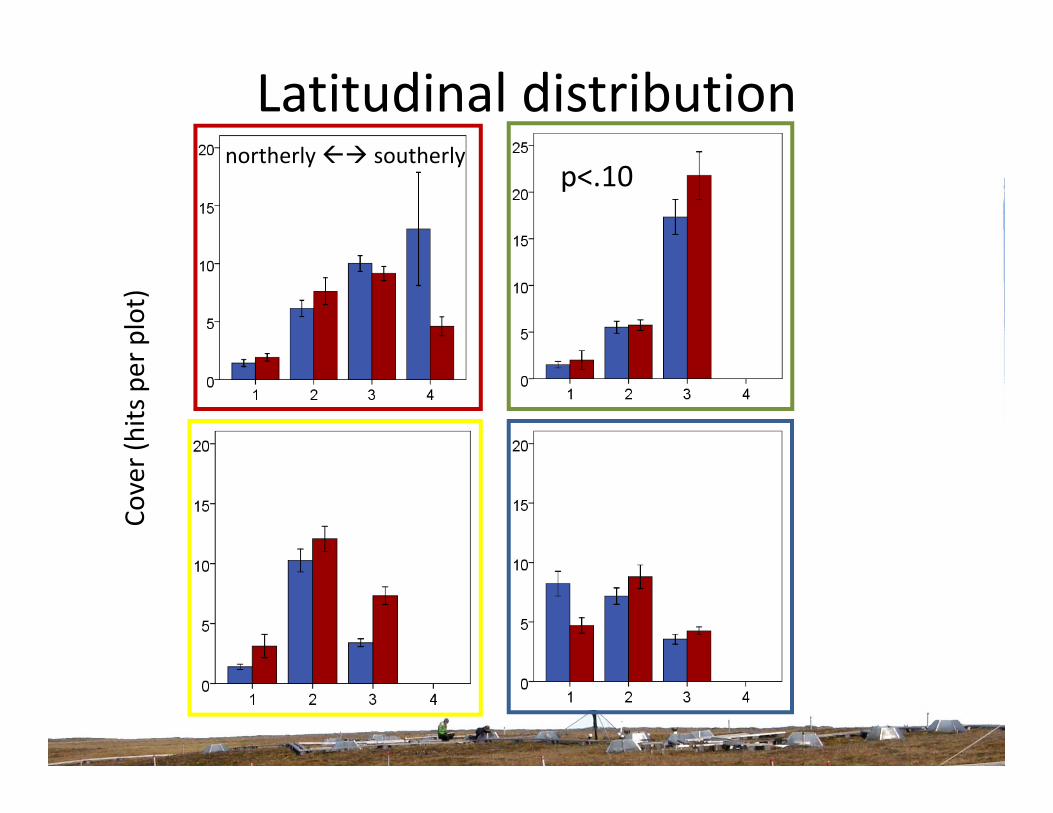
Latitudinal distributionCo
ver (hits per plot)
p<.10northerly southerly
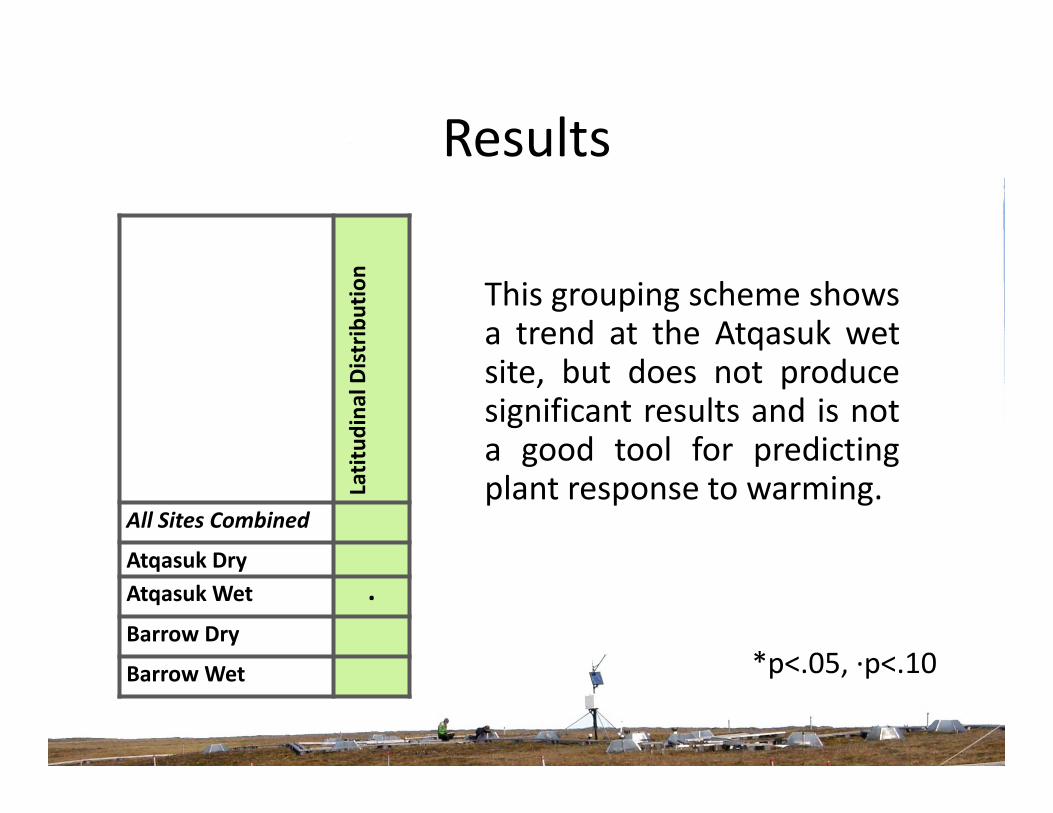
Results
*p<.05, ∙p<.10
This grouping scheme showsa trend at the Atqasuk wetsite, but does not producesignificant results and is nota good tool for predictingplant response to warming.La
titud
inal Distribution
All Sites Combined
Atqasuk DryAtqasuk Wet ∙Barrow Dry
BarrowWet
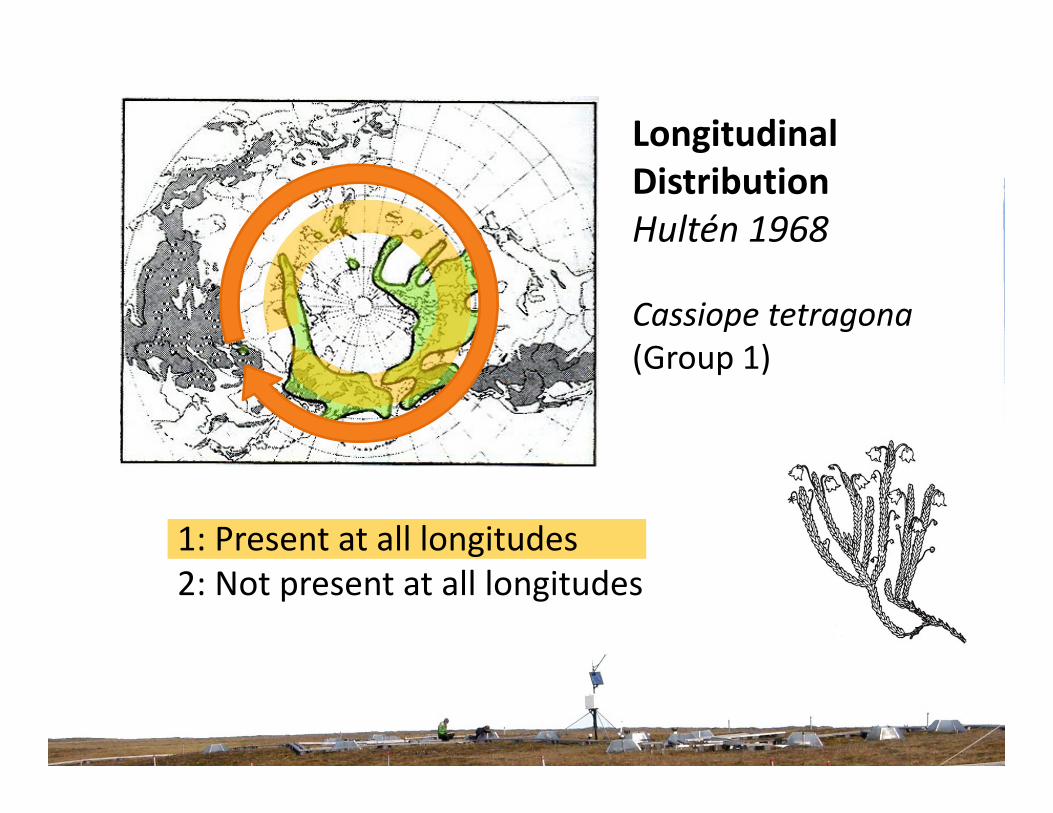
Longitudinal DistributionHultén 1968
1: Present at all longitudes2: Not present at all longitudes
Cassiope tetragona(Group 1)
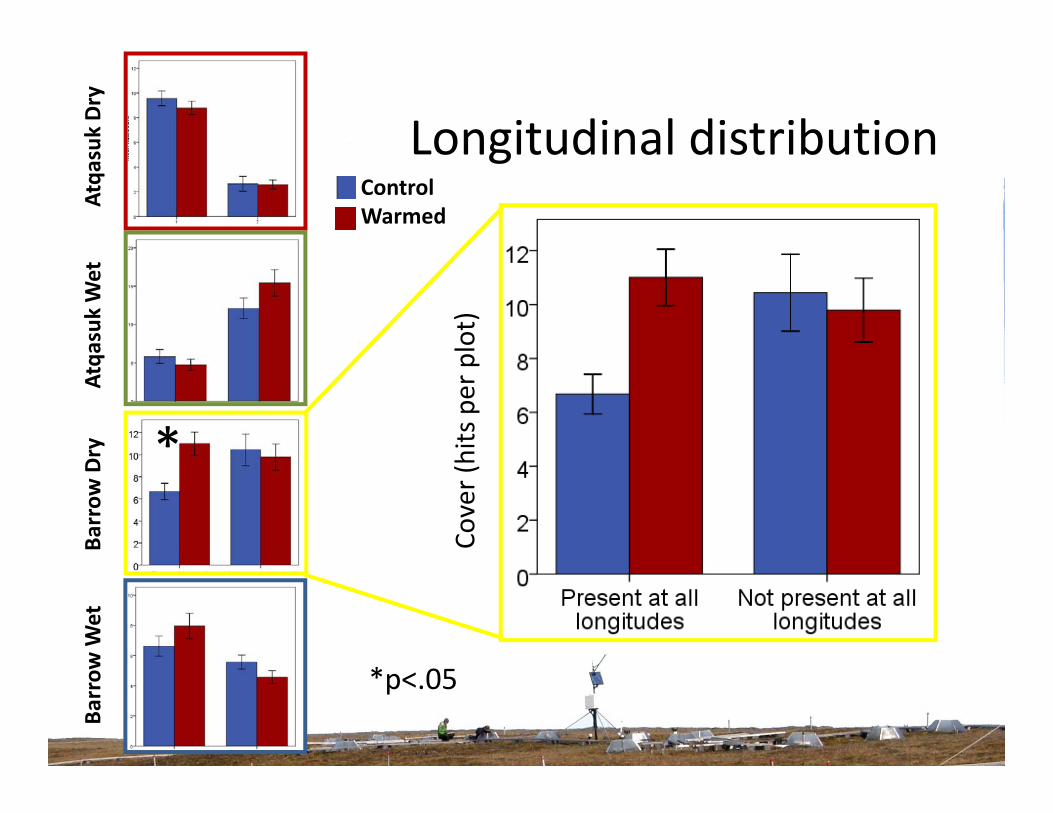
Longitudinal distributionBa
rrow
Wet Barrow Dry Atqa
suk Wet Atqasuk
Dry
*p<.05
*Co
ver (hits per plot)
ControlWarmed
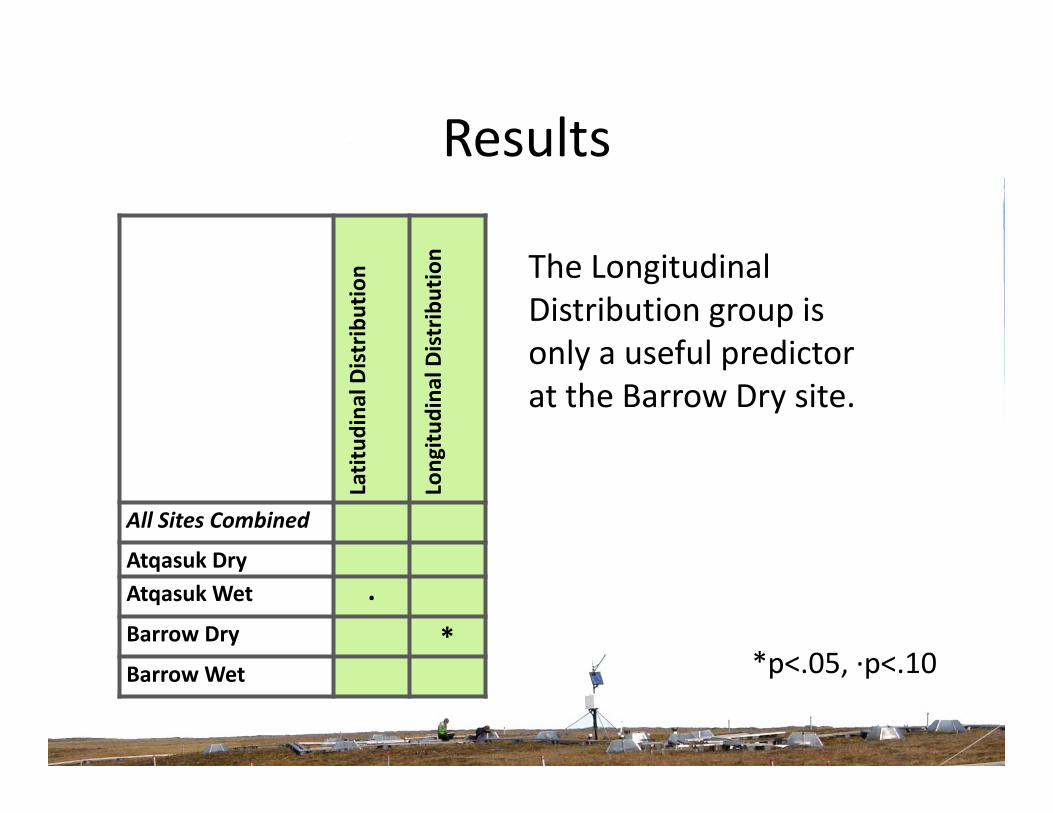
Results
*p<.05, ∙p<.10
The Longitudinal Distribution group is only a useful predictor at the Barrow Dry site.
Latitud
inal Distribution
Long
itudina
l Distribution
All Sites Combined
Atqasuk DryAtqasuk Wet ∙Barrow Dry *BarrowWet

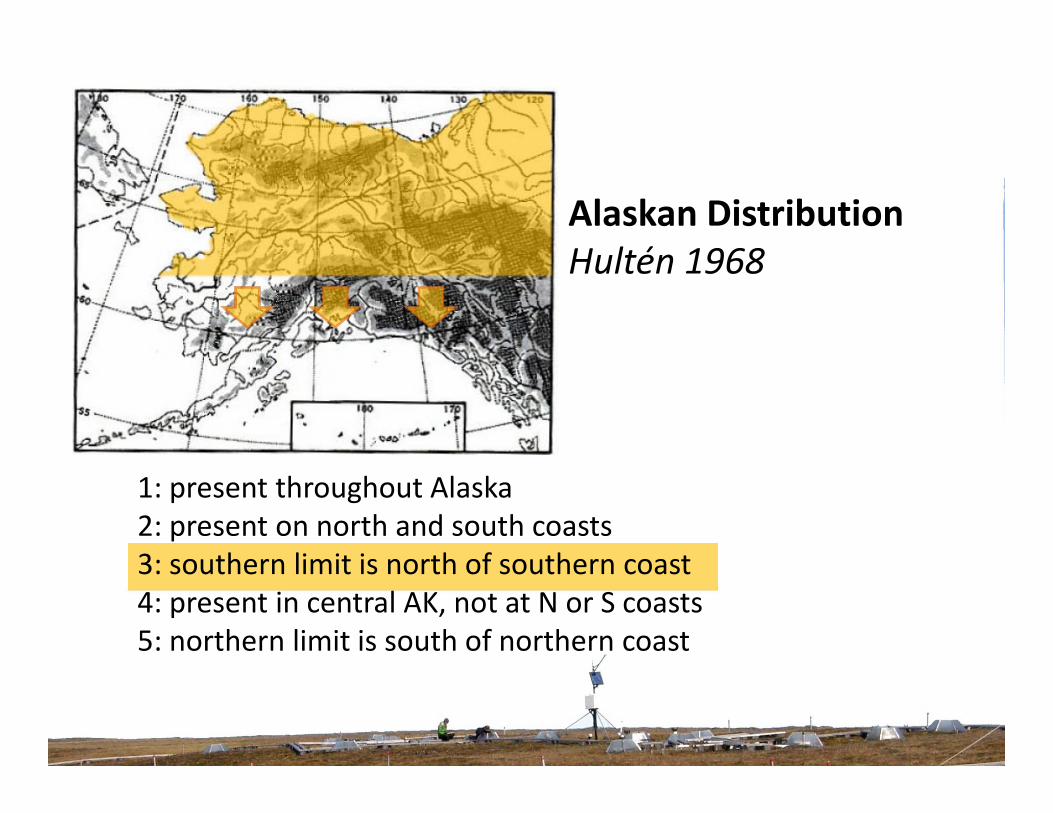
Alaskan DistributionHultén 1968
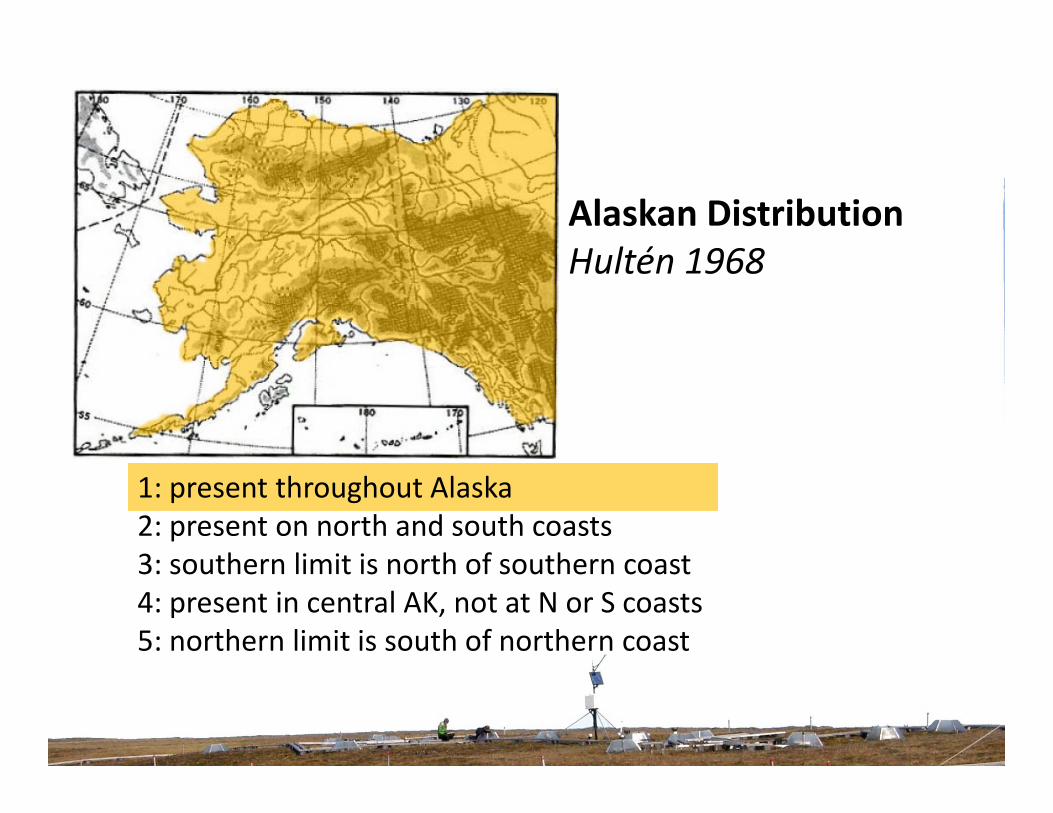
1: present throughout Alaska2: present on north and south coasts3: southern limit is north of southern coast4: present in central AK, not at N or S coasts5: northern limit is south of northern coast
Alaskan DistributionHultén 1968

1: present throughout Alaska2: present on north and south coasts3: southern limit is north of southern coast4: present in central AK, not at N or S coasts5: northern limit is south of northern coast
Alaskan DistributionHultén 1968
1: present throughout Alaska2: present on north and south coasts3: southern limit is north of southern coast4: present in central AK, not at N or S coasts5: northern limit is south of northern coast
Alaskan DistributionHultén 1968
1: present throughout Alaska2: present on north and south coasts3: southern limit is north of southern coast4: present in central AK, not at N or S coasts5: northern limit is south of northern coast
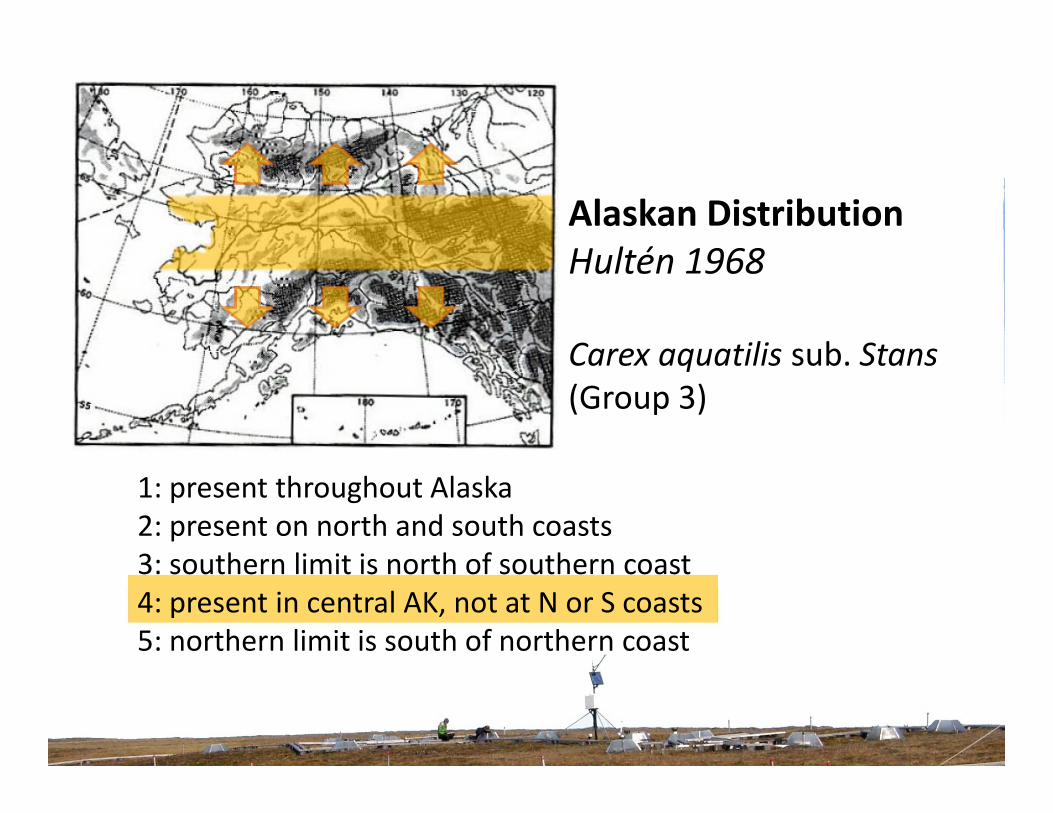
Alaskan DistributionHultén 1968
Carex aquatilis sub. Stans(Group 3)
1: present throughout Alaska2: present on north and south coasts3: southern limit is north of southern coast4: present in central AK, not at N or S coasts5: northern limit is south of northern coast
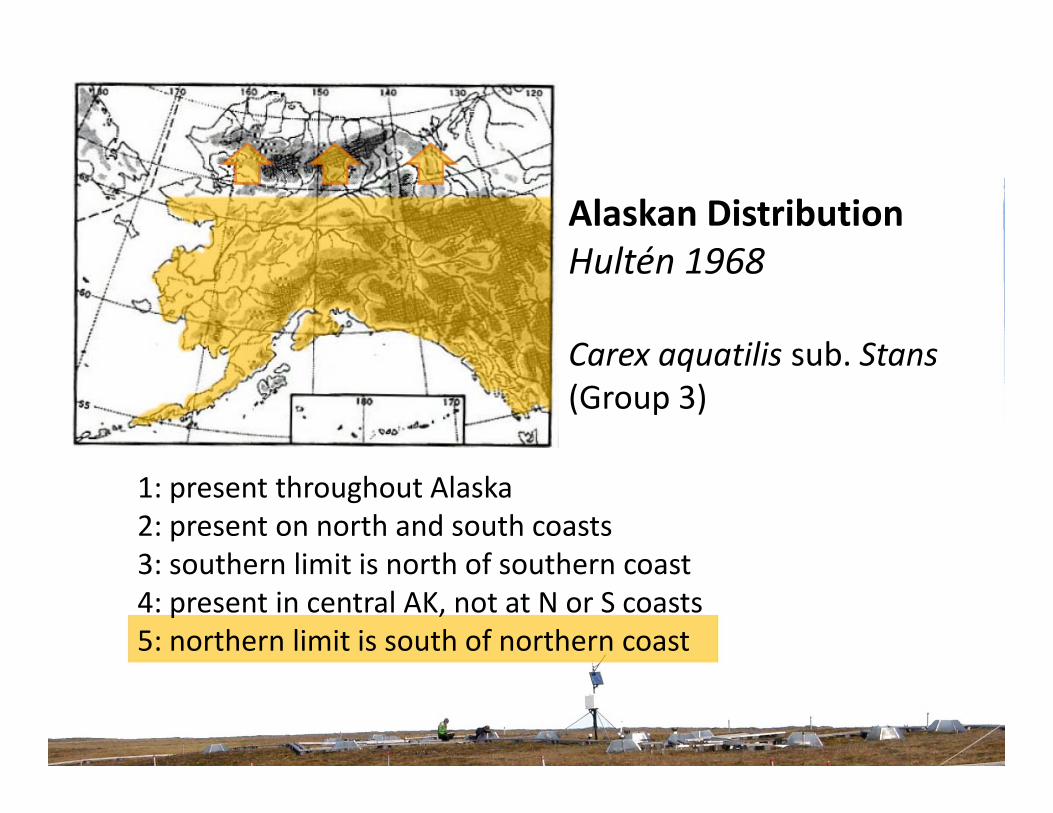
Alaskan DistributionHultén 1968
Carex aquatilis sub. Stans(Group 3)
1: present throughout Alaska2: present on north and south coasts3: southern limit is north of southern coast4: present in central AK, not at N or S coasts5: northern limit is south of northern coast
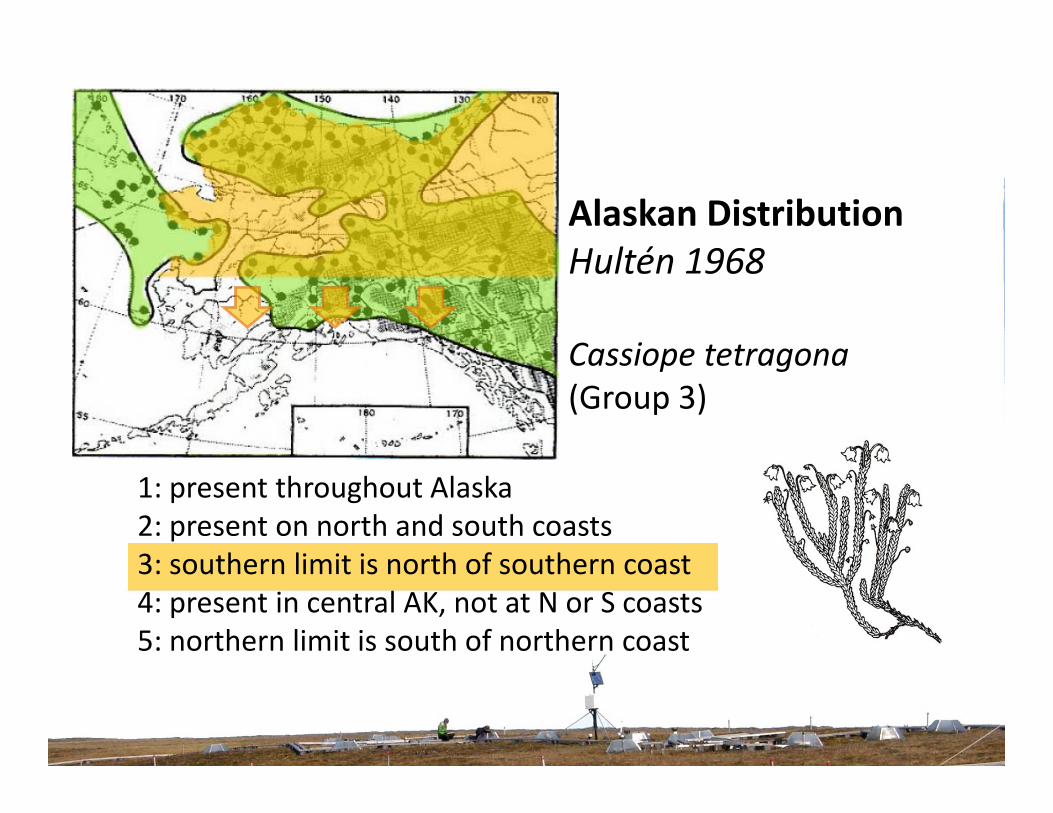
Alaskan DistributionHultén 1968
Cassiope tetragona(Group 3)
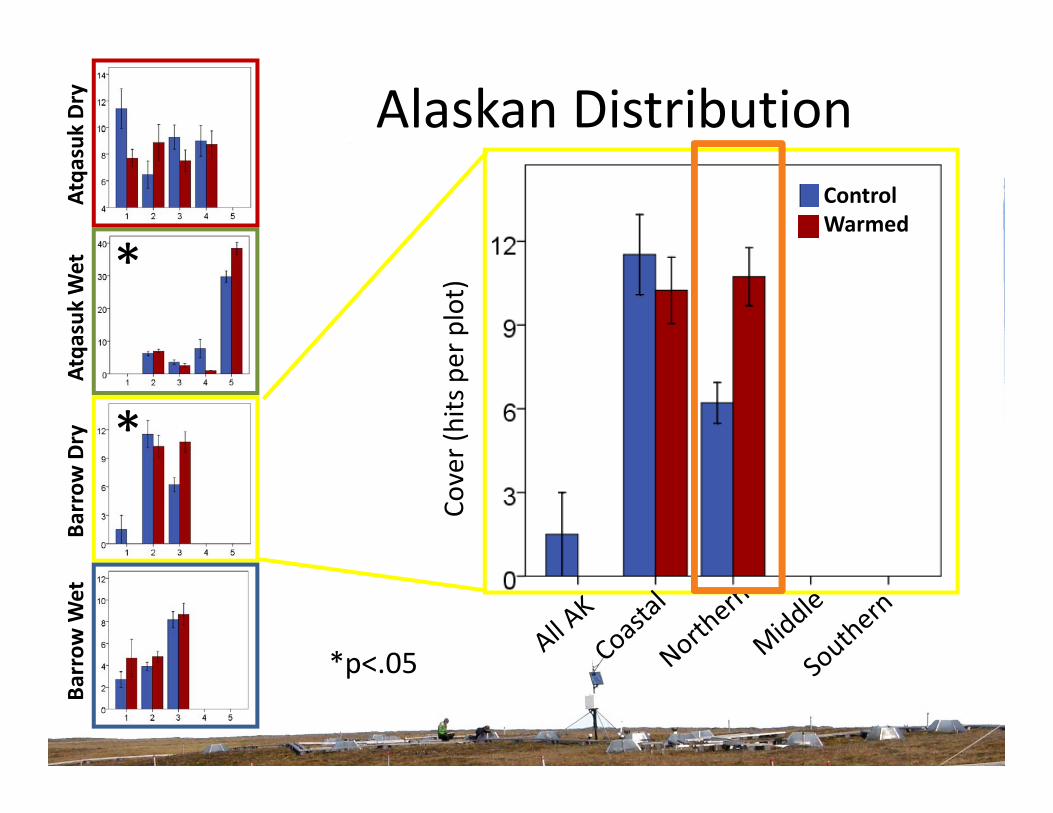
Alaskan Distribution
Cover (hits per plot)*
*
Barrow
Wet B
arrow Dry A
tqasuk
Wet Atqa
suk Dry
*p<.05
ControlWarmed
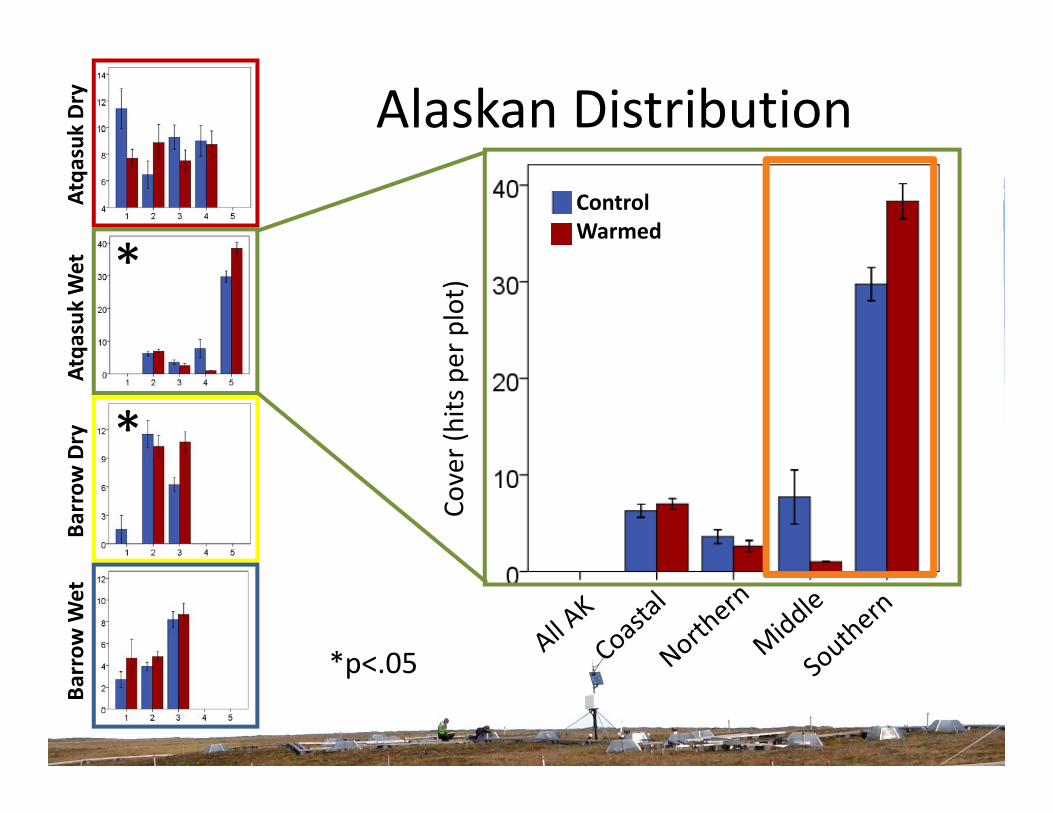
Alaskan Distribution
Cover (hits per plot)*
*
Barrow
Wet B
arrow Dry A
tqasuk
Wet Atqa
suk Dry
*p<.05
ControlWarmed
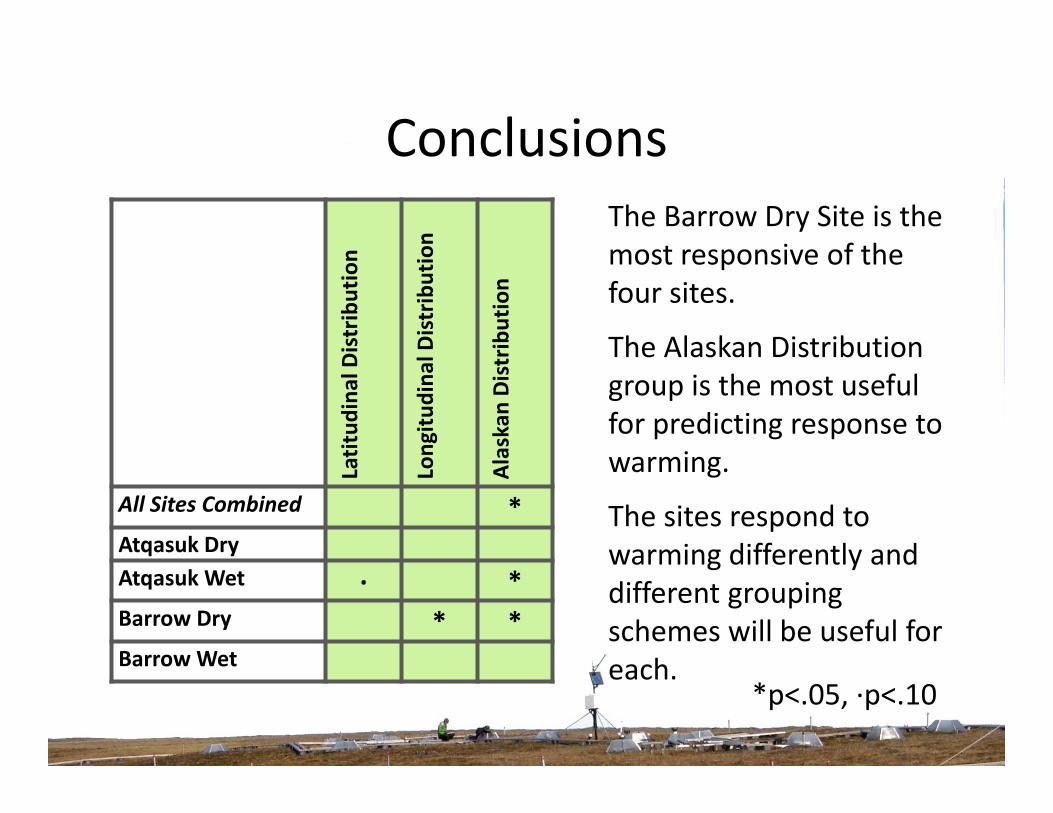
Conclusions
Latitud
inal Distribution
Long
itudina
l Distribution
Alaskan Distribution
All Sites Combined *Atqasuk DryAtqasuk Wet ∙ *Barrow Dry * *BarrowWet
*p<.05, ∙p<.10
The Barrow Dry Site is the most responsive of the four sites.
The Alaskan Distribution group is the most useful for predicting response to warming.
The sites respond to warming differently and different grouping schemes will be useful for each.
Current and Future Questions• Are there good predictors of community response to warming?
• Other geographic grouping schemes are being looked at to see if they agree with this investigation:– Young (1971)– Sørensen (1938)
• Other grouping schemes are being developed, based on – Morphology– Development– Phenology
ReferencesEdlund, S. A. & Alt, B. T. 1989. Regional congruence of vegetation and summer climate patterns in the Queen Elizabeth
Islands, Northwest Territories, Canada. Arctic 42 (1): 3‐23.
Gould, W. A. & Walker, M. D. 1999. Plant communities and landscape diversity along a Canadian Arctic river. Journal of Vegetation Science 10 (4): 537‐548.
Hollister, R.D. 2003. Response of Tundra Vegetation to Temperature: Implications for Forecasting Vegetation Change. Doctor of Philosophy Dissertation. Michigan State University. East Lansing, MI. 385+XXIVpp.
Hollister, R.D., P.J. Webber, F.E. Nelson, and C.E. Tweedie. 2006. Soil thaw and temperature response to air warming varies by plant community: Results from an open‐top chamber experiment in northern Alaska. Arctic Antarctic and Alpine Research 38(2):206‐215.
Hultén, E. 1968. Flora of Alaska and Neighboring Territories. Stanford University Press, Stanford, California, USA, 1008 p.
Young, S.B., 1971,The vascular flora of St. Lawrence Island with special reference to floristic zonation in the Arctic regions: Contributions of the Gray Herbarium, v. 201, p. 11‐115
Thanks to the members of the Arctic Ecology Program in 2007‐2008: Jeremy May, Robert Slider, Jean Marie Galang, Amanda Snyder, and Michael Lothshutz.
Thanks to the National Science Foundation for funding and the Barrow Arctic Science Consortium for providing logistics in Alaska.
Thanks to the members of the Arctic Ecology Program in 2007‐2008: Jeremy May, Robert Slider, Jean Marie Galang, Amanda Snyder, and Michael Lothshutz.
Thanks to the National Science Foundation for funding and the Barrow Arctic Science Consortium for providing logistics in Alaska.
Thank you!