Embed Size (px)
Citation preview
8/11/2019 Predicting Penetration Rates JamesMaher
http://slidepdf.com/reader/full/predicting-penetration-rates-jamesmaher 1/6
A Machine Learning Approach to Predicting andMaximizing Penetration Rates in Earth Pressure Balance
Tunnel Boring MachinesJames Maher
Colorado School of Mines
1600 Illinois StreetGolden, CO, USA1-303-384-2465
1. Introduction
Modern tunneling projects will often rely on a Tunnel Boring
Machines (TBMs) rather than traditional drill and blast (D&B)methods, because of TBMs’ increased tunneling efficiency[1].
TBMs have a circular drill at the front, which can range indiameter from 1 meter to 19.25 meters, depending on the desired
use for the completed tunnel. Applications of tunnels dug byTBMs range from underground water and sewer conduits tosubway lines and double-decker, 3-lane wide highways. MostTBM contractors monitor the performance of their TBMs with
sensors that send data back to a central data collection system.200-400 sensor readings are collected every 10 seconds ontunneling projects that can last over a year [2].
Underground construction and tunneling projects can incur projectcosts from tens of millions of dollars to well over one billion
dollars. Project costs are estimated based on prior experience, or a best guess, of the penetration rate. A scientific model forunderstanding the factors that affect the penetration rate of a TBMcan lead to improved cost prediction and lower overall cost to
complete the tunnel [3]. Data collected by TBMs is visible to
human operators as the TBM constructs the tunnel and it isrecorded in a database for later analysis. Application of machinelearning to this large data set provides the opportunity to find
long-term trends that may not be visible during operation of theTBM.
2. Background and Related Work
2.1. Background
This research project used data from a subway extension projectin Seattle, WA, USA, [4] to determine the factors that affect the
penetration rate of a TBM. The TBMs examined in this project are
a subset of machines called Earth Pressure Balance (EPB) TBMs.EPBs are used in soft-soil conditions (as opposed to a traditional
hard-rock TBMs) and are designed to control ground settlement asthe machine passes beneath an urban environment. Because EPBTBMs drill in sandy and clay soils, there is a danger of buildingsat the surface collapsing as the TBM drills. EPB TBMs are oftenused in ground conditions where other drilling methods are not
available.
Since the soil conditions an EPB TBM drills through are differentthan a hard-rock TBM, this project proposes that the factorsimpacting the penetration rate of an EPB TBM will be different.
Other researchers have linked the penetration rate of a hard-rockTBM to rock hardness and the type and number of joint fracturesin the rock being drilled [8]-[14]. Since the soil conditions aresofter with an EPB TBM, the penetration rate is more determined
by conditioning the soil to excavate it faster from the drillingchamber. A Ground Conditioning System (GCS) is used to injectchemical mixtures into the soil, making it easier for the soil to
enter the screw conveyor and to be removed from the constructionsite. These factors are not concerns for hard rock TBMs, and thusneed to be explored.
Figure 1. Cross Sectional View of an EPB TBM
A cross sectional view of an EPB TBM and completed concretetunnel is shown at Figure 1. EPBs tunnel through materials thatwill collapse if the material is not completely supported by the
machine until the concrete tunnel lining is constructed. A metalshield surrounds the machine until pre-cast concrete segments can
be set into place and sealed with grout. Propulsion cylinders, label4 in figure 1, push against these newly constructed concrete
segments to provide thrust as the machine drills forward throughthe soil. Single shield TBMs operate on a cycle of first excavating
approximately 5 feet, then constructing a ring of concrete tunnelsegments. These rings are later referred to in this paper as tunnelrings.
2.1.2 Related Work
Research has been conducted on studying methods for predictingthe performance of a TBM. Most research is focused on hard-rockTBMs, and no research has been found on predicting EPB TBM
penetration rates. Previous work from hard-rock TBMs isrelevant, because the machines are performing a similar function,
but one must understand the fundamental differences between the
8/11/2019 Predicting Penetration Rates JamesMaher
http://slidepdf.com/reader/full/predicting-penetration-rates-jamesmaher 2/6
challenges encountered by a hard-rock TBM versus those
challenges encountered by an EPB TBM. Researchers use severalapproaches to predict a TBM’s penetration rate. The following
categories summarize these approaches:
1. Creating a computer or laboratory simulated model of the soil
and TBM [5] – [7]
2. Modeling TBM performance by applying regressions to soiland rock rating systems [8] – [14].
3. Analyzing soil and TBM data through machine learningtechniques[15] – [21]
M. A. Grima et al., presents research that utilized the Universityof Texas, Austin’s database of over 640 hard-rock TBM projects
to predict the penetration rates of these projects through neuro-fuzzy methods [16]. The parameters selected as inputs to this
model were: two parameters based on rock strength, three parameters based on the type of TBM, the maximum cutterheadtorque, and revolutions per minute. Grima, et al. picked these
parameters based on a literature review of the parameters
affecting the penetration rate of hard-rock TBMs. The input spacewas reduced with Principle Component Analysis (PCA) to 3inputs. Ten sets of testing data (of unknown size) were used to testfor overfitting of the model. The root mean squared error (RMSE)
of the testing data was 0.8999 meters/hour. Since no research onthe prediction of advance rates in EPB TBMs could be found,these research results are a good comparison point when testingthe RMSE of new EPB TBM penetration rate models.
3. Approach and Uniqueness
3.1 Uniqueness
Previous studies have focused on performance prediction of hard-
rock TBMs, but this research will focus on soft-soil EPB TBMs.Because, EPB TBMs face different challenges than hard-rockTBMs, it is hypothesized that the inputs to an EPB performancemodel will be different than the inputs to a hard-rock TBM model.
Most hard-rock TBM models focus on rock hardness and brittleness characteristics, but soft-soil projects are focused on balancing the pressure at the face of the TBM and maintaining atoothpaste-like soil consistency to easily remove the soil from the
excavation chamber.
Previous work has selected input parameters for models fromliterature studies. Although a literature study is essential to
understanding the operation of the machine, automated featureselection methods may find machine parameters that were not
previously known to affect the performance of the TBM. For thisreason, this study uses automatic feature selection.
The machine learning techniques used in prior studies are primarily ANN, multi-linear regression, fuzzy logic, and neuro-fuzzy methods. Multi-linear regression will be used in this study,
but methods such as Support Vector Machines (SVMs) andensemble decision tree classifiers will also be used to generate arobust set of parameters. When creating a model to fit data, it iscommon to overfit the model to training data unless one is careful
in the use of training and testing data or cross-validation data. Themodels created will use 10-fold cross validation to avoidoverfitting.
3.2 Approach
Data analyzed in this project was obtained from two EPB TBMs
constructing a northbound and a southbound tunnel as part of theSeattle, WA, University Link subway extension project [4]. Onetunnel is referred to as the northbound tunnel and the other is
referred to as the southbound tunnel, but the TBMs drilled thesetunnels in the same direction to take advantage of a downwardslope. Sensors were sampled every 10 seconds for the length of
the project. Since torques, pressures, flow rates, etc. areinstantaneous values that can become erratic when only sampledevery 10 seconds, the data was smoothed over the space of eachconcrete tunnel ring (approximately 5ft of TBM advance). Theaverage penetration rate per ring was used as the target value, and
the median value of all other TBM sensors was used to decreasethe impact of outlier values. The data used was only from whenthe TBM was actively drilling.
The hypothesis for this research is that the set of parametersaffecting the penetration rate of an EPB TBM are different fromthose affecting hard rock TBMs. To determine features essentialto predicting an EPB’s penetration rate, two methods of feature
selection were used: Stepwise Forward Feature Selection (SFFS)and Guided Regularized Random Forests (GRRFs) [22], [23].
SFFS is a greedy feature selection algorithm which starts with aset of no input features I F = {}. A separate linear regression modelis fitted for each of the potential input parameters. An F-test is runon each of these models, and the input feature with the smallest p-value ( I 0) is added to the final set of input features I F = {I 0 }. The p-
value of the input added to I F must be less than a predeterminedentrance criterion. Each step in SFFS adds one additional, non-selected parameter to the set I F = {I 0 }. The feature with the lowest
p-value, that is less than the entrance criterion, is added to I F .
Features can also be removed if their p-value is higher than an exitcriterion when used in a new regression created with the
parameters from I F . The entrance criterion of 0.05 and the exitcriterion of 0.10 were chosen.
Guided Regularized Random Forests generates a set of RandomForest [24] decision trees that predict the average penetration rate
per ring of the TBM. GRRFs provide a method of selectingfeatures that is not based on a linear function and is resistant tonoise in the data. The GRRF algorithm modifies the entropy(sometimes called information gain) equation, shown at equation1.
I() ∑ |(|) (1)
Where is the set of input features available to split a node in the
decision tree, c is the set of classes and p(i|t) is the percentage oftraining examples correctly classified by this split. Equation 1 is
repeated for all input features in , and the input feature with the
greatest information gain is selected for the split. This equation isfor binary input features, but can be adapted to input features thatuse continuous values. Because GRRFs are for limiting the input
feature space, the algorithm adds a penalty term ( ) for any inputfeature that has not been previously used by the random forest.
Equation 2 show the formula applied by GRRF to the informationgain equation.
() { ()
(2)
8/11/2019 Predicting Penetration Rates JamesMaher
http://slidepdf.com/reader/full/predicting-penetration-rates-jamesmaher 3/6
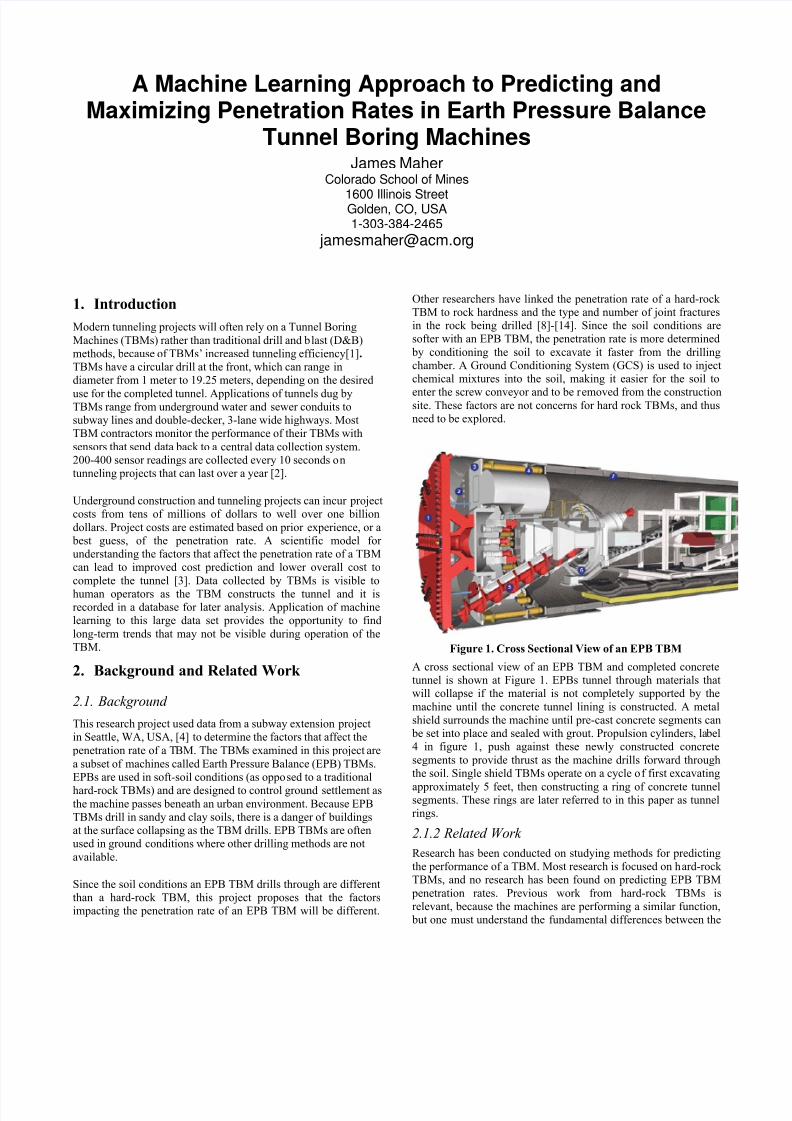
Figure 2. Scatterplot of the predicted vs. observed penetration rate in each ring of the tunnels. The predicted model was created
using multilinar regression with the features selected by SFFS. The red trendline is the y=x line; all points would lie on this line in
an ideal (non-existant) model. The r2 value is calculated for the y=x line. Data from the northbound tunnel is shown on the left and
data from the southbound tunnel is shown on the right.
Root Mean Squared Error (RMSE) for Multiple Linear Regression Models Using SFFS and Hard-Rock Neuro-Fuzzy Method[16]
Northbound RMSE Southbound RMSE Grima Hard-Rock, Neuro-Fuzzy RMSE
0.514 meters/hour 0.544 meters/hour 0.8999 meters/hours
Table 1. A comparison of the RMSE of the multilinear regression model to the hard-rock TBM model created by A. Grima, et al.
Where F is the set of input features already used in the random
forest and . The value of is not the same for all inputfeatures, because it is initialized based on an ordinary random
forest created before the GRRF algorithm is run.
After the feature selection algorithms determined the importantinput features, the features were used to create a model of theTBM’s penetration rate. Linear regression, polynomial regression,and SVM regression with a linear kernel, were used to create this
model. The RMSE value and r 2 values were calculated for eachmodel to provide a quantitative measure of how well the inputfeatures performed.
In order to determine which features could be adjusted to improve
the penetration rate performance of the TBM, the input featureswere compared across the northbound and southbound TBMs.Features that could not be modified (such as the weight of
material on the rear belt scale) were eliminated fromconsideration. The remaining input features were examined on atime series plot to determine their effects on the penetration rate.
4. ResultsSFFS was applied to the northbound and southbound tunnelsseparately. Initially, it was applied to the entire data set whichconsisted of readings from each TBM sensor every 10 seconds forthe length of the project. Because the sensors were only sampled
every 10 seconds, the resolution of the penetration rate was low,and thus the SFFS could not find an ideal set of features thatlinearly impacted the penetration rate. The southbound tunnel
returned 114 significant features with a very high RMSE of 7.308m/hour.
Since it was not possible to increase the resolution of the sensorreadings, the data was smoothed over each tunnel ring
(approximately 5 linear feet) providing differentiation among thetarget penetration rates. The smoothing allowed the SFFSalgorithm to find features linearly related to the penetration rate.SFFS was run with entrance criteria of p = 0.05 and an exit
criteria of 0.10. The features identified by SFFS are shown attable 2.
TBM Features Identified by SFFS
Northbound Southbound
Cutterhead Vertical Offset #5 Propulsion Cylinder
#2 Screw Conveyor SoilPressure
#9 Propulsion Cylinder
#4 Cutterhead Seal
Temperature
#3 Bulkhead Soil Pressure
#1 Cutterhead OpeningPosition
#2 Tunnel Shaping CutterPosition
#2 Screw Conveyor Hydraulic
Position
#3 Cutterhead Seal
TemperatureTail Seal Grease InjectionPressure
Right Side Traction Pressure
Rear Side Conveyor Belt Scale Front Side Conveyor Belt Scale
Line 1 Grout Component B
Pressure
Line 1 Grout Component B
Flow Rate
Line 1 Grout Flushing Pressure Line 2 Grout Component A
Flow Rate
Line 2 Grout Component B
Flow Rate
Line 3 Grout Component A
Flow Rate
Line 3 Grout Component AFlow Rate
Line 2 GCS Solution Total
Expelled
Line 5 GCS Foam TotalExpelled
Line 3 GCS Solution TotalExpelled
Table 2. TBM sensor readings determined significant by the
SFFS algorithm. Bold faced text represents sensors recording
the GCS.
A multiple linear regression, third degree polynomial regression,
and support vector regression with linear and polynomial kernelseach built a model using the input features selected by SFFS.Figure 2 shows scatterplots of the observed penetration rates foreach ring on the x-axis and the multiple linear regression
0
2
4
6
0 2 4 6
P r e d i c t e d A d v a n c e R a t e
( m / h r )
Observed TBM Advance Rate (m/hr)
Northbound Tunnel
r2 = 74.09%
0
2
4
6
0 2 4 6
P r e d i c t e d A d v a n c e R a t e
( m / h r )
Observed TBM Advance Rate (m/hr)
Southbound Tunnel
r2 = 62.81%
8/11/2019 Predicting Penetration Rates JamesMaher
http://slidepdf.com/reader/full/predicting-penetration-rates-jamesmaher 4/6
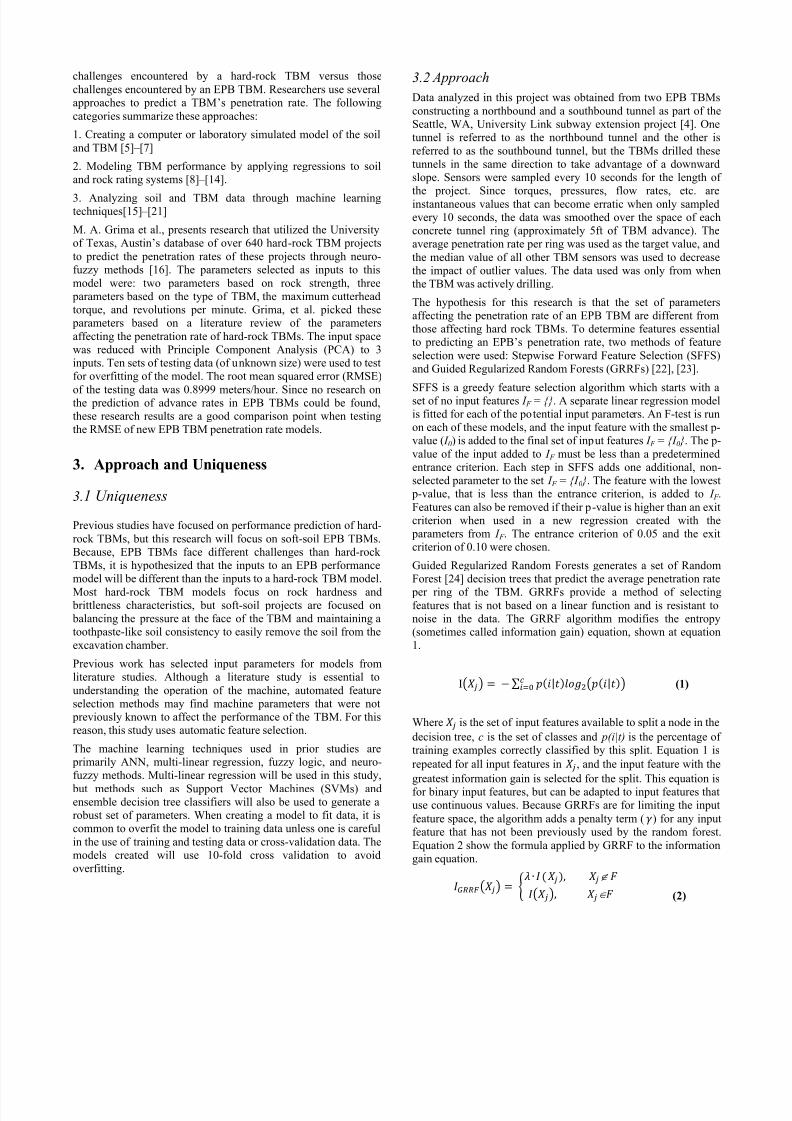
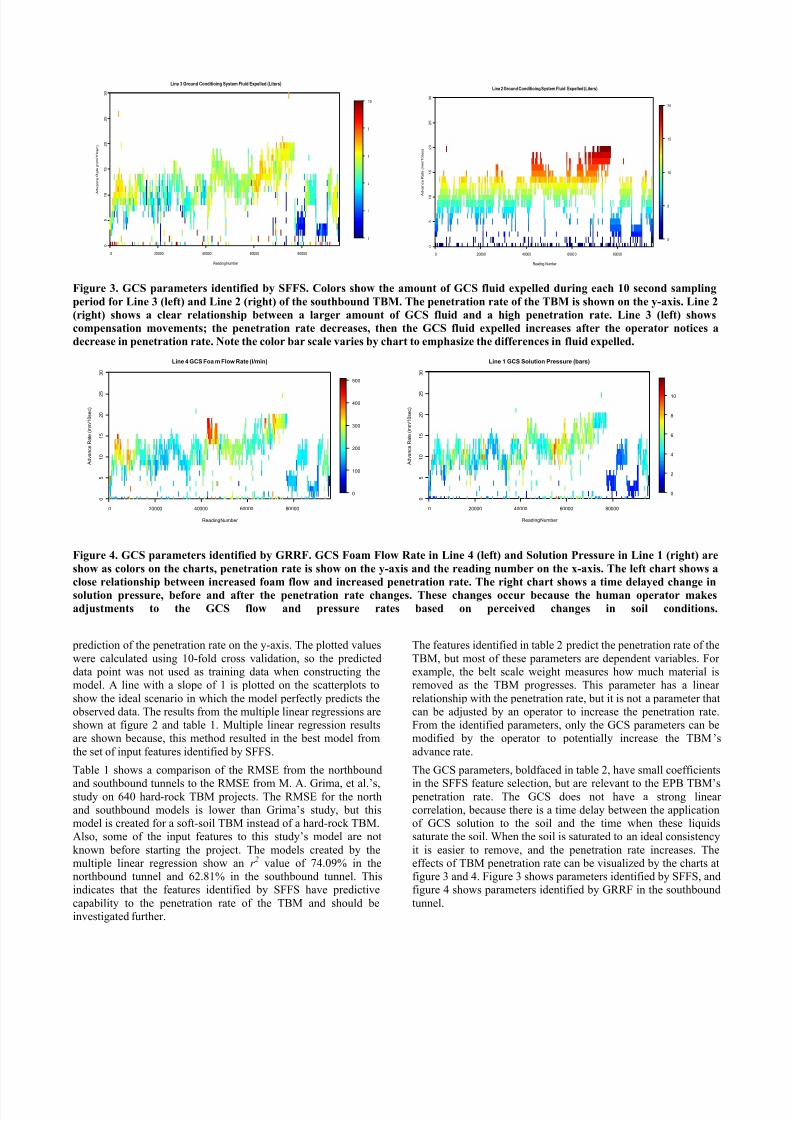
Figure 3. GCS parameters identified by SFFS. Colors show the amount of GCS fluid expelled during each 10 second sampling
period for Line 3 (left) and Line 2 (right) of the southbound TBM. The penetration rate of the TBM is shown on the y-axis. Line 2
(right) shows a clear relationship between a larger amount of GCS fluid and a high penetration rate. Line 3 (left) shows
compensation movements; the penetration rate decreases, then the GCS fluid expelled increases after the operator notices a
decrease in penetration rate. Note the color bar scale varies by chart to emphasize the differences in fluid expelled.
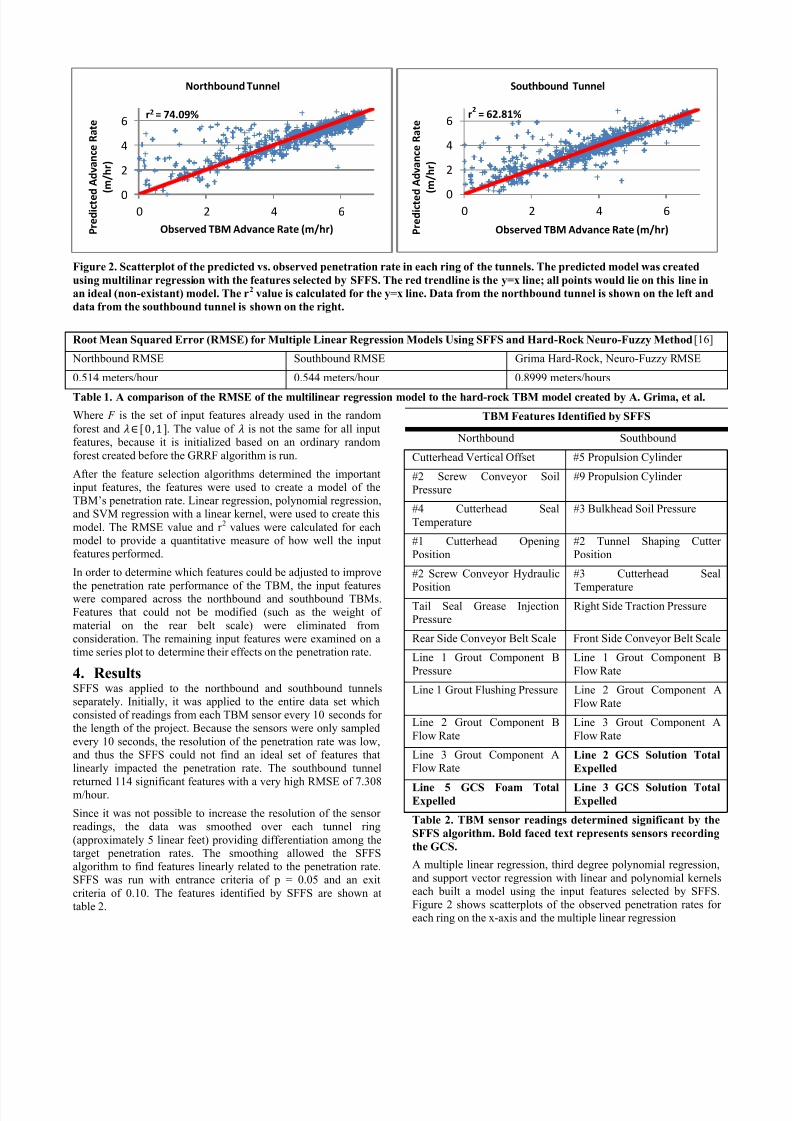
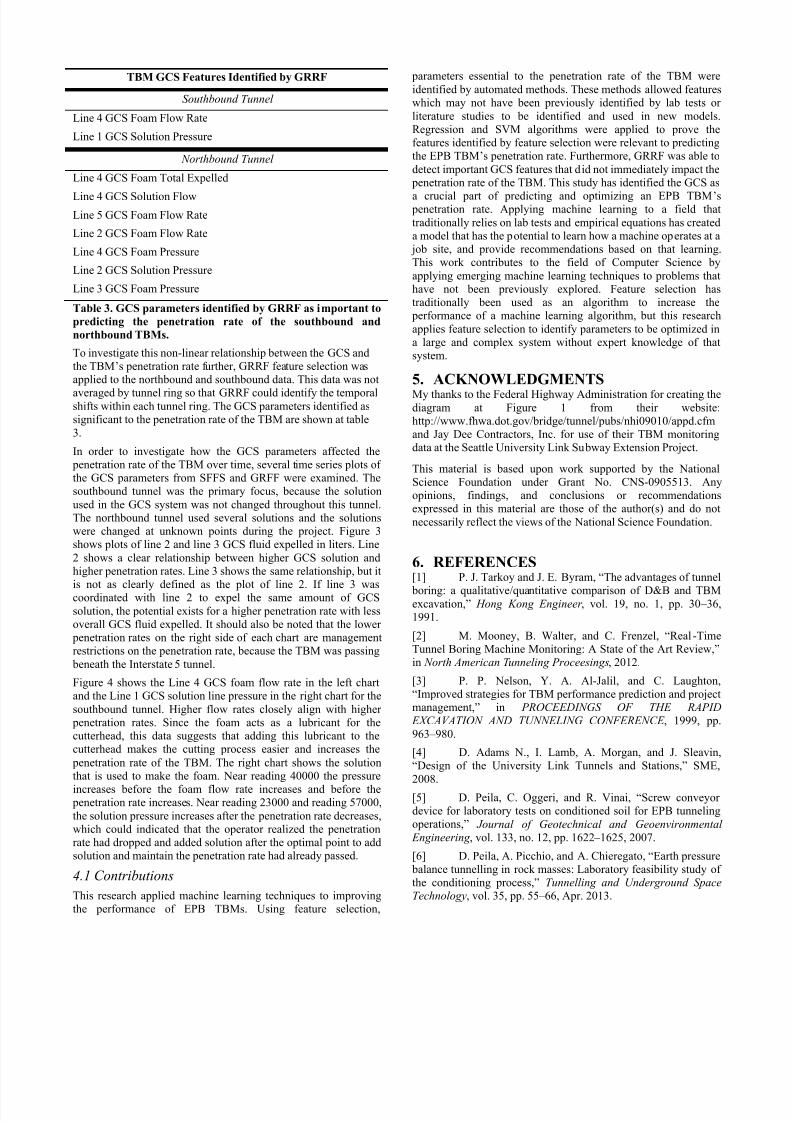
Figure 4. GCS parameters identified by GRRF. GCS Foam Flow Rate in Line 4 (left) and Solution Pressure in Line 1 (right) are
show as colors on the charts, penetration rate is show on the y-axis and the reading number on the x-axis. The left chart shows a
close relationship between increased foam flow and increased penetration rate. The right chart shows a time delayed change in
solution pressure, before and after the penetration rate changes. These changes occur because the human operator makes
adjustments to the GCS flow and pressure rates based on perceived changes in soil conditions.
prediction of the penetration rate on the y-axis. The plotted values
were calculated using 10-fold cross validation, so the predicteddata point was not used as training data when constructing themodel. A line with a slope of 1 is plotted on the scatterplots to
show the ideal scenario in which the model perfectly predicts theobserved data. The results from the multiple linear regressions areshown at figure 2 and table 1. Multiple linear regression resultsare shown because, this method resulted in the best model from
the set of input features identified by SFFS.
Table 1 shows a comparison of the RMSE from the northbound
and southbound tunnels to the RMSE from M. A. Grima, et al.’s,study on 640 hard-rock TBM projects. The RMSE for the northand southbound models is lower than Grima’s study, but thismodel is created for a soft-soil TBM instead of a hard-rock TBM.Also, some of the input features to this study’s model are not
known before starting the project. The models created by themultiple linear regression show an r 2 value of 74.09% in thenorthbound tunnel and 62.81% in the southbound tunnel. Thisindicates that the features identified by SFFS have predictive
capability to the penetration rate of the TBM and should beinvestigated further.
The features identified in table 2 predict the penetration rate of the
TBM, but most of these parameters are dependent variables. Forexample, the belt scale weight measures how much material isremoved as the TBM progresses. This parameter has a linear
relationship with the penetration rate, but it is not a parameter thatcan be adjusted by an operator to increase the penetration rate.From the identified parameters, only the GCS parameters can bemodified by the operator to potentially increase the TBM’s
advance rate.
The GCS parameters, boldfaced in table 2, have small coefficients
in the SFFS feature selection, but are relevant to the EPB TBM’s penetration rate. The GCS does not have a strong linearcorrelation, because there is a time delay between the applicationof GCS solution to the soil and the time when these liquidssaturate the soil. When the soil is saturated to an ideal consistency
it is easier to remove, and the penetration rate increases. Theeffects of TBM penetration rate can be visualized by the charts atfigure 3 and 4. Figure 3 shows parameters identified by SFFS, andfigure 4 shows parameters identified by GRRF in the southbound
tunnel.
0 20000 40000 60000 80000
0
5
1
0
1 5
2 0
2 5
3 0
Line 3 Ground Conditioing System Fluid Expelled (Liters)
Reading Number
A d v a n c e R a t e ( m m / 1 0 s e c )
0
2
4
6
8
10
0 20000 40000 60000 80000
0
5
1 0
1 5
2 0
2 5
3 0
Line 2 Ground Conditioing System Fluid Expelled (Liters)
Reading Number
A d v a n c e R a t e ( m m / 1 0 s e c )
0
5
10
15
20
0 20000 40000 60000 80000
0
5
1 0
1 5
2 0
2 5
3 0
Line 4 GCS Foa m Flow Rate (l/min)
Reading Number
A d v a n c e R a t e ( m m / 1 0 s e c )
0
100
200
300
400
500
0 20000 40000 60000 80000
0
5
1 0
1 5
2 0
2 5
3 0
Line 1 GCS Solution Pressure (bars)
Reading Number
A d v a n c e R a t e ( m m / 1 0 s e c )
0
2
4
6
8
10
8/11/2019 Predicting Penetration Rates JamesMaher
http://slidepdf.com/reader/full/predicting-penetration-rates-jamesmaher 5/6
TBM GCS Features Identified by GRRF
Southbound Tunnel
Line 4 GCS Foam Flow Rate
Line 1 GCS Solution Pressure
Northbound Tunnel
Line 4 GCS Foam Total Expelled
Line 4 GCS Solution Flow
Line 5 GCS Foam Flow Rate
Line 2 GCS Foam Flow Rate
Line 4 GCS Foam Pressure
Line 2 GCS Solution Pressure
Line 3 GCS Foam Pressure
Table 3. GCS parameters identified by GRRF as important to
predicting the penetration rate of the southbound and
northbound TBMs.
To investigate this non-linear relationship between the GCS andthe TBM’s penetration rate further, GRRF feature selection wasapplied to the northbound and southbound data. This data was not
averaged by tunnel ring so that GRRF could identify the temporalshifts within each tunnel ring. The GCS parameters identified assignificant to the penetration rate of the TBM are shown at table
3.
In order to investigate how the GCS parameters affected the penetration rate of the TBM over time, several time series plots ofthe GCS parameters from SFFS and GRFF were examined. Thesouthbound tunnel was the primary focus, because the solution
used in the GCS system was not changed throughout this tunnel.The northbound tunnel used several solutions and the solutionswere changed at unknown points during the project. Figure 3shows plots of line 2 and line 3 GCS fluid expelled in liters. Line
2 shows a clear relationship between higher GCS solution andhigher penetration rates. Line 3 shows the same relationship, but it
is not as clearly defined as the plot of line 2. If line 3 wascoordinated with line 2 to expel the same amount of GCS
solution, the potential exists for a higher penetration rate with lessoverall GCS fluid expelled. It should also be noted that the lower
penetration rates on the right side of each chart are managementrestrictions on the penetration rate, because the TBM was passing
beneath the Interstate 5 tunnel.
Figure 4 shows the Line 4 GCS foam flow rate in the left chartand the Line 1 GCS solution line pressure in the right chart for the
southbound tunnel. Higher flow rates closely align with higher penetration rates. Since the foam acts as a lubricant for thecutterhead, this data suggests that adding this lubricant to thecutterhead makes the cutting process easier and increases the
penetration rate of the TBM. The right chart shows the solutionthat is used to make the foam. Near reading 40000 the pressure
increases before the foam flow rate increases and before the penetration rate increases. Near reading 23000 and reading 57000,
the solution pressure increases after the penetration rate decreases,which could indicated that the operator realized the penetrationrate had dropped and added solution after the optimal point to addsolution and maintain the penetration rate had already passed.
4.1 Contributions
This research applied machine learning techniques to improvingthe performance of EPB TBMs. Using feature selection,
parameters essential to the penetration rate of the TBM were
identified by automated methods. These methods allowed featureswhich may not have been previously identified by lab tests or
literature studies to be identified and used in new models.Regression and SVM algorithms were applied to prove thefeatures identified by feature selection were relevant to predictingthe EPB TBM’s penetration rate. Furthermore, GRRF was able to
detect important GCS features that did not immediately impact the penetration rate of the TBM. This study has identified the GCS as
a crucial part of predicting and optimizing an EPB TBM’s penetration rate. Applying machine learning to a field that
traditionally relies on lab tests and empirical equations has createda model that has the potential to learn how a machine operates at a
job site, and provide recommendations based on that learning.This work contributes to the field of Computer Science by
applying emerging machine learning techniques to problems thathave not been previously explored. Feature selection hastraditionally been used as an algorithm to increase the
performance of a machine learning algorithm, but this research
applies feature selection to identify parameters to be optimized ina large and complex system without expert knowledge of thatsystem.
5. ACKNOWLEDGMENTSMy thanks to the Federal Highway Administration for creating thediagram at Figure 1 from their website:http://www.fhwa.dot.gov/bridge/tunnel/pubs/nhi09010/appd.cfmand Jay Dee Contractors, Inc. for use of their TBM monitoringdata at the Seattle University Link Subway Extension Project.
This material is based upon work supported by the NationalScience Foundation under Grant No. CNS-0905513. Anyopinions, findings, and conclusions or recommendationsexpressed in this material are those of the author(s) and do not
necessarily reflect the views of the National Science Foundation.
6. REFERENCES[1] P. J. Tarkoy and J. E. Byram, “The advantages of tunnel
boring: a qualitative/quantitative comparison of D&B and TBMexcavation,” Hong Kong Engineer , vol. 19, no. 1, pp. 30 – 36,1991.
[2] M. Mooney, B. Walter, and C. Frenzel, “Real-TimeTunnel Boring Machine Monitoring: A State of the Art Review,”in North American Tunneling Proceesings, 2012.
[3] P. P. Nelson, Y. A. Al-Jalil, and C. Laughton,“Improved strategies for TBM performance prediction and projectmanagement,” in PROCEEDINGS OF THE RAPID
EXCAVATION AND TUNNELING CONFERENCE , 1999, pp.
963 – 980.
[4] D. Adams N., I. Lamb, A. Morgan, and J. Sleavin,“Design of the University Link Tunnels and Stations,” SME,
2008.
[5] D. Peila, C. Oggeri, and R. Vinai, “Screw conveyordevice for laboratory tests on conditioned soil for EPB tunnelingoperations,” Journal of Geotechnical and Geoenvironmental
Engineering , vol. 133, no. 12, pp. 1622 – 1625, 2007.
[6] D. Peila, A. Picchio, and A. Chieregato, “Earth pressure balance tunnelling in rock masses: Laboratory feasibility study ofthe conditioning process,” Tunnelling and Underground SpaceTechnology, vol. 35, pp. 55 – 66, Apr. 2013.

8/11/2019 Predicting Penetration Rates JamesMaher
http://slidepdf.com/reader/full/predicting-penetration-rates-jamesmaher 6/6
[7] M. J. Maynar and L. E. Rodríguez, “Discrete numerical
model for analysis of earth pressure balance tunnel excavation,” Journal of geotechnical and geoenvironmental engineering , vol.
131, no. 10, pp. 1234 – 1242, 2005.
[8] Q. M. Gong, J. Zhao, and Y. S. Jiang, “In situ TBM
penetration tests and rock mass boreability analysis in hard rocktunnels,” Tunnelling and Underground Space Technology, vol.22, no. 3, pp. 303 – 316, May 2007.
[9] Q. M. Gong and J. Zhao, “Development of a rock masscharacteristics model for TBM penetration rate prediction,”
International Journal of Rock Mechanics and Mining Sciences,vol. 46, no. 1, pp. 8 – 18, Jan. 2009.
[10] A. Delisio, J. Zhao, and H. H. Einstein, “Analysis and prediction of TBM performance in blocky rock conditions at theLötschberg Base Tunnel,” Tunnelling and Underground Space
Technology, vol. 33, no. 0, pp. 131 – 142, Jan. 2013.
[11] J. Hassanpour, J. Rostami, and J. Zhao, “A new hardrock TBM performance prediction model for project planning,”
Tunnelling and Underground Space Technology, vol. 26, no. 5, pp. 595 – 603, Sep. 2011.
[12] J. Hassanpour, J. Rostami, M. Khamehchiyan, A.Bruland, and H. R. Tavakoli, “TBM performance analysis in
pyroclastic rocks: a case history of Karaj water conveyancetunnel,” Rock Mechanics and Rock Engineering , vol. 43, no. 4,
pp. 427 – 445, 2010.
[13] M. Sapigni, M. Berti, E. Bethaz, A. Busillo, and G.Cardone, “TBM performance estimation using rock mass
classifications,” International Journal of Rock Mechanics and Mining Sciences, vol. 39, no. 6, pp. 771 – 788, Sep. 2002.
[14] S. R. Torabi, H. Shirazi, H. Hajali, and M. Monjezi,
“Study of the influence of geotechnical parameters on the TBM performance in Tehran – Shomal highway project using ANN andSPSS,” Arabian Journal of Geosciences, pp. 1 – 13, 2011.
[15] A. Benardos, “Artificial Intellegence in UndergroundDevelopment: A Study of TBM Performance,” UndergroundSpaces.
[16] M. Alvarez Grima, P. A. Bruines, and P. N. W.
Verhoef, “Modeling tunnel boring machine performance byneuro-fuzzy methods,” Tunnelling and Underground Space
Technology, vol. 15, no. 3, pp. 259 – 269, Jul. 2000.
[17] A. G. Benardos and D. C. Kaliampakos, “Modelling
TBM performance with artificial neural networks,” Tunnellingand Underground Space Technology, vol. 19, no. 6, pp. 597 – 605,
Nov. 2004.
[18] R. Mikaeil, M. Z. Naghadehi, and F. Sereshki,“Multifactorial fuzzy approach to the penetrability classificationof TBM in hard r ock conditions,” Tunnelling and UndergroundSpace Technology, vol. 24, no. 5, pp. 500 – 505, Sep. 2009.
[19] S. Yagiz, C. Gokceoglu, E. Sezer, and S. Iplikci,“Application of two non-linear prediction tools to the estimationof tunnel boring machine performance,” Engineering Applications
of Artificial Intelligence, vol. 22, no. 4 – 5, pp. 808 – 814, Jun. 2009.
[20] S. Yagiz and H. Karahan, “Prediction of hard rock TBM penetration rate using particle swarm optimization,” International
Journal of Rock Mechanics and Mining Sciences, vol. 48, no. 3, pp. 427 – 433, Apr. 2011.
[21] Z. Zhao, “Prediction model of tunnel boring machine performance by ensemble neural networks,” Geomechanics and
Geoengineering: An International Journal , vol. 2, no. 2, pp. 123 – 128, 2007.
[22] H. Deng and G. Runger, “Feature selection viaregularized trees,” in Neural Networks (IJCNN), The 2012
International Joint Conference on, 2012, pp. 1 – 8.
[23] H. Deng and G. Runger, “Gene selection with guided
regularized random forest,” arXiv preprint arXiv:1209.6425,2012.
[24] L. Breiman, “Random forests,” Machine learning , vol.45, no. 1, pp. 5 – 32, 2001.