Embed Size (px)
Citation preview

PREDICTING EXPRESSIVE DYNAMICS IN PIANO PERFORMANCESUSING NEURAL NETWORKS
Sam van HerwaardenAustrian Research Institute for AI
Maarten GrachtenAustrian Research Institute for AI
http://www.ofai.at/˜maarten.grachten
W. Bas de HaasUtrecht [email protected]
ABSTRACT
This paper presents a model for predicting expressiveaccentuation in piano performances with neural networks.Using Restricted Boltzmann Machines (RBMs), featuresare learned from performance data, after which these fea-tures are used to predict performed loudness. Duringfeature learning, data describing more than 6000 musicalpieces is used; when training for prediction, two datasetsare used, both recorded on a Bosendorfer piano (accuratelymeasuring note on- and offset times and velocity values),but describing different compositions performed by differ-ent pianists. The resulting model is tested by predictingnote velocity for unseen performances. Our approach dif-fers from earlier work in a number of ways: (1) an ad-ditional input representation based on a local history ofvelocity values is used, (2) the RBMs are trained to re-sult in a network with sparse activations, (3) network con-nectivity is increased by adding skip-connections, and (4)more data is used for training. These modifications resultin a network performing better than the state-of-the-art onthe same data and more descriptive features, which can beused for rendering performances, or for gaining insight intowhich aspects of a musical piece influence its performance.
1. INTRODUCTION
Music is not performed exactly the way it is described inscore: a performance in which notes occur on a regulartemporal grid and all notes are played equally loud is oftenconsidered dull. Depending on the instrument, perform-ers have different parameters they use for modulating ex-pression in their music [14]: time (timing, tempo), pitch,loudness and timbre. For some of these parameters com-posers add annotations to musical score describing howthey should be varied, but for a large part performers areexpected render the score according to tacit knowledge,and personal judgment. This allows performers to imbueon a performance their personal style, but this is not to saythat music performance is arbitrary—it is often clear which
c© S. van Herwaarden, M. Grachten, W.B. de Haas.Licensed under a Creative Commons Attribution 4.0 International Li-cense (CC BY 4.0). Attribution: Sam van Herwaarden, MaartenGrachten, W. Bas de Haas. “Predicting expressive dynamics in piano per-formances using neural networks”, 15th International Society for MusicInformation Retrieval Conference, 2014.
interpretations are (not) musically appropriate.This article describes a number of modifications to the
method for modeling expressive dynamics proposed byGrachten & Krebs [7], and is based on the MSc thesiswork described in [17]. We show that, with an additionalinput representation and a different set-up of the machinelearning approach, we achieve a statistically significant im-provement on the prediction accuracy achieved in [7], withmore descriptive features. Our achieved performance isalso comparable with the work in [8]. In the following sec-tions we first summarize previous work in this area, fol-lowed by an overview of the used machine learning archi-tecture. We then describe the experiments, the results andthe relevance of the findings.
2. PREVIOUS WORK
Two important aspects of music that affect the way it is tobe performed are the musical structure, and the emotionthat the performance should convey [13]. The last decadesdifferent methods for analyzing the structural properties ofa piece of music have been proposed (e.g. [12, 15]), wherethe analysis tends to stress the relationship between struc-ture on a local level (elements of pitch and rhythm) andtheir effect on the melodic expectancy of a listener. Emo-tional charge conveyed by a piece is more abstract and vari-able: trained musicians can play the same piece conveyingdifferent emotions, and in fact these emotions can be iden-tified by listeners [5].
Because musical structure can be studied through in-spection of the musical score, computational models ofmusical expression tend to focus on this. A number ofdifferent computational models of expression have beendeveloped earlier, studying different expressive parame-ters (e.g. [1, 4]). Many models are rule-based, where therules describing how expression should be applied are of-ten hand-designed. Other models still focus on rules, butautomatically extract them from performance data (e.g. [11,18]). A performance model can also be based on the scoreannotations for the relevant parameter provided by the com-poser, as in [8] which uses information on note pitch, loud-ness annotations and other hand-crafted features.
Some recent studies model regularities in musical se-quences using unsupervised techniques [2, 16], in the con-text of musical sequence prediction. Grachten & Krebs [7]apply unsupervised learning techniques to learn featuresfrom a simple input representation based on a piano roll
15th International Society for Music Information Retrieval Conference (ISMIR 2014)
47
representation of the symbolic score, in the context of pre-dicting musical expression. The resulting learned featuresthen describe common patterns occurring in the input data,which can be related to concepts from music theory andused for prediction of expressive dynamics. By using asimple input representation and network, the model re-mains relatively transparent with regard to its inner work-ings. It is shown that Restricted Boltzmann Machines(RBMs) learn the most effective model, and in this paper,we build on that approach.
An RBM is a type of artificial neural network, particu-larly suitable for unsupervised learning from binary inputdata. During training it learns a set of features that can ef-ficiently encode the input data. The features are used totransform the input data non-linearly, which can be usefulfor further (supervised) learning. For a detailed explana-tion of RBMs the reader is referred to for example [9, 10].
3. ARCHITECTURE
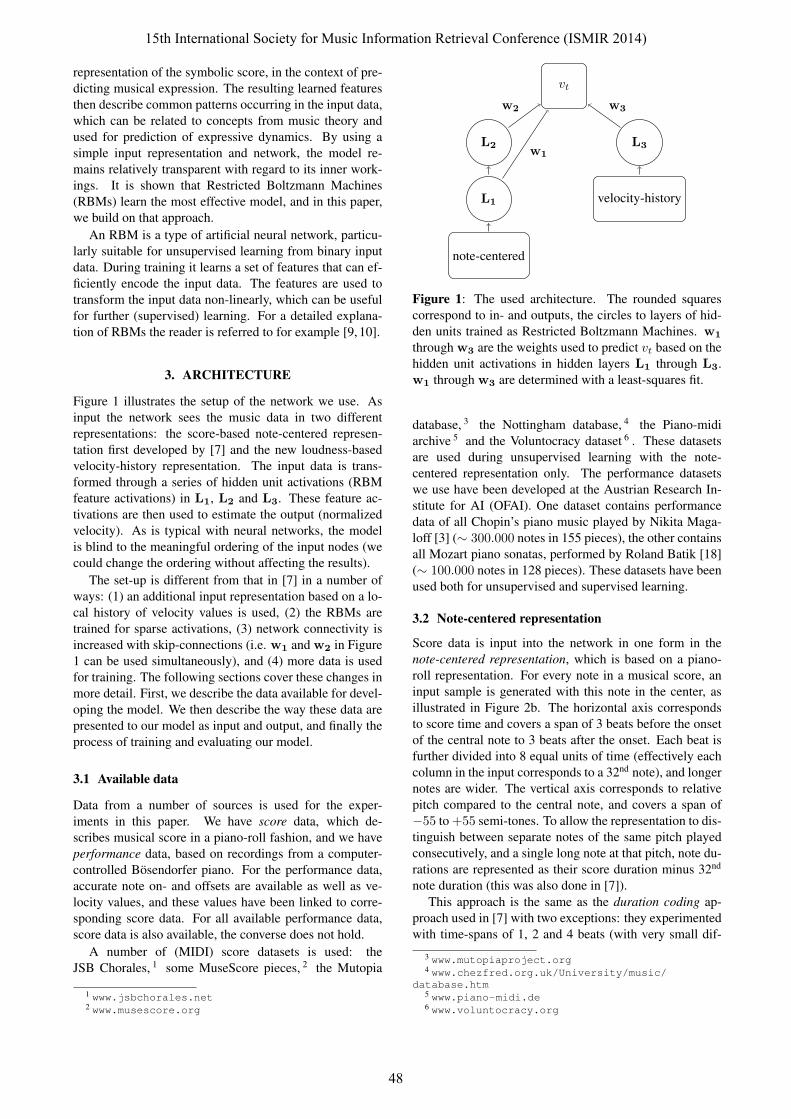
Figure 1 illustrates the setup of the network we use. Asinput the network sees the music data in two differentrepresentations: the score-based note-centered represen-tation first developed by [7] and the new loudness-basedvelocity-history representation. The input data is trans-formed through a series of hidden unit activations (RBMfeature activations) in L1, L2 and L3. These feature ac-tivations are then used to estimate the output (normalizedvelocity). As is typical with neural networks, the modelis blind to the meaningful ordering of the input nodes (wecould change the ordering without affecting the results).
The set-up is different from that in [7] in a number ofways: (1) an additional input representation based on a lo-cal history of velocity values is used, (2) the RBMs aretrained for sparse activations, (3) network connectivity isincreased with skip-connections (i.e. w1 and w2 in Figure1 can be used simultaneously), and (4) more data is usedfor training. The following sections cover these changes inmore detail. First, we describe the data available for devel-oping the model. We then describe the way these data arepresented to our model as input and output, and finally theprocess of training and evaluating our model.
3.1 Available data
Data from a number of sources is used for the exper-iments in this paper. We have score data, which de-scribes musical score in a piano-roll fashion, and we haveperformance data, based on recordings from a computer-controlled Bosendorfer piano. For the performance data,accurate note on- and offsets are available as well as ve-locity values, and these values have been linked to corre-sponding score data. For all available performance data,score data is also available, the converse does not hold.
A number of (MIDI) score datasets is used: theJSB Chorales, 1 some MuseScore pieces, 2 the Mutopia
1 www.jsbchorales.net2 www.musescore.org
velocity-history
note-centered
L3
L1
L2
vt
w1
w2 w3
Figure 1: The used architecture. The rounded squarescorrespond to in- and outputs, the circles to layers of hid-den units trained as Restricted Boltzmann Machines. w1
through w3 are the weights used to predict vt based on thehidden unit activations in hidden layers L1 through L3.w1 through w3 are determined with a least-squares fit.
database, 3 the Nottingham database, 4 the Piano-midiarchive 5 and the Voluntocracy dataset 6 . These datasetsare used during unsupervised learning with the note-centered representation only. The performance datasetswe use have been developed at the Austrian Research In-stitute for AI (OFAI). One dataset contains performancedata of all Chopin’s piano music played by Nikita Maga-loff [3] (∼ 300.000 notes in 155 pieces), the other containsall Mozart piano sonatas, performed by Roland Batik [18](∼ 100.000 notes in 128 pieces). These datasets have beenused both for unsupervised and supervised learning.
3.2 Note-centered representation
Score data is input into the network in one form in thenote-centered representation, which is based on a piano-roll representation. For every note in a musical score, aninput sample is generated with this note in the center, asillustrated in Figure 2b. The horizontal axis correspondsto score time and covers a span of 3 beats before the onsetof the central note to 3 beats after the onset. Each beat isfurther divided into 8 equal units of time (effectively eachcolumn in the input corresponds to a 32nd note), and longernotes are wider. The vertical axis corresponds to relativepitch compared to the central note, and covers a span of−55 to +55 semi-tones. To allow the representation to dis-tinguish between separate notes of the same pitch playedconsecutively, and a single long note at that pitch, note du-rations are represented as their score duration minus 32nd
note duration (this was also done in [7]).This approach is the same as the duration coding ap-
proach used in [7] with two exceptions: they experimentedwith time-spans of 1, 2 and 4 beats (with very small dif-
3 www.mutopiaproject.org4 www.chezfred.org.uk/University/music/
database.htm5 www.piano-midi.de6 www.voluntocracy.org
15th International Society for Music Information Retrieval Conference (ISMIR 2014)
48

(a)(b)
(c)
Figure 2: A short piece of score, and resulting network input for the note indicated by the arrow: (a) shows the score,where the annotations should be interpreted as performed loudness, not as annotated loudness directives, (b) shows thenote-centered representation and (c) the velocity-history representation.
ferences in results between the 2 and 4 beats experiments),and used a pitch range of −87 to +87 semi-tones (so thatalways the entire piano keyboard is covered). In practice,the large pitch range is likely unnecessary and only in-creases the length of the network input vector (note com-binations with such intervals are very rare and do not no-ticeably affect the learned features).
This choice of representation makes our system insen-sitive to absolute pitch: if all input notes are transposed bya few semi-tones in the same direction, the generated in-put samples will be identical. This also allows the systemto learn about harmony based on relative pitch: for exam-ple certain chords will typically be represented in the sameway regardless of their root tone. No additional informa-tion on absolute note pitch was included, to keep the modelsimple.
3.3 Velocity-history representation
When analyzing expressive parameters in existing perfor-mances, it is interesting to not only take into account directharmonic and rhythmic structure around a note as is donewith the note-centered representation, but also effects incontinuity of musical phrases: for example, in many casesnote loudness increases or decreases gradually over a num-ber of notes. The precise accentuation of a note is thanaffected by the accentuation of preceding notes.
Our velocity-history representation is designed to en-code this kind of information. Figure 2c illustrates this rep-resentation. Conceptually, it is similar to the note-centeredrepresentation, with a few differences: the vertical axisnow represents relative velocity (normalized with respectto the mean µ and standard deviation σ of the velocity ina piece, where the range from µ − 2σ to µ + 2σ is quan-tized into 12 discrete values), and the horizontal axis cor-responds to the time preceding the current note (rangingfrom note onset −3 beats to note onset +0).
The velocity-history representation uses informationfrom an actual performance during prediction. In a sense,the system is asked to predict the continuation of a musicalphrase: given that the last notes were played in a certainway, how will the next note be played? When using thisrepresentation, experiments with our model aim to explain
how a note is performed in an existing performance, ratherthan predict it for a new piece of bare score (an actual per-formance needs to be available).
3.4 Velocity normalization
Since we use semi-supervised learning, at some point weneed target values accompanying our input representations.We have exactly one sample for each note, and we arestudying dynamics, so the logical parameter to base thesetarget values on is note velocity. However, the differentpieces described in our data have fairly diverse character-istics when it comes to dynamics. Some pieces are per-formed louder on average, or have stronger variations indynamics. In this study we have chosen to focus on lo-cal effects within a single piece, and not so much on dif-ferences between pieces. For this reason we normalizeour velocity target values so they have zero-mean and unitstandard-deviation within a piece (we use these values bothfor supervised learning and for generating the velocity-history representation). This is slightly different from thenormalization used in [7], where normalization was onlyused to obtain zero-mean within a piece.
3.5 Training and evaluation
The process of developing and testing the network can beseparated into three phases: unsupervised learning, super-vised learning and performance evaluation. We will nowdescribe these in more detail.
3.5.1 Unsupervised learning
During unsupervised learning, we train only hidden layersL1 through L3. The layers are trained as RBMs on the fullset of score data in the note-centered and velocity-historyrepresentations, where L1 and L3 are trained on the inputrepresentations directly, and L2 is trained on the featureactivations in L1.
In the note-centered representation samples consist of5280 binary input values. L1 is trained with 512 hiddenunits (ensuring a significant bottleneck in the network),and L2 contains fewer hidden units again: 200 units. Inthe velocity-history representation samples consist of 288input values, these are encoded in 120 hidden units in L3.
15th International Society for Music Information Retrieval Conference (ISMIR 2014)
49
We enforce sparse coding in the network, using themethod proposed in [6], which allows us to not only con-trol the average activation of hidden units in the network,but also the actual distribution of activations: we can forcethe RBM to represent each sample as a number of highlyactive features, improving inspectability.
3.5.2 Supervised learning
For supervised learning we use a simple approach: giventhe transformation of an input sample by L1 to L3, wefit the hidden unit activations in these layers to the corre-sponding vt (normalized velocity) values using least-squares.Exploratory experiments suggested that more advanced tech-niques do not yield much better results. Thus, w1 throughw3 simply define a linear transformation from the featuresactivations to a prediction of the normalized velocity.
3.5.3 Performance evaluation
To evaluate the performance of our model we use a leave-one-out approach: we cycle through all the pieces in theperformance data, where every time a particular piece isleft out during supervised learning, after which the trainednetwork is used to predict the expressive dynamics of theleft-out piece. The quality of the prediction is then quan-tified using the R2 measure (coefficient of determination).As mentioned before, the full set of data is used duringunsupervised learning – because the objective function op-timized during this phase has no relation to the velocitytargets, we believe that this is an acceptable approach. Asthe final score after cycling through the whole dataset inthis fashion, we use the weighted average R2, where thenumber of notes in a piece is used as its weight.
4. EXPERIMENTS
In our experiments we vary two parameters: network con-nectivity, and training/testing datasets. Other experimentswere also done but are not described in this paper, for thesethe interested reader is referred to [17].
4.1 Network connectivity
Different parts of our model describe information con-cerning different aspects of the input data. The note-centered representation corresponds to rhythmic and har-monic structure of the score surrounding a note, while thevelocity-history representation relates more closely to ex-pressive phrases. This distinction continues through thelayers of feature activations. To get an impression of howstrongly the expressive variation in velocity data corre-sponds to these different aspects, we experimented withthe different layers in isolation and together. We will re-fer to the network configurations by the layers that wereused during training and prediction, i.e. L1,2 means both ofthe layers on top of the note-centered representation wereused, and L3 was not. Another way to see this would bethat w3 is constrained to be a matrix of only 0’s.
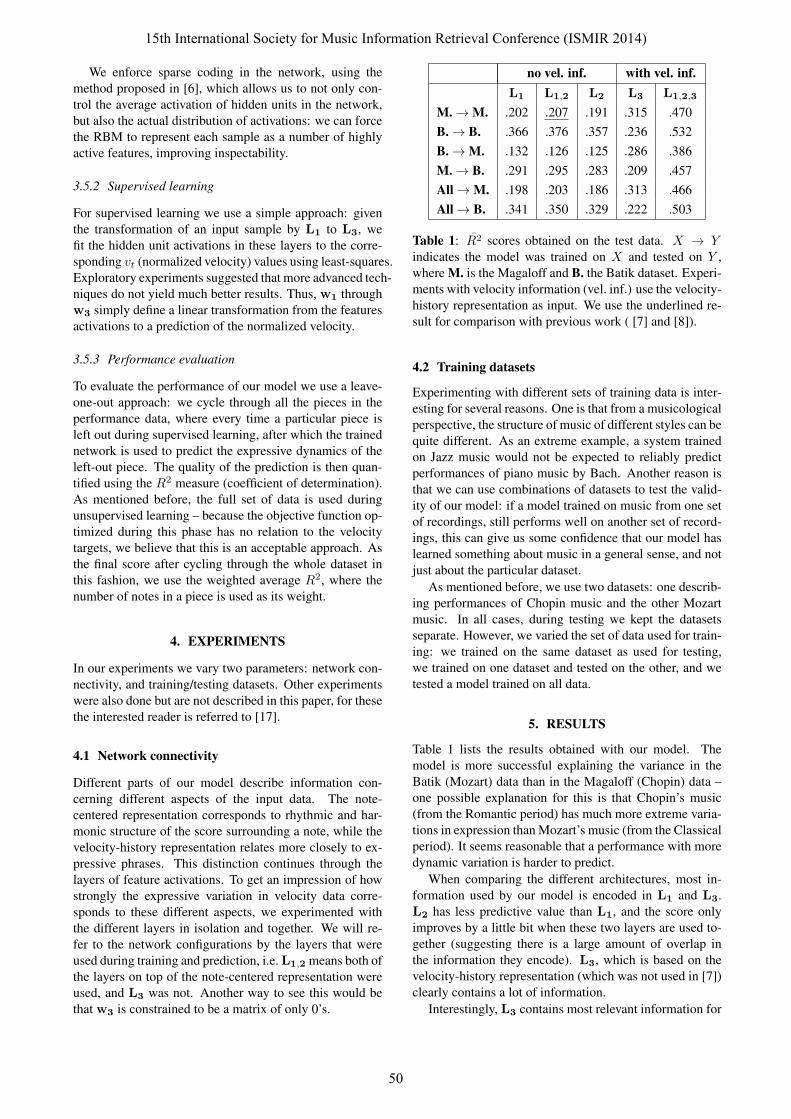
no vel. inf. with vel. inf.L1 L1,2 L2 L3 L1,2,3
M.→M. .202 .207 .191 .315 .470B.→ B. .366 .376 .357 .236 .532B.→M. .132 .126 .125 .286 .386M.→ B. .291 .295 .283 .209 .457All→M. .198 .203 .186 .313 .466All→ B. .341 .350 .329 .222 .503
Table 1: R2 scores obtained on the test data. X → Yindicates the model was trained on X and tested on Y ,where M. is the Magaloff and B. the Batik dataset. Experi-ments with velocity information (vel. inf.) use the velocity-history representation as input. We use the underlined re-sult for comparison with previous work ( [7] and [8]).
4.2 Training datasets
Experimenting with different sets of training data is inter-esting for several reasons. One is that from a musicologicalperspective, the structure of music of different styles can bequite different. As an extreme example, a system trainedon Jazz music would not be expected to reliably predictperformances of piano music by Bach. Another reason isthat we can use combinations of datasets to test the valid-ity of our model: if a model trained on music from one setof recordings, still performs well on another set of record-ings, this can give us some confidence that our model haslearned something about music in a general sense, and notjust about the particular dataset.
As mentioned before, we use two datasets: one describ-ing performances of Chopin music and the other Mozartmusic. In all cases, during testing we kept the datasetsseparate. However, we varied the set of data used for train-ing: we trained on the same dataset as used for testing,we trained on one dataset and tested on the other, and wetested a model trained on all data.
5. RESULTS
Table 1 lists the results obtained with our model. Themodel is more successful explaining the variance in theBatik (Mozart) data than in the Magaloff (Chopin) data –one possible explanation for this is that Chopin’s music(from the Romantic period) has much more extreme varia-tions in expression than Mozart’s music (from the Classicalperiod). It seems reasonable that a performance with moredynamic variation is harder to predict.
When comparing the different architectures, most in-formation used by our model is encoded in L1 and L3.L2 has less predictive value than L1, and the score onlyimproves by a little bit when these two layers are used to-gether (suggesting there is a large amount of overlap inthe information they encode). L3, which is based on thevelocity-history representation (which was not used in [7])clearly contains a lot of information.
Interestingly, L3 contains most relevant information for
15th International Society for Music Information Retrieval Conference (ISMIR 2014)
50

(a) (b) (c) (d) (e)
Figure 3: Some hand-selected features from L1 that are representative for the types of patterns learned from the note-centered representation (see Figure 2b). Dark values correspond to negative weights, light values to positive weights.
the Magaloff data, and L1 for the Batik data. This could bedue to the difference between music from the Romantic pe-riod and that from the Classical period: L1 contains moreinformation about harmony, whereas L3 contains more in-formation about the expressive ‘flow’ of the piece.
Training on a single dataset has a positive effect onthe prediction scores. This is likely due to the fact thatthe datasets are of a different nature in terms of musicalstyle, and if we would want to predict performance param-eters for a Mozart piece, training on Chopin music willnot provide our model with the relevant ‘know-how’. Thisis also illustrated by the cross-training experiments, wherewe trained on one dataset and tested on the other: a drop inperformance of around 0.08 in all cases is observed. Still,also a relatively large amount of the predictive capabilityremains, providing some confidence that our model gener-alizes over different datasets to some extent.
Because the velocity-history representation requires de-tailed performance data for predictions, we use the resultsfrom our L1,2 experiments when comparing our results toearlier work which does not use performance data. In [7]the best obtained R2 score on the Magaloff data is .139,using a single dense RBM layer with 1000 hidden units(similar to our L1 model). Our L1,2 model achieved anR2 of .207 on the same dataset. To keep statistical test-ing simple, we tested the statistical significance of the dif-ference in unweighted average R2 of our model and themodel in [7] using a Wilcoxon signed rank test. We chosethe Wilcoxon test because the underlying distribution oftheR2 data is unknown. We found that the unweighted av-erage R2 of .199 of our L1,2 model is significantly differ-ent from the unweighted average R2 of .121 of the modelin [7] (W = 11111, p < 2.2 · 10−16). In [8], the maximalobtained prediction accuracy on the Magaloff dataset is anR2 of .188. This model uses information our models haveno access to, most importantly dynamic score annotations.Nevertheless, with an R2 of .207 our L1L2 model againseems more successful even though it does not take suchannotations into account. 7 When we do use performance
7 To perform the statistical test, detailed results from [7] were kindlyprovided by the authors. For the work in [8] these results were unfor-tunately unavailable, meaning we could not perform the same statisticalanalysis with this result.
data, the difference becomes more pronounced: our L1,2,3
model obtains an R2 of .470 on the Magaloff data.Something interesting to mention here is that in [17] we
also experimented with limiting training data to a particu-lar genre (i.e. training only on Nocturnes). These exper-iments suggested that the velocity-history representationencodes some genre-specific information, however due tospace constraints we do not cover these results further here.
6. DISCUSSION
We discuss two properties of our model: the features thatwere learned from the musical data, and the performanceachieved during prediction. Figure 3 illustrates a numberof hand-selected features that have been learned from thenote-centered representation, which were chosen to give animpression of the variety of learned features. Comparedto the features learned by [7], there is a larger variety offeatures, where features represent sharper patterns.
6.1 Learned features
Figure 3 illustrates some of the learned features. The dis-played features were selected so as to give the reader animpression of the diversity of the learned features . From amusicological perspective, it is interesting to see that thereseem to be some remarkable patterns relating the featuresto music theory. The features learned from the velocity-history representation are harder to interpret musicologi-cally, these are not further discussed in this paper.
Figure 3a shows clear horizontal banding, where inter-estingly the bands are exactly 12 rows apart – this corre-sponds to octaves. The feature in some locations displays astrong contrast between pitches one semi-tone apart, whichis related to dissonance.
A common pattern is illustrated in Figure 3b, with adark (inhibitive) band above or below a lighter region. Thistype of feature is also described by Grachten & Krebs [7],who argue this can be regarded as an accompaniment ver-sus melody detector: the illustrated feature is strongly in-hibited by notes in a sample that are below the central note,meaning that the feature activates more readily for bassnotes. The opposite type of feature, with inhibitive regionsabove and excitatory regions below the central note (not
15th International Society for Music Information Retrieval Conference (ISMIR 2014)
51
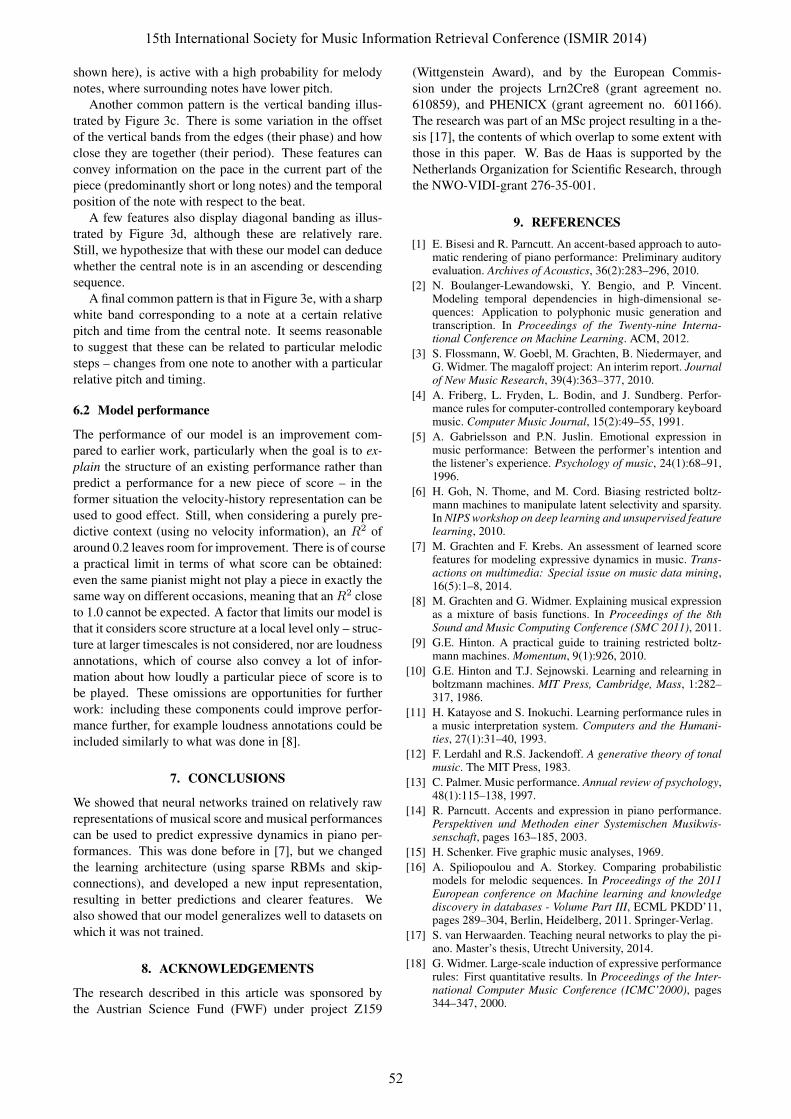
shown here), is active with a high probability for melodynotes, where surrounding notes have lower pitch.
Another common pattern is the vertical banding illus-trated by Figure 3c. There is some variation in the offsetof the vertical bands from the edges (their phase) and howclose they are together (their period). These features canconvey information on the pace in the current part of thepiece (predominantly short or long notes) and the temporalposition of the note with respect to the beat.
A few features also display diagonal banding as illus-trated by Figure 3d, although these are relatively rare.Still, we hypothesize that with these our model can deducewhether the central note is in an ascending or descendingsequence.
A final common pattern is that in Figure 3e, with a sharpwhite band corresponding to a note at a certain relativepitch and time from the central note. It seems reasonableto suggest that these can be related to particular melodicsteps – changes from one note to another with a particularrelative pitch and timing.
6.2 Model performance
The performance of our model is an improvement com-pared to earlier work, particularly when the goal is to ex-plain the structure of an existing performance rather thanpredict a performance for a new piece of score – in theformer situation the velocity-history representation can beused to good effect. Still, when considering a purely pre-dictive context (using no velocity information), an R2 ofaround 0.2 leaves room for improvement. There is of coursea practical limit in terms of what score can be obtained:even the same pianist might not play a piece in exactly thesame way on different occasions, meaning that anR2 closeto 1.0 cannot be expected. A factor that limits our model isthat it considers score structure at a local level only – struc-ture at larger timescales is not considered, nor are loudnessannotations, which of course also convey a lot of infor-mation about how loudly a particular piece of score is tobe played. These omissions are opportunities for furtherwork: including these components could improve perfor-mance further, for example loudness annotations could beincluded similarly to what was done in [8].
7. CONCLUSIONS
We showed that neural networks trained on relatively rawrepresentations of musical score and musical performancescan be used to predict expressive dynamics in piano per-formances. This was done before in [7], but we changedthe learning architecture (using sparse RBMs and skip-connections), and developed a new input representation,resulting in better predictions and clearer features. Wealso showed that our model generalizes well to datasets onwhich it was not trained.
8. ACKNOWLEDGEMENTS
The research described in this article was sponsored bythe Austrian Science Fund (FWF) under project Z159
(Wittgenstein Award), and by the European Commis-sion under the projects Lrn2Cre8 (grant agreement no.610859), and PHENICX (grant agreement no. 601166).The research was part of an MSc project resulting in a the-sis [17], the contents of which overlap to some extent withthose in this paper. W. Bas de Haas is supported by theNetherlands Organization for Scientific Research, throughthe NWO-VIDI-grant 276-35-001.
9. REFERENCES[1] E. Bisesi and R. Parncutt. An accent-based approach to auto-
matic rendering of piano performance: Preliminary auditoryevaluation. Archives of Acoustics, 36(2):283–296, 2010.
[2] N. Boulanger-Lewandowski, Y. Bengio, and P. Vincent.Modeling temporal dependencies in high-dimensional se-quences: Application to polyphonic music generation andtranscription. In Proceedings of the Twenty-nine Interna-tional Conference on Machine Learning. ACM, 2012.
[3] S. Flossmann, W. Goebl, M. Grachten, B. Niedermayer, andG. Widmer. The magaloff project: An interim report. Journalof New Music Research, 39(4):363–377, 2010.
[4] A. Friberg, L. Fryden, L. Bodin, and J. Sundberg. Perfor-mance rules for computer-controlled contemporary keyboardmusic. Computer Music Journal, 15(2):49–55, 1991.
[5] A. Gabrielsson and P.N. Juslin. Emotional expression inmusic performance: Between the performer’s intention andthe listener’s experience. Psychology of music, 24(1):68–91,1996.
[6] H. Goh, N. Thome, and M. Cord. Biasing restricted boltz-mann machines to manipulate latent selectivity and sparsity.In NIPS workshop on deep learning and unsupervised featurelearning, 2010.
[7] M. Grachten and F. Krebs. An assessment of learned scorefeatures for modeling expressive dynamics in music. Trans-actions on multimedia: Special issue on music data mining,16(5):1–8, 2014.
[8] M. Grachten and G. Widmer. Explaining musical expressionas a mixture of basis functions. In Proceedings of the 8thSound and Music Computing Conference (SMC 2011), 2011.
[9] G.E. Hinton. A practical guide to training restricted boltz-mann machines. Momentum, 9(1):926, 2010.
[10] G.E. Hinton and T.J. Sejnowski. Learning and relearning inboltzmann machines. MIT Press, Cambridge, Mass, 1:282–317, 1986.
[11] H. Katayose and S. Inokuchi. Learning performance rules ina music interpretation system. Computers and the Humani-ties, 27(1):31–40, 1993.
[12] F. Lerdahl and R.S. Jackendoff. A generative theory of tonalmusic. The MIT Press, 1983.
[13] C. Palmer. Music performance. Annual review of psychology,48(1):115–138, 1997.
[14] R. Parncutt. Accents and expression in piano performance.Perspektiven und Methoden einer Systemischen Musikwis-senschaft, pages 163–185, 2003.
[15] H. Schenker. Five graphic music analyses, 1969.[16] A. Spiliopoulou and A. Storkey. Comparing probabilistic
models for melodic sequences. In Proceedings of the 2011European conference on Machine learning and knowledgediscovery in databases - Volume Part III, ECML PKDD’11,pages 289–304, Berlin, Heidelberg, 2011. Springer-Verlag.
[17] S. van Herwaarden. Teaching neural networks to play the pi-ano. Master’s thesis, Utrecht University, 2014.
[18] G. Widmer. Large-scale induction of expressive performancerules: First quantitative results. In Proceedings of the Inter-national Computer Music Conference (ICMC’2000), pages344–347, 2000.
15th International Society for Music Information Retrieval Conference (ISMIR 2014)
52