Embed Size (px)
Citation preview

Pergamon Minerals Engineering, Vol. !1, No. I1, pp. 1061-1080, 1998
© 1998 Elsevier Science Ltd All rights wa~'ved
0 ~ 9 ~ . 6 8 7 ~ ( 9 8 ) 0 0 0 9 3 - . 4 0892-6875/98/$ - - see front matter
PREDICTING CHARGE MOTION, POWER DRAW, SEGREGATION AND WEAR IN BALL MILLS USING DISCRETE ELEMENT METHODS
P.W. CLEARY
CSIRO Division of Mathematical and Information Sciences, Private Bag 10, Clayton South MDC, Clayton, Vic, 3169, Australia. E.mail: [email protected]
(Received 10 April 1998; accepted 16 July 1998)
ABSTRACT
Discrete element modelling (DEM) of particle flows inside ball mills involves following the trajectories and spins of all the particles and objects in the system and predicting their interactions with other particles and with the mill. It is necessary to simulate particles of many different sizes and densities interacting with complex shaped lifters and liner. The key ingredients are a fast and robust algorithm to predict collisions, a good collision model wut an efficient and powerful method for describing the mill.
Particle j~ows in a 5 m diameter ball mill are presentecL The charge behaviour, torque and power draw are analysed for a range of rotation rates from 50 to 130% of the critical spee~ Sensitivity of the results to the choice of friction and restitution coefficients and to the particle size distribution are examined. Segregation is an important issue in rotating mills. Size segregation of steel balls and size separation of small rocks from the larger bails are examined. Predictions of liner wear rates and distributions are made. Evolution of the liner profile can be modelled in order to predict the lifter life cycle and its effect on the mill operation. Collisional force distributions can be used as indicators of breakage and attrition. Such quantitative predictions, once validated, can be used as part of a program to optimise mill design and operation. © 1998 Elsevier Science Ltd. All rights reserved
Keywords Modelling; simulation; grinding; comminution; process optimisation
I N T R O D U C T I O N
Particle breakage is an essential component of mineral processing and is important in other industry sectors. The aim is to efficiently reduce the particle sizes from those supplied to the much smaller ones required for further processing, producing maximum mill throughput at mininum operating cost. Such milling processes typically use only 1 to 5% of the supplied energy for particle breakage. Opportunities exist to improve the performance and control of such mills.
Presented at Comminution '98, Brisbane, Australia, February 1998
1061

1062 P.w. Cleary
Ball mills are a common comminution device in the mineral processing and quarrying industries, consisting of a rotating cylinder up to 5 m in diameter and typically having a length greater than this. The rock generally comes from a crusher or perhaps a semi-autogenous (SAG) mill (depending on the design of the milling circuit) and is fed into one end of the mill. Grinding media consisting of steel balls, with typical diameters from 50 to 200 mm, are already present in the mill along with rock that is still too large to pass out through the extraction grate at the opposite end. Particles migrate slowly along the length of the mill while circulating rapidly in the plane orthogonal to the mill axis. The radial and azimuthal particle motion is assisted by regularly lifter bars attached to the mill shell. Replaceable liner plates are bolted to the shell between the lifters to the reduce wear in this hostile environment.
A typical 5 m diameter ball mill consumes around 3 to 4 MW of power and has a very low energy efficiency. Significant economic and environmental benefits can be obtained by improving the efficiency even modestly. There are also large costs involved in replacing the liners (commonly made from expensive wear resistant cast molybdenum stainless steels) arising both from the liner replacement cost and from lost production. Further benefits can be obtained through higher downstream recoveries if the exit particle size distributions can be made closer to the optimum for the subsequent flotation processes.
DEM modelling is now well established and are described in review articles by Campbell [1], Barker [2] and Walton [3]. It has been used successfully over the past decade in modelling geophysical applications, (such as landslides [4,5] and ice flows [6]) and industrial applications [7,8,9,10,13,14].
Simulation of ball, SAG, AG, pebble, tower and many other types of mills by discrete element methods offers enormous prospects for improving the efficiency and productivity of these comminution processes. In this paper we report the results of extensive DEM simulations of ball mills. This builds on earlier work by Mishra and Rajamani [7,8,9]. Comparison of the charge behaviour predicted by our DEM model for centrifugal mills [10] with high speed photographs [11] demonstrates high accuracy and leads us to expect that the simulation results presented here for ball mills are also reasonable.
Mills are one of the more difficult applications to model using DEM because of the scale of the mill, the huge numbers of particles present in the mill, the presence of water (which we currently neglec0 and the timescales involved in the comminution processes. Directly modelling the actual particle size reduction by attrition and breakage is an even greater challenge.
Visualisation of charge motion is important in understanding these complex flows. However, the detailed information available in DEM simulations also allows a wide range of useful quantitative predictions to be made. These include estimates of wear rates and distributions, collisional force and work distributions, dynamic loads on boundaries, power consumption, torques and flow rates. In addition, mixing and separation rates can be calculated. Such tools, once validated, allow existing equipment to be analysed in detail and the enhanced understanding can then be used to help improve them.
THE DISCRETE ELEMENT METHOD
In discrete element simulations collisional interactions of all particles with each other and with their environment are modelled. Equations of motion are solved for the objects with which the particlas interact. For mills it is important to be able to model the complex boundary geometry of the liner, including the lifters. In our two dimensional code, boundary objects are constructed from s e ~ c n ~ which can be line segments, circular segments or discs, Unlike earlier modelling efforts, nearly arbitrary shaped two dimensional mill cross sections can be constructed, ~ i t r a r y rigid body ~ d surf~e motions can also be
2
specified.
Our particles are modelled as either discs or super-quarries whose general form:

Predictions for ball mills using discrete element methods 1063
(1)
is used to describe non-circular particles, where the power n determines the sharpness or blockiness of the particle (with the shape smoothly changing from a circle to a square as n increases) and A is the aspect ratio of the particle with semi-major axis s, (note that this is not the radius of the particle). Aspect ratios of up to 10:1 and sharpnesses of up to 20 can be used. These shapes are able to capture many of the essential elements of real particle shape and greatly extend the range of applicability of the DEM.
The particles are set up as groups with any number of independent groups of particles specifiable. Each can be made from mullaple independent subgroups, whose diameters, densities, aspect ratios, sharpnesses and material properties can be independently specified according to selected probability distributions. Generally these are constant, uniformly distributed or normally distributed, but other more specialised ones such as Rosin and Rambler can be used. Packed particle microstructures are built by filling user-specified polygons with these particle.,;. The simulation code takes these input data, (generated by a graphical pre-processor) and performs the rq~luired simulation collecting output data that is appropriate for the application.
The DEM variant used here is sometimes called a 'soft particle method'. The particles are allowed to overlap and the amount of overlap Ax, and normal v n and tangential v t relative velocities determine the collisional forces, qlaere are a range of possible contact force models available that approximate the collision dynamics to various extents. A conventional linear spring-dashpot model is used in these simulations. Other more complex forms are available (see [3,12] for more details). Figure 1 shows diagramatically the collisional force model used here. The normal force:
F -" - k, Ax÷ C~v, (2)
consists of a sprinl~ to provide the repulsive force and a dashpot to dissipate a proportion of the relative kinetic energy. The maximum overlap between particles is determined by the stiffness k of the spring in the normal direction. Typically average overlaps of 0.1-1.0% are desirable, requiring spring constants of the order of 106 to 101 N/re. The normal damping coefficient C n is chosen to give a required coefficient of restitution ~ (defined as the ratio of the post-collisional to pre-collisional normal component of the relative velocity):
where
T'- - - - - , I n ( E ) and mu-- m% I ~2÷ ln2(~) mi÷ rr~
is the reduced mass of particles i and j with masses m s and m j respectively. This arises from the analytic solution of the normal collision equation (2) for two such particles. Each particle can have a different coefficient of restilution (and corresponding damping constant), but we generally use the same value for all the particles because the variations in ¢ are unquantified. The tangential fon'e is given by:
where the integral of the tangential velocity v t over the collision behaves as an incremental spring that stores

1064 p.W. Cleary
energy from the relative tangential motions and represents the elastic tangential deformation of the contacting surfaces. The dashpot dissipates energy from the tangential motion and models the tangential plastic deformation of the contact. The total tangential force (given by the sum of the elastic and plastic components) is limited by the Coulomb frictional limit at which point the surface contact shears and the particles begin to slide over each other.
Ax is the particle overlap, k n and k t are the normal and tangential spring constants, v n and v t are the normal and tangential velocities, C n and C t are the normal and tangential damping coeffs /~ is the friction coefficient
Normal Force F n ffi -knAx + CnVn
Tangential Force F t =min(/~F n , k t ~ vtdt + Ctv t )
Fig.1 The contact force model involves a spring and a dashpot in the normal direction and an incrementing spring and dashpot limited by the sliding friction in the tangential direction.
The contact force model requires both the coefficient of elasticity and friction for the particles to be supplied. Such quantities are in practice very difficult to obtain experimentally and vary from particle to particle and during the flow. This partially follows from the variability of real materials and because these model parameters are not themselves really true reflections of reality, but are highly idealised. The development of better contact force models that reflect this and whose parameters can be measured robustly is an important element of further improving the predictive power of discrete element modelling.
The discrete element algorithm itself is relatively simple with three essential parts:
A search grid is used to periodically build a particle near-neighbour interaction list. The boundary objects appear as virtual particles. Using only particle pairs in the near neighbour list reduces the force calculation to an O(N) operation, where N is the total number of particles. Some mechanism such as this is essential for using realistic numbers of particles (presently up to 80,000).
The collisional forces on each of the particles and boundary objects are evaluated efficiently using the near-neighbour list and the spring-dashpot interaction model (shown in Figure 1) and then transformed into the simulation frame of reference.
All the forces on each of the objects and particles are summed and the resulting equations of motion are integrated:
.~,--u,, ti,-- ~ F#,g (4) J
0,: co: (5) J
where xi, u i and Fij are the position, velocity and collisional forces on particle i, and 0 i and ~i are the particle orientation and spin produced by the moments Mij. Here g is the gravity vector.

Predictions for ball mills using discrete element methods 1065
The integration scheme is a second order predictor-corrector. Between 20 and 50 timesteps are required to accurately integrate each collision. This necessitates very small timesteps (typically 10 -3 to 10 .6 s depending on the controlling le, ngth and time scales of each problem). If the integration is accurate then the coefficient of restitution from which the damping coefficient was chosen should be recovered. The integration timestep is given by:
/ where Urea x is the maximum particle velocity, drain is the smallest panicle diameter and n s is the number of timesteps betweam searches.
DATA COLLECTION
Granular flows c~ua be analysed with visualisation and data processing tools to provide quantitative predictions about wear rates and distributions, collision forces, dynamic loads on boundaries, power consumption, torques and flow rates, sampling statistics, mixing and segregation rates. This requires the disordered particle data to be collected in bins, possibly smoothed and then displayed in an informative way.
Bins and smooMtg
In such DEM simulations, the positions, velocities, orientations and spins of all the particles and the collisional forces me known at all times. The estimation of variables from disordered data requires the data to be collected into bins. This is a difficult task for an genial object oriented code where the binning strategy must work for all complex objects. Such a system has been implemented for our code.
Two types of data are collected:
One dimensional data along the surfaces of objects. This includes normal, tangential and total boundary forces. They allow prediction of wear rates,, wear distributions and dynamic particle pressures on boundaries. The surfaces of each object are subdivided into sequences of equal sized bins. Each object segment can have its own sequence of bins or a sequence can follow the edges of several segments depending on needs. Information about each collision is stored in the appropriate bin. Figure 2 shows a typical set of bins for pan of the liner of a ball mill.
Two dimensional data about forces, average velocities and spin, velocity correlations (equivalent to Reynolds stresses) and granular temperature within the flowing granular material. These can be used for a range of purposes including estimation of the grinding efficiency of comminution devices. 1he desired rectangular region is subdivided into square bins that move and rotate with the specified reference object.
Fig.2 The bin sequences for data collection around the lifter bars in a ball mill.
A major problem with any form of binned data from discrete element simulations is its tendency to be very spiky. This arises from the discrete nature of the particles. The spikes can be removed by appropriate

1066 P.w. Cleary
smoothing. We use a Demmler-Reinsh formulation of the cubic spline smoothing algorithm. The amount of smoothing is controlled by a smoothing parameter, which determines the balance between exact curve fitting and the smoothing. The length scale of the spikeness is determined by the size of the largest particle dma x. The smoothing parameter is chosen to remove more than 90% of variation whose length scales are less than this. Smoothing is applied independently to each bin sequence, since it is not appropriate to smooth data around sharp comers. Details of the binning and smoothing can be found in Cleary [13].
Measuring segregation
Flowing granular materials undergo segregation and it is useful to be able to measure it. The distribution of local averages of particle size, mass or density characterise the spatial variation of the particle composition from the average. The amount of segregation of a granular material can be measured by the coefficient of variation of this distribution. Comparing this to the values occurring for perfectly mixed and perfectly segregated materials allows the mixing state to be described by a single parameter in the range of 0 to 1. Its time variation is then a measure of the segregation rate. This method does not rely on trying to correlate the mixing state with any spatial dimension. More details of this method and examples are given in [14].
Wear prediction
Wear predictions can be made from the collisional data collected in the object bins using the Finnie model [15, 16]. This uses particle impact speeds and material hardnesses to estimate the wear produced by each impact. The Finnie model contains a parameter c which is the fraction of particles cutting in an idealised manner. On average this is the proportion of kinetic energy that goes into producing wear. This value needs to be determined experimentally for each application and is unknown in this case. Our best estimate found by comparing anecdotal wear rates with our predictions for ball mill lifters is around 0.1.
CHARGE MOTION IN A 5 m BALL MILL
In this paper we concentrate on the behaviour and performance of a 5 m diameter ball mill with 23 symmetrically placed lifter bars rotating clockwise at various fractions N of the critical speed of 19.5 rpm at which the particles begin to centrifuge. The solids loading used throughout most of these simulations is 50%. This ball mill rotates with constant speed. The torque required and energy consumption of the mill can then be predicted. Alternatively a constant torque could be applied and the subsequent motion predicted. The effects of the inertia of the mill itself can also be included and will strongly smooth the highly fluctuating instantaneous torque and power.
Ball motion
To begin, we consider a charge that consists only of the steel balls, of which 5% by number are 200 mm diameter and the rest are 100 and 75 mm with 47.5% of each by number. They have a coefficient of restitution of E = 0.3 and friction of tt = 0.75.
The location of the charge in the mill is shown in Figure 3 for various mills speed. For N = 60% the bulk of the charge lies in the lower left half of the mill and its motion is relatively gentle. Balls rotate from the toe position (at about 4 o'clock) up to the shoulder around 10 o'clock. The charge fluidises here and cascades down along the free surface to the toe. There is very little cataracti~g (ballistic) material.
For N = 80% (Figure 3b), much of the charge fluidises above the center of the mill and the free surface develops the bi-linear shape characteristic of high rotation rate mills. A moderate amount of cataracting material now impacts on the liner to the right and on the charge in the toe region. As the mill rotation increases the charge becomes progressively more out of balance, requiring i ~ n g torque to support it and increasing the power consumption.

Predictions for ball mills using discrete element methods 1067
For N = 100% (Figure 3c), particles begin to centrifuge and can be seen trapped between the lifters. Much of the core of the charge is now cataracting. Mills are generally run sub-critical (N < 100%) because little grinding can be acMeved with the centrifuged material and significant lifter wear is produced by the cataracting material. For N > 120% the thickness of the centrifuged layer exceeds the height of the lifters.
Fig.3 Motion predicted when just the balls are modelled for: a ) N = 60%, b)N = 80%, c) N = 100% and d) N = 12q:~b.
Ball and rock mol~ion
The bulk of the charge in a mill is really rock of various sizes with a smaller proportion of steel balls. Adding rock partic]Les with a plausible size distribution introduces a number of changes to the flow. Figure 4 shows typical pA,rticle positions for a charge consisting of:
Steel balls with diameter uniformly distributed between 50 mm and 200 mm, and
Rock with diameter uniformly.distributed between 5 mm and 50 mm with ten times more rock panicles tl~an steel balls.

1068 P.w. Cleary
Otherwise all the other simulation parameters and the mill geometry are as before. The particles are shaded according to their size with the smallest particles being the darkest.
Comparing these to Figure 3 we find important changes. In all cases the surface of the charge is much more sharply defined. The smaller rocks allow much more detail to be distinguished. At N = 60% the charge profile has changed from being almost linear to being sharply bi-linear with quite different slopes leading to the toe and the shoulder.
(b
(dl
Fig.4 Motion predicted when the charge consists of rocks and balls for: a) N = 60%, b) N = 70%, c) N = 80% and d) N = 90%.
At N = 80% the charge profile is again sharper, the toe location is higher and the angular difference between the two parts of the bi-linear profile is larger. There is now also quite clear definition and structure in the cataracting material. It is not randomly distributed throughout the upper part of the mill, but falls in fairly well defined bands.-Each band is slightly curved, is almost vertical but tipped to the right a bit at the top and leads to the front face of one of the lifters above. As each lifter leaves the shoulder region it acts as a filled bucket. As the lifter rises and its angle changes, the particles inside gradually pour out with the last particles departing as the lifter reaches the vertical. Each ban d corresponds to the material that poured from the space in front of the lifter to which it leads. The impacts of eataracting material with the charge and mill liner in the toe region are therefore not continuous in time, but are bunched together and produce a cyclic variation in the impact forces in this region. For some rotation rates, spectral analysis of the instantaneous

Predictions for ball mills using discrete element methods 1069
power draw detects a signal with a frequency given by the product of the mill frequency and the number of lifters which corresponds to the one that such cyclic impacts would produce.
For N = 90% the changes produced by adding the rock are similar. We also observe that the fluidisation of the charge in the upper half of the charge is greatly reduced. Overall, the introduction of the rocks into the charge have had a reasonably strong effect on the flow pattern and the charge distribution in the mill.
POWER DRAW AND TORQUE
The torque required to maintain a constant speed and the power consumption of the mill can be predicted. Figure 5a shows the instantaneous power draw of the mill shown in Figure 3 for three minutes of operation at N = 80%. The running average of the power is shown by the grey line. The average power is 3 × 10⁵ W per meter of mill length. This gives a total power draw for a typical 7 m mill of 2.1 MW. This compares well with a typical lrnotor power of 3.3MW. Superimposed on this average power draw are irregular high frequency fluctuations of 130% of the mean, reflecting the highly impulsive and unsteady flow of the charge. Figure 5b shows the variation of the torque and power with mill speed. The torque increases slowly until the peak is attained for N = 80%. As the amount of eataracting and then centrifuging increases, the balance of the charge improves and the torque required to maintain the asymmetric charge position drops steadily. The power (the product of the torque and the mill speed) consequently has a much rounder peak centered on N = 90% before dropping sharply above 105%.
(a)
t~ 0
v
0 O-
0
(b)
0
0 13.
I I I I
J
0 50 1 O0 150 60 80 1 O0 120
Time (s) Mill Rotation (~ critical)
Fig.5 a) Power draw for N = 80% and b) Average torque and power for several speeds.
The material parameters e and p and particle size distribution for the rock vary between mines and within mines and are also likely to be modified by the presence of water in the mill. It is therefore important to understand the effect of variability in the material parameters on the mill performance. Figure 6 shows the power draw versus mill speed for a range of material properties and particle sizes. The base ease with
= 0.3 and p = 0.75 is shown by the circles and is the one shown in the previous Figure. Increasing the coefficient of restitution to 0.5 has only a modest effect on the power draw curve. At low speeds N < 75% there is little change at all. For the intermediate speeds (in which the mills are most commonly operated) and high speeds there is a reduction in power consumption of between 2 and 6%. Increasing E to 0.8 causes an even smaller reduction in the power draw.
This shows that a change in restitution coefficient from 0.3 to 0.5, which reduces the energy dissipation per collision from 91% to 75% produces a much smaller reduction in the overall power consumption. This may seem surprising but is easily explained by realising that in all the non-cataracting part of the mill the

1070 P . W . Clea ry
particles are densely packed and that particles undergo a very rapid series of collisions (on a millisecond timescale) with their neighbours. It matters little to the overall flow whether 2, 3 or 4 collisions in rapid sequence are required to dissipate any relative motion between the particles. All the relative motion is dissipated much faster than any timescale for macroscopic movement of the charge mass to occur. For the cataracting material this is not true. These particles are more sparsely spaced and can move reasonable distances between collisions. For N <_ 75% there is little cataracting material so the power draws are effectively independent of s. For higher rotation rates the amount of cataracting material (for which the power consumption is sensitive to s) is a small proportion of the total charge. This does lead to a reduction in power draw for the less dissipative materials but proportionally less than one may have estimated based on the energy losses for one collision.
~ " c,J
2
~ 0
0
E
0 t'-"
o 13..
, ¢
(a)
Fig.6
, , , , ~
o
E g
A f ' o - e--0.8, mu=0.75 , # / + - e=0.3, muffiO.25
, - e=0.8, muffiO.25 ~ '¢ I J .
= I , I , I , I
60 80 1 O0 120
Mill Rotation (% critical) (b)
| I I I
A - Continuous b o l l s
60 80 1 O0 120
Mill Rotation (~ critical)
a) power draw for 50% fill for different values of ~ and IJ and b) power draw for 50% fill with different particle size distributions.
For the fast super-critical mill speeds N > 100% the power consumption actually rises slightly with increasing restitution coefficient. For these speeds there is a solid centrifuged layer around the entire perimeter of the shell. The strength and stability of the inner part of the centrifuged layer depends on e. For very dissipative particles all the energy of relative motion is dissipated and they are firmly bound. As the particles become less dissipative they become more mobile and are able to move further from the shell in the upper right region and the charge becomes more asymmetric. The power consumption is the power that is required to maintain this unbalanced state. So as the centrifuged layer becomes more mobile with increasing e so the power consumption rises.
One intriguing observation is that for s = 0.3 the power draw curve was found to be sensitive to the precise set of particles used, even when they were generated using the same probability distributions. Three different sets of particles were used and variations of up to 10% were found. These differences changed erratically from one mill speed to the next. This behaviour was not observed for any of the higher values of s or other values of ~. It was only observed for very inelastic particles. It is quite unclear why the power draw in this case should be so sensitive to the details of the set of particles.
Reducing the friction coefficient to 0.25 (a reasonable value considering the lubricating effects of the interstitial fluid), we again find only a small change in the power draw below 75% of the critical speed. Again one may have expected that a large decrease in the friction may have significantly decreased the power draw, but this change does not much affect the dynamics of the charge in the lower left part of the mill. The bulk of the charge is actually locked together and rigidly rotating. The material outside the avalanching region near the surface of the charge is not sliding, so the energy consumption is not affected

Predictions for ball mills using discrete element methods 1071
by the lower limit on the sliding friction. In the avalanching layer the lower friction does reduce the power consumption, but these particles are a minority of those in the charge and the particle contacts are generally not long duration sliding ones. This leads to only a small reduction in the energy consumption. At higher sub-critical speeds and the super-critical speeds the power consumption actually rises with the lower friction. Again this is counter-intuitive but can be explained by the lower friction increasing the mobility of particles, particularly in the centrifuged layer that appears at high speeds. These more mobile particles lead to a more unbalanced load and higher dissipation rates due to the more energetic normal collisions. So a decrease in the friction leads to a small decrease in the dissipation in the tangential direction, but leads to a much larger increase in the dissipation in the normal one via increased particle mobility. At N = 130% the power draw is actually doubled.
Figure 6b shows the variation of the power draw curves with changes in the particle size distribution. The circles show the power draw curve for the original particles used in Figure 3 whilst the pluses show the power draw for the rock/ball combination shown in Figure 4.
Changing the particle size distribution from the three discrete sizes to a continuous uniform distribution between 50 and 200 mm gives the power draw curve given by the triangles. For N _< 75% there is negligible change in the power draw. For higher sub-critical speeds the power draw is reduced by 2 to 5% for the continuous size particles. For super-critical speeds there is a significant reduction in power consumption of 20-25%.
Using the same continuous ball distribution and adding rocks with sizes uniformly distributed between 10 and 50 mm (with ten times more rocks than balls) we obtain the power draw curve given by the squares. This is consistently around 0.5 kW/tonne lower than for the balls alone for speeds below 80%. This is a decrease of 5 to 8% and occurs in the speed range which previously has been quite insensitive to changes. This is probably due to the higher toe location (see Figure 4) producing a more balanced charge and therefore requiring a lower torque and power consumption to support it. At higher speeds the reduction of the power draw found when comparing the ball and rock case to the straight ball ease declines with the ball and rock case haViCLg a higher power draw for N > 95%. For speeds up to 105% the ball and rock case then has a higher power draw by around 2%. For higher speeds this case has a significantly higher power draw. Note that the overall1 shapes of the power draw curves are similar and that the peak power occurs at around the same speed.
Decreasing the boUom size of the rocks to 5 mm gives the power draw curve shown by the plus markers. For low and high speeds the power draw is very similar to the previous case with the 10 ram bottom size (squares). However, in the region 80 > N > 105% the power draw for the case with the smaller bottom size is reduced by around 2%. It is not clear why the charge motion and power should be mildly sensitive to the choice of bottom size in this region. The necessity for the particle size distribution to be truncated (in order to keep the size of the DEM simulations feasible) and overlap of this sensitive region with the most commonly used operating speeds, indicates that some care needs to be made in extrapolating DEM results to real mills. These truncation size effects could be responsible for errors in the prediction of the power draw of a few percent. The variation of the power draw by several percent with particle size distribution also reflects the well known sensitivity of real mill performance to changes in the feed composition.
Overall these sensitivity analyses indicate that a mill operating at or below 75% critical is insensitive to the changes in material properties of the charge but is sensitive to changes in the size distribution. This means that mills operated at these speeds should be more stable in their operation and easier to control than the same mill operating at higher speeds. Variations of 2-6% are observed with variations in the material properties for higher rotation rates. At higher speeds, lower friction material actually leads to higher power draw. This appears to be particularly important for mills that are operated super-critical.
Next we examine the effect of changes in the fill level of the mill on the power draw. Figure 7a shows the power draw as a function of mill speed for the original 50% fill level and a 40% fill level using a charge consisting of both balls and rocks with a bottom size of 5 ram. As expected the smaller charge consumes

1072 P.W. Cieary
less power, except at N = 120% where the power is equal. At 130% critical there is a significant drop in the power draw, since for this lower fill level almost all the particles are being centrifuged, whereas for the higher fill level there was still a reasonable amount of flowing material. Interestingly, the peak of the power draw has moved from around N = 95% for the 50% fill level to 105% for the 40% fill level. This is the first occasion that any change in the mill configuration or particles has altered the location of the peak power consumption.
U3 o
~3
E
Cq
0 EL
I/3 o
(a)
I I I I
o - 50~ load
o
, I , I , I , I ,
60 80 1 O0 120
Mill Rotation (% critical) (b)
I I I I
, I , I , I , I ,
60 80 1 O0 120
Mill Rotation (~ critical)
Fig.7 a) power draw and b) power consumption/tonne, for 40% and 50% fill levels.
The power consumption per tonne (or power density) is more interesting and is shown in Figure 7b. It is considerably higher for the 40% fill level, by between 15 and 20%. The rate of particle grinding is actually dependent on the local rate of energy dissipation or power density rather than on the total power consumed. This Figure shows that better grinding will occur with a lower total energy consumption for a 40% full mill rather than one jammed to near or above capacity at 50%. This clearly illustrates the well known observation that an overfilled mill suffers from reduced grinding efficiency. Shortly we will identify the optimum fill level for this mill and set of particles. It is expected to be around 30-35%.
EFFECT OF NON-CIRCULAR PARTICLES
The particles used so far have all been circular. Figure 8 shows a snapshot of the balls (using the original discrete size distribution) at a rotation rate ofN = 80% for both circular and non-circular particles. The non- circular particles have aspect rations between 0.5 and 1 and sharpnesses from 2 to 5. This gives particles that vary between circular and elongated blocks. The flows are qualitatively very similar, with the shape and angle of the free surface being very similar and similar amounts of cataracting material.
There are however, some key differences. The particles in the upper half of the charge are flowing down the free surface. Any flowing non-circular material behaves quite differently because this material is forced to dilate in order for the spinning particles to pass each other. This produces a noticeably higher void fraction in this upper flowing region. The expansion of this region lifts the free surface higher, which in turn raises the height of the cataracting stream. All three of these differences are clearly visible in this Figure. The non-circularity of the particles also increases the shear strength oftbe non-flowing material in the lower half of the charge. It is not clear whether this has affected the location of the central shear zone, but any

Predictions for ball mills using discrete element methods 1073
effects of increased microstructural strength appear at best to be small. Interestingly, the power density for these circular and matching non-circular particles are within a couple of percent of each other. This suggests that the changes produced in modelling the mill performance by non-circular particles are quite small and that the results obtained using circular particles both here and by other authors may be closer to reality than may have been thought possible.
• ; ' ~e:' o• b ~ • ' d b
2£ ', .
o ~ l 'ql, ~ •
Fig.8 a) Mill with circular particles and b) Mill with non-circular particles.
LINER WEAR PREDICTIONS
Liner and fifter wear is extremely important in milling operations. The replacement costs of the liner and the cost of production lost during re-lining are both significant. Minimising these costs is important to improving plant pexformance. Being able to predict the liner wear is a first step in using DEM simulations to design mill line:rs that assist in this goal. The liner wear process also affects the charge flow pattern and grinding within the mill, so being able to design lifters that maintain grinding performance for longer is also a very important ~xea that DEM modelling can assist with.
Wear predictions (:an be made from the DEM collisional data collected in the object bins using the Finnie model. This uses particle impact speeds and material hardnesses to estimate the wear produced by each impact. The wear information is collected around the entire mill. Since the lifters and liner spacing in between are symmetric for the mill we are modelling, we can average the wear for each bin of the first lifter with the matching bins on the other 22 lifters.
Figure 9 shows the first lifter and its bins for N = 60% and N = 80%. The bins are shaded according to the magnitude of the wear in each bin, with the lightest grey corresponding to the maximum wear rate and the

1074 P.W. Clvary
black to the lowest. The highest wear occurs around the upper corners of the lifter bar. Comparison of these shaded wear rates is quite difficult, but we can use the wear rate distribution to evolve the shape of the lifter bars and then compare these. The center point of every bin is moved inwards according to the local wear rate. It is not appropriate to use just the wear value for each bin in moving that bin, since a high wear bin would rapidly create an unphysical depression. In reality, particles would no longer be able to contact the lifter inside such a depression, so further collisions that would have occurred in this bin will actually occur in the bins to either side. In this way, the erosion of a surface is moderately self-smoothing as the precise details of the new surface alter the flow slightly and act to smooth it out. DEM simulations cannot be run for long enough to actually simulate lifter evolution, but most of the effect can be achieved by using the binned wear rate data and spatially smoothing it with adjacent bins. In this case we smooth each bin with the eight bins to either side. Using an efficiency wear parameter of 0.1 in the Finnie model then allows us to predict the shape of the lifter at later times. The new profiles after 5,000 hours (208 days) of operation are shown in Figure 9.
Fig.9 Wear rate distribution calculated by the DEM model and the predicted liner shaper after 5,000 hours of operation for: a) N = 60% and b) N = 80%.
For N = 60% the largest wear is on the comers and then uniformly across the top surface of the lifter. On the front face (left side) there are different wear rates at different heights leading to a reduction in the face angle of the lifter. There is very little wear on the back face at this speed. There is a moderate amount of wear on the liner between the lifters, but this is less than the wear on the top surface of the lifter. For N = 80% the wear on the comers increases moderately and the corner wear now extends much further down the faces of the lifter. The lifter face angle reduction is also increased. The wear on the upper surface of the lifter (away from the corners) remains quite even but has increased significantly (in a higher proportion than for the corners). There has also been a disproportionate increase in the wear on the liner between the lifters.
The peak smoothed wear rates on the lifter comers are 5.6 and 8.9 mm/1000 hours for a high grade stainless steel lifter (using a Vickers Hardness of 900 kg/mm) and the wear rates averaged over all the bins are 1.9 and 3.2 mm/1000 hours respectively. These peak wear rates would lead to erosion of 5.0 cm and 7.8 cm per year. The distance between the original lifter corners and the mid-point of the base of this lifter is around 22 cm. The lifters would generally be used until they were highly rounded and this distance was reduced to one third or one quarter of its original value. This would be achieved with the peak wear rates predicted by the DEM after about 2.9 and 1.8 years respectively for the two speeds. These are quite plausible predictions of the liner lifespan, Higher rotation rates and smaller lifters would both decrease these lifespans.
Predictions for ball mills using discrete element methods 1075
The changing height and face angle of the lifter have significant effects on the flow pattern and grinding performance. As the face angle declines, the charge is lifted less, so the toe moves higher and shoulder moves lower. There is also a large decrease in the amount of cataracting material. Using the DEM to predict a new liner shape, we can then set up a new DEM simulation with the new liner shape. This will predict the altered flow patl~ern, grinding efficiency, power draw and the new wear pattern. Repeating this process several times aUows us to study the entire life cycle of the liner. Such a prediction of the entire liner life cycle and understanding its effects on the energy efficiency and mill performance will soon be possible. The performance of a mill should be not optimised for a single point in time and particularly not for the initial liner configuration. It should be optimised to produce the highest output at the lowest cost over the entire liner life cycle. There would seem to be much more scope to improve the performance later in the cycle when,.the liner is worn than early in the cycle when the shape is closer to that which was designed.
Significant develop~ment remains to be done on wear prediction. The Finnie model is the simplest of those available. Replacing this with more sophisticated models would be expected to improve the predictions. The inclusion of the abrasiveness of the charge is also important. Finally, detailed validation against good well defined wear experiments is very important.
SIZE SEGREGATION OF CHARGE
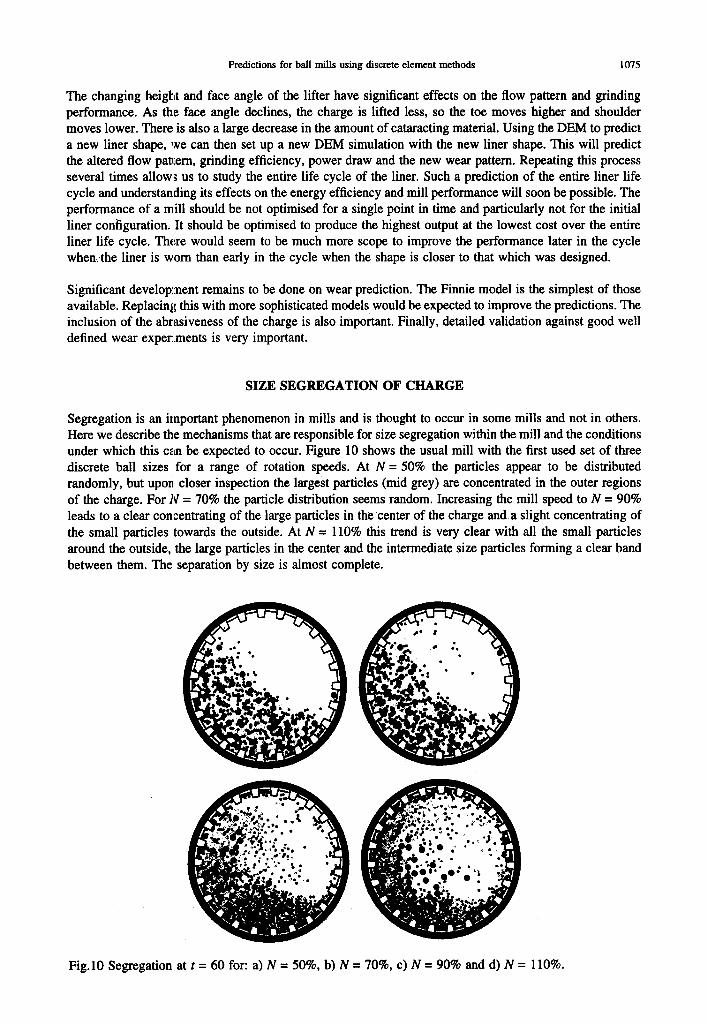
Segregation is an important phenomenon in mills and is thought to occur in some mills and not in others. Here we describe the mechanisms that are responsible for size segregation within the mill and the conditions under which this c.'aa be expected to occur. Figure 10 shows the usual mill with the first used set of three discrete ball sizes for a range of rotation speeds. At N = 50% the particles appear to be distributed randomly, but uponL closer inspection the largest particles (mid grey) are concentrated in the outer regions of the charge. For N = 70% the particle distribution seems random. Increasing the mill speed to N = 90% leads to a clear concentrating of the large particles in the center of the charge anda slight concentrating of the small particles towards the outside. At N = 110% this trend is very clear with all the small particles around the outside, the large particles in the center and the intermediate size particles forming a clear band between them. The separation by size is almost complete.
Fig.10 Segregation at t = 60 for: a) N = 50%, b) N = 70%, c) N = 90% and d) N = 110%.

1076 P.W. Clcary
The segregation state can be measured by calculating the coefficient of variation of the distribution of local average diameters (see section 3.2). For N = 50%, this quantity ~ is mostly a little greater than the randomly mixed level, confirming the small amount of segregation observed above. For N = 70%, Yl remains below the randomly mixed level indicating that there is no discernible segregation. The time series of ~ is shown in Figure 11 for N =90 and 110%. The upper dashed line is the fully segregated limit whilst the lower curve is the randomly mixed limit. The central curve is n and shows the amount of segregation. In both cases the charge segregates rapidly reaching its asymptotic level after around 20 s. The simulations are continued for 240 s to show that the the amount of segregation remains basically unchanged after the first 20 s. There are two types of fluctuations super-imposed on this long term level of segregation. The first is high frequency noise associated with the fluctuations produced by individual particles changing the averaging cells in which they reside. This is of no significance. For N = 90% a cyclic variation in the level of segregation is clearly visible with a period of around 120 s. This corresponds to a periodic re-mixing and re-segregating of the flow and demonstrates that the internal motions of the ball mill charge are not steady with time but possess intriguing structure. The average underlying segregation level is around 13% and 40% for N = 90 and 110% respectively. This demonstrates that the amount of segregation increases rapidly with mill speed.
oo
c~ 0om "J6
c- O
0
Oo
o
._~ 6
0 r J o
' ' ' ' I ' ' ' ' I . . . . I . . . . I ' ' ' . . . . . . . . . . . . . . . . . . . . . . . . . . . .
(a)
. . . . I . . . . I . . . . I . . . . I " ' "
. . . . . . . . . . . . . . . . . . . . . . . . . . . .
(b) 86
a
0
c- O
0
d W , - - -
0
._v d (.>
0 ( - ) o
0 . . . . I . . . . I . . . . I . . . . I , , , i I ' I . . . . I I I I i ] I I I I I . . . .
0 50 I O0 150 200 SO I O0 1,50 200
Time T ime
Fig.11 Segregation as a function of time for: a) N = 90% and b) N = 110%.
There seem to be two basic mechanisms producing size segregation in mills. At low speeds the segregation is produced by percolation of fines through the surface avalanching layers. This causes large particles to migrate to the outside of the charge (as seen in Figure 10a). Within a deforming or flowing granular media the second mechanism causes large particles to move against the acceleration field and smaller particles to move in its direction (this is the same mechanism that causes segregation of particles in a vibrating container--the muesli effect [10]). In a mill at higher speeds the centrifugal force is comparable to gravity and is directed radially outwards from the center of the mill. This force causes the large particles to move into the center of the charge and the fines to the outside (as seen in Figure 10c and d). The two mechanisms cause particles to move' in opposite directions; so for intermediate rotation rates these two mechanisms cancel and leave an randomly mixed charge (Figure 10b).
Figure 12 shows a charge consisting of balls and rocks (the same as used in Figure 4) for N = 110% after 100 s of rotation. When the rocks are inchlded the size range is m u c h ~ aad the segregation rates are faster and the limiting amount of szgrzgatiori, is much 1 ~ ~ ~ is sa extremely high degree of separation where not only have th¢ balls become concentrated in thz ~ but tlie balls and the surrounding rock are sorted radially according to size. There is even segregaticm ~ S e material centrifugally trapped between the lifters. The smaller particles accumulate at the back of each lifter and the larger ones at the front.

Predictions for ball mills using discrete element methods 1077
Fig.12 Particle diistribution for N = 110% at t = 100 s showing very clear radial segregation with balls clustering in the center of the charge and the rocks to the outside.
Segregation (such as observed here) will have detrimental effects on the mill performance. Since the balls are confined to the center they cannot enter the cataracting stream and therefore cannot break particles by high energy impacts in the toe region. Furthermore, particles tend to collide with neighbours of similar size, further reducing the breakage opportunities.
The largest amoun~t of segregation in a mill that is 50% full of rocks and balls occurs for N = 110%. For higher speeds the centrifuging reduces the mobility of the particles and restricts the segregation. No segregation at all is~ found for N = 75% while 2% is observed for N = 80%. This rises to 25% for N = 95% and 52% for N = 1(90%. The segregation rates seems to be relatively invariant with N, so the length of time taken to achieve the maximally segregated state increases with the maximum level. At sub-critical speeds the segregation does not start immediately. There is a delay which increases as N gets smaller. For N = 95% the delay is only (5 s, but for N = 80% it increases to 19 s. This indicates that there are some subtle structural re-arrangements occurring in the charge that are a precursor of the segregation. It is not clear what this may be. The delay is important for DEM simulations, since there is a temptation to run these for only short periods of time that cannot capture these phenomena.
COMMINUTION M E C ~ M S
The comminution seems to be produced by at least three different mechanisms, each of which may need to be understood mid modelled in order to predict the exit particle size distribution from the mill.
Breakage by high energy normal collisions: These occur when large cataracting rocks or the steel balls impact at high speed on either the toe region or the liner. Rock impacts with the liner produce useful breakage and liner wear. Ball impact with the liner damages both the balls and the liner and is very undesirable. The position of the toe varies with fill level (which in turn varies with the hardness cf the rock, the mill rotation rate, the water flow rate and the feed rate) and is generally not knowvL. Significant work continues on trying to determine where the charge is and how to control it. The crushing produced by the balls falling onto the rocks in the toe has been the focus

1078 p.w. Cleary
of much of the modelling [7, 8, 9] and experimental mill work [17].
Attrition: The shearing action in both the avalanching region and near the shell in the region where material is being lifted produces attrition where very small fragments are ripped/rubbed from the larger ones which become progressively more rounded. This is a very important mechanism once the breakage mechanism has exhausted the major flaws in the larger rocks and reduced them to below 50-100 ram. This seems to be poorly understood.
Low energy crushing near the shell: In a granular material most of the force is transmitted via a small number of chains of particles, the members of which experience very large instantaneous forces. The particles in Figure 3 are shaded according to the instantaneous total collisional force (with black being the highest level) and show these chains in the bulk of the charge very clearly. They are generally curved and end at the liner in the lower part of the mill. The intensity of the forces increases with depth into the charge. These chains change extremely rapidly as the microstructure deforms, continuously adjusting to small changes in the mill orientation. Very high instantaneous forces are experienced by only a small number of particles in these chains at any given time. If these forces produce tensile forces within the particles that exceed their yield stresses then they are crushed. This is a very low energy but high force crushing mechanism for the larger particles and is quite different from the first high energy mechanism.
Modelling the actual size reduction in a full scale mill by DEM would involve tracking particles with sizes less than 100 microns. The length scales and numbers of particles are presently prohibitive. We therefore use the DEM to calculate quantities such as the rate of particle-particle and particle-wall shear and normal work and use these as indicators of the breakage and the attrition. This allows comparison of comminution performance for different mill configurations.
Figure 13 shows the intensity of the collisions within the ball mill for the first particle set modelled. The collisional intensities in the bulk of the charge increase with proximity to the bottom reflecting the increasing weight of material above that must be supported. The collisional forces are slightly higher in the surface avalanching region. There is a higher force area at the base of the avalanching/shearing in the upper part of the charge, where additional force must be applied to halt the downward flow of this material. A high intensity region in the lower right is caused by the cataracting material impacting heavily on the liner and on the tail of the charge. Attrition and breakage rates can be inferred from such collisional force data.
Fig. 13 Collision intensity within the ball mill.
CONCLUSION
Discrete element modelling of the charge within a 5 m ball mill allows predictions of the charge profile, segregation state, power draw, torque, liner wear and eolfisional force distributions to be made. The

Predictions for ball mills using discrete element methods 1079
sensitivity of the power draw to particle properties and some operating parameters was analysed. In general, the power draw is relatively insensitive to the material properties with variations generally around 5% or less for normal operating conditions. For super-critical speeds low friction (such as that produced by water in the mill) increases the power draw considerably. The behaviour of a charge consisting of balls and rocks was found to behave moderately differently to that of a charge of just balls. The toe position is higher and the surface profile has a more bi-linear shape which is much better defined. The cataracting material falls in bands from the spaces between lifters and can generate cyclic force variations in the mill shell. The power draw predicted is lower when the rocks are included. The specific energy consumption was found to be higher for a :mill loaded to 40% capacity than it was for one loaded to 50%. This shows that DEM models can detect the decreasing efficiency that occurs when a mill is over-filled.
Non-circular particles were found to modify the charge position modestly. The shearing in the avalanching region generates dilative pressures that expand the volume of the charge and which lift the cataracting stream slightly hig]her. Despite this the power draw was found to be only marginally different.
Liner wear was predicted for two rotation rates using a simple wear model. Plausible average lifter life spans of 1.8 years 'were found for a rotation rate of 80% critical. The wear rates increase much faster than linearly with the rc)tation rate. The spatial distribution of the wear is reasonable and leads to the rounding observed on real lifters.
Two mechanisms were identified for size segregation in mills. One operates at low speed and concentrates large particles arouad the outside of the charge. The other operates at high speeds and causes large particles to accumulate in the center of the charge. At intermediate speeds these mechanisms cancel. The segregation rates are rapid and almost complete radial segregation can be achieved for a charge of rocks and balls in 95 s for N = 110%.
Substantial further work is required to validate these types of DEM predictions and to improve models for wear. Prediction o:r particle size reduction in the mills with information from these models remains a significant challenge.
.
2.
3.
4.
5.
6.
7.
8.
9.
10.
11.
REFERENCES
Campbell, C.S., Rapid Granular Flows, Annual Rev. Fluid Mech., 1990, 22, 57-92. Barker, G.C., Computer simulations of granular materials, in: Granular Matter: An interdisciplinary approach, Ed. Anita Mehta, 1994, Springer-Verlag,/flY., pp. 35-83 Walton, OR., Numerical simulation of inelastic frictional particle-particle interaction, Chapter 25 of Particu/ate two-phaseflow, ed M. C. Roco, Butterworth-Heinemann, Boston, 1994, 884-911. Cleary, P.W. & Campbell, C.S., Self-lubrication for long run-out landslides: Examination by computer simulation, J. Geophys. Res., 1993, 98, B12, pp. 21,911-21,924. Campbell, C.S., Cleary, P.W. & Hopkins, M.A., Large scale landslide simulations: Global deformation, velocities and basal friction, J. Geophys. Res., 1995, 100, B5, 8267-8283. Hopkins, M.A., Hibler, W.D. & Flato, G.M., On the numerical simulation of the sea ice ridging process, J. Geophys. Research, 1991, 96, C3, 4809--4820 Mishra, B.K. & Rajamani, R.J., The discrete element method for the simulation of ball mills, App. Math. ModeUing, 1992, 16, pp. 598--604. Mishra, B.K. & Rajamani, R.K., Simulation of charge motion in ball mills. Part 1: experimental verifications, Int. J. Mineral Processing, 1994, 40, 171-186. Rajamani, R.K. & Mishra, B.K., Dynamics of ball and rock charge in sag mills, Proc. SAG 1996, 1996, Dep~'nent of Mining and Mineral Process Engineering, University of British Columbia. Cleary, P.W., Modelling industrial granular flows, Proc. 1st Australian Engineering Mathematics conference, pp. 169-177, Melbourne, 11-13th July, Eds. A. K. Easton and J. M. Steiner, 1994, Studentlitteratur. Hoyer, D.I., Particle trajectories and charge shapes in centrifugal mills, Proc. Int. Conf. on recent advances in mineral sciences and technology, MINTEK, South Africa, 1984, pp. 401-409.

1080
12.
13.
14.
15. 16. 17.
P. w. Cleary
Schafer, J., Dippel, S. & Wolf, D.E., Force schemes in simulation of granular material, J. de Physique L 1996, 6, 5. Cleary, P.W., Discrete element modelling industrial granular flows, Proc. 2nd Australian Engineering Mathematics conference, pp. 301-308, Eds. W.Y., Yuen, Broadbridge, P., and Steiner, J. M., 1996, Institute of Engineers, Australia. Cleary, P.W., Industrial particle flow modelling: Discrete element methods and their applications, Proc. Chemeca 97, paper PTla on CD Rom, reprinted in Chemeca97 Particle Technology Workshop, Ed. C. Davies, 1-12, Rotorua NZ, 1997. Finnie, I., Erosion of surfaces by solid particles, Wear, 1960, 3, 87-103. Finnie, I., Some observations on the erosion of ductile metals, Wear, 1972, 19, 81-90. Moys, M.H. & Skorupa, J., Measurement of the radial and tangential forces exerted by the load on a liner in a ball mill, as a function of load volume and mill speed, Int. J. of Mineral Proc., 1993, 37, 329-256.
Correspondence on papers published in Minerals Engineering is invited, preferably by e- mail to [email protected], or by Fax to +44-(0)1326-318352