Embed Size (px)
Citation preview
Predicting an Predicting an EpidemicEpidemic
A Quantitative Assessment of TSE A Quantitative Assessment of TSE Sampling Data to Predict Outbreak Sampling Data to Predict Outbreak
MagnitudeMagnitudeAspen ShacklefordAspen Shackleford
HONR299JHONR299J
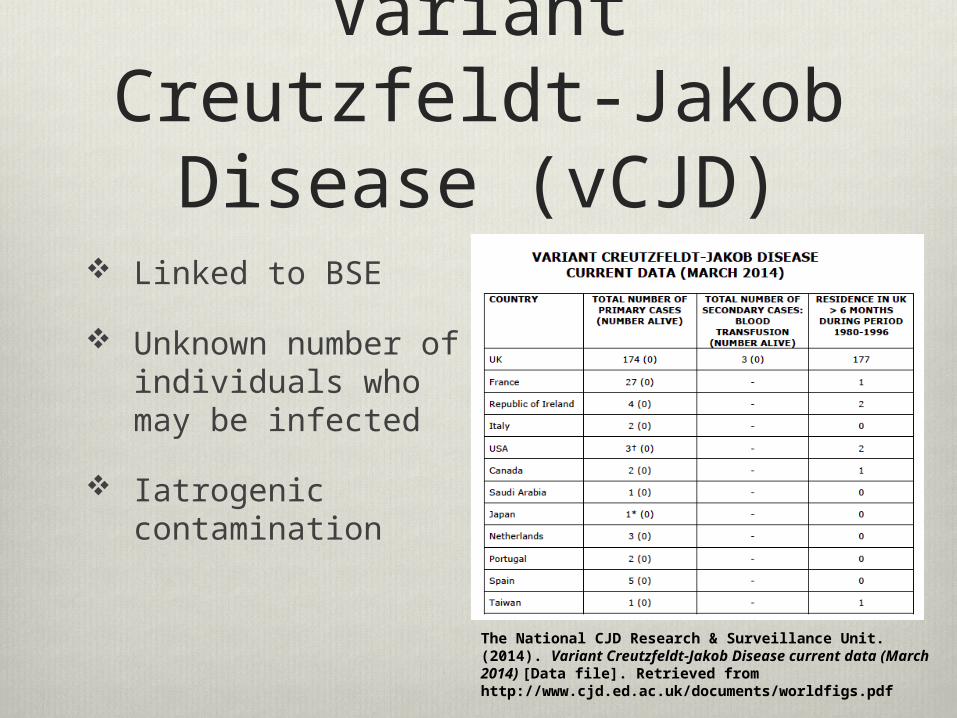
Variant Creutzfeldt-Jakob Disease (vCJD)
Linked to BSE
Unknown number of individuals who may be infected
Iatrogenic contamination
The National CJD Research & Surveillance Unit. (2014). Variant Creutzfeldt-Jakob Disease current data (March 2014) [Data file]. Retrieved from http://www.cjd.ed.ac.uk/documents/worldfigs.pdf
How are outbreak predictions made?
Reporting
Statistical Models

Dealler & Kent, 1995 Age of onset of clinical BSE symptoms was
sampled
Results Decrease in peak age of onset
Led to further investigation of under-reporting
Dealler, S.F. & Kent, J.T. (1995). BSE: an update on the statistical evidence. British Food Journal, 97 (8), 3-18. http://docserver.ingentaconnect.com

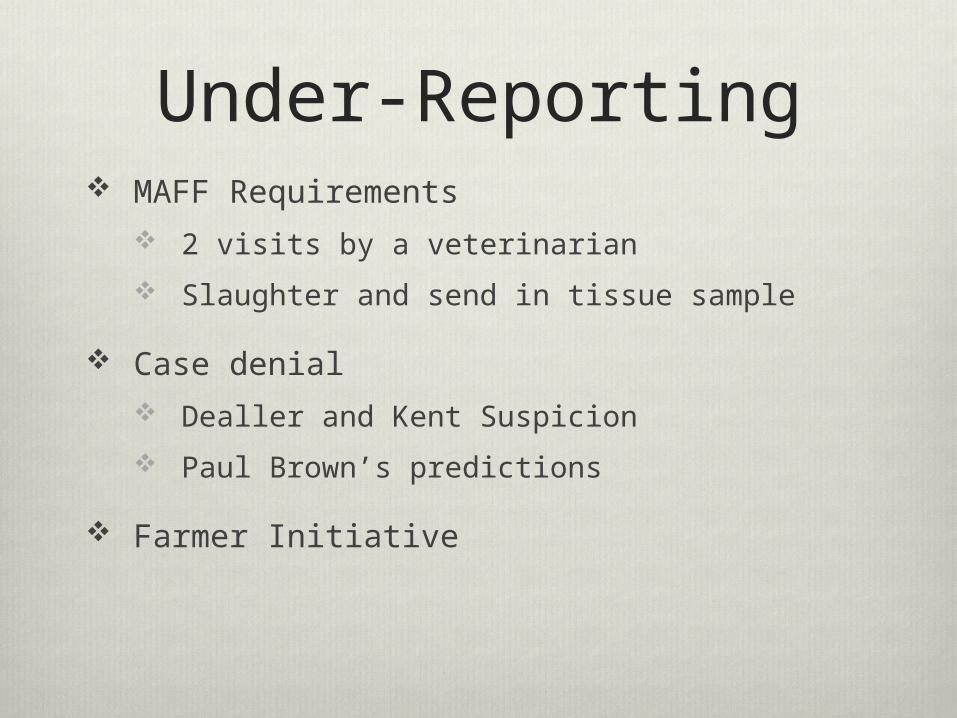
Under-Reporting MAFF Requirements
2 visits by a veterinarian
Slaughter and send in tissue sample
Case denial Dealler and Kent Suspicion
Paul Brown’s predictions
Farmer Initiative
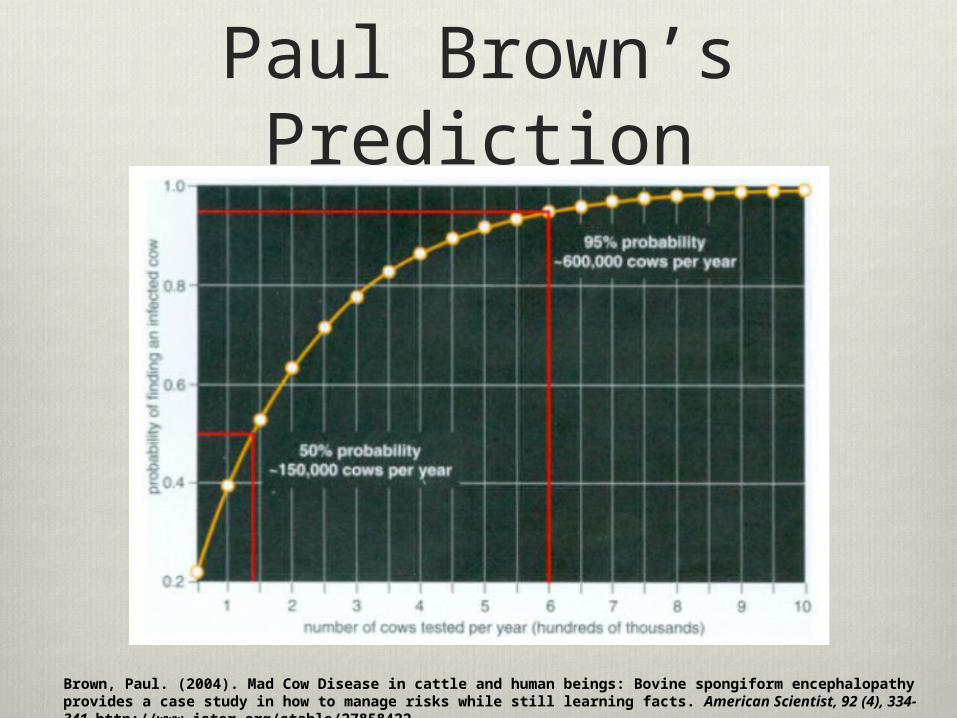
Paul Brown’s Prediction
Brown, Paul. (2004). Mad Cow Disease in cattle and human beings: Bovine spongiform encephalopathy provides a case study in how to manage risks while still learning facts. American Scientist, 92 (4), 334-341. http://www.jstor.org/stable/27858422
Under-Reporting MAFF Requirements
2 visits by a veterinarian
Slaughter and send in tissue sample
Case denial Dealler and Kent Suspicion
Paul Brown’s predictions
Farmer Initiative
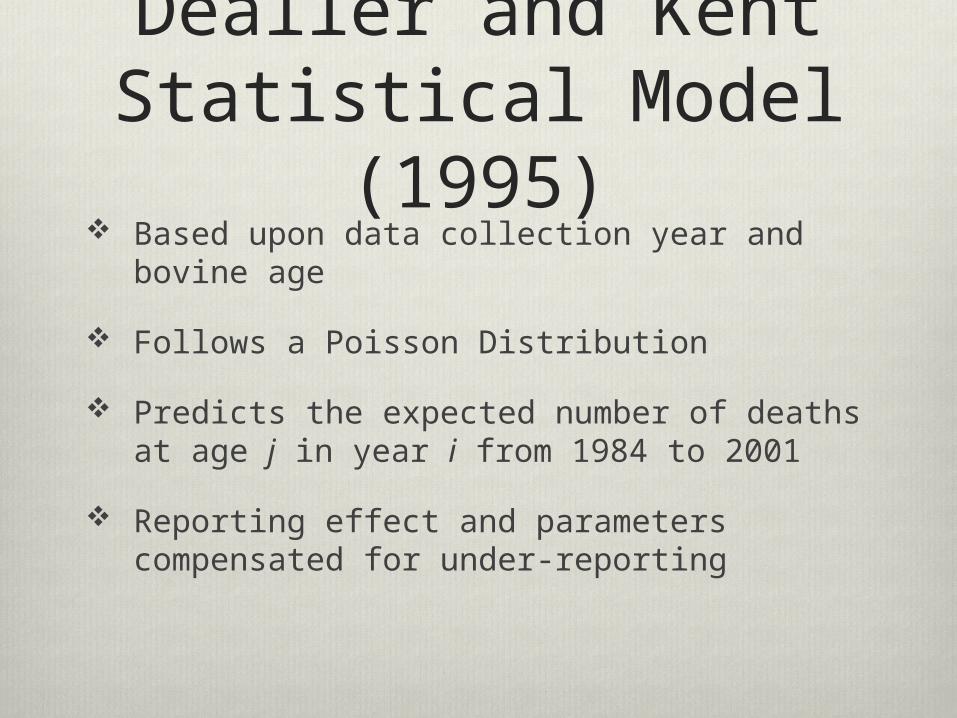
Dealler and Kent Statistical Model
(1995) Based upon data collection year (i) and
bovine age (j)
Follows a Poisson Distribution
Predicts the expected number of deaths at age j in year i from 1984 to 2001
Reporting effect and parameters compensated for under-reporting
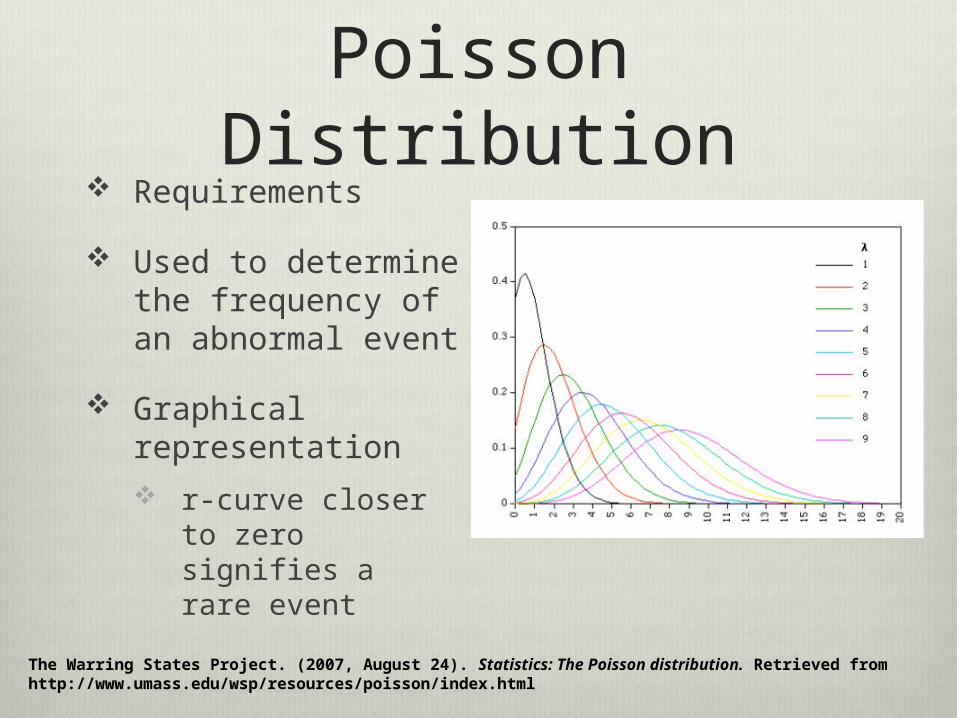
Poisson Distribution Requirements
Used to determine the frequency of an abnormal event
Graphical representation r-curve closer to
zero signifies a rare event
The Warring States Project. (2007, August 24). Statistics: The Poisson distribution. Retrieved from http://www.umass.edu/wsp/resources/poisson/index.html
Dealler and Kent Statistical Model
(1995) Based upon data collection year and bovine
age
Follows a Poisson Distribution
Predicts the expected number of deaths at age j in year i from 1984 to 2001
Reporting effect and parameters compensated for under-reporting
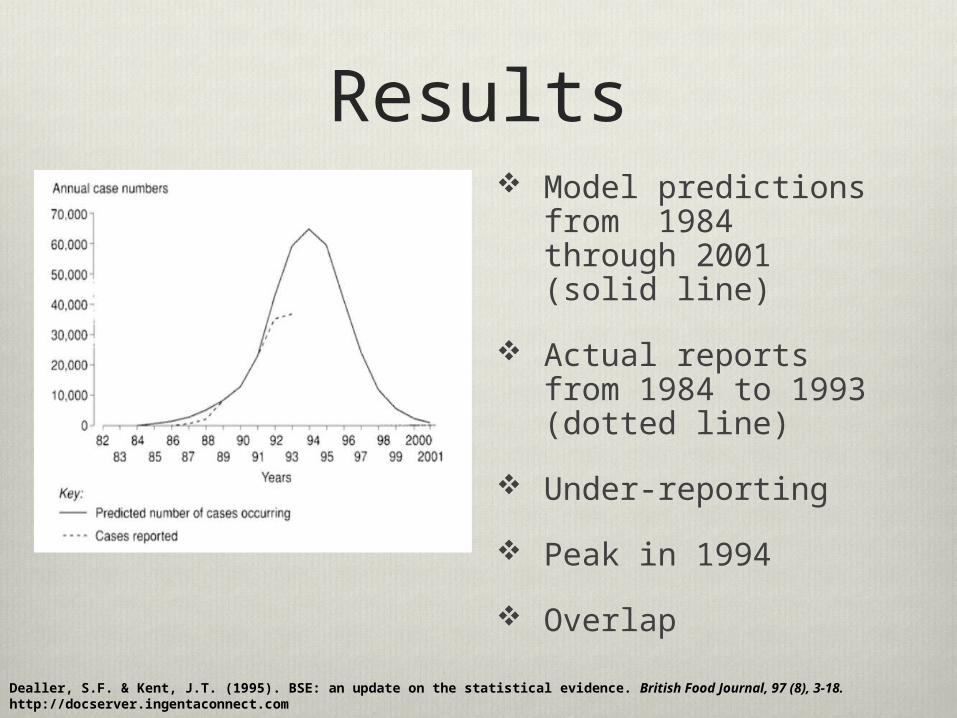
Results Model predictions
from 1984 through 2001 (solid line)
Actual reports from 1984 to 1993 (dotted line)
Under-reporting
Peak in 1994
Overlap
Dealler, S.F. & Kent, J.T. (1995). BSE: an update on the statistical evidence. British Food Journal, 97 (8), 3-18. http://docserver.ingentaconnect.com
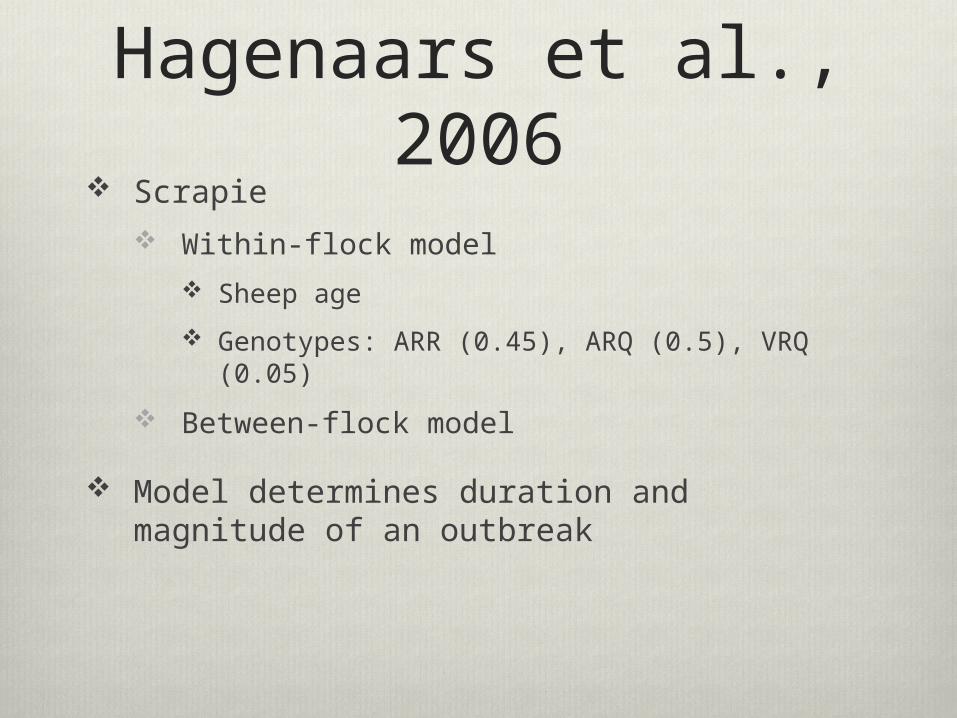
Hagenaars et al., 2006
Scrapie Within-flock model
Sheep age
Genotypes: ARR (0.45), ARQ (0.5), VRQ (0.05)
Between-flock model
Model determines duration and magnitude of an outbreak
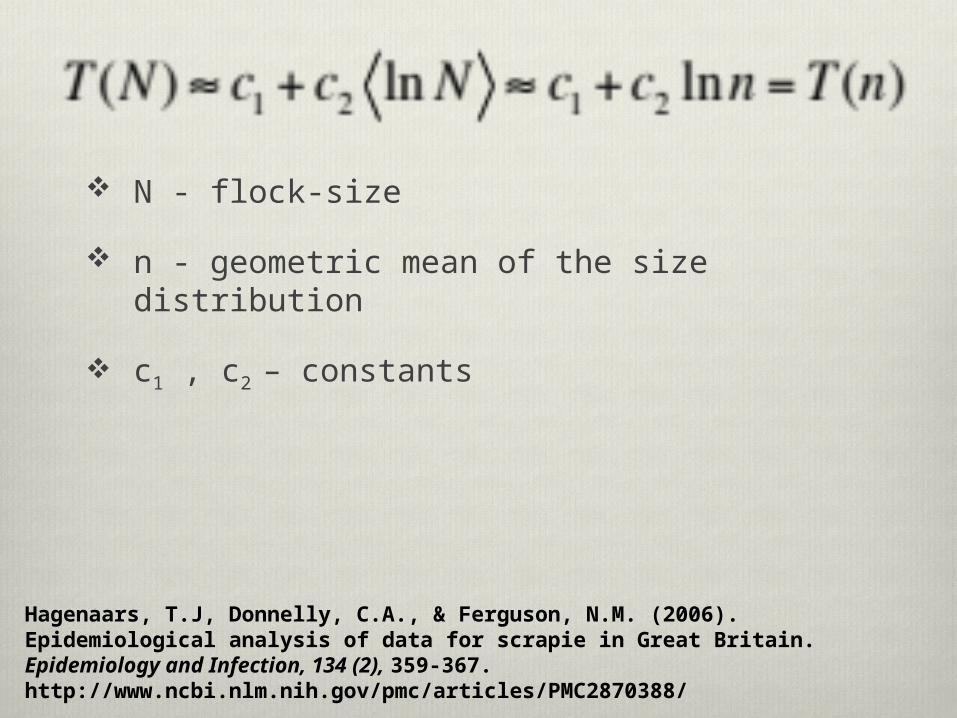
N - flock-size
n - geometric mean of the size distribution
c1 , c2 – constants
Hagenaars, T.J, Donnelly, C.A., & Ferguson, N.M. (2006). Epidemiological analysis of data for scrapie in Great Britain. Epidemiology and Infection, 134 (2), 359-367. http://www.ncbi.nlm.nih.gov/pmc/articles/PMC2870388/
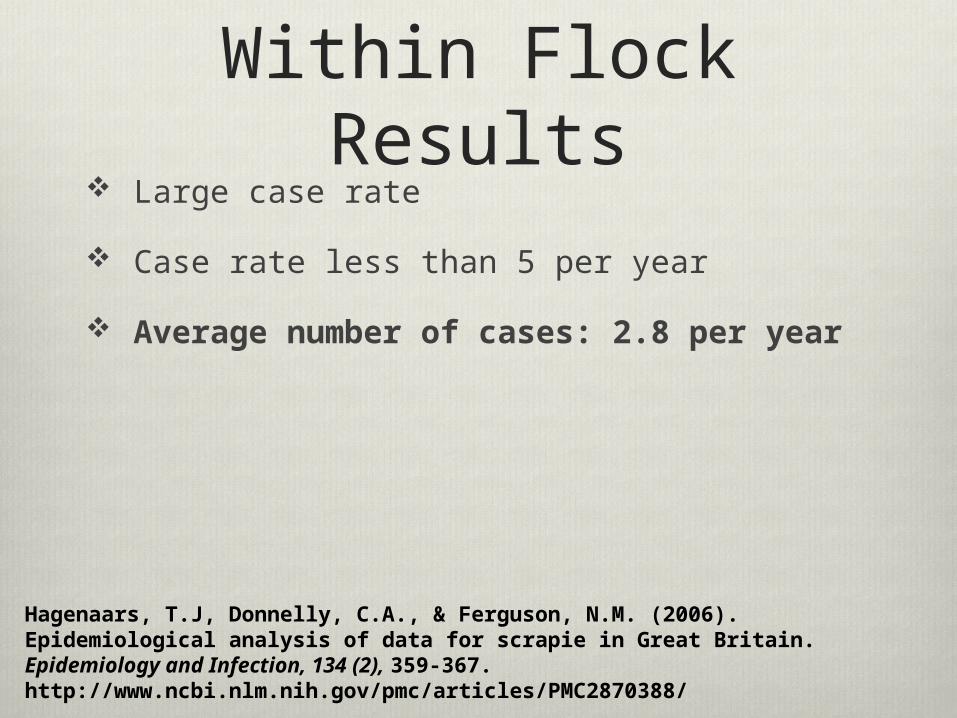
Within Flock Results Large case rate
Case rate less than 5 per year
Average number of cases: 2.8 per year
Hagenaars, T.J, Donnelly, C.A., & Ferguson, N.M. (2006). Epidemiological analysis of data for scrapie in Great Britain. Epidemiology and Infection, 134 (2), 359-367. http://www.ncbi.nlm.nih.gov/pmc/articles/PMC2870388/
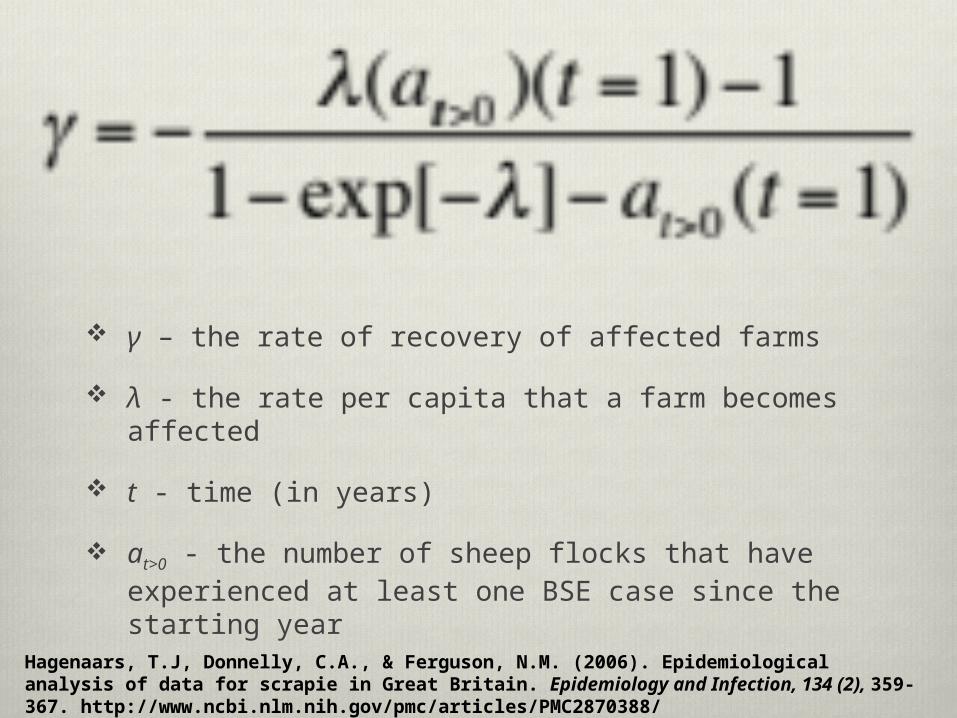
γ – the rate of recovery of affected farms
λ - the rate per capita that a farm becomes affected
t - time (in years)
at>0 - the number of sheep flocks that have experienced at least one BSE case since the starting year
Hagenaars, T.J, Donnelly, C.A., & Ferguson, N.M. (2006). Epidemiological analysis of data for scrapie in Great Britain. Epidemiology and Infection, 134 (2), 359-367. http://www.ncbi.nlm.nih.gov/pmc/articles/PMC2870388/

Between Flock Results
Low basic reproduction rate
High basic reproduction rate
Breeding for resistance ARR/ARR genotype
Changes in management
Hagenaars, T.J, Donnelly, C.A., & Ferguson, N.M. (2006). Epidemiological analysis of data for scrapie in Great Britain. Epidemiology and Infection, 134 (2), 359-367. http://www.ncbi.nlm.nih.gov/pmc/articles/PMC2870388/
Conclusion Statistical models are widely used
Statistical models offer information that uses parameters and constraints that model real life
The predictions of statistical models can be used to make decisions about how to best prevent an outbreak that threatens human and animal populations