Embed Size (px)
Citation preview
Predicting long-term academic performance from psychosocial factors.
Nomxolisi Sindiswa Malope
Department of Psychology
University of Cape Town
The factors influencing academic performance amongst university students particularly amongst
previously disadvantaged students is a major concern in South Africa. This paper attempts to
bridge the gap in the literature of this area by testing the predictability of academic performance
from psychosocial factors. A total of 194 students (56% males and 44% females) from five
different Faculties (Commerce, Science, Law, Humanities and Engineering and Built
Environment) who were receiving financial aid at the University of Cape Town participated in
the study. The psychosocial factors under this study were measured at the end of first year
through various self-report scales. Academic performance was also measured at the end of first
year and again at the end of third year, the academic marks were obtained from the university’s
IPD office and the various Faculty board schedules. The results of the study suggest that there
are other factors which determine the academic performance of previously disadvantaged
students apart from psychosocial factors. Only 4% of the variance of the academic performance
can be attributed to the psychosocial factors in the study and at the end of first year psychosocial
factors explained 17% of the variance in academic performance when mediated by adjustment. It
was however discovered that academic performance at the end of first year was the best predictor
of academic performance at the end of third year.
Keywords: ‘Academic performance’, ‘psychosocial factors’, ‘self-esteem’, ‘academic
motivation’, ‘financial aid students’, ‘academic adjustment’ and ‘academic overload’.
2
INTRODUCTION
There is a growing interest in factors which predict academic performance. This interest is
directed at creating, and improving already existing interventions and support services for
students who are at risk of having academic problems (McKenzie & Schweitzer, 2001). These
academic problems include relatively high drop-out rates which affect the roll out of financial
assistance granted to students who would otherwise not afford tertiary education. Dreijmanis
(1988) found that almost 30% of university students in South Africa dropped-out of university
before completing their studies. This figure is unfortunately very high considering the large
amounts of money being invested in these students and it does not seem to be decreasing as
demonstrated in the present study.
South Africa has undergone major transitional changes for the past 13 years some of which aim
to regress the injustices of the past by moving from an authoritarian regime to a democratic one
(Dlamini, 1995). The education sector has been no exception to this transition as the government
attempts to standardise the quality of education for the economically disadvantaged populations
with that of the so-called ex-Model C schools. The quality of education under the apartheid
regime was defined in terms of the four different education systems for each of the races in the
country (i.e. Whites, Blacks, Coloureds and Indians). Each of these departments operated
significantly different from the others and the quality of the education received by the students is
reflected in the performance of the students at university level. Jawits (1995) showed that the
performance of first and second year engineering students at the University of Cape Town relied
heavily on the quality of high school education they received. In his study he found that all the
students from schools under the DET were excluded at the end of their first year in engineering.
This demonstrates that a disadvantaged educational background, mostly attributed to quality of
the education, influences the performance of students at university as this study aims to
demonstrate. The second way through which a disadvantaged educational background impacts
on university study is that it has determining power of whether a child receives the opportunity
for higher learning or not. This determining power lies in the fact that the quality of a school a
child goes to determines to a large extent, their performance in matric; and up until now, matric
results are still widely used as very important, if not sole determinants of university admission.
These matric results were used as predictors of university academic performance as reported by
3
Jawits, 1995; Potter et al., 1990, Bokhorst et al., 1992; Stoker, 1985; CUP, 1987; Moran, 1987;
Fresen, 1987; Van Wyk, 1984 and continue to be used today. Therefore, universities project
students’ potential based on their matric performance which depends heavily on the overall
quality of the high school. With the new government however, it has been taken into
consideration that the matric scores of students from previously disadvantaged academic
backgrounds are not always a true reflection of their potential as they were from schools which
had had limited resources. Thus, the University of Cape Town and other South African
universities now allow some students who do not necessarily meet the minimum requirements an
opportunity for higher education. Some of the students in this study fall into this group.
In light of the history of South Africa there are inevitable socio-economic divisions between
social classes in this country. These socio-economic circumstances have various consequences
on the quality of the lives of the people. This socio-economic disadvantage filters down to the
quality of education that the people who are its victims receive. Botha et al. (2005) suggest that
the higher education system is affected by the national problems which occur at macro-level; that
is why students who are from poverty stricken backgrounds feel the impact of their family’s
adversity at university level. Ramey, Ramey, and Lanzi (1998, as cited in Dass-Brailsford, 2005)
argue that although familial poverty often leads to poor academic performance, this could be
countered by strong social support systems and the possible moderating variables such as
psychosocial factors which include adjustment, help-seeking behaviours, academic motivation,
self-esteem, perceived stress and academic workload.
In the South African context, when we speak of disadvantaged students we are referring to
students who attended historically ‘black’ high schools (De Villiers, 1999; Huysamen, 2000;
Nunns & Ortlepp, 1994; Shochet, 1994). These students are regarded as relatively educationally
disadvantaged due to the inequalities in their schooling which can be attributed to the legacy of
apartheid (De Villiers, 1999; Huysamen, 2000). Huysamen (2000, p. 146) also states that,
“Although the departments of education for the different demographic groups were integrated in
1995, the ill effects of the former DET may very well still be expected to be prevailing in the
historically black high schools”. The ill effects of the racial segregation implemented by the
apartheid regime are still apparent in many South African high schools. The second
distinguishing characteristic of disadvantaged students is the fact that most of them are likely to
4
speak English as a second or third language and are therefore generally under-prepared for
university considering that most previously ‘white’ universities in South Africa use English as a
medium of instruction (Huysamen, 2000; Sennett et al., 2003; Woollacott & Henning, 2004).
Thus having considered these characteristics and understanding that these are the students who
are eligible to receive need-based financial aid one can already see how this group of students are
of particular concern for universities in post-apartheid South Africa.
Of late, the South African government has been encouraging previously ‘white’ institutions of
higher learning to make way for students from economically disadvantaged backgrounds. One
way that previously ‘white’ institutions (such as the University of Cape Town) have attempted to
bridge this gap by putting in place financial support systems that provide financial assistance for
students who would otherwise not afford higher education at these relatively very expensive
institutions. Financial assistance is often based on need and/ or merit which imply that
economically disadvantaged students have to be exceptional in their performance amidst the
limited resources in their schools if they are to receive financial assistance for higher learning. A
high 30% of the students who are afforded this opportunity do not make it past their first year
(Dreijmanis, 1988). This shows that there may be many other contributing factors apart from
economic factors.
The higher education system in this country has been described as “a system in transition” which
is constantly changing and improved in order to be more accommodating to all of South Africa’s
people (Ndebele, 2004, p.1). Strong emphasis on change is that of equity of access to higher
education and equity with regard to opportunity to succeed within higher education (Hendry,
1998). Previously ‘white’ South African universities are required to respond to the National Plan
for Higher Education (2001) by focusing on increasing the enrolment of previously
disadvantaged students, and doing whatever it takes to improve retention and graduation rates
(Hendry, 1998). The National Plan specifically identified the lack of access, poor graduation and
retention rates, and high drop-out rates as focus points for South African universities. The
National Plan (2001, section 2.1.3) indicates that while higher education institutions have been
successful in meeting the goal of equity of access, “the total growth in graduates has not kept
pace with enrolment growth in higher education”, with 17 % as the average graduation rate for
universities in the period between 1993 and 1998. The National Plan (2001, section 2.1.3)
5
defines the average graduation rate as “the number of graduates as a percentage of head count
enrolments”. An annual drop-out rate of 20% is reported for undergraduate and post-graduate
students and an average of 25% for first-time entering students (National Plan for Higher
Education, 2001). It is reported in the National Plan that a drop-out rate of 20% costs the
government about R1,3 billion in subsidies each year for students who do not complete their
study programmes. According to Bean (1990a as cited in Hendry, 1998), the university looses
three years (or four years in the case of four-year bachelors’ degree programmes) of potential fee
income when a single bachelors’ student drops out during his/her first-year of study. Thus high
repetition and drop-out rates are costly, representing wasted resources and are indicators of poor
institutional performance. South African universities have thus become increasingly concerned
with developing ways to increase retention and graduate output in order to achieve the goals
outlined in the National Plan. Historically ‘white’ universities, such as the University of Cape
Town (UCT), where this study is located, are faced with the particularly difficult task of
developing ways to improve retention and graduation rates, and redress past inequalities, against
a backdrop of diminished government funding (Hendry, 1998). The long-term plan to redress
pass inequalities and increase retention and graduation rates at South African universities, as
communicated in the National Plan (2001), highlights the need for universities to re-examine the
factors that determine students’ academic success and failure (Fraser & Killen, 2005).
The Student Services Tactical Plan of the University of Cape Town (2001) partnered with the
education department and identified economic circumstances as a major interference with
academic performance. The financial status of the subjects in this study has been confirmed by
previous research as stressful to the students in university (Bojuwoye, 2002). In his study,
Bojuwoye found a significant relationship between stress and the financial situation of South
African university students. The students in his study reported above average stress due to
financial difficulties. This is in agreement with Dass-Brailsford’s (2005) study which showed
poverty as a substantial stressor in South African university students. In fact, the groups of
students who are from economically disadvantaged backgrounds have the highest reported drop-
out rate (Botha et al., 2005). The Cultural Capital Theory of Hansen and Mastekaasa (2006)
suggests that perhaps these high drop out rates from economically disadvantaged students are
6
grounded on the expectations that the students have regarding their performance and the
expectations from their families. These expectations are suggested to be low. This area grew in
interest as more and more researchers wanted to identify the factors that lead to these results.
In the past cognitive abilities such as intelligence, aptitude and matric grades were generally
believed to be the deciding factors of academic performance and this was standard practice
worldwide (De Villiers, 1999; Pascarella & Terenzini, 1991). However, a number of studies
from the late 1990’s and early 2000’s started investigating the influence of these cognitive
abilities and showed that academic success in university does not solely depend on cognitive
abilities and therefore encouraged studies that were going to focus on other factors. Nonetheless,
cognitive abilities have been shown to have a significant, yet minor contributing roles in
academic success especially with black South African students due to the history of the country.
However, they have more significance for previously advantaged students (Malefo, 2000). This
difference has indicated that there may be more factors at play in determining academic
performance (Malefo (2000). Hansen and Mastekaasa (2006) agree that there is a whole array of
factors involved apart from cognitive factors, these include the already discussed educational
background (Honikman, 1982; Nettles, 1988), social and occupational status of parents (Allen,
1985; Fleming, 1984, Fuller et al., 1989 & Jenkins, 1989), self beliefs (Kleeman, 1994;
McLaren, 1989), academic integration, interfering problems which often involve finances
(Nettles, 1988) and family environment (Berg, 1991). A significant number of students facing
any of the challenges are said to drop out or perform poorly academically in university
(Finchilescu et al., 2003). These challenges impede the progress of students who have been
granted an opportunity by the state and the various institutions to better their future and
perpetuate the cycle of poverty if the students come to university only to return home without a
degree because there were factors that hindered the performance. This outcry calls for immediate
investigation into what these factors that are affecting their performance so strongly are and only
until these are known can the institutions assist in addressing them.
7
Variables in the study
Help-seeking
Petersen (2006) has found that students who seek help show some improvement in their
adjustment to university, which in turn positively influences their academic performance. There
are various student support centers offered at the University of Cape Town which offer help with
academic, social, emotional, physical and financial problems. These services are made available
to students either free of charge or on relatively very low fees when compared with what they
would pay for these services outside of the university. Academic help is offered through the
availability of lecturers for consultation by students outside of lecture times. Students are
encouraged to approach or e-mail their lecturers concerning course content work. There are
tutors in almost all departments and faculties who have also been placed to assist students who
may have failed to grasp certain concepts in lectures. Tutors thus offer a second source of the
same information transmitted by the lecturer only in a more interactive way and in smaller, more
manageable tutorial groups to assist students in their understanding of the concepts covered in
lectures. Tutors are also available to students whenever students need them and can be
communicated through text messages, e-mail or personal meetings. Some students on financial
assistance also have mentors assigned to them at the beginning of the year and these mentors are
trained to assist students with basically all their concerns. Some university residences (i.e.
Univeristy House and Tugwell) also have mentors and tutors in the specific residence who are an
addition to the tutors and mentors ‘employed’ by the university. Thus, it appears that there are
numerous sources of help for academic work.
Social groups are also plenty at the University of Cape Town. These are formed according to a
number of commonalities of their members and they offer assistance in adjusting socially. Some
groups are formed according to nationality with almost all the Southern African Development
Community countries represented (i.e. the Botswana student Association), shared spiritual values
(the Islam Student Association and the Student Christian Fellowship), shared hobbies (such as
Drama teams and yoga groups), and many other groupings of students who have common
interests.

8
The Student Counseling Services Center (SCSC) attempts to address as many of the students’
emotional needs as possible. Services they offer at the SCSC include assistance with self-esteem,
stress, and motivation, coping with day-to-day challenges in romantic relationships, family
problems, sexual issues, assistance with study methods, tips for studying and self-efficacy
amongst many others. Optimal functioning in these areas is said to lead to better performance in
academics (Povey, 2003). Therefore SCSC’s contributes largely to the well-being of students
(Botha et al., 2005). This suggests that students who seek this kind of help would generally
improve in their academic performance as it is postulated that issues such as self-esteem, stress
and self-efficacy influence overall academic performance (self-esteem and its relationship to
academic performance is described below). The Student Wellness Center is a low-cost health
service center that addresses physical needs of students. This center facilitates medical assistance
and runs a family planning service which also offers free HIV/AIDS testing and counselling
services. Thus, this center is aimed at addressing medical needs and sexual health concerns of
students. Finally, the financial aid office addresses financial matters in terms of scholarships and
bursaries.
The subjects in this study are all already receiving financial assistance from the university. It can
thus be argued that the University of Cape Town has put a high number of support structures for
students. These structures set the foundation for the development of supportive relationships at
the university and these relationships have been shown to lead to better adjustment (Aspinwall
and Taylor, 1992). The absence of these supportive relationships results in students suffering
from homesickness and poor academic and psychosocial adjustment; which in turn, inevitably
leads to an increase in the chances of these students dropping out of university (Coffman &
Gillian, 2002-2003). A very high 84.7% of the students in this study sought help in some form or
another at the university which means that if help-seeking is a significant factor in good
academic performance we should expect good performance from the students in this study.
Self-esteem
Self-esteem is “the individual’s positive or negative attitude toward the self as a totality”
(Rosenberg, Schooler, Schoenbach & Rosenberg, 1995). According to Rosenberg et al., the
central aspects of self-esteem are self-acceptance and self-respect which are personal resources
9
necessary for positive psychological adjustment to stressful life transitions (Aspinwall & Taylor,
1992; Coffman & Gilligan, 2002-2003). Because of this individuals with high levels of self-
esteem may be more resilient during stressful life transitions (Aspinwall & Taylor, 1992).
Various authors state that individuals with high levels of self-esteem would perceive themselves
to have the ability to adequately complete certain tasks, and would thus employ effective coping
strategies and management of their resources in completing those tasks (see Aspinwall & Taylor,
1992; Chemers, Hu & Garcia, 2001; Coffman & Gilligan, 2002-2003; Ochse, 2001). These
individuals are thus likely to succeed in completing those tasks.
A number of studies have shown a positive association between self-esteem and several social
and academic-related factors, including psychological well-being and academic performance (see
Aspinwall & Taylor, 1992; Chemers et al., 2001; Grant-Vallone et al., 2003-2004; Rosenberg,
1979; Rosenberg et al., 1995). Grant-Vallone et al. found that students who reported high levels
of self-esteem showed better social and academic adjustment when they examined key factors
contributing to the social and academic adjustment and institutional commitment/attachment of
students who were financially disadvantaged students.
Although numerous studies have shown a positive relation between self-esteem and
psychological well-being and academic performance, it is unclear as to whether self-esteem is a
predictor or a symptom of the experience of academic and social difficulties as many of the
studies that have investigated the relationship between self-esteem and academic and social
difficulties have been correlational studies (Crocker & Luhtanen, 2003; Grant-Vallone et al.,
2003-2004; Rosenberg et al., 1995). The empirical evidence of the relation between self-esteem
and academic performance is also unclear. Some studies have shown self-esteem to have a
positive effect on academic performance (e.g. Boulter, 2002; Chemers et al., 2001) whereas
others have shown self-esteem to have no effect or have shown the effect of self-esteem on
academic performance to be mediated by another variable (e.g. Aspinwall & Taylor, 1992) .
In other studies, Boulter (2002) investigated the effect of a multi-dimensional measure of self-
esteem on academic performance among first year students at an American university. In his
study he found that only the aspect self-perception was a positive predictor of academic
performance.

10
Rosenberg’s (1979) study warns researchers to be careful in generalising their results has
emphasized the importance of taking the social and cultural context into consideration in
measuring self-esteem. According to Rosenberg, individuals judge and evaluate themselves by
comparing themselves to other individuals, groups and/or social categories in their environment
(Petersen, 2006). Individuals’ self-esteem tends to suffer when they compare unfavourably to
others in their surroundings. Disadvantaged students attending historically ‘white’ universities
are thus likely to have low levels of self-esteem.
High levels of self-esteem are however preferable because when coupled with optimism they
usually result in better coping strategies which in turn improves the adjustment of students and
lessens their perceived stress (Aspinwall & Taylor, 1992; Grant-Vallone et al., 2003). If
adjustment and perceived stress are found to be significant predictors of academic performance
then we would expect stress and optimism to be in turn, significant. Aspinwall and Taylor (1992)
also found that in the second year of study optimism appears to have a direct impact on
adjustment as compared to self-esteem. Interest in the course, the approach students take in
studying and their belief in their abilities are somewhat dependent on how they attempt to
increase their chances of performing well (Fraser & Killen, 2005).
Academic Motivation
Academic motivation in academic studies is invariably related to enjoying the course. Beyefeld,
Hugo, & Struwig (2005) found that students who do not enjoy their studies and are not motivated
tend to concentrate on meeting the minimum requirements for that course just so that they can
pass it and continue on to the following year of study. Motivation levels are generally low when
students do not find their studies meaningful and attribute poor performance on outside factors
and the opposite is true when motivation levels are high (Seifert, 2004). Academic success has
been shown to be related to satisfaction with one’s studies, especially in students whose need for
academic success is motivated by gratification (Lance, 2006). In the present study motivation
was measured from five aspects; (i) Identified regulation which refers to the most self-
determined form of extrinsic motivation which involves the desire to improve and advance one’s
abilities for the sake of bettering one self; (ii) Intrinsic motivation which represents the prototype
of the self-determination theory which encompasses feelings of satisfaction and pleasure about
11
being in a certain place or doing a certain thing. For the students in this study intrinsic motivation
will be contentment with the chosen degree and institution; (iii) Introjected regulation involves
internalising demands that force one to behave in a certain way and are not integrated into one’s
self, such as actively and consciously pushing oneself to study when one does not really see the
value of doing it and are not enjoying it; (iv) Extrinsic regulation which refers to the least self-
determined form of extrinsic motivation referred to as ‘classical’ regulation involves using
external pressure as a motivation to do work. Students with this characteristic do not see the
point of studying and only convince themselves to study because of the money their parents have
invested in their studies or other such external pressures and (v) Amotivation refers to a type of
motivation which is neither intrinsic nor extrinsic, almost the opposite of motivation in the sense
that it works counterproductively to motivation. This aspect of motivation refers to the complete
apathy towards one’s studies.
Perceived Stress
Possibly overwhelming stressors for university students are the demanding coursework,
examinations, long periods of time spent away from home, unfamiliar environment,
living/sharing with different room/housemates from various different backgrounds, learning to
manage their time and money and developing new friendships (Coffman & Gillian, 2002-2003).
The majority of university students experience high levels of stress at one point or another in
their academic career (Shaikh, Kahloon, Kazmi, Khalid, Nawaz, Khan, & Khan, 2004). Shaikh et
al.(2004) indicate that students on financial aid have higher levels of stress than non-recipients of
financial aid. This is possibly due to the financial problems as most of the students on financial
aid are from very impoverished backgrounds and may experience other sources of financial
problems even though their tuition fees and accommodation may already be paid for. These
problems may include the inability to meet everyday needs such as money to call home, money
to buy clothes, toiletries and cosmetics, clothes, social outings and pocket money in for hair and
other costs including printing and photocopying.
There are also somewhat moderate stresses, especially due to the fact that many of these students
are black and have few classmates of the same race which might make them feel alienated and
perceive this as alack of social support (Flemming, 1984; Nettles, 1988). Less serious stresses
12
range from everyday financial difficulties (such as printing, photocopying) to pressure from
friends to spend more money on clothing and social activities. In a study by Baker (2003)
perceived stress was shown to have a negative correlation with academic performance. Female
students tend to report higher levels of stress when compared with their male classmates
(Bojuwoye, 2002; Baker, 2003). Together with academic overload, perceived stress has been
identified as an important factor influencing the experiences and academic success of
disadvantaged students, and more particularly ‘black’ students at predominantly ‘white’
universities (Prillerman, Myers & Smedley, 1989; Malefo, 2000). Much of the literature on the
experiences of disadvantaged students making the transition from high school to university
shows that the transition is particularly stressful for these students, particularly ‘black’ students
attending historically ‘white’ universities (Bojuwoye, 2002; Prillerman et al., 1989; Sennett et
al., 2003).
Coffman and Gilligan investigated the relationship between social support, perceived stress
amongst other variables at an American university. They, and a couple of other studies have
found a significant negative association between stress and academic performance (e.g. Neville,
Heppner, Ji & Thye, 2004; Struthers, Perry & Menec, 2000) whereas other studies found that
stress did not have a significant impact on academic performance (e.g. Malefo, 2000; Trockel,
Barnes & Egget, 2000). These studies were done in other countries however and the only South
African study investigating the effect of stress on academic performance that could be found was
the study conducted by Malefo (2000). She explored the relationships between the family
environment, experiences of life stress and coping behaviours, and the effects of these on
academic performance among ‘black’ African female students at a predominantly ‘white’
university in South Africa. She found a non-significant association between stress and academic
performance. However, in another study which investigated the impact of stress on academic
performance among disadvantaged students in comparison to non-disadvantaged students
(Charles, Dinwiddie & Massey, 2004) found that stress had a significant negative effect on
academic performance among disadvantaged students.

13
Academic workload
Many students making the transition from high school to university experience difficulty in
managing the academic workload at university due to the fact that students are required to spend
more time on academic work than in high school (Bitzer & Troskie-De Bruin, 2004; Doyle,
2002). Furthermore, this set of author’s found that the students’ perceptions of the demands of
their academic tasks and their perceptions of their ability to succeed in completing the tasks
influences the amount of effort they put into academic work. According to Bitzer and Troskie-De
Bruin (2004), all university programmes require students to spend an average of about 18 hours
of out-of-class time per week on academic work whereas more than a quarter of the students in
their study had reported having spent less than 6 hours out-of-class in matric. The danger with
the steep increase in out-of-class time required in the first year of university is that students may
not be able to adequately adapt and cope with the new academic demands due to failure to
accurately perceive the demands or poor time management skills (Bitzer & Troskie-De Bruin,
2004).
Educationally disadvantaged students in particular seem to experience great difficulty in coping
with the academic workload in their first year at university (Agar 1990; Huysamen &
Raubenheimer, 1999). In the South African context many disadvantaged students have had
inadequate levels of schooling and are thus likely to be under-prepared for university. These
students’ educational backgrounds may not have prepared them for managing and coping with
the academic demands of the university. They may not have developed adequate time
management and planning skills for managing their workload. A lack of skills for managing the
academic workload may further be exacerbated by difficulties experienced in reading and
studying academic material in their second or third language (Agar, 1990; Miller et al., 1998).
Educationally disadvantaged students form a big chunk of the student population which is
struggling to cope with their academic workload, particularly in their first year (Agar, 1990;
Huysamen & Raubenheimer, 1999). This country’s educationally disadvantaged students are
generally underprepared for university and the quality of their high school education is likely to
have not prepared them for managing and coping in university (Petersen, 2006).
14
The difficulties students experience in managing their academic workload, have been shown to
have a negative impact on students’ academic adjustment to university and their academic
performance. For example, Chambel and Curral (2005) found significant negative correlations
between students’ perceptions of their academic workload, and their well-being and academic
performance. Students who perceived their workload as high were expected to struggle in their
academic performance as it was hypothesised in the present study that high perceived academic
workload will negatively impact on academic performance.
Adjustment
Research shows that disadvantaged students are particularly vulnerable to adjustment difficulties
during the transition from high school to university (Petersen, 2006). Adjustment is the process
of adapting to something new (such as environmental conditions) by becoming suitable to the
often different circumstances. The ability to adjust to university is influenced by a lot of factors
such as personality characteristics; family, mentor and peer support (Chamers et al., 2001).
When disadvantaged students come to university for the first time they may have to adjust to a
university environment that is often vastly different from their previous school and home
environments which requires them to adjust to the physical, emotional, social and academic
demands of the new environment. Most disadvantaged students have to make transitions from
an impoverished (often rural) environment to an urban environment and are required to adjust to
the new institutional culture that is likely to be different from their own cultures (Bojuwoye,
2002; Miller et al., 1998; Sennett et al., 2003).
Many students coming from impecunious backgrounds experience the physical environment of
the university as frightening and alienating (feeling that one’s values are completely different
from the social collectivity and thus isolating oneself from this social collectivity by having as
minimal interaction with their fellow colleagues as possible), as they often come from
environments that have simpler, less threatening buildings (Bojuwoye, 2002; Loo & Rolison,
1986). Therefore the size and complexity of the university may affect students’ adjustment to
the university as students at big institutions have less opportunity for active interpersonal contact
and are thus less socially integrated (Pascarella & Terenzini, 1991). In the South African context
many students, particularly ‘black’ students at historically ‘white’ universities, would also be
15
coming in close contact with students from different ‘racial’ and cultural groups for the first time
due to the legacy of apartheid’s racial segregation policy. These students are thus more likely to
experience loneliness, social isolation and alienation in the transition from high school to
university (Petersen, 2004). These students are at risk of experiencing social anxiety (Bojuwoye,
2002; Earwaker, 1992; Rickinson, 1998). Strahan (2003), who investigated the effect of social
anxiety on adjustment among undergraduate students at an American university, found a
significant negative correlation between social anxiety and adjustment. Many of the students
receiving need-based financial aid at UCT often reside in the residences on the university
campus (Sennett et al., 2003). Many students, particularly students living away from home, may
feel disconnected from previous sources of support (e.g. family, friends, community, etc.)
(Earwaker, 1992).
Adjustment problems and coping strategies which are a result of having poorly adapted to
university interact with the other factors addressed in this review were shown to negatively
impact on the academic performance of students from previously disadvantaged (including
economically disadvantaged) backgrounds (Malefo, 2002). Adjustment is positively related to
problem-solving and both these factors are said to be almost necessary for academic success
(Baker, 2003). Woosley (2003) found that students, who thought that they were adjusting well,
had made friends and were satisfied with their social life during the first three weeks of
university, were more likely to complete a degree. The impact of adjustment thus depends on
how well the students cope with pressure and their personal problem-solving styles. These are
often developed from high school which makes students from low quality high schools less
equipped in dealing with this as they are often from schools which have not adequately prepared
them for dealing with problems of this nature (i.e. pressure). The inability of the school system to
prepare these students in dealing with these problems is due to low budgets at the school and
consequently the poor quality of their education. This occurs due to the fact that the quality of
education is strongly correlated with its school fees and ‘poor’ families generally do not afford
high quality education as they have limited funds.
There appears to be some agreement on the roles of non-cognitive factors in predicting academic
performance. The South African studies considered the demographic situation of the students in
their studies and the history of higher education in the country and have come to a general
16
consensus that psychosocial, although not directly accounting for the poor performance of
economically disadvantaged students, influences the quality of the adjustment of these students
both socially and academically which in turn affects their academic performance. Psychosocial
functioning, academic adjustment, social support and personal attributes all play important roles
to the adjustment of students at university (Finchilescu et al., 2003). Griffin (1992) argued that
academic adjustment, which is one of the most determining factors of academic performance, is
influenced by students’ interaction with their faculties, their study skills and academic assistance
from lecturers and tutors. It is then, the overall adjustment (academic, social and personal) in
these that is strongly correlated to good academic performance (Petersen, 2006).
Baker (2003) found the grade average in first year as a significant predictor of academic
performance in final year this prediction is one of the major sources of interest for the present
study. Huysamen (2000) adds that throughout the years as disadvantaged students become more
familiar with the learning culture they may show great improvement in their academic
performance, this too will be tested in the present study. This review has shown how certain
psychosocial factors are important to the good performance of the students in their university
studies. Very little research in this area has conducted a longitudinal study of the same group of
students to assess their progress over the years and to the determine more accurately the factors
influencing their academic performance, which is why this study is of utmost importance as it
will fill the literature gap which exists in this area.
In conclusion this introductory section has highlighted the severity of the need for predicting
academic performance in South African and argued for the reasons as to why the ability to do
this is of particular concern in the country. The most significant motivation behind this quest was
shown to be the need to address the high failure and drop-out rates of disadvantaged students
(Miller et al., 1998). Universities in South Africa are facing the challenging task of developing
ways to increase the enrolment and retention of disadvantaged students against a background of
limited financial resources and it is for this reason that these concerns arise (De Villiers, 1999;
Hendry, 1998). This study is therefore of crucial importance in assessing and improving the
support systems provided for the financially aided students and this can only be done once the
factors affecting academic performance are identified (Petersen, 2006; McKenzie & Schweitzer,
2001).
17
Note: Ill-haam Petersen (2006) initiated this study and ran the tests at the end of first year for the
students in this sample. The present study is building up on hers. She measured the academic
performance of the students at the end of first year and I have measured them at the end of third
year, hence this is a longitudinal study that measures long-term academic performance. I have
not however, re-measured the psychosocial variables’ scores firstly because some of the students
have either completed their studies or have been excluded and thus would not be available to
complete the questionnaires as they are no longer at the University of Cape Town. The second
reason I have not remeasured the psychosocial factors is because the main aim of the study is to
test the predictability of academic performance from first year variables and this purpose would
be counteracted if I were to run the tests again. Therefore, the only the new variable in this study
is the academic performance of 2006.
METHOD
The SPSS programme for the analysis of Hierarchical Linear Multiple Regression was used. This
method allowed me to enter all my predictors simultaneously since other methods would require
me to enter my variables in a certain order and this would be really difficult as I could not have
known which variables comes first. The outcome/dependent variable throughout all the analysis
is the success of meeting the requirements of the degree a student is registered for according the
student’s faculty requirements. Academic performance, exclusion/drop-out and the conditions
that students have to meet are defined somewhat different in this study and it is important to note
that; (i) students who changed degrees and or faculties were measured according the
requirements of the degree they were registered for at the end of 2006, (ii) Students who were
excluded at any point of their studies (i.e. end of first, second or third year) were included and
whatever course counts they had accumulated at the end of 2006 were included and whatever
percentages they had accumulated at the end of 2004 were added and calculated as their grade
average, and (iii) in calculating the course count as opposed to grade averages I was able to
measure everyone according to their degrees and faculties such that if a student passed all their
courses at the end of 2006 when they are studying for a four-year degree and another student
who had also passed all their courses but was studying towards a three-year degree and was thus
18
in final year in 2006; both students would get a 100% at the end of 2006 because they would
have both adequately met the requirements for their degrees.
Participants
The participants in this study consisted of 194 students who registered for their first year of
university at the University of Cape Town in 2004. Students chosen for this study had to be
receiving financial assistance from the university and so 100% of the students in this sample
were on financial aid. All of them had just completed their Grade 12 in the previous year (2003).
The sample included students who identified themselves as black (76%), white (5%), Coloured
(17%) and Indian (2%). The students ranged between the ages of 18 and 27 with the mean age
being 19 years of age. This sample was made up of 56% males and 44% females. The majority
(67%) of the students in the sample spoke an African language as their first language (i.e. Xhosa,
Zulu, Sotho), 21% spoke English as a first language and 12% spoke neither English nor any of
the South African languages. The participants comprised of a high 87% who attended
government high schools, 7% who attended private schools and 6% who attended high schools
which were neither government nor private schools. The students in the study were registered in
either one of the five faculties; 33.6% were registered in the Faculty of Commerce, 26.9% in the
Faculty of Humanities, 20.4% in the Faculty of Science, 18.1% in the Faculty of Engineering and
the Built Environment and 1.1% in the Faculty of Law. The matric points obtained by the
students ranged from 17 to 49 with a mean of 36.78 (N=188; SD=5.33). The students were
selected from the 465 students receiving financial aid from the Undergraduate Funding Office as
per UCT’s records. They were invited to participate and only the students who volunteered to
participate and met the requirements ( the students had to be South African citizens, be registered
to study full time, must be from families who have an annual gross income not exceeding R100
000 and their records must be fully completed) were chosen.
Instruments used to measure variables
Help-seeking behaviours were measured through the Student Adaptation to College
Questionnaire. The scores ranged between a ‘yes’ and a ‘no’ answer. These answers have been
transformed to ‘0’ and ‘1’ in the analysis. The asked whether students sought any assistance with
difficulties they were faced with and who these sources of assistance were. Unfortunately, this

19
scale does not measure the frequency, quality and satisfaction of this help and as will be shown
in the discussion section this limitation has severely limited the findings of this study.
Self-esteem was measured through Rosenberg’s Self-esteem scale. This scale consists of 10
items and measures self-esteem on a 4-point Likert scale where the students had to indicate the
extent to which they agreed with the statememts in the scale. A high indicates a high level of
self-esteem and a low score indicates a low level of self-esteem. The reliability of this scale
ranges from 0.67 and 0.88 (Rosenberg, 1979). The scale is widely in South Africa.
Academic motivation was measured by an adapted version of Muller & Louw’s (2004) Scale.
This scale consisted of items from Deci and Ryan’s Self-determination theory (SDT). Only items
based on this SDT theory were used. Academic motivation was measured on a 5-point Likert
scale with answers ranging from ‘strongly disagree’ to ‘agree completely’. Five other subscales
were measured using this scale, these are; (i) intrinsic motivation which measured five items
scored either high or low an example of which is ‘I really have great fun studying’. A high score
indicated a high level of intrinsic motivation; (ii) Extrinsic regulation was measured through
three items where a high score indicates a high level of extrinsic regulation an example of these
items is ‘I am learning primarily for the examinations’ (emphasis added); (iii) introjected
regulation was measured through four items where a high score indicates a high level of
introjected regulation, an example of these items is ‘ I must push myself in order to do the work
in my studies’, (iv) identified regulation was measured through three items an example of which
is ‘I am committed to my work because they are personally very important for me’ and a high
score here also indicates high levels of this attribute and lastly, (v) Amotivation was measured
through a three item scale where a high score means high levels of this attribute, an example of
an Amotivation question is ‘I am very uncertain whether I have chosen the proper field of study’.
The overall reliability of the motivation scale (including the five sub-scales) ranges between 0.60
and 0.85 and is said to be sufficient for group analysis (Muller & Louw, 2004).
Perceived Stress was measured by a scale developed by Cohen, Karmarck and Mermelseit
(1983). This scale is an empirically established index for perceived stress and has scores ranging
between 14 and 70. A high score on this scale indicates a high level of perceived stress.
Examples of questions in this scale are; ‘felt nervous or stressed?’ ‘felt confident about handling
20
personal problems?’ to which students answer by indicating on a 5-point Likert scale ranging
from ‘never’ to ‘very often’.
Academic Workload was measured on a 5-point Likert scale also used by Muller & Louw
(2004) with scores ranging from 1 to 5. The reliability of this scale has been previously shown by
Muller and Louw to have a reliability coefficient of 0.84.
Adjustment was measured with the Student Adaptation to College Questionnaire (SACQ). The
questionnaire is made up of 67 item self-report scale with the assumption that adjustment multi-
faceted and thus its measure should incorporate a wide variety of questions (Baker & Siryk,
1989). These multi-facets include academic adjustment, social adjustment, personal-emotional
adjustment and institutional attachment. The academic adjustment scale consists of six items for
motivation, four items for application, nine items for performance and five items for academic
environment. Low points on this scale indicate a feeling of lacking control. This sub-scale has a
reliability which is in the range between 0.81 and 0.90. The social adjustment sub-scale has
seven items for general questions, seven items for relationships with people, three items for
nostalgia and three items for the social environment. High scores (scores range between 19 and
181) on this sub-scale indicate a high sense of social avoidance. This sub-scales’ reliability falls
between 0.83 and 0.91. The personal-emotional sub-scale has fifteen items which measure the
psychological and physical well-being of students. It thus has two clusters, (i) the psychological,
which has nine items and (ii) the physical which has six items with a reliability coefficient of
between 0.77 and 0.86. Low scores (scores range between 23 and 217) are indicative of low
degree of psychological and physical well-being. Goal commitment and institutional
commitment scales have scores which range between 14 and 136 with a reliability coefficient in
the range of o.85 to 0.91. The grand total of this scale ranges between a minimum of 66 and a
maximum of 604. The SACQ has an overall reliability that ranges between 0.92 and 0.95.
Specifically to the South African population this scale has a reliability which falls in the range
between 0.80 and 0.93.

21
RESULTS
At the end of first year, the mean attained by the students in academic performance was 52. 82%
with the lowest attained year average being 0 and the highest mark obtained being 78.63%. The
standard deviation was 12.40. At the end of the third year of study in 2006 the students obtained
an average of 63.54 with a minimum of 0 and a maximum of 100 and a standard deviation of
31.45 (See Table 1 below). The two academic performances in 2004 and 2006 were measured
differently. Whereas in 2006 the students’ performance according to the course counts minimum
expected at the end of three years was measured, the actual percentage average of marks were
measured at the end of 2004. This different method may be influencing the averages because
although it was impossible for a student to attain a 100% average at the end of first year (they
would have to get a 100% in all their tests, assignments and exams throughout the year) it was
easier to attain this percentage using the second method which would only require that you must
have passed all your courses with at least the minimum pass mark which is 50%. This difference
in the way that these marks are calculated renders it difficult to calculate the difference in
performance between 2004 and 2006. However, this is not a major limitation as the major
concern of the study was not to measure the differences in academic performance but the factors
which contribute to this.
Only one student had an average of 0% at the end of first year, whereas five students attained
this mark at the end of their third year. This means that they failed all their courses although they
may not have necessarily got 0% in any of them. For the one student who attained 0% at the end
of first year, it however means something different. It means that they either did not write any
exams or they were awarded 0% for all their exams.
Only 38 students (approximately 20%) met the requirements set by their various faculties
expected at the end of third year. Approximately 51.7% of the 194 in this study failed to meet the
requirements for their various degrees but they were allowed to continue with their studies this
year (2007) and they are all still registered UCT students. A relatively high 28.8% of the students
(N=56) were excluded from university either in their first, second or third year of study. This is
consistent with Dreijimanis’ estimation which was that of 30% also conducted here in South
Africa. The Faculty of Science had the highest number of drop-out/exclusions rates (21 of the 71
students (29.5%), were excluded) despite the various student support systems they offer and
22
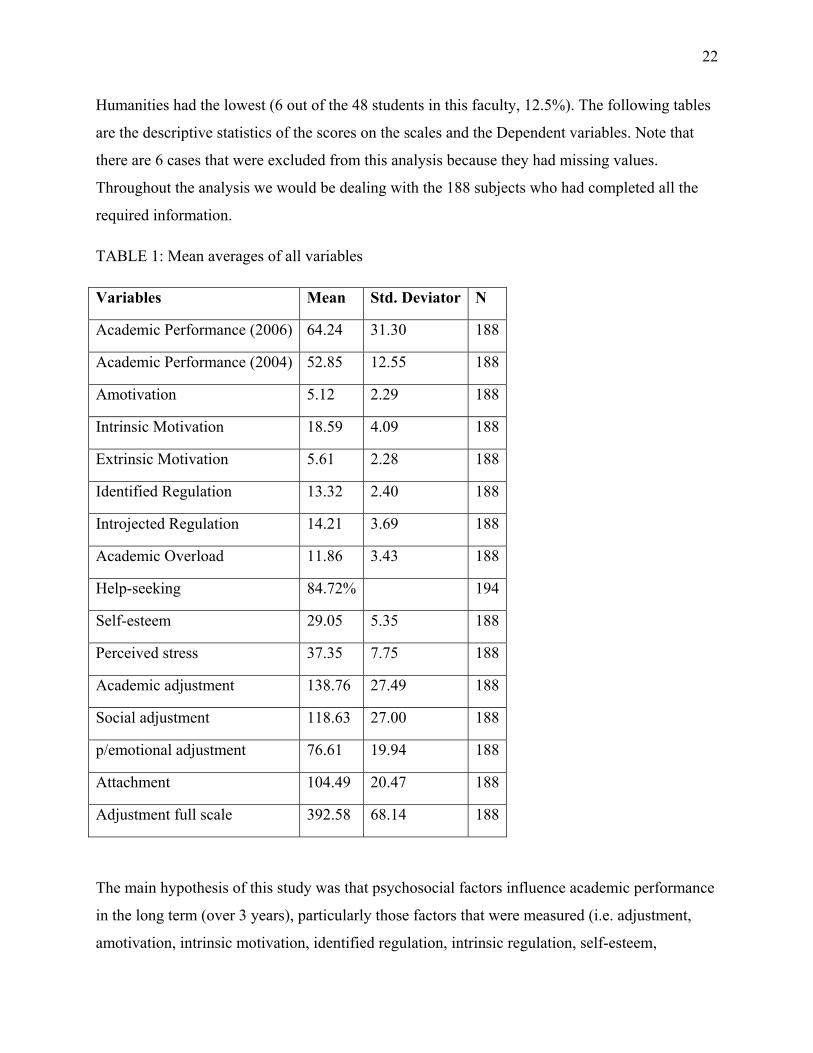
Humanities had the lowest (6 out of the 48 students in this faculty, 12.5%). The following tables
are the descriptive statistics of the scores on the scales and the Dependent variables. Note that
there are 6 cases that were excluded from this analysis because they had missing values.
Throughout the analysis we would be dealing with the 188 subjects who had completed all the
required information.
TABLE 1: Mean averages of all variables
Variables Mean Std. Deviator N
Academic Performance (2006) 64.24 31.30 188
Academic Performance (2004) 52.85 12.55 188
Amotivation 5.12 2.29 188
Intrinsic Motivation 18.59 4.09 188
Extrinsic Motivation 5.61 2.28 188
Identified Regulation 13.32 2.40 188
Introjected Regulation 14.21 3.69 188
Academic Overload 11.86 3.43 188
Help-seeking 84.72% 194
Self-esteem 29.05 5.35 188
Perceived stress 37.35 7.75 188
Academic adjustment 138.76 27.49 188
Social adjustment 118.63 27.00 188
p/emotional adjustment 76.61 19.94 188
Attachment 104.49 20.47 188
Adjustment full scale 392.58 68.14 188
The main hypothesis of this study was that psychosocial factors influence academic performance
in the long term (over 3 years), particularly those factors that were measured (i.e. adjustment,
amotivation, intrinsic motivation, identified regulation, intrinsic regulation, self-esteem,
23
perceived stress, academic adjustment). Specific hypothesis were that seeking help will have a
positive association with adjustment. This variable (help-seeking) was found in many studies to
significantly impact on adjustment was found to not have such influence at the end of the first
year of study and surprisingly was found to have a negative relationship with academic
performance at the end of third year (β=-0.049) which means that as a student sought help, their
performance chances decreased by 0.049 units. Also expected was that Amotivation will have a
negative association with adjustment and academic performance indicating that students’
motivation influences their performance; this relationship was shown to be true both at the end of
first year and at the end of third year with unstandardised results showing that as Amotivation
increased by 0.124 units in scores then academic performance at the end of first year would
decrease by 1% and the strength of Amotiovation was 0.009 in the standardised results. Intrinsic
motivation and Identified regulation were expected to both have a positive association with both
adjustment and academic performance this was not so at the end of third year. Both these
variables had a negative impact on academic performance with β=0.061 and β=0.095
respectively. Introjected regulation was expected to have a negative influence on academic
performance, it turned out however to have a positive one (β=0.005). Perceived stress and
Academic overload were both also expected to have negative influences academic performance.
Interestingly the results show that as perceived stress increases so does academic performance
(β=0.303). Academic overload was as expected, negatively influential on academic performance
with a standardised beta value of 0.129.Self-esteem was expected to have a positive influence
academic performance and so was Adjustment both were as expected with β=0.104 and β=0.211
respectively.
Two hierarchical linear regression analyses were run in this study. Both were aimed at finding
the best fitting model for the prediction of academic performance in the sample. The first
analysis measured the psychosocial factors simultaneously with academic performance as a
dependent variable. In the collinearity results of this analysis it was found that there were high
levels of collinearity between some of the Independent variables, particularly, the adjustment
subscales with the adjustment full scale. These factors had strong correlations with the
adjustment full scale; academic adjustment had a 0.84 correlation; social adjustment had a 0.79;
personal/emotional had 0.72 and attachment had 0.80.These factors also had high collinearity
values of 0.95, 0.85, 0.90, and 0.71 respectively. These relationships were cause for concern as
24
they not only had high scores of collinearity, they also were high Variance Inflation Factors.
Relationships between variables which are above 0.70 in the collienearity diagnostics and whose
scores are above 10 in the VIF are considered best removed or excluded from the study as they
limit the size of R (the fit iof the model), they also comourflage the individual importance of the
variables and often result in unstable predictor variables (Field, 2005). Analysis which included
all the adjustment sub scales yielded the following scores; Academic adjustment had a VIF of
37.80, Social adjustment had (20.93); Personal/emotional adjustment had a VIF of 19.52;
Attachment had a VIF of 11.15 and overall adjustment full scale had a VIF of 190.89 with the
preceding variables. For this reason, the sub-scales in adjustment were removed and only the
adjustment full scale was used so as to be able to make a more accurate prediction of whether the
students will meet their requirements in their respective degrees. Although including these
variables yielded the highest variance at 36.5% Adjusted R square value (See tables A.2 in
appendix A). The results are summarised below and the rest of the results are in Tables A.2 of
Appendix A.

25
Table 2: Beta summary table.
Predictor Variable B SE B β
Constant -9.120 36.26
Amotivation -0.124 1.10 0.009
Intrinsic Motivation -0.468 0.76 -0.06
Extrinsic Motivation -1.302 1.16 0.095
Identified Regulation 0.206 1.25 0.016
Introjected Regulation 0.047 0.71 0.005
Academic Overload -1.180 0.72 -0.01
Help-seeking -3.618 5.39 -0.04
Self-esteem 0.606 0.51 0.104
Perceived Stress 1.224 0.40 0.303
Adjustment (FullScale) 0.097 0.05 0.211
R square: 0.092, Adjusted R Square: 0.041, p=0.065, df=187.
These low results demonstrate that the psychosocial factors included in this study were not
necessarily the most influential to academic performance. Unfortunately this means that the
psychosocial factors under this study do not help us explain much in terms of the factors that
determine whether students from previously disadvantaged backgrounds will meet the
requirements at the end of third year. It appears that without academic performance at the end of
first year we cannot make strong inferences and predictions on how a student will perform after
three years. We can only attribute 9% (R square and 4% adjusted R square) of the variance to
these variables using the results from this analysis (See Table A. 1. Appendix A.). Although the
academic performance results from the end of first year cannot be considered a psychosocial
26
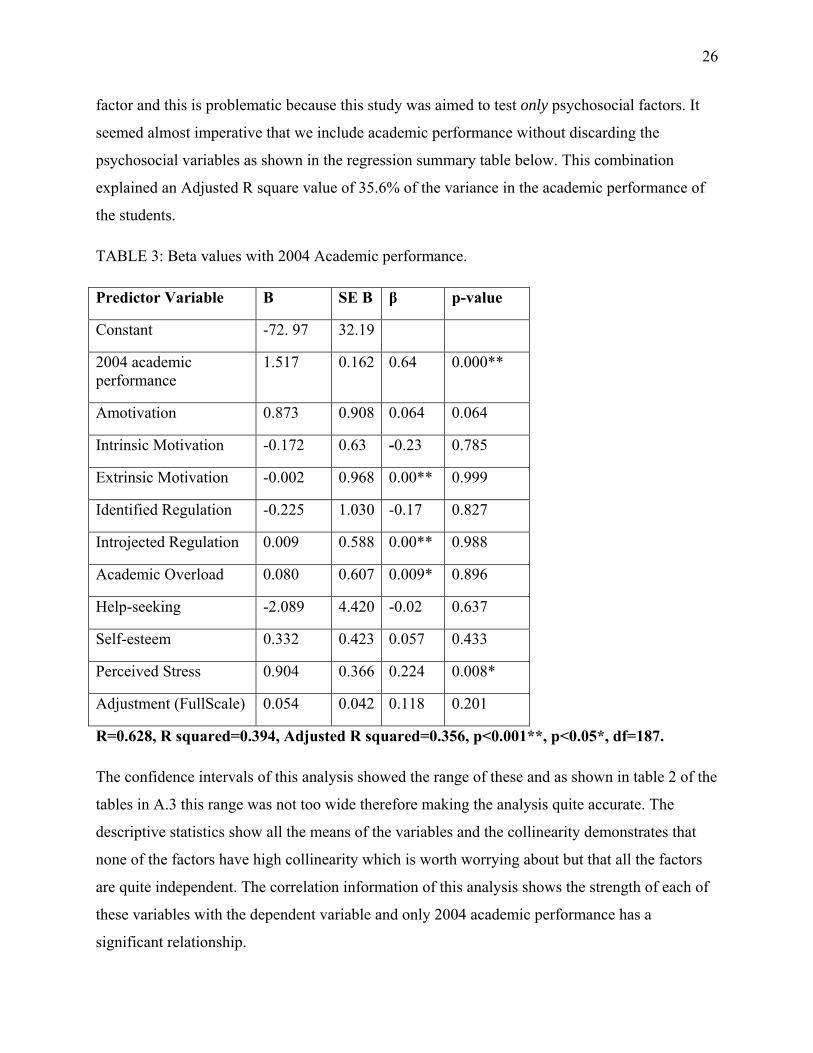
factor and this is problematic because this study was aimed to test only psychosocial factors. It
seemed almost imperative that we include academic performance without discarding the
psychosocial variables as shown in the regression summary table below. This combination
explained an Adjusted R square value of 35.6% of the variance in the academic performance of
the students.
TABLE 3: Beta values with 2004 Academic performance.
Predictor Variable B SE B β p-value
Constant -72. 97 32.19
2004 academic performance
1.517 0.162 0.64 0.000**
Amotivation 0.873 0.908 0.064 0.064
Intrinsic Motivation -0.172 0.63 -0.23 0.785
Extrinsic Motivation -0.002 0.968 0.00** 0.999
Identified Regulation -0.225 1.030 -0.17 0.827
Introjected Regulation 0.009 0.588 0.00** 0.988
Academic Overload 0.080 0.607 0.009* 0.896
Help-seeking -2.089 4.420 -0.02 0.637
Self-esteem 0.332 0.423 0.057 0.433
Perceived Stress 0.904 0.366 0.224 0.008*
Adjustment (FullScale) 0.054 0.042 0.118 0.201
R=0.628, R squared=0.394, Adjusted R squared=0.356, p<0.001**, p<0.05*, df=187.
The confidence intervals of this analysis showed the range of these and as shown in table 2 of the
tables in A.3 this range was not too wide therefore making the analysis quite accurate. The
descriptive statistics show all the means of the variables and the collinearity demonstrates that
none of the factors have high collinearity which is worth worrying about but that all the factors
are quite independent. The correlation information of this analysis shows the strength of each of
these variables with the dependent variable and only 2004 academic performance has a
significant relationship.

27
DISCUSSION
The students in this study had low levels of amotivation. There were high levels of self-esteem
amongst these students which Aspinwall and Taylor (1992); Coffman and Gilligan (2002-2003)
correlated with high competency and effective coping strategies. Although the students in this
study reported high levels of self-esteem with a mean of 29 (out of a possible score of 40) they
still performed poorly academically, certainly not in accordance with their self-esteem scores.
High levels of intrinsic motivation were found, many of them sought help (84.7%), they had high
levels of perceived stress, most of them reported to have adjusted well socially and academically.
Most of them felt that they had too much work (academic overload) and they had high levels of
introjected regulation. Their overall adjustment was high. Considering these means (see Table 1
on page 22) one would expect a higher average as only the help-seeking result was unexpected.
However, as shown in Table A.4 in Appendix A none of the factors had a strong enough (approx.
0.45) relationship with academic performance.
The low levels of influence of the variables in this study and their shown weak influence on
academic performance could be due to a number of factors such as the fairly low sample (only
188 of the 194 students in the study were included in the analysis, the other 6 had missing
information in one variable or another. The second possible reason for this is that the scores used
in the Independent variables were self-reported by the students whereas the academic results and
averages were obtained directly from the university records. It is known that subjects often
distort the truth and respond according to what they think is expected by the researcher. The third
possible reason for the insignificant findings could perhaps have been the method used for
analysis.
The academic performance in first year was the best predictor of academic performance after
three years for the students in this sample. It yielded an R square value of 0.30 by itself meaning
that 30% of the variance in academic performance in three years can be explained by the
academic performance at the end of first year. The correlation of the psychosocial factors in this
study (excluding the adjustment subscales and academic performance from 2004) is a mere 0.303
which only accounts for approximately 9% of the variance in the academic performance at the
end of third year. This value decreases even more in the adjusted R square value (i.e. 0.041)
28
which means that we can only safely explain about 4% of the variance as 5% of it could have
happened by chance at p<0.05 level of significance.
The variables showed some few strong relationships between each other. Intrinsic motivation
had a correlation of r=0.526 with the adjustment full scale and r=0.584 with Identified
regulation. Self-esteem had a strong, negative relationship with perceived stress (r=-0.520) and a
positive relationship with adjustment (r=0.501). Perceived stress had a strong negative
relationship with adjustment (r=-0.649). All these relationships were significant at p<0.05.
CONCLUSION
This study aimed to measure the influence of psychosocial factors on academic performance
after three years. Petersen (2006) and I followed the progress of a group of 194 students from
previously disadvantaged backgrounds and studied the influence of 15 psychosocial factors on
their performance. The study found that these psychosocial factors alone did not explain much of
the variance of academic performance and that the academic performance at the end of first year
was a good predictor of performance after three years. Only 20% of the students in this sample
had met the requirements set out in their faculties for their degrees. Although this is a small
percentage we cannot ignore the fact that most of these students would have not afforded to go to
university had it not been for the financial assistance they receive. The other students who are
continuing with their studies are will, hopefully, also meet their expected outcomes (for which
most is to graduate for their degrees at the end of 2007). This national funding is thus
significantly increasing the number of graduates produced in the country (National Plan for
Higher Education, 2002).
Quite interesting in this study is that 20 of the of the 38 students (53%) were registered in the
Humanities faculty and only 5 (13%) whereas there was not such a wide difference between the
number of participants from each group with 26.9% being from Humanities and 20.4% being
from the Science faculty. This is interesting because the faculty of Science has more than three
(specifically for the science faculty) programmes which are in place for assisting students with
their academic work and the humanities has no special programmes apart from those endorsed by
the university as a whole. This alludes to the possibility that the programmes in place are not
meeting the students’ need, that perhaps more money should be invested in the academic
29
development and academic adjustment programmes as opposed to psychosocial interventions
which are what most of the programmes in the science faculty involve.
The current design of the different interventions vary from programmes aimed specifically at
assisting students to bridge the gap in the specific content of a course, to programmes aimed
specifically at facilitating students’ adjustment to university and equipping them with necessary
life-skills (Miller et al., 2001). This design may need to be revised and more attention and money
should be allocated in bridging the gap between previously disadvantaged students with their
fellow colleagues who have not been deprived of essential management and coping techniques
and who do not experience any language barriers. These programmes should thus focus on
course content (the programmes dealing with this aspect are referred to as academic development
programmes) as opposed to psychosocial factors which have been shown to have minimal
influence on academic performance. These Academic development programmes include, access,
bridging, foundation and extended programmes and evaluations of these programmes show that
the programmes have been successful in improving the students’ academic performance (e.g. De
Boer & van Rensburg, 1997; Miller et al., 2001; Woollacott & Henning, 2004).
In order for intervention to be effective with regard to improving financial aided students the
university should support more studies similar to this one which will look at the other factors
influencing academic performance. These need not be limited to psychosocial factors only but to
other factors as well such as the quality of the school that the students were in prior to be at
university. If these other factors can be thoroughly understood then appropriate intervention can
be provided to assist the students from economically disadvantaged backgrounds in performing
better academically. In future studies it may be useful to test some of the following identified
possible predictors of academic performance. Finchilescu et al. (2003) further identified
problems with English being used as the medium of instruction problematic for students who are
non-English first language speakers, as this causes the inability to receive and communicate
information with their English-speaking lecturers and tutors (Nyamapfene & Letseka, 1996). A
lack of competence in understanding English encourages rote learning, which could be
detrimental to students’ academic studies (Agar, 1990). These students may thus already be at a
disadvantage and may immense difficulty in adjusting to the academic demands of the
university.

30
Dass-Brailsford (2005) identified strong initiative, motivation and goal orientation as some of the
attributes of students who performed well at university. Problem-solving skills and confidence
together have been shown to account for 15% of the adjustment to university (Baker, 2003).
Working styles such as the (i) Willingness to take on the challenge that university presents, (ii)
working consistently, (iii) time management skills, (iv) approach to studying and (v) cultural
factors are further contributors to successfully completing university studies (Meyer, 1990;
Lahmers & Zulauf, 2000). Ferreira (1995) also found that the transition from school to university
contributes to poor performance at university because of the fundamentally different teaching
styles. Where high school education focuses on the acquisition of knowledge university
education is mostly about the application of knowledge and independent work (p.154). Other
internal, emotional factors such as the experiences of subtle racism, feelings of alienation, socio-
political influences and an inferiority complex could affecting the academic performance of
previously disadvantaged students (Lea,1988; Leon & Lea, 1988). In this study however, time
constraints have not deemed it possible to measure all these other factors as specific interest was
in psychpsocial factors. These factors are nonetheless worth exploring further as they may
explain the variance unexplained by the factors under the present study. None of the differences
between the students’ marks can be attributed to changes in demographic information such as
age, race and gender. Therefore, the overall poor performance cannot be attributed to individual
strengths and weaknesses in coping with the demands of university but to group dynamics at
play in these previously disadvantaged students such as the educational disadvantage.
This paper thus raises a compelling need to investigate the factors influencing academic
performance and encourages the focus to be more on academic performance at the end of first
year as this study showed that in predicting long-term academic performance the performance at
the end of first year helps us explain much of the variance.
31
REFERENCES
Agar, D. (1990). Non-traditional students: Perceptions of problems which influence academic
success. Higher Education, 19, 435-454.
Allen, W. R. (1985). Black student, white campus: structural interpersonal and psychological
correlates of success. Journal of Negro Education, 54, 134-147.
Aspinwall, L. G., and Taylor, S. E. (1992). Modeling cognitive adaptation: A longitudinal
investigation of the impact of individual differences and coping on college adjustment and
performance. Journal of Personality and Social Psychology, 63, 989-1003.
Baker, S. (2003). A prospective longitudinal investigation of social problem-solving appraisals
on adjustment to university, stress, health, and academic motivation and performance.
Personality and Individual Differences, 35, 569-591.
Berg, A. S. (1991). The relationship between self concept, family factors and academic
achievement. Unpublished Masters Thesis.University of the Witwatesrand, Johannesburg.
Beyefeld, A. A., Hugo, A. P., & Struwig, M. C. (2005). An innovative approach to the
management of knowledge overload in the medical microbiology. South African Journal of
Higher Education, 19, 1473-1485.
Bitzer, E. & Troskie-De Bruin, C. (2004). The effect of factors related to prior schooling on
student persistence in higher education. South African Journal of Education, 24, 119-125.
Bojuwoye, O. (2002). Stressful experiences of first year students of selected universities in South
Africa. Counselling Psychology Quarterly, 15, 277-290.
Borkost, F. D; Foster, D. H. & Lea, S. J. (1992). Factors affecting academic performance in first-
year psychology at the University of Cape Town. South African Journal of Higher Education, 6,
59-65.
32
Botha, H.L., Braud, H. J., Cilliers, C. D., Davidow, A., de Jager, A. C., & Smith, D. (2005).
Student counseling.
Boulter, L.T. (2002). Self-concept as a predictor of college freshman academic adjustment.
[Electronic Version]. College Student Journal, 36, 234-247.
Chambel, M. J. & Curral, L. (2005). Stress in academic life: Work characteristics as predictors
of student well-being and performance. Applied Psychology: An International Review, 54, 135-
147.
Chemers, M. M., Hu, L., Garcia, B. F. (2001). Academic self-efficacy and first year college
student performance and adjustment. Journal of Educational Psychology, 93, 55-64.
Coffman, D. L. & Gillian, T. D. (2002-2003). Social support, stress and self-efficacy: Effects on
students satisfaction. College Student Rentention,4, 53-66.
Cohen, S., Kamarck, T. & Mermelstein, R. (1983). A global measure of perceived stress. Journal
of Health & Social Behaviour, 24, 385-396.
Committee of University Principals (CUP). (1987). Report of work committee of the CUP
investigation: Accessibility of university study. Investigation into macro aspects of the university
in South Africa. Pretoria: Committee of University Principals.
Crocker, J. & Luhtanen, R.K. (2003). Level of self-esteem and contingencies of self-worth:
Unique effects on academic, social, and financial problems in college students. Personality and
Social Psychology Bulletin, 29, 701-712.
Dass-Brailsford, P. (2005). Exploring resiliency: Academic achievement among disadvantaged
black youth in South Africa. South African Journal of Psychology, 35, 574-591.
De Boer, A. L. & van Rensburg, M. C. J. (1997). Underprepared students in the faculty of arts:
Burden or boon? A preliminary report. [Electronic version]. South African Journal of
Ethnology, 20, 159-164.
33
Dlamini, C. R. M. (1995). The transformation of South African Universities. South African
Journal of Higher Education, 9, 39-46.
Doyle, M. (2002, Fall). First year adjustment to university: What do students need from faculty?
[Electronic Version] The News. About Teaching and Learning at Memorial. Newsletter of the
Instructional Development Office, 6, 1-4.
Dreijmans, J. (1988). The Role of the South African government in tertiary education. South
African Institute for Race relations: Johannesburg.
Earwaker, J. (1992). Helping and supporting students. Rethinking the issues. Buckingham:
SRHE and Open University Press.
De Villiers, A. B. (1999). Disadvantaged students’ academic performance: Analysing the zone
of proximal development. Unpublished doctoral thesis, University of Cape Town, South Africa.
Grayson, J. P. (2003). The consequences to early adjustment to university. Higher Education, 46,
411-429.
Ferreira, J. G. (1995). Transition from school to university. South African Journal of Higher
Education, 9, 154-158.
Field, A. (2005). Discovering Statistics using SPSS, 2nd Ed. London: Sage Publications.
Finchilescu, G., Gibson, K., Sennet, J. and Strauss, R. (2003). Adjustment of black students at a
historically white South African University. Educational Psychology, 23, 107-116.
Flemming, J. (1984). Blacks in College. San Francisco: Jossey-Buss.
Fraser, W. and Killen, R. (2005). The perceptions of students and lecturers of some factors
influencing academic performance at two South Africa universities. Perspectives in Education,
23, 25-40.
Fresen, J. & Fresen, J. (1987). Correlation between matric symbols and first-year university
results: business statistics as an example, South African Journal of Sociology, 83, 123-145.
34
Fuller, B., Lockheed, M. E., and Nyirongo, R. (1989). Family effects on students’achievement in
Thailand and Malawi. Sociology of Education, 62, 239-256.
Grant-Vallone, E., Reid, K., Umali, C., & Pohlert, E. (2003). An analysis of the effects of self-
esteem, social support,and participartion in student support services on students’ adjustment and
commitment to college. Journal of College Student Retention, 5, 255-274.
Hansen, M. N. & Mastekaasa, A. (2006). Social Origins and Academic Performance at
University. European Sociological Review, 22, 277-291.
Hendry, J. (1998). The analysis and prediction of student progression through degree
programmes: A cohort analysis of undergraduate students at the University of Cape Town.
Unpublished master’s thesis, University of Cape Town, South Africa.
Honikman, K. (1982). Processes and problems of first-year students at a South African
University. Unpublished master’s thesis, University of Cape Town, South Africa.
Huysamen, G. K. & Raubenheimer, J. E. (1999). Demographic-group differences in the
prediction of tertiary-academic performance. South African Journal of Higher Education, 13,
171-177.
Huysamen, G. K. (2000). The differential validity of matriculation and university performance as
predictors of post-first-year performance. South African Journal of Higher Education, 14, 146-
151.
Jawitz, J. (1995). Perormance in first-and second-year engineering at UCT. South African
Journal of Higher Education, 9, 101-108.
Jenkins, L. E. (1989). The black family and academic achievement. In Asamen, J. K and Berry,
G. L. (Eds). (1987). Black Students Psychosocial Issues and Achievement. New York: Sage
Publishers.
Kleemann, G. L. (1994). Achieving academic success with ethnically diverse students:
Implications for student affairs. National Association of Student Personnel Administration
Journal, 31, 137-149.
35
Letseka, M. & Nyamapfene, K. (1995). Problems of learning among first year students in South
African universities. South African Journal of Higher Education, 9, 159-167.
Loo, C. M. & Rolison, G. (1986). Alienation of ethnic minority students at a predominantly
white university. Journal of Higher Education, 57, 58-77.
Malefo, V. (2002). Psycho-social factors and academic performance among African women
students at a predominantly white university in South Africa. South African Journal of
Psychology, 30, 40-45.
McLaren, P. (1989). Life in Schools. New York: Longman Inc.
McKenzie, K. & Schweitzer, R. (2001). Who succeeds at university? Factors predicting
academic performance in first year Australian university students. Higher Education Research &
Development, 20, 21-33.
Miller, R., Bradbury, J., & Pedley, K. (1998). Academic performance of first and second
language students: Disadvantage and underpreparedness [Electronic version]. South African
Journal of Science, 94, 103-107.
Myers, R. (1990). Classical and modern regression with applications, 2nd ed. Boston, MA:
Duxbury.
Ndebele, N. (2004). Higher education and political transition. Retrieved January 7, 2006,
from Centre for Higher Education Transformation (CHET) Web site:
http://www.chet.org.za/issues/Njabulo%20Article.doc
Nettles, M. T. (Ed). (1988). Toward Black Undergraduate Student Equality in American
Education. New York: Greenwood Press.
No Author. (2001). National Plan for Higher Education. Retrieved from:
http://education.pwv.gov.za
No Author. (2001). Student Services Tactical Plan. University of Canberra, Australia. Retrieved
from http://www.canberra.edu.au/corporate/quality/plans/stuserv.html.
36
Nunns, C. & Ortlepp, K. (1994). Exploring predictors of academic success in Psychology I at
Wits University as an important component of fair student selection. South African Journal of
Psychology, 24, 201-207.
Pascarella, E. T. & Terenzini, P. T. (1991). How college affects students. Findings and insights
from twenty years of research. San Fransisco: Jossey-Bass Publishers.
Petersen, I. (2006). Psychosocial factors and academic performance among first-year financial
aid students: Testing adjustment as a mediator variable. Unpublished masters thesis. University
of Cape Town, South Africa.
Potter, C. & van der Merwe, E. (1993). Academic performance in Engineering. South African
Journal Of Higher Education, 7, 33-46.
Povey, J. (2003). CAP: Exploring a relationship between non-cognitive variables and academic
performance: a comparison study. Unpublished report, University of Port Elizabeth, Port
Elizabeth.
Prillerman, S. L., Myers, H. F., & Smedley, B. D. (1989). Stress, well-being, and academic
achievement in college. In G. L. V. Berry & J. K. Asamen, Black students. Psychosocial issues
and academic achievement (pp. 198-217). California: Sage Publications, Inc.
Rickinson, B. (1998). The relationship between undergraduate student counselling and
successful degree completion. Studies in Higher Education, 23, 95-102.
Rosenberg, M. (1979). Conceiving the self. Malabar, Florida: Robert E. Krieger Publishing
Company.
Rosenberg, M., Schooler, C., Schoenbach, C., & Rosenberg, F. (1995). Global self-esteem and
specific self-esteem: Different concepts, different outcomes. American Sociological Review, 60,
141-156.
37
Shaikh, B. T., Kahloon, A., Kazmi, M., Khalid, H., Nawaz, K., Khan, N. A., & Khan, S. (2004).
Students, stress and coping strategies: A case of Pakistani medical school. Education for Health,
17, 346-353.
Shochet, I. (1986). University admissions: can we measure potential? ASPECTS, 6: 1-24.
Seifert, T. L. (2004). Understanding student motivation. Educational Research, 46, 137-149.
Sennett, J., Finchilescu, G., Gibson, K., & Strauss, R. (2003). Adjustment of black students at a
historically white South African university. Educational Psychology, 23, 107-116.
Strahan, E. Y. (2003). The effects of social anxiety and social skills on academic performance.
Personality and Individual Differences, 34, 347-366.
Stoker, D. J. (1985). Investigation into differential entrance requirements for tertiary education
institutions. Report WS-32, Human Sciences Research Council.
SPSS for Windows. (2007). Rel.11.0.1. Chicago: SPSS Inc.
Tinto, V. (1993). Leaving College: Rethinking the causes and cures of student attrition (2nd Ed).
Chicago: University of Chicago Press.
Tinto, V. (2006-2007). Research & practice of student retention: What next? Journal of College
Student Retention, 8, 1-19.
Van Wyk, J. A. & Crawford, J. L. (1984). Correlation between matric symbols and marks
obtained in a firststyle ancillary Physics course at the University of the Witwatersrand. South
African Journal of Sociology, 80: 45-78.
Woollacott, L. & Henning, L. (2004, March). Dealing with under-preparedness in engineering
entrants: A perspective from Wits [Electronic Version]. For Engineering Educators, 8, 3-8.
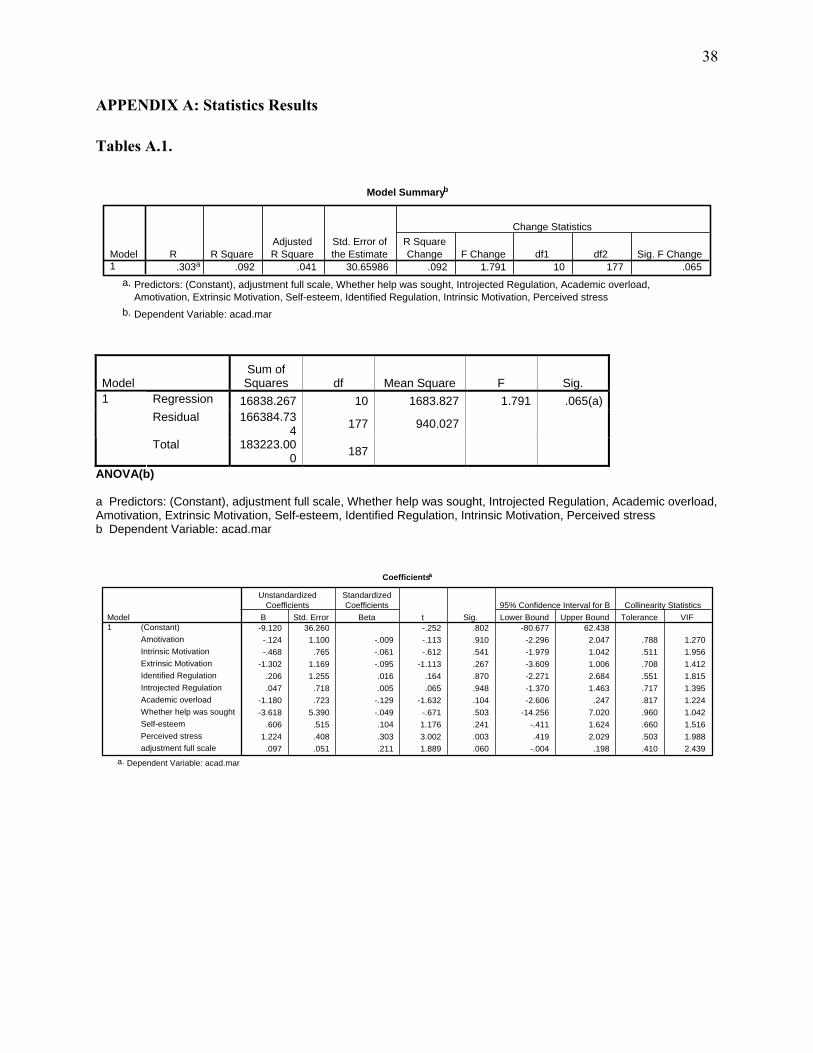
38
APPENDIX A: Statistics Results
Tables A.1.
Model Summaryb
.303a .092 .041 30.65986 .092 1.791 10 177 .065Model1
R R SquareAdjustedR Square
Std. Error ofthe Estimate
R SquareChange F Change df1 df2 Sig. F Change
Change Statistics
Predictors: (Constant), adjustment full scale, Whether help was sought, Introjected Regulation, Academic overload,Amotivation, Extrinsic Motivation, Self-esteem, Identified Regulation, Intrinsic Motivation, Perceived stress
a.
Dependent Variable: acad.marb.
Model Sum of
Squares df Mean Square F Sig. Regression 16838.267 10 1683.827 1.791 .065(a) Residual 166384.73
4 177 940.027
1
Total 183223.000 187
ANOVA(b) a Predictors: (Constant), adjustment full scale, Whether help was sought, Introjected Regulation, Academic overload, Amotivation, Extrinsic Motivation, Self-esteem, Identified Regulation, Intrinsic Motivation, Perceived stress b Dependent Variable: acad.mar
Coefficientsa
-9.120 36.260 -.252 .802 -80.677 62.438-.124 1.100 -.009 -.113 .910 -2.296 2.047 .788 1.270-.468 .765 -.061 -.612 .541 -1.979 1.042 .511 1.956
-1.302 1.169 -.095 -1.113 .267 -3.609 1.006 .708 1.412.206 1.255 .016 .164 .870 -2.271 2.684 .551 1.815.047 .718 .005 .065 .948 -1.370 1.463 .717 1.395
-1.180 .723 -.129 -1.632 .104 -2.606 .247 .817 1.224-3.618 5.390 -.049 -.671 .503 -14.256 7.020 .960 1.042
.606 .515 .104 1.176 .241 -.411 1.624 .660 1.5161.224 .408 .303 3.002 .003 .419 2.029 .503 1.988
.097 .051 .211 1.889 .060 -.004 .198 .410 2.439
(Constant)AmotivationIntrinsic MotivationExtrinsic MotivationIdentified RegulationIntrojected RegulationAcademic overloadWhether help was soughtSelf-esteemPerceived stressadjustment full scale
Model1
B Std. Error
UnstandardizedCoefficients
Beta
StandardizedCoefficients
t Sig. Lower Bound Upper Bound95% Confidence Interval for B
Tolerance VIFCollinearity Statistics
Dependent Variable: acad.mara.

39
Descriptive Statistics
64.2355 31.30179 18852.8540 12.54744 188
5.1223 2.29646 18818.6383 4.09727 188
5.6117 2.27830 18813.3218 2.40630 18814.2128 3.68803 18811.8564 3.43240 188
.23 .425 18829.0512 5.35469 18837.3528 7.75180 188
392.5790 68.13649 188
acad.maracad_marAmotivationIntrinsic MotivationExtrinsic MotivationIdentified RegulationIntrojected RegulationAcademic overloadWhether help was soughtSelf-esteemPerceived stressadjustment full scale
Mean Std. Deviation N
Model Summaryb
.628a .394 .356 25.12213 .394 10.392 11 176 .000 1.826Model1
R R SquareAdjustedR Square
Std. Error ofthe Estimate
R SquareChange F Change df1 df2 Sig. F Change
Change StatisticsDurbin-Watson
Predictors: (Constant), adjustment full scale, Whether help was sought, Introjected Regulation, acad_mar, Amotivation, Academic overload,Self-esteem, Identified Regulation, Extrinsic Motivation, Intrinsic Motivation, Perceived stress
a.
Dependent Variable: acad.marb.
ANOVAb
72145.629 11 6558.694 10.392 .000a
111077.4 176 631.121183223.0 187
RegressionResidualTotal
Model1
Sum ofSquares df Mean Square F Sig.
Predictors: (Constant), adjustment full scale, Whether help was sought, IntrojectedRegulation, acad_mar, Amotivation, Academic overload, Self-esteem, IdentifiedRegulation, Extrinsic Motivation, Intrinsic Motivation, Perceived stress
a.
Dependent Variable: acad.marb.

40
Coefficientsa
-79.550 30.649 -2.596 .010 -140.036 -19.0641.517 .162 .608 9.361 .000 1.197 1.837 .816 1.225.873 .908 .064 .962 .337 -.918 2.665 .777 1.288
-.172 .628 -.023 -.274 .785 -1.411 1.067 .510 1.961-.002 .968 .000 -.002 .999 -1.912 1.909 .694 1.441-.225 1.030 -.017 -.218 .827 -2.257 1.807 .550 1.819.009 .588 .001 .015 .988 -1.152 1.170 .717 1.395.080 .607 .009 .131 .896 -1.119 1.278 .777 1.287
-2.089 4.420 -.028 -.473 .637 -10.812 6.634 .959 1.043.332 .423 .057 .785 .433 -.503 1.168 .657 1.523.904 .336 .224 2.691 .008 .241 1.567 .498 2.008.054 .042 .118 1.284 .201 -.029 .138 .405 2.467
(Constant)acad_marAmotivationIntrinsic MotivationExtrinsic MotivationIdentified RegulationIntrojected RegulationAcademic overloadWhether help was soughtSelf-esteemPerceived stressadjustment full scale
Model1
B Std. Error
UnstandardizedCoefficients
Beta
StandardizedCoefficients
t Sig. Lower Bound Upper Bound95% Confidence Interval for B
Tolerance VIFCollinearity Statistics
Dependent Variable: acad.mara.
Residuals Statisticsa
-14.8765 106.6742 64.2355 19.64193 188-4.028 2.161 .000 1.000 188
3.448 11.798 6.173 1.481 188
-17.8206 107.9117 64.1964 19.87636 188-61.76382 70.50729 .00000 24.37205 188
-2.459 2.807 .000 .970 188-2.516 2.934 .001 1.004 188
-64.80434 77.04742 .03916 26.10067 188-2.555 3.000 .000 1.009 1882.528 40.248 10.941 5.936 188
.000 .067 .006 .009 188
.014 .215 .059 .032 188
Predicted ValueStd. Predicted ValueStandard Error ofPredicted ValueAdjusted Predicted ValueResidualStd. ResidualStud. ResidualDeleted ResidualStud. Deleted ResidualMahal. DistanceCook's DistanceCentered Leverage Value
Minimum Maximum Mean Std. Deviation N
Dependent Variable: acad.mara.

41
Regression Standardized Predicted Value20-2-4
Reg
ress
ion
Stan
dard
ized
Res
idua
l
3
2
1
0
-1
-2
-3
Scatterplot
Dependent Variable: acad.mar
Tables A.2
Model Summaryb
.645a .416 .365 24.93571 .416 8.178 15 172 .000Model1
R R SquareAdjustedR Square
Std. Error ofthe Estimate
R SquareChange F Change df1 df2 Sig. F Change
Change Statistics
Predictors: (Constant), adjustment full scale, Whether help was sought, Introjected Regulation, acad_mar, Amotivation,Academic overload, Self-esteem, Identified Regulation, Extrinsic Motivation, Intrinsic Motivation, Perceived stress, p/emotionaladjustment, attachment, social adjustment, academic adjustment
a.
Dependent Variable: acad.marb.

42
ANOVAb
76275.194 15 5085.013 8.178 .000a
106947.8 172 621.790183223.0 187
RegressionResidualTotal
Model1
Sum ofSquares df Mean Square F Sig.
Predictors: (Constant), adjustment full scale, Whether help was sought, IntrojectedRegulation, acad_mar, Amotivation, Academic overload, Self-esteem, IdentifiedRegulation, Extrinsic Motivation, Intrinsic Motivation, Perceived stress, p/emotionaladjustment, attachment, social adjustment, academic adjustment
a.
Dependent Variable: acad.marb.
Tables A.3.
Descriptive Statistics
64.2355 31.30179 1885.1223 2.29646 188
18.6383 4.09727 1885.6117 2.27830 188
13.3218 2.40630 18814.2128 3.68803 18811.8564 3.43240 188
.23 .425 18829.0512 5.35469 18837.3528 7.75180 188
392.5790 68.13649 188
acad.marAmotivationIntrinsic MotivationExtrinsic MotivationIdentified RegulationIntrojected RegulationAcademic overloadWhether help was soughtSelf-esteemPerceived stressadjustment full scale
Mean Std. Deviation N
R R Square Adjusted R
Square Std. Error of the Estimate Change Statistics
Model R Square Change F Change df1 df2 Sig. F Change
R Square Change F Change df1 df2
1 .628(a) .394 .356 25.12213 .394 10.392 11 176 .0Model Summary(b) a Predictors: (Constant), adjustment full scale, Whether help was sought, Introjected Regulation, acad_mar, Amotivation, Academic overload, Self-esteem, Identified Regulation, Extrinsic Motivation, Intrinsic Motivation, Perceived stress b Dependent Variable: acad.mar
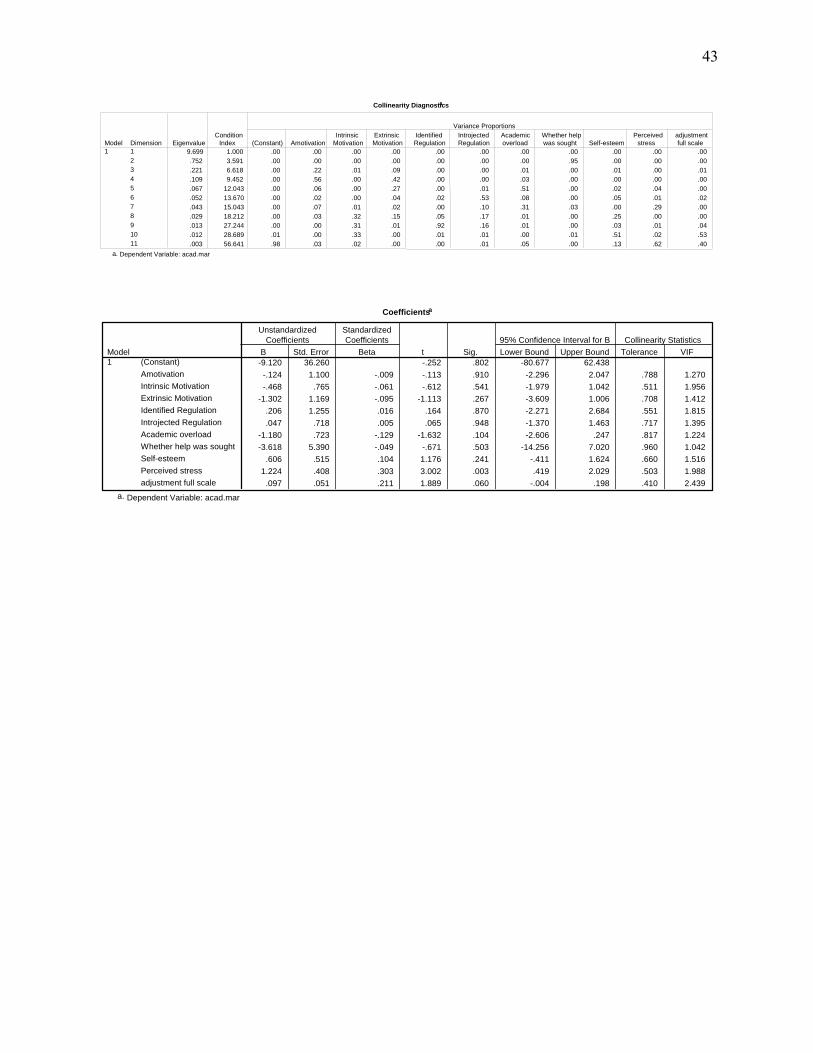
43
Coefficientsa
-9.120 36.260 -.252 .802 -80.677 62.438-.124 1.100 -.009 -.113 .910 -2.296 2.047 .788 1.270-.468 .765 -.061 -.612 .541 -1.979 1.042 .511 1.956
-1.302 1.169 -.095 -1.113 .267 -3.609 1.006 .708 1.412.206 1.255 .016 .164 .870 -2.271 2.684 .551 1.815.047 .718 .005 .065 .948 -1.370 1.463 .717 1.395
-1.180 .723 -.129 -1.632 .104 -2.606 .247 .817 1.224-3.618 5.390 -.049 -.671 .503 -14.256 7.020 .960 1.042
.606 .515 .104 1.176 .241 -.411 1.624 .660 1.5161.224 .408 .303 3.002 .003 .419 2.029 .503 1.988
.097 .051 .211 1.889 .060 -.004 .198 .410 2.439
(Constant)AmotivationIntrinsic MotivationExtrinsic MotivationIdentified RegulationIntrojected RegulationAcademic overloadWhether help was soughtSelf-esteemPerceived stressadjustment full scale
Model1
B Std. Error
UnstandardizedCoefficients
Beta
StandardizedCoefficients
t Sig. Lower Bound Upper Bound95% Confidence Interval for B
Tolerance VIFCollinearity Statistics
Dependent Variable: acad.mara.
Collinearity Diagnosticsa
9.699 1.000 .00 .00 .00 .00 .00 .00 .00 .00 .00 .00 .00.752 3.591 .00 .00 .00 .00 .00 .00 .00 .95 .00 .00 .00.221 6.618 .00 .22 .01 .09 .00 .00 .01 .00 .01 .00 .01.109 9.452 .00 .56 .00 .42 .00 .00 .03 .00 .00 .00 .00.067 12.043 .00 .06 .00 .27 .00 .01 .51 .00 .02 .04 .00.052 13.670 .00 .02 .00 .04 .02 .53 .08 .00 .05 .01 .02.043 15.043 .00 .07 .01 .02 .00 .10 .31 .03 .00 .29 .00.029 18.212 .00 .03 .32 .15 .05 .17 .01 .00 .25 .00 .00.013 27.244 .00 .00 .31 .01 .92 .16 .01 .00 .03 .01 .04.012 28.689 .01 .00 .33 .00 .01 .01 .00 .01 .51 .02 .53.003 56.641 .98 .03 .02 .00 .00 .01 .05 .00 .13 .62 .40
Dimension 1 2 3 4 5 6 7 8 9 10 11
Model 1 Eigenvalue Condition
Index (Constant) Amotivation IntrinsicMotivation
ExtrinsicMotivation
IdentifiedRegulation
IntrojectedRegulation
Academicoverload
Whether help was sought Self-esteem Perceived
stressadjustmentfull scale
Variance Proportions
Dependent Variable: acad.mar a.
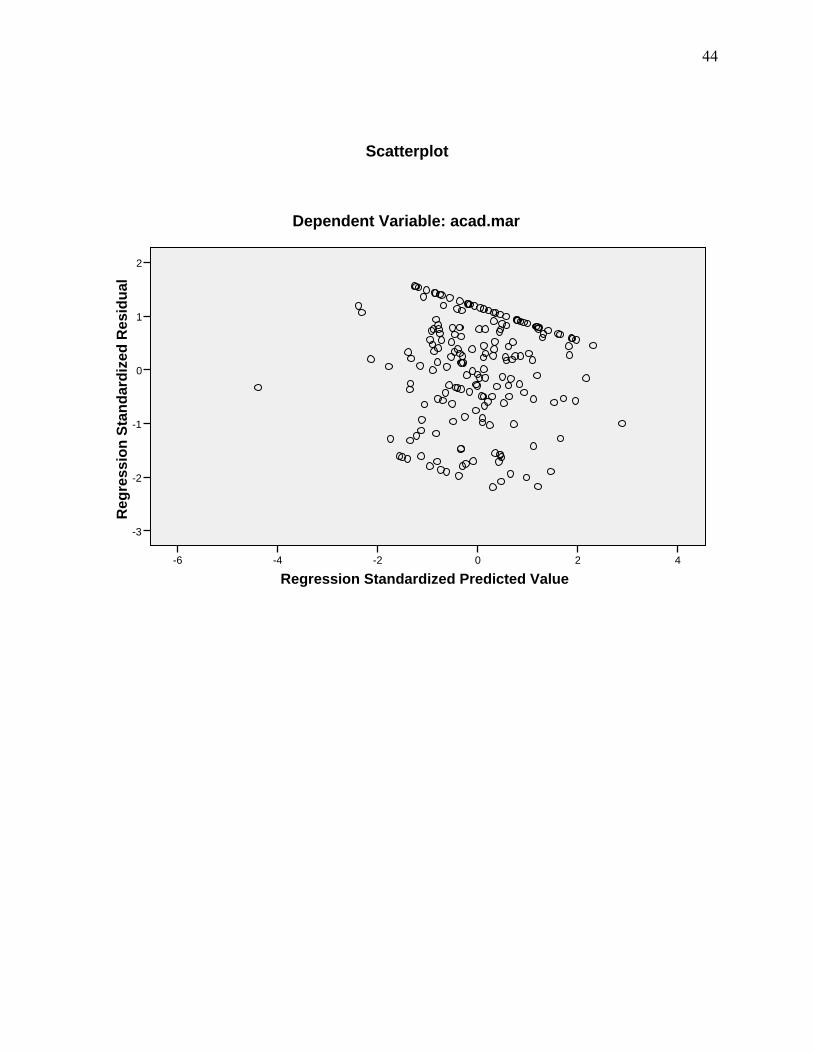
44
Regression Standardized Predicted Value420-2-4-6
Reg
ress
ion
Stan
dard
ized
Res
idua
l
2
1
0
-1
-2
-3
Scatterplot
Dependent Variable: acad.mar
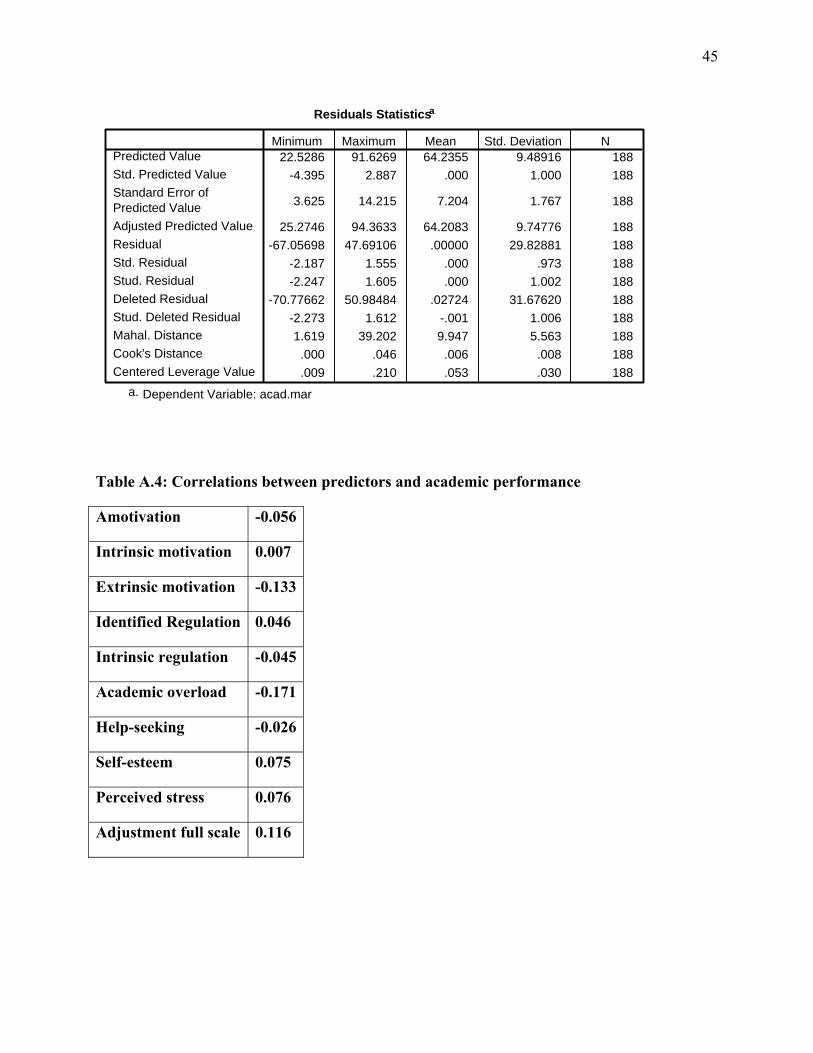
45
Residuals Statisticsa
22.5286 91.6269 64.2355 9.48916 188-4.395 2.887 .000 1.000 188
3.625 14.215 7.204 1.767 188
25.2746 94.3633 64.2083 9.74776 188-67.05698 47.69106 .00000 29.82881 188
-2.187 1.555 .000 .973 188-2.247 1.605 .000 1.002 188
-70.77662 50.98484 .02724 31.67620 188-2.273 1.612 -.001 1.006 1881.619 39.202 9.947 5.563 188
.000 .046 .006 .008 188
.009 .210 .053 .030 188
Predicted ValueStd. Predicted ValueStandard Error ofPredicted ValueAdjusted Predicted ValueResidualStd. ResidualStud. ResidualDeleted ResidualStud. Deleted ResidualMahal. DistanceCook's DistanceCentered Leverage Value
Minimum Maximum Mean Std. Deviation N
Dependent Variable: acad.mara.
Table A.4: Correlations between predictors and academic performance
Amotivation -0.056
Intrinsic motivation 0.007
Extrinsic motivation -0.133
Identified Regulation 0.046
Intrinsic regulation -0.045
Academic overload -0.171
Help-seeking -0.026
Self-esteem 0.075
Perceived stress 0.076
Adjustment full scale 0.116

46
APPENDIX B
EXAMPLES OF QUESTIONNAIRE QUESTIONS
Table B.1
Source of support No. of
responses Tutor (academic issues) 97 Lecturer 71 Curriculum Advisor 59 Counselor or Psychologist 17 Mentor (social or emotional issues) 30
Table B.2
Reason No. of
responses I thought I should solve the problem on my own 55 Limited time 28 I didn’t need to seek help 18 I didn’t know I could approach anyone 14 Felt embarrassed 14 I was afraid 14 I didn’t know that there were these services 9 Other 17

47
Table B.3
N Mean Standard deviation
Minimum Maximum Cronbach Alpha
Raw scores Full scale 193 392.03 68.24 195.00 573.11 0.93 Academic 193 138.37 27.55 68.00 213.91 0.84 Social 193 118.14 26.97 36.00 180.00 0.84 P/emotional 193 76.78 20.01 20.00 128.00 0.78 Attachment 193 104.21 20.89 19.00 135.00 0.86 T-scores Full scale 193 45.09 9.77 25.00 75.00 Academic 193 47.32 10.34 25.00 75.00 Social 193 46.01 10.09 25.00 75.00 P/emotional 193 41.54 9.06 25.00 68.00 Attachment 193 51.60 10.59 25.00 75.00 Academic performance 194 52.82 12.41 0.00 78.63

48
APPENDIX B
EXAMPLES OF QUESTIONNAIRE QUESTIONS
Table B.1
Source of support No. of
responses Tutor (academic issues) 97 Lecturer 71 Curriculum Advisor 59 Counselor or Psychologist 17 Mentor (social or emotional issues) 30
Table B.2
Reason No. of
responses I thought I should solve the problem on my own 55 Limited time 28 I didn’t need to seek help 18 I didn’t know I could approach anyone 14 Felt embarrassed 14 I was afraid 14 I didn’t know that there were these services 9 Other 17

49
Table B.3
N Mean Standard deviation
Minimum Maximum Cronbach Alpha
Raw scores Full scale 193 392.03 68.24 195.00 573.11 0.93 Academic 193 138.37 27.55 68.00 213.91 0.84 Social 193 118.14 26.97 36.00 180.00 0.84 P/emotional 193 76.78 20.01 20.00 128.00 0.78 Attachment 193 104.21 20.89 19.00 135.00 0.86 T-scores Full scale 193 45.09 9.77 25.00 75.00 Academic 193 47.32 10.34 25.00 75.00 Social 193 46.01 10.09 25.00 75.00 P/emotional 193 41.54 9.06 25.00 68.00 Attachment 193 51.60 10.59 25.00 75.00 Academic performance 194 52.82 12.41 0.00 78.63

50
APPENDIX D
THE QUESTIONNAIRES
(These were manually attached to the hard copy submitted).
51
PLAGIARISM DECLARATION
1. I know that plagiarism is wrong.
2. I have used the American Psychological Association (APA) convention for citation and
referencing. Each significant contribution to, and quotation in, this paper from the work, or
works, of other people has been attributed, and has cited and referenced.
3. This research project is my own work.
4. I have not allowed, and will not allow, anyone to copy my work with the intention of passing
if off as his or her own work.
5. I acknowledge that copying someone else’s assignment or essay, or part of it, is wrong, and
declare that this is my own work.
Signature: Nomxolisi Sindiswa Malope.