Embed Size (px)
Citation preview
DP RCDisaster Prevention Research Center,National Cheng Kung University, Taiwan
Tectono-Hydrology Research Group
Precursory and Coseismic Groundwater Precursory and Coseismic Groundwater Level Changes with Earthquakes of Level Changes with Earthquakes of
Taiwan, 2003~2004 Taiwan, 2003~2004
WenWen--Chi LaiChi Lai11, Chjeng, Chjeng--Lun ShiehLun Shieh11, Kuo, Kuo--Chyng ChangChyng Chang22, Kai, Kai--Wen KuoWen Kuo33,,
1. DPRC, NCKU, Taiwan 2. Water Resource Agency, MOEA, Taiwan3. Central Weather Bureau, MOEA, Taiwan

22
DP RCI. IntroductionI. Introduction
Tectonic Setting of Taiwan.Tectonic Setting of Taiwan.Highly Seismic hazard risk.Highly Seismic hazard risk.Advantage of the researchAdvantage of the research
High density monitoring High density monitoring network for water resources network for water resources Groundwater Monitoring Groundwater Monitoring Networks of TaiwanNetworks of TaiwanHigh density High density seismic seismic monitoring networkmonitoring network. . High seismic activityHigh seismic activity
Good quality observationGood quality observation
→→ Waiting for good newsWaiting for good news……(Cheng et al.,2000)
2003/3/31
Eurasian Plate
Eurasian Plate
Philippine Sea PlatePhilippine Sea Plate

33
DP RC
Taiwan Groundwater Monitoring Network Taiwan Groundwater Monitoring Network (1992~2003)(1992~2003)
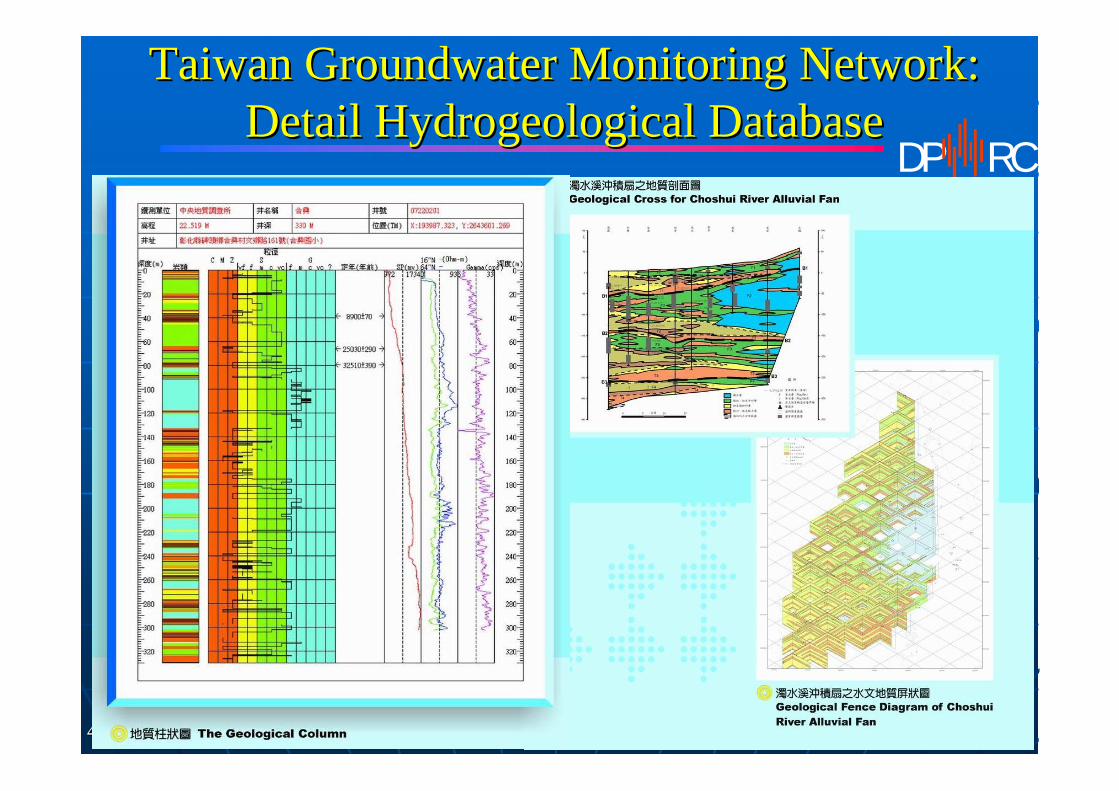
Design for water resources managementDesign for water resources managementMonitoring different aquifer in same site Monitoring different aquifer in same site
########
########
#### ####
#######
##
####
#
###
## #####
####
###
######## ##
#####
####
#####
###### ###
##
####
#####
##
##
###
###########
#### ## ############
#####
######### ##
#######
###### #####
######## ####
##
######
####
#### ###
#### ###
## ####
####
############# ###
###
#######
######
##
###
## ###
##
##
###
####
#######
####
######## ##
##
#
#
###
############
##
############
###
#
###
###
####
##
#####
#
#
###
#####
###
####
#
##
##
#####
######
####
###
######
####
###
####
######
#
##
######
###
###
####
###
####
########
#####
##
########
####
######
##
##
########
## #######
#####
#
###
#
##
#
######
###
####
#
##
##########
35351616HsinchuHsinchu--Miaoli Miaoli AreaArea
560560228228TotalTotal45453030Ilan PlainIlan Plain
1321325555Pingtung PlainPingtung Plain
1051054040ChiayiChiayi--TainanTainanAreaArea
1931937070Choshui River Choshui River Alluvial FanAlluvial Fan
101055Taoyuan TablelandTaoyuan Tableland
30301212Taipei BasinTaipei Basin
WellWellSiteSiteSubSub--ProvinceProvince
Well Fault
44
DP RC
Taiwan Groundwater Monitoring Network:Taiwan Groundwater Monitoring Network:Detail Hydrogeological DatabaseDetail Hydrogeological Database

55
DP RCObservation NetworkObservation Network
Philippine Sea PlatePhilippine Sea Plate
Eurasian PlateEurasian Plate
AccretionalAccretionalWedgeWedge
Luzon Arc
Luzon Arc
Ryuku ArcRyuku Arc
TaipeiTaipei
Kaoshiung
KaoshiungTainanTainan
Taichung
Taichung
TaitungTaitung
HulienHulien
IlanIlanIlan Seismic Zone
Ilan Seismic Zone
TaitungTaitung--Huilen Seismic Zone
Huilen Seismic Zone
SanyiSanyi--Puli Seismic ZonePuli Seismic Zone
ChiayiChiayi--Tainan Seismic Zone
Tainan Seismic Zone
DLI
BTO
JSUWUT
JUS
SBT
JND CHS
HDN
SIP
DHR
LJANBA
TWNHUA
TLO
XXX
XXX
Well Location
Before 2004
After 2004
66
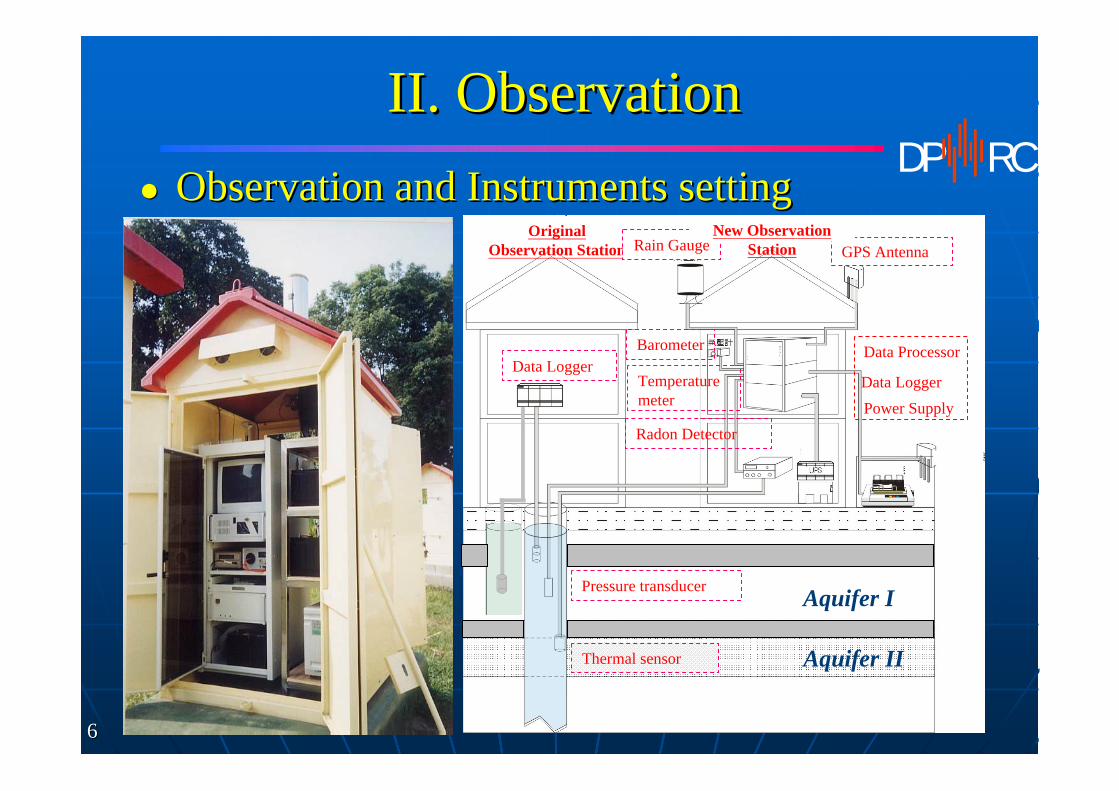
DP RCII. ObservationII. Observation
Observation and Instruments settingObservation and Instruments settingOriginal
Observation Station
Data LoggerBarometer
Aquifer II
Radon DetectorPower SupplyData Logger
Data Processor
Aquifer I
Thermal sensor
Pressure transducer
GPS Antenna
Temperature meter
Rain Gauge New Observation
Station
77
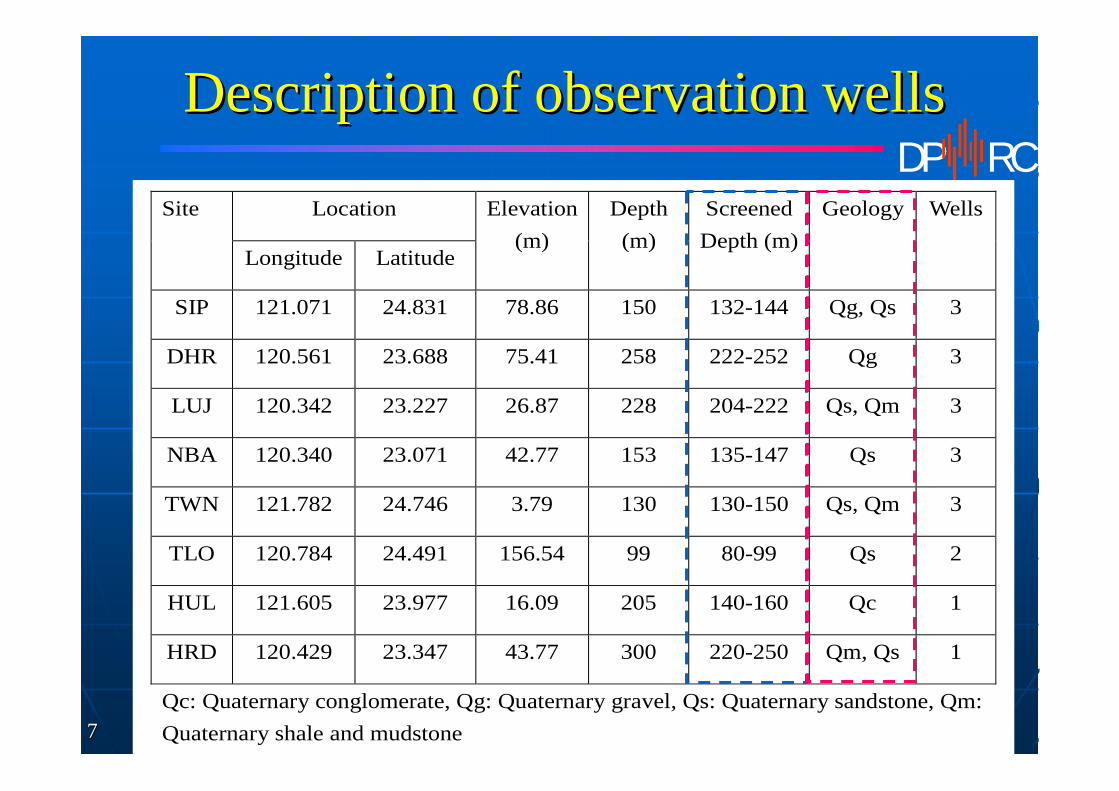
DP RCDescription of observation wellsDescription of observation wells
Qc: Quaternary conglomerate, Qg: Quaternary gravel, Qs: Quaternary sandstone, Qm: Quaternary shale and mudstone
Location Site
Longitude Latitude
Elevation (m)
Depth (m)
Screened Depth (m)
Geology Wells
SIP 121.071 24.831 78.86 150 132-144 Qg, Qs 3
DHR 120.561 23.688 75.41 258 222-252 Qg 3
LUJ 120.342 23.227 26.87 228 204-222 Qs, Qm 3
NBA 120.340 23.071 42.77 153 135-147 Qs 3
TWN 121.782 24.746 3.79 130 130-150 Qs, Qm 3
TLO 120.784 24.491 156.54 99 80-99 Qs 2
HUL 121.605 23.977 16.09 205 140-160 Qc 1
HRD 120.429 23.347 43.77 300 220-250 Qm, Qs 1
88
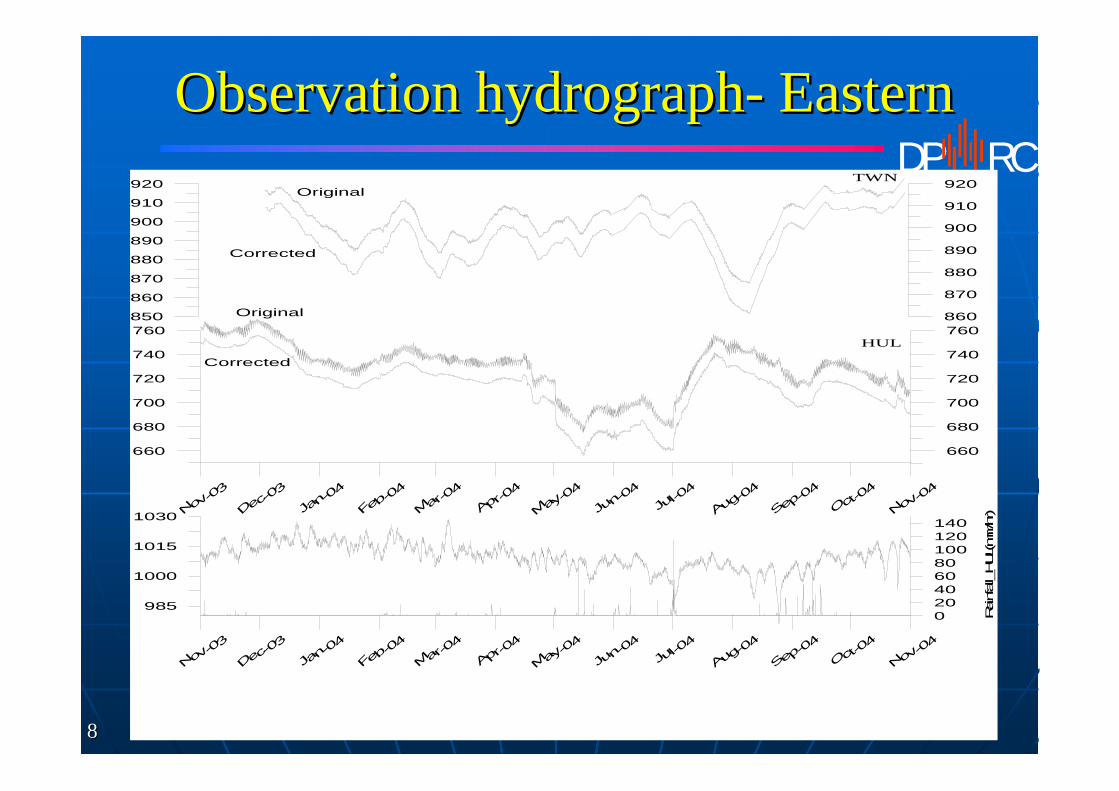
DP RCObservation hydrographObservation hydrograph-- EasternEastern
Nov-03
Dec-03
Jan-0
4
Feb-04
Mar-04
Apr-04
May-04
Jun-0
4
Jul-0
4
Aug-04
Sep-04
Oct-04
Nov-04
660
680
700
720
740
760
660
680
700
720
740
760
Nov-03
Dec-03
Jan-0
4
Feb-04
Mar-04
Apr-04
May-04
Jun-0
4
Jul-0
4
Aug-04
Sep-04
Oct-04
Nov-04
985
1000
1015
1030
020406080100120140
Rainfall_HUL(mm/hr)
HUL
Corrected
Original850
860
870
880
890
900
910
920
860
870
880
890
900
910
920TWN
Corrected
Original

99
DP RCObservation hydrographObservation hydrograph-- CentralCentral
Nov-03
Dec-03
Jan-0
4
Feb-04
Mar-04
Apr-04
May-04
Jun-0
4
Jul-0
4
Aug-04
Sep-04
-200
-100
0
100
200
300
400
-200
-100
0
100
200
300
400
Nov-03
Dec-03
Jan-0
4
Feb-04
Mar-04
Apr-04
May-04
Jun-0
4
Jul-0
4
Aug-04
Sep-04
975
990
1005
0
20
40
60
80
100
Rainfall_DHR(m
m/hr)
DHR
Corrected
Original
100
200
300
400
500
600
700
100
200
300
400
500
600
700HRD
Original
1010
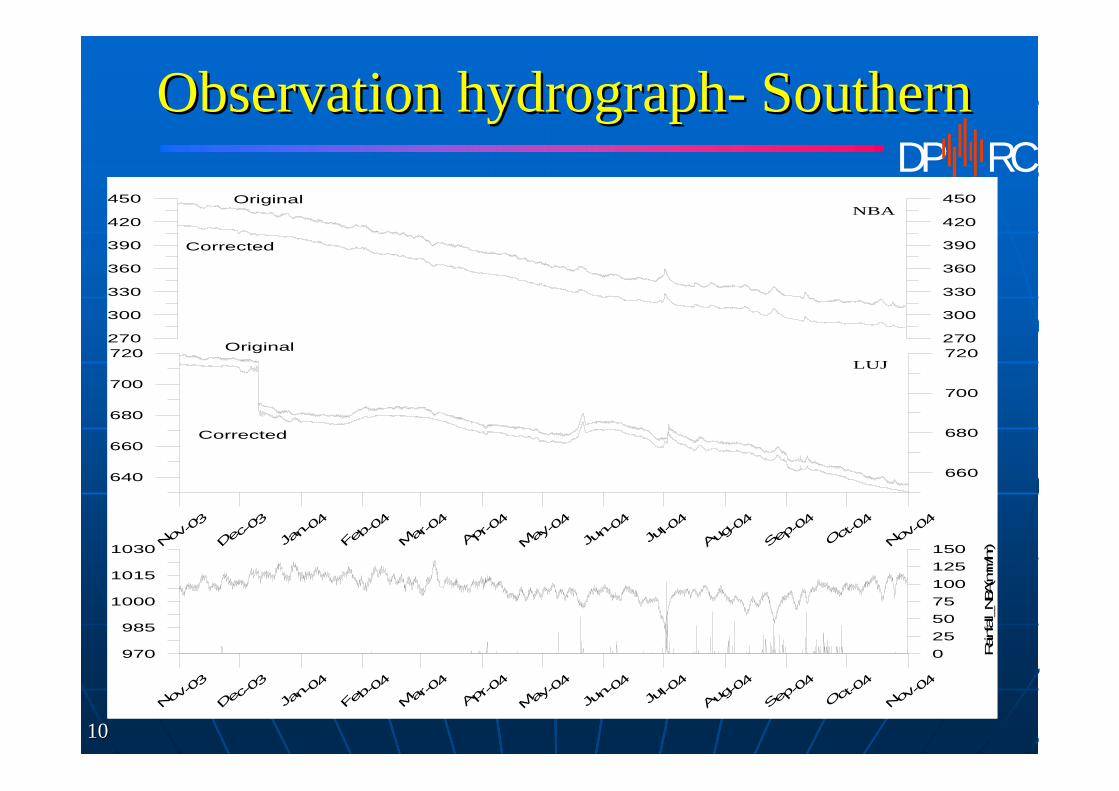
DP RCObservation hydrographObservation hydrograph-- SouthernSouthern
Nov-03
Dec-03
Jan-0
4
Feb-04
Mar-04
Apr-04
May-04
Jun-0
4
Jul-0
4
Aug-04
Sep-04
Oct-04
Nov-04
640
660
680
700
720
660
680
700
720
Nov-03
Dec-03
Jan-0
4
Feb-04
Mar-04
Apr-04
May-04
Jun-0
4
Jul-0
4
Aug-04
Sep-04
Oct-04
Nov-04
970
985
1000
1015
1030
0255075100125150
Rainfall_NBA
(mm/hr)
LUJ
Corrected
Original270
300
330
360
390
420
450
270
300
330
360
390
420
450NBA
Corrected
Original

1111
DP RCObservation hydrographObservation hydrograph-- CentralCentral
Nov-03
Dec-03
Jan-0
4
Feb-04
Mar-04
Apr-04
May-04
Jun-0
4
Jul-0
4
Aug-04
Sep-04
Oct-04
Nov-04
-75
-50
-25
0
25
50
75
100
525
550
575
600
625
650
675
700
Nov-03
Dec-03
Jan-0
4
Feb-04
Mar-04
Apr-04
May-04
Jun-0
4
Jul-0
4
Aug-04
Sep-04
Oct-04
Nov-04
970
985
1000
1015
1030
0
20
40
60
80
100
Rainfall_SIP(m
m/hr)
SIP
Corrected
Original
300400500600700800900
10001100
30040050060070080090010001100TLO
Corrected
Original

1212
DP RCIII. Results and DiscussionsIII. Results and Discussions
6/10/03M6.5
12/10/03M6.6
5/19/04M6.5
11/8/04M6.7
ML 3 4 5 6
2003 118 181 43 3
2004 86 125 25 5
Events 204 306 68 8
Events of the earthquake ML >3 in Taiwan 03’~04’
CMT solution and distribution of events3
4
5
6
7
03/1
03/2
03/3
03/4
03/5
03/6
03/7
03/8
03/9
03/1
003
/11
03/1
204
/104
/204
/304
/404
/504
/604
/704
/804
/904
/10
04/1
1
Mag
nitu
deM
agni
tude
1313
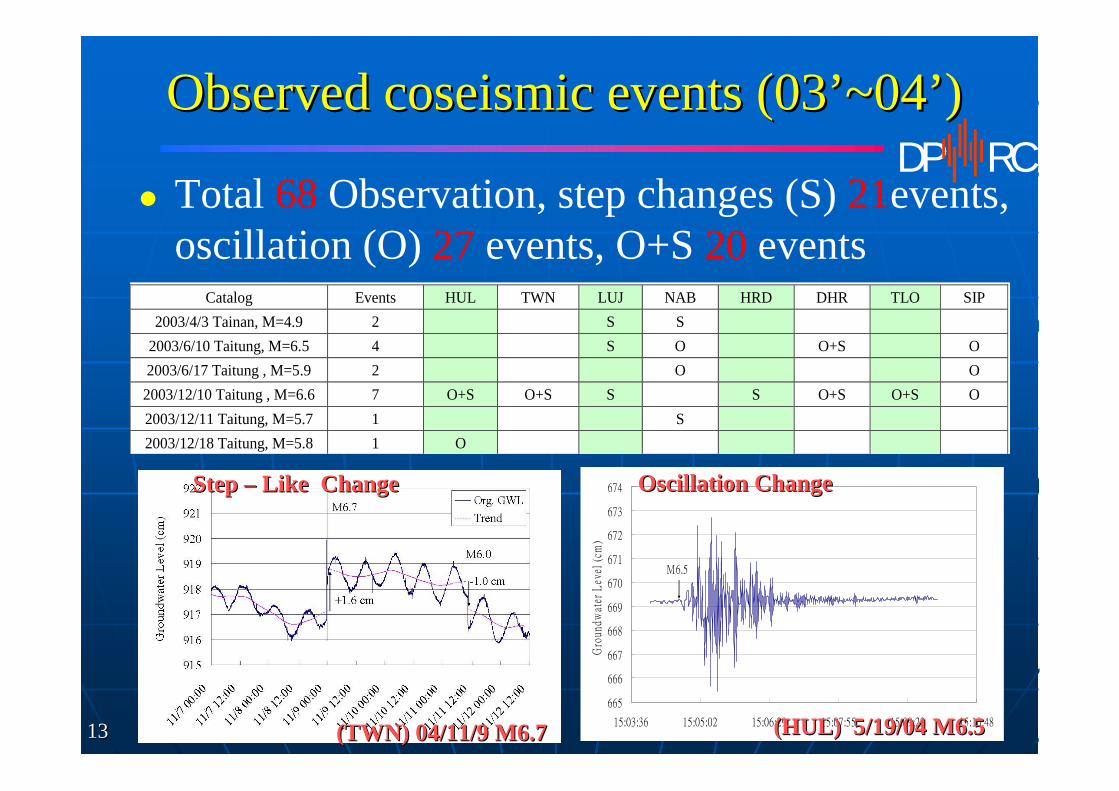
DP RCObserved coseismic events (03Observed coseismic events (03’’~04~04’’))
Total 68 Observation, step changes (S) 21events, oscillation (O) 27 events, O+S 20 events
Catalog Events HUL TWN LUJ NAB HRD DHR TLO SIP 2003/4/3 Tainan, M=4.9 2 S S
2003/6/10 Taitung, M=6.5 4 S O O+S O 2003/6/17 Taitung , M=5.9 2 O O 2003/12/10 Taitung , M=6.6 7 O+S O+S S S O+S O+S O 2003/12/11 Taitung, M=5.7 1 S 2003/12/18 Taitung, M=5.8 1 O
665
666
667
668
669
670
671
672
673
674
15:03:36 15:05:02 15:06:29 15:07:55 15:09:22 15:10:48
Gro
undw
ater
Lev
el (
cm)
M6.5
(HUL) 5/19/04 M6.5(HUL) 5/19/04 M6.5(TWN) 04/11/9 M6.7(TWN) 04/11/9 M6.7
Step Step –– Like ChangeLike Change Oscillation ChangeOscillation Change
1414
DP RC
NBANBA
HULHUL
LJALJAHRDHRD
DHRDHR
TLOTLO
SIPSIP TWNTWN▲1.12
▼1.35
▼27.57
▼2.35
▼0.86
▼1.22
▼0.16
B
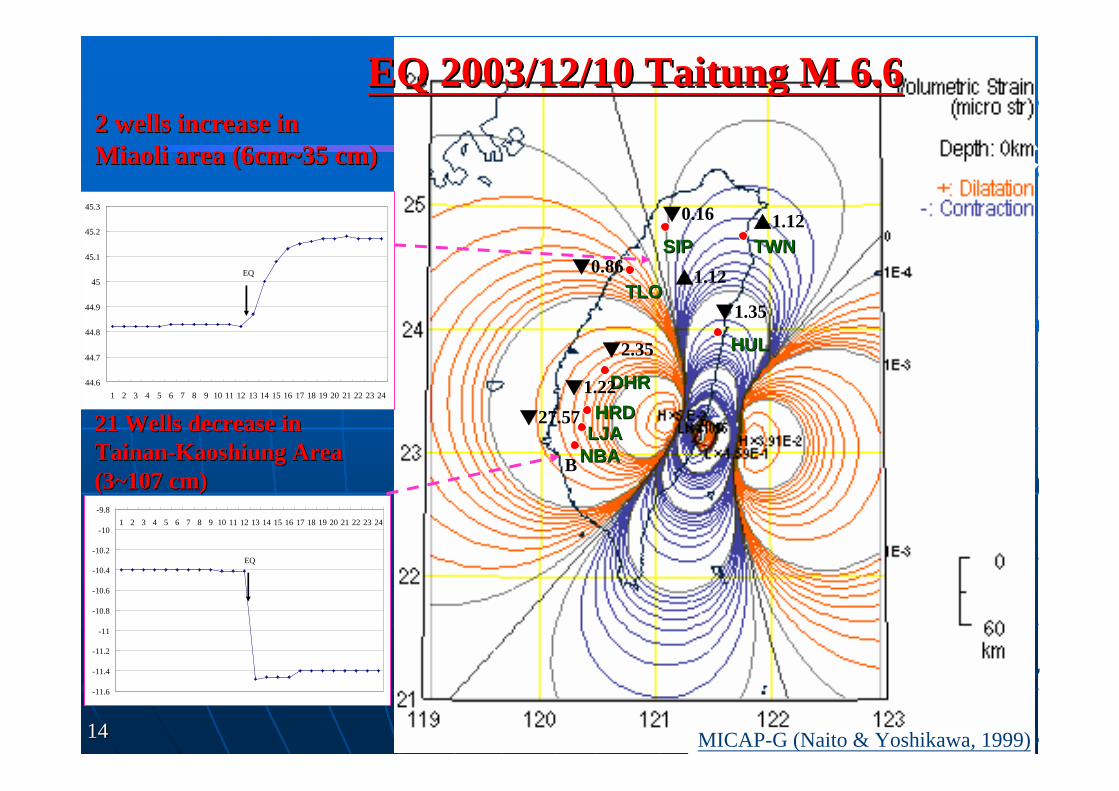
EQ 2003/12/10 Taitung M 6.6EQ 2003/12/10 Taitung M 6.6
21 Wells decrease in 21 Wells decrease in TainanTainan--Kaoshiung Area Kaoshiung Area (3~107 cm)(3~107 cm)
▲1.12
2 wells increase in 2 wells increase in Miaoli area (6cm~35 cm)Miaoli area (6cm~35 cm)
44.6
44.7
44.8
44.9
45
45.1
45.2
45.3
1 2 3 4 5 6 7 8 9 10 11 12 13 14 15 16 17 18 19 20 21 22 23 24
EQ
-11.6
-11.4
-11.2
-11
-10.8
-10.6
-10.4
-10.2
-10
-9.81 2 3 4 5 6 7 8 9 10 11 12 13 14 15 16 17 18 19 20 21 22 23 24
EQ
MICAP-G (Naito & Yoshikawa, 1999)
1515
DP RC
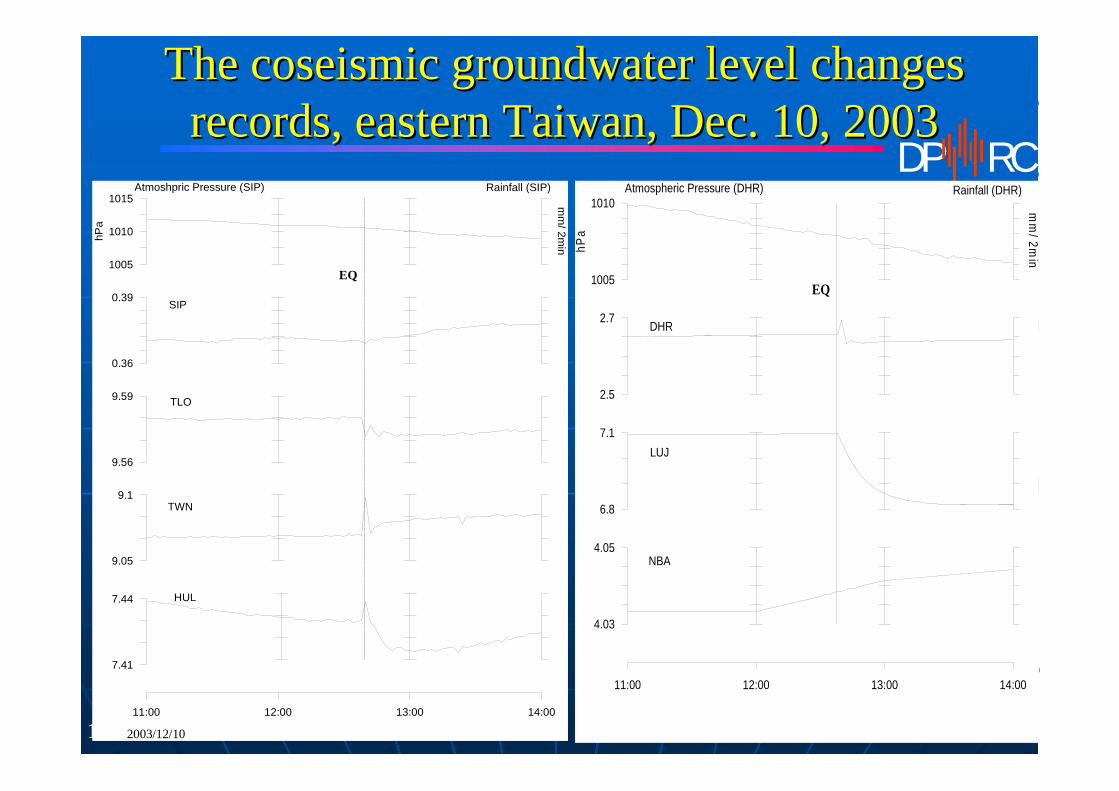
The The coseismiccoseismic groundwater level changes groundwater level changes records, eastern Taiwan, Dec. 10, 2003 records, eastern Taiwan, Dec. 10, 2003
11:00 12:00 13:00 14:00
1005
1010
1015
hPa
mm
/ 2min
0.36
0.39SIP
9.56
9.59 TLO
9.05
9.1TWN
7.41
7.44 HUL
EQ
Atmoshpric Pressure (SIP) Rainfall (SIP)
2003/12/10
11:00 12:00 13:00 14:00
1005
1010
hPa
mm
/2min
2.5
2.7DHR
6.8
7.1LUJ
4.03
4.05NBA
EQ
Atmospheric Pressure (DHR) Rainfall (DHR)
1616
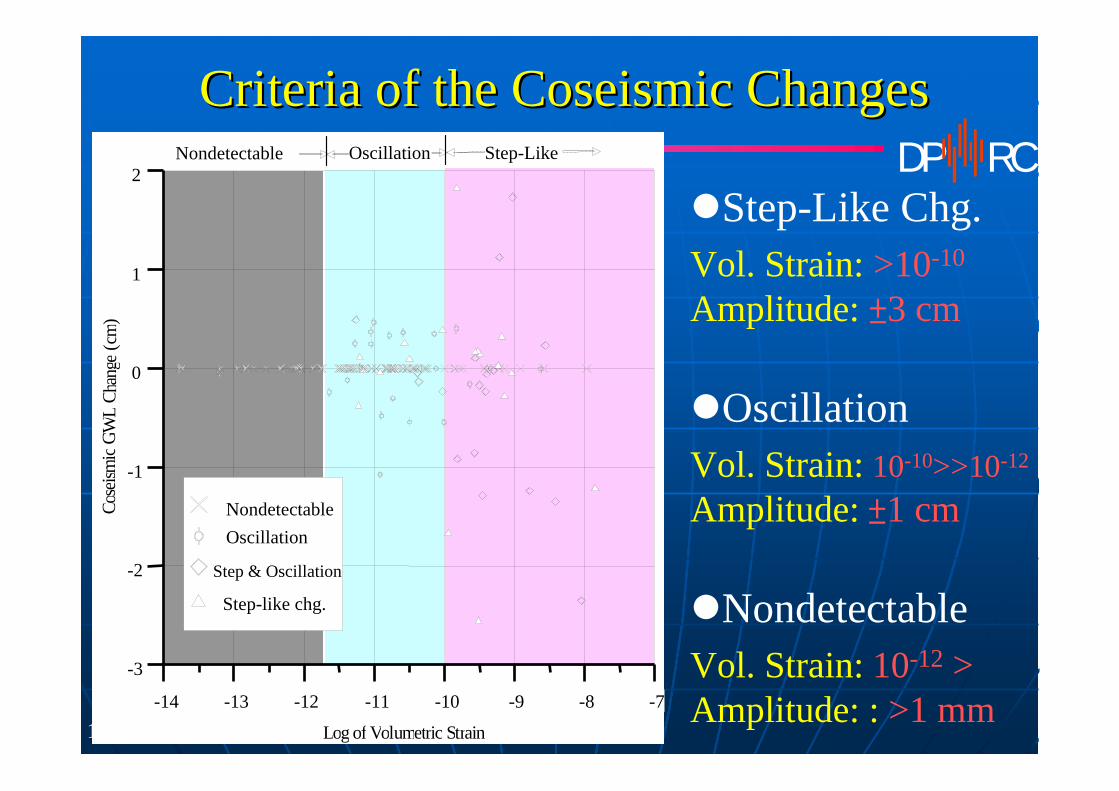
DP RCOscillation Step-Like
-14 -13 -12 -11 -10 -9 -8 -7
Log of Volumetric Strain
-3
-2
-1
0
1
2
Cose
is mic
G WL
C han
g e(c
m)
NondetectableOscillation
Step & Oscillation
Step-like chg.
Step-Like Chg.Vol. Strain: >10-10
Amplitude: ±3 cm
OscillationVol. Strain: 10-10>>10-12
Amplitude: ±1 cm
NondetectableVol. Strain: 10-12 >Amplitude: : >1 mm
Nondetectable
Criteria of the Coseismic Changes Criteria of the Coseismic Changes

1717
DP RCEstimation of the Estimation of the theoretic responses theoretic responses
Using Using BaytapBaytap--GG Program to estimate the Tidal component of Program to estimate the Tidal component of observed groundwater levelobserved groundwater level
Calculate the theoretic tidal potential from Calculate the theoretic tidal potential from GOTIC IIGOTIC II ProgramProgram
Derived the Derived the static strain sensitivitystatic strain sensitivity by by
static strain sensitivity = (tidal responses static strain sensitivity = (tidal responses ÷÷ tidal potential)tidal potential)
Calculate the coseismic static volumetric strain using Calculate the coseismic static volumetric strain using MICAPMICAP--GGprogramprogram
Derived the Derived the predicted amplitudepredicted amplitude estimated from tidal response by estimated from tidal response by
Amp. Of Chg.= ( calculated volumetric strain Amp. Of Chg.= ( calculated volumetric strain ×× strain sensitivity)strain sensitivity)

1818
DP RCStatic Volumetric Strain SensitivityStatic Volumetric Strain Sensitivity
SIP TLO DHR HRD LUJ NBA TWN HUL Amplitude (10-8) [Phase Shift (degree)]
Vol. starin by M2 earth tide, te 1.35 [0] 1.35 [0] 1.37 [0] 1.38 [0] 1.38 [0] 1.38 [0] 1.35 [0] 1.37 [0]
Vol. starin by M2 oceanic tidal loading, to
1.11 [-314]
2.08 [-321]
0.18 [-276]
0.14 [-283]
0.11 [-290]
0.11 [-301]
0.60 [-227]
6.10 [-184]
Vol. starin by earth + oceanic tide, tt=te + to
2.27 [-340]
3.25 [-336]
1.40 [-352]
1.42 [-355]
1.42 [-356]
1.45 [-356]
1.04 [-335]
4.73 [-185]
M2 amplitude of water level, tw 5.19±0.45 3.72±0.67 6.17±0.60 2.61±1.05 2.54±0.59 4.24±0.29 3.93±0.27 23.77±0.50
[-323±24] [-282±49] [-339±23] [-252±18] [-350±34] [-349±15] [-272±21] [-21±6] Strain sens. by M2 tide, Ws = tw/tt (mm/10-8)
2.28 1.14 4.39 1.84 1.78 2.92 3.78 5.02
*Negative phase shifts denote lags.
1919
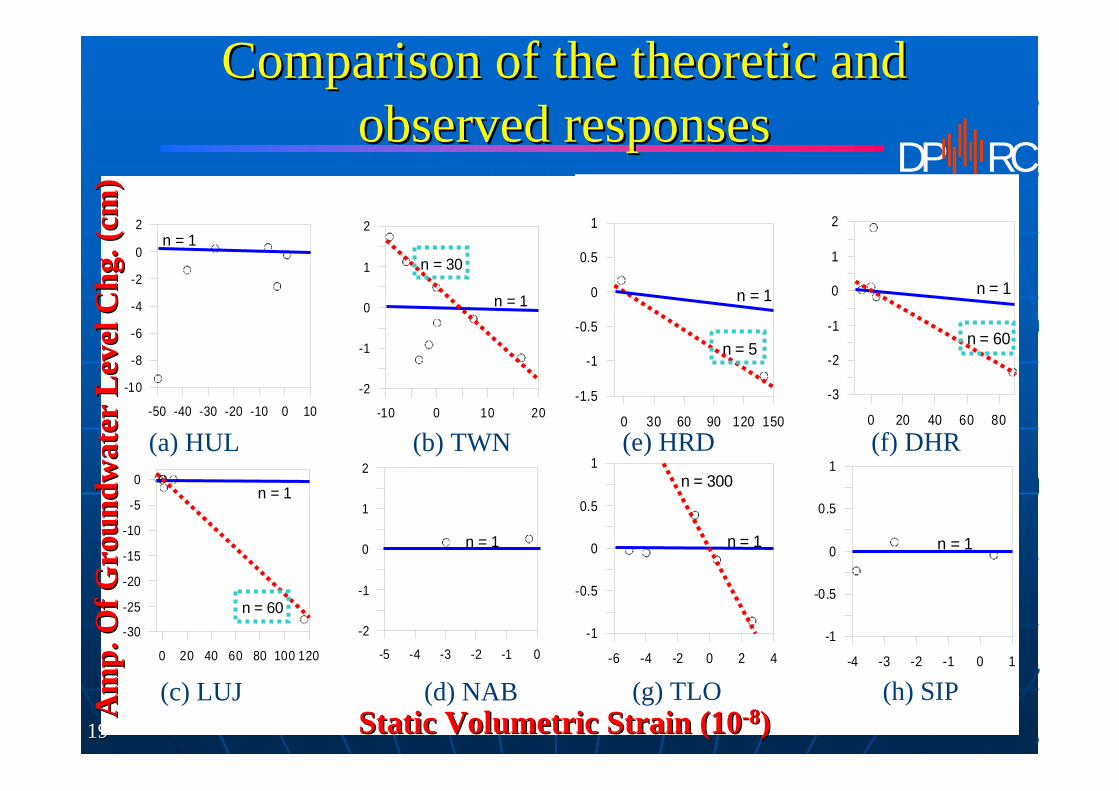
DP RC
Comparison of the theoretic and Comparison of the theoretic and observed responses observed responses
(c) LUJ (d) NAB
-50 -40 -30 -20 -10 0 10
-10
-8
-6
-4
-2
0
2
-10 0 10 20
-2
-1
0
1
2
n = 1
n = 30
0 20 40 60 80 100 120
-30
-25
-20
-15
-10
-5
0
-5 -4 -3 -2 -1 0
-2
-1
0
1
2
n = 1
n = 1
n = 1
n = 60
(a) HUL (b) TWN0 20 40 60 80
-3
-2
-1
0
1
2
n = 1
n = 60
0 30 60 90 120 150
-1.5
-1
-0.5
0
0.5
1
n = 1
n = 5
-6 -4 -2 0 2 4
-1
-0.5
0
0.5
1
n = 1
n = 300
-4 -3 -2 -1 0 1
-1
-0.5
0
0.5
1
n = 1
(g) TLO (h) SIP
(e) HRD (f) DHR
Am
p. O
f Gro
undw
ater
Lev
el C
hg. (
cm)
Am
p. O
f Gro
undw
ater
Lev
el C
hg. (
cm)
Static Volumetric Strain (10Static Volumetric Strain (10--88))

2020
DP RCPrePre--seismic Groundwater Level Changesseismic Groundwater Level Changes
EQ
2004/10/15 Ilan Earthquake, M7.0 (TWN)
1cm
1day
Filtered trend comp.Original data.
Gro
undw
ater
leve
l (cm
)

2121
DP RC
720722724726728730732
Hulien:Waterlog:Water level (cm) Hulien:Waterlog:Water level(fit) (cm)
-1-012
Hulien:Waterlog:Water level(resid) (cm)
1016101710181019102010211022
Hulien:Barometer:Pressure (hPa)
131415161718
Hulien:Therometer:Air Temperature (c)
25.69025.69525.70025.70525.71025.715
Hulien:Therometer:Water Temperature (c)
00h00m00s08-02-04
12h00m00s08-02-04
00h00m00s09-02-04
12h00m00s09-02-04
00h00m00s10-02-04
0.00.20.40.60.81.0
Hulien:Raingage:Rain fall (mm)
14:10 +1.5 cm
Feb. 9 15:14, 2004, Hulien Earthquake, (M=4.3 Depth 27.6 Km)
GWL(cm)GWL(cm)
Res.(cm)Res.(cm)
Baro..(hp)Baro..(hp)
Air temp. (C)Air temp. (C)
GWL temp. (C)GWL temp. (C)
Rain fall (mm)Rain fall (mm)
2cm
6cm Obs.Tidal.

2222
DP RC
Intens.Obs. Sta.Distance
(km)Depth(km)Lat.Lon.MLOcc. TimeNo.
44HULHUL13.3 13.3 18.918.924.0524.05121.51121.514.64.62004/05/13 23:28:472004/05/13 23:28:479305393053
11HULHUL15.7 15.7 21.121.124.0924.09121.52121.524.14.12004/07/14 20:04:302004/07/14 20:04:30--
33HULHUL23.3 23.3 19.519.523.8623.86121.43121.434.84.82004/07/09 19:19:292004/07/09 19:19:299306993069
EQ
EQ
EQ
Sea levelGroundwater level
T.D.
T.D.
T.D.

2323
DP RC650
660
670
680
690
700
Hulien:Waterlog:Water level (cm) Hulien:Waterlog:Water level(fit) (cm)
-10
-5
0
5
Hulien:Waterlog:Water level(resid) (cm)
1000
1005
1010
1015
1020
Hulien:Barometer:Pressure (hPa)
10-04-05 20-04-05 30-04-05 10-05-050.5
0.6
0.7
0.8
0.9
1.0Hulien:Raingage:Rain fall (mm)
I III II
4/5/
05
4/10
/05
4/15
/05
4/20
/05
4/25
/05
4/30
/05
5/5/
05
5/10
/05
5/15
/05
Time
3
4
5
6
Mag
nitu
de (M
L)
Seismic activity and the groundwater level Seismic activity and the groundwater level changes changes ((April~MayApril~May, 2005), 2005)
SeismicitySeismicity((MMLL))
Orig. WL. Orig. WL. (green)(green)FiltedFilted ComponentsComponents(red(red))
Residual water levelResidual water level(cm)(cm)
Barometric PressureBarometric Pressure((hpahpa))
RainfallRainfall(mm)(mm)
April,2005
May,2005

2424
DP RC
Discussion: Discussion: Possible Mechanism of Possible Mechanism of Observation in Hulien Observation WellObservation in Hulien Observation Well
Effected by ocean tideEffected by ocean tideLocated on complex fault zoneLocated on complex fault zone
Tide GaugeStation
Hulien ObservationWell
1 km200 m
Location of Hulien observation well and tidal gauge stationLocation of Hulien observation well and tidal gauge station
2525
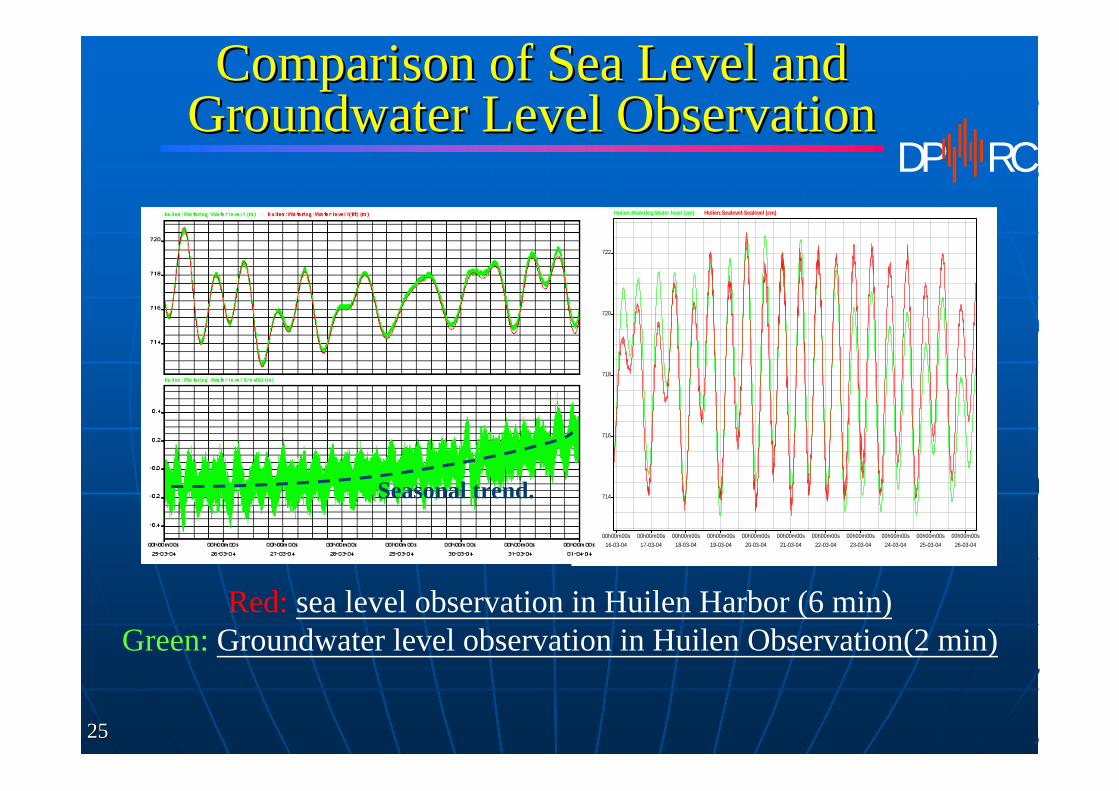
DP RC
00h00m00s16-03-04
00h00m00s17-03-04
00h00m00s18-03-04
00h00m00s19-03-04
00h00m00s20-03-04
00h00m00s21-03-04
00h00m00s22-03-04
00h00m00s23-03-04
00h00m00s24-03-04
00h00m00s25-03-04
00h00m00s26-03-04
714
716
718
720
722
Hulien:Waterlog:Water level (cm) Hulien:Sealevel:Sealevel (cm)
Comparison of Sea Level and Comparison of Sea Level and Groundwater Level Observation Groundwater Level Observation
Red: sea level observation in Huilen Harbor (6 min)Green: Groundwater level observation in Huilen Observation(2 min)
Seasonal trend.
2626
DP RC
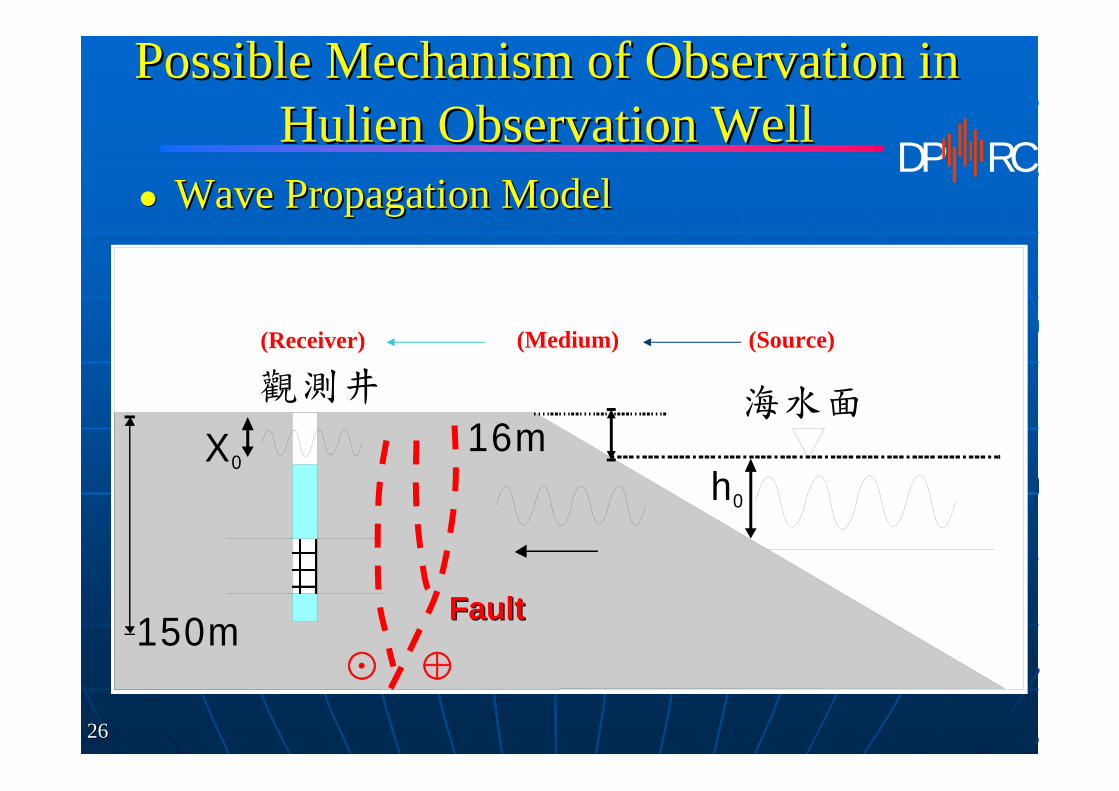
Possible Mechanism of Observation in Possible Mechanism of Observation in Hulien Observation WellHulien Observation Well
Wave Propagation ModelWave Propagation Model
h0
X0
觀測井 海水面
1Km
150m
16m
FaultFault
♁☉
(Source)(Receiver) (Medium)

2727
DP RCSummarySummary
Valuable information of earthquake induced Groundwater Valuable information of earthquake induced Groundwater level changes derived from dense level changes derived from dense ““Groundwater Monitoring Groundwater Monitoring Networks of TaiwanNetworks of Taiwan””
Observed coseismic patterns can fit to poroelastic behavior, Observed coseismic patterns can fit to poroelastic behavior, but the amplitudes are but the amplitudes are amplifyamplify compare to the static strain compare to the static strain sensitivity estimated from tidal response.sensitivity estimated from tidal response.
Curiously preCuriously pre--seismic groundwater level changes in the seismic groundwater level changes in the pattern of pattern of tidal deviationtidal deviation occurred repeatedly in several local occurred repeatedly in several local seismic events nearby the HUL.seismic events nearby the HUL.
The The wave propagation modelwave propagation model were issued from HUL were issued from HUL observation results.observation results.