Embed Size (px)
Citation preview

Nuclear Physics A430 (1984) 685-712 @ North-Holland Publishing Company
PRECISION MEASUREMENT OF THE 2pls TRANSITION IN MUONIC 12C:
Search for new muon-nucleon interactions or accurate determination of the rms nuclear charge radius+
W. RUCKSTUHL”, B. AASb, W. BEER, I. BELTRAMI”, K. BOSd, P.F.A. GOUDSMIT, H.J. LEISI, G. STRASSNER and A. VACCHI’
Institute for Medium Energy Physics, ETHZ, cl o SIN, CH-5234 Vilfigen, Switzerland
and
F.W.N. DE BOER, U. KIEBELE and R. WEBER
Physics Department, Unioersiry of Fribourg, CH-I 700 Fribourg, Switzerland
Received 14 June 1983 (Revised 8 May 1984)
Abstract: The wavelength of the 2p,,,-ls,,, transition in muonic 12C was measured with a crystal spectrometer as 16.473765 (88) pm. With an improved model-independent analysis we deduce an rms charge radius for 12C of 2.4829 (19) fm. A 2.4 standard deviation difference between our rms charge radius and that deduced from recent elastic electron-scattering experiments is tentatively attributed to a short-range additional interaction between muon and nucleons. A comparison is made with other experiments yielding information on such interactions.
1. Introduction
Measurements of transition energies in muonic atoms involving s-states can be used for the determination of the nuclear charge rms radius (RMSR), the precision being in general higher than that obtained from electron-scattering experiments. On the other hand, if the RMSR is already known very accurately from electron scattering, the measurement in the muonic atom provides information on possible short-ranged muon-nucleon interactions.
From measurements of transitions in muonic atoms one determines charge- moments. The finite-size correction of the 2pls transition depends to a first approxi-
’ This work is based on the thesis of W. Ruckstuhl (ETH Zurich, no. 7061, 1982); it was supported in part by SIN, the Schweizerischer Nationalfonds and the Netherlands Organisation for the Advancement of Pure Scientific Research (ZWO).
a Resent address: CalTech, Pasadena, CA 91125, USA. b Resent address: LAMPF, Los Alamos, NM 87545, USA. ’ Present address: SLAC, BIN 37, PO Box 4349, Stanford, CA 94305, USA. d Present address: NIKHEF-H, Postbus 41882, 1009 DB Amsterdam, The Netherlands. ’ And NIKHEF-K, Postbus 41882, 1009 DB Amsterdam, The Netherlands. ’ Resent address: Rockefeller Univ., 1230 York Avenue, New York, NY 10021, USA.
685

686 W. Ruckstuhl et al. / Precision measurement
mation on the second moment only. For the determination of the RMSR, the other parts of the nuclear finite-size correction must be calculated using information on the charge distribution from electron-scattering data. In view of the high precision of our measurement a major effort was undertaken to obtain an RMSR which is
(i) independent of a specific model distribution for the nuclear charge, (ii) independent to a high degree of electron-scattering data and specially of the
RMSR deduced from these data. Evidently these requirements can only be fulfilled for nuclei where a charge-model-
independent analysis of the electron-scattering data exists. The method used in the present work to extract from the measured wavelength the RMSR satisfying both conditions (i) and (ii) is described in sect. 2.
Alternatively, incorporating in the analysis the RMSR obtained from electron- scattering data permits us to search for possible short-ranged muon-nucleon inter- actions.
In the nonrelativistic limit a scalar and a vector boson exchange have the same effect on the energy levels. The corresponding potential is of the Yukawa type, the range being determined by the mass of the boson. An exchange of an axial vector boson also gives rise to a Yukawa potential, with an additional ur * uN factor ‘), i.e. it changes the hyperfine splitting in muonic atoms. The effect of a pseudoscalar is restricted to a change of the hyperfine splitting in relativistic order V/C.
The measurement presented in this work is one out of a series of four muonic atom experiments, all performed with the crystal spectrometer facility at SIN, which cover all possible space-time structures of parity-conserving neutral boson exchanges:
(a) short-ranged interactions of the scalar or vector type (this work); (b) long-ranged interactions of the scalar or vector type (measurement of the
3d-2p transition wavelengths in 24Mg and 28Si [ref. ‘)I); (c) scalar or vector exchange with isovector structure (measurement of the isotope
shift in the 2p-1s transition of 13C and ‘*C [ref. ‘)I) ; (d) interactions of the axial vector type (measurement of the hyperfine splitting
in the Is state of ‘Li [ref. ‘)I). The results of the present investigation have recently been communicated in a
letter “). A more detailed description can be found in ref. ‘). The ‘*C nucleus was chosen for such a precision measurement since great efforts
have been undertaken in the determination of its charge form factor. Hence the RMSR of the “C nucleus is known very precisely.
2. Theory
The theoretical treatment is based on exact numerical solutions of the Dirac equation for a finite-nuclear-size Coulomb potential and a finite-size Uehling poten- tial. The general layout of our analysis is sketched below.
W. Ruckstuhl et al. / Precision measurement 687
First, the point-nucleus Dirac wavelength A0 = 16.467378 (9) pm, of the 2p3,T1s1,2 transition, calculated using the fundamental constants of ref. 6, and the ratio m,/ m,
of ref. ‘), is subtracted from the measured wavelength. The wavelength difference is transformed into an energy AE(exp).
Then the energy shift AE,(VP) from vacuum polarization of order cu(Zti) for a point nucleus is subtracted. It is calculated in subsect. 2.3. All other QED corrections as well as the effects of nuclear polarization, electron screening and relativistic recoil do not depend on the shape of the nuclear charge distribution within 0.01 eV (subsect. 2.5). The sum AE(corr) of all these corrections is also subtracted from AE(exp). The rest term AE,s(exp) contains the finite nuclear size effects on the Coulomb energy and on the vacuum polarization LX(&) :
AE,s(exp)=AE(exp)-AE,(VP)-AE(corr). (2-l)
The RMSR is deduced from AErs(exp) by expanding the major contributions to AEFs in a series of nuclear charge moments. For this purpose the finite size shift is split into three parts:
A& = AE,(Coul) +AE,s(VP) +AE(rest) . (2.2)
The term AE,(Coul) contains most of the finite-size correction to the Coulomb energy. With first- and second-order perturbation theory AE,(Coul) and AE,a(VP) are written as functions of charge moments only (see subsects. 2.2, 2.3):
(.f(r))=4~ I
O” r’f(r)p(r) dr (2.3) 0
with the normalization
I 00
4lr r*p(r) dr = 1 . (2.4) 0
An essential requirement of our approach is to make AE(rest) sufficiently small thereby reducing its dependence on the nuclear charge distribution. The contribu- tions of AE,(Coul), AE,s(VP) and AE(rest) are 398 eV, 6 eV and 1 eV, respectively.
In subsect. 2.6 the calculations for the unresolved fine structure are given. The sign of all energies presented in this paper refer to binding energies and not to total energies.
For numerical calculations we made use of the code MURKS. A detailed descrip- tion “) is available on request. The code makes use of either a standard parametriz- ation of the nuclear charge distribution or of numerical distributions from model-independent analysis of electron scattering data. The overall numerical accuracy in the 1s state of carbon is better than 0.02 eV.

688 W. Rucksruhl et al. / Precision measurement
2.1. CHARGE DISTRIBUTION FROM ELECTRON SCATTERING
In order to compare the RMSR from muonic atoms with that from electron scattering the two values have to be as uncorrelated as possible. With the formalism described in subsect. 2.2 the contributions depending on (r’) only can be separated clearly from the parts depending also on different moments. The model-independent analysis of Sick ‘) reduces the correlations between (r’) and (rK) to a minimum. By taking the ratios
(2.5)
instead of the moments (2.3) from electron scattering, one gets information on the charge distribution, which is nearly independent of the RMSR. In addition to this, the ratios can be determined much more precisely from the data than the moments themselves, because part of the uncertainties cancel. In table 1 the moments (rK) and the ratios VK from the “model-independent” analysis lo) are given. The Stanford data which are part of Sick’s data set were originally analyzed using a modified harmonic oscillator distribution with five parameters I’). The ratios VK for this charge distribution are given in the last column of table 1. The errors arise from a variation of each of the five parameters within its error. The corresponding changes of VK were addded linearly, although the correlation of the five parameters is not complete. To have an impression of this estimation of the uncertainty one may compare the error given in ref. ‘I) on the RMSR (0.025 fm) with the 0.038 fm uncertainty arising from our procedure. For practical reasons we willvse the model distribution to determine the p(r) dependence of AE(rest) (subsect. 2.4). Table 1 shows, that all ratios VK from this distribution and from the model-independent analysis agree within the errors. This also holds for the RMSR.
TABLE 1
Nuclear charge moments (rK)‘lK and ratios V, (defined in (2.3) and (2.5), respec-
tively) from the charge-model-independent analysis of electron scattering data (3rd
column) and the model distribution (4th column)
K (rK)‘JK [fm] VKa) VKb)
-I 1.8857 (36) 0.7637 (06) 0.7640 (62)
1 2.3018 (43) 0.9321 (03) 0.9324 (30)
3 2.6245 (72) 1.0628 (06) 1.0625 (42)
4 2.7717 (83) 1.1224(14) 1.1218 (99)
5 2.9141 (124) 1.1799 (27) 1.1790 (169)
(log Or/a)) (r’ log (2r/a))“‘/RMSR
-2.3210 (13) -2.3236 (120) il.4267 (10) il.4280 (71)
“) Ref. I’). b, Ref. I’).

W. Ruc~ru~l et aL j Precision measwemettf 689
2.2. FINITE-SIZE CORRECTIONS TO THE COULOMB INTE~CT~ON (A~~(Coul))
The finite nuclear size corrections to the Coulomb energy are expressed in charge moments by using perturbation theory for the finite-size part of the Coulomb potential. This calculation has been carried out by Friar 12). As basis functions he used point-nucleus Coulomb eigenfunctions and included relativistic corrections to the energy shift up to relative order (ZCY)~.
We have replaced Friar’s inconvenient term (r3)2 - showing a strong correlation with (8) - by terms containing only normal moments. Some remaining numerically small contributions are omitted; these are automatically absorbed in AE(rest). The result is
AE,(Coul) = -&~Z)~rn,c~ V) a2
(r3) W(r2) w~x~4) _---- 2a3 a3 10a3
(r4) 2 7 --- +10a4 3 3-’ a4 a4 9a4 ( )
(r2j2 +0%r3) +(l/rNr?
+2 (r2)(r2 log W/a)) 3 a4
+taz)2
1
j2_ y) ~_O%~og (2r/a))_(l/r)(r3) (2.6) a a2 11 3a2 ’
where
m, = reduced p-mass, and y = 0.5772. By introducing the ratios V, (2.5) the energy shift AE,(Coul) can be written as
a polynomial in RMSR:
AE,(Coul) = aR2 + bR3 + cR4, R = ( r2)li2 . (2.7)
The coefficients a, b and c have statistically correlated errors which come from the uncertainties of the ratios V, in table 1.
Table 2 gives the contribution of each term in (2.6), calculated with the ratios V, of the model-independent analysis lo) and the average RMSR from electron scatter- ing. The errors of the different terms are correlated (the signs for the errors in table 2 indicate this correlation). We have calculated all terms in (2.6) for the two extreme distributions of the fits from ref. ‘O) and get the errors from the difference. The total error of A&(Coul) is an order of magnitude smaller than the experimental uncer- tainty of 0.41 eV.

690 W. ~uekstuhi et al. / Precision measurement
TABLE 2
Contributions of the different terms of the charge-moment part (2.6) calculated with RMSR = 2.4705 (50) fm [in eVj
(r2)
a3 terms:
(r9
Wr3 (llr)(r4)
a4 terms:
lr$ r4 GW)
(l/W) (r2Xr2 log (r))
Contribution Error
-440.384 (1.58)
15.167 0.023 23.552 -0.009
5.251 0.030
-0.230 1.697 -0.001 0.000 -1.622 -0.002 -0.482 -0.006
1.967 -0.003
relat. corr.:
(r*j
(r*Xb Cd) O/W>
-1.201 0.000
- 1.959 0.001 0.442 0.000
total dE,(CouI) -397.802 0.040
If one varies the nuclear charge distribution within the limits from electron- scattering experiments in such a way that the RMSR remains constant, AE,(Coul) changes by 0.04 eV (table 2). When one interprets our measurement as a search for an additional muon nucleon interaction, one has to use in addition to the ratios VK the RMSR with its error from electron-scattering data. Because we insert the ratios V, in (2.6) all terms in table 2 change with the RMSR. The error given for the (r2) term corresponds to the total change of AE,(Coul), when one varies the RMSR within its error.
2.3. VACUUM POLARIZATION OF ORDER a(&)
In the 1s state the nuclear finite size contribution to the vacuum polarization AE,s(VP) amounts to 6 eV. The hypothesis ‘) that AE,,(VP) depends on the charge distribution only through AE,s(VP) = u( r2) was tested and confirmed with numerical calculations in which the nuclear charge distribution was blown up and shrunk. The factor z, was determined with the model-independent charge distribution of ref. lo) and the result was included in the poIynomia1 2.7.
2.4. EXACT CALCULATION OF AE(rest)
The part AE(rest) of the finite-size correction not expressed in terms of charge moments is defined by eq. (2.2). The exact value AE,(th) for the finite-size corrections is
AE,,(th) = E,,,,(Coul +VP) - E” - AE,(VP) , (2.8)
E” being the point nudeus Dirac energy. For the numerical evaluation of AE(rest) we subtract from AE,s(th) the terms AE,(Coul) and AE&P) for the same model-independent dist~bution of ref. lo).
The scatter of AEfrest) due to the unce~ainty of the charge dist~bution from electron scattering was determined using the model distribution from ref. I*). Each parameter was varied within its error. The five corresponding changes of AE(rest) were added linearly to form the total uncertainty of AE( rest) (see end of subsect. 2.1):
AE(rest)=-1,24(13)eV.
2.5. HIGHER-ORDER CORRECTIONS
The corrections contributing more than 0.01 eV are listed in table 3. The change of the sum of these corrections under a variation of the nuclear charge dist~bution within the limits from electron scattering is smaller than 0.01 eV. This is added linearly to the uncertainty of AE(rest). Most of the higher-order corrections are calculated using the code MURK& In this subsection V(I) stands for the Coulomb potential with finite nuclear size.
2.5.1. Vacuum polarization of higher orders. These contributions were calculated in first order perturbation theory. The basis functions were taken from the exact solution of the Dirac equation with a potential including finite nuclear size and vacuum polarization of order a(&).
The Kaellen-Sabry potential of the vacuum polarization of order a*(.Zcy) was calculated following Fullerton and Rinker ‘3). Inside the matching radius of 1.5 times the muon orbital radius the point-nucleus potential was folded with the nuclear charge distribution. Outside r = X, the expression of Huang 14) was taken instead of the rough estimate of ref. 13).
The contribution of the vacuum polarization a(Zo)3 was estimated with a similar procedure. We took the finite-size effect on the potential into account by a simple folding of the point-nucleus potential with the nuclear charge distribution using an expansion from Blomquist I’). Outside the matching radius the point-nucleus poten- tial was taken from the article of Huang 14). The accuracy of this procedure is estimated to be better than 30% in the 1s states “).
The range of the potential due to vacuum polarization through muon pairs and hadron pairs is small compared with the nuclear radius. Therefore the simple

692 W. Ruckstuhl et al. / Precision measurement
TABLE 3
Corrections to the point-nucleus~(Coulomb) value of the 2ps,2-ls,,2 transition energy
(in eV)
1s I/2 2P,/2 Transition
vacuum polarization o(Za)
(point nucleus)
vacuum polarization 02(Zo)
a(Zcu)’
muon-pairs
hadrons
vertex correction
virtual Delbrueck
relativistic recoil
two-photon recoil
nuclear polarization
electron screening
totai
AE,(Coul) (term prop. (r2)) -440.38 0.00 AE,(Coul) (other terms) 42.58 0.00
A&s(VP) -6.05 0.00 AE(rest) -1.24 0.01
total
403. I I 24.41
2.91 0.19 -0.04 -0.01
0.21 0.00
0.14 0.00 -4.9 I -0.01
0.02 0.00
0.70 0.03 -0.22 0.00
2.50 “) 0.01 0.00 0.04
378.64 (0.02)
2.72 (0.03)
-0.03 (0.01)
0.21 (0.01)
0.14 (0.02) -4.90 (0.20)
0.02 (0.00)
0.67 (0.03)
-0.22 (0.02)
2.50 (0.30)
-0.04 (0.04)
379.71 (0.37)
-440.38 [I ,581
42.58 (0.04)
-25.37 (0.39)
[I.621
Upperpart: contributions not depending on the shape of the nuclear charge distribution;
lower part: finite-nuclear-size contributions calculated with RMSR = 2.4705 (50) fm. The
uncertainties given in parentheses do not contain the error of the RMSR from electron
scattering in contrast to those given in square brackets.
“) Ref. 22).
expressions 133 and 138 of ref. 16) were used. The resulting corrections are included in table 3.
2.52. Vertex corrections. A discussion of the problems related to the vertex correction in bound systems can be found in the review article by Borie and Rinker 16).
The contributions to the vertex correction are calculated both for a point nucleus 20*2’) and taking into account the nuclear finite size according to Rinker and Steffen I’). The lowest-order ((~(Zcz)) corrections can be split into two parts:
AE(AM)=&: I
“dV
P F 0 xf(r)g(r) dr.
(2.9a)
(2.9b)

W Ruckstuhl et al. / Precision measurement 693
The first term is the self-energy contribution, and the second is due to the anomalous magnetic moment of the muon. The Bethe logarithm is approximated by the mean value of the Bethe-Negele limits 17,‘) [for the point nucleus the value from ref. 20) is used:
in(g) =jln [t($)2,(d$&2,1, (2.10)
(p2c2) = ((E - V)‘) - m:c4 . (2.11)
The effects of higher order in (Zcu) are estimated using a formula from Barrett et al. la)+:
2a (h~)~ AEWQ =;-
dV ’ In ((p2c2)/m~c4)
r (( H dr mfc4 - (p2c2) ’ (2.12)
Note that the expectation value (p) in (2.9a) has to be calculated with nonrelativistic muon wave functions, because some contributions of relative order (Zcu)’ are already included in (2.12). The vertex correction of order ~‘(Z(Y) was derived by Borie 19) [see also ref. “)I.
The different contributions to the vertex correction in the 1s state are given in table 4. The average value 4.9 1 (20) eV between point nucleus and extended nucleus is used in our further analysis. The error corresponds to the difference between the two values.
TABLE 4
Vertex correction in the 1s state (in eV)
Extended Point
nucleus nucleus
self-energy a(Zcr) -4.12 -4.28
anomalous magnetic moment a(Za) -0.38 -0.38
vertex correction a(Zcu)” -0.33 -0.36
vertex correction a’(Za) 0.02 0.02
In the 2p level the point-nucleus expression 20) should be used since relation (2.9a) is expected to lead to numerical instabilities for small values of(p) [ref. ‘“)I. However, the only term contributing on the 0.01 eV level is given by (2.9b).
2.5.3. Other corrections. The lowest-order relativistic recoil correction is calculated according to ref. 16). The two-photon-recoil correction has only been calculated for
’ If one takes the order CY(Z~)’ estimate (2.12) in the original form of ref. I*), the finite-size effect
reduces the correction by about 10% as in the leading-order term. A division of expression (2.12) by a
“rather arbitrary” factor two as done in ref. “) only spoils this agreement.
694 W. Ruckstuhl et al. / Precision measurement
a point nucleus. For the 1s state the expression from ref. 2’) can be written as
a=ln2+1+;. (2.13)
The point-nucleus Bethe logarithm was taken from ref. ‘O). The nuclear-polarization correction was calculated 22) by Rosenfelder using a
parametrization of the nuclear response function 23) from a fit to experimental data on photon absorption and quasi-elastic electron scattering.
The virtual Delbriick effect was calculated by Borie 24). The contribution amounts to 0.016 (3) eV and 0.001 eV for the 1s and the 2p state, respectively.
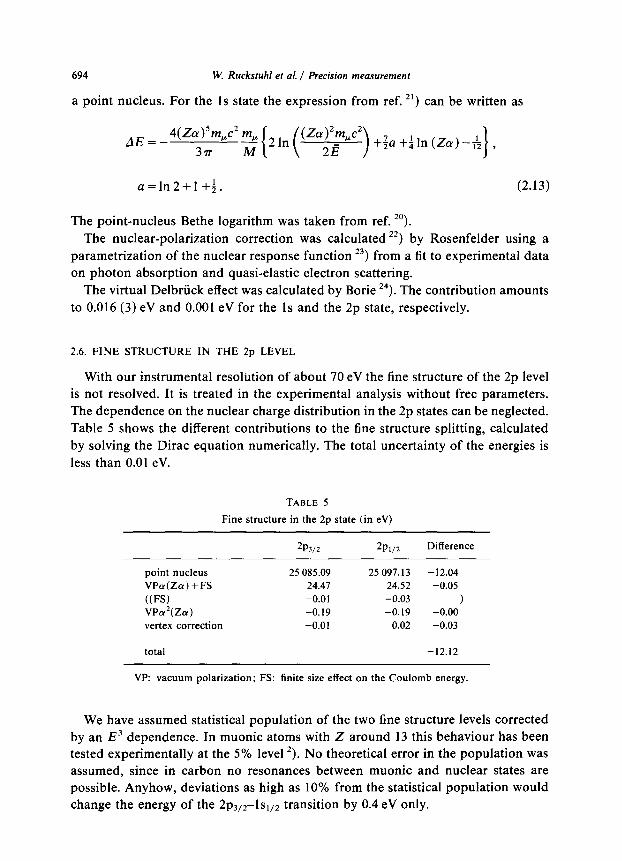
2.6. FINE STRUCTURE IN THE 2p LEVEL
With our instrumental resolution of about 70 eV the fine structure of the 2p level is not resolved. It is treated in the experimental analysis without free parameters. The dependence on the nuclear charge distribution in the 2p states can be neglected. Table 5 shows the different contributions to the fine structure splitting, calculated by solving the Dirac equation numerically. The total uncertainty of the energies is less than 0.01 eV.
TABLE 5
Fine structure in the 2p state (in eV)
2Pw 2P1/2 Difference
point nucleus 25 085.09 25 097.13 -12.04
VPcr(Za) +FS 24.47 24.52 -0.05
((FS) -0.01 -0.03 ) VPd(Za) -0.19 -0.19 -0.00
vertex correction -0.01 0.02 -0.03
total -12.12
VP: vacuum polarization; FS: finite size effect on the Coulomb energy.
We have assumed statistical population of the two fine structure levels corrected by an E3 dependence. In muonic atoms with Z around 13 this behaviour has been tested experimentally at the 5% level ‘). No theoretical error in the population was assumed, since in carbon no resonances between muonic and nuclear states are possible. Anyhow, deviations as high as 10% from the statistical population would change the energy of the Zp3,2-1~1,2 transition by 0.4 eV only.
W. Ruckstuhl et al. / Precision measurement
3. Experiment
695
3.1. SET-UP
The measurement was performed with the bent-crystal spectrometer facility at SIN operated in the continuous scanning mode. The experimental set up for the carbon measurement was identical to that for the last measurements of ref. ‘). We also refer to this publication for the experimental technique and the analysis of the data.
The spectrometer is described in detail in an earlier publication 25). It is built in the DuMond geometry. The 0.27 mm thick target consisted of a 10 x 50 mm* foil of natural graphite. The calibration of the spectrometer with the 84 keV line in the decay of “‘Tm was carried out in the “shadow source” method ****‘j). The absorption of the graphite target itself being not sufficient for this purpose a separate absorber consisting of a flattened 0.2 mm thick wire of jewelry silver (80% Ag and 20% Cu) was used. It was fixed on the target holder parallel to the graphite foil at a distance of 1.5 mm. To minimize aberrational effects only two crystals were mounted on top of each other in the rotational axis of the spectrometer. Quartz crystals (3.2 mm thick) with reflecting 310 planes were used. In the following, the upper crystal is referred to as no. 1, the lower as no. 2. The same notation is used for the two phoswhich detectors behind the crystals. The total solid angle amounted to 2 x 10m5 of 47r. The hardware and the software for spectrometer control in the continuous scanning method are described in ref. “).
The angle defining the angular position of the crystals was measured with a laser interferometer. An exact definition of its reading R (which is essentially proportional to the sinus of the crystal angle) is given in subsect. 4.3.2 of ref. 25). The right and the left Bragg reflex were both measured. The wavelength A(C) of the carbon transition is calculated using the relation
T(C) A(C) =- TW-4
A Pm) , (3.1)
where 2T is the difference in R between the left and the right reflex. The total measuring time of the “C run was 65 h. The proton-beam intensity was
around 70 kA. About half of the time could be used for the measurements of the carbon transition. This corresponds to a total of 4 x 10” muons stopped in the target.
The carbon run was split into a total of 40 cycles. In every cycle three types of left and right angular spectra were measured:
(i) The muonic 2pls transition in carbon in a “narrow” angular region (3.3 FWHM of the reflex) with 26 sweeps.
(ii) The same reflex in a “broad” angular region (6.6 FWHM) with 2 sweeps. The purpose of these measurements was to determine a possible slope of the background in the angular spectrum.

696 W. Rucksiuhl et al. / Precision measurement
(iii) The 84 keV line of “‘Tm in an angular region corresponding to 4.9 FWHM
of the reflex. These measurements are mainly used as a control of the spectrometer
stability.
One cycle took about 90 min. The T-value of Tm used in (3.1) was determined
mainly from calibration measurements before and after the run (see subsect. 3.2).
3.2. y-RAY MEASUREMENTS
Measurements of the reflex of the 84 keV line from an external “‘Tm source ‘)
were used for the determination of T(Tm) in (3.1) as well as for a control of the
spectrometer stability. The angular spectrum of one of the five calibration measure-
ments is shown in fig. 1. In order to eliminate possible aberrational effects 25S2), the
T-value was evaluated using the center-of-gravity (c.g.) method 2). The (linear)
background was determined from the data regions next to the peak, as indicated
in fig. 1. As a check we also determined the T-value by fitting a gaussian line shape
to the spectra. Because of the high “background” in the spectra measured with the
“shadow method” the statistical uncertainty is a factor two larger in the c.g. method
than in the fit. The resulting T-values coincide within the error. Therefore the fit
can be used for the stability checks.
By summing three cycles at a time the carbon run was divided into 13 parts. The
stability of the spectrometer was tested by examination of the internal consistency
of the T-values resulting from gaussian fits to the 13 thulium spectra. These T-values
were found to be consistent within the statistical error which was a factor 2 smaller
than that in the corresponding carbon spectra. The calibration measurements before
and after the run were split in a similar procedure into 16 parts with an accuracy
of <4 ppm each.
A total of six thulium angular spectra (measured during the carbon run and in
five calibration blocks measured before and after) were used to evaluate the T-values
with the c.g. method. The major problem in a c.g. determination is the choice of
the data region. If the region is chosen too wide the uncertainty from the background
points becomes unnecessarily large and one is sensitive to possible structures in the
background far from the line. A too narrow data region will obviously give wrong
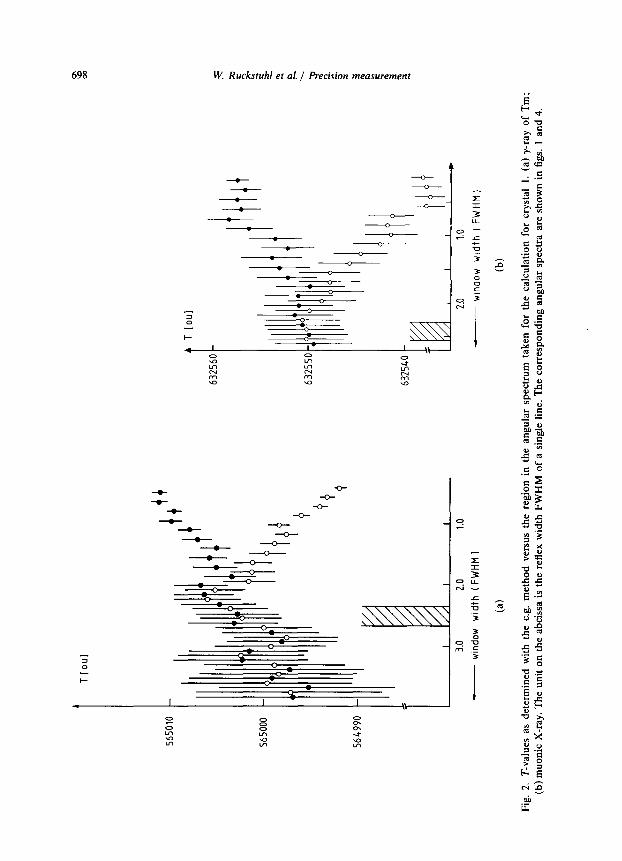
results. In order to obtain an optimal choice the c.g. was determined for two series
of data regions, one having its centre slightly below the actual c.g., the other slightly
above. For both series (indicated by dots and open cycles in fig. 2a) the width of
the data regions was diminished successively by one bin on each side. As can be
seen in fig. 2a for very wide regions the c.g. from both series coincide, whereas for
too narrow regions the centre from the two sets splits apart. The optimal choice
indicated in the figure consists of four data regions situated just before the splitting
of the two branches. The average width of these regions corresponds to about 2.5
times the FWHM of the reflex. The resulting c.g. is the average of the values found
for these four regions. The T-values of the six spectra determined with this procedure
W. Ruckstuhl et al. / Precision measurement 691
5000
I Counts
4ooo
3000
2000
t t t
9b i 55Mxx) 557000
I I I I I
- 573lW - 574000 R I opt. units 1
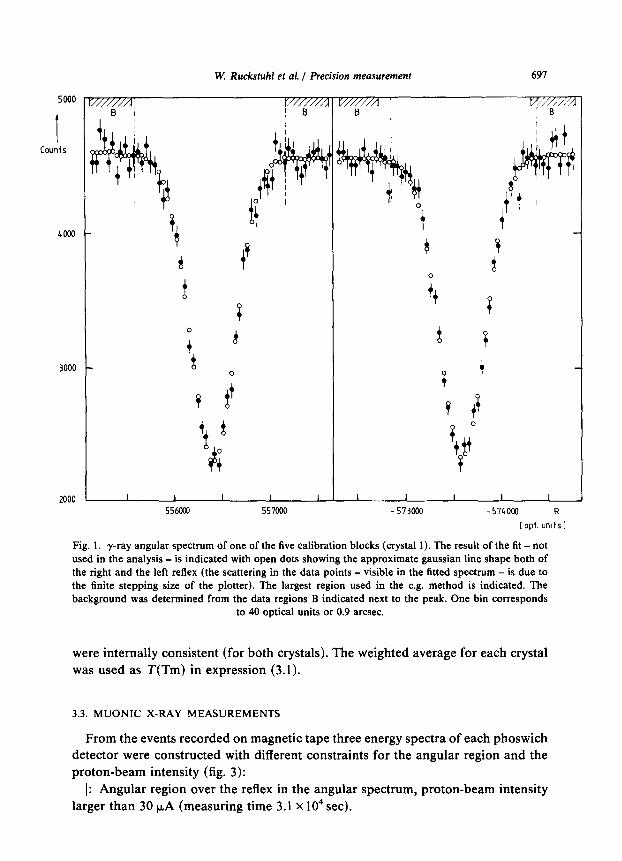
Fig. 1. y-ray angular spectrum of one of the five calibration blocks (crystal 1). The result of the fit - not used in the analysis - is indicated with open dots showing the approximate gaussian line shape both of the right and the left reflex (the scattering in the data points - visible in the fitted spectrum - is due to the finite stepping size of the plotter). The largest region used in the c.g. method is indicated. The background was determined from the data regions B indicated next to the peak. One bin corresponds
to 40 optical units or 0.9 arcsec.
were internally consistent (for both crystals). The weighted average for each crystal was used as T(Tm) in expression (3.1).
3.3. MUONIC X-RAY MEASUREMENTS
From the events recorded on magnetic tape three energy spectra of each phoswich detector were constructed with different constraints for the angular region and the proton-beam intensity (fig. 3):
I: Angular region over the reflex in the angular spectrum, proton-beam intensity larger than 30 PA (measuring time 3.1 x lo4 set).
698 W. Ruckstuhl et al. / Precision measurement
- - - -
- ^
-- --

W. Ruckstuhl et al. / Precision measurement
Counts Isec
’ I
699
i0 QO 90 Energy I WV]
Fig. 3. Energy spectra of phoswich detector 1 from the right carbon reflex. The window used for the construction of the angular spectrum is indicated.
x: Background in the angular region away from the reflex, proton-beam intensity larger than 30 PA (measuring time 1.1 x lo4 set).
0: Background “without beam”, proton-beam intensity lower than 2 PA (measur- ing time 1.4 X lo4 set).
The energy resolution in the phoswich detectors was 10 keV FWHM at 75 keV. The background around 75 keV amounted to 4.5(2) x 10-4/(keV. set) without beam; with beam it increased by a factor 1.6 f 0.2. In the phoswich spectra with beam one can see very weakly the 58 keV line of ‘271, coming from inelastic neutron scattering in the detector itself *‘). The energy window used in the construction of the angular spectrum is indicated in fig. 3.
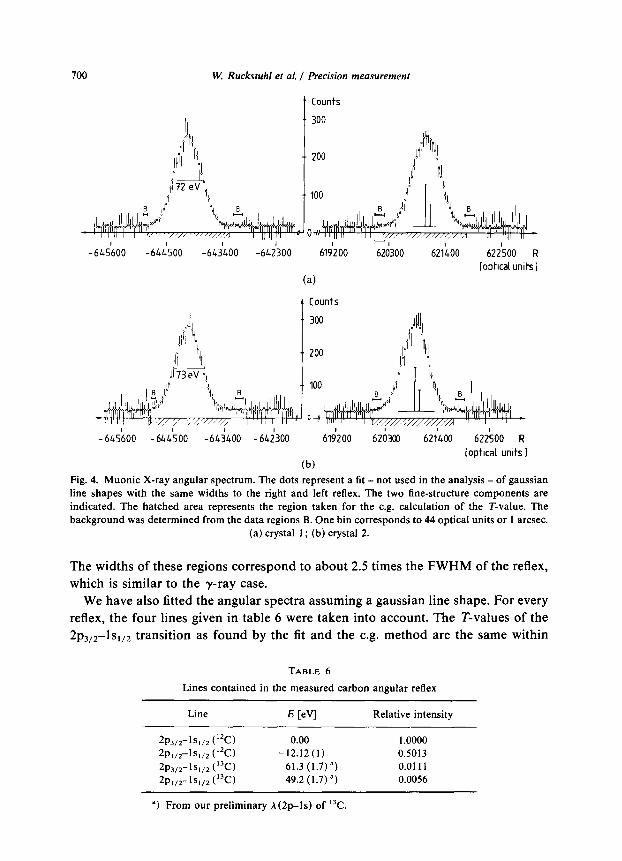
Fig. 4 shows the angular spectrum for both crystals all data summed. The T-value was determined using the c.g. method. A constant background (derived from the data regions next to the peak, as indicated in fig. 4) was first subtracted (small deviations in the subtracted background do not influence the c.g. value significantly since the windows were always chosen symmetrically with respect to the actual centre of gravity).
In fig. 2b these T-values are plotted as a function of the data region taken in the c.g. evaluation. The four regions chosen for the calculation of T(C) are indicated.
W. Ruckstuhl et al. / Precision measurement
[optical units ]
- 6451600 -644;oo -64;400 - 64;300 615200 62;300 62i400 622500 R
[optical units 1 (b)
Fig. 4. Muonic X-ray angular spectrum. The dots represent a fit - not used in the analysis - of gaussian
line shapes with the same widths to the right and left reflex. The two fine-structure components are
indicated. The hatched area represents the region taken for the c.g. calculation of the T-value. The
background was determined from the data regions B. One bin corresponds to 44 optical units or 1 arcsec.
(a) crystal 1; (b) crystal 2.
The widths of these regions correspond to about 2.5 times the FWHM of the reflex, which is similar to the y-ray case.
We have also fitted the angular spectra assuming a gaussian line shape. For every reflex, the four lines given in table 6 were taken into account. The T-values of the 2p3,2-1s,,2 transition as found by the fit and the c.g. method are the same within
TABLE 6
Lines contained in the measured carbon angular reflex
Line E Cevl Relative intensity
2P,,,-ls,,, (“C) 0.00 1 .oooo 2P,,,-ts,,, (“C) -12.12 (1) 0.5013 2ps,2-ts,,z (‘W 61.3 (1.7) “) 0.0111 2Pr,z-ls,/, YC) 49.2 (1.7) “) 0.0056
“) From our preliminary h(2p1s) of ‘%.

W. Rucksruhl et al. / Precision measurement 701
5 ppm. The uncertainty in the c.g. evaluation is only 20% larger as compared with the fit. This is due the large peak-to-background ratio of 13 : 1.
Using the gaussian fit, several checks were performed. The muon stopping rate in the target was monitored with a Ge(Li) detector at a distance of 56 cm from the target. With this detector the intensity of the 2pls line in muonic carbon was measured. In the off-line analysis the intensity of the 2pls transition was determined for every angular bin with a gaussian fit. The muon stopping rate was found to be constant over the whole angular region (as expected) within the statistical error of 2% per angular bin. Omitting the muon stopping-rate normalization we found that the T-values are unchanged within 0.2 ppm. Finally we confirmed that the T-values do not change if a wider energy window is chosen for the phoswich detector (fig. 3).
The T-value in carbon was determined assuming a constant background in the angular spectrum. With a slope as a free parameter the T-value found by the fit changed by 2.1 ppm and 4.5 ppm in the two crystals. The slopes were all consistent with zero. No error due to a possible slope in the background was added.
3.4. TRANSITION WAVELENGTH
The wavelength of the 2p,,,-l~,,~ transition in “C is determined with expression (3.1) using the wavelength of the 84 keV -y-rays in the decay of “‘Tm from ref. 28). The corrections that have to be applied to the ratio of the measured T-values in (3.1) are given in table 7 together with all other contributions determining the uncertainty of A(2p1s).
Note, that the nuclear recoil effect is corrected for in the experimental part; hence, the experimental wave length corresponds to the total energy difference of the two
TABLE 7
Corrections (and uncertainties), both in ppm, to be applied to the ratio A(C)/h(Tm)
Correction
(uncertainty)
crystal 1 crystal 2
Overall uncertainty
statistics T(“C)
statistics T(Tm)
A (Tm) nuclear recoil
‘sC content
source-height effect zero-angle correction temperature stability
total 4.1 -14.8 1.4
(6.5) (7.8) (2.0) (2.8)
- - (0.9) -3.4 (0.0) -3.4 (0.0)
6.8 (0.4) 7.5 (0.4) (0.4)
0.2 (1.3) -19.4 (1.3) (0.5)
0.5 (0.1) 0.5 (0.1) (0.1) (0.8)
Uncertainties of corrections with highly correlated behavior in the two crystals are given in the last column.

702 W. Ruckstuhl et al. / Precision measurement
muonic levels. The target, the “shadow source” and the crystals have a finite height. Thus a photon hits the crystal in general with a small inclination. For a fixed position of the crystal, the diffraction angle for an inclined trajectory is slightly smaller than for a horizontal one. A large part of this source-height effect cancels in the ratio T(C)/ T(Tm). A detailed calculation of the source-height effect can be found in refs. 25Y29). The uncertainty of the corrections is entirely due to uncertainty in the geometry of the set-up, it is reduced in the average over both crystals. A “zero-angle” correction 25) must be made because the carbon target and the silver absorber used in the Tm calibration were 1.5 mm apart from each other.
The movements of the target relative to the crystal were measured with a laser system described in subsect. 2.5 of ref. 25). In the continuous scanning method the correction for target movement was applied off-line, event by event. The overall correction of the T-values due to target motions are -0.2 ppm and -0.8 ppm for carbon and thulium, respectively. The temperature in the surrounding of the crystals and the interferometer was controlled within +O.l”C during the complete set of measurements. This corresponds to a possible change in the T-values of less than
0.8 ppm [ref. ‘)I. Finally, the correction due to the weak contribution of the 2p-1s lines of 13C is
based on a muonic X-ray measurements of an enriched 13C target ‘). Preliminary analysis of this measurement yields
E(‘%(2p-1s)) - E(“C(2p-1s)) = 61*3 eV.
The difference between the 13C corrections in table 7 is due to a slightly different window setting in the centre of gravity analysis for the two crystals.
TABLE 8
Survey of the derivation of the X-ray transition wavelength A(2p,,2-l~,,2) from
the experimental data and the corrections
Crystal 1 Crystal 2
lA(WA(Tm)l corrections (tab. 7)
[A (C)/A (TmLrrected
[A(C)lA(Tm)l
A(Tm)= 14.715430pm
total correlated
error = 1.4 ppm (tab. 7)
1.1195485 (75) 1.1195606 (90) 4.1 ppm - 14.8 ppm 1.1195531 (75) 1.1195440 (90)
1.1195494 (58)
A(2p-1s) 16.47465 1 (88) pm
fine structure 0.000886 pm
16.473765 (88) pm
W. Rucksruhl et al. / Recision measurement 103
From the weighed average in table 7 we find the centre of gravity of the 2p-1s
transition in j.~-l’C:
h(2p1s) = 16.474651 (88) pm. (3.2)
The corresponding transition energy 75 258.2 (5) eV is in agreement with the most precise value so far 3oT50) of 75 263 (5) eV, the error being an order of magnitude smaller in the present measurement.
With a statistical population for the 2p states and the fine structure splitting from table 5 we obtain the 2p~12-ls,12 transition wavelength:
A(2psj2- 1~~~~) = 16.473765 (88) pm i5.3 ppml . (3.3)
4. Results and discussion
4.1. THE rms RADIUS OF 12C
The different steps necessary to obtain the measured nuclear finite size effect AE,s(exp) on the transition energy are listed in table 9. All notations used are defined in sect. 2. This energy shift can be written as a polynomial in the RMSR
AE&exp) = AE(rest) +(a +u)R2 +bR3 +cR4,
R = (r2)“‘.
Solving this equation numerically yields
(r’)z’= 2.4829 (19) fm .
TABLE 9
Determination of the nuclear finite size effect from the (2p,,,-l~,,~) transition wavelength
(4.1)
(.4.2)
A (exp) 16.473765 (88) pm
ho 16.467378 (09) pm h (exp) - A0 0.006387 (88) pm AE (exp) -29.19 (41) eV
A& (VP) 378.64 (02) eV AE (corr) 1.07 (37) eV
AJk (exp) -408.90 (55) eV
table 8
table 3 table 3
The different contributions to the uncertainty are listed in table 10. The error due to the uncertainty of the information on the charge distribution taken from electron scattering (i.e. the ratios V,) is completely negligible. It was determined by solving eq. (4.1) with a, b and c calculated for the two extreme charge distributions as discussed in subsect. 2.2. The errors of AE,,(exp) and AE(rest) were treated in the same way.

704 W. R~~k~~uh~ et al. / Precision measurement
TABLE 10
Contributions to the uncertainty of the RMSR (in fmf
experiment 0.0014 theory (upper part of table 3) 0.00 11 ratios V,(table 1) 0.0001 dE (rest) 0.0005
The value (4.2) agrees with the most precise measurement so far of the RMSR using muonic atoms (table 1 I), deduced with the “equivalent-radius” method from the 2p-1s transition energy measured with a Ge(Li) diode. In this method it remains rather unclear, how the RMSR deduced from muonic transition energies is correlated with electron-scattering data. The parameters of the Barrett moment depend on the “starting” nuclear charge distribution used in the calculation of the muon wave functions. It is obvious that the proportionality of the finite nuclear size energy shift to the Barrett moment holds rather accurately only under a variation of the charge distribution near this starting distribution. For this reason the deduced RMSR and its uncertainty are dependent on electron-scattering data in a rather obscure way. An indication of this is the fact that one finds several sets of parameters in the literature [see e.g. refs. 34*51)]. We have investigated the proportionality by a variation of the charge distribution within the limits from electron scattering. The deviation in this propo~ionality is 0.50 eV. Comparing this with the co~esponding 0.13 eV scatter of AE(rest) and the total error of 0.4 eV in our work one must conclude that the method introduced in our work is superior whenever very high precision is to be reached.
The most recent values from model-independent analysis of electron-scattering data are given in the lower part of table 11. Sick ‘O) has analyzed the data from
TABLE II
Recent measurements of the RMSR of ‘*C
Method RMSR [fm] Ref.
p-atom this work 53 1
e-scattering 2.47 10 f 0.0055 “) 2.4680 f 0.0 120 b,
10 i 34
2.4720*0.01SOc) 33)
“) Data from NBS 33), IKO a’), Darmstadt 32) and SLAC ‘I), analyzed with SOG method; additional information used on large-r behaviour of p(r).
b, Own data, analyzed with Fourier-Bessel parametrization. “) Own data [NBS 33)] and data from IKO 3’) and SLAC I’),
analyzed with Fourier-Bessel parametrization.

W. Rucksruhl et al. / Precision measurement 705
Stanford I’), Amsterdam 3’), Darmstadt 32) and the recent precise NBS data 33) using the sum-of-gaussian method. The charge distribution resulting from this analysis was used in the calculations of sect. 2. Inserting additional information on the nuclear wave functions for large radii Sick improved the precision of the RMSR by a factor of 3. The Mainz group uses the Fourier-Bessel method in analyzing their own data 34). Hence the two values are independent and the best model- independent RMSR from electron-scattering is the weighted average:
( r2)L’2 = 2.4705 (50) fm .
The dispersion corrections are considered in the analysis of both ref. lo) and ref. 34). The RMSR measured with electrons is smaller than the value from muons:
(r2):/2-(r2)~‘2=0.0124f0.0053fm. (4.3)
4.2. ADDITIONAL MUON-NUCLEON INTERACTIONS?
The major motivation of this work is the search for additional muon-nucleon interactions. In this section we tentatively ascribe the difference between our muonic X-ray result and that from electron scattering for 12C to an additional muon-nucleon interaction of vector or scalar type. We compare its strength with information from other experiments. In a second part we estimate roughly the muonic energy level shift which could result from a scalar meson exchange by the mechanism discussed by Barshay 43).
To obtain the information on additional muon-nucleon interactions we insert the rms radius from electron scattering in our calculation of the theoretical transition energy and find+:
AE(exp)(table 9) - AE(th)(table 3) = -3.8* 1.6 eV . (4.4)
The additional interaction (assumed to be isoscalar) is described as the exchange of a (scalar or vector) boson of mass M with coupling constants g,, and g, to the muon and nucleon. Units h = c = 1 and e2 = 41rcu will be used. For boson masses M * u-’ (2.6) such an interaction can be shown to result in an energy shift of muonic s-states of
AE = $$ Ae2(p), (4.5)
where (p) is the muon expectation value of the nuclear charge distribution (normaliz- ation (2.4)); for the 1s state of 12C, (p) = 3.45 x low6 fm-3. From (4.4) and (4.5) we deduce a strength
s = gwgN - = -0.13 1 f 0.056 GeVP2 . e2M2 (4.6)
’ Including our ‘3C(2p-ls) data 3, changes this to a 2.5~ deviation.
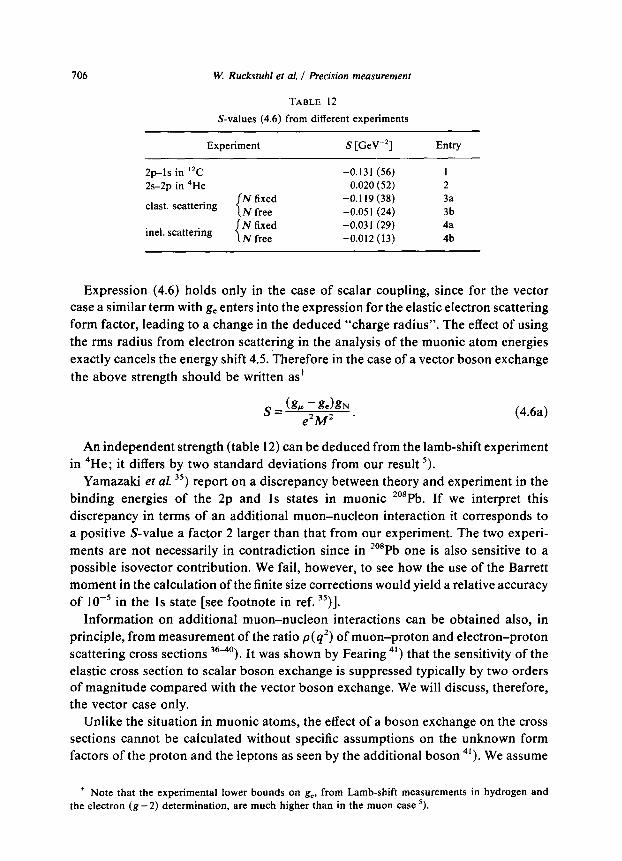
706 W. Ruckstuhl et al. / Precision measurement
TABLE 12
S-values (4.6) from different experiments
Experiment S [GeV-*] Entry
2pls in ‘*C -0.131 (56) 1 2s-2p in 4He 0.020 (52) 2
elast. scattering N fixed
N free
-0.119 (38) 3a
-0.05 1 (24) 3b
inel. scattering -0.03 1 (29) 4a
-0.012 (13) 4b
Expression (4.6) holds only in the case of scalar coupling, since for the vector case a similar term with g, enters into the expression for the elastic electron scattering form factor, leading to a change in the deduced “charge radius”. The effect of using the rms radius from electron scattering in the analysis of the muonic atom energies exactly cancels the energy shift 4.5. Therefore in the case of a vector boson exchange the above strength should be written as+
s = k, - &kN e2M2 *
(4.6a)
An independent strength (table 12) can be deduced from the lamb-shift experiment in 4He; it differs by two standard deviations from our result ‘).
Yamazaki et al. 35) report on a discrepancy between theory and experiment in the binding energies of the 2p and 1s states in muonic “‘Pb. If we interpret this discrepancy in terms of an additional muon-nucleon interaction it corresponds to a positive S-value a factor 2 larger than that from our experiment. The two experi- ments are not necessarily in contradiction since in “*Pb one is also sensitive to a possible isovector contribution. We fail, however, to see how the use of the Barrett moment in the calculation of the finite size corrections would yield a relative accuracy of 10e5 in the 1s state [see footnote in ref. “)I.
Information on additional muon-nucleon interactions can be obtained also, in principle, from measurement of the ratio p( q2) of muon-proton and electron-proton scattering cross sections 36-4o). It was shown by Fearing 41) that the sensitivity of the elastic cross section to scalar boson exchange is suppressed typically by two orders of magnitude compared with the vector boson exchange. We will discuss, therefore, the vector case only.
Unlike the situation in muonic atoms, the effect of a boson exchange on the cross sections cannot be calculated without specific assumptions on the unknown form factors of the proton and the leptons as seen by the additional boson 4’). We assume
’ Note that the experimental lower bounds on g,, from Lamb-shift measurements in hydrogen and the electron (g - 2) determination, are much higher than in the muon case 5).

W. Ruckstuhl et al. / Precision measurement 107
all these form factors to be equal to the electromagnetic ones, treating elastic and inelastic scattering separately, however.
Since the photon is a vector particle the effect of an additional vector boson leads to a very simple expression 36):
Pel(q*) = Pine1(4*r K PI = l + [
(g, - g,)g, 4* g 1 q*+A4* . (4.7)
For a heavy boson the scattering experiments are sensitive to the same combination S (4.6) as the investigations of s-states in muonic atoms.
All the experiments of refs. 3ao) have been analyzed in terms of a muon form factor. The comparison of the corresponding ratio p [see e.g. ref. ““)I for large cut-off parameters with expression 4.7 shows that the parameter l/A2 just equals the strength S. Unfortunately the result of fitting l/A* to the measured ratio p is always given with the statistical error only. The larger uncertainty due to the systematic error in the absolute normalization of the cross sections is not included. We have estimated this uncertainty with our own fits 5, to the published values of p(q*) by increasing and decreasing all ratios by the systematic error cited in the different papers. The resulting S-values are consistent within these total errors for the three elastic experiments and the two inelastic ones, respectively. The weighted averages are given in table 12 (entries 3a and 4a). A more conservative treatment of the systematic normalization error is proposed in the most recent study 37,38). There an analysis of all elastic and inelastic data, respectively, in one common fit is given. In this fit
a normalization factor for each experiment and one common cut-off l/A* were treated as free parameters. The results of these fits are listed in entries 3b and 4b of table 12.
The effect of vector bosons with masses lower than 1 GeV was investigated with our own fit. For a fixed boson mass, bounds on (g, - g,)g, were deduced 5). The result of this investigation is displayed in fig. 5 together with the bounds from muonic atoms. The systematic normalization error is included.
A further experiment providing limits on additional interactions of the muon is the measurement of the anomalous magnetic moment (g -2) of the muon “). Evidently, the experiment gives bounds on g’, (as a function of the boson mass) 42). In order to compare these limits with the results from the other experiments considered in this section, one has to assume values for the coupling constant g,. If one takes as a maximum value a typical strong-interaction coupling constant gN = 49r the area below the (g - 2) curve in fig. 5 is allowed for g, < gv The limits on g, for the case of a scalar boson are somewhat lower (25% for boson masses below 10 MeV and a factor 3 at 10 GeV)?.
No common explanation for the muonic carbon and the pp/ep “discrepancies” is possible for a scalar boson exchange. Here the boson mass is limited to a region
’ The remark about spin-0 bosons at the end of subsect. 7.3 in the final report “) on the experiment is not correct. The stated “insensitivity” arises from an extrapolation of the formulas for M s m to masses of the order of the muon mass.

W. Ruckstuhl e! al. / Precision measurement
I ‘He
0.01 I I I I ,,,,, I 0.1 1.0
M[GeVl-
Fig. 5. Bounds on the strength of an interaction mediated by a vector boson versus the boson mass
(90% confidence level). Shadowed area: 2pls transition in “C (this work); dashed-dotted line: upper
limit from the Lamb shift in 4He [refs. “,“‘)]; hatched area: comparison of elastic pp and ep scattering (entry 3a of table 12 and own fit); solid line: upper limit from the anomalous magnetic moment of the
muon “) (with g, < gP and g, = 4~ assumed).
between roughly 0.1 and several GeV by the measurement of the 3d2p transitions
in muonic 24Mg and 28Si and the (g - 2) experiment.
One might ask finally if our hypothetical boson would have been observed in
existing high-energy experiments. The ratio S = g,g,,,/ e2M2 = -0.13 GeV-’ deduced
from our experiment implies that the coupling increases with the boson mass.
Therefore, for very high masses it would seem probable that such a boson would
have been detected e.g. in pp collision experiments or as an anomaly in the Drell-Yan
mechanism. A direct comparison with our experiment, though, is strongly model
dependent+. For lower boson masses the value S = 0.13 GeV2 results only in a
relatively small additional decay width for the /_L+P- channel. E.g. if the p-meson
would have an additional direct coupling to the muon with S = 0.13 GeV its branch-
ing ratio for p + p”+pu- would be changed by less than 1% only. Such an effect
would not have been noticed in existing experiments.
We now turn to the estimate of the effect oi a svalar boson coupling to leptons
as has been discussed by Barshay 43) in connection with muonic atoms. The corre-
’ E.g. for a 4 GeV vector boson with S = 0.13 GeV2 the ratio between the boson-induced cross section
and the -y-induced effect in the Drell-Yan resonance is approximately 4 for g, = g, = 5.

W. Ruckstuhl et al. / Precision measurement 709
(4 (b) Fig. 6. Effective coupling of a scalar meson H to the muon: (a) muon-nucleon interaction; (b) decay of
the real meson.
sponding graph is shown in fig. 6a. It can be parametrized by a Yukawa potential. The meson form factor (indicated by a bubble in fig. 6a) and the loop are absorbed in the effective coupling constant g,. The coupling is roughly estimated by cutting the graph and studying the decay of the real meson into a lepton pair (fig. 6b). The imaginary part of gP can be calculated in a model-independent way 43,45). For heavy mesons the expression simplifies to
T(H + 2Y) M ’
M>m, (4.8)
where m is the lepton mass, M the hadron mass, and r( H + 27) the partial 2 y width. In the potential corresponding to the diagram (fig. 6a) the real part of g, enters which cannot be calculated without assumptions on the meson form factor45). It is, however, connected with the imaginary part through a dispersion relation. Hence the two parts are expected to be of the same order of magnitude. The sign of gP cannot be predicted 43) though.
Experimentally established candidates for the exchanged scalar meson are the S*(975) and the E( 1300). With a partial two-photon widths of 3 keV [refs. 4M8)] and the assumptions
lReg,l=lImg,l~ g,=4lr
the energy shift in the 1s state of muonic 12C was estimated (table 13). For many years there have been speculations on a broad scalar structure, here called a, with a mass of 2500 MeV, based both on experimental 50) and theoretical 49) consider- ations. A treatment of this structure as a normal resonance (included in table 13) shows that such a structure with an effective coupling to the muon might give rise to an energy shift of the order of our observed effect.
TABLE 13
Effect of a scalar meson exchange via diagram fig. 6a
Meson Mass [MeV] Pm gl E(in “C) [ev]
S: 1300 975 2.2 1.6 x x 1o-5 IO-’ 0.05 0.1 l7 2500 4.2 x 1O-5 0.8

710 W. Ruckstuhl et al. / Precision measurement
5. Conclusions
If we assume that no additional interactions between muons and nucleons are present we deduce from our measurement a charge radius for ‘*C of
(rZ)“*=2.4829*0.0019fm.
The experiment results in a disagreement between the measured energy of the 2~~,~-1s,,~ transition and the calculated value of -3.9* 1.6 eV. Being unable to find any systematic effects (experimental nor theoretical) that could account for such a deviation we tentatively ascribe this energy shift to a short-range muon-nucleon interaction with a strength gPgN/e2M2 = -0.13 1 kO.056 GeV-*, with a boson mass that is restricted to values in the = 1 GeV region. In the case of a vector boson exchange this additional interaction would also result in an improved fit of the pp/ep scattering results. For the case of a scalar boson, a coupling through a mechanism proposed by Barshay 43) is conceivable.
A definite interpretation of our result has to await further investigations of neutral muon-hadron interactions. The muonic-atom experiments are limited by the nuclear charge radius input from electron scattering (with the possible exception of future PH experiments). Experimental progress may be expected from more precise pup scattering under appropriate kinematical conditions. Experiments in the range q*= M’, seem to be particularly promising. Here the effect of a boson interaction could, in principle, be isolated from normalization uncertainties by variation of q*.
We would like to thank L. Knecht for his assistance in solving numerous mechanical problems of the experiment. The help of the staff members of SIN in providing excellent beam conditions is acknowledged. We are indebted to E. Borie for her advice and for fruitful discussions on the theoretical part of the work. It is a pleasure to thank I. Sick for providing us with the charge-momentum ratios and the nuclear charge distribution from his analysis as well as for helpful discussions. The discussions with M. Lecher, F. Lenz, R. Rosenfelder and T. Nakada have been of great help in the interpretation of the experiment. We would like to thank C. Schmid for his help in the comparison with the high-energy physics experiments.
References
I) W. Ruckstuhl, B. Aas, I. Beltrami, K. Bos, P.F.A. Goudsmit, H.J. Leisi, G. Strassner, A. Vacchi, J.
van der Velden, U. Kiebele and R. Weber, Measurement of the byperfine splitting of the Is state in
muonic Li, to be published 2) I. Beltrami, B. Aas, W. Beer, G. de Chambrier, P.F.A. Goudsmit, Th. v.Ledebur, H.J. Leisi, W.
Ruckstuhl, W.W. Sapp, G. Strassner, A. Vacchi, U. Kiebele, J.-A. Pinston and R. Weber, New
precision measurements of the muonic 3d-2p X-ray transition in Mg and Si, to be published
3) F.W.N. de Boer et al., to be published
4) W. Ruckstuhl, B. Aas, W. Beer, I. Beltrami, F.W.N. de Boer, K. Bos, P.F.A. Goudsmit, U. Kiebele,
H.J. Leisi, G. Strassner and A. Vacchi, Phys. Rev. Lett. 49 (1982) 859

W. Rucksmhl et al. / Precision measurement 711
5) W. Ruckstuhl, Suche nach neuen Muon-Nucleon Wechselwirkungen in s-Zustaenden von muon-
ischen Atomen LHE report, ETH Ziirich (1982); Search for new muon-nucleon interactions in
s-states of muonic atoms, thesis ETH, Ziirich no. 7061, 1982, unpublished
6) Particle Data Group, R.L. Kelly et al., Phys. Lett. 1llB (1982)
7) E. Klempt, R. Schulze, H. Wolf, M. Camani, F.N. Gygax, A. Schenck and H. Schilling, Phys. Rev.
D25 (1982) 652 8) W. Ruckstuhl, MURKS, ein Programm zur Berechnung von Korrekturen zu den Bindungsenergien
in muonischen Atomen, LHE report, ETH Ziirich (1982)
9) I. Sick, Nucl. Phys. A218 (1974) 509
10) I. Sick, Phys. Lett. 116B (1982) 212; private communication
11) I. Sick and J. McCarthy, Nucl. Phys. A150 (1970) 631
12) J. Friar, Ann. of Phys. 122 (1979) 151
13) L.W. Fullerton and G.A. Rinker, Phys. Rev. Al3 (1976) 1283 14) K.N. Huang, Phys. Rev. Al4 (1976) 1311
15) J. Blomquist, Nucl. Phys. B48 (1972) 95
16) E. Borie and G.A. Rinker, Rev. Mod. Phys. 54 (1982) 67
17) G.A. Rinker and R.M. Steffen, At. Nucl. Data Tables 20 (1977) 143
18) R.C. Barrett, S.J. Brodsky, G.W. Erickson and M.H. Goldhaber, Phys. Rev. 166 (1968) 1589
19) E. Borie, Helv. Phys. Actaz, 48 (1975) 671 23
20) S. Klarsfeld and A. Maquet, Phys. Lett. B43 (1973) 201
21) G.W. Erickson, J. Phys. Chem. Ref. Data 6 (1977) 831
22) R. Rosenfelder, Nucl. Phys. A393 (1982) 301
23) R. Rosenfelder, Nucl. Phys. A377 (1982) 518
24) E. Borie, private communication
25) B. Aas, W. Beer, I. Beltrami, P. Ebersold, R. Eichler, Th.v. Ledebur, H.J. Leisi, W. Ruckstuhl, W.W.
Sapp, A. Vacchi, J. Kern, J.A. Pinston, W. Schwitz and R. Weber, Nucl. Phys. A375 (1982) 405
26) W.W. Sapp, Nucl. Instr. Meth. 141 (1977) 391
27) W. Beer, Th.< Ledebur and W. Schoeps, Nucl. Instr. Meth. 156 (1978) 493
28) E.G. Kessler, L. Jacobs, W. Schwitz and R.D. Delattes, Nucl. Instr. Meth. 160 (1979) 435
29) I. Beltrami, Neue Praezisionsmessungen des 3d-2p Ueberganges in muonischem Mg und Si, LHE
report, ETH Ziirich (1982)
30) L.A. Schaller, L. Schellenberg, A. Ruetschi and H. Schneuwly, Nucl. Phys. A343 (1980) 333
31) J.A. Hansen, R.T. Peerdeman and C. devries, Nucl. Phys. A188 (1972) 337
32) G. Fey, H. Frank and W. Schuetz, TH Darmstadt preprint
33) L.S. Cardman, J.W. Lightbody, S. Penner, S.P. Fivozinsky, X.K. Maruyama, W.P. Trower and S.E.
Williamson, Phys. Lett. 91B (1980) 203
34) W. Reuter, G. Fricke, K. Merle and H. Miska, Phys. Rev. C26 (1982) 806
35) Y. Yamazaki, H.D. Wohlfahrt, E.B. Shera, M.V. Hoehn and R.M. Steffen, Phys. Rev. Lett. 42 (1979)
1470
36) T.J. Braunstein, W.L. Lakin, F. Martin, M.L. Perl, W.T. Toner and T.F. Zipf, Phys. Rev. D6 (1972) 106
37) I. Kostulas, A. Entenberg, H. Joestlein, A.C. Melissinos, L.M. Lederman, P. Limon, M. May, P.
Rapp, H. Gittleson, T. Kirk, M. Murtagh, M.J. Tannenbaum, J. Sculli, T. White and T. Yamanouchi,
Phys. Rev. Lett. 32 (1974) 489
38) A. Entenberg, H. Joestlein, I. Kostulas, A.C. Melissin&, L.M. Lederman, P. Limon, M. May, P.
Rapp, H. Gittleson, T. Kirk, M. Murtagh, M.J. Tannenbaum, J. Sculli, T. White and T. Yamanouchi,
Phys. Rev. Lett. 32 (1974) 486
39) L. Camillieri, J.H. Christensen, M. Kramer, L.M. Lederman, Y. Nagashima and T. Yamanouchi, Phys. Rev. Lett. 23 (1969) 153, 149
40) R.W. Ellsworth, A.C. Melissinos, J.H. Tinlot, H. von Briesen, T. Yamanouchi, L.M. Lederman, M.J.
Tannenbaum, R.L. Cool and A. Maschke, Phys. Rev. 165 (1968) 1449
41) H.W. Fearing, Phys. Rev. D6 (1972) 203
42) B.E. Lautrup, A. Peterman and E. de Rafael, Phys. Reports 3 (1972) 193
43) S. Barshay, Phys. Rev. D7 (1973) 2635; Phys. Lett. 37B (1971) 397

712 W. Ruckstuhl et al. / Precision measurement
44) J. Bailey et al., Nucl. Phys B150 (1979) 1
45) P. Herczeg, Phys. Rev. D16 (1977) 712
46) A.E. Kaloshin, Sov. J. Nucl. Phys. 33 (1981) 758
47) R.J. Wedemeyer, Proc. 1981 Int. Symp. on lepton and photon interactions at high energies, Univer- sitaet Bonn (1981)
48) R. Brandelik et al., Z. Phys. Cl0 (1981) 117
49) R. Delbourgo and M.D. Scadron, Phys. Rev. Lett. 48 (1982) 379
50) G. Mennessier, Meson pair production in y-r-scattering and implication for scalar mesons, 2. Phys.
Cl6 (1983) 241
51) R. Engfer, H. Schneuwly, J.L. Vuilleumier, H.K. Walter and A. Zehnder, At. Nucl. Data Tables 14
(1974) 509
52) G. Carboni, G. Gorini, E. Iacopini, F. Palmonari, G. Torelli and E. Zavattini, Phys. Lett. 73B (1978)
229;
G. Carboni, G. Gorini, L. Palffy, F. Palmonari, G. Torelli and E. Zavattini, Nucl. Phys. A278 (1977)
381
53) L.A. Schaller, L. Schellenberg, T.Q. Phan, G. Piller, A. Ruetschi and H. Scheuwly, Nucl. Phys. A379
(1982) 523


![CANON A430[1]](https://img.dokumen.tips/doc/110x75/543084a0219acdf5478b5afe/canon-a4301.jpg)