Embed Size (px)
Citation preview

NCHRP Web Document 54 (Project D9-26): Contractor’s Interim Report
Precision Estimates of Selected Volumetric Properties of HMA
Using Non-Absorptive Aggregate
Prepared for:
National Cooperative Highway Research Program Transportation Research Board
of the National Academies
Submitted by:
Peter Spellerberg David Savage James Pielert
AASHTO Materials Reference Laboratory Gaithersburg, Maryland
February 2003

ACKNOWLEDGMENT
This work was sponsored by the American Association of State Highway and Transportation Officials (AASHTO), in cooperation with the Federal Highway Administration, and was conducted in the National Cooperative Highway Research Program (NCHRP), which is administered by the Transportation Research Board (TRB) of the National Academies.
DISCLAIMER
The opinion and conclusions expressed or implied in the report are those of the research agency. They are not necessarily those of the TRB, the National Research Council, AASHTO, or the U.S. Government.
This report has not been edited by TRB.
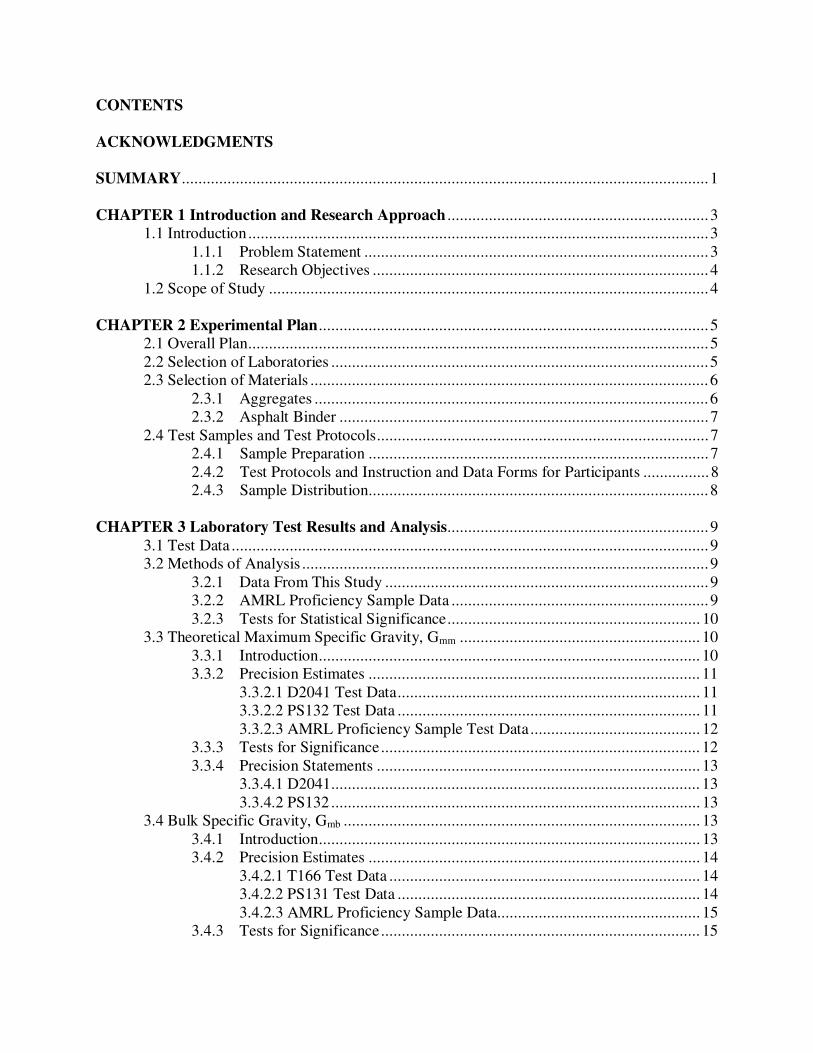
CONTENTS
ACKNOWLEDGMENTS
SUMMARY...............................................................................................................................1
CHAPTER 1 Introduction and Research Approach ...............................................................3 1.1 Introduction...............................................................................................................3
1.1.1 Problem Statement ...................................................................................3 1.1.2 Research Objectives .................................................................................4
1.2 Scope of Study ..........................................................................................................4
CHAPTER 2 Experimental Plan..............................................................................................5 2.1 Overall Plan...............................................................................................................52.2 Selection of Laboratories ...........................................................................................5 2.3 Selection of Materials ................................................................................................6
2.3.1 Aggregates ...............................................................................................6 2.3.2 Asphalt Binder .........................................................................................7
2.4 Test Samples and Test Protocols................................................................................7 2.4.1 Sample Preparation ..................................................................................7 2.4.2 Test Protocols and Instruction and Data Forms for Participants ................8 2.4.3 Sample Distribution..................................................................................8
CHAPTER 3 Laboratory Test Results and Analysis...............................................................9 3.1 Test Data ...................................................................................................................9 3.2 Methods of Analysis ..................................................................................................9
3.2.1 Data From This Study ..............................................................................9 3.2.2 AMRL Proficiency Sample Data ..............................................................9 3.2.3 Tests for Statistical Significance............................................................. 10
3.3 Theoretical Maximum Specific Gravity, Gmm .......................................................... 10 3.3.1 Introduction............................................................................................ 10 3.3.2 Precision Estimates ................................................................................ 11
3.3.2.1 D2041 Test Data......................................................................... 113.3.2.2 PS132 Test Data ......................................................................... 113.3.2.3 AMRL Proficiency Sample Test Data......................................... 12
3.3.3 Tests for Significance............................................................................. 12 3.3.4 Precision Statements .............................................................................. 13
3.3.4.1 D2041......................................................................................... 133.3.4.2 PS132 ......................................................................................... 13
3.4 Bulk Specific Gravity, Gmb ...................................................................................... 13 3.4.1 Introduction............................................................................................ 13 3.4.2 Precision Estimates ................................................................................ 14
3.4.2.1 T166 Test Data ........................................................................... 143.4.2.2 PS131 Test Data ......................................................................... 143.4.2.3 AMRL Proficiency Sample Data................................................. 15
3.4.3 Tests for Significance............................................................................. 15

3.4.4 Precision Statements .............................................................................. 16 3.4.4.1 T166........................................................................................... 16 3.4.4.2 PS131 ......................................................................................... 17
3.5 Relative Density at Nini and Ndes .............................................................................. 17 3.5.1 Introduction............................................................................................ 17 3.5.2 Precision Estimates ................................................................................ 17
3.5.2.1 T312 Test Data ........................................................................... 173.5.2.2 AMRL Proficiency Sample Test Data......................................... 18 3.5.2.3 T269........................................................................................... 18
3.5.3 Tests for Significance............................................................................. 19 3.5.4 Precision Statement for T312 ................................................................. 19
CHAPTER 4 Conclusions and Recommendations ................................................................ 20 4.1 General.................................................................................................................... 204.2 Conclusions and Recommendations Related to Specific Standards .......................... 20
4.2.1 ASTM D2041......................................................................................... 204.2.2 AASHTO T166...................................................................................... 20 4.2.3 ASTM D2041 Results Compared to ASTM PS132 Results .................... 214.2.4 AASHTO T166 Results Compared to ASTM PS131 Results.................. 214.2.5 AASHTO T312...................................................................................... 22 4.2.6 AASHTO T269...................................................................................... 22
4.3 General Conclusions and Recommendations............................................................ 23
FIGURES ................................................................................................................................ 24
TABLES .................................................................................................................................. 34
REFERENCES ....................................................................................................................... 43
APPENDIX A Instructions to Laboratories for Testing Samples .................................... 44
APPENDIX B Bivariant Tolerance Region – A Tool for Screening AMRL Proficiency Sample Data ............................................................................................... 54
APPENDIX C Statistical Methods for Analyzing AMRL Proficiency Sample Data ....... 56
APPENDIX D Precision Statement for D2041-00 ............................................................. 57
APPENDIX E Precision Statement for T166-00 ............................................................... 58
APPENDIX F Precision Statement for T312-01 ............................................................... 59

ACKNOWLEDGMENTS
The research reported herein was performed under NCHRP Project 9-26 by the AASHTO Materials Reference Laboratory (AMRL). Mr. Peter Spellerberg and Mr. David Savage were co-principle investigators on the study, and Dr. Charles Antle was the consultant on statistical analysis of the interlaboratory data. Stephen Ritenour of AMRL had a lead role supported by other AMRL staff members in the design and preparation of the samples. The authors wish to give a special thanks to Dr. Haleem Tahir of AASHTO for his excellent advice and guidance during the study.
The authors wish to acknowledge the laboratories that participated in this interlaboratory study. Their willingness to volunteer their time and conduct the testing under tight time constraints at no cost to the study is most appreciated. The laboratories included:
State Departments of Transportation Florida Department of Transportation, State Materials Office, Gainesville, Florida Georgia Department of Transportation, Office of Materials and Research, Forest Park,
Georgia Hawaii Department of Transportation, Highway Department, Honolulu, Hawaii Indiana Department of Transportation, Indianapolis, Indiana Iowa Department of Transportation, Highway Division Materials Laboratory, Ames,
Iowa Kansas Department of Transportation, Research and Materials Bureau, Topeka, Kansas Kentucky Transportation Cabinet, Division of Materials, Frankfort, Kentucky Maryland State Highway Administration, Western Regional Laboratory, Hancock,
Maryland Michigan Department of Transportation, Lansing, Michigan Minnesota Highway Department, Materials and Research Laboratory, Maplewood,
Minnesota Montana Department of Highways, Materials Bureau, Helena, Montana Nebraska Department of Roads, Materials and Test Division, Lincoln, Nebraska Nevada Department of Transportation, Materials and Testing Division, Carson City,
Nevada New York State Department of Transportation, Albany, New York Oklahoma Department of Transportation, Oklahoma City, Oklahoma Rhode Island Department of Transportation, Public Works Materials Testing Center,
Providence, Rhode Island South Carolina Department of Transportation, Columbia, South Carolina Utah Department of Transportation, Construction Materials Division, Salt Lake City,
Utah Virginia Department of Highways and Transportation, Materials Division – Physical
Laboratory, Richmond, Virginia Wyoming State Highway Department, Cheyenne, Wyoming
Other Laboratories Braun Intertec Engineering, Inc., St. Paul, Minnesota

Federal Highway Administration – Central Federal Lands Highway Division, Denver, Colorado
Kary Asphalt, Eden, Maryland National Center for Asphalt Technology – Auburn University, Auburn, Alabama Payne and Dolan, Inc., Waukesha, Wisconsin Rieth-Riley Construction Company, Inc., Indianapolis, Indiana
The authors would also like to acknowledge the Western Regional Laboratory of the Maryland State Highway Administration who assisted in the identification of aggregate used in this study and in recommending HMA mixture designs. Thanks also to the Chevron Refinery in Perth Amboy, New Jersey who supplied the PG 64-22 grade binder at no cost to the study.

1
SUMMARY
The Superpave system for the laboratory design of Hot Mixed Asphalt (HMA) requires the use of Superpave Gyratory Compactors for the compaction of specimens. The procedure used for this purpose is included in AASHTO T312, Standard Method of Test for Preparing and Determining the Density of Hot-Mix Asphalt (HMA) Specimens by Means of the Superpave Gyratory Compactor. This study was undertaken with the objective of developing a precision statement applicable to AASHTO T312 and updating the published precision statements for AASHTO T166, Standard Method of Test for Bulk Specific Gravity of Compacted Asphalt Mixtures Using Saturated Surface-Dry Specimens, and ASTM D2041-01, Standard Test Method for Theoretical Maximum Specific Gravity and Density of Bituminous Mixtures.
Another objective was to prepare first-cut precision estimates for ASTM provisional standards ASTM PS131, Standard Method of Test for Bulk Specific Gravity and Density of Compacted Mixtures Using Automatic Vacuum Sealing Method, and ASTM PS132, Standard Method of Test for Maximum Specific Gravity and Density of Bituminous Paving Mixtures Using Automatic Vacuum Sealing Method.
The experimental plan for the study selected an aggregate source that produced relatively uniform non-absorptive limestone aggregate. The binder for the study was a PG 64-22 meeting the requirements of AASHTO MP1, Standard Specification for Performance Graded Asphalt Binder. Twenty-seven laboratories (including AMRL) volunteered to participate in an inter-laboratory program within the scope of the study. The plan required determining the test precision applicable to the coarse and fine mixes. A maximum aggregate size of 19.0-mm was used for the coarse mix and 12.5-mm for the fine mix.
The test samples were prepared by AMRL staff at the AMRL facility located at the National Institute of Standards and Technology (NIST). This involved determination of the design binder content for the two mixes in accordance with the requirements of AASHTO MP2, Standard Specification for Superpave Volumetric Mix Design and AASHTO PP28, Standard Practice for Superpave Volumetric Design for Hot-Mix Asphalt (HMA). With the design binder contents known, loose mix samples were then prepared according to PP28, and distributed to the participating laboratories for interlaboratory testing. The laboratories were provided with instructions to test the samples and test data collection forms. The test results from this study and existing data from the AMRL Proficiency Sample Program were statistically analyzed and precision estimates prepared.
The study resulted in proposed precision statements in a format for consideration by standards committees for D2041, T166 (Method A), and T312. It is recommended that AASHTO consider adopting D2041 as a replacement for T209, Standard Method of Test for Theoretical Maximum Specific Gravity and Density of Bituminous Paving Materials. The Gmb
values obtained using T166 from specimens compacted with the Pine AFGC125X compactor were greater than those obtained from specimens compacted with the Troxler 4140 compactor. The relative density values determined using T312 from specimens compacted with the Pine AFGC125X compactor were greater than those obtained from specimens compacted with the Troxler 4140 compactor. Although the range in air voids in specimens tested in this study were

2
limited, it may be appropriate to include the precision estimates proposed for T312 which are applicable to Superpave specimens in T269.
Precision estimates for PS131 andPS132 were prepared based on the results from this study but they are not recommended for adoption into standards until interlaboratory studies involving laboratories having more experience in performing the tests are conducted.

CHAPTER 1
INTRODUCTION AND RESEARCH APPROACH
1.1 INTRODUCTION
At the conclusion of research on asphalt in 1993, the Strategic Highway Research Program (SHRP), delivered as a final product, “The Superpave System .” The system proposed methods of design of dense graded Hot Mixed Asphalts (HMA) for new pavements and overlays (1)1. The system takes into account the traffic loading, environmental conditions, materials characteristics, and the level of performance expected of the HMA in the real world of service conditions. The design system established criteria for selecting, proportioning and combining the materials, densification or compaction requirements, and the volumetric properties of the mix.
As these new Superpave design procedures became available, the American Association of State Highway and Transportation Officials (AASHTO) Subcommittee on Materials (SOM) transformed them into national standards and published them as “Provisional Standards” ( 2).This step was taken to accomplish three objectives. First, maintain uniformity in the use of design procedures on a national basis. Second, make the standards available in a single volume, i.e., provide one-stop shopping. Third, provide a means for getting input from the practicing engineers and researchers for the improvement of the standards on a real-time basis.
The Provisional Standards continue to meet these objectives. Because of their application at the national level, the Superpave protocols have received extensive feedback from users and researchers. Since their first publication in 1993, most of these protocols have been revised and published on a yearly basis with the latest edition dated May 2002.
1.1.1 Problem Statement
Significant changes and improvements have occurred and continue to occur in the Superpave design procedures since the system was first introduced. One serious deficiency, which is widely acknowledged, relates to the absence of precision statements in most of the standards.
The Superpave mix design method relies on the volumetric properties of HMA at specified compaction levels. The desired compaction levels in the laboratory mix design are achieved by the use of gyratory compactors. The design computations and the volumetric properties for laboratory compacted specimens require determination of bulk and maximum specific gravities. There is concern about the validity of the precision statements in standards used to determine these properties. AASHTO T312-01, Standard Test Method for Preparing and Determining the Density of Hot-Mix Asphalt (HMA) Specimens by Means of the Superpave Gyratory Compactor (3) does not have a precision statement. ASTM D2041-00, Standard Test Method for Theoretical Maximum Specific Gravity and Density of Bituminous Mixtures (4) has
1 Numbers in parentheses refer to the bibliography.
3

a precision statement but it may be obsolete because of many changes made to the standard. The precision statement for AASHTO T166-00, Standard Method of Test for Bulk Specific Gravity of Compacted Asphalt Mixtures Using Saturated Surface-Dry Specimens (3) may be outdated.
1.1.2 Research Objectives
This phase of Project 9-26 had the following objectives: (a) Develop a precision statement applicable to T312. (AASHTO Provisional Standard
TP4-00 was the predecessor to T312. TP4-00 was used to test the 12.5-mm samples and T312 was used to test the 19.0-mm samples.)
(b) Update precision statements currently published in T166 and D2041. (c) Develop precision estimates for ASTM PS131-01, Bulk Specific Gravity and Density
of Compacted Bituminous Mixtures Using Automatic Vacuum Sealing Method (4); and PS132-01, Maximum Specific Gravity and Density of Bituminous Paving Mixtures Using Automatic Vacuum Sealing Method (4).
(d) Compare the precision estimates obtained from this study to estimates obtained from data collected in the Proficiency Sample Program operated by the AASHTO Materials Reference Laboratory (5).
(e) If possible, evaluate differences among models of Superpave gyratory compactors (SGCs).
1.2 SCOPE OF STUDY
This work was limited to the development of precision statements for the standards which provide information on the density or percent compaction of HMA made with non-absorptive aggregates. The following conditions limited the scope of the study:
(a) Use materials that conform to the Superpave mix specifications. (b) Use only one source of relatively uniform non-absorptive aggregate. Use a 19.0-mm
coarse gradation and a 12.5-mm fine gradation with Superpave upper and lower gradation bands as specified in MP2-00, Standard Specification for Superpave Volumetric Mix Design (2).
(c) Use a single performance grade neat binder PG 64-22 from a single source.
Specific tasks included in the study were as follows.
Task 1 – Selection of Laboratories Task 2 – Selection of Materials and Mix Designs
Task 3 – Preparation of Loose Mix Samples Task 4 – Preparation of Instructions for Participants Task 5 – Analysis of Data from Participants Task 6 – Preparation of Revisions to the Standards Task 7 – Preparation of a Final Report
4

5
CHAPTER 2
EXPERIMENTAL PLAN
2.1 OVERALL PLAN
The development of precision statements as outlined in Section 1.1.2 required participation of a number of laboratories in an interlaboratory study. The approach used for the development of such a program was based on ASTM E691-99, Standard Practice for Conducting an Interlaboratory Study to Determine the Precision of a Test Method (6). The absolute minimum number of laboratories required for the development of a precision statement is specified as six in E691 with a preferred minimum of 30.
The study involved two mix designs, one having a 12.5-mm fine gradation and the other a 19.0-mm coarse gradation. For each mix design, each participant was asked to determine the theoretical maximum specific gravity of three approximately 2300 g loose mix test specimens by D2041, and the maximum specific gravity of the same three loose mix test specimens according to PS132 using the automatic vacuum sealing method. In addition, for each mix design, each participant was asked to compact three approximately 5000 g loose mix specimens according to T312, determine the bulk specific gravity of the compacted specimens according to T166, determine the bulk specific gravity of the same compacted specimens as described in PS131 using the automatic vacuum sealing method, and calculate the relative density at Nini and Ndes as described in T312.
2.2 SELECTION OF LABORATORIES
The criteria developed for the selection of laboratories considered to be good candidates for this study were:
1. Its participation must be voluntary with no cost to the study. 2. The selection will be made from a mix of the State DOT and private sector
laboratories. 3. The participants will agree to comply and strictly adhere to the requirements of the
standards in question and the supplementary instructions and data sheets provided by the AMRL.
4. Preference will be given to laboratories that have all the equipment and accessories needed for the completion of the tests included in the study.
5. Preference will be given to laboratories that participated in the AMRL HMA Proficiency Sample Program which included TP4 or T312 for the past four years.
6. Preference will be given to laboratories accredited by the AASHTO Accreditation Program (5,7).
The most difficult criterion for the selection of laboratories was that they have the capability of performing all the tests included in the study. Three of the tests, D2041, PS131, and PS132, required new equipment not available in many laboratories. Accordingly, it was
6
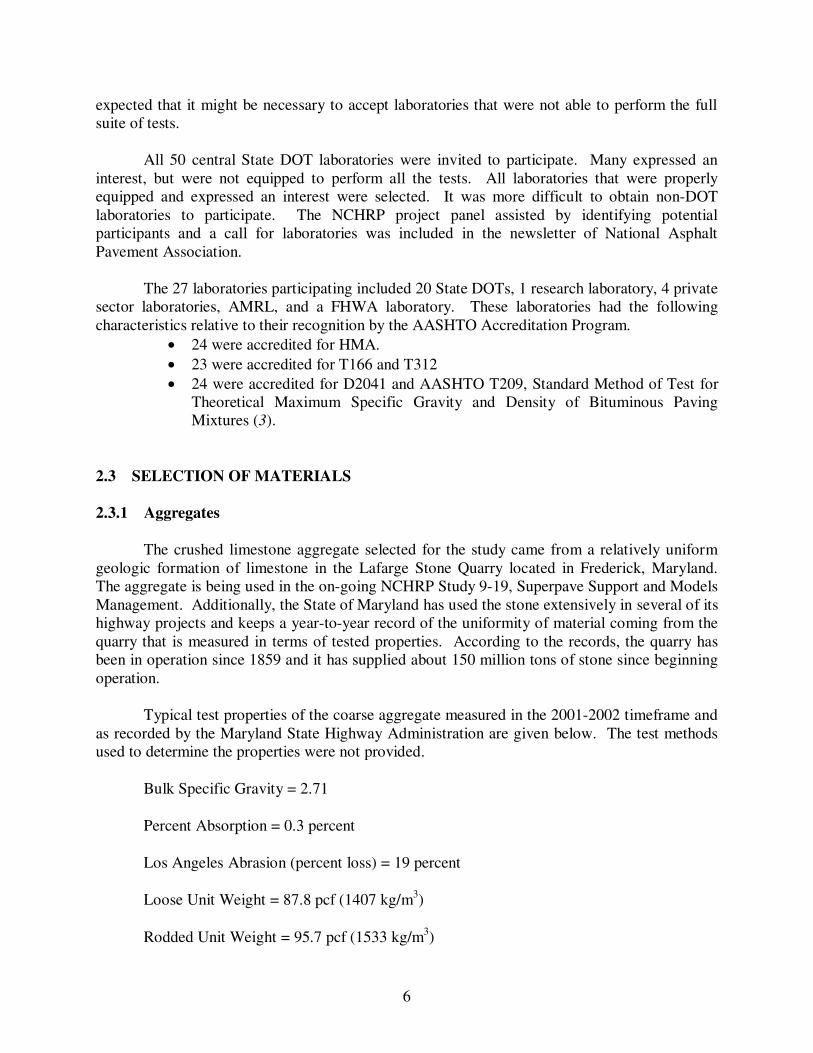
expected that it might be necessary to accept laboratories that were not able to perform the full suite of tests.
All 50 central State DOT laboratories were invited to participate. Many expressed an interest, but were not equipped to perform all the tests. All laboratories that were properly equipped and expressed an interest were selected. It was more difficult to obtain non-DOT laboratories to participate. The NCHRP project panel assisted by identifying potential participants and a call for laboratories was included in the newsletter of National Asphalt Pavement Association.
The 27 laboratories participating included 20 State DOTs, 1 research laboratory, 4 private sector laboratories, AMRL, and a FHWA laboratory. These laboratories had the following characteristics relative to their recognition by the AASHTO Accreditation Program.
• 24 were accredited for HMA. • 23 were accredited for T166 and T312 • 24 were accredited for D2041 and AASHTO T209, Standard Method of Test for
Theoretical Maximum Specific Gravity and Density of Bituminous Paving Mixtures (3).
2.3 SELECTION OF MATERIALS
2.3.1 Aggregates
The crushed limestone aggregate selected for the study came from a relatively uniform geologic formation of limestone in the Lafarge Stone Quarry located in Frederick, Maryland. The aggregate is being used in the on-going NCHRP Study 9-19, Superpave Support and Models Management. Additionally, the State of Maryland has used the stone extensively in several of its highway projects and keeps a year-to-year record of the uniformity of material coming from the quarry that is measured in terms of tested properties. According to the records, the quarry has been in operation since 1859 and it has supplied about 150 million tons of stone since beginning operation.
Typical test properties of the coarse aggregate measured in the 2001-2002 timeframe and as recorded by the Maryland State Highway Administration are given below. The test methods used to determine the properties were not provided.
Bulk Specific Gravity = 2.71
Percent Absorption = 0.3 percent
Los Angeles Abrasion (percent loss) = 19 percent
Loose Unit Weight = 87.8 pcf (1407 kg/m3)
Rodded Unit Weight = 95.7 pcf (1533 kg/m3)

7
Testing performed on the aggregate by AMRL yielded the following results:
(a) Coarse Aggregate
Water Absorption by AASHTO T85, Standard Method of Test for Specific Gravity and Absorption of Coarse Aggregate (3) = 0.5 – 1.0 percent
Bulk Specific Gravity by AASHTO T85 = 2.67
Effective Specific Gravity by AASHTO PP28, Standard Practice for Superpave Volumetric Design for Hot-Mix Asphalt (HMA) (2) = 2.71
(b) Fine Aggregate
Water Absorption by AASHTO T84, Standard Method of Test for Specific Gravity and Absorption of Fine Aggregates (3) = 1.0 percent
Bulk Specific Gravity by AASHTO T84 = 2.64
2.3.2 Asphalt Binder
The binder used in both mixtures was a PG 64-22 grade asphalt binder obtained from the Chevron Refinery in Perth Amboy, New Jersey. This binder is one of the most commonly used grades in the United States and it has been used successfully on numerous research projects.
2.4 TEST SAMPLES AND TEST PROTOCOLS
2.4.1 Sample Preparation
Samples were prepared by AMRL staff in the Proficiency Sample Facility located at the National Institute of Standards and Technology (NIST) using procedures developed for the AMRL HMA Proficiency Sample Program (7).
The laboratory mix formulas shown in Table 1 were used to prepare the 12.5-mm and 19.0-mm maximum specific gravity (Gmm) test mixtures and the Superpave gyratory (Gyr) test mixtures. Each loose mix test sample was individually prepared during one of four mix operations: 12.5-mm Gmm, 12.5-mm Gyr, 19.0-mm Gmm, and 19.0-mm Gyr. The 12.5-mm and 19.0-mm mixtures resulted in the properties shown in Table 2. Ten extra mixtures were prepared during each mix operation. For each mix operation, the masses of the loose mixtures were determined and those mixtures resulting in the smallest variation in mass were selected for distribution.

8
The samples were boxed and marked as shown in Figure 1. Each laboratory received one set of 12.5-mm Gmm samples; one set of 12.5-mm Gyr samples; one set of 19.0-mm Gmm
samples; and one set of 19.0-mm Gyr samples. Each set contained three replicate samples chosen at random from the samples selected for distribution.
2.4.2 Test Protocols and Instruction and Data Forms for Participants
The test properties determined and the protocols followed in the study are shown in Table 3. The instruction and data forms shown in Appendix A were used by participants to test the samples and report test results. Additionally, the method of weighing (in air or in water) was reported for D2041, and the SGC manufacturer and model number were reported for T312.
2.4.3 Sample Distribution
Samples were distributed to participating laboratories using the U.S. Postal Service and Federal Express. The 12.5-mm samples were shipped to participants and tested in June 2001 and the 19.0-mm samples were shipped and tested in December 2001.

9
CHAPTER 3
LABORATORY TEST RESULTS AND ANALYSIS
3.1 TEST DATA
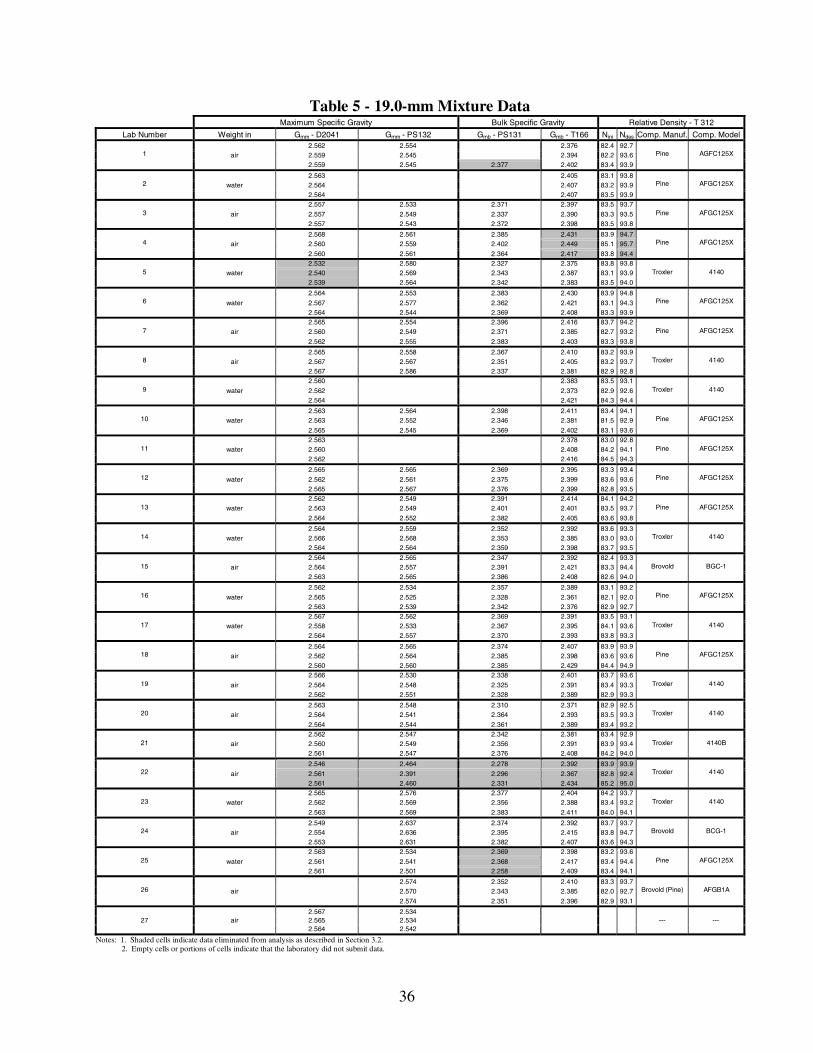
The data obtained in this study are shown in Table 4 for the 12-5mm mixture and in Table 5 for the 19.0-mm mixture. Empty cells or portions of cells indicate that the laboratory did not submit data. Shaded cells indicate data that were eliminated from analysis as described in Section 3.2.
3.2 METHODS OF ANALYSIS
Different methods of analysis were used on the interlaboratory test data collected in the study and on the data from the AMRL Proficiency Sample Program.
3.2.1 Data from This Study
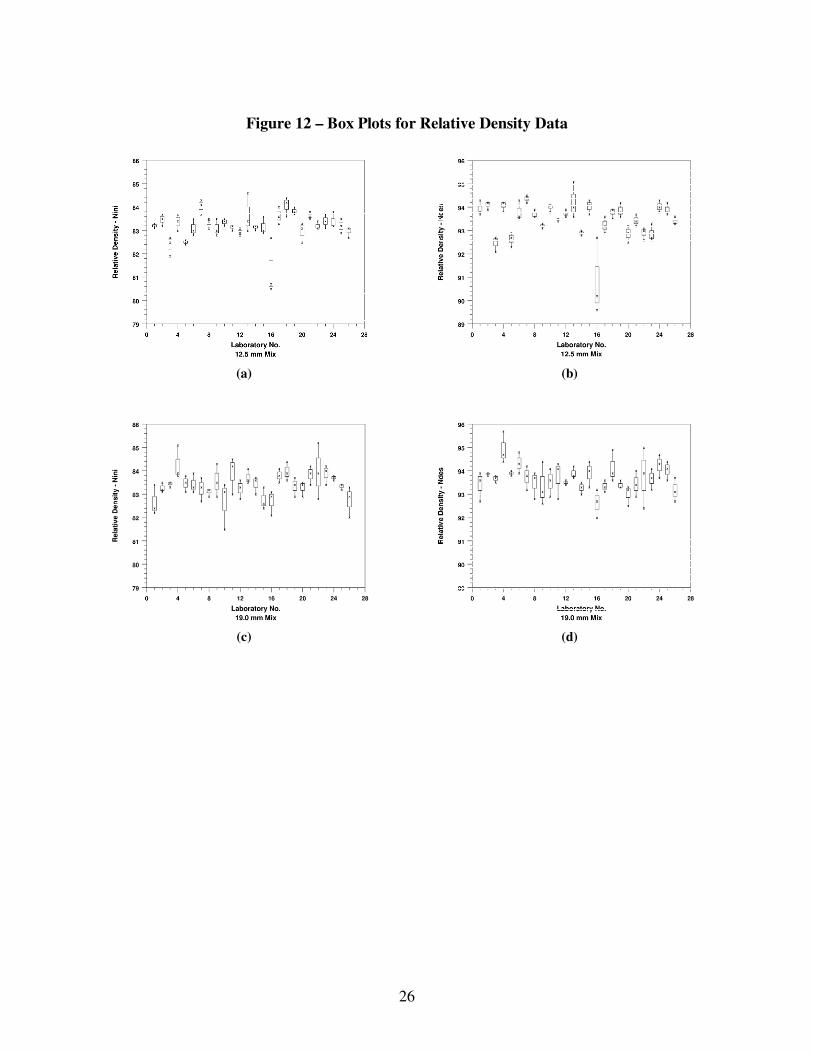
Test data from this study were displayed graphically using box plots generated by Dataplot (8) which was developed at NIST and is a free, public-domain, multi-platform software system for scientific visualization, statistical analysis, and non-linear modeling (See Figures 2, 7, and 12). The box plot is a graphical data analysis technique for determining if differences exist between the various levels of a 1-factor model (9). The box plot is a graphical alternative to a 1-factor ANOVA. It is also a useful technique for summarizing and comparing data from two or more samples. A box plot is structured in the following manner. The bottom x is the data minimum and the top x is the data maximum. The bottom of the box is the estimated 25 percent point and the top of the box is estimated 75 percent point. The middle x in the box is the data median.
In addition to eliminating any partial sets of data, data were eliminated from analysis by following the procedures described in E691 in determining repeatability (Sr) and reproducibility (SR) estimates of precision. Data exceeding critical h and k values were eliminated as described in Sections 3.3, 3.4, and 3.5. Once identified for elimination, the same data were eliminated from any smaller subsets analyzed.
3.2.2 AMRL Proficiency Sample Data
AMRL operates proficiency sample programs for a number of construction materials. (5,7) AMRL gyratory proficiency sample pairs 7/8, 9/10, and 11/12 were the most recent gyratory proficiency samples available at the time of this study. Sample pair 7/8 was tested in 1999; sample pair 9/10 was tested in 2000, and sample pair 11/12 was tested in 2001. The test samples comprising all three sample pairs were mixed and compacted by 200 to 300 individual participants using materials and a job mix formula supplied by AMRL. (In the NCHRP study

10
the participants were provided with premixed samples ready for compaction.) All AMRL proficiency samples had a 12.5-mm maximum aggregate size. For AMRL proficiency sample pair 7/8, a single butter batch was split into two samples, and each sample was tested to determine the maximum specific gravity for sample pair 7/8. Two separate butter batches were used to determine the maximum specific gravity for AMRL proficiency sample pairs 9/10 and 11/12. Proficiency sample participants were asked to determine the bulk specific gravity and relative density in a manner similar to this study. The test results from sample pairs 7/8 and 9/10 permitted valid estimates of within laboratory variability. However, the bulk density data from sample pair 11/12 indicated that the samples were too dissimilar to permit valid estimates of within laboratory precision.
A bivariate normal tolerance region containing approximately 85% of the data with 95% confidence as described in a paper by Hall (10) was applied to the data from the AMRL proficiency sample pairs described above. Only data falling within the bivariate tolerance region for each pair were analyzed. Appendix B describes this approach and the rationale for screening AMRL proficiency sample data in this manner.
Once screened, the proficiency sample data were analyzed in the manner described in Appendix C to determine Sr and SR precision estimates.
3.2.3 Tests for Statistical Significance
Tests for statistical significance on both data collected in this study and the AMRL proficiency sample data were performed using the “T-test” and “ F-test” functions in Microsoft Excel. All T-tests assumed two samples with unequal variance and a one-tailed T distribution. For data in this study, F-tests, to determine if Sr estimates of precision were statistically different, were performed on the variances calculated from the three replicate determinations. For AMRL proficiency sample data, F-tests, to determine if Sr estimates of precision were statistically different, were performed on the variances calculated for the paired test results, taking into account any actual differences in the two samples comprising the sample pair.
3.3 THEORETICAL MAXIMUM SPECIFIC GRAVITY, Gmm
3.3.1 Introduction
The theoretical maximum specific gravity (Gmm) is a fundamental property of bituminous paving mixtures whose value is influenced by the composition of the mixture in terms of types and amounts of aggregate and bituminous materials. The Gmm is used in the calculation of air voids in compacted bituminous paving mixtures and the amount of asphalt binder bitumen absorbed by the aggregate. The Gmm also provides a target value for the compaction of paving mixtures.
The conventional method for determining the Gmm involves weighing a sample of loose paving mixture, placing it in a tared vacuum vessel (a bowl or flask), and adding sufficient water

11
at 25°C to cover it. Partial vacuum is applied to reduce the residual pressure in the vacuum vessel to 4 kPa or less, held for 15 ± 2 minutes, and then gradually released. The volume of the sample of paving mixture is obtained either by immersing the vacuum vessel in a water bath and weighing (weight in water), or by filling the vacuum vessel level full of water and weighing (weight in air). The Gmm is calculated from these mass and volume measurements. Possible sources of test variation when weighing in air include entrapping air bubbles under the lid and inadequate drying of the outside of the vacuum vessel. When making weighings in water, “floaters” in the bowl could be lost when the bowl is immersed causing errors in the test result. Errors for either method could also result from variations in temperature and pressure.
Study participants were asked to determine the Gmm of three replicate 12.5-mm mixtures and three replicate 19.0-mm mixtures according to D2041-00. This test procedure differs significantly from D2041-95 and T209-99 by requiring continuous agitation, a larger test specimen, a constant partial vacuum (3.7 ± 0.3 kPa), a reduction in the number of allowable containers, and a procedure for placing the lid on the pycnometer.
After determining Gmm by D2041, the participants were asked to oven dry and retest each specimen and determine Gmm using PS132. This method for determining the Gmm involves placing a weighed oven-dry sample of loose paving mixture in a specially designed bag. The bag containing the sample is then placed inside another bag and placed inside a vacuum chamber. The sample is evacuated for approximately 1 minute to 4 kPa and automatically sealed. The bags containing the sample are removed and placed underwater in a large water tank. While completely submerged, the bag is cut open to allow water to enter the bag, and the submerged sample is weighed. The submerged weight is corrected for the influence of the bags to determine the sample volume. The dry mass and the volume are used to calculate Gmm.
3.3.2 Precision Estimates
3.3.2.1 D2041 Test Data
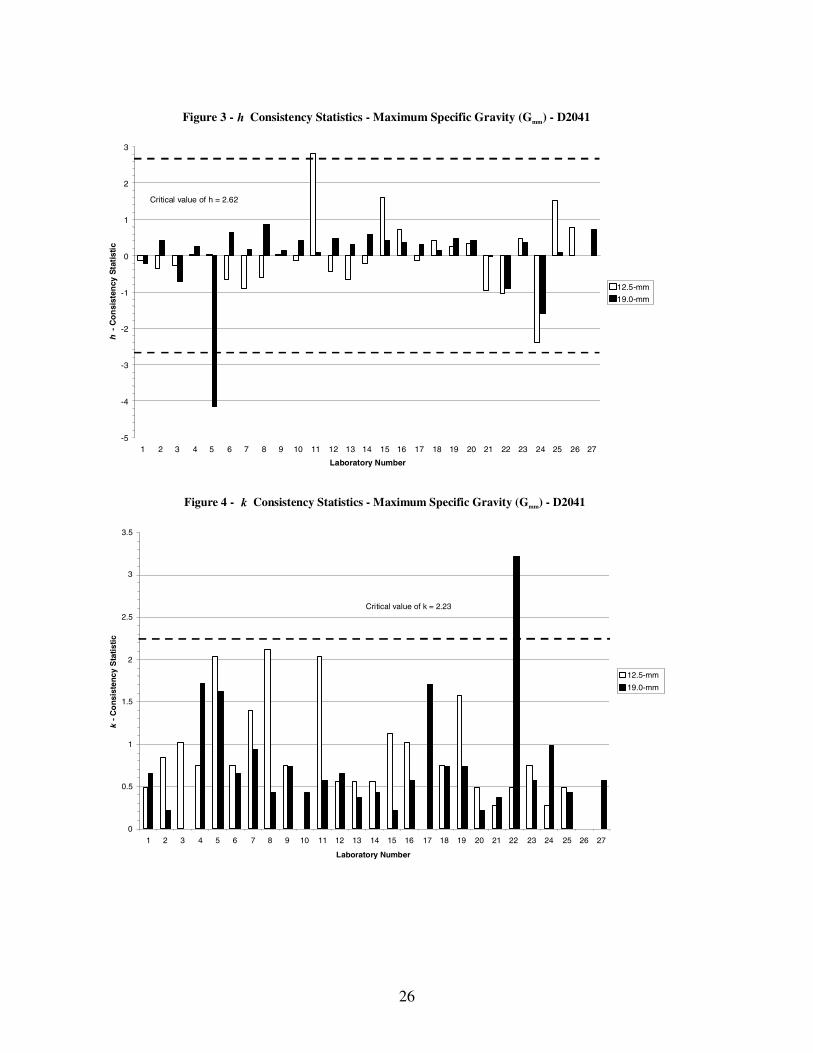
Twenty-six laboratories submitted full sets of Gmm data based on D2041 for the 12.5-mm and 19.0-mm mixtures (See Tables 4 and 5 – Column 3). The data are displayed on box plots in Figures 2a and 2c. The data from laboratory 11 were eliminated from the 12.5-mm mixture analysis, and the data from laboratories 5 and 22 were eliminated from the 19.0-mm mixture analysis based on h- and k-statistics (See Figures 3 and 4). All remaining data were re-analyzed with E691 software to determine the Sr and SR precision estimates shown in Table 6. The 12.5-mm and 19.0-mm mixture data remaining after the removal of outliers were separated into four data sets by method of weighing, and each of the four data sets was analyzed to determine the Sr
and SR precision estimates shown in Table 6.
3.3.2.2 PS132 Test Data
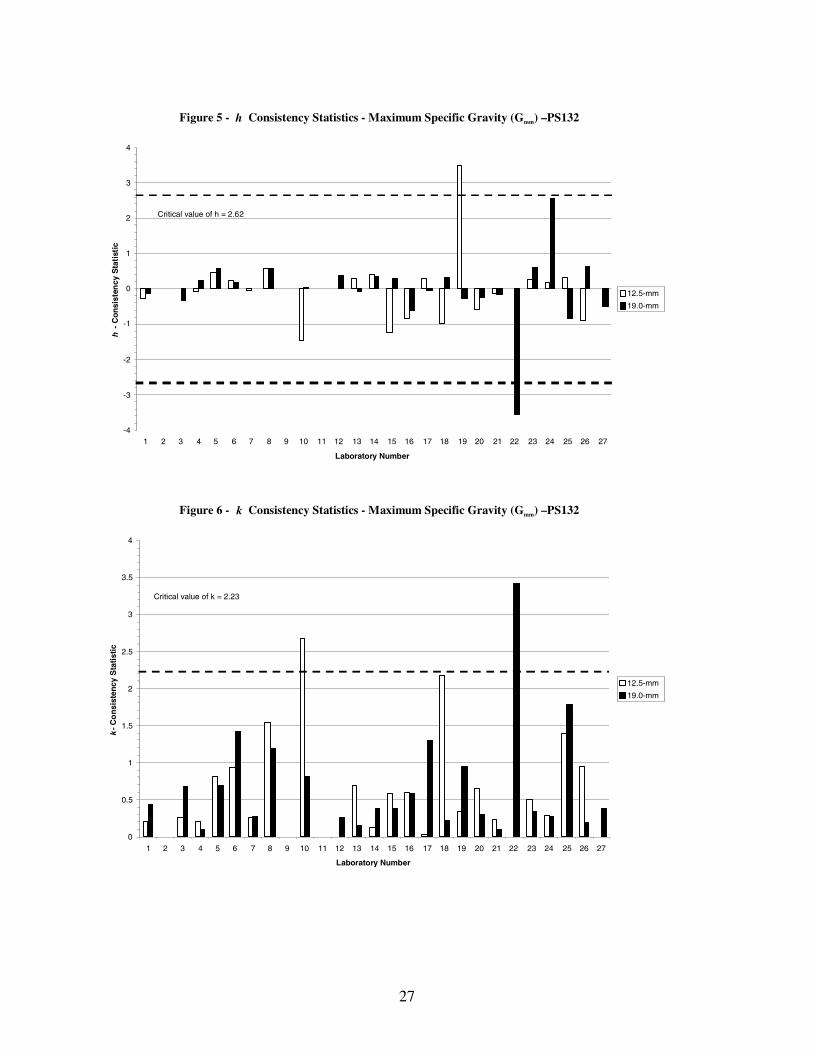
Twenty-one laboratories submitted full sets of Gmm data using the vacuum sealing method for the 12.5-mm mixture, and twenty-four laboratories submitted full sets of Gmm data
12
for the 19.0-mm mixtures (See Tables 4 and 5, Column 4). The data are displayed in Figures 2b and 2d. The data from laboratories 10 and 19 were eliminated from the 12.5-mm mixture analysis and the data from laboratory 22 were eliminated from the 19.0-mm mixture analysis based on h- and k-statistics (See Figures 5 and 6). All remaining data were re-analyzed using E691 software to determine the Sr and SR precision estimates shown in Table 6.
3.3.2.3 AMRL Proficiency Sample Test Data
For AMRL gyratory proficiency sample pairs 9/10 and 11/12, data were analyzed as described in Appendices B and C to determine the Sr and SR precision estimates shown in Table 6.
3.3.3 Tests for Significance
A comparison of D2041 Gmm test results from laboratories using the "weight in water" method and the "weight in air" method indicates that there is very little bias in test results from the two methods and that the Sr estimates (0.002) shown in Table 6 are the same. However, the results of the F-tests shown in Table 7, Column 4, Rows 3 and 4, indicate a statistically significant difference in the SR estimates for the "weight in air" method (0.005 and 0.004) and the SR estimates for the "weight in water" method (0.002 and 0.003). Consideration was given to making separate SR estimates for the "weight in water" and "weight in air" methods in the proposed precision statement for D2041-00 noting a possible difference in multilaboratory precision when using the two methods. Unfortunately, AMRL gyratory proficiency sample data were not available to evaluate these test conditions separately; therefore, separate precision estimates are not presented (See Section 3.3.4.1). AMRL hopes to have proficiency sample data which will support a separate analysis of the two methods of test in the near future. If necessary, the precision statement can be revised.
The results of the T-test comparing the 12.5-mm, D2041 data to the 12.5-mm PS132 data indicate a statistically significant difference in the average Gmm values shown in Table 6 (2.550 vs. 2.542 respectively) at a 99 percent confidence level (See Table 7). Although not significant at a 99 percent confidence level, similar comparison of the 19.0-mm data did indicate a statistically significant difference in the average values at a 95 percent confidence level (2.562 vs. 2.557 respectively). This bias is somewhat evident in the box plots in Figure 2 and suggests that Gmm values obtained using PS132 may be lower than those obtained using D2041.
The results of F-tests shown in Table 7 indicate that the Sr and SR precision estimates of Gmm data obtained using PS132 are statistically greater than the Sr and SR precision estimates of Gmm data obtained using D2041. The greater variation in PS132 test data is clearly evident in Figure 2.
13
3.3.4 Precision Statements
3.3.4.1 D2041
Table 6 shows there is good agreement in the variability between the 12.5-mm and 19.0-mm mixtures for the D2041 Gmm data obtained from this study. Appendix D shows a proposed revised precision statement for D2041-00 which includes precision estimates, for both size mixtures, of Sr = 0.002 and SR = 0.004. Although tighter than the precision estimates currently found in D2041-00 as shown in Table 6, the proposed estimates seem to be suitable given the improvement made to D2041 and the fact that, through an oversight, the 2300 g, 19.0-mm specimens distributed to laboratories did not meet the 2500 g minimum sample mass requirements specified in D2041.
The precision estimates shown in Table 6 which resulted from the analysis of the 12.5-mm, AMRL gyratory proficiency samples, involving over 200 laboratories, are a little higher, but compare favorably to the D2041 precision estimates from this study. Analysis of sample pair 9/10 yielded an Sr estimate of 0.003 and an SR estimate of 0.006, while sample pair 11/12 resulted in an Sr estimate of 0.003 and an SR estimate of 0.005. Laboratories testing the AMRL proficiency samples determined Gmm according to D2041-95 and T209-99 which were earlier versions of standards used in this study.
Based on the results of this study and the analysis of AMRL proficiency sample data, the precision estimates currently published in D2041 appear to be high and in need of revision. The precision estimates published in T209 look more appropriate than those published in D2041, but may need updating.
3.3.4.2 PS132
The Gmm precision estimates shown in Table 6 which resulted from the analysis of the 12.5-mm and 19.0-mm PS132 test results are greater than those obtained from the analysis of both D2041 data reported for this study and AMRL proficiency data. The increase in variability of test results obtained using PS132 may be due to the inexperience of the participants performing the test. Sixteen of the participants reported that they performed the test for the first time on the 12.5-mm mixtures, and reported very little additional experience when performing the test on the 19.0-mm mixture. Only two of the participants reported performing the test 25 times or more. The increased variation in PS132 Gmm values may indicate the test procedure needs adjustment. Some possible problems are the bags touching the sides of the bath during weighing, an incomplete evacuation of air during the vacuum sealing process, and compaction of the specimen during the vacuum sealing process.
3.4 BULK SPECIFIC GRAVITY, Gmb
3.4.1 Introduction

14
The proper measurement of bulk specific gravity (Gmb) of compacted HMA mixes is a major concern of the HMA industry. The Gmb of compacted asphalt mixtures is required for making volumetric calculations used during mixture design, field control, and construction acceptance (12). Volumetric properties such as air voids, voids in mineral aggregate, voids filled with asphalt, and percent maximum density at a certain number of gyrations are based on Gmb.
Study participants were asked to compact the as-received loose mixtures weighing approximately 4900 g according to T312 and determine the Gmb of three replicate 12.5-mm specimens and three replicate 19.0-mm specimens according to PS131. This method for determining Gmb involves placing a weighed sample in a specially designed bag. The bag containing the sample is then placed inside a vacuum chamber. The air in the bag containing the specimen is evacuated and the bag is automatically sealed. The mass of the sealed bag containing the specimen is determined. The sealed bag containing the specimen is immersed in water at 25°C and weighed. The G mb is calculated from the resulting mass determinations, the immersed weight, and the apparent specific gravity of the plastic bag.
After determining Gmb by PS131, participants were asked to retest each specimen and determine Gmb according to T166, Method A. Method A of T166 involves determining the mass of an air-dried specimen (in this case a 150-mm diameter specimen compacted using a Superpave gyratory compactor), immersing the specimen in a water bath at 25°C, recording the weight after 3 to 5 minutes, removing the specimen, blotting it quickly with a damp cloth towel, and determining the saturated surface dry (SSD) mass in air. These mass and volume measurements are used to calculate Gmb. AMRL observes substantial variation in the techniques used to obtain the SSD condition of the specimen during laboratory assessments. Some reasons for this variation may be the difference in dampness of the towel used to blot the surface of the specimen, differences in temperature of the immersion bath, and differences in interpretations in achieving a SSD condition as quickly as possible.
3.4.2 Precision Estimates
3.4.2.1 T166 Test Data
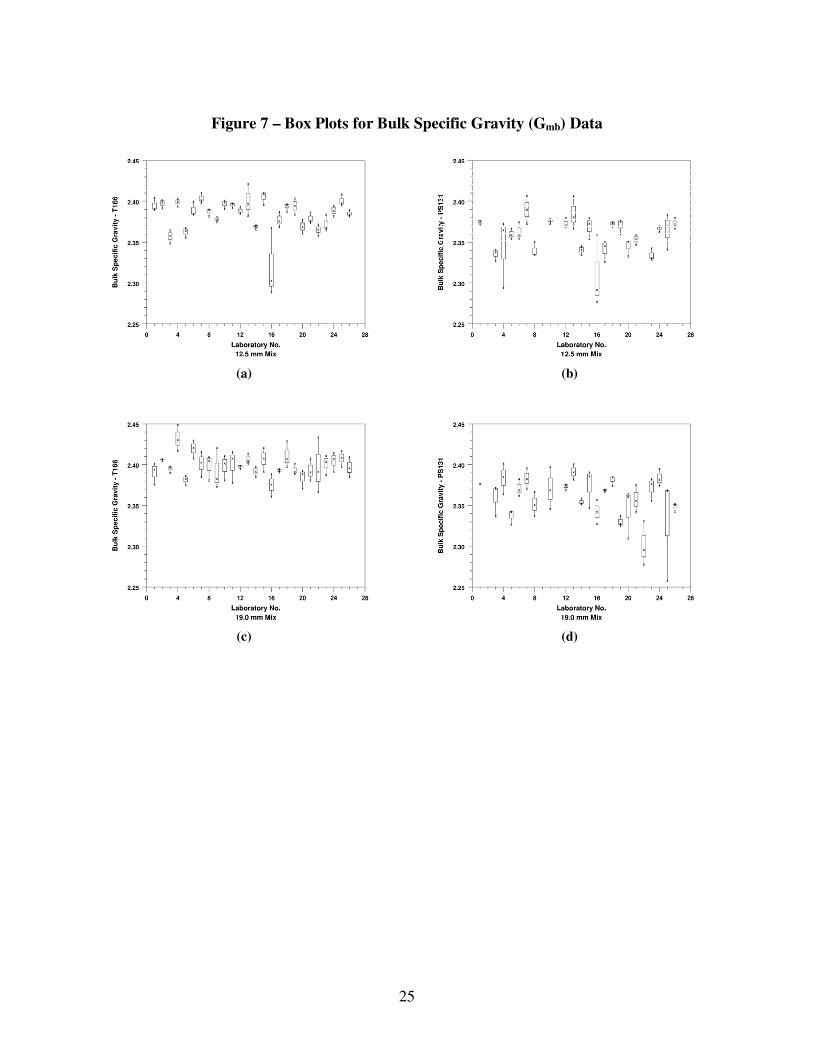
Twenty-six laboratories submitted full sets of T166 data for the 12.5-mm and 19.0-mm mixtures (See Tables 4 and 5, Column 6). The data are displayed in Figures 7a and 7c. All data were analyzed using the E691 software. The data from laboratory 16 were eliminated from the 12.5-mm mixture analysis and the data from laboratories 4 and 22 were eliminated from the 19.0-mm mixture analysis based on h- and k-statistics (See Figures 8 and 9). All remaining data were re-analyzed with the E691 software to determine the Sr and SR precision estimates shown in Table 8. The 12.5-mm and 19.0-mm mixture data remaining after the removal of outliers were separated into four data sets based on the mixture type and compactor manufacturer/model used in compaction. Each of the four data sets was analyzed with the E691 software to determine the Sr and SR precision estimates shown in Table 8.
3.4.2.2 PS131 Test Data

15
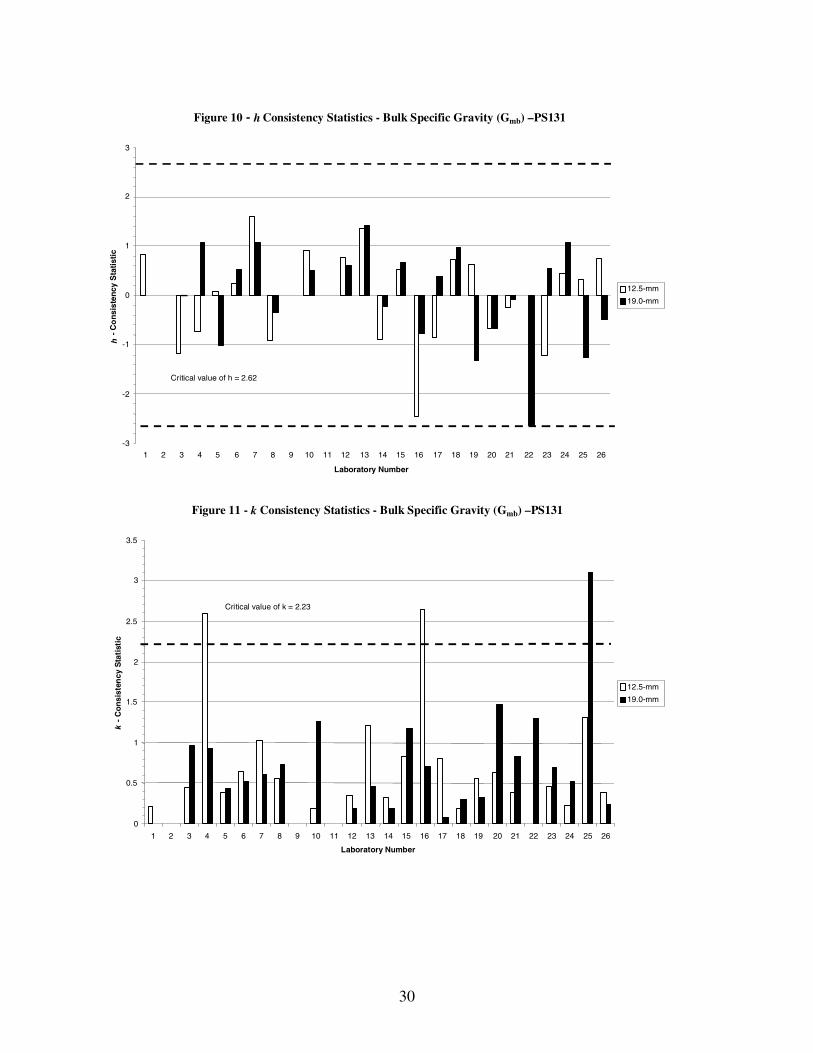
Twenty-two laboratories submitted full sets of PS131 Gmb data for the 12.5-mm mixture and 19.0-mm mixtures (See Tables 4 and 5, Column 5). The data are displayed in box plot form in Figures 7b and 7d. All data were analyzed using E691 software. Data from laboratories 4 and 16 were eliminated from the 12.5-mm mixture analysis, and data from laboratories 22 and 25 were eliminated from the 19.0-mm mixture analysis based on h- and k-statistics (See Figures 10 and 11). All remaining data were re-analyzed with the E691 software to determine the Sr and SR
precision estimates shown in Table 8. The 12.5-mm and 19.0-mm mixture data remaining after the removal of outliers were separated into four data sets based on the mixture type, and compactor manufacturer and model used in compaction. Each of the four data sets was analyzed with the E691 software to determine the Sr and SR precision estimates shown in Table 8.
3.4.2.3 AMRL Proficiency Sample Data
For comparison purposes, Sr and SR precision estimates were determined for Gmb data from AMRL gyratory proficiency sample pairs 7/8, 9/10, and 11/12. Data were analyzed as described in Appendices B and C to determine the Sr and SR precision estimates shown in Table 8. In addition, the results for sample pair 9/10 were separated into two data sets, one including data from laboratories that used a Pine compactor, and the other including data from laboratories that used a Troxler compactor. AMRL data includes the compactor manufacturer but not the compactor model number. The Sr and SR precision estimates shown in Table 8 were determined for each data set.
3.4.3 Tests for Significance
As expected, the results of the T-test shown in Table 9 indicate a significant difference in the average Gmb for the 12.5-mm mixture and the average Gmb for the 19.0-mm mixture.
T-tests were performed to determine if the average Gmb values obtained using PS131 differed significantly from average Gmb values obtained by T166. The T-test results shown in Table 9 indicate statistically significant differences in the PS131 and T166 average Gmb values for both the 12.5-mm (2.362 vs. 2.386) and 19.0-mm (2.364 vs. 2.398) test data. In both cases, the average specific gravity determined from tests performed using PS131 was significantly lower than the average specific gravity determined from tests performed using T166. The bias in the test results from the two methods is apparent when viewing the box plots in Figure 7.
There is good agreement in the reproducibility estimates between the 12.5-mm and 19.0- mm mixtures (0.015 vs. 0.014) for the T166 data. However, the F-test result shown in Table 9 indicates a statistically significant difference between the repeatability for the 12.5-mm and 19.0-mm mixtures (0.008 vs. 0.013). The boxes in Figure 7a are noticeably smaller than those in Figure 7c.
T-tests were performed to determine if the average Gmb values obtained from specimens compacted using the Pine AFGC125X compactor differed significantly from average Gmb values obtained from specimens compacted using the Troxler 4140 compactor. The T-test results shown in Table 9 indicate statistically significant differences in the average density of specimens

16
compacted using the Pine compactor and the average density of specimens compacted using the Troxler compactor for the 12.5-mm and 19.0-mm T166 data, the 12.5-mm and 19.0-mm PS131 data, and AMRL proficiency sample pair 9/10 data. Analysis of data in this study and AMRL proficiency sample data indicates that the average density of specimens compacted with the Troxler compactor is lower than the average density of specimens compacted with a Pine compactor.
The results of F-tests shown in Table 9, comparing the 12.5-mm and 19.0-mm T166 Gmb data to the PS131 Gmb data, indicate that the Sr precision of Gmb data obtained on the 12.5-mm mixture using PS131 was statistically greater than the Sr precision of Gmb data obtained using T166 (0.011 vs. 0.008). In addition, the F-tests indicated that the SR precision of Gmb data obtained on the 19.0-mm mixture using PS131 was statistically greater than the SR precision of Gmb data obtained using T166 as shown in Table 8 (0.021 vs. 0.014).
The F-test results shown in Table 9, comparing data obtained from specimens compacted using the Pine compactor to data obtained from specimens compacted using the Troxler compactor, indicate that there is a significant difference in the Sr estimates for the 12.5-mm T166 data, the 12.5-mm PS131 data, and the AMRL proficiency sample pair 9/10 data. While the differences may be statistically significant, they are inconsistent and relatively small, and, therefore, may be insignificant from a practical standpoint.
3.4.4 Precision Statements
3.4.4.1 T 166
As indicated above, there is a significant difference between the repeatability for the 12.5-mm and 19.0-mm mixtures (0.008 vs. 0.013). Noting this difference, it appears appropriate to propose separate repeatability precision estimates for 12.5-mm and 19.0-mm mixtures. However, it is unclear from the data obtained whether the increase in single operator variability for 19.0-mm mixtures reflects problems with T166 or actual variation in the density of the specimens tested; that is, problems with the compaction process described in T312. Further research is needed to resolve this issue.
The current precision statement in T166 does not include a SR estimate and, based on the results from this study, the Sr estimate appears to be high. The precision estimates published in ASTM D2726, Standard Test Method for Bulk Specific Gravity and Density of Non-Absorptive Compacted Bituminous Mixtures (4) agree more closely with the results obtained from this study.
The Sr and SR estimates from the analysis of AMRL proficiency sample data shown in Table 8 are a little greater than the estimates resulting from the analysis of data obtained in this study. Differences of the magnitude observed are expected given the greater number of laboratories included in the AMRL Proficiency Sample Program.

17
Appendix E includes a proposed precision statement for T166 based on the findings from this study. It should be noted that the range in air voids covered by the 12.5-mm and 19.0-mm mixtures included in this study is limited. Work should continue to evaluate Gmb precision estimates for specimens covering a wider range of air voids.
3.4.4.2 PS131
The Gmb precision estimates shown in Table 8 resulting from the analysis of the 12.5-mm and 19.0-mm PS131 test results are greater than those obtained from the analysis of both T166 data reported for this study and AMRL proficiency sample data. The increase in variation in Gmb values obtained using the automatic vacuum sealing method may be due to the inexperience of the participants performing the test. Twelve of the participants reported that they performed the test for the first time on the 12.5-mm mixtures, and nine still reported having very little experience performing the test when it was performed on the 19.0-mm mixture. Seven of the participants reported performing the test 25 times or more. The increased variation in Gmb values may also be caused by the bags touching the sides of the bath during weighing, an incomplete evacuation of air during the vacuum sealing process, and pinholes developing in the bags after the vacuum sealing process.
3.5 RELATIVE DENSITY AT Nini AND Ndes
3.5.1 Introduction
T312 describes a method for preparing 150-mm diameter cylindrical specimens of HMA using the Superpave gyratory compactor. The resulting specimens are intended to simulate the density, aggregate orientation, and structural characteristics in an actual roadway when proper construction procedures are followed in the placement of a paving mix. T312 also describes procedures for calculating the relative density of a cylindrical specimen at any point in the compaction process from specimen height measurements, the Gmb of the specimen, and the Gmm
of the mixture. Relative density values can be used for field control of a HMA production process.
Participants in this study were provided with three replicate 12.5-mm and three replicate 19.0-mm loose mix samples. They were asked to prepare gyratory specimens from each of the as-received samples and determine the relative density at Nini (8 gyrations) and Ndes (100 gyrations).
3.5.2 Precision Estimates
3.5.2.1 T312 Test Data
Twenty-six laboratories submitted full sets of relative density data at Nini and Ndes for both the 12.5-mm and 19.0-mm mixtures (See Tables 4 and 5, Columns 7 and 8). The data are

18
displayed in box plot form in Figure 12. All data were analyzed using the E691 software. Based on h- and k-statistics shown in Figures 13, 14, 15, and 16, the Nini and Ndes relative density data from laboratory 16 were eliminated from the 12.5-mm mixture analysis, the Nini and Ndes relative density data from laboratory 22 were eliminated from the 19.0-mm mixture analysis, and the Ndes
relative density data from laboratory 4 were eliminated from the 19.0-mm mixture analysis. All remaining data were re-analyzed with the E691 software to determine the Sr and SR precision estimates shown in Table 10.
The 12.5-mm and 19.0-mm mixture, Nini and Ndes relative density data remaining after the removal of outliers were separated into four data sets based on the mixture type, and compactor manufacturer and model number used in the compaction. Each of the four data sets was analyzed with the E691 software to determine the Sr and SR precision estimates shown in Table 10.
3.5.2.2 AMRL Proficiency Sample Test Data
For comparison purposes, Sr and SR precision estimates were determined for relative density at Ndes (100 gyrations) data from AMRL gyratory proficiency sample pairs 9/10 and 11/12. Data were analyzed as described in Appendices B and C to determine the Sr and SR
precision estimates shown in Table 10. In addition, the results for AMRL sample pair 9/10 were separated into two data sets, one including data from laboratories that used a Pine compactor, and the other including data from laboratories that used a Troxler compactor. The AMRL data identified the compactor manufacturer but not the compactor model number. The Sr and SR
precision estimates shown in Table 10 were determined for each data set.
3.5.2.3 T269
Air voids calculated and reported in AASHTO T269, Standard Test Method for Percent Air Voids in Compacted Dense and Open Bituminous Paving Mixtures (3) and ASTM D3203, Standard Test Method for Percent Air Voids in Compacted Dense and Open Bituminous Paving Mixtures (4) are equivalent to 100 minus the relative density at Ndes. As a result, the precision estimates for relative density at Ndes data from this study may be applied directly to T269 and D3203. The precision statement in ASTM D3203-94 states, “The precision of this test method depends on the precision of the test methods for bulk specific gravity and the theoretical maximum specific gravity. It is computed by a procedure described in ASTM Practice D4460, Standard Practice for Calculating Precision Limits Where Values are Calculated from Other Test Methods (6).” Table 10 shows the precision estimates calculated from the precision estimates proposed for T166 and D2041 using D4460. The resulting precision estimates are in close agreement with those proposed for T312.
The precision estimates currently published in T269-97, shown in Table 10, were calculated from the precision estimates in T166 and T209. The estimates shown appear to be significantly higher than those proposed for T312. Although the range in air voids of the specimens tested in this study is limited, if D2041 is adopted as a replacement for T209, it may be appropriate to replace the precision estimates in T269 with those proposed for T312.
19
3.5.3 Tests for Significance
There is fairly good agreement in the Nini and Ndes reproducibility estimates shown on Table 10 for the T312, 12.5-mm and 19.0-mm relative density data (Nini: 0.48 vs. 0.60, Ndes: 0.59 vs. 0.57). However, the results of the F-tests shown in Table 11 indicate a statistically significant difference between the repeatability of the Nini and Ndes data for the 12.5-mm and 19.0-mm mixtures (Nini: 0.32 vs. 0.49, Ndes: 0.30 vs. 0.49). This is consistent with the findings relative to the Gmb data, since the relative density values are greatly influenced by the Gmb
values.
T-tests were performed to determine if the average relative density of specimens compacted using the Pine AFGC125X compactor differed significantly from the average relative density of specimens compacted using the Troxler 4140 compactor. For the 12.5-mm data and AMRL proficiency sample pair 9/10 data, the T-test results shown in Table 11 indicated statistically significant differences in the relative density at Ndes. In both cases the average relative density at Ndes of specimens compacted with the Troxler compactor was lower than the average relative density at Ndes of specimens compacted with a Pine compactor. The differences observed are consistent with those noted for the Gmb data for both compaction devices.
The F-test results shown in Table 11, comparing relative density data obtained from specimens compacted using the Pine AFGC125X compactor to relative density data obtained from specimens compacted using the Troxler 4140 compactor, indicate that there is a significant difference in the Sr estimates for the 12.5-mm data at Nini and Ndes. For both the 12.5-mm and 19.0-mm mixtures the Sr estimates for specimens compacted using the Troxler compactor are smaller than Sr estimates for specimens compacted using the Pine compactor, however, this trend was not supported by the AMRL proficiency sample pair 9/10 data. While the differences observed may be statistically significant, because of this inconsistency and the relative magnitude of the differences, they were judged to be insignificant from a practical standpoint.
3.5.4 Precision Statement for T312
As noted in Section 3.5.3, there is a significant difference between the repeatability of the Nini and Ndes data for the 12.5-mm and 19.0-mm mixtures (Nini: 0.32 vs. 0.49, Ndes: 0.30 vs. 0.49). Noting this difference, it appears to be appropriate, as it was for T166, to propose separate repeatability precision estimates for 12.5-mm and 19.0-mm mixtures. Here too, however, it is unclear from the data obtained whether the increase in single operator variability for 19.0-mm mixtures reflects actual variation in the relative density of the specimens tested, or a problem with the compaction process described in T312.
The Sr and SR estimates from the analysis of AMRL proficiency sample relative density data at Ndes are a little greater than the estimates resulting from the analysis of data in this study. These differences are a result of the increased variability of AMRL proficiency sample Gmb data noted earlier. Appendix F includes a proposed precision statement for T312 based on the findings from this study.
20
CHAPTER 4
CONCLUSIONS AND RECOMMENDATIONS
4.1 GENERAL
This study was conducted to prepare precision estimates for AASHTO and ASTM standards used to determine selected volumetric properties of HMA using non-absorptive aggregate. Specific study objectives were to (1) develop a precision statement applicable to AASHTO T312 used to prepare and determine the density of HMA specimens using a Superpave Gyratory compactor, (2) update precision statements currently published in AASHTO T166 used to determine bulk specific gravity of compacted asphalt mixtures and ASTM D2041 used to determine maximum specific gravity of bituminous paving mixtures, and (3) prepare first-cut precision estimates for ASTM Provisional Standards PS131 and PS132 which are used to determine bulk specific gravity and density of compacted bituminous mixtures using an automatic vacuum sealing method. The study conclusions and recommendations are as follows.
4.2 CONCLUSIONS AND RECOMMENDATIONS RELATED TO SPECIFIC STANDARDS
4.2.1 ASTM D2041, Standard Test Method for Theoretical Maximum Specific Gravity and Density of Bituminous Materials
Conclusions
1. The precision statement currently published in D2041-00 is in need of revision.
2. While the D2041 reproducibility estimates were statistically greater for the "weight in air" method than the "weight in water" method, there is not enough data available to provide separate precision estimates.
Recommendations
1. The precision statement in Appendix D should be adopted for D2041.
2. AMRL should collect data from participants in its Proficiency Sample Program to determine if separate Sr precision estimates are warranted for “weight in air” and “weight in water” methods.
4.2.2 AASHTO T166, Standard Test Method for Bulk Specific Gravity of Compacted Asphalt Mixtures Using Saturated Surface-Dry Specimens
Conclusions
1. The precision statement currently published in T166-00 is in need of revision.

21
2. The Sr precision estimates for the 19.0 mm mixture were statistically larger than that obtained for the 12.5 mm mixture.
3. The T166 bulk specific gravity (Gmb) values obtained from specimens compacted with the Pine AFGC125X compactor were greater than those obtained from specimens compacted with the Troxler 4140 compactor.
Recommendations
1. The precision statement proposed in Appendix E should be adopted for T166 (Method A). Separate Sr precision estimates are proposed for the 19.0 mm mixture and 12.5 mixtures. There was no apparent difference in the T166 SR precision estimate for the 12.5 mm mixture and the 19.0 mm mixture as shown in the proposed precision statement.
2. Further research is needed to determine if the difference in the repeatability (Sr) of Gmb test results from 12.5-mm and 19.0-mm mixtures reflects potential problems with T166 or actual variation in the density of specimens tested.
4.2.3 ASTM D2041 Results Compared to ASTM PS132 Results
Conclusions
1. The variation in test results obtained using PS132 was statistically greater than that obtained using D2041.
2. The maximum specific gravity (Gmm) values obtained using PS132 were lower than those obtained using D2041.
Recommendation
1. A precision statement for PS132 should not be adopted until an interlaboratory study involving laboratories having more experience performing the test method is conducted.
2. Changes to PS132 to increase its precision should be investigated.
4.2.4 AASHTO T166 Results Compared to ASTM PS131 Results
Conclusions
1. The bulk specific gravity (Gmb) values obtained using PS131 were significantly lower than those obtained using T166.

22
2. The Sr estimates obtained using PS131 were statistically greater than those obtained using T166.
3. For the 19.0 mm mixture, the SR estimate obtained using PS131 was statistically greater than the SR estimate obtained using T166.
Recommendations
1. A precision statement for PS131 should not be adopted until an interlaboratory study involving laboratories having more experience performing the test method is conducted.
2. Changes to PS131 to increase its precision should be investigated.
4.2.5 AASHTO T312, Standard Method of Test for Preparing and Determining the Density of Hot-Mix Asphalt (HMA) Specimens by Means of the Superpave Gyratory Compactor
Conclusions
1. T312 needs a precision statement.
2. The T312 Sr estimate for the 19.0 mm mixture was statistically larger than that obtained for the 12.5 mm mixture.
3. The relative density values obtained from specimens compacted with the Pine AFGC125X compactor were greater than those obtained from specimens compacted with the Troxler 4140 compactor.
Recommendations
1. The precision statement proposed in Appendix F for T312 should be adopted. It includes separate Sr estimates for the 12.5-mm and 19.0-mm mixtures.
4.2.6 AASHTO T269, Standard Test Method for Percent Air Voids in Compacted Dense and Open Bituminous Paving Mixtures
Conclusions
1. The precision statement in T269 could be revised to include precision estimates applicable to Superpave specimens.

23
Recommendations
1. If AASHTO adopts D2041 as a replacement for T209, the precision estimates and conditions given in Appendix F for T312 could be added to the precision statement in T269 as precision estimates and conditions applying to Superpave specimens.
4.3 GENERAL CONCLUSIONS AND RECOMMENDATIONS
1. The bivariant analysis described by Hall (10) can be used effectively to screen AMRL proficiency sample data.
2. AMRL should attempt to develop precision estimates from existing asphalt binder and HMA proficiency sample data using the bivariate approach to screen the data.
3. Further research is needed to develop precision estimates for HMA mixtures with a wider range of air voids and having greater aggregate absorption.

24
= =
Figure 1 –Box Samples for Participating Laboratories
Loose 12.5-mm Mix (Upper band)
Loose 19.0-mm Mix (Lower band)
Prepare 2 boxes containing 3 each ~4837 and ~1611 g specimens, respectively.
Gyr – 3 replicate ~4837 g specimens
Gmm – 3 replicate ~1611 g specimens
4 boxes of samples per laboratory
Prepare 2 boxes containing 3 each ~4915 and ~2176 g specimens, respectively.
Gyr – 3 replicate ~4915 g specimens
Gmm – 3 replicate ~2176 g specimens

24
Figure 2 – Box Plots for Maximum Specific Gravity (Gmm) Data
(a) (b)
(c) (d)
26
Figure 3 - h Consistency Statistics - Maximum Specific Gravity (Gmm) - D2041
-5
-4
-3
-2
-1
0
1
2
3
1 2 3 4 5 6 7 8 9 10 11 12 13 14 15 16 17 18 19 20 21 22 23 24 25 26 27
Laboratory Number
h-
Co
nsi
sten
cy S
tati
stic
12.5-mm
19.0-mm
Critical value of h = 2.62
Figure 4 - k Consistency Statistics - Maximum Specific Gravity (Gmm) - D2041
0
0.5
1
1.5
2
2.5
3
3.5
1 2 3 4 5 6 7 8 9 10 11 12 13 14 15 16 17 18 19 20 21 22 23 24 25 26 27
Laboratory Number
k -
Co
nsi
sten
cy S
tati
stic
12.5-mm
19.0-mm
Critical value of k = 2.23
27
Figure 5 - h Consistency Statistics - Maximum Specific Gravity (Gmm) – PS132
-4
-3
-2
-1
0
1
2
3
4
1 2 3 4 5 6 7 8 9 10 11 12 13 14 15 16 17 18 19 20 21 22 23 24 25 26 27
Laboratory Number
h -
Co
nsi
sten
cy S
tati
stic
12.5-mm
19.0-mm
Critical value of h = 2.62
Figure 6 - k Consistency Statistics - Maximum Specific Gravity (Gmm) – PS132
0
0.5
1
1.5
2
2.5
3
3.5
4
1 2 3 4 5 6 7 8 9 10 11 12 13 14 15 16 17 18 19 20 21 22 23 24 25 26 27
Laboratory Number
k-
Co
nsi
sten
cy S
tati
stic
12.5-mm
19.0-mm
Critical value of k = 2.23
25
Figure 7 – Box Plots for Bulk Specific Gravity (Gmb) Data
(a) (b)
(c) (d)

29
Figure 8 - h Consistency Statistics - Bulk Specific Gravity (Gmb) - T166
-4
-3
-2
-1
0
1
2
3
1 2 3 4 5 6 7 8 9 10 11 12 13 14 15 16 17 18 19 20 21 22 23 24 25 26
Laboratory Number
h -
Co
nsi
sten
cy S
tati
stic
12.5-mm
19.0-mm
Critical value of h = 2.62
Figure 9 - k Consistency Statistics - Bulk Specific Gravity (Gmb) - T166
0
0.5
1
1.5
2
2.5
3
3.5
4
1 2 3 4 5 6 7 8 9 10 11 12 13 14 15 16 17 18 19 20 21 22 23 24 25 26
Laboratory Number
k-C
on
sist
ency
Sta
tist
ic
12.5-mm
19.0-mm
Critical value of k = 2.23
30
Figure 10 - h Consistency Statistics - Bulk Specific Gravity (Gmb) – PS131
-3
-2
-1
0
1
2
3
1 2 3 4 5 6 7 8 9 10 11 12 13 14 15 16 17 18 19 20 21 22 23 24 25 26
Laboratory Number
h -
Co
nsi
sten
cy S
tati
stic
12.5-mm
19.0-mm
Critical value of h = 2.62
Figure 11 - k Consistency Statistics - Bulk Specific Gravity (Gmb) – PS131
0
0.5
1
1.5
2
2.5
3
3.5
1 2 3 4 5 6 7 8 9 10 11 12 13 14 15 16 17 18 19 20 21 22 23 24 25 26
Laboratory Number
k -
Co
nsi
sten
cy S
tati
stic
12.5-mm
19.0-mm
Critical value of k = 2.23
26
Figure 12 – Box Plots for Relative Density Data
(a) (b)
(c) (d)

32
Figure 13 - h Consistency Statistics - Relative Density (Nini) –T312
-4
-3
-2
-1
0
1
2
3
1 2 3 4 5 6 7 8 9 10 11 12 13 14 15 16 17 18 19 20 21 22 23 24 25 26
Laboratory Number
h-
Co
nsi
sten
cy S
tati
stic
12.5-mm
19.0-mm
Critical value of h = 2.62
Figure 14 - k Consistency Statistics - Relative Density (Nini) –T312
0
0.5
1
1.5
2
2.5
3
3.5
1 2 3 4 5 6 7 8 9 10 11 12 13 14 15 16 17 18 19 20 21 22 23 24 25 26
Laboratory Number
k-
Co
nsi
sten
cy S
tati
stic
12.5-mm
19.0-mm
Critical value of k = 2.23

33
Figure 15 - h Consistency Statistics - Relative Density (Ndes) –T312
-4
-3
-2
-1
0
1
2
3
1 2 3 4 5 6 7 8 9 10 11 12 13 14 15 16 17 18 19 20 21 22 23 24 25 26
Laboratory Number
h-
Co
nsi
sten
cy S
tati
stic
12.5-mm
19.0-mm
Critical value of h = 2.62
Figure 16 - k Consistency Statistics - Relative Density (Ndes) –T312
0
0.5
1
1.5
2
2.5
3
3.5
4
1 2 3 4 5 6 7 8 9 10 11 12 13 14 15 16 17 18 19 20 21 22 23 24 25 26
Laboratory Number
k-
Co
nsi
sten
cy S
tati
stic
12.5-mm
19.0-mm
Critical value of k = 2.23

34
Table 1 – Laboratory Mix Designs Material 12.5-mm, Gmm (g) 12.5-mm, Gyr (g) 19.0-mm, Gmm (g) 19.0-mm, Gyr (g)
19.0-mm aggregate --- --- 447 1010
12.5-mm aggregate 274 822 438 990
9.5-mm aggregate 268 805 204 460
4.75-mm aggregate 303 910 241 545
2.36-mm aggregate 273 820 239 540
Sand 414 1243 512 1155
Mineral Filler 10 30 9 20
Binder 69 207 86 195
Total: 1611 4837 2176 4915
Table 2 – HMA Design – Binder Content and Absorption
Property 12.5-mm mix, (percent) 19.0-mm mix, (percent)
Design Asphalt Content 4.28 3.97
Effective Asphalt Content 3.59 3.37
Binder Absorption1 0.7 0.6 1Determined Using PP28 (2)
Table 3 - Test Properties Determined in Study Property 12.5-mm Mixture 19.0-mm Mixture
ASTM D2041-00 ASTM D2041-00 Maximum Specific Gravity (Gmm)
ASTM PS132-01 ASTM PS132-01 ASTM PS131-01 ASTM PS131-01
Bulk Specific Gravity (Gmb)AASHTO T166-00 AASHTO T166-00 AASHTO T312, Nini AASHTO T312, NiniRelative Density AASHTO T312, Ndes AASHTO T312, Ndes

35
Table 4 - 12.5-mm Mixture Data Maximum Specific Gravity Bulk Specific Gravity Relative Density - T 312
Lab Number Weight in Gmm - D2041 Gmm – PS132 G mb – PS131 G mb - T166 Nini Ndes Comp. Manuf. Comp. Model 2.549 2.534 2.371 2.391 83.2 93.8
air 2.551 2.540 2.378 2.390 83.1 93.7 1
2.550 2.539 2.376 2.405 83.3 94.3
Pine AGFC125X
2.548 2.392 83.5 93.9 water 2.548 2.399 83.2 94.2 2
2.551 2.402 83.7 94.2
Pine AFGC125X
2.550 2.549 2.338 2.365 82.7 92.7 water 2.547 2.547 2.327 2.358 82.5 92.6 3
2.551 2.541 2.341 2.349 81.9 92.1
Pine AFGC125X
2.551 2.540 2.373 2.404 83.4 94.2 air 2.552 2.546 2.294 2.394 83.0 93.8 4
2.549 2.545 2.365 2.400 83.7 94.2
Pine AFGC125Xa
2.546 2.545 2.367 2.364 82.6 92.9 water 2.554 2.571 2.359 2.368 82.5 92.7 5
2.552 2.555 2.354 2.356 82.4 92.3 Troxler 4140
2.548 2.559 2.354 2.385 82.8 93.6 water 2.549 2.534 2.360 2.384 83.0 93.5 6
2.546 2.561 2.375 2.400 83.5 94.3
Pine AFGC125X
2.545 2.540 2.390 2.402 84.3 94.4 air 2.545 2.545 2.373 2.398 83.7 94.2 7 2.550 2.548 2.407 2.411 84.1 94.5
Pine AFG1A
2.546 2.573 2.335 2.382 83.1 93.6 air 2.545 2.531 2.335 2.390 83.5 93.9 8
2.553 2.575 2.351 2.390 83.4 93.6
Troxler 4140
2.552 2.375 82.8 93.1 water 2.551 2.381 83.5 93.3 9
2.549 2.378 83.0 93.2 Troxler 4140
2.550 2.517 2.379 2.401 83.5 94.1
water 2.550 2.461 2.373 2.391 83.4 93.8 10
2.550 2.546 2.377 2.399 83.2 94.1
Pine AFGC125X
2.558 2.392 83.2 93.5 water 2.564 2.397 83.0 93.5 11
2.566 2.398 83.2 93.4 Pine AFGC125X
2.550 2.380 2.394 83.1 93.9
water 2.548 2.555 2.371 2.385 82.9 93.6 12
2.548 2.563 2.369 2.387 82.8 93.7
Pine AFGC125X
2.547 2.564 2.367 2.383 83.0 93.6 water 2.549 2.552 2.381 2.397 83.4 94.0 13
2.547 2.542 2.407 2.422 84.6 95.1 Pine AFGC125X
2.551 2.553 2.346 2.371 83.2 92.9
water 2.549 2.556 2.341 2.370 83.0 93.0 14
2.549 2.557 2.335 2.366 83.2 92.8
Troxler 4140
2.560 2.504 2.373 2.409 83.6 94.1 air 2.556 2.512 2.380 2.411 82.9 94.3 15
2.556 2.523 2.353 2.396 83.0 93.7
Brovold BGC-1
2.553 2.525 2.360 2.368 82.7 92.7 water 2.556 2.532 2.292 2.303 80.7 90.2 16
2.552 2.513 2.277 2.289 80.5 89.6
Pine AFGC125X
2.550 2.553 2.352 2.388 84.0 93.6 water 2.550 2.553 2.346 2.376 83.6 93.2 17
2.550 2.552 2.326 2.369 83.3 92.9
Troxler 4140
2.554 2.528 2.369 2.388 83.6 93.5 air 2.551 2.551 2.374 2.396 84.2 93.9 18
2.552 2.482 2.375 2.397 84.4 93.9
Pine AFGC125X
2.548 2.628 2.360 2.384 84.0 93.6 air 2.553 2.639 2.375 2.404 83.8 94.2 19
2.554 2.634 2.377 2.395 83.7 93.8
Troxler 4140
2.553 2.518 2.333 2.361 82.5 92.5 air 2.552 2.534 2.351 2.378 83.3 93.2 20
2.551 2.538 2.352 2.369 83.1 92.9
Troxler 4140
2.546 2.543 2.354 2.377 83.6 93.4 air 2.547 2.545 2.360 2.387 83.8 93.7 21 2.546 2.538 2.347 2.374 83.5 93.2
Troxler 4140B
2.545 2.372 83.4 93.1 air 2.546 2.358 83.1 92.6 22
2.547 2.366 83.1 93.0
Troxler 4140
2.553 2.559 2.343 2.384 83.7 93.3 water 2.554 2.543 2.329 2.368 83.4 92.7 23
2.551 2.555 2.331 2.365 83.1 92.6 Troxler 4140
2.540 2.545 2.363 2.382 83.2 93.8 air 2.540 2.554 2.369 2.395 83.8 94.3 24
2.541 2.549 2.370 2.389 83.2 94.0
Brovold BCG-1
2.556 2.573 2.370 2.396 83.2 93.7 water 2.557 2.529 2.341 2.398 82.9 93.8 25
2.558 2.559 2.384 2.409 83.5 94.2 Pine AFGC125X
2.554 2.519 2.380 2.390 83.1 93.6
air 2.554 2.509 2.367 2.382 83.1 93.3 26
2.554 2.539 2.372 2.384 82.7 93.3
Brovold (Pine) AFGB1A
Notes: 1. Shaded cells indicate data eliminated from analysis as described in Section 3.2. 2. Empty cells or portions of cells indicate that the laboratory did not submit data. One laboratory did not submit any data.
36
Table 5 - 19.0-mm Mixture Data Maximum Specific Gravity Bulk Specific Gravity Relative Density - T 312
Lab Number Weight in Gmm - D2041 Gmm - PS132 Gmb - PS131 Gmb - T166 Nini Ndes Comp. Manuf. Comp. Model 2.562 2.554 2.376 82.4 92.7
air 2.559 2.545 2.394 82.2 93.6 1
2.559 2.545 2.377 2.402 83.4 93.9
Pine AGFC125X
2.563 2.405 83.1 93.8 water 2.564 2.407 83.2 93.9 2
2.564 2.407 83.5 93.9
Pine AFGC125X
2.557 2.533 2.371 2.397 83.5 93.7
air 2.557 2.549 2.337 2.390 83.3 93.5 3
2.557 2.543 2.372 2.398 83.5 93.8
Pine AFGC125X
2.568 2.561 2.385 2.431 83.9 94.7 air 2.560 2.559 2.402 2.449 85.1 95.7 4
2.560 2.561 2.364 2.417 83.8 94.4
Pine AFGC125X
2.532 2.580 2.327 2.375 83.8 93.8 water 2.540 2.569 2.343 2.387 83.1 93.9 5
2.539 2.564 2.342 2.383 83.5 94.0
Troxler 4140
2.564 2.553 2.383 2.430 83.9 94.8
water 2.567 2.577 2.362 2.421 83.1 94.3 6
2.564 2.544 2.369 2.408 83.3 93.9
Pine AFGC125X
2.565 2.554 2.396 2.416 83.7 94.2 air 2.560 2.549 2.371 2.385 82.7 93.2 7
2.562 2.555 2.383 2.403 83.3 93.8
Pine AFGC125X
2.565 2.558 2.367 2.410 83.2 93.9 air 2.567 2.567 2.351 2.405 83.2 93.7 8
2.567 2.586 2.337 2.381 82.9 92.8
Troxler 4140
2.560 2.383 83.5 93.1
water 2.562 2.373 82.9 92.6 9
2.564 2.421 84.3 94.4
Troxler 4140
2.563 2.564 2.398 2.411 83.4 94.1 water 2.563 2.552 2.346 2.381 81.5 92.9 10
2.565 2.545 2.369 2.402 83.1 93.6
Pine AFGC125X
2.563 2.378 83.0 92.8 water 2.560 2.408 84.2 94.1 11
2.562 2.416 84.5 94.3
Pine AFGC125X
2.565 2.565 2.369 2.395 83.3 93.4
water 2.562 2.561 2.375 2.399 83.6 93.6 12
2.565 2.567 2.376 2.399 82.8 93.5
Pine AFGC125X
2.562 2.549 2.391 2.414 84.1 94.2 water 2.563 2.549 2.401 2.401 83.5 93.7 13
2.564 2.552 2.382 2.405 83.6 93.8
Pine AFGC125X
2.564 2.559 2.352 2.392 83.6 93.3 water 2.566 2.568 2.353 2.385 83.0 93.0 14
2.564 2.564 2.359 2.398 83.7 93.5
Troxler 4140
2.564 2.565 2.347 2.392 82.4 93.3 air 2.564 2.557 2.391 2.421 83.3 94.4 15
2.563 2.565 2.386 2.408 82.6 94.0
Brovold BGC-1
2.562 2.534 2.357 2.389 83.1 93.2
water 2.565 2.525 2.328 2.361 82.1 92.0 16
2.563 2.539 2.342 2.376 82.9 92.7
Pine AFGC125X
2.567 2.562 2.369 2.391 83.5 93.1 water 2.558 2.533 2.367 2.395 84.1 93.6 17
2.564 2.557 2.370 2.393 83.8 93.3
Troxler 4140
2.564 2.565 2.374 2.407 83.9 93.9 air 2.562 2.564 2.385 2.398 83.6 93.6 18
2.560 2.560 2.385 2.429 84.4 94.9
Pine AFGC125X
2.566 2.530 2.338 2.401 83.7 93.6
air 2.564 2.548 2.325 2.391 83.4 93.3 19
2.562 2.551 2.328 2.389 82.9 93.3
Troxler 4140
2.563 2.548 2.310 2.371 82.9 92.5 air 2.564 2.541 2.364 2.393 83.5 93.3 20
2.564 2.544 2.361 2.389 83.4 93.2
Troxler 4140
2.562 2.547 2.342 2.381 83.4 92.9 air 2.560 2.549 2.356 2.391 83.9 93.4 21
2.561 2.547 2.376 2.408 84.2 94.0
Troxler 4140B
2.546 2.464 2.278 2.392 83.9 93.9
air 2.561 2.391 2.296 2.367 82.8 92.4 22
2.561 2.460 2.331 2.434 85.2 95.0
Troxler 4140
2.565 2.576 2.377 2.404 84.2 93.7 water 2.562 2.569 2.356 2.388 83.4 93.2 23
2.563 2.569 2.383 2.411 84.0 94.1
Troxler 4140
2.549 2.637 2.374 2.392 83.7 93.7 air 2.554 2.636 2.395 2.415 83.8 94.7 24
2.553 2.631 2.382 2.407 83.6 94.3
Brovold BCG-1
2.563 2.534 2.369 2.398 83.2 93.6
water 2.561 2.541 2.368 2.417 83.4 94.4 25
2.561 2.501 2.258 2.409 83.4 94.1
Pine AFGC125X
2.574 2.352 2.410 83.3 93.7 air 2.570 2.343 2.385 82.0 92.7 26
2.574 2.351 2.396 82.9 93.1
Brovold (Pine) AFGB1A
2.567 2.534 27 air 2.565 2.534 --- ---
2.564 2.542
Notes: 1. Shaded cells indicate data eliminated from analysis as described in Section 3.2. 2. Empty cells or portions of cells indicate that the laboratory did not submit data.

37
Table 6 - Precision Estimates - Maximum Specific Gravity (Gmm)
No. of No. of Repeatability Reproducibility
Data Source Labs Replicates Average 1s (Sr) d2s 1s (SR) d2s
D2041, 12.5-mm MixA 25 3 2.550 0.002 0.005 0.004 0.011
D2041, 12.5-mm Mix, Wt in AirB 12 3 2.550 0.002 0.006 0.005 0.013
D2041, 12.5-mm Mix, Wt in WaterB 13 3 2.551 0.002 0.005 0.003 0.008
D2041, 19.0-mm MixA 24 3 2.562 0.002 0.006 0.003 0.009
D2041, 19.0-mm Mix, Wt in AirB 12 3 2.562 0.002 0.006 0.004 0.012
D2041, 19.0-mm Mix, Wt in WaterB 12 3 2.563 0.002 0.005 0.002 0.005
PS132, 12.5-mm MixA 19 3 2.542 0.014 0.039 0.018 0.051
PS132, 19.0-mm MixA 23 3 2.557 0.009 0.025 0.022 0.063
T209-99 AASHTO Book (3) 5 3 ___ 0.004 0.011 0.006 0.019
D2041-00 ASTM Book (4) ~300 2 ___ 0.008 0.023 0.016 0.044
AMRL PSP Samples 9 & 10, 12.5-mm MixC 231 2 2.554 0.003 0.008 0.006 0.016
AMRL PSP Samples 11 & 12, 12.5-mm MixC 279 2 2.552 0.003 0.007 0.005 0.015
A Outliers were eliminated and the remaining data were analyzed in the manner described in ASTM Practice E 691.
B Outliers excluded from the combined data set were eliminated. The remaining data were analyzed in the manner described in ASTM Practice E 691.
C Based on analysis of data falling within a bivariate normal tolerance region containing approximately 85% of the data with 95% confidence. (See Appendix B).

38
Table 7 – Significance Levels (P-Values) for the Observed Differences in the Maximum Specific Gravity (Gmm) Data
T test F test for Sr F test for SR
Data Compared P-Value for the test of no difference in means
P-Value for the test of no difference in repeatability
P-Value for the test of no difference in
reproducibility
D2041, 12.5-mm Mix D2041, 19.0-mm Mix --- 60.9% 19.8%
D2041, 12.5-mm Mix, Wt in Air D2041, 12.5-mm Mix, Wt in Water 16.2% 41.1% 0.6%
D2041, 19.0-mm Mix, Wt in Air D2041, 19.0-mm Mix, Wt in Water 2.2% 87.2% 0.0%
D2041, 12.5-mm Mix PS132, 12.5-mm Mix 0.1% 0.0% 0.0%
D2041, 19.0-mm Mix PS132, 19.0-mm Mix 3.0% 0.0% 0.0%
Note: Shaded cells indicate significant differences at a 1% level.

39
Table 8 - Precision Estimates - Bulk Specific Gravity (Gmb)
No. of No. of Repeatability Reproducibility
Data Source Labs Replicates Average 1s (Sr) D2s 1s (SR) d2s
T166, 12.5-mm MixA 25 3 2.386 0.008 0.022 0.015 0.043
T166, 12.5-mm Mix, Pine AFGC125XB 11 3 2.392 0.008 0.024 0.014 0.040
T166, 12.5-mm Mix, Troxler 4140B 10 3 2.376 0.007 0.021 0.012 0.033
T166, 19.0-mm MixA 24 3 2.398 0.013 0.035 0.014 0.040
T166, 19.0-mm Mix, Pine AFGC125XB 12 3 2.401 0.012 0.035 0.015 0.043
T166, 19.0-mm Mix, Troxler 4140B 9 3 2.392 0.013 0.036 0.013 0.036
PS131, 12.5-mm MixA 20 3 2.362 0.011 0.030 0.019 0.054
PS131, 12.5-mm Mix, Pine AFGC125XB 8 3 2.368 0.012 0.034 0.018 0.050
PS131, 12.5-mm Mix, Troxler 4140B 8 3 2.348 0.009 0.025 0.014 0.040
PS131, 19.0-mm MixA 20 3 2.364 0.015 0.043 0.021 0.060
PS131, 19.0-mm Mix, Pine AFGC125XB 9 3 2.373 0.015 0.043 0.019 0.054
PS131, 19.0-mm Mix, Troxler 4140B 8 3 2.352 0.015 0.042 0.019 0.053
T166 AASHTO Book, 4" dia. specimen ___ ___ ___ 0.020 0.057 ___ ___
D2726 ASTM Book, 4" dia. specimen 16 4 ___ 0.012 0.035 0.027 0.076
AMRL PSP Samples 7 & 8, 12.5-mm MixC,D 231 2 2.487 0.008 0.022 0.020 0.058
AMRL PSP Samples 9 & 10, 12.5-mm MixC 239 2 2.424 0.013 0.037 0.025 0.070
AMRL PSP Samples 9 & 10, PineC 89 2 2.429 0.012 0.033 0.022 0.062
AMRL PSP Samples 9 & 10, TroxlerC 120 2 2.422 0.014 0.040 0.027 0.076
AMRL PSP Samples 11 & 12, 12.5-mm MixC 289 2 2.438 0.022E 0.062E 0.028 0.078
A Outliers were eliminated and the remaining data were analyzed in the manner described in ASTM Practice E 691.
B Outliers excluded from the combined data set were eliminated. The remaining data were analyzed in the manner described in ASTM Practice E 691.
C Based on analysis of data falling within a bivariate normal tolerance region containing approximately 85% of the data with 95% confidence.
D Specimens compacted to Nmax.E A test to identify significant difference between the variance in the test results for samples 11 and 12, the F test, indicated with 99% probability that the sample variances were different. Therefore, the repeatability estimates are not valid.
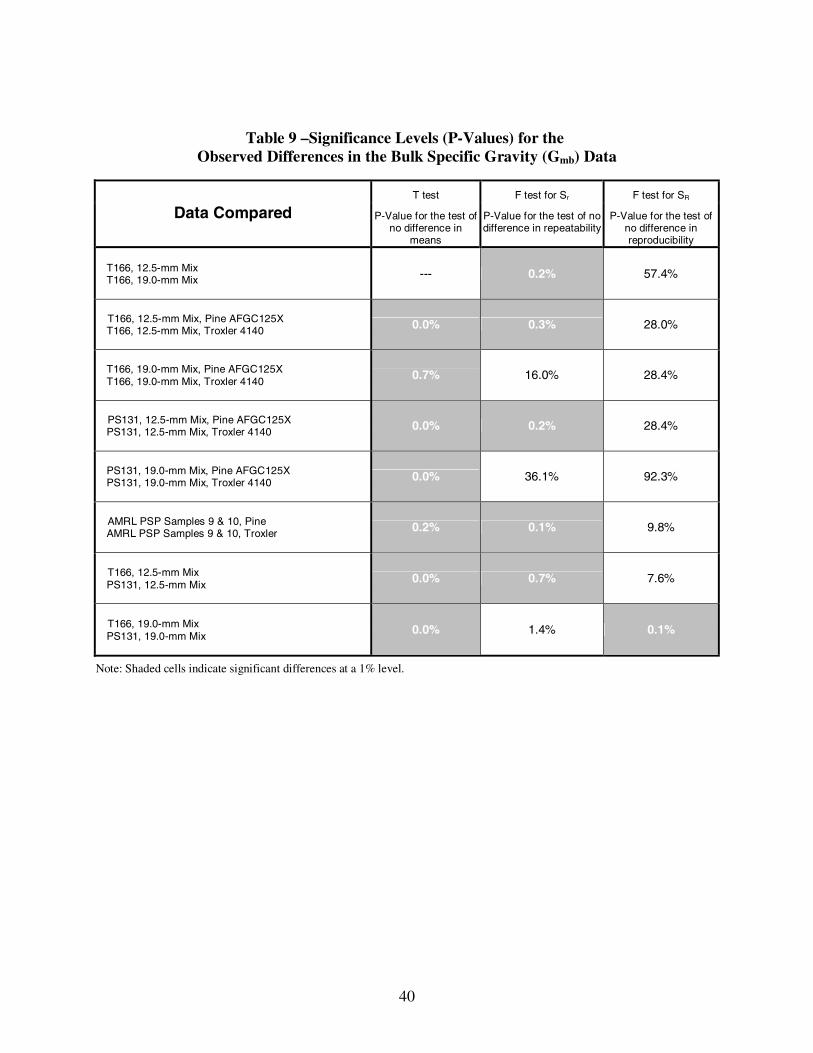
40
Table 9 – Significance Levels (P-Values) for the Observed Differences in the Bulk Specific Gravity (Gmb) Data
T test F test for Sr F test for SR
Data Compared P-Value for the test of no difference in
means
P-Value for the test of no difference in repeatability
P-Value for the test of no difference in reproducibility
T166, 12.5-mm Mix T166, 19.0-mm Mix --- 0.2% 57.4%
T166, 12.5-mm Mix, Pine AFGC125X T166, 12.5-mm Mix, Troxler 4140 0.0% 0.3% 28.0%
T166, 19.0-mm Mix, Pine AFGC125X T166, 19.0-mm Mix, Troxler 4140 0.7% 16.0% 28.4%
PS131, 12.5-mm Mix, Pine AFGC125X PS131, 12.5-mm Mix, Troxler 4140 0.0% 0.2% 28.4%
PS131, 19.0-mm Mix, Pine AFGC125X PS131, 19.0-mm Mix, Troxler 4140 0.0% 36.1% 92.3%
AMRL PSP Samples 9 & 10, Pine AMRL PSP Samples 9 & 10, Troxler 0.2% 0.1% 9.8%
T166, 12.5-mm Mix PS131, 12.5-mm Mix 0.0% 0.7% 7.6%
T166, 19.0-mm Mix PS131, 19.0-mm Mix 0.0% 1.4% 0.1%
Note: Shaded cells indicate significant differences at a 1% level.
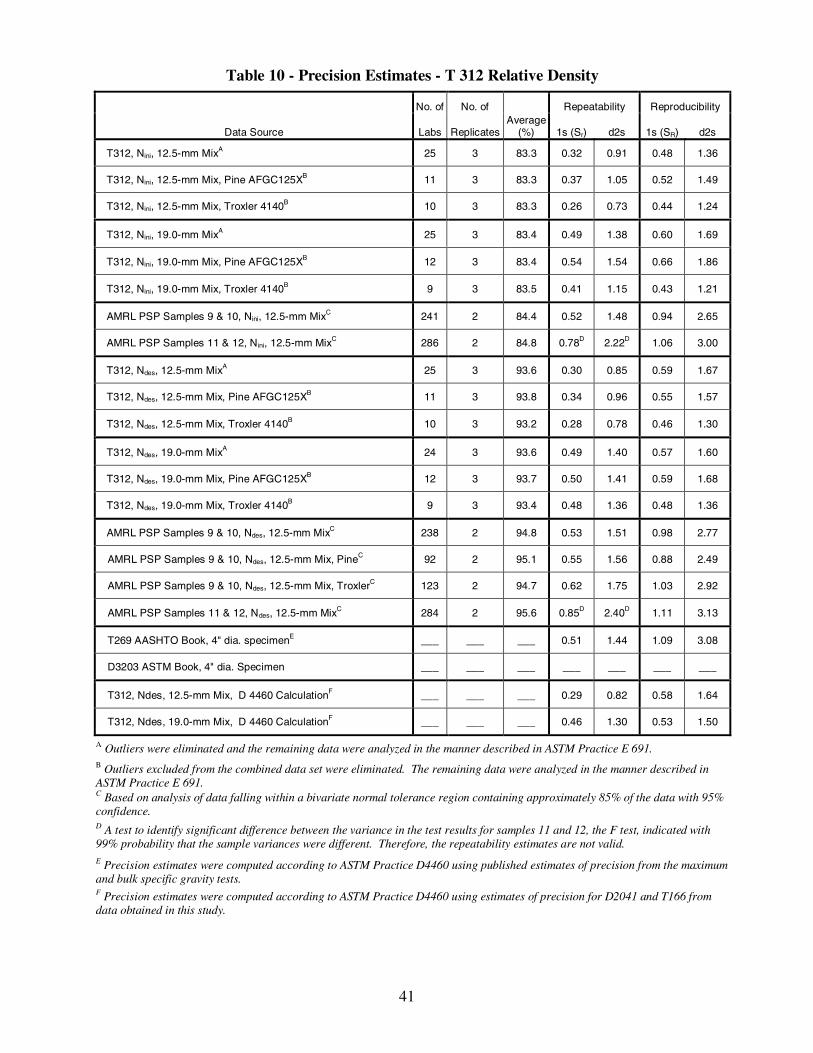
41
Table 10 - Precision Estimates - T 312 Relative Density
No. of No. of Repeatability Reproducibility
Data Source Labs ReplicatesAverage
(%) 1s (Sr) d2s 1s (SR) d2s
T312, Nini, 12.5-mm MixA 25 3 83.3 0.32 0.91 0.48 1.36
T312, Nini, 12.5-mm Mix, Pine AFGC125XB 11 3 83.3 0.37 1.05 0.52 1.49
T312, Nini, 12.5-mm Mix, Troxler 4140B 10 3 83.3 0.26 0.73 0.44 1.24
T312, Nini, 19.0-mm MixA 25 3 83.4 0.49 1.38 0.60 1.69
T312, Nini, 19.0-mm Mix, Pine AFGC125XB 12 3 83.4 0.54 1.54 0.66 1.86
T312, Nini, 19.0-mm Mix, Troxler 4140B 9 3 83.5 0.41 1.15 0.43 1.21
AMRL PSP Samples 9 & 10, Nini, 12.5-mm MixC 241 2 84.4 0.52 1.48 0.94 2.65
AMRL PSP Samples 11 & 12, Nini, 12.5-mm MixC 286 2 84.8 0.78D 2.22D 1.06 3.00
T312, Ndes, 12.5-mm MixA 25 3 93.6 0.30 0.85 0.59 1.67
T312, Ndes, 12.5-mm Mix, Pine AFGC125XB 11 3 93.8 0.34 0.96 0.55 1.57
T312, Ndes, 12.5-mm Mix, Troxler 4140B 10 3 93.2 0.28 0.78 0.46 1.30
T312, Ndes, 19.0-mm MixA 24 3 93.6 0.49 1.40 0.57 1.60
T312, Ndes, 19.0-mm Mix, Pine AFGC125XB 12 3 93.7 0.50 1.41 0.59 1.68
T312, Ndes, 19.0-mm Mix, Troxler 4140B 9 3 93.4 0.48 1.36 0.48 1.36
AMRL PSP Samples 9 & 10, Ndes, 12.5-mm MixC 238 2 94.8 0.53 1.51 0.98 2.77
AMRL PSP Samples 9 & 10, Ndes, 12.5-mm Mix, PineC 92 2 95.1 0.55 1.56 0.88 2.49
AMRL PSP Samples 9 & 10, Ndes, 12.5-mm Mix, TroxlerC 123 2 94.7 0.62 1.75 1.03 2.92
AMRL PSP Samples 11 & 12, Ndes, 12.5-mm MixC 284 2 95.6 0.85D 2.40D 1.11 3.13
T269 AASHTO Book, 4" dia. specimenE ___ ___ ___ 0.51 1.44 1.09 3.08
D3203 ASTM Book, 4" dia. Specimen ___ ___ ___ ___ ___ ___ ___
T312, Ndes, 12.5-mm Mix, D 4460 CalculationF ___ ___ ___ 0.29 0.82 0.58 1.64
T312, Ndes, 19.0-mm Mix, D 4460 CalculationF ___ ___ ___ 0.46 1.30 0.53 1.50
A Outliers were eliminated and the remaining data were analyzed in the manner described in ASTM Practice E 691. B Outliers excluded from the combined data set were eliminated. The remaining data were analyzed in the manner described in ASTM Practice E 691.C Based on analysis of data falling within a bivariate normal tolerance region containing approximately 85% of the data with 95%confidence. D A test to identify significant difference between the variance in the test results for samples 11 and 12, the F test, indicated with 99% probability that the sample variances were different. Therefore, the repeatability estimates are not valid. E Precision estimates were computed according to ASTM Practice D4460 using published estimates of precision from the maximum and bulk specific gravity tests. F Precision estimates were computed according to ASTM Practice D4460 using estimates of precision for D2041 and T166 from data obtained in this study.

42
T test F test for Sr F test for SR
P-Value for the test of no difference in means
P-Value for the test of no difference in repeatability
P-Value for the test of nodifference in
reproducibility
T312, Nini, 12.5-mm Mix
T312, Nini, 19.0-mm Mix 12.6% 0.7% 5.9%
T312, Nini, 12.5-mm Mix, Pine AFGC125X T312, Nini, 12.5-mm Mix, Troxler 4140
45.8% 0.1% 31.6%
T312, Nini, 19.0-mm Mix, Pine AFGC125X T312, Nini, 19.0-mm Mix, Troxler 4140
25.4% 2.2% 2.8%
T312, Ndes, 12.5-mm Mix T312, Ndes, 19.0-mm Mix
29.1% 0.5% 76.6%
T312, Ndes, 12.5-mm Mix, Pine AFGC125X T312, Ndes, 12.5-mm Mix, Troxler 4140 0.0% 0.1% 22.1%
T312, Ndes, 19.0-mm Mix, Pine AFGC125X T312, Ndes, 19.0-mm Mix, Troxler 4140
2.0% 43.8% 22.0%
AMRL PSP Samples 9 & 10, Ndes, 12.5-mm Mix, PineAMRL PSP Samples 9 & 10, Ndes, 12.5-mm Mix, Troxler 0.0% 15.9% 50.2%
Table 11 – Significance Levels (P-Values) for the Observed Differences in the Relative Density Data
Data Compared
Note: Shaded cells indicate significant differences at a 1% level.
43
REFERENCES
1. Cominsky, R.J., Huber, G.A., Kennedy, T.W., and Anderson, R.M., “The Superpave Mix Design Manual for New Construction and Overlays,” Strategic Highway Research Program, SHRP-A-407, 1994.
2. American Association of State Highway and Transportation Officials, “Provisional Standards,” Annual Editions 1993-2002.
3. AASHTO Standard Specifications for Transportation Materials and Methods of Sampling and Testing (Part 2 – Tests), Twenty-First Edition, American Association of State Highway and Transportation Officials, Washington, DC.
4. ASTM Book of Standards, Vol. 04.03, Road and Paving Materials, West Conshohocken, PA, 2001.
5. Pielert, J.H. and Spellerberg, P.A., “AASHTO Materials Reference Laboratory – Thirty Years of Service to the Transportation Community,” TR News, Number 183, Transportation Research Board, Washington, DC, March-April 1996, pages 22-28.
6. ASTM Book of Standards, Vol. 14.02, General Test Method, Non-Metallic, Chromatography; Durability of Non-Metallic Materials; Forensic Sciences; Laboratory Apparatus; Statistic Methods, West Conshohocken, PA, 2001.
7. AMRL Web Site: http://www.nist.gov/amrl8. Dataplot Website: http://www.itl.nist.gov/div898/software/dataplot.html/summary.htm 9. Tukey, John W., “Exploratory Data Analysis,” Addison Wesley, Reading, Massachusetts,
1977. 10. Hall, I. J., and Sheldon, D. D., “Improved Bivariate Normal Tolerance Regions with Some
Applications”, Journal of Quality Technology, Vol. 11, No. 1, January 1979. 11. Youden, W.J., Statistical Techniques for Collorrative Tests, Journal of the Association of
Official Analytical Chemists, Washington, DC, 1967, pp. 18-19. 12. Cooley, L.A., Prowell, B.D., Hainin, M.R., and Buchanan, M.S., Bulk Specific Gravity
Round-Robin Using the Corelok Vacuum Sealing Device, National Center for Asphalt Technology, Auburn University, Auburn, Alabama.

44
APPENDIX A
INSTRUCTIONS TO LABORATORIES FOR TESTING SAMPLES
NCHRP 9-26 Precision Statement for AASHTO T312
12.5-mm Mix
Maximum Specific Gravity Of Bituminous Paving Mixtures
ASTM D2041-00, See Protocol Provided
The three small boxes of mix labeled “NCHRP 9-26: Maximum Specific Gravity” are to be used for the maximum specific gravity test. The samples shall be heated in an oven at a temperature of 105 ± 5oC until soft enough to be separated. Use either the bowl or flask method, and the mechanical agitation device described in the method. Record the temperature, masses and the results below.
Weighing-in-Water Determination (Bowl)
1 2 3
(a) Mass of Oven Dried Mix Sample in Air (0.1 g)
(b) Mass of Bowl in Water @ 25oC (0.1 g)
(c) Mass of Bowl+Mix in Water @ 25oC (0.1 g)
(d) Temperature of Water Bath (0.1oC)
a/a-(c-b) Maximum Specific Gravity, Gmm (0.001)
Weighing-in-Air Determination (Flask or Bowl)
1 2 3
(a) Mass of Oven Dried Mix Sample in Air (0.1 g)
(b) Mass of Bowl/Flask+Water @ 25oC (0.1 g)
(c) Mass of Bowl/Flask+Mix+Water @ 25oC (0.1 g)
(d) Temperature of Bowl/Flask and Contents (0.1oC)
a/(a+b-c) Maximum Specific Gravity, Gmm (0.001)
Please submit all data by July 13, 2001
Name of Laboratory: ______________________________ Tested by: ______________________________ Phone No: ______________________________ Date Tested: ______________________________

45
NCHRP 9-26 Precision Statement for AASHTO T312
12.5-mm Mix
Maximum Specific Gravity Of Bituminous Paving Mixtures Using Corelok
See Protocol Provided
The three small boxes of mix labeled “Maximum Specific Gravity” are to be used for the maximum specific gravity test. The samples shall be tested for D2041 and then dried back to constant mass. The samples shall be dried to constant mass in an oven at a temperature of 105 ± 5oC. Record the temperature, masses and the results below.
1 2 3
(b) Mass of Oven Dried Mix Sample in Air (0.1 g)
(a) Combined Mass of Two Plastic Bags (0.1 g)
(c) Mass of Mix & Bags in Water @ 25oC (0.1 g)
(d) Temperature of Water Bath (0.1oC)
(Vc) Apparent specific gravity of plastic sealing material
b/a+b-c-(a/Vc) Maximum Specific Gravity, Gmm
(0.001)
Please submit all data by July 13, 2001
Name of Laboratory: ______________________________ Tested by: ______________________________ Phone No: ______________________________ Date Tested: ______________________________
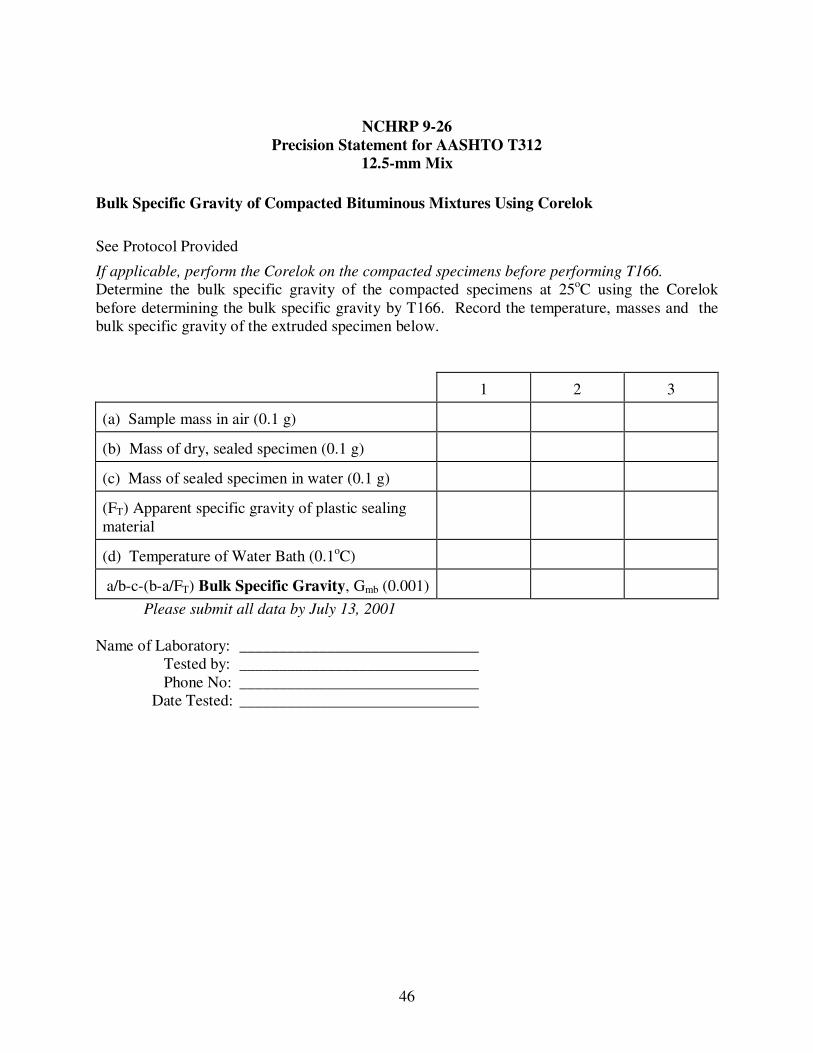
46
NCHRP 9-26 Precision Statement for AASHTO T312
12.5-mm Mix
Bulk Specific Gravity of Compacted Bituminous Mixtures Using Corelok
See Protocol Provided
If applicable, perform the Corelok on the compacted specimens before performing T166.Determine the bulk specific gravity of the compacted specimens at 25oC using the Corelok before determining the bulk specific gravity by T166. Record the temperature, masses and the bulk specific gravity of the extruded specimen below.
1 2 3
(a) Sample mass in air (0.1 g)
(b) Mass of dry, sealed specimen (0.1 g)
(c) Mass of sealed specimen in water (0.1 g)
(FT) Apparent specific gravity of plastic sealing material
(d) Temperature of Water Bath (0.1oC)
a/b-c-(b-a/FT) Bulk Specific Gravity, Gmb (0.001)
Please submit all data by July 13, 2001
Name of Laboratory: ______________________________ Tested by: ______________________________ Phone No: ______________________________ Date Tested: ______________________________

47
NCHRP 9-26 Precision Statement for AASHTO T312
12.5-mm Mix
Bulk Specific Gravity of Compacted Bituminous Mixtures Using SSD Specimens
AASHTO T166-00, See AASHTO Standard Specifications for Transportation Materials and Methods of Sampling and Testing (20th Edition)
After performing the bulk specific gravity with the Corelok, remove the compacted specimens from the sealed bag and determine the bulk specific gravity of the compacted specimens at 25oCusing T166. Record the temperature, masses and the bulk specific gravity of the extruded specimen below.
1 2 3
(a) Sample mass in air (0.1 g)
(b) Sample mass in water (0.1 g)
(c) SSD mass in air (0.1 g)
(d) Temperature of Water Bath (0.1oC)
a/(c-b) Bulk Specific Gravity, Gmb (0.001)
Please submit all data by July 13, 2001
Name of Laboratory: ______________________________ Tested by: ______________________________ Phone No: ______________________________ Date Tested: ______________________________

48
NCHRP 9-26 Precision Statement for AASHTO T312
12.5-mm Mix
Density of HMA Specimens by Means of the Superpave Gyratory Compactor
AASHTO TP4-00, See AASHTO Provisional Standards (2000 Edition)
Verify the calibration of the gyratory compactor prior to compacting the specimens. The three large boxes of mix labeled “NCHRP 9-26: Gyratory” are to be compacted using the gyratory compactor. The mix shall be brought to the compaction temperature (141-146oC) by careful, uniform heating in an oven immediately prior to molding. Compact the specimens using 100 gyrations. Report the height of the specimens at Nini (8 gyrations) and Ndes (100 gyrations) to the nearest 0.1 mm. Please attach a copy of the printout for the specimen height after each gyration. Calculate and report the percent of maximum specific gravity at Nini and Ndes.
1 2 3
Height @ Nini (0.1 mm)
Height @ Ndes (0.1 mm)
Percent Gmm @ Nini (0.1 percent)
Percent Gmm @ Ndes (0.1 percent)
Please submit all data by July 13, 2001
Please attach a printout of the specimen height after each gyration.
Gyratory Manufacturer:_____________________Model:_________________
Name of Laboratory: ______________________________ Tested by: ______________________________ Phone No: ______________________________
Date Tested: ______________________________

49
NCHRP 9-26 Precision Statement for AASHTO T312
19.0-mm Mix
Maximum Specific Gravity Of Bituminous Paving Mixtures
ASTM D2041-00, See Protocol Provided
The three small boxes of mix labeled “NCHRP 9-26 (19-mm): Maximum Specific Gravity” are to be used for the maximum specific gravity test. The samples shall be heated in an oven at a temperature of 105 ± 5oC until soft enough to be separated. Use either the bowl or flask method, and the mechanical agitation device described in the method. Record the temperature, masses and the results below.
Weighing-in-Water Determination (Bowl)
1 2 3
Specimen No.
(a) Mass of Oven Dried Mix Sample in Air (0.1 g)
(b) Mass of Bowl in Water @ 25oC (0.1 g)
(c) Mass of Bowl+Mix in Water @ 25oC (0.1 g)
(d) Temperature of Water Bath (0.1oC)
a/a-(c-b) Maximum Specific Gravity, Gmm (0.001)
Weighing-in-Air Determination (Flask or Bowl)
1 2 3
Specimen No.
(a) Mass of Oven Dried Mix Sample in Air (0.1 g)
(b) Mass of Bowl/Flask+Water @ 25oC (0.1 g)
(c) Mass of Bowl/Flask+Mix+Water @ 25oC (0.1 g)
(d) Temperature of Bowl/Flask and Contents (0.1oC)
a/(a+b-c) Maximum Specific Gravity, Gmm (0.001)
Please submit all data by December 14, 2001Name of Laboratory: ______________________________
Tested by: ______________________________ Phone No: ______________________________
Date Tested:______________________________

50
NCHRP 9-26 Precision Statement for AASHTO T312
19.0-mm Mix
Maximum Specific Gravity Of Bituminous Paving Mixtures Using Corelok
See Protocol Provided
The three small boxes of mix labeled “NCHRP 9-26 (19-mm): Maximum Specific Gravity” are to be used for the maximum specific gravity test. The samples shall be tested for D2041 and then dried back to constant mass. The samples shall be dried to constant mass in an oven at a temperature of 105 ± 5oC. Record the temperature, masses and the results below.
1 2 3
Specimen No.
(A) Combined Mass of Two Plastic Bags (0.1 g)
(B) Mass of Oven Dried Mix Sample in Air (0.1 g)
(C) Mass of Mix & Bags in Water @ 25oC (0.1 g)
(D) (A+B)-C
(E) A/Vc
Vc of the Plastic Bags
(F) D-E
(G) B/F Maximum Specific Gravity, Gmm (0.001)
Temperature of Water Bath (0.1oC)
Please submit all data by December 14, 2001
Name of Laboratory: ______________________________ Tested by: ______________________________ Phone No: ______________________________ Date Tested: ______________________________

51
NCHRP 9-26 Precision Statement for AASHTO T312
19.0-mm Mix
Bulk Specific Gravity of Compacted Bituminous Mixtures Using Corelok
See Protocol Provided
If applicable, perform the Corelok on the compacted specimens before performing T166.Determine the bulk specific gravity of the compacted specimens at 25oC using the Corelok before determining the bulk specific gravity by T166. Record the temperature, masses and the bulk specific gravity of the extruded specimen below.
1 2 3
Specimen No.
(a) Sample mass in air (0.1 g)
(b) Mass of dry, sealed specimen (0.1 g)
(c) Mass of sealed specimen in water (0.1 g)
(FT) Apparent specific gravity of plastic sealing material
(d) Temperature of Water Bath (0.1oC)
a/[b-c-(b-a/FT)] Bulk Specific Gravity, Gmb
(0.001)
Please submit all data by December 14, 2001
Name of Laboratory: ______________________________ Tested by: ______________________________ Phone No: ______________________________ Date Tested: ______________________________
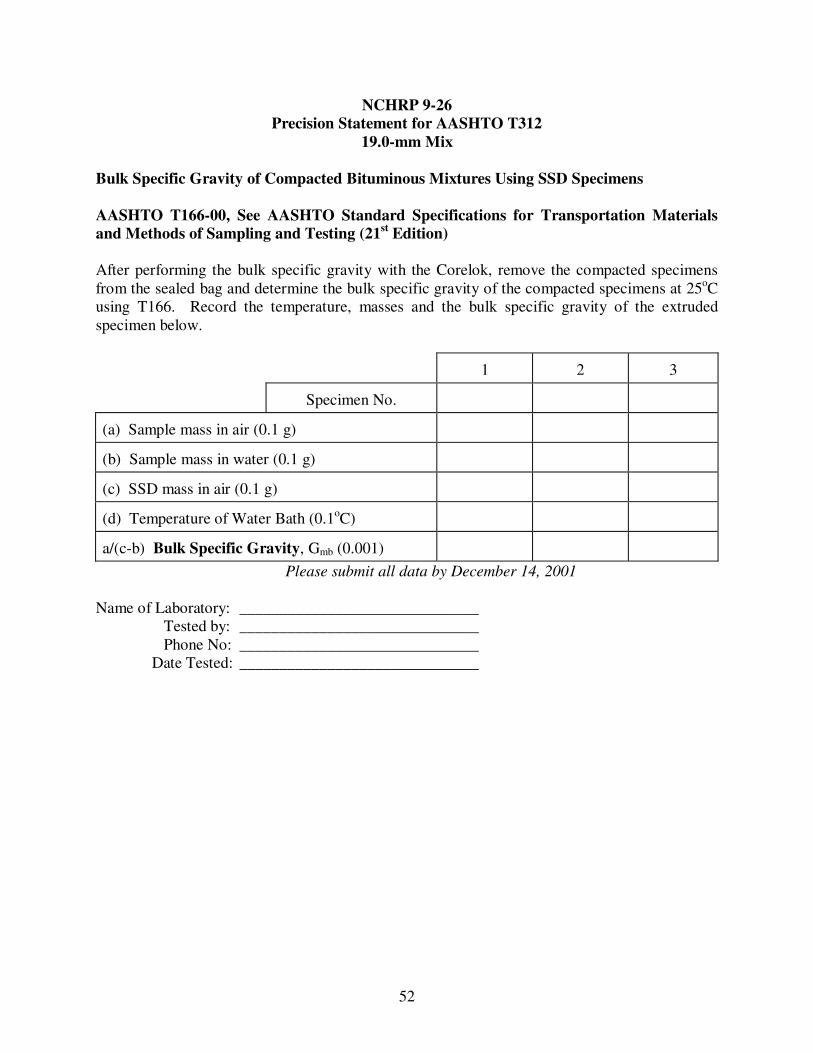
52
NCHRP 9-26 Precision Statement for AASHTO T312
19.0-mm Mix
Bulk Specific Gravity of Compacted Bituminous Mixtures Using SSD Specimens
AASHTO T166-00, See AASHTO Standard Specifications for Transportation Materials and Methods of Sampling and Testing (21st Edition)
After performing the bulk specific gravity with the Corelok, remove the compacted specimens from the sealed bag and determine the bulk specific gravity of the compacted specimens at 25oCusing T166. Record the temperature, masses and the bulk specific gravity of the extruded specimen below.
1 2 3
Specimen No.
(a) Sample mass in air (0.1 g)
(b) Sample mass in water (0.1 g)
(c) SSD mass in air (0.1 g)
(d) Temperature of Water Bath (0.1oC)
a/(c-b) Bulk Specific Gravity, Gmb (0.001)
Please submit all data by December 14, 2001
Name of Laboratory: ______________________________ Tested by: ______________________________ Phone No: ______________________________ Date Tested: ______________________________

53
NCHRP 9-26 Precision Statement for AASHTO T312
19.0-mm Mix
Density of HMA Specimens by Means of the Superpave Gyratory Compactor
AASHTO T312-01, See AASHTO Standard Specifications for Transportation Materials and Methods of Sampling and Testing (21st Edition)
Verify the calibration of the gyratory compactor prior to compacting the specimens. The three large boxes of mix labeled “NCHRP 9-26 (19-mm): Gyratory” are to be compacted using the gyratory compactor. The mix shall be brought to the compaction temperature (141-146oC) by careful, uniform heating in an oven immediately prior to molding. Compact the specimens using 100 gyrations. Report the height of the specimens at Nini (8 gyrations) and Ndes (100 gyrations) to the nearest 0.1 mm. Use the corresponding D2041 Gmm value and T166 Gmb value from columns 1, 2 and 3 on Pages 1 and 4 when calculating the Percent Gmm @ Nini and Ndes for columns 1, 2 and 3. Please attach a copy of the printout for the specimen height after each gyration. Calculate and report the percent of maximum specific gravity at Nini and Ndes.
1 2 3
Specimen No.
Height @ Nini (0.1 mm)
Height @ Ndes (0.1 mm)
Percent Gmm @ Nini (0.1 percent)
Percent Gmm @ Ndes (0.1 percent)
Please submit all data by December 14, 2001
Please attach a printout of the specimen height after each gyration.
Gyratory Manufacturer:_____________________Model:_________________
Name of Laboratory: ______________________________ Tested by: ______________________________ Phone No: ______________________________ Date Tested: ______________________________
54
APPENDIX B
BIVARIANT TOLERANCE REGION – A TOOL FOR SCREENING AMRL PROFICIENCY SAMPLE DATA
In this study, AMRL proficiency sample data were analyzed to judge the suitability of the precision estimates determined and to validate the findings regarding the comparison of test procedures and compaction equipment.
The AMRL proficiency sample testing rounds involve paired test samples distributed to and tested by a large number of laboratories. The primary purpose of the program is to provide participants with a tool for comparing their test results to those of other laboratories. However, the reasons for participation vary, and in some cases the data obtained may not be the result of testing performed in exact accordance with the standard methods specified. Some laboratories participate to verify non-standard versions of test procedures. Some laboratories use the program to evaluate the competency of their technicians. Some technicians participate in order to become certified or to maintain certification. Some tests are performed by certified/qualified technicians, others are not. Some laboratories perform tests using test equipment that meets specification requirements, others may not. Many of the participating laboratories are assessed by AMRL and also accredited by AASHTO, however, many are not.
In order to use the data for comparison purposes it is necessary to screen the data so that only the core data remains. Since all AMRL proficiency sample rounds result in paired test results from each laboratory, the method chosen to eliminate spurious data prior to analysis involved defining a bivariate tolerance region as described Hall (10) and eliminating the data beyond the region defined. This technique allows the user to define a region to encompass a desired percentage of the data with a selected degree of confidence. For this study a region that encompassed approximately 85 percent of the data with 95 percent confidence was chosen. The figure below shows the bivariate tolerance region obtained when the technique was applied to the bulk specific gravity data from AMRL gyratory proficiency sample pair 9/10. The data outside the ellipse were eliminated from the analysis.

55
2.300 2.350 2.400 2.450 2.500 2.550
2.300
2.350
2.400
2.450
2.500
2.550
Sample No. 9
Sam
ple
No
. 10
AMRL HMA Gyratory Proficiency Sample ProgramBulk Specific Gravity - 277 Points(38 outside the tolerance region)
*
** ***
**
*
**
**
**
*
****
***
***
*
**
**
*
**
**
*
*
*
*
***
**
**
*
****
*
*
*
*
*
**
**
**
**
*
*****
*
***
**
**
**
*
*
*
**
**
*
*
*
***
*
*
**
*
*
*
*
*
*
***
**
*
*
*
*
*
*
*
**
**
*
***
**
*
*
*
***
**
**
**
*
**
*
*
*
**
*
*
*
***
**
**
*
***
**
*
*
**
*
*
*
*
*
*
*
***
*
*
**
***
*
*
****
*
*
*
*
*
***
*
*
**
*
*
*
*
*
*
**
*
**
*
*
*
*
*
***
*
****
*
**
*
**
*
*
***
***
*
*
*
**
**
*
***
**
***
*
*
*
*
*
*
***
*
*
**
*
**
**
*
*
*
*
2.300 2.350 2.400 2.450 2.500 2.550
2.300
2.350
2.400
2.450
2.500
2.550
Sample No. 9
Sam
ple
No
. 10
AMRL HMA Gyratory Proficiency Sample ProgramBulk Specific Gravity - 277 Points(38 outside the tolerance region)

56
APPENDIX C
STATISTICAL METHODS FOR ANALYZING AMRL PROFICIENCY SAMPLE DATA
Since the two samples comprising a pair of AMRL proficiency samples are not identical in many cases, Sr (repeatability) estimates are obtained in the manner described by Youden (11)by applying the following equation to the paired data:
( ) ( )( )
( )12
2
−−−−
= ∑n
yxyxS
iir (1)
where: Sr = repeatability estimate Xi = laboratory test result from the odd number sample of a pair Yi = laboratory test result from the even number sample of a pair X = average of all Xi
Y = average of all Yi
This equation removes any actual differences in the samples and allows the paired test results to be treated as replicates. In some cases, when “F” exceeds “ F critical” at an alpha level of 0.05, the differences between the samples comprising the pairs are judged to be too great. In these instances the Sr estimates are considered invalid and unsuitable as precision estimates.
SR precision estimates for AMRL proficiency sample data are obtained using the following equation:
( )( )
( )( )
211
2222
−−
+−
−
=
∑ ∑∑ ∑nn
yyn
nn
xxn
S
iiii
R (2)
where: SR = reproducibility estimate

57
APPENDIX D
PRECISION STATEMENT FOR: ASTM STANDARD TEST METHOD FOR THEORETICAL MAXIMUM SPECIFIC GRAVITY AND DENSITY OF BITUMINOUS PAVING MIXTURES, D 2041-00
1. Precision and Bias
1.1 Precision
1.1.1 Single Operator Precision - The single operator standard deviation has been found to be 0.002A (1s limit) for mixtures containing aggregate with an absorption of less than 1.5 percent, having a nominal maximum aggregate size of 12.5-mm or 19.0-mm, and tested without use of Section 11. Therefore, the results of two properly conducted tests on the same material, by the same operator, using the same equipment, should be considered suspect if they differ by more than 0.006 (d2s limit).
1.1.2 Multilaboratory PrecisionB - The multilaboratory standard deviation has been found to be 0.004A (1s limit) for mixtures containing aggregate with an absorption of less than 1.5 percent, having a nominal maximum aggregate size of 12.5-mm or 19.0-mm, and tested without use of Section 11. Therefore, the results of two properly conducted tests on the same material, by different operators, using different equipment should be considered suspect if they differ by more than 0.011 (d2s limit).
ABased on an interlaboratory study described in NCHRP Research Report 9-26 involving twenty-seven laboratories, two materials (a 12.5-mm mixture and a 19.0-mm mixture), and three replicates. The approximately 2300 g, 19.0-mm mixture specimens tested did not meet the minimum sample size requirement in D2041.
BLimited research has indicated that the multilaboratory precision estimate for the “weight in water” method of test may be less than the multilaboratory precision estimate for the “weight in air” method of test. Further investigation is underway to determine if separate multilaboratory precision estimates are warranted.
1.2 Bias No information can be presented on the bias of the procedure because no material having an accepted reference value is available.
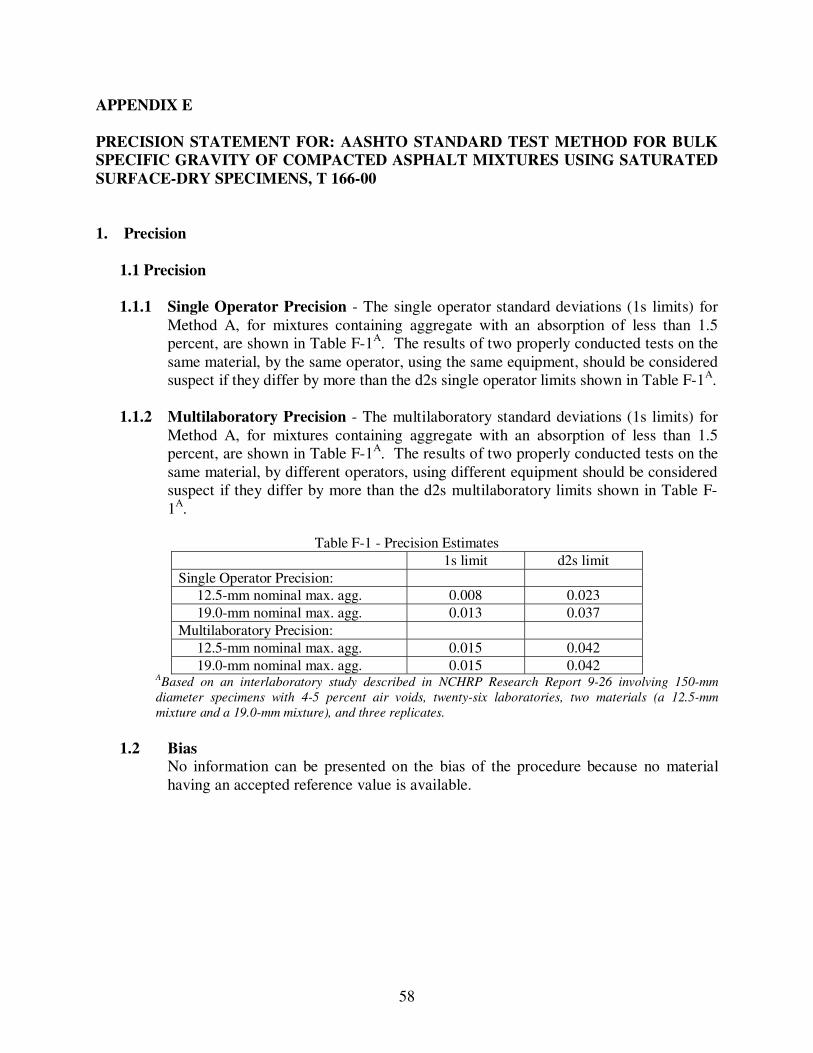
58
APPENDIX E
PRECISION STATEMENT FOR: AASHTO STANDARD TEST METHOD FOR BULK SPECIFIC GRAVITY OF COMPACTED ASPHALT MIXTURES USING SATURATED SURFACE-DRY SPECIMENS, T 166-00
1. Precision
1.1 Precision
1.1.1 Single Operator Precision - The single operator standard deviations (1s limits) for Method A, for mixtures containing aggregate with an absorption of less than 1.5 percent, are shown in Table F-1A. The results of two properly conducted tests on the same material, by the same operator, using the same equipment, should be considered suspect if they differ by more than the d2s single operator limits shown in Table F-1A.
1.1.2 Multilaboratory Precision - The multilaboratory standard deviations (1s limits) for Method A, for mixtures containing aggregate with an absorption of less than 1.5 percent, are shown in Table F-1A. The results of two properly conducted tests on the same material, by different operators, using different equipment should be considered suspect if they differ by more than the d2s multilaboratory limits shown in Table F-1A.
Table F-1 - Precision Estimates 1s limit d2s limit Single Operator Precision: 12.5-mm nominal max. agg. 0.008 0.023 19.0-mm nominal max. agg. 0.013 0.037 Multilaboratory Precision: 12.5-mm nominal max. agg. 0.015 0.042 19.0-mm nominal max. agg. 0.015 0.042
ABased on an interlaboratory study described in NCHRP Research Report 9-26 involving 150-mm diameter specimens with 4-5 percent air voids, twenty-six laboratories, two materials (a 12.5-mm mixture and a 19.0-mm mixture), and three replicates.
1.2 Bias No information can be presented on the bias of the procedure because no material having an accepted reference value is available.

59
APPENDIX F
PRECISION STATEMENT FOR: AASHTO STANDARD TEST METHOD FOR PREPARING AND DETERMINING THE DENSITY OF HOT-MIX ASPHALT (HMA) SPECIMENS BY MEANS OF THE SUPERPAVE GYRATORY COMPACTOR, T 312-01
1. Precision and Bias
1.1 Precision
1.1.1 Single Operator Precision - The single operator standard deviations (1s limits) for densities at Nini and Ndes, for mixtures containing aggregate with an absorption of less than 1.5 percent, are shown in Table H-1A. The results of two properly conducted tests on the same material, by the same operator, using the same equipment, should be considered suspect if they differ by more than the d2s single operator limits shown in Table H-1A.
1.1.2 Multilaboratory Precision - The multilaboratory standard deviations (1s limits) for relative densities at Nini and Ndes, for mixtures containing aggregate with an absorption of less than 1.5 percent, are shown in Table H-1A. The results of two properly conducted tests on the same material, by different operators, using different equipment should be considered suspect if they differ by more than the d2s multilaboratory limits shown in Table H-1A.
ABased on an interlaboratory study described in NCHRP Research Report 9-26 involving 150-mm diameter specimens with 4-5 percent air voids, twenty-six laboratories, two materials (a 12.5-mm mixture and a 19.0-mm mixture), and three replicates.
1.2 Bias No information can be presented on the bias of the procedure because no material having an accepted reference value is available.
1s limit Relative Density (%)
d2s limit Relative Density (%)
Single Operator Precision: 12.5-mm nominal max. agg. 0.3 0.9 19.0-mm nominal max. agg. 0.5 1.4 Multilaboratory Precision: 12.5-mm nominal max. agg. 0.6 1.7 19.0-mm nominal max. agg. 0.6 1.7
Table H-1 - Precision Estimates