Embed Size (px)
Citation preview

Precision Drilling Corporation4200, 150 - 6th Avenue SWCalgary, Alberta, Canada T2P 3Y7Telephone: 403-716-4500Facsimile: 403-264-0251www.precisiondrilling.com
Precision Drilling Corporation Annual Report2003
Precision Drilling Corporation2003
Annual Report
cover_sd 3/24/04 6:05 PM Page 1

A N N U A L R E P O R T 2003
page107
G L O S S A R Y
Borehole - Also known as the wellbore, this is the holemade by the drill bit, including the open or uncasedpart of the well.
Cased hole - The part of the wellbore which has beenprotected by metal casing to prevent fluid, pressure,and stability problems.
Coil tubing - A long continuous length of pipe wound onto a spool.The pipe is straightened prior to pushinginto a wellbore and recoiled to spool the pipe backonto the transport and storage spool.
Completion - The process of assembling downhole tubingand equipment to finish a well so that it can safelyproduce oil and gas.
Controlled Pressure Drilling (CPD) - Drilling with abottom hole pressure less than, equal to or overreservoir pressure.
Directional drilling - The use of equipment andengineering to intentionally change the angle of awellbore so that drilling efficiency can be enhanced orformations or obstructions can be circumvented inorder to reach the pay zone.
Drill string - Comprised of a string of tools, includingthe drill pipe, bottom hole assembly and any othertools needed to make the drill bit rotate at the bottomof the wellbore.
Electromagnetic (EM) telemetry - A downhole datacommunication method which uses the transmission ofelectromagnetic signals along the drill string to surfacewhere the data is decoded by a surface transceiver.
Fracturing - A method of stimulating production byincreasing formation permeability by creating andopening fractures through which formation fluids can flow.
Gamma Ray Logging (GR) - Measures the naturallyoccurring radiation in formations. Primarily used todifferentiate types of lithology.
Heavy oil - A viscous oil with an American PetroleumIndex (API) gravity of less than 22.3 degrees.
Oil sands - Any consolidated or unconsolidated rock thatcontains a hydrocarbon material with a gas-freeviscosity, measured at reservoir temperature, greaterthan 10,000 mPa, or that contains a hydrocarbonmaterial that is extractable from the mined or quarried rock.
Horizontal drilling - Directional drilling techniquewhere the wellbore inclination approaches or exceeds90 degrees from vertical.
Logging-While-Drilling (LWD) technology - Usesdownhole tools to measure formation properties in realtime while the well is being drilled. Propertiesmeasured include formation resistivity, porosity and density.
Measurement-While-Drilling (MWD) technology- Uses downhole tools to measure wellboreproperties in real time while the well is beingdrilled. Properties measured include wellboreinclination and azimuth, downhole pressure,temperature drillstring vibration and shock.
Mud Pulse telemetry - The transmission of downholeinformation to the surface while drilling by pressurepulses in the drilling mud.
Multi-Frequency Resistivity (MFR) - A logging-while-drilling tool that uses multiplefrequencies to accurately determine resistivitymeasurements in many different mud and formation types.
Open hole - The part of a well that is not cased.This canbe the complete wellbore immediately after the well isdrilled, or the section of the wellbore that occursbelow the casing after completion.
Polycrystalline Diamond Compact (PDC) bits - A type of bit that uses cutters with synthetic diamonddisks to shear rock with a continuous scraping motion.
Rotary Steerable (RS)- A tool designed for directionaldrilling that allows wellbore direction to be controlledwhile drilling with continuous rotation of the drill stringfrom surface.
Slickline - A thin non-electric cable used for selectiveplacement and retrieval of wellbore hardware and tools.
Snubbing - A procedure for moving drill pipe or tubing inand out of a wellbore while the well is under pressure.
Steam Assisted Gravity Drainage (SAGD) - Atechnique used to extract heavy oils which involves theinjection of steam into the producing zone, creating ahigh-temperature steam chamber in the formation.The injected heat decreases the viscosity of the thickcrude and allows it to flow more freely, with gravity'sassistance, to the horizontal production well oftenlocated below the injector.
Underbalanced Drilling (UBD) - When thehydrostatic head of a drilling fluid is intentionallydesigned to create a bottom hole pressure lowerthan the formation being drilled.The hydrostatichead of the drilling fluid may be naturally less thanthe formation pressure or it can be induced.Theinduced state may be created by adding natural gas,nitrogen or air to the liquid phase of the drillingfluid.Whether induced or natural this may result inan influx of formation fluids which must becirculated from the well and controlled at surface.
Well testing - Using specialized equipment andprocedures to obtain essential information about oil and gas wells after the drilling process is complete. Typical information derived may includereservoir performance, reservoir pressure, reserves,damage, permeability, porosity, and formation fluid composition.
Wireline - Single-strand or multi-strand cable used tolower evaluation tools into the borehole and to transmit data.
Workover - The repair or servicing of a producing well torestore or increase production.
TRADEMARKS used in this annual reportEMpulse™
Hostile Environment Logging (HEL™)
Multi-Frequency Resistivity (MFR™)
PrecisionLWD™
Revolution™
RBOP®
SuperLance™
Super Single® rig
Target Zero™
A N N UA L M E E T I N G
The Annual and Special Meeting of the Shareholders of Precision Drilling Corporation will be
held in the Devonian Room of the Calgary Petroleum Club, 319 – 5th Avenue SW, Calgary,
Alberta, Canada at 3:00 p.m. (Calgary time) on Tuesday, May 11, 2004.
Shareholders are encouraged to attend and those unable to do so are requested to complete
the Form of Proxy at their earliest convenience.
TA B L E O F C O N T E N TS
Corporate Profile 1
At-A-Glance 2
Report of the Chief Executive Officer 4
Disclosure Regarding Forward-Looking Statements 11
Leadership in Safety 13
Rapid Growth in Mexico 19
Bringing Technology Services Products to Market 25
Community Relations 31
The Board of Directors 32
Corporate Governance 34
Management’s Discussion and Analysis(including Operations Review) 43
Financial Reporting 76
Supplementary Information 101
Quarterly Financial Summary 104
Shareholder Information 105
Glossary 107
FRONT COVER PHOTO : PRECIS ION RIG 420 , P INK MOUNTAIN , NORTHEAST BRIT ISH COLUMBIA , CANADA
BACK COVER PHOTO : PRECIS ION RIG 724 , BURGOS BASIN , MEXICO
DRILL BIT TEETH RIG CREW – MEXICO
Des
igne
d an
d pr
oduc
ed b
y R
esul
t Inc
.Pr
inte
d in
Can
ada
by S
undo
g Pr
intin
g
cover_sd 3/24/04 6:05 PM Page 2

We operate in some of the world’s most activeand challenging hydrocarbon regions, includingCanada, the United States, Mexico, SouthAmerica, Europe, Africa, the Middle East and Asia/Pacific.
Everything in our business begins with the drill bit– recognizing that a drill bit today must turn,veer, and dive, withstand intense pressure andtemperature – with a view to carve a wellbore trajectory to lead equipment that provides real-time information about subsurface conditionsand location at all times. Precision has been at the forefront of drilling technology for 50 years.
Our business has evolved from contract drilling toincorporate a broad offering of support systemsand services used by our customers in theirdrilling and production programs. Four years agowe diversified further into downhole technologiesthrough our Technology Services segment andtoday we are beginning to roll out new productsthat provide innovative solutions to drilling challenges. By introducing, and often leading,technical innovation within our industry, we areseeing our market share grow around the world.
Precision’s shares are listed on the Toronto StockExchange (PD and PD.U) and the New York StockExchange (PDS).
PRECISION DRILLING CORPORATION is Canada’s largest
oilfield services company, providing contract drilling and technology
services to energy companies around the world.
page1P R E C I S I O N D R I L L I N G C O R P O R A T I O N C O R P O R A T E P R O F I L E
ROTARY STEERABLE SYSTEM WORKING SAFELY WIREL INE UNIT – YEMEN

P R E C I S I O N D R I L L I N G C O R P O R A T I O N
S E G M E N T S T R A T E G Y M A N A G E M E N T
CONTRACT
DRILLING
TECHNOLOGY
SERVICES
RENTAL AND
PRODUCTION
CANADA
Strengthen service capabilities incore businesses.
Focus on being the leader inproviding safe, cost effectivedrilling and well servicing solutionsin conventional and nicheproduction areas.
Look for innovative drilling,snubbing and well servicing solutions through work process andequipment offerings.
Maintain large diverse customer base.
Integrate financial, customer andoperations data through enterpriseaccounting software.
Match capital spending on equipmentwith customer plans.
INTERNATIONAL
Grow international rig count inregions where Precision Drilling’stechnology differentiates us fromcompetition and a significant presence can be established.
Increase international rig countthrough integrated service with otherPrecision product lines.
Diversify employee base to support growth.
CANADA
Dwayne Peters Senior VicePresident, Canadian DrillingOperations
Ron Berg Vice President,Operations
John Jacobsen Vice President,Operations
Doug Evasiuk Vice President,Marketing
Steve James Vice President,Health, Safety andEnvironment
Alex MacAusland GeneralManager, Precision WellServicing
Steve Folk General Manager, Live Well Service
Ross Pickering GeneralManager, LRG Catering Ltd.
Yook Tong General Manager,Rostel Industries Ltd.
Martin Byar General Manager,Columbia Oilfield Supply Ltd.
INTERNATIONAL
Mark Helmer Vice President,International DrillingOperations
Tim Braun OperationsManager
CEDA
Roger Hearn President, CEDA InternationalCorporation
Brian Fitzmaurice VicePresident, Industrial Services
Ian Martin Vice President, Mechanical Services
Greg Kraus Vice President, Catalyst Services
Jeff Grubbs Environmental,Health and Safety Manager
RENTALS
Gene Stahl Vice President,Precision Rentals Ltd.
Jim Hamper OperationsManager, South
Darcy Falardeau OperationsManager, Central
Tom Facette OperationsManager, North
Bob Stockton MarketingManager
John King Senior VicePresident, Technology Services
Rusty Petree Vice President,Corporate Development
Dan Robson Vice President,Drilling Services
Maarten Propper VicePresident, Wireline Services
Carel Hoyer RegionalDirector, Canada
Marwan Bitar RegionalDirector, Middle East
Kurt Beilner RegionalDirector, Europe/Africa
Miles Walker RegionalDirector, Asia/Pacific
Mike Larronde President,Advantage R&D, Inc.
Don Oliver Vice President,Wireline R&D
Martin Kemp Senior QHSEManager
CEDA
Lead North American industrial service providers in safe work practices for our employees.
Develop our competency-basedtraining program to enhance thecareers and safety of our employees.
Focus on developing and deliveringnew tools to the North Americanmarket place.
Market full service contracts to ourclient base that include IndustrialServices, Mechanical Services, and Catalyst Services.
Form alliances to open new markets in the U.S. for CEDA’sspeciality services.
RENTALS
Become a leader in the industry in terms of service and equipment quality.
Be responsive to our customers’growing and changing needs.
Expand product lines to increasecustomer convenience by offering a true one-stop shop for equipment rentals.
Streamline internal operations, andgeographic product concentrationto meet current and near-term customer demand.
Establish a foundation that can expand or shrink to meet market conditions.
Develop fit-for-purpose technologies appropriate for theemerging challenges of the oil and gas industry.
Integrate technologies with customer-focused processes to develop gain-sharecontract structures.
Manage the technologydevelopment strategy in line with key customer drivers.
Respond to customer needs withefficiency and service delivery as key performance indicators.
Focus on delivery of key productlines in specific geographic markets.
Develop a product or service lifetime marketing plan as an integral part of the product development process.
Establish sustainable profitableinternational operations in our chosen regional markets.
Develop strong employee, technicaland business development programs.
Guide our activities based onstringent return on capital metrics.
Work closely with Contract Drillingto grow the integrated servicesbusiness and establish Precision asa global leader in this market niche.
page 2
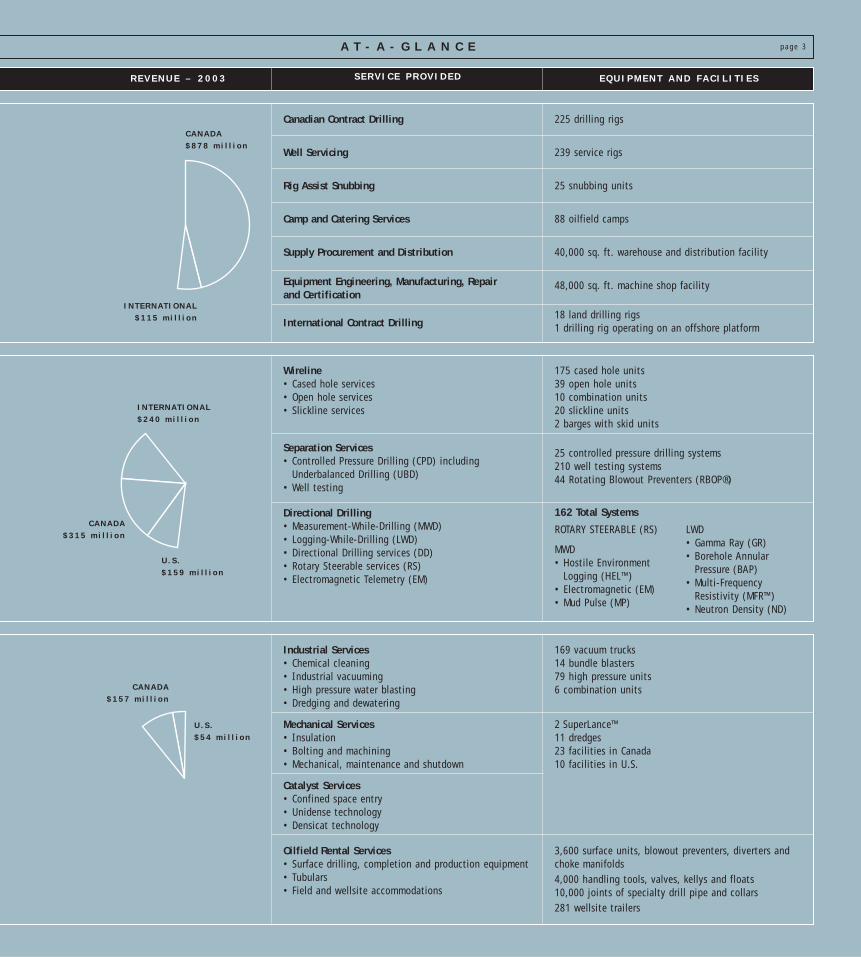
A T - A - G L A N C E
225 drilling rigs
239 service rigs
25 snubbing units
88 oilfield camps
40,000 sq. ft. warehouse and distribution facility
48,000 sq. ft. machine shop facility
18 land drilling rigs1 drilling rig operating on an offshore platform
175 cased hole units39 open hole units10 combination units20 slickline units2 barges with skid units
25 controlled pressure drilling systems210 well testing systems44 Rotating Blowout Preventers (RBOP®)
169 vacuum trucks14 bundle blasters79 high pressure units6 combination units
23 facilities in Canada2 SuperLance™11 dredges23 facilities in Canada10 facilities in U.S.
3,600 surface units, blowout preventers, diverters andchoke manifolds4,000 handling tools, valves, kellys and floats10,000 joints of specialty drill pipe and collars281 wellsite trailers
Industrial Services• Chemical cleaning• Industrial vacuuming• High pressure water blasting• Dredging and dewatering
Mechanical Services• Insulation• Bolting and machining• Mechanical, maintenance and shutdown
Catalyst Services• Confined space entry• Unidense technology• Densicat technology
Oilfield Rental Services• Surface drilling, completion and production equipment• Tubulars• Field and wellsite accommodations
C A N A D A$ 1 5 7 m i l l i o n
U . S .$ 5 4 m i l l i o n
U . S .$ 1 5 9 m i l l i o n
I N T E R N AT I O N A L$ 2 4 0 m i l l i o n
C A N A D A$ 3 1 5 m i l l i o n
C A N A D A$ 8 7 8 m i l l i o n
I N T E R N AT I O N A L$ 1 1 5 m i l l i o n
E Q U I P M E N T A N D F A C I L I T I E SS E R V I C E P R O V I D E DR E V E N U E – 2 0 0 3
162 Total Systems
ROTARY STEERABLE (RS)
MWD• Hostile Environment
Logging (HEL™)• Electromagnetic (EM)• Mud Pulse (MP)
LWD• Gamma Ray (GR)• Borehole Annular
Pressure (BAP)• Multi-Frequency
Resistivity (MFR™)• Neutron Density (ND)
page 3
Canadian Contract Drilling
Well Servicing
Rig Assist Snubbing
Camp and Catering Services
Supply Procurement and Distribution
Equipment Engineering, Manufacturing, Repair and Certification
International Contract Drilling
Wireline• Cased hole services• Open hole services• Slickline services
Separation Services• Controlled Pressure Drilling (CPD) including
Underbalanced Drilling (UBD)• Well testing
Directional Drilling• Measurement-While-Drilling (MWD)• Logging-While-Drilling (LWD)• Directional Drilling services (DD)• Rotary Steerable services (RS)• Electromagnetic Telemetry (EM)
Industry conditions during 2003 provided Precision Drilling Corporation with an
excellent platform for strong financial performance in our core markets and to expand and
develop new markets. Hydrocarbon commodity prices were strong throughout the year,
resulting in increased drilling activity across North America.The rig activity in Canada
reached near record levels, surpassed only in 1997, and revenue in all Canadian businesses
responded accordingly. Our focused approach to targeting and operating in select geographic
regions around the world allowed us to post growth in international drilling as well.
Technology Services was successful in introducing products into new markets as we continue
along the path of increasing market demand for our product suite. Combining all these factors,
the result was the second highest revenue in Precision’s history. More significantly for our
shareholders, however, was our exceptional performance in putting dollars on the bottom
line. Our focus on cost reduction and greater efficiency paid off in 2003 as we saw an increase
in profitability as a percentage of sales that were near record levels. Earnings per share more
than doubled from a year ago to reach $3.41 and pre-tax return on capital employed
increased to 11.4% from 6.4% in 2002.
Clearly we are very pleased with these results.We believe our business model is working
well in Canada and we are continuing to work on the areas of our business where we feel we
can achieve better results.
Looking forward, we expect the operating conditions in 2004 and perhaps even 2005
could mirror 2003. Commodity prices are expected to remain strong and demand for natural
gas in the North American market continues to outstrip supply.The growing demand plus the
gassy nature of the North American sedimentary basins suggests that natural gas drilling
activity will continue to be significant. Non-conventional energy sources – heavy oil and oil
sands – represent the other area of significant growth over the near to long-term.
Precision is ideally positioned in tight natural gas, heavy oil and oil sands – areas of
potential growth. Our equipment is designed for these types of reservoirs and the expertise of
our people is extremely high in these areas. As the market presents the kinds of opportunities
we expect, we believe 2004 and 2005 will be years of sustained profitability and growth.We
intend on taking advantage of these conditions to invest in the international drilling business
P R E C I S I O N D R I L L I N G C O R P O R A T I O N
page4
R E P O R T O F T H E C H I E F E X E C U T I V E O F F I C E R
H A N K B . S W A R T O U TChairman of the Board, President
and Chief Executive Officer
and the Technology Services segment and bring all areas of our business up to an optimal level of
financial and operating performance.
As I look forward to the next two years, it is clear that we have four main initiatives.We will
continue to focus on safety as an issue that is at the crux of our ability to responsibly hire and
retain the people that make our industry work.We have developed a profitable position in the
Canadian market based on technical superiority and we want to continue to optimize that
advantage.We feel that our approach to the international market has been successful and there are
additional opportunities to exploit. Finally, we have vowed to make Technology Services profitable
and we are making significant progress. I will expand on each of these initiatives which are critical
to our long-term performance, and how we intend to achieve our targeted results.
The greatest challenge facing the industry today is the need to develop a well-trained,
operationally reliable, incident-free workforce. Given the cyclical nature of the business, it
has been extremely difficult for industry to attract and keep a consistent level of personnel.
In Canada, for example, working drilling rigs, and therefore demand for crews, varied from a
peak in the first quarter of 2003 at around 600 rigs, dropping to 200 rigs in the second
quarter and increasing to around 450 in the third and fourth quarters of the year. Seasonal
layoffs combined with the typical turnover in the sector means that industry is constantly
hiring and training people to meet peak drilling rig requirements of 12,000 employees. Our
employees work in conditions that are often remote, subject to temperature extremes,
culturally challenging for many and increasingly technically complex. Conditions such as these
are the motivation for industry to put in place an apprenticeship program to enhance rig crew
safety and skills.
Precision has implemented an approach to safety and training that is broad and
comprehensive.We will do whatever we can to make our people better trained and assure
their safety.We have developed safety and training programs that address the 24-hour
A N N U A L R E P O R T 2003
page5R E P O R T O F T H E C H I E F E X E C U T I V E O F F I C E R
I n i t i a t i v e 1 Continue to promote safety in all our operations

experience of our people. In 2002 we introduced a program we call Target Zero™ – It’s
People... It’s Personal – that is intended to focus all our employees on achieving
incident-free working conditions at all times.Through these programs we have established
partnerships that are firsts for our industry, including our unique driver-training program
with the Royal Canadian Mounted Police (RCMP) and safety tours with customers.
On these tours I and other senior management personally bring the senior people from our
customer companies to the rigs and jointly we reinforce the importance of safety practices.
We are also working with the technical institutions, colleges and universities to develop
programs that will encourage people to make our industry a chosen profession and help
support a long-term, permanent work force.We believe these initiatives are good for us and
for our entire industry.
Precision fields Canada’s largest fleet of drilling rigs, snubbing units and the largest
service rig fleet.We have intentionally focused on expanding our fleet in those areas where
we could play to our strengths – by providing specific technology that meets Canadian
drilling demands and through our ability to supply integrated services.Today Precision is
ideally positioned in the areas of the Canadian drilling market that have been expanding and
are expected to continue to grow in the future.
Trends show that drilling for natural gas has exceeded wells with crude oil targets, with
the ratio reaching three to one in 2003. Given the current focus on the sedimentary basin in
western Canada, a significant percentage of natural gas prospects continue to be shallow. In
addition to our niche market coil tubing drilling rigs, a key component of our fleet is the
Super Single® – a rig Precision developed which is ideally suited to drilling shallow gas
wells. It is a compact, well-designed piece of equipment that moves easily, assembles rapidly
P R E C I S I O N D R I L L I N G C O R P O R A T I O N
page6
I n i t i a t i v e 2 Optimize our specialized equipment in the Canadian drilling industry
See our story about Leadership in
Safety on page 13.

and drills wells quickly with a minimum of manpower. Our new generation Super Single®
Light provides even more advantages, with faster tear down/set up capability and greater
operating efficiencies.We currently have two of these new generation Super Single® Light
rigs in the field.The initial feedback from our customers is that these rigs are performing
better than expected and doing equal or better than the coil tubing drilling rigs.
Other areas of growing demand include drilling for heavy oil, oil sands and tight gas
formations like coal bed methane, which require specialized equipment capable of accessing
very specific oil or gas target zones. Again, Precision can offer customers the specialized rigs
and the supporting drilling technology to drill even the most complex, technically
challenging well.
Our customer relationship goes beyond drilling a well to include many additional
services required through the full spectrum of drilling, completion and production.With this
integrated approach, a new and technologically advanced fleet of equipment and a relentless
approach to safety and training, we believe we are well positioned to be one of the most
active and highly profitable participants in the Canadian contract drilling industry.
The worldwide supply of rigs outside Canada has remained relatively stable over the past
decade. Our strategy for growth in the international market includes playing to our strengths,
which is the drilling business.
Precision has 19 rigs around the world, with meaningful potential for growth in 2004.
Our approach has been to find profitable opportunities that match our technical capabilities.
Distribution of Precision’s rigs reflects the areas where we have technical and operating
advantages and, in certain cases, where the operator has chosen Precision after a previous
experience with our Corporation.
A N N U A L R E P O R T 2003
page7R E P O R T O F T H E C H I E F E X E C U T I V E O F F I C E R
I n i t i a t i v e 3 Create opportunities to expand international contract drilling

P R E C I S I O N D R I L L I N G C O R P O R A T I O N
page8
Our largest international program and most significant success has been in Mexico where
we ended the year with 10 rigs operating.The combination of Precision’s highly portable,
efficient drilling equipment and technically advanced measurement and steering tools is meeting
the requirements of the Mexican national energy company for a drilling and production
program that aims to increase natural gas supplies quickly. In 2004, Precision will complete a
drilling program that was expanded during 2003 from 240 to over 600 wells and expects to
bid on other contracts as they are presented.
The Corporation also has four rigs in Venezuela that were more active in 2003 than
2002, however, overall industry activity was dampened by the financial crisis and labour
strike at the end of 2002 and beginning of 2003. Nonetheless, Precision’s drilling operations
were relatively unaffected by this event. Currently, our rig fleet in Venezuela is fully utilized
with expected high utilization throughout 2004.
At the end of 2003 Precision deployed a 2,000 horsepower drilling rig to the Middle
East to undertake a deep drilling program using equipment built and configured to meet
customer requirements. In the Asia/Pacific region we carried full utilization with a Super
Single® rig mobilized in July 2002. Our second rig in the region will be mounted on an
offshore platform and is expected to begin drilling a 20-well program in the second quarter
of 2004.
Our strategy for the international market is to continue to build critical mass in select
markets. In all cases, we have and will continue to introduce high quality equipment to each
market, supported by good maintenance programs and highly skilled personnel. Our values
regarding safety and training apply equally to our international operations.We believe the
value proposition – good equipment, good maintenance programs, good people, comprehensive
services – is as appealing to international customers as it has been to our Canadian customers.
See our story about Rapid Growth in
Mexico on page 19.

Technology Services represents an area of exciting growth opportunities for Precision.
We know that today, just as we knew that a year ago when we featured this segment in our
2002 Annual Report.What we perhaps did not fully appreciate a year ago was the time and
effort that would be required to re-focus the operations, marketing and manufacturing
structure around the products that were emerging from R&D into field testing. In 2003
we spent considerable time on rationalizing that infrastructure and while our expectations
around timing have been tempered, our enthusiasm for the potential of these products is
as strong as ever.
During 2003 our new management team restructured the operations of this group,
focusing on those products with the promise of near-term market development and an
adequate return on invested capital.This process required reductions in operating costs and
shifting the skill sets of our people to include marketing and product development.We
narrowed our product grouping down to three areas: directional services, wireline services
and separation services.As well, we undertook a market analysis to refine our expectations as
to the location, size and quality of the potential geographic markets for our new generation
drilling tools. Besides Canada, our focus is on four main markets around the world (U.S.,
Mexico, the Middle East, and the Asia/Pacific region) and specific initiatives for entering and
working in those markets.There are a number of products in various stages of market
development and we will continue to refine the structure of the organization as we proceed.
Our objective is to deliver year over year improvement in quarterly earnings. Our goal
is for Technology Services to be self-sustaining in terms of profitability and reinvestment by
2006. As I look at the evolution of Technology Services, I am confident we will be able to
follow through on that promise. Our science is strong, our understanding of the marketplace
is deep and broad, our management is highly experienced, and our commitment to make this
work is unwavering.
A N N U A L R E P O R T 2003
page9R E P O R T O F T H E C H I E F E X E C U T I V E O F F I C E R
I n i t i a t i v e 4 Complete the turnaround of Technology Services
See our story about Bringing
Technology Services Products to
Market on page 25.

The 2004 year is exciting, as it presents both opportunities and possibilities.We have
built an extremely competent team of people who are committed to our values and our
growth.Within our group are a great number of people who understand all aspects of our
business and add value to our organization every day. I am confident that, as the Corporation
evolves our management team has the breadth and depth to maintain the strategic and
profitable growth that has characterized Precision to this point.The business of our
Corporation is much more complex today than when I started, but there is a simple truth that
still applies – “that you get an honest day’s pay for an honest day’s work.” I think every one of
the close to 12,000 people that work for this Corporation believes that too. I want to thank
them for their contributions towards Precision’s success.
On behalf of the Board of Directors,
P R E C I S I O N D R I L L I N G C O R P O R A T I O N
page10
H A N K B . S W A R T O U TChairman of the Board, President and Chief Executive Officer
March 10, 2004
Certain statements contained in this annual report, including statements which may contain words such as “could”, “should”, “expect”, “estimate”, “likely”, “believe”, “will” andsimilar expressions and statements relating to matters that are not historical facts are forward-looking statements including, but not limited to, statements as to: future capitalexpenditures, including the amount and nature thereof; oil and gas prices and demand;expansion and other development trends of the oil and gas industry; business strategy;expansion and growth of the Corporation’s business and operations, including theCorporation’s marketshare and position in the domestic and international drilling markets;and other such matters.
These statements are based on certain assumptions and analyses made by the Corporationin light of its experience and its perception of historical trends, current conditions and expectedfuture developments, as well as other factors it believes are appropriate in the circumstances.However, whether actual results, performance and achievements will conform with theCorporation’s expectations and predictions is subject to a number of risks and uncertaintieswhich could cause actual results to differ materially from the Corporation’s expectations,including: fluctuations in the price and demand of oil and gas; fluctuations in the level of oiland gas exploration and development activities; fluctuations in the demand for well servicing,contract drilling and ancillary oilfield services; the existence of competitors, technologicalchanges and developments in the oil and gas industry; the ability of oil and gas companies toraise capital; the effects of severe weather conditions on operations and facilities; the existenceof operating risks inherent in the well servicing, contract drilling and ancillary oilfield services;political circumstances impeding the progress of work in any of the countries in which theCorporation does business; identifying and acquiring suitable acquisition targets on reasonableterms; general economic, market or business conditions, including stock market volatility;changes in laws or regulations, including taxation, environmental and currency regulations; thelack of availability of qualified personnel or management; and other unforeseen conditionswhich could impact on the use of services supplied by the Corporation.
Consequently, all of the forward-looking statements made in this report are qualified by these cautionary statements and there can be no assurance that the actual results or developments anticipated by the Corporation will be realized or, even if substantiallyrealized, that they will have the expected consequences to or effects on the Corporation or its business or operations.The Corporation assumes no obligation to update publiclyany such forward-looking statements, whether as a result of new information, future events or otherwise.
A N N U A L R E P O R T 2003
page11page
D I S C L O S U R E R E G A R D I N G F O R WA R D - L O O K I N G S TAT E M E N T S
P R E C I S I O N D R I L L I N G C O R P O R A T I O N
page12
J O H N K I N GSenior Vice President,
Technology Services
D W A Y N E P E T E R SSenior Vice President,
Canadian Drilling Operations
M A R T I N K E M PSenior QHSE Manager
S T E V E J A M E SVice President, Health, Safety and Environment

A N N U A L R E P O R T 2003
page13
Working in the oil and gas industry holds inherent risks and as such requires a continuous
focus towards working safely by all on-site personnel.That puts Precision, Canada’s largest
oilfield services company and a growing player in the international market, front and centre
in the energy industry’s efforts to ensure workplace safety.
“We have a vision for our Corporation and having a safe operating environment is the heart
and soul of that vision,” Hank Swartout, Precision’s Chairman, President and Chief Executive
Officer, said after visiting several of the Corporation’s Canadian rig sites in early 2003. “Every
single one of our employees should be able to complete each shift as healthy as he or she began
it. Precision owes that to them. Moreover, our employees owe it to themselves, their families and
friends. It falls to all of us in this Corporation to be safety leaders.”
Precision sponsors an annual “Safety Stand-Down Week” during which senior managers
including Hank Swartout visit field locations throughout western Canada. Meeting with front
line workers and discussing safety demonstrates and reinforces the commitment we hold
toward working safely.The safety week is part of Precision’s broad ranging and industry-leading
Target Zero™ vision. Although Precision has long had a safety program, the Corporation
launched Target Zero™ – It’s People... It’s Personal – in 2002 to give even greater meaning,
momentum and focus to the Corporation’s initiatives and safety efforts.
As its name suggests,Target Zero’s™ lucid message to Precision’s employees, customers
and industry counterparts is that the Corporation is aiming to achieve zero incidents every
year, and day-by-day, is improving on each year’s performance.While the Corporation fully
accepts its responsibility of taking the lead role in creating and maintaining a safe working
environment,Target Zero™ also aims to empower employees.
“We need the commitment and support of all employees to ensure that zero is achievable
by making safety a part of their daily routine,” says Hank Swartout. “In a world where
everything we do on the job can affect ourselves, our colleagues or the communities in which
we work, there really can be no other possible target.” Precision has structured Target Zero™
with a view to instilling a safety culture throughout the organization, whether employees are
operating in Arctic regions, in the Western Canada Sedimentary Basin, in international locations
such as Mexico or the Middle East or in the Corporation’s head office in Calgary, Alberta.
L E A D E R S H I P I N S A F E T Y
Precision has structured Target Zero™
with a view to instilling a safety
culture throughout the organization
where the aim is to achieve
zero incidents.
Between 2001 and 2003, Precision
realized a 31 percent decrease in
its total recordable injury frequency,
meaning there were 281 fewer
recordable incidents in 2003.

Charged with leading Target Zero™ is Precision’s Health, Safety and Environment (HSE)
team, which is made up of 20 professionals from Contract Drilling, 23 from Technology
Services and 26 from Rental and Production, who combined have accumulated vast experience
developing and implementing HSE programs for better workplace safety.
Through training and development programs, the HSE team transfers its knowledge to
all Precision employees. In 2003 thousands of Precision employees attended multiple training
courses that provided insightful health, safety and environmental awareness.Training starts as
soon as, or sometimes even before, an employee joins the Corporation. Since 1998, Precision
has invested hundreds of thousands of dollars to support our initiative at our Nisku, Alberta
training facility, where new drilling rig employees attend a rigorous orientation program.
Even some prospective employees may participate to give them a full picture of what their job
would entail and help them understand and feel comfortable with the job requirements.
Class participants are introduced to personal protective equipment, on and off the job
protection and seat belt safety – a session that is presented by the Royal Canadian Mounted
Police (RCMP). Later, candidates participate in ‘real life’ drilling scenarios using Precision’s
rig floor simulator.The training sessions also use a variety of media including slide presentations,
videos and guest speakers – all designed to provide a complete and realistic look at the life of
a roughneck. In remote regions where assembling our employees into a centralized training
facility is not practical, Precision capitalizes on the expertise of either local contract trainers
or internal personnel to provide orientation and job skill training.
This training is imperative for all segments of Precision. Jeff Grubbs, Environmental,
Health and Safety Manager of CEDA International Corporation explains, “Our training
programs are continuously monitored and revised to remain applicable to the advancing
technologies of our industry. Our employees are expected to go through very extensive and
ongoing training with respect to health, safety, and the environment.This knowledge is taken
to the field and controls their everyday activities, both on and off the job. It is this level of
commitment and awareness that paves the road towards Target Zero™.”
“The orientation is the introduction to our Corporation, and safety needs to be front and
centre. It’s an intensive program that is proven to have a significant impact on our employees,”
P R E C I S I O N D R I L L I N G C O R P O R A T I O N
page14
RCMP presentation on vehicle safety – one ofthe many courses Precision offers its employeeseach year.

says Steve James, Contract Drilling’s Vice President, Health, Safety and Environment.
“The program is highly representative of Precision’s ongoing commitment to safety.”
Precision supplements its classroom training with ongoing field training, which includes
observation and communication workshops for supervisors, driver training, hazard
identification and control techniques, environmental awareness, and much more.
Internationally, Precision has dedicated health, safety and environment professionals in
regional centres, whose focus is incident prevention through careful employee selection, and
then the development, implementation and monitoring of safety systems.
The Target Zero™ vision extends outside the Corporation to Precision’s customers who
are invited to participate in its internal observation and communication training program.
This gives customers a first-hand look at the training that Precision’s site supervisors go
through. Customers can take what they learn and transfer that knowledge to their operations
and the wellsite.
Precision’s HSE initiatives also reach out to the whole petroleum industry. As an active
member of the Canadian Association of Oilfield Drilling Contractors (CAODC), the
Canadian Petroleum Safety Council and the Petroleum Services Association of Canada,
Precision is sharing its experience with these groups while also learning from its peers. In a
collaborative effort with the RCMP, Precision produced a seat belt awareness video that it
distributed industry-wide.
“We can look at safety many different ways,” says Martin Kemp, Senior QHSE Manager,
Technology Services. “In order to maintain our continuous motivation toward Target Zero™
we must hold personal ownership toward protecting our greatest asset, people. People are
what safety is all about. From a financial point of view, industry leading safety performance
correlates with industry leading productivity,” says Mr. Kemp. “That’s a worthwhile investment
and one that we make consistently, whether we are at the high point or the low point of the
drilling cycle.”
But when you get right down to it, safety is about people; our employees working
collaboratively and smartly between themselves and with customers. It’s about teamwork and
getting the job done the best way possible.
A N N U A L R E P O R T 2003
page15
Precision supplements its classroom
training with ongoing field training,
which includes observation and
communication workshops for
supervisors, driver training, hazard
identification and control techniques,
environmental awareness, and
much more.
Employees training on rig floor simulator.
L E A D E R S H I P I N S A F E T Y

P R E C I S I O N D R I L L I N G C O R P O R A T I O N
page16
F R A N C I S C O L O P E ZIntegrated Services Manager, Mexico
M A R K H E L M E RVice President, International Drilling Operations
J U L I O C U M A N ABurgos Project Manager, Mexico
T I M B R A U NOperations Manager, International Drilling

A N N U A L R E P O R T 2003
page17
PRECIS ION RIG 723 IN TAMAULIPAS , MEXICO

P R E C I S I O N D R I L L I N G C O R P O R A T I O N
page18
Pemex approachedPrecision,interested inPrecision’s world-leading drillingexpertise
00 Precision awarded a US$270 millionjoint venture contract in Mexico’sBurgos Basin
01 Entered Mexico tobegin drilling of the240 well program inthe Burgos Basin
01 Pemex awardsPrecision a contractextension worth US$61 million
02 Pemex extendedPrecision’s contract,worth US$340 million, to drill anadditional 285 gaswells in the Burgos Basin
03
STAGING OUR ENTRY TO THE MEXICAN MARKET

When opportunity knocked for Precision in Mexico, the Corporation was more than
ready to turn opportunity into success.
“Think about it,” says Francisco Lopez, Precision’s Integrated Services Manager, Mexico.
“We signed our first multi-million dollar contract in 2001 and have already extended it
several times, also for multi-million dollar amounts.This didn’t happen by chance. In Mexico,
we are proving just how successfully Precision’s state-of-the-art drilling technology can be
transferred to international markets.”
Petróleos Mexicanos (Pemex), Mexico’s state-run oil company and one of the largest
petroleum companies in the world, first approached Precision in the summer of 2000. Pemex
was interested in the potential for Precision to apply its broad, world-leading drilling expertise
to the strategically-important Burgos Basin, Mexico’s largest non-associated natural gas field.
Spanning more than 50,000 square kilometres in the northeastern states of Tamaulipas and
Nuevo León along the Texas border, the Burgos Basin has an estimated 75 trillion cubic feet
(tcf) of untapped natural gas reserves. For Mexico, successful and rapid development of the
Burgos Basin is critical to meeting the country’s growing demand for natural gas.The country
as a whole has an estimated 845 tcf of natural gas reserves and 12.6 billion barrels of proven
crude oil reserves.
Precision embraced the Mexico opportunity.We knew we could meet Pemex’s need for
high performance safe drilling. Moreover, the opportunity fit perfectly with the Corporation’s
strategy to expand operations internationally into markets where Precision can both add value
and be profitable. In early 2001, Pemex invited Precision to tender for an integrated services
contract to turnkey the delivery of 240 non-associated gas wells against the industry’s largest
services providers and in February of that year Precision and its joint venture partner won a
US$270 million contract to deliver the project. At the time, this was the largest on-shore
drilling contract ever awarded in Mexico.
Precision acted quickly, and by May, had the first of five drilling rigs operating in Mexico.
“I believe that the speed at which Precision works both in rig construction and delivering
wells was a key factor in our winning this contract and the subsequent contract extension,”
says Mark Helmer, Precision’s Vice President, International Drilling Operations.
A N N U A L R E P O R T 2003
page19
R A P I D G R O W T H I N M E X I C O
ReynosaBurgos Basin
Mexico City
Veracruz

“We can deliver our product quickly and on time, anywhere in the world. Precision’s
specially-configured drilling equipment has reduced drilling time per well significantly in the
Burgos Basin and set the performance benchmark for subsequent projects. Moreover, due to a
compact, fit-for-purpose design we can move our rigs quickly and safely from one wellsite
to another.”
In 2002, Pemex awarded the joint venture a contract extension worth US$61 million
and as a result Precision brought in two more rigs to the Burgos field.
Then, in 2003, the joint venture won a contract extension that is worth more than the
other two contracts combined – US$340 million for an additional 285 gas wells. By the
fourth quarter of 2003, Precision had a total of 10 rigs operating in Mexico. Precision is
projecting continuous drilling for the 10-rig fleet until January 2005. In total, Precision will
drill an estimated 605 wells under the current contract with Pemex, twice the number of
wells as its leading competitor.
Precision serves as the lead contractor and project manager, providing supervisory
staff, wellsite construction, well design, engineering and construction, drilling rigs,
directional drilling, flowline hookups, wireline, logging-while-drilling (LWD),
measurement-while-drilling (MWD), production testing, and drill bits. Our joint venture
partner for their part provides the cementing, fracturing and coiled tubing required to
complete the well.
Precision’s rigs are ideally designed to meet the drilling requirements of the Burgos field’s
geology, drilling wells in depth range from 900 to 3,500 metres with multiple target zones.
For example, Precision uses its PD 721 and PD 735 Super Single® rigs which drill
shallow and medium-depth wells more economically and faster than traditional jack-knife and
telescopic doubles.The Super Single®, incorporating a hydraulic pipe handling system, top
drive and power wrench among other advancements, is more versatile, efficient and safer to
work on than conventional drilling rigs.
“Precision’s rigs are the only ones of their kind in Mexico in terms of size, speed and
mobility,” says Mr. Lopez. “Not only is our technology unique, we also offer greater automation,
which, in the drilling world, means less room for human error, greater safety for the rig
operators and faster drilling speeds.”
P R E C I S I O N D R I L L I N G C O R P O R A T I O N
page20
“I believe that the speed at which
Precision works both in rig
construction and delivering wells was
a key factor in our winning this
contract and the subsequent contract
extension,” says Mark Helmer,
Precision’s Vice President,
International Drilling Operations.
In Mexico, Precision serves as the
lead contractor and project manager,
providing supervisory staff, wellsite
construction, well design, engineering
and construction, drilling rigs,
directional drilling, flowline hookups,
wireline, logging-while-drilling,
measurement-while-drilling,
production testing, and drill bits.
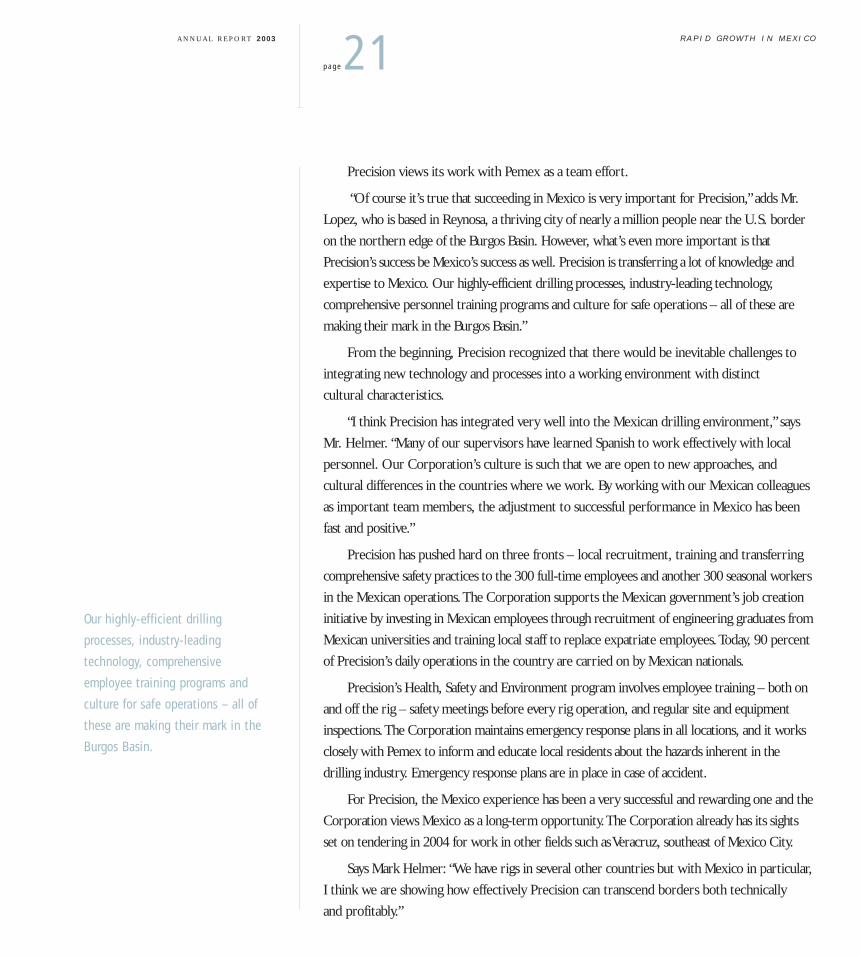
Precision views its work with Pemex as a team effort.
“Of course it’s true that succeeding in Mexico is very important for Precision,” adds Mr.
Lopez, who is based in Reynosa, a thriving city of nearly a million people near the U.S. border
on the northern edge of the Burgos Basin. However, what’s even more important is that
Precision’s success be Mexico’s success as well. Precision is transferring a lot of knowledge and
expertise to Mexico. Our highly-efficient drilling processes, industry-leading technology,
comprehensive personnel training programs and culture for safe operations – all of these are
making their mark in the Burgos Basin.”
From the beginning, Precision recognized that there would be inevitable challenges to
integrating new technology and processes into a working environment with distinct
cultural characteristics.
“I think Precision has integrated very well into the Mexican drilling environment,” says
Mr. Helmer. “Many of our supervisors have learned Spanish to work effectively with local
personnel. Our Corporation’s culture is such that we are open to new approaches, and
cultural differences in the countries where we work. By working with our Mexican colleagues
as important team members, the adjustment to successful performance in Mexico has been
fast and positive.”
Precision has pushed hard on three fronts – local recruitment, training and transferring
comprehensive safety practices to the 300 full-time employees and another 300 seasonal workers
in the Mexican operations.The Corporation supports the Mexican government’s job creation
initiative by investing in Mexican employees through recruitment of engineering graduates from
Mexican universities and training local staff to replace expatriate employees.Today, 90 percent
of Precision’s daily operations in the country are carried on by Mexican nationals.
Precision’s Health, Safety and Environment program involves employee training – both on
and off the rig – safety meetings before every rig operation, and regular site and equipment
inspections.The Corporation maintains emergency response plans in all locations, and it works
closely with Pemex to inform and educate local residents about the hazards inherent in the
drilling industry. Emergency response plans are in place in case of accident.
For Precision, the Mexico experience has been a very successful and rewarding one and the
Corporation views Mexico as a long-term opportunity.The Corporation already has its sights
set on tendering in 2004 for work in other fields such as Veracruz, southeast of Mexico City.
Says Mark Helmer: “We have rigs in several other countries but with Mexico in particular,
I think we are showing how effectively Precision can transcend borders both technically
and profitably.”
A N N U A L R E P O R T 2003
page21R A P I D G R O W T H I N M E X I C O
Our highly-efficient drilling
processes, industry-leading
technology, comprehensive
employee training programs and
culture for safe operations – all of
these are making their mark in the
Burgos Basin.

P R E C I S I O N D R I L L I N G C O R P O R A T I O N
page22
D A N R O B S O NVice President, Drilling Services
R U S T Y P E T R E EVice President, Corporate Development
K U R T B E I L N E RRegional Director, Europe/Africa
M A R W A N B I T A RRegional Director, Middle East

A N N U A L R E P O R T 2003
page23
PRECIS ION ’ S TECHNOLOGY IS UT IL IZED IN THE GULF OF MEXICO

P R E C I S I O N D R I L L I N G C O R P O R A T I O N
page24
M I K E L A R R O N D EPresident, Advantage R&D, Inc.
D O N O L I V E RVice President, Wireline R&D
M A A R T E N P R O P P E RVice President,Wireline Services
C A R E L H O Y E RRegional Director, Canada

A N N U A L R E P O R T 2003
page25
B R I N G I N G T E C H N O L O G Y S E R V I C E SP R O D U C T S T O M A R K E T
Precision and our customer working together
By listening to and understanding our customers we determine their needs.
OPPORTUNITY IDENTIFICATION
We then review the potential for this tool or service from a global perspective, to define target specifications and to establish a lifetime marketing plan.
MARKETASSESSMENT
The target specifications are summarized in an engineering context.
CONCEPTUALDESIGN
Prototypes are developed to confirm the ability to meet target technical and commercial specifications.
ENGINEERING & DEVELOPMENT
Subsurface conditions are re-created in the Engineering Centres to evaluate the performance of the new tool.
BENCH TESTING
Tools and services are tested in market environments. Field testing is carried out in all appropriate environments and conditions pertinent to the market application. Both surface and downhole reservoir conditions are taken into account when selecting appropriate field test locations.
FIELD TESTING
Product is launched, starting with field employee training, followed by the roll out to target markets.
COMMERCIALIZATION
Precision’s internal work to develop the tool
2003 has seen the evolution of Technology Services into a technology delivery organization.
Today, Precision has many technology development initiatives underway at each of our
research and development facilities in North America and Europe.While some of these
projects are actually focused on developing new “game changing” technologies, particular to
different operating regions across the globe, many are merely upgrades or modifications of
existing tools required to address specific needs of customers. Our ability to develop and
commercialize fit-for-purpose technologies for almost any operating region or environment is
the cornerstone of Precision’s strategic model. Our development process leads to a full
commercialization of each tool as illustrated in the flowchart below.
P R E C I S I O N D R I L L I N G C O R P O R A T I O N
page26
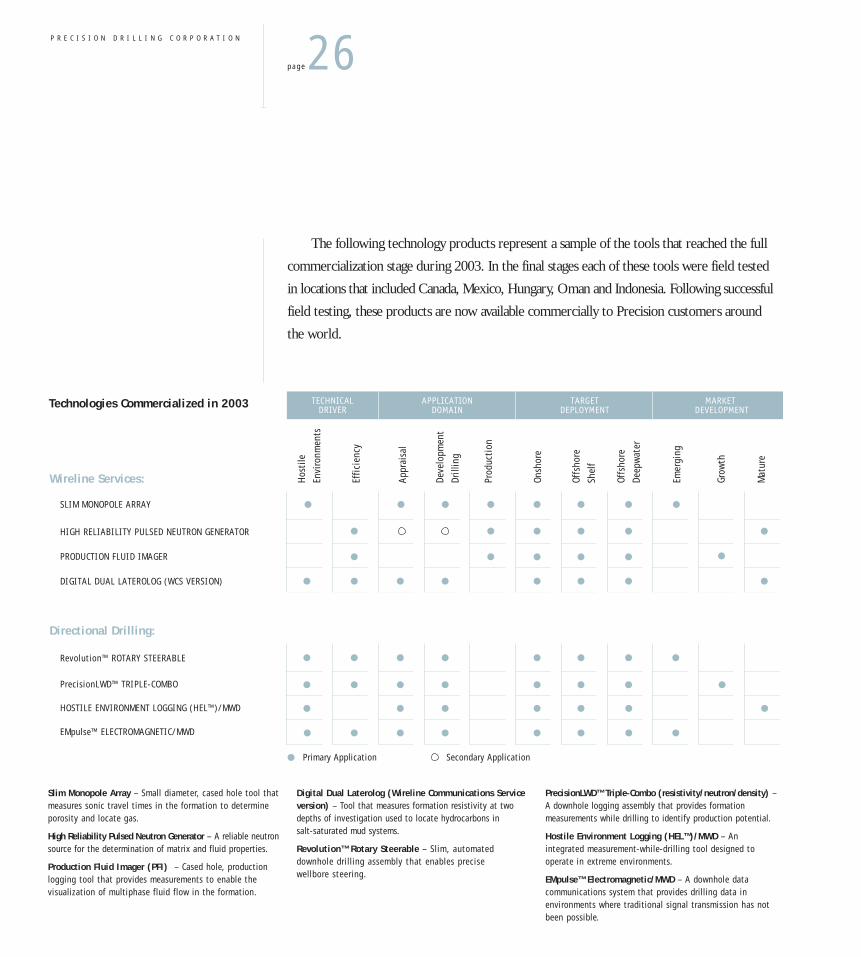
The following technology products represent a sample of the tools that reached the full
commercialization stage during 2003. In the final stages each of these tools were field tested
in locations that included Canada, Mexico, Hungary, Oman and Indonesia. Following successful
field testing, these products are now available commercially to Precision customers around
the world.
Slim Monopole Array – Small diameter, cased hole tool thatmeasures sonic travel times in the formation to determineporosity and locate gas.
High Reliability Pulsed Neutron Generator – A reliable neutronsource for the determination of matrix and fluid properties.
Production Fluid Imager (PFI) – Cased hole, productionlogging tool that provides measurements to enable thevisualization of multiphase fluid flow in the formation.
Digital Dual Laterolog (Wireline Communications Serviceversion) – Tool that measures formation resistivity at twodepths of investigation used to locate hydrocarbons in salt-saturated mud systems.
Revolution™ Rotary Steerable – Slim, automateddownhole drilling assembly that enables precise wellbore steering.
PrecisionLWD™ Triple-Combo (resistivity/neutron/density) –A downhole logging assembly that provides formationmeasurements while drilling to identify production potential.
Hostile Environment Logging (HEL™)/MWD – Anintegrated measurement-while-drilling tool designed tooperate in extreme environments.
EMpulse™ Electromagnetic/MWD – A downhole datacommunications system that provides drilling data inenvironments where traditional signal transmission has notbeen possible.
Hos
tile
Envi
ronm
ents
Effi
cien
cy
Appr
aisa
l
Deve
lopm
ent
Drill
ing
Prod
ucti
on
Emer
ging
Grow
th
Mat
ure
Onsh
ore
Offs
hore
Shel
f
Offs
hore
Deep
wat
er
SLIM MONOPOLE ARRAY
DIGITAL DUAL LATEROLOG (WCS VERSION)
HIGH RELIABILITY PULSED NEUTRON GENERATOR
PRODUCTION FLUID IMAGER
Wireline Services:
Technologies Commercialized in 2003
Revolution™ ROTARY STEERABLE
HOSTILE ENVIRONMENT LOGGING (HEL™)/MWD
EMpulse™ ELECTROMAGNETIC/MWD
PrecisionLWD™ TRIPLE-COMBO
Directional Drilling:
Primary Application Secondary Application

Drilling wells in as few bit runs as possible can result in significant cost reductions.These
solutions make Precision's Revolution™ Rotary Steerable service particularly applicable to
drilling in Mexico.The Precision Revolution™ slimhole Rotary Steerable system was used to
drill a well vertically to a predetermined location, then “kick-off-from-the-vertical” to a 57°
inclination and eventually complete the horizontal section, all in a single bit run.This
innovative system, only available from Precision, eliminates the expense of rig time required
to alter drill string configurations that previously have been necessary to drill complex well
configurations with vertical, deviated and horizontal sections.
A N N U A L R E P O R T 2003
page27B R I N G I N G T E C H N O L O G Y S E R V I C E S P R O D U C T S T O M A R K E T
Case Study: Mexico
Revolution™ ROTARY STEERABLE
Case Study: Yemen
WIRELINE SERVICES
Case Study: Indonesia
PrecisionLWD™ TRIPLE-COMBO
In a remote, maturing oil field in the Yemen desert, Precision mobilized and constructed
a complete self-sufficient wireline operation, on time and without disruption to our customer’s
ongoing operations.The mobilized equipment included a suite of fit-for-purpose tools
designed to provide wellbore characterization in wells ranging from 5,000 to 10,000 feet
deep, accurately and with exceptional reliability.The customer’s specific technology
requirements required development of several new tools, which were developed by
Precision’s internal wireline research and development organization.
Balancing offshore rig cost against time taken for data acquisition to give accurate
formation information has always been a challenge. Our customer came to us with just that
challenge and we delivered.The PrecisionLWD™ Triple-Combo logged wells at a drilling
rate of more than 400 feet per hour, more than twice the industry standard, providing
real-time wireline quality data. For our customer, faster logging meant lower rig costs
and greater efficiency.

P R E C I S I O N D R I L L I N G C O R P O R A T I O N
page28
J O H N J A C O B S E NVice President, Operations
R O N B E R GVice President, Operations
A L E X M a c A U S L A N DGeneral Manager, Precision Well Servicing
D O U G E V A S I U KVice President, Marketing
A N N U A L R E P O R T 2003
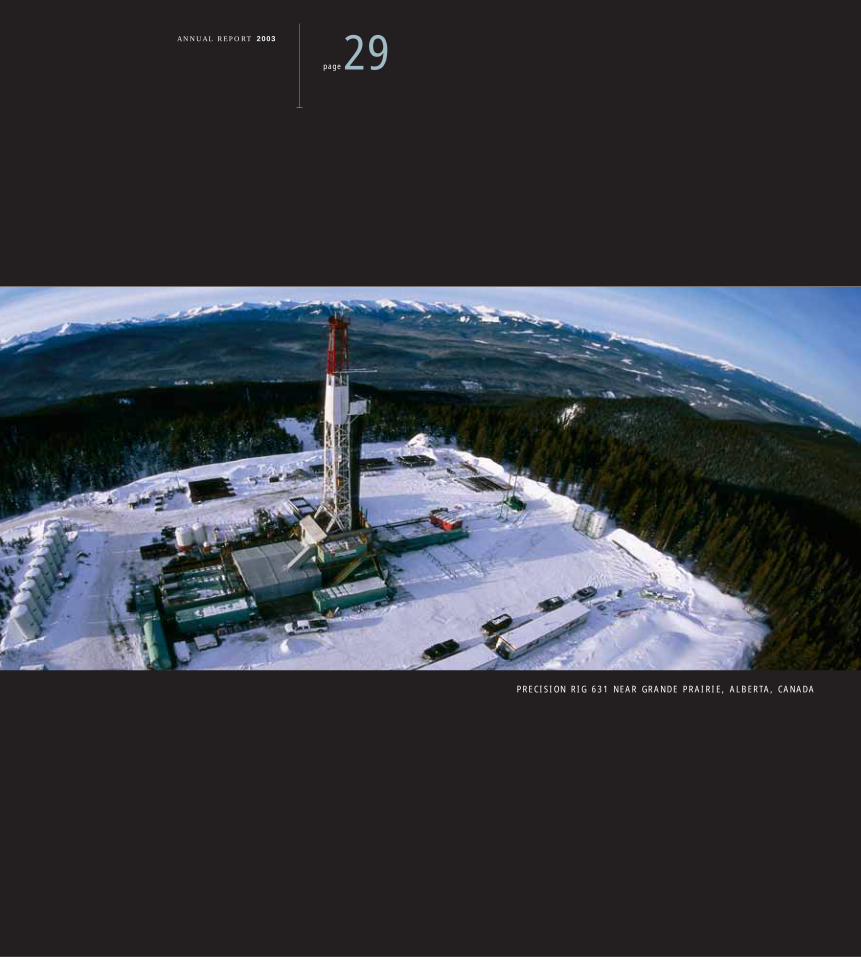
page29
PRECIS ION RIG 631 NEAR GRANDE PRAIRIE , ALBERTA , CANADA

P R E C I S I O N D R I L L I N G C O R P O R A T I O N
page30
R O G E R H E A R NPresident, CEDA International Corporation
G E N E S T A H LVice President, Precision Rentals Ltd.
B R I A N F I T Z M A U R I C EVice President, Industrial Services
B O B S T O C K T O NMarketing Manager, Rentals

Precision’s Community Relations program plays an important role in being a good
corporate citizen by strengthening our presence in the communities in which we operate.
In 2003, our Corporate Donations program fulfilled over 60 percent of requests
received from our employees, customers, the communities in which we do business, and
registered charitable organizations.These requests fall into 11 categories, including rural
and urban community; international aid; women’s groups; youth; aboriginal; medical and
disabilities; the arts; the homeless; educational; the environment; and political. In order to
provide ongoing support, a number of the donations are made over a three to five-year
period, including those to the Alberta Children’s Hospital Foundation, shelters for abused
women and children, medical research and education.
In addition, Precision is proud to sponsor a number of events throughout the year that
provide proceeds to charitable organizations such as Shock Trauma Air Rescue Society (STARS),
Ronald McDonald House and the Calgary Drop-In Centre.
While Precision provides corporate support, our employees and their families are equally
committed to the communities in which they live.This commitment includes volunteering for
local charities; participating in events supporting breast cancer, diabetes and other research;
participating in United Way’s ‘Days of Caring’ program; adopting families of the less fortunate
during the holiday season; coaching sports teams; and participating in local arts programs.
Precision also recognizes the value of a post-secondary education.The Corporation
supports children of employees through its Employees’ Dependent Children Scholarship
Program. Scholarships are awarded to applicants who demonstrate superior academic
performance, work experience and community leadership.
A N N U A L R E P O R T 2003
page31
C O M M U N I T Y R E L A T I O N S
Precision’s philosophy of giving
back to the community is one that
we are proud to share with all of our
stakeholders and the communities in
which we work and live.
Precision employees volunteer by serving lunch at the Mustard Seed Street Ministry.

P R E C I S I O N D R I L L I N G C O R P O R A T I O N
page32
T H E B O A R D O F D I R E C T O R S
W. C . ( M I C K E Y ) D U N N R O B E R T J . S . G I B S O N PAT R I C K M . M U R R AY F R E D E R I C K W. P H E A S E Y
H A N K B . S WA R T O U T M U R R AY K . M U L L E N
H . G A R T H W I G G I N S

A N N U A L R E P O R T 2003
page33
T H E B O A R D O F D I R E C T O R S
W.C . (M ICKEY) DUNN (2)(3)
EDMONTON, ALBERTA
Mr. Dunn has been a member of Precision’s Board of
Directors since September 1992. He has held the
position of Chairman of True Energy Ltd., a publicly
traded oil and gas exploration company since January
2000. Previously he was President and a Director of
Cardium Service and Supply Limited.
ROBERT J . S . G IBSON (1)(3)
CALGARY, ALBERTA
Mr. Gibson has been President of a private investment
firm, Stuart & Company Limited, since 1973 and is also
Managing Director of Alsten Holdings Ltd. He has been
a Director of Precision since June 1996.
MURRAY K . MULLEN (2)
CALGARY, ALBERTA
Mr. Mullen joined Mullen Trucking Ltd. in 1977 and is
currently Chairman, President and Chief Executive
Officer of Mullen Transportation Inc., a publicly traded
company whose shares are listed on the Toronto Stock
Exchange. Mr. Mullen has been a Director of Precision
since September 1996 and continues to be active in a
number of industry and community organizations.
PATR ICK M . MURRAY (1)
DALLAS , TEXAS
Mr. Murray is Chief Executive Officer of Dresser Inc.,
and has been a Director of Precision since July 2002.
A member of the American Petroleum Institute and the
Society of Petroleum Engineers, Mr. Murray is also
a board member of the World Affairs Council of Greater
Dallas, the Valve Manufacturers Association, the
Petroleum Equipment Suppliers Association and
Houston-based Harvest Natural Resources Inc.
FREDER ICK W. PHEASEY (3)
EDMONTON, ALBERTA
Mr. Pheasey is currently the Executive Vice President
and a Director of National-Oilwell Inc. Previously he
was the founder and Board Chairman of Dreco Energy
Services, which was acquired by National-Oilwell in
1997. Mr. Pheasey has been a Director of Precision
since July 2002.
HANK B. SWARTOUT
CALGARY, ALBERTA
Mr. Swartout has been Chairman, President and Chief
Executive Officer of Precision since 1985. Previously he
held positions as Manager of Bawden Western Oceanic
Offshore, Vice President of Rig Design and Construction
for Dreco, and Manager of Construction for Nabors
Drilling Canada.
H. GARTH WIGG INS (1)
CALGARY, ALBERTA
Mr. Wiggins has been the President of a private
investment firm, Kamloops Money Management, since
1993. He is also currently a Principal of Kenway,
Mack, Slusarchuk, Stewart Chartered Accountants.
Previously he was Vice President Finance and Chief
Financial Officer of Tri Link Resources Ltd. and a
partner of Farvolden, Wiggins, Balderston Chartered
Accountants. He has been a Director of Precision since
September 1997.
(1) Audit Committee member(2) Compensation Committee member(3) Corporate Governance and Nominating Committee member
Precision’s Board of Directors is comprised of experienced, proven leaders representing a diverse group of
professions and industries in Canada and the United States.Together, the Directors work to help Precision realize
its full potential by sharing their creative vision, initiative and sense of how outside events and developments can
affect Precision’s future.They bring sound judgment, integrity and independence of thought to the task and are
encouraged to speak their minds, while respecting others, so that different viewpoints can flourish in the process
of developing a sensible consensus.
Our Code of Business Conduct and Ethics (the Code), adopted by the Board, expresses fundamental principles
that guide the Board in its deliberations and shape Precision’s activities worldwide.The Code applies to the
members of the Board, the Chief Executive Officer (CEO), the Chief Financial Officer and all employees
throughout the organization. It incorporates our guiding principles: upholding the law, honoring trust, fairness,
objectivity, confidentiality, integrity and corporate and individual responsibility. It creates a frame of reference
for dealing with sensitive and complex issues and provides for accountability if standards of conduct are not
upheld. In addition, the CEO and the principal financial officers of Precision have signed a Code of Ethics.The
text of both of these documents can be found in the Corporate Governance section of Precision’s website at
www.precisiondrilling.com.
Under the rules of the Toronto Stock Exchange (TSX), Precision is required to disclose information relating
to its system for corporate governance. Precision’s disclosure addressing each of the TSX’s guidelines is set out in
Schedule ‘A’ to the Management Information Circular issued in connection with the 2004 Annual and Special
Meeting of the Shareholders, and can also be found in the Corporate Governance section of Precision’s website
at www.precisiondrilling.com.
Precision’s common shares are also listed on the New York Stock Exchange (NYSE). Precision’s governance
practices comply with the NYSE rules in all significant respects.
INDEPENDENCE OF THE BOARD
A majority of the Board of Precision must be resident Canadians and must qualify as independent and
unrelated directors in accordance with the applicable rules of the TSX, the NYSE and Canadian and U.S.
Securities Laws.To assist it in making determinations as to the independence of members of the Board of
Directors and its committees, the Board has adopted categorical standards of independence as per the rules of
the NYSE. A Director who qualifies as independent under this policy is both “unrelated” to Precision within the
P R E C I S I O N D R I L L I N G C O R P O R A T I O N
page34
C O R P O R A T E G O V E R N A N C E

meaning of the TSX guidelines and “independent” under the NYSE rules. Six of the seven members of Precision’s
Board are independent and unrelated to Precision.The only related Director is Hank B. Swartout, Chairman of
the Board, President and Chief Executive Officer of Precision.The Board further concluded that Mr. Swartout’s
dual role does not impair the Board’s ability to function independently of management. Mr. Swartout’s extensive
knowledge of Precision’s business is beneficial to other members of the Board.To further reinforce
independence, the Board appoints a Lead Director from the independent Directors present at each regularly
held in-camera session.The Lead Director is responsible for developing the agenda for, and presiding over
in-camera sessions and acting as principal liaison between the non-management Directors and the CEO on matters
dealt with during the in-camera sessions.
RESPONS IB IL I T I E S OF THE BOARD
The Board of Precision oversees the management of the business affairs of Precision, discharging its
responsibilities either directly, through Board committees or through management.The delegations of authority
conform to statutory limitations specifying responsibility of the Board that cannot be delegated to management.
Any responsibilities not delegated to management remain with the Board and its committees.The Board
encourages Precision’s management, led by the President and CEO, to be strong leaders and make clear and
appropriate executive decisions.
Among the Board’s activities derived from these responsibilities are to:
■ Supervise the succession planning process including the selection, appointment, development, evaluation and
compensation of the Chairman of the Board, CEO and the Senior Executives;
■ Provide advice and counsel to the CEO, nominate Directors and evaluate Board performance;
■ Hold an annual formal strategic planning session and approve strategic plans and objectives, major decisions,
and corporate plans;
■ Oversee the ethical, legal and social conduct of the organization, and review the financial performance and
condition of Precision;
■ Identify and consider risks in the operations of Precision and establish policies for monitoring and managing
those risks; and
■ Represent the interests of all shareholders in general and not of just one group.
A complete guideline of Director responsibilities can be found in the Corporate Governance section of
Precision’s website at www.precisiondrilling.com.
A N N U A L R E P O R T 2003
page35C O R P O R A T E G O V E R N A N C E

DIRECTOR OR IENTAT ION AND CONT INUING EDUCAT ION
The Board of Precision will establish or identify and provide access to appropriate orientation programs,
sessions or materials for newly elected Directors of Precision for their benefit either prior to or within a reasonable
period of time after their nomination or election as a Director. Precision will encourage, but not require,
Directors to periodically pursue or obtain appropriate programs, sessions or materials as to the responsibilities
of Directors of publicly-traded companies.
DIRECTOR COMPENSAT ION
Directors receive an annual retainer of US$16,000 per year.They also receive Board and committee
meeting fees of US$1,000 for attendance in person and US$500 for attendance by telephone. Committee Chairs
receive a retainer of US$5,000. Related travel and out-of-pocket expenses are reimbursed. In addition, a travel
allowance of US$1,000 is paid to non-management Directors who travel more than three hours by air to a board
or committee meeting.
Shareholdings of Board Members
■ Total commons shares of Precision held by the non-employee Directors – 41,000
■ Total stock options to purchase common shares of Precision held by the non-employee Directors – 116,000
COMMIT TEES OF THE BOARD
The Board of Directors has established an Audit Committee, a Compensation Committee and a Corporate
Governance and Nominating Committee.All members of the committees are independent and unrelated, and in
addition, members of the Audit Committee meet additional required tests of independence. Directors, committees
or members of a committee have the right to engage an outside advisor at Precision’s expense.The Board delegates
certain work to Board committees.This allows in-depth analysis of issues by the committees and more time for the
full board to discuss and debate items of business. Complete mandates of the Board committees are available on
the Corporate Governance section of Precision’s website at www.precisiondrilling.com.
Audit Committee
The Audit Committee consists of H. Garth Wiggins (Chairman), Patrick M. Murray and Robert J.S. Gibson,
all of whom are unrelated Directors and all of whom are independent under the rules of the NYSE.
The Audit Committee recommends the external Auditors to be appointed by the Shareholders at each
Annual Meeting and receives reports from the external Auditors. It also determines the remuneration of the
external Auditors and must approve, in advance, any permitted non-audit services.The Audit Committee has
been given authority to establish processes for the confidential receipt and handling of employee complaints
P R E C I S I O N D R I L L I N G C O R P O R A T I O N
page36
The Audit
Committee met
six times in 2003.

(Whistleblower Hotline) which can be accessed anonymously through the internet, by email or by voicemail.
Additional information about the Whistleblower Hotline can be found on Precision’s website at
www.precisiondrilling.com.
The Audit Committee has the general responsibility for overseeing and monitoring the financial aspects of
Precision’s business and operations, and to:
■ Review the annual and interim financial statements and Management’s Discussion and Analysis (MD&A) prior
to submission to the Board for approval;
■ Review and discuss with management and the external Auditors, as applicable, (a) major issues regarding
accounting principles and financial statement presentations including any significant changes in the
Corporation’s selection or application of accounting principles, and major issues as to the adequacy of
Precision’s internal controls and any special audit steps adopted in light of material control deficiencies;
(b) analyses prepared by management or the external Auditors setting forth significant financial reporting issues
and judgments made in connection with the preparation of the financial statements, including analyses of the
effects of alternative generally accepted accounting principles (GAAP) methods on the financial statements;
(c) any management letter provided by the external Auditors and the Corporation’s response to that letter;
(d) any problems, difficulties or differences encountered in the course of the audit work including any
disagreements with management or restrictions on the scope of the external Auditors’ activities or on access
to requested information and management’s response thereto; (e) the effect of regulatory and accounting
initiatives, as well as any off balance sheet structures on the financial statements of the Corporation; and
(f) earnings press releases (paying particular attention to any use of “pro forma” or “adjusted”, “non-GAAP
information”, as well as financial information and earnings guidance (generally on a case-by-case basis)
provided to analysts and rating agencies;
■ Discuss with management Precision’s major financial risk exposures and the steps management has taken to
monitor and control such exposures, including the Corporation’s risk assessment and risk management policies;
■ Ensure that the Corporation maintains an internal audit function and at least annually obtain and review a
report from the external Auditors regarding (a) the external Auditors’ quality control procedures, (b) any
material issues raised by the most recent quality control review or peer review of the firm, or by any inquiry
or investigation by governmental or professional authorities within the preceding five years respecting one
or more independent audits carried out by the external Auditors, (c) any steps taken to deal with any such
issues, and (d) all relationships between the external Auditors and Precision;
■ Evaluate the qualifications, performance and independence of the external Auditors, including a review and
A N N U A L R E P O R T 2003
page37C O R P O R A T E G O V E R N A N C E
evaluation of the lead partner of the external Auditors and set clear hiring policies for employees or former
employees of the external Auditors;
■ Ensure that the lead audit partner of the external Auditors and the audit partner responsible for reviewing the
audit are rotated at least every five years as required by the Sarbanes-Oxley Act of 2002, and further consider
rotation of the external Auditors’ firm itself;
■ Discuss with management and the external Auditors any accounting adjustments that were noted or proposed
by the external Auditors but were passed on (as immaterial or otherwise);
■ Establish procedures for (a) the receipt, retention and treatment of complaints received by Precision regarding
accounting, internal accounting controls or auditing matters, and (b) the confidential, anonymous submission
by employees of Precision of concerns regarding questionable accounting or auditing matters;
■ Review other financial information included in the Corporation’s annual report to ensure that it is consistent
with the Board of Directors’ knowledge of the affairs of the Corporation and is unbiased and non-selective;
■ Review the Annual Information Form;
■ Meet periodically, as appropriate, and at least annually with the internal and external Auditors of the
Corporation;
■ Review planning for, and the results of, the annual external audit and solely approve:
• The external Auditors’ engagement letter as agreed between the external Auditors and management
of the Corporation.
• The reasonableness of audit fees as agreed between the external Auditors and management.
• Audit scope, including locations to be visited, areas of audit risk, materiality as it affects audit
judgment, timetable, deadlines and coordination with internal audit.
• The audit report to the Corporation’s shareholders and any other reports prepared by the
external Auditors.
• Non-audit related services provided by the external Auditors.
• Assessment of the external Auditors’ performance.
■ Hold in-camera meetings with representatives of the internal and external Auditors to discuss audit related
issues including the quality of accounting personnel;
■ Have such other powers and duties as may from time to time by resolution be assigned to it by the Board;
P R E C I S I O N D R I L L I N G C O R P O R A T I O N
page38

■ Carry out an annual performance evaluation of the Audit Committee; and
■ Have the authority, to the extent it deems necessary or appropriate, to retain special legal, accounting or
other consultants to advise the Audit Committee and carry out its duties, and to conduct or authorize
investigations into any matters within its scope of responsibilities.
Corporate Governance and Nominating Committee
The Corporate Governance and Nominating Committee consists of Robert J.S. Gibson (Chairman),W.C.
(Mickey) Dunn and Frederick W. Pheasey, all of whom are independent and unrelated Directors.
The Corporate Governance and Nominating Committee has the general responsibility for developing and
monitoring Precision’s approach to corporate governance matters and is responsible for recommending to the
Board its size, composition and membership, succession planning for Directors and Board committee structure.
The Committee’s mandate is to:
■ Set criteria for Board members, identify individuals qualified to become Board members and, at the direction
of the Board, either select or recommend that the Board select the Director nominees for the next Annual
Meeting of the Shareholders;
■ Develop and recommend a set of corporate governance principles applicable to the Corporation;
■ Assess annually the effectiveness of the Board as a whole, the various committees of the Board and the
contribution of individual Directors and make any necessary recommendations to the Board in relation thereto;
■ Make recommendations to the Board as to the members of the various committees of the Board, taking into
account the eligibility for membership on such committees based upon applicable laws, rules and regulations;
■ Ensure the provision of appropriate orientation for new Directors and availability of continuing education
programs for all Directors;
■ Establish and monitor procedures for administering the relationship of the Board with the Corporation’s
management and ensure that the Board can function independently of management and ensure that the
Chairmen of the various committees of the Board shall have unimpeded access to senior management;
■ Ensure that there is a process to allow all levels of employees access to appropriate Board members to bring
“Whistleblower” issues to the Board which are not being adequately dealt with by management of Precision;
■ Establish and monitor procedures to ensure that the Board is made aware of current and evolving legislation,
regulations and guidelines relating to applicable corporate governance issues pertaining to regulated public issuers;
■ Establish and monitor procedures which will enable an individual Director to engage an outside advisor at the
A N N U A L R E P O R T 2003
page39C O R P O R A T E G O V E R N A N C E
The Corporate
Governance
and Nominating
Committee
met four times
in 2003.

P R E C I S I O N D R I L L I N G C O R P O R A T I O N
page40
expense of the Corporation under appropriate circumstances on the basis that such procedures shall allow the
Committee to retain the discretion to approve the reasonableness and costs for such engagement;
■ Provide a report on corporate governance on a yearly basis to be included in the Management Information
Circular for the Annual Meeting of the Shareholders, which report shall compare the corporate governance
practices of the Corporation to the stated criteria listed in the Toronto Stock Exchange Report on Corporate
Governance.This report shall also take into account other corporate governance requirements required by the
New York Stock Exchange and other applicable entities that have jurisdiction over the Corporation;
■ Review and reassess, at least annually, the adequacy of the Corporate Governance Guidelines of the
Corporation and recommend any proposed changes to the Board for approval;
■ Review and reassess, annually, the adequacy of the Corporate Governance and Nominating Committee
mandate and recommend any proposed changes to the Board for approval; and
■ Report, on a regular basis to the Board, on its deliberations.
Compensation Committee
The Compensation Committee consists of Murray K. Mullen (Chairman) and W.C. (Mickey) Dunn, both of
whom are independent and unrelated Directors.
The Committee’s mandate is to:
■ Review and develop the CEO’s compensation package;
■ Annually review and recommend the compensation for non-employee Directors;
■ Review the Corporation’s goals and objectives with the CEO and recommend to the Board the CEO’s
compensation package in light of the goals and objectives;
■ Evaluate the CEO’s performance on an annual basis as such performance relates to the established goals
and objectives;
■ Make recommendations to the Board with respect to incentive compensation and equity based plans;
■ Adopt, administer, approve and ratify awards under incentive compensation and stock plans, including
amendments to the awards made under any such plans and review and monitor awards under such plans;
■ Review with the CEO of the Corporation and comment upon: (a) the compensation plans for senior
executive officers of the Corporation; and (b) recommendations for the appointment of senior executive
officers prior to consideration by the Board;
■ Have the sole authority to retain and terminate any compensation consultant to be used to assist in the evaluation
The Compensation
Committee
met five times
in 2003.

of Director, CEO or senior executive compensation and shall have the sole authority to approve the consultant’s
fees and other retention terms as it relates to such evaluation.The Compensation Committee shall also have
authority to obtain advice and assistance from internal or external legal, accounting or other advisors; and
■ Review and reassess the adequacy of this mandate annually and recommend any proposed changes to the
Board for approval.The Compensation Committee shall annually review its own performance.
A N N U A L R E P O R T 2003
page41C O R P O R A T E G O V E R N A N C E
SUMMARY OF BOARD ANDCOMMITTEE MEET ING ATTENDANCE
Board Committee
meetings meetings
Director attended(1) attended(1)
W.C. (Mickey) Dunn 7 of 7 7 of 9(2)
Robert J.S. Gibson 7 of 7 10 of 10
Murray K. Mullen 7 of 7 5 of 5
Patrick M. Murray 6 of 7 6 of 6
Frederick W. Pheasey 7 of 7 4 of 4
Hank B. Swartout 7 of 7 N/A
H. Garth Wiggins 7 of 7 6 of 6
(1) Attendance in person or by telephone.
(2) Attended 4/4 Corporate Governance meetings.Appointedto the Compensation Committee July 2003 and attendedall committee meetings subsequent to that appointment.

P R E C I S I O N D R I L L I N G C O R P O R A T I O N
page42
D A L E T R E M B L A YSenior Vice President Finance
and Chief Financial Officer
M I C K M C N U L T YSenior Vice President, Operations Finance
B O B G E R M A NVice President and Chief Accounting Officer
J A N C A M P B E L LCorporate Secretary

The Management’s Discussion and Analysis has been prepared taking into consideration information
available to February 10, 2004.The discussion focuses on key statistics from the Consolidated Financial
Statements, and pertains to known risks and uncertainties relating to the oilfield and industrial service sectors.
This discussion should not be considered all-inclusive, as it excludes changes that may occur in general economic,
political and environmental conditions. Additionally, other elements may or may not occur which could affect
the Corporation in the future. In order to obtain the best overall perspective, this discussion should be read in
conjunction with the material contained in other parts of this annual report, including the audited Consolidated
Financial Statements.The effects on the Consolidated Financial Statements arising from differences in generally
accepted accounting principles (GAAP) between Canada and the United States are described in Note 15 to the
Consolidated Financial Statements.
HIGHL IGHTS (1)
(Stated in thousands of Canadian dollars, except per share amounts, which are presented on a diluted basis)
Increase Increase IncreaseYears ended December 31, 2003 (Decrease) 2002 (Decrease) 2001 (Decrease)
Revenue 1,917,933 350,427 1,567,506 (247,702) 1,815,208 504,234% change 22% (14%) 45%
Operating earnings (2) 297,110 141,551 155,559 (206,226) 361,785 115,840% change 91% (57%) 47%
Earnings from continuing operations before goodwill amortization 191,131 101,597 89,534 (116,763) 206,297 59,439% change 113% (57%) 40%
Earnings from continuing operations 191,131 101,597 89,534 (86,176) 175,710 50,694% change 113% (49%) 41%
Net earnings 188,676 97,411 91,265 (95,269) 186,534 56,421% change 107% (51%) 43%
Earnings per share from continuing operations 3.46 1.83 1.63 (1.60) 3.23 0.75% change 112% (50%) 30%
Net earnings per share 3.41 1.75 1.66 (1.78) 3.44 0.86% change 105% (52%) 33%
Cash flow from operations 258,427 59,204 199,223 (233,007) 432,230 195,345% change 30% (54%) 82%
Net capital spending 290,504 50,961 239,543 (101,418) 340,961 160,207% change 21% (30%) 89%
(1) Quarterly financial information for the two-year period ended December 31, 2003 is presented on page 104 of this annual report.(2) Operating earnings is not a recognized measure under Canadian generally accepted accounting principles (GAAP). Management believes that in addition to net earnings,
operating earnings is a useful supplemental measure as it provides an indication of the results generated by the Corporation’s principal business activities prior to consideration of how those activities are financed or how the results are taxed in various jurisdictions. Investors should be cautioned, however, that operating earningsshould not be construed as an alternative to net earnings determined in accordance with GAAP as an indicator of Precision’s performance. Precision’s method ofcalculating operating earnings may differ from other companies and, accordingly, operating earnings may not be comparable to measures used by other companies.
A N N U A L R E P O R T 2003
page43
M A N A G E M E N T ’ S D I S C U S S I O N A N D A N A L Y S I S
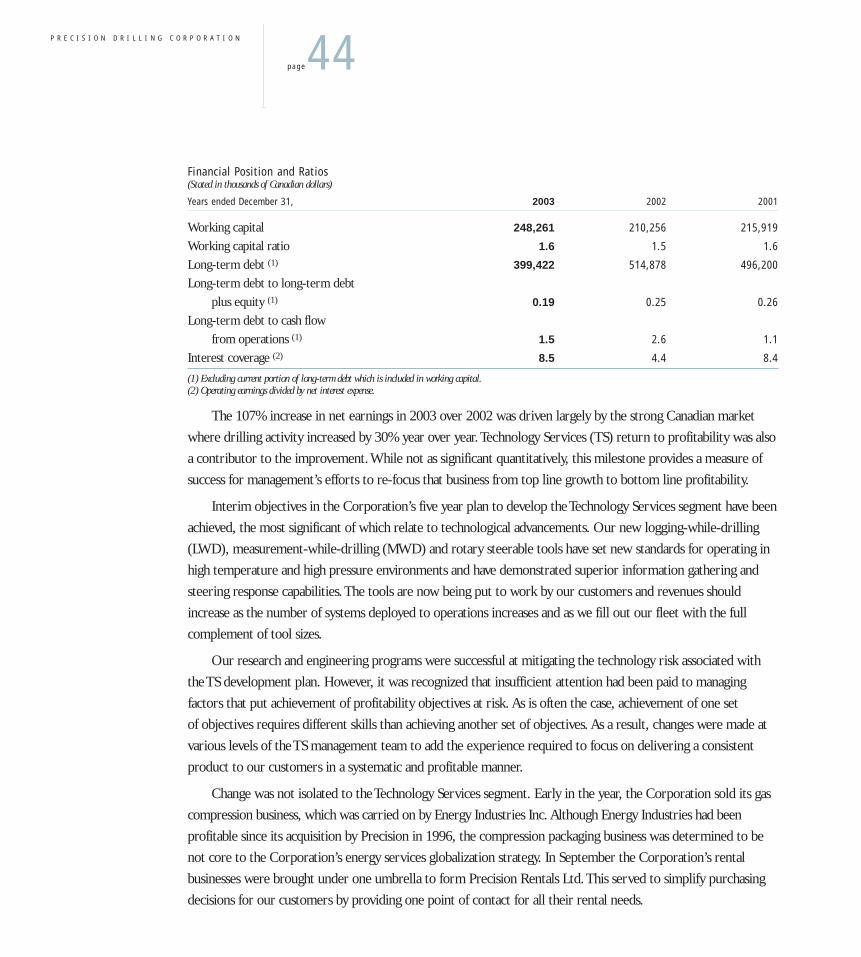
Financial Position and Ratios(Stated in thousands of Canadian dollars)
Years ended December 31, 2003 2002 2001
Working capital 248,261 210,256 215,919
Working capital ratio 1.6 1.5 1.6
Long-term debt (1) 399,422 514,878 496,200
Long-term debt to long-term debt
plus equity (1) 0.19 0.25 0.26
Long-term debt to cash flow
from operations (1) 1.5 2.6 1.1
Interest coverage (2) 8.5 4.4 8.4
(1) Excluding current portion of long-term debt which is included in working capital.(2) Operating earnings divided by net interest expense.
The 107% increase in net earnings in 2003 over 2002 was driven largely by the strong Canadian market
where drilling activity increased by 30% year over year.Technology Services (TS) return to profitability was also
a contributor to the improvement.While not as significant quantitatively, this milestone provides a measure of
success for management’s efforts to re-focus that business from top line growth to bottom line profitability.
Interim objectives in the Corporation’s five year plan to develop the Technology Services segment have been
achieved, the most significant of which relate to technological advancements. Our new logging-while-drilling
(LWD), measurement-while-drilling (MWD) and rotary steerable tools have set new standards for operating in
high temperature and high pressure environments and have demonstrated superior information gathering and
steering response capabilities.The tools are now being put to work by our customers and revenues should
increase as the number of systems deployed to operations increases and as we fill out our fleet with the full
complement of tool sizes.
Our research and engineering programs were successful at mitigating the technology risk associated with
the TS development plan. However, it was recognized that insufficient attention had been paid to managing
factors that put achievement of profitability objectives at risk. As is often the case, achievement of one set
of objectives requires different skills than achieving another set of objectives. As a result, changes were made at
various levels of the TS management team to add the experience required to focus on delivering a consistent
product to our customers in a systematic and profitable manner.
Change was not isolated to the Technology Services segment. Early in the year, the Corporation sold its gas
compression business, which was carried on by Energy Industries Inc. Although Energy Industries had been
profitable since its acquisition by Precision in 1996, the compression packaging business was determined to be
not core to the Corporation’s energy services globalization strategy. In September the Corporation’s rental
businesses were brought under one umbrella to form Precision Rentals Ltd.This served to simplify purchasing
decisions for our customers by providing one point of contact for all their rental needs.
P R E C I S I O N D R I L L I N G C O R P O R A T I O N
page44

Summary Income Statement(Stated in thousands of Canadian dollars)
Years ended December 31, 2003 2002 2001
Operating earnings (loss)
Contract Drilling $ 285,753 $ 184,553 $ 298,737
Technology Services 4,842 (31,733) 52,257
Rental and Production 39,350 30,090 39,365
Corporate and Other (32,835) (27,351) (28,574)
297,110 155,559 361,785
Interest, net 35,050 35,123 43,059
Dividend income – (39) (1,106)
Gain on disposal of investments (3,355) (900) (1,805)
Earnings from continuing operations before
income taxes, non-controlling interest
and goodwill amortization 265,415 121,375 321,637
Income taxes 72,532 30,690 114,472
Earnings from continuing operations before
non-controlling interest and
goodwill amortization 192,883 90,685 207,165
Non-controlling interest 1,752 1,151 868
Earnings from continuing operations before
goodwill amortization 191,131 89,534 206,297
Goodwill amortization, net of tax – – 30,587
Earnings from continuing operations 191,131 89,534 175,710
Gain on disposal of discontinued operations 17,460 – –
Discontinued operations (19,915) 1,731 10,824
Net earnings $ 188,676 $ 91,265 $ 186,534
ECONOMIC DR IVERS OF THE O ILF I ELD SERV ICES BUS INESS
Crude oil and natural gas (hydrocarbons) are the primary sources of energy in the world.The provision
of these commodities to the consuming public involves a number of players, each of whom take on different
risks in the process of exploring for, producing, refining and distributing hydrocarbons and its associated refined
by-products. Exploration and production companies assume the risk of finding hydrocarbons in pools of
sufficient size to economically develop and produce the reserves.The economics of exploration and production
is dictated by the current and expected future margin between the cost to find and develop hydrocarbons and
the price at which those products can be sold.The wider the margin, the more incentive there is to undertake
the activities involved in the process of finding, producing, refining and distributing energy to residential and
business users.
A N N U A L R E P O R T 2003
page45M A N A G E M E N T ’ S D I S C U S S I O N A N D A N A L Y S I S

These activities include acquiring access to prospective lands, shooting seismic to detect the presence of
hydrocarbons, drilling wells and measuring the characteristics of subsurface geological formations. If a well is
evaluated to be commercially viable, additional oilfield services are required to complete the new well and then
subsequently to maintain production. Exploration and production companies hire oilfield service companies to
perform the majority of these services, hence, they are Precision’s customers.The revenue for an oilfield service
company is therefore, our customer’s finding and development cost.
Providing these services incorporates three main elements: people, technology and equipment. Attracting,
training and retaining qualified employees is the single biggest challenge for a service company. Exploration and
production activities are taking place in ever changing surface and subsurface conditions. Developing technology
and building equipment that can withstand increasing physical challenges and operate more efficiently is key to
maintaining and improving the economics of crude oil and natural gas production.The primary economic risks
assumed by oilfield service companies are the volatility of activity levels, that translate into utilization rates for
its investment in people, technology and equipment, and cost control to maximize the margins it earns.
The economics of a service company is thus largely driven by the current and expected price of crude oil
and natural gas, which is determined by the supply and demand for the commodity. Since crude oil can be
transported relatively easily, it is priced in a worldwide market which is influenced by a wide array of economic
and political factors. Natural gas is priced in more local markets due to the requirement to transport this
gaseous product in pressurized pipelines.
P R E C I S I O N D R I L L I N G C O R P O R A T I O N
page46
Reservoir Info
Drilling
Infrastructure
Production/ Maintenance
Drilling Related Services
Completion
Logistical Support
16%
6% 5%
14%
16%
26%
17%
OILFIELD SPENDING WORLDWIDE
Source: Spears & Associates, Morgan Stanley Research
Crude Oil
Natural Gas
Hydroelectric Power
Nuclear Electric Power
Coal Geothermal, Solar, Wind, and Wood and Waste Electric Power
23%
7% 1%
7% 39%
23%
SOURCES OF ENERGY USED WORLDWIDE
The worldwide oilfield services industry
(broadly defined) is a $100+ billion
business that provides a wide array of services
and equipment to support oil and gas
exploration and production activities.

Although, as illustrated above, crude oil and natural gas prices have historically been quite volatile, the
consensus of industry observers is that the relatively high current price environment appears to be sustainable
for the foreseeable future. Oil prices, which during 2003 averaged US$31.10 per barrel for West Texas
Intermediate (WTI), are the result of political instability in some OPEC member nations (Venezuela, Iraq and
Nigeria) and from a generally improving world economy with energy demand growth particularly strong in
China and Southeast Asia. Another important factor in the crude oil pricing equation, and one that has seen a
fundamental change from past pricing scenarios, is the value of the U.S. dollar. Since oil prices are denominated
in U.S. dollars around the world, the devaluation of the U.S. dollar that has occurred over the past year has
implications for both the seller and buyer of the commodity. Oil producing nations, with OPEC members taking
the lead in controlling supplies and prices, are motivated to see an increase in the U.S. dollar price of oil to
maintain their purchasing power in other currencies such as the Euro. From a buyer’s perspective, the
devaluation of the U.S. dollar has made oil a cheaper commodity for those who spend Euros and Japanese Yen
thus supporting the increased demand.
North American natural gas prices are also being supported by strong fundamentals. Demand is increasing
with improved economic growth while supply from relatively mature producing basins is starting to decline.The
near record gas drilling activity in 2003 served only to slow the decline in the production rate and this situation
is not expected to change in the near future. High oil prices also serve to support natural gas prices as the
A N N U A L R E P O R T 2003
page47M A N A G E M E N T ’ S D I S C U S S I O N A N D A N A L Y S I S
Gas US$/MMBtu Oil US$/Bbl
WTI OIL AND HENRY HUB GAS PRICES
10 40
35
30
25
20
15
10
5
0
9
8
7
6
5
4
3
2
1
0
Oil US$/Bbl
Jan
85
Jan
86
Jan
87
Jan
88
Jan
89
Jan
90
Jan
91
Jan
92
Jan
93
Jan
94
Jan
95
Jan
96
Jan
97
Jan
98
Jan
99
Jan
00
Jan
01
Jan
02
Jan
03
4 Year Gas Average Gas US$/MMBtu 4 Year Oil Average
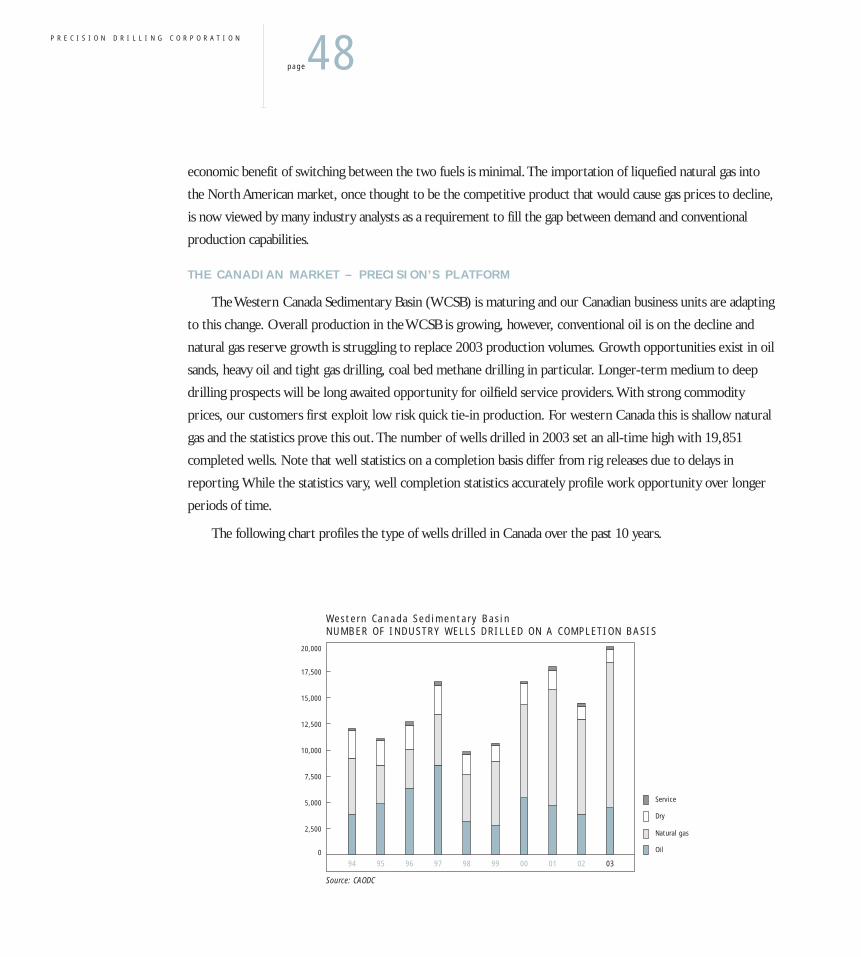
economic benefit of switching between the two fuels is minimal.The importation of liquefied natural gas into
the North American market, once thought to be the competitive product that would cause gas prices to decline,
is now viewed by many industry analysts as a requirement to fill the gap between demand and conventional
production capabilities.
THE CANADIAN MARKET – PREC I S ION ’ S PLATFORM
The Western Canada Sedimentary Basin (WCSB) is maturing and our Canadian business units are adapting
to this change. Overall production in the WCSB is growing, however, conventional oil is on the decline and
natural gas reserve growth is struggling to replace 2003 production volumes. Growth opportunities exist in oil
sands, heavy oil and tight gas drilling, coal bed methane drilling in particular. Longer-term medium to deep
drilling prospects will be long awaited opportunity for oilfield service providers.With strong commodity
prices, our customers first exploit low risk quick tie-in production. For western Canada this is shallow natural
gas and the statistics prove this out.The number of wells drilled in 2003 set an all-time high with 19,851
completed wells. Note that well statistics on a completion basis differ from rig releases due to delays in
reporting.While the statistics vary, well completion statistics accurately profile work opportunity over longer
periods of time.
The following chart profiles the type of wells drilled in Canada over the past 10 years.
P R E C I S I O N D R I L L I N G C O R P O R A T I O N
page48
Oil
Natural gas
Dry
Service
20,000
17,500
15,000
12,500
10,000
7,500
5,000
2,500
0
94 95 96 97 98 99 00 01 02 03
Western Canada Sedimentary Basin NUMBER OF INDUSTRY WELLS DRILLED ON A COMPLETION BASIS
Source: CAODC

The steady growth in natural gas drilling has fueled activity for the past decade.The shift from oil to natural
gas wells impacts the underlying nature of the energy services that companies like Precision provide. It has created
higher demand for snubbing and in general, lower demand for service rigs, as natural gas wells do not need to
be worked over as frequently as oil wells.
The following chart profiles 10-year drilling rig activity trends as measured by spud to rig release operating
days by category of drilling rig depth rating.
While the year 2003 set the WCSB well count record, it is 1997 that continues to hold the high mark for
drilling rig work in terms of utilization and operating days.At 33% of industry drilling rigs, Precision’s activity tracks
very close to industry.While the well count is important, the reduction in time to drill a well deserves emphasis.
It is the development of shallow well oil and natural gas prospects that underpins the Canadian market and
continues to be the agent for activity volatility.The trend towards deeper drilling prospects is progressing at a
slow pace. However as our customers drill out the shallow well inventories that they hold today, they will be
forced to pursue deeper prospects.We believe that we are beginning to see this shift as demand for medium
depth light triple type drilling rigs has never been stronger than it is in the first quarter of 2004.
A N N U A L R E P O R T 2003
page49M A N A G E M E N T ’ S D I S C U S S I O N A N D A N A L Y S I S
2,451 – 3,050m
1,851 – 2,450m
951 – 1,850m
4,601m+
3,701 – 4,600m
3,051 – 3,700m
0 – 950m
Operating Days 140,000
120,000
100,000
80,000
60,000
40,000
20,000
0
Rig Depth Category
94 95 96 97 98 99 00 01 02 03
Western Canada Sedimentary Basin INDUSTRY OPERATING DAYS BY DRILLING RIG DEPTH RATING
Source: CAODC

The following chart profiles the 10-year trend in terms of average well depth and average operating days to
drill a well.
On average, oil and gas well depths are increasingly shallow.This is entirely consistent with the production
shift to natural gas in the WCSB. Experience shows that our customers, the producers, first develop low risk
close to market prospects such as those in southern Alberta.The average time to drill a well in the WCSB in
2003 was just over six days. For Precision in Canada, the average time is 5.1 days.The average drilling time per
well has shown considerable reduction since 1999 as drilling contractors continue to search for niche equipment
solutions to specific well parameters. Precision’s coil tubing drilling rigs, since their emergence in the year
2000, have had a significant impact on industry drilling statistics and in some ways have diminished the meaning
of a well count in terms of drilling rig activity.
Improvements in drilling equipment and processes in combination with better downhole tools like MWD,
LWD and the drill bit have provided productivity gains that lower customer costs. Precision’s coil tubing drilling
rigs is a case in point. Available rigs averaged 10.5 in 2003 and all together they drilled 2,641 wells during the
year. Each well averaged a well depth of 614 metres, took 16.8 hours to drill with an operating utilization of
48%, move time excluded.These types of drilling solutions are applicable to specific drilling programs only and
have filled a customer need to better exploit shallow natural gas. Another example is oil sands drilling in
northeast Alberta where Precision has taken a lead industry role in the development of specialized equipment
configuration with our Super Single® drilling rig to meet the drilling requirement for programs that enable
recovery techniques such as Steam Assisted Gravity Drainage (SAGD).
P R E C I S I O N D R I L L I N G C O R P O R A T I O N
page50
Days to DrillWell Depth (metres)
Average Operating Days per Well to Drill
Average Industry Well Depth
1300
1200
1100
1000
900
10
9
8
7
6
800 594 95 96 97 98 99 00 01 02 03
Western Canada Sedimentary Basin AVERAGE INDUSTRY WELL DEPTH VERSUS TIME TO DRILL
Source: CAODC

Innovations such as these may reduce our drilling revenue days in the near term, however it balances out as
we enable our customers to pursue more prospects in the exploitation of hydrocarbons within the WCSB.
The following chart profiles the 10-year trend in terms of available drilling rigs and operating day rig utilization.
The supply of drilling rigs in Canada has steadily increased over the past 10 years to almost 700, an all-time
high. Customer demand as measured by operating day utilization peaked in 1997 and has languished between
38% and 56% since.This has not deterred the industry from adding rigs as drilling contractors have continued
to build capacity. In the short term the capacity is geared toward peak winter demand in January and February.
In the medium to long-term it provides the capacity to drill more wells through better utilization in the other
ten months of the year. If commodity prices weaken for a prolonged period the industry may have a large supply
demand imbalance. Clearly the industry believes that the pace of drilling to sustain natural gas production for
domestic Canadian use and export to the United States will keep equipment utilization in good stead.
Within the Contract Drilling segment, Precision underwent tremendous growth in Canada up to 1997.
Subsequently we diversified our service offering through service rigs and snubbing units to service and
work-over the increasing number of wells drilled and in production.This included camp and catering capabilities
to meet the logistical reality of remote drilling locations and the need to reduce travel incidents for field
employees at the well site. Precision’s drilling rig fleet represented 40% of the industry in 1997. Our market
share has eroded to 33% in 2003. Precision is comfortable at this level and we acknowledge that it would take
the acquisition of 55 existing rigs to regain lost market share.
A N N U A L R E P O R T 2003
page51M A N A G E M E N T ’ S D I S C U S S I O N A N D A N A L Y S I S
Drilling Rigs Available 800
700
600
500
400
300
Drilling Rig Utilization (%)
Drilling Rigs Available at Year End
Rig Operating Day Utilization
80
70
60
50
40
3094 95 96 97 98 99 00 01 02 03
Western Canada Sedimentary Basin INDUSTRY UTILIZATION VERSUS NUMBER OF DRILLING RIGS AVAILABLE
Source: CAODC

With a lead industry market share in Canada and reduced acquisition opportunities within Canada our focus
has been to reach out and gain experience in the international drilling market.We have gained considerable
work experience and projects like the Burgos Basin in Mexico demonstrate our ability to deploy and operate on
a large scale in the global arena.
PREC I S ION ’ S DEVELOPMENT IN THE O ILF I ELD SERV ICES BUS INESS
Precision’s development is best described in the context of its three business segments which are distinguished
by not only by the types of services provided but also by their position on the continuum from start-up to maturity.
Contract Drilling includes drilling rigs, service rigs, hydraulic well assist snubbing units, procurement and
distribution of oilfield supplies, camp and catering services, and manufacture, sale and repair of rig equipment.
Technology Services includes wireline, directional drilling, MWD, LWD services, separation services, controlled
pressure drilling, and the design, manufacture and marketing of polycrystalline diamond compact drill bits. Rental
and Production includes oilfield equipment rental services and industrial process services.
The following graphs illustrate how each of the Contract Drilling,Technology Services and Rental and
Production segments have historically contributed to Precision’s profitability and investment.
P R E C I S I O N D R I L L I N G C O R P O R A T I O N
page52
Rental and Production
Technology Services
Contract Drilling
2000
1750
1500
1250
1000
750
500
250
099 00 0201 03
REVENUE ($ mil l ions)
Rental and Production
Technology Services
Contract Drilling
500
400
300
200
100
0
(100)99 00 0201 03
OPERATING EARNINGS ($ mil l ions)
03
Rental and Production
Technology Services
Contract Drilling
400
350
300
250
200
150
100
50
099 00 0201 03
CAPITAL SPENDING ($ mil l ions)
Con t ra c t D r i l l i n g – C anada i s t he Co re – Wo r l dw ide D r i l l i n g i s i n S i gh t
The Contract Drilling segment is the current financial foundation of the Corporation. Canadian business
units within the segment are well established. Each core business unit has undergone asset growth and has a lead
market role within Canada. Using the financial and operational leverage gained, the segment continues to evolve
within Canada with a view to exporting its capabilities to niche markets worldwide.
Within Canada the segment has individual business units that are tightly integrated in terms of operational
management, safety, engineering, accounting and senior management supervision and governance.
Communication is a skill that has been refined and ingrained in the operating culture.The strength to
successfully integrate acquisitions with vertical integration within and between related ancillary business units
has been developed through the handling of acquisitions over the past 15 years.
Precision’s roots began in Western Canada as a land drilling contractor and the Corporation’s development
has matched that of the WCSB. Initially founded in 1985 as Cypress Drilling Ltd., the business quickly grew
from four drilling rigs to 19 with the reverse takeover in 1987 of Precision Drilling Ltd., a company formed in
1952. Over the following decade a series of nine acquisitions expanded the Canadian drilling rig fleet to 200 as
of May 1997 and a 40% market share of industry rigs. International operations in Venezuela commenced in 1992
with the Sierra Drilling acquisition. Diversification into service rig and snubbing operations came with the 1996
acquisition of Enserv Corporation. In the second half of the year 2000, Precision became fully vested in the
Canadian service rig business as the CenAlta Energy Services Inc. acquisition created a combined fleet of 257
service rigs and a lead industry market share of 28%.The additional acquisition in 2000 of coil tubing drilling rigs
and other shallow drilling rigs rounds out key milestones in our asset base growth.
While each business unit is at its own stage in the business life cycle continuum, drilling has matured over
the past three years.Today the business has developed critical equipment mass and employee depth. It has
developed integrity-based systems that enable the business to evolve in meeting fundamental industry challenges
while delivering better profit and safety performance. Employee retention and seasonal cycles remain a huge
manpower challenge for the industry.This condition is rather unique in that there is a reasonable supply of
equipment; it is the people element that keeps the market in tight supply.The supply of experienced people
yields profit leverage for oilfield service companies, not just the “iron”.
A N N U A L R E P O R T 2003
page53M A N A G E M E N T ’ S D I S C U S S I O N A N D A N A L Y S I S

Core Business AssetsFive Year History, end of year status
2003 2002 2001 2000 1999
International (beyond Canada and the U.S.)Drilling Rigs 19 16 15 12 11
United States Drilling Rigs 1 1 4 2 0
CanadaDrilling Rigs – 33% of industry 225 226 229 230 211
Service Rigs – 28% of industry 239 240 257 257 76
Rig Assist Snubbing Units – 33% of industry 25 23 24 19 20
Oilfield Drilling Camps – 25% of industry 88 74 74 74 75
Enabling Infrastructure (Canada – in square feet)Equipment Manufacture Facility 48,000 48,000 48,000 38,000 38,000
Consumable Supply Procurement and Distribution Facility 40,000 40,000 40,000 40,000 40,000
The following tables provide a worldwide summary of Precision’s drilling and service rig fleets.
2003 2002Type of Drilling Rig Depth Canada/U.S. International Total Canada/U.S. International Total
Single to 1,200 m 18 – 18 17 – 17
Super Single® to 2,500 m 15 4 19 16 4 20
Double to 3,000 m 96 7 103 96 6 102
Light triple to 3,600 m 47 6 53 48 5 53
Heavy triple to 7,600 m 39 2 41 39 1 40
Coiled tubing 11 – 11 11 – 11
Total fleet 226 19 245 227 16 243
Type of Service Rig – Canada 2003 2002 2001 2000 1999
Single 1 1 4 4 –
Freestanding mobile single 75 50 23 8 4
Mobile single 29 55 91 105 42
Double 57 58 60 59 24
Freestanding mobile double 6 6 5 4 –
Mobile double 46 45 48 50 –
Heavy double 7 7 9 9 2
Freestanding heavy double 2 2 – – –
Freestanding slants 16 16 16 16 4
Swab – – 1 2 –
Total fleet 239 240 257 257 76
P R E C I S I O N D R I L L I N G C O R P O R A T I O N
page54

As shallow natural gas drilling runs its course in Canada, our diverse and versatile fleet of drilling and
service rigs are very well positioned for the eventual shift to deeper drilling prospects.
Te chno l ogy Se r v i c e s
The acquisition of Computalog Ltd. in 1999 marked the initial step in a five-year strategy to develop the
Technology Services business.The market for downhole services was and still is dominated by three large multi-
national oilfield service companies. However, oil and gas exploration and production companies are keen to see
competition in the ranks of their service providers and a niche was available to a smaller participant that could
deliver quality products and service. Precision’s mature drilling operation provided the reputation of a respected
service provider and the financial backing required to take on such a venture. In addition, the TS business provided
the means to participate in the offshore oil and gas exploration and production market.
The objectives of TS are the same today as they were in 1999.They are to expand our product offering,
globalize the presence of the whole Precision group outside of Canada, and introduce a step change in
technological capabilities of what existed in TS and the industry. An advantage that TS had as a new “greenfield”
participant in the market was that it was not burdened by the challenge of integrating new technology with old,
nor need it be concerned with the impact new technology might have on the economics of a substantial
investment in earlier generation technologies.
Initially, activities aimed at achieving TS objectives were undertaken across a broad front. Since 1999
Precision has spent $133 million on its research and engineering efforts. Much of this work was centered around
Advantage R&D, Inc. in Houston,Texas, which was established by Precision in 2000 with the mandate to
develop the next generation of LWD and MWD tools. Another significant element of the research and
engineering program focused on the development of our Rotary Steerable tools, which work was undertaken by
Smart Stabilizer Systems Ltd., a Precision subsidiary based in Cheltenham, England.
Acquisitions, including Geoservices S.A in October 2000 and BecField Drilling Services Ltd. in January
2001, were completed to gain access to innovative technologies and to establish a presence in certain regional
international markets. By early 2001,TS had established regional centers in seven strategic geographic areas around
the world, namely Canada, the U.S., Mexico, Latin America, Europe/Africa, the Middle East and Asia/Pacific.
Technology Services revenue grew from $126 million in 1999 to $603 million in 2002. A significant
amount of this expansion came outside of the Canadian and U.S. markets with the other regional operations
accounting for 38% of revenue in 2002 compared to 14% in 1999. However, the scope of TS growth initiatives,
in terms of both geography and product lines, combined with the impact of delays in the deployment of new
technologies, resulted in operations support and administrative organizations that were uneconomic for the
start-up revenue levels realized.
A N N U A L R E P O R T 2003
page55M A N A G E M E N T ’ S D I S C U S S I O N A N D A N A L Y S I S

Fiscal 2003 can best be characterized as a “year of re-focus” for TS. A number of management changes
occurred during the year which changed the style and culture of the TS segment. No longer is the segment
purely focused on revenue growth and geographic expansion.The renewed goal is profitable growth in areas
where we believe we can achieve an acceptable long-term return on our investment.
Ren ta l and P roduc t i on
Precision entered this segment of its business in 1996 when it acquired EnServ Corporation. Since then the
Corporation has reduced the operations carried on by this segment through strategic divestitures that took
advantage of attractive valuations to dispose of operations determined to be not core to Precision’s future
growth plans.The industrial rental division was sold in February 1999 and the gas compression operation was
sold in March 2003. Each of these transactions produced gains for the Corporation. Both of the businesses
currently carried on by the segment, namely, industrial plant maintenance and oilfield equipment rental, have
grown through acquisitions and the pursuit of internal growth opportunities.
CEDA’s plant maintenance operations have become increasingly focused on the expanding activity in
northern Alberta’s oilsands regions.The acquisition of JJay Exchanger Industries Ltd. in the second quarter of
2000 solidified the segment’s position in this market as a provider of all the required services in a major refinery
or petro-chemical plant turnaround/shutdown.
Innovation has also played an important role in CEDA’s steady growth.Their research and development
efforts have grown out of their unique knowledge and experience, with the focus on developing new tools and
applications that are marketable in the field. Examples of products that CEDA has introduced to the market
include the SuperLance™ System, which combined Precision’s experience in coil tubing drilling with water
blasting technology to increase the efficiency of cleaning coker units in refineries, and various adaptations of
robotics technology to increase the safety and timeliness of tank cleaning operations.
The oilfield equipment rental business expanded its product offerings in 1997 with the acquisition of
substantially all of the business assets of Ducharme Oilfield Rentals Ltd. whose primary product line was the
rental of portable industrial housing, which is used at many remote drilling locations in western Canada. Since
then many initiatives have been undertaken to integrate the delivery of products to customers and increase the
profitability of operations. Among them is the closure of the wellsite trailer manufacturing facility in favour of
less costly outsourcing arrangements in 2002 and more recently the consolidation of all rental product lines to
form Precision Rentals Ltd.This latter move was in response to changing and growing customer needs to simplify
their purchasing decisions by providing one point of contact to access all their rental needs.
P R E C I S I O N D R I L L I N G C O R P O R A T I O N
page56

RESULTS OF OPERAT IONS
Con t ra c t D r i l l i n g(Stated in thousands of Canadian dollars, except per day/hour amounts)
% of % of % of Years ended December 31, 2003 Revenue 2002 Revenue 2001 Revenue
Revenue $ 992,824 $ 770,147 $1,004,265
Expenses:
Operating 602,418 60.7 491,433 63.8 599,159 59.7
General and administrative 29,364 3.0 29,769 3.9 32,453 3.2
Depreciation 77,725 7.8 62,524 8.1 75,170 7.5
Foreign exchange (2,436) (0.3) 1,868 0.2 (1,254) (0.1)
Operating earnings $ 285,753 28.8 $ 184,553 24.0 $ 298,737 29.7
% Increase % Increase % Increase2003 (Decrease) 2002 (Decrease) 2001 (Decrease)
Number of drilling rigs (end of year) 245 0.8 243 (2.0) 248 1.6
Drilling operating days (worldwide) 46,715 33.2 35,081 (25.6) 47,142 8.7
Revenue per operating day $ 15,984 (0.1) $ 16,008 (0.1) $ 16,097 15.3
Number of service rigs (end of year) 239 (0.4) 240 (6.6) 257 –
Service rig operating hours 439,519 12.1 392,210 (20.4) 492,480 121.3
Revenue per operating hour $ 462 3.6 $ 446 4.4 $ 427 12.4
2003 Compared to 2002
In financial terms, the Contract Drilling segment had a very good year in 2003 with a sharp rebound in
Canadian drilling activity to 2001 levels, higher international rig activity with fourth quarter growth and a
moderate increase in Canadian service rig activity. Snubbing and camps services were also more active with
equipment utilization improvement similar to drilling.While international conditions were positive,
seasonally adjusted Canadian performance strengthened throughout 2003. In 2002, the quarterly trend was
quite the opposite where in Canada conditions were deteriorating after the torrid pace of 2001. For 2003,
segment revenues increased by 29% to $993 million, an improvement of $223 million over the prior year.
Operating earnings increased by 55% to $286 million, an improvement of $101 million and 4.8 percentage
points of revenue for a margin improvement of 20%. Of the $101 million improvement in operating earnings,
70% or $70 million of this is attributable to Canadian drilling rig and service rig operations.This earnings
improvement is attributable to more equipment activity and higher pricing.The equipment activity increase,
volume factor, generated incremental operating earnings of $50 million over prior year with higher pricing,
price factor, generating $20 million virtually all of which was generated in the second half of the year. Service
rig performance is noteworthy, as the operating earnings margin improvement was almost half the total at
$9 million or $21 per service rig operating hour.
A N N U A L R E P O R T 2003
page57M A N A G E M E N T ’ S D I S C U S S I O N A N D A N A L Y S I S
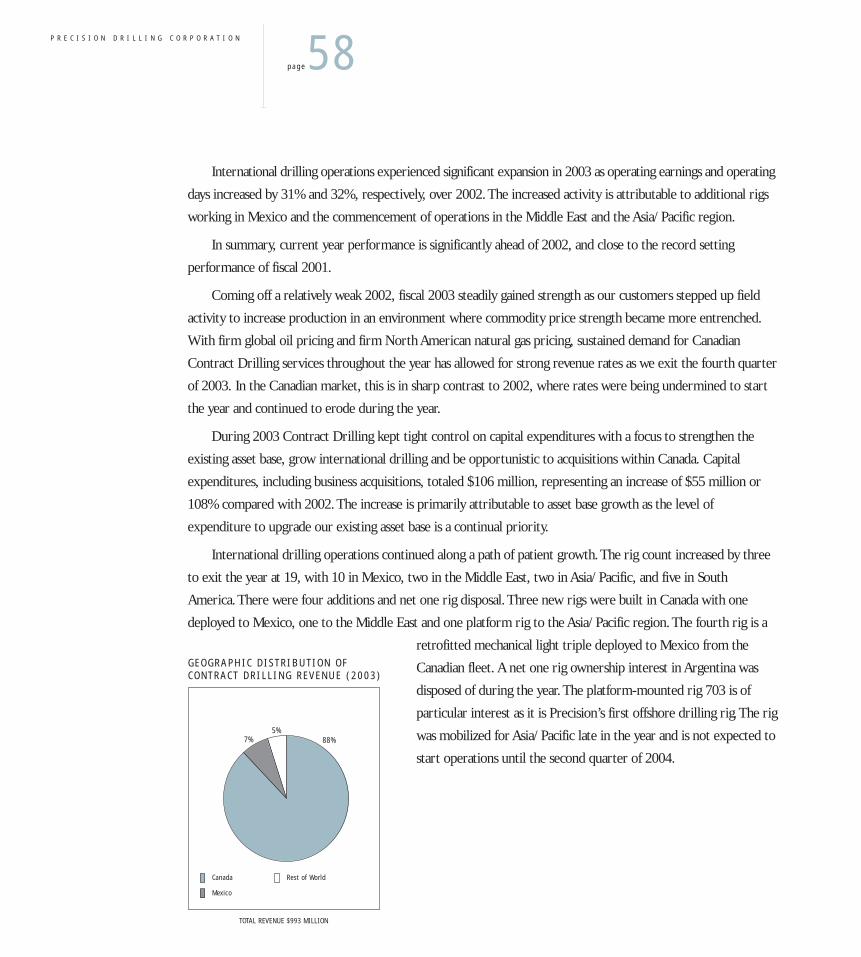
International drilling operations experienced significant expansion in 2003 as operating earnings and operating
days increased by 31% and 32%, respectively, over 2002.The increased activity is attributable to additional rigs
working in Mexico and the commencement of operations in the Middle East and the Asia/Pacific region.
In summary, current year performance is significantly ahead of 2002, and close to the record setting
performance of fiscal 2001.
Coming off a relatively weak 2002, fiscal 2003 steadily gained strength as our customers stepped up field
activity to increase production in an environment where commodity price strength became more entrenched.
With firm global oil pricing and firm North American natural gas pricing, sustained demand for Canadian
Contract Drilling services throughout the year has allowed for strong revenue rates as we exit the fourth quarter
of 2003. In the Canadian market, this is in sharp contrast to 2002, where rates were being undermined to start
the year and continued to erode during the year.
During 2003 Contract Drilling kept tight control on capital expenditures with a focus to strengthen the
existing asset base, grow international drilling and be opportunistic to acquisitions within Canada. Capital
expenditures, including business acquisitions, totaled $106 million, representing an increase of $55 million or
108% compared with 2002.The increase is primarily attributable to asset base growth as the level of
expenditure to upgrade our existing asset base is a continual priority.
International drilling operations continued along a path of patient growth.The rig count increased by three
to exit the year at 19, with 10 in Mexico, two in the Middle East, two in Asia/Pacific, and five in South
America.There were four additions and net one rig disposal.Three new rigs were built in Canada with one
deployed to Mexico, one to the Middle East and one platform rig to the Asia/Pacific region.The fourth rig is a
retrofitted mechanical light triple deployed to Mexico from the
Canadian fleet. A net one rig ownership interest in Argentina was
disposed of during the year.The platform-mounted rig 703 is of
particular interest as it is Precision’s first offshore drilling rig.The rig
was mobilized for Asia/Pacific late in the year and is not expected to
start operations until the second quarter of 2004.
P R E C I S I O N D R I L L I N G C O R P O R A T I O N
page58
Canada
Mexico
Rest of World
7%5%
88%
GEOGRAPHIC DISTRIBUTION OF CONTRACT DRILLING REVENUE (2003)
TOTAL REVENUE $993 MILLION

In Canada, our asset base expanded with the acquisition of two snubbing units, 19 oilfield camps and the
construction of one new generation single drilling rig, a Super Single® Light with a 1,200 metre depth rating.
A second such rig commenced drilling in February 2004. Asset reductions include the decommissioning of one
drilling and one service rig, the sale of one surface hole drilling rig and one camp and the transformation of
certain four unit camps into six unit configurations.
Canada spurred the improved financial performance on the strength of record shallow natural gas well
drilling activity.
■ Canadian drilling rig activity increased 36% over prior year to 42,725 operating days and 52% utilization,
an improvement of 11,362 days and 14 utilization percentage points.
■ Service rig activity increased 12% over prior year to 439,519 operating hours and 50% utilization,
an improvement of 47,309 hours and five utilization percentage points.
■ Snubbing unit activity increased 39% over prior year to 4,322 utilization days and 54% utilization,
an improvement of 1,210 days and 12 utilization percentage points.
■ Camp activity increased 38% over prior year to 12,451 camp days and 39% utilization, an improvement of
3,406 days and 6 utilization percentage points.
International drilling rig activity increased 32% over prior year to 3,990 operating days, an improvement of
975 days.Two thirds of the additional days occurred in the Mexico operations where additional rigs were put to
work with the extension of the Burgos integrated services project. Drilling operations ran for a full year in the
Asia/Pacific region adding 280 days to the increase in 2003 while Middle East operations commenced in the
fourth quarter of 2003.
Looking ahead to 2004 we carry strong momentum in all business lines within the segment.
■ Precision Drilling International’s drilling operation is expected to benefit from a full year of 2003 growth in
the Middle East and Asia/Pacific regions.We expect operations in Venezuela to carry forward at current levels.
■ Precision Drilling in Canada is off to an excellent first quarter start with drilling rig activity 4% ahead of
2003 and superior operating earning margins.
■ Precision Well Servicing in Canada is off to an even better first quarter start with service rig activity 8% ahead
of 2003 and superior operating earnings margins.
■ Live Well Service and LRG Catering are also ahead of last year’s pace as natural gas drilling and production
activity is generating strong demand for snubbing and camp/catering services.
A N N U A L R E P O R T 2003
page59M A N A G E M E N T ’ S D I S C U S S I O N A N D A N A L Y S I S

2002 Compared to 2001
The asset base for Contract Drilling was virtually unchanged during 2002, as there were no additions and
certain rigs, 4 drilling and 17 service, were taken out of service.The reasons for the decline in activity in 2002
compared to 2001 were two-fold. First, competition and industry capacity continued to increase, albeit at a
slower pace, as competitors continued to build new equipment. Available rigs in Canada reached an all-time
record high. Second, although the fourth best year ever in western Canada in terms of well completions, 2002
was characterized by low risk drilling whereby short duration shallow gas wells were dominant. A lack of
confidence in energy commodity pricing triggered conservative spending by our customers.This was noteworthy
as drilling parameters serve as a lead indicator for most future energy services within a region.There were
14,459 wells drilled in Canada in 2002, a mark that resulted in a drilling rig activity decline of 27% to 31,363
operating days for Precision in Canada representing a 38% utilization rate, a post-1992 low. Service rig activity
declined 20% to 392,210 hours in Canada (44% utilization). Our service rig work was split one-third new well
completion with the remaining two-thirds directed towards the workover of existing wells in production. Snubbing
unit activity declined 15% and camp and catering days declined 37% to 9,041 days (33% utilization).
Capital expenditures were managed to closely match changes in demand for our existing asset base.
Measures of demand include utilization, revenue and operating earnings. Compared to the prior year service and
drilling rig utilization declined a combined 24%, capital expenditures declined 59%, revenue decline of 23%
and operating earnings declined 38%.
In terms of operating earnings, the $114 million dollar decline over prior year was due to a volume
reduction of $71 million due to lower equipment utilization, with the remaining $43 million due to price
competitiveness resulting in lower rig dayrates and less coverage of fixed infrastructure costs. Drilling and service
rig dayrates were strong in the first quarter of 2002 as record 2001 performance momentum carried forward
through winter drilling. However, as the remaining three quarters progressed, steadily softening demand
continued to erode operating margins and Contract Drilling exited the year with margins at 52 week lows.
P R E C I S I O N D R I L L I N G C O R P O R A T I O N
page60

Te chno l ogy Se r v i c e s(Stated in thousands of Canadian dollars)
% of % of % of Years ended December 31, 2003 Revenue 2002 Revenue 2001 Revenue
Revenue $ 714,385 $ 603,088 $ 614,152
Expenses:
Operating 523,105 73.2 463,632 76.9 404,577 65.9
General and administrative 70,619 9.9 80,751 13.4 75,468 12.3
Depreciation and amortization 75,578 10.6 53,347 8.8 47,694 7.8
Research & engineering 42,419 5.9 34,862 5.8 31,677 5.1
Foreign exchange (2,178) (0.3) 2,229 0.4 2,479 0.4
Operating earnings (loss) $ 4,842 0.7 $ (31,733) (5.3) $ 52,257 8.5
% Increase % Increase % Increase2003 (Decrease) 2002 (Decrease) 2001 (Decrease)
Wireline jobs performed 38,403 24.6 30,813 (18.6) 37,845 28.6
Directional wells drilled 2,954 78.6 1,654 44.1 1,148 15.1
Well testing/CPD man days (Canada only) (1) 53,377 8.4 49,227 (18.1) 60,135 43.9
(1) Controlled Pressure Drilling (CPD).
2003 Compared to 2002
As noted earlier, 2003 was a year of transition for Technology Services with new management changing the
focus of the business from top line growth and geographic expansion to enhanced bottom line profitability.
Return on capital employed is now the yardstick by which success is measured and investment decisions are
guided.The transition is not complete, however, significant improvements were achieved in all regions and we
will strive to make further progress in 2004.
Notable accomplishments in 2003 include the following:
■ Non-profitable product lines were shut down in many regions.This is consistent with another key element
of the Technology Services strategy going forward.That being, not trying to be everything to everybody
everywhere.The segment will focus on what it is good at in regions where economies of scale will contribute
to profitable operations.
■ Other businesses were rationalized and re-focused. In some instances this involved consolidating management
functions where geographically possible. In others it meant trimming cost structures to better match anticipated
revenue levels and renegotiating customer contracts to recognize additional services being provided.
■ Non-core businesses were identified.The sale of one such business, Fleet Cementers, Inc., was completed in
February 2004, and a similar transaction is being pursued with respect to Polar Completions.
A N N U A L R E P O R T 2003
page61M A N A G E M E N T ’ S D I S C U S S I O N A N D A N A L Y S I S

P R E C I S I O N D R I L L I N G C O R P O R A T I O N
page62
■ TS was successful in signing a number of large contracts throughout the world on which the Corporation will
use its new technologies.
■ A technology review was completed in the third quarter which provided the direction for our research and
engineering work for the next few years.This review centered on a road map for a development plan that
considers key customer needs and requirements, identifies the related project parameters, and set priorities.
■ The first phase of the segment’s Enterprise Resource Planning information system implementation project
was completed in the fourth quarter when the Canadian operations went live on the software.The new
system and processes are already beginning to pay dividends in terms of expense analysis and additional
information available to manage the business.
One critical factor that hampered the roll out of our new suite of tools in the first part of 2003 was the
ability for the hostile environment logging (HEL™)/LWD tool to demonstrate that it could reliably perform in
many different geological environments.The fourth quarter saw a step change in the reliability of these tools.
The mean time between failure almost quadrupled in December and that success has continued in early 2004.
This operating reliability allows our customers to also see the technological advantages of our tools which are
demonstrating logging speeds well in excess of existing industry standards.The HEL™/LWD tools now appear
to be nearing the end of the process of evolving from a science project to a viable business.We began the project
by designing and building tools to collect high quality geological and geophysical information.The next phase
focused on collecting that information in a reliable and efficient manner, which is what we accomplished in the
latter half of 2003.We are now starting to generate advanced interpretation products from that information and
should be able to grow the business using our existing wireline infrastructure such as our computing and
interpretation centers in Calgary and Houston.
With respect to our Rotary Steerable tool, although several runs have been completed with over 125 hours
in the hole, we are having some reliability challenges of the same nature as we experienced with the HEL™/LWD
tools in early 2003.The tools have demonstrated superior capability to generate high build angles and to kick off
directionally from a vertical wellbore, both of which add efficiencies to our customers’ drilling operations.
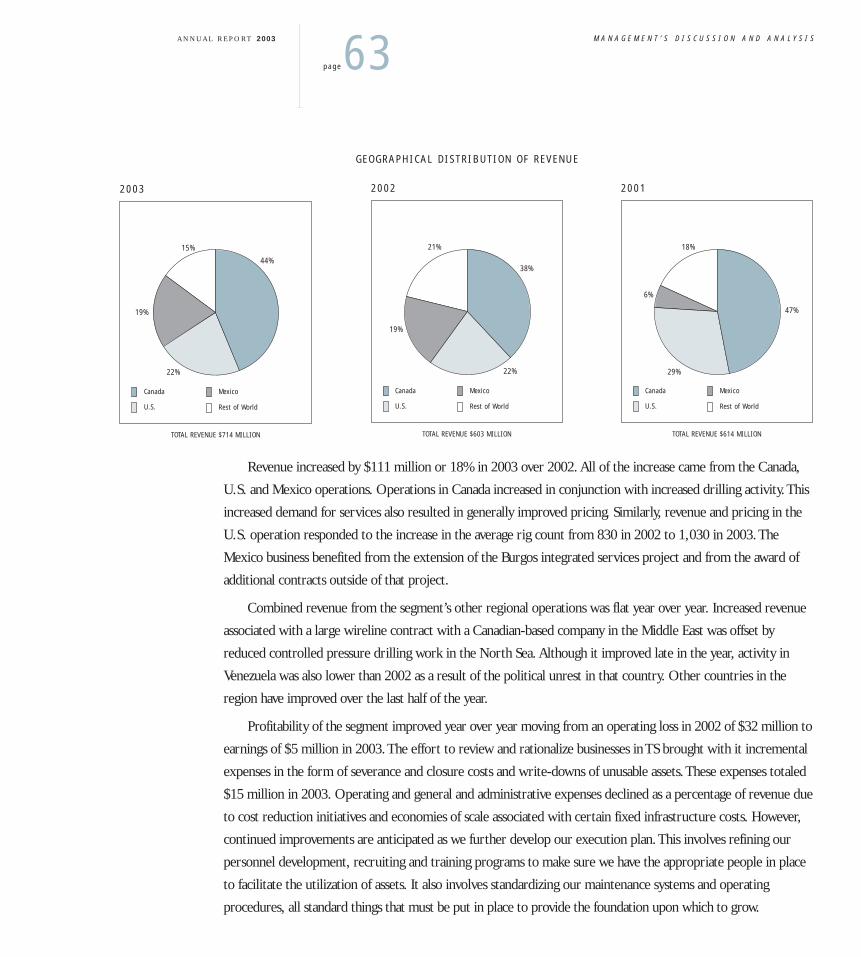
Revenue increased by $111 million or 18% in 2003 over 2002. All of the increase came from the Canada,
U.S. and Mexico operations. Operations in Canada increased in conjunction with increased drilling activity.This
increased demand for services also resulted in generally improved pricing. Similarly, revenue and pricing in the
U.S. operation responded to the increase in the average rig count from 830 in 2002 to 1,030 in 2003.The
Mexico business benefited from the extension of the Burgos integrated services project and from the award of
additional contracts outside of that project.
Combined revenue from the segment’s other regional operations was flat year over year. Increased revenue
associated with a large wireline contract with a Canadian-based company in the Middle East was offset by
reduced controlled pressure drilling work in the North Sea. Although it improved late in the year, activity in
Venezuela was also lower than 2002 as a result of the political unrest in that country. Other countries in the
region have improved over the last half of the year.
Profitability of the segment improved year over year moving from an operating loss in 2002 of $32 million to
earnings of $5 million in 2003.The effort to review and rationalize businesses in TS brought with it incremental
expenses in the form of severance and closure costs and write-downs of unusable assets.These expenses totaled
$15 million in 2003. Operating and general and administrative expenses declined as a percentage of revenue due
to cost reduction initiatives and economies of scale associated with certain fixed infrastructure costs. However,
continued improvements are anticipated as we further develop our execution plan.This involves refining our
personnel development, recruiting and training programs to make sure we have the appropriate people in place
to facilitate the utilization of assets. It also involves standardizing our maintenance systems and operating
procedures, all standard things that must be put in place to provide the foundation upon which to grow.
A N N U A L R E P O R T 2003
page63M A N A G E M E N T ’ S D I S C U S S I O N A N D A N A L Y S I S
Canada
U.S.
Mexico
Rest of World
19%
15%
44%
22%
2003
TOTAL REVENUE $714 MILLION
Canada
U.S.
Mexico
Rest of World
19%
21%
38%
22%
2002
TOTAL REVENUE $603 MILLION
Canada
U.S.
Mexico
Rest of World
6%
18%
47%
29%
2001
TOTAL REVENUE $614 MILLION
GEOGRAPHICAL DISTRIBUTION OF REVENUE

An important element in continuing the profitability improvements in TS is increased utilization of the new
tools being put into service. Currently the jobs being performed are usually isolated from one another requiring
backup equipment for every location. As customer acceptance increases, more jobs will be occurring
simultaneously in one geographic region requiring less backup equipment on a per job basis. Plans are also in
place to refine our manufacturing processes to reduce the overall cost of tools being built.These developments
should serve to reduce depreciation expense as a percentage of revenue.
Research and engineering expenditures increased in 2003 as tool development programs moved from the
laboratory to field operations. During the initial stages of the roll out, product support initiatives were being
performed by the research and engineering teams.With the commercialization of operations, this work has
been transferred to the operations groups.The target for sustained research and engineering expenditures is
5% of revenue.
2002 Compared to 2001
TS continued its geographic diversification efforts in 2002. Revenue declined by $11 million or 1.8% in
2002 compared to 2001.The Canadian and U.S. operations saw revenue decline as a result of reduced activity
levels.The year over year decline in the number of wells drilled amounted to approximately 20% in both markets.
The U.S. operations were also hampered by delays in the roll out of the new suite of tools.
Revenue increased in all regions outside of Canada and the U.S. as the segment’s expanded international
presence facilitated the participation in a broader spectrum of projects.The political situation in Venezuela did
have a negative effect on revenue as oil and gas production activity in that country was virtually shut down in the
last six weeks of the year.
Having set up regional operations centers in 2001, the strategy was to establish brand recognition for
Precision through successful completion of competitively bid projects.With these expanded operations,
Precision increased its recognition as a viable alternative to the historical group of oilfield service providers in
many international markets. However, the scope of the TS growth initiatives, in terms of both geography and
product lines, combined with the impact of delays in the deployment of new technologies, resulted in operations
support and administrative organizations that were uneconomic for the start-up revenue levels realized.This is
also reflected in operating and general and administrative expense which grew 13.4% while revenue declined
by 1.8%.
P R E C I S I O N D R I L L I N G C O R P O R A T I O N
page64

Ren ta l and P roduc t i on(Stated in thousands of Canadian dollars)
% of % of % of Years ended December 31, 2003 Revenue 2002 Revenue 2001 Revenue
Revenue $ 210,724 $ 192,840 $ 194,567
Expenses:
Operating 147,911 70.2 139,781 72.5 132,832 68.3
General and administrative 10,479 5.0 9,518 4.9 9,484 4.9
Depreciation 12,533 5.9 13,159 6.8 13,388 6.9
Foreign exchange 451 0.2 292 0.2 (502) (0.3)
Operating earnings $ 39,350 18.7 $ 30,090 15.6 $ 39,365 20.2
% Increase % Increase % Increase2003 (Decrease) 2002 (Decrease) 2001 (Decrease)
Equipment rental days (000’s) 820 35.1 607 (34.4) 925 37.9
Plant maintenance man-days (000’s) 272 5.0 259 12.6 230 15.0
2003 Compared to 2002
Revenue in the Rental and Production segment increased by 9% in 2003 compared to 2002. Both the oilfield
equipment rental and industrial plant maintenance operations contributed to the increase. Equipment rental
days increased in conjunction with increased drilling activity and operating earnings in this business improved
significantly as most expenses are fixed in nature.
The cornerstone to the plant maintenance operations continues to be the work performed at the oilsands
projects in northern Alberta.The division’s ability to offer the complete suite of cleaning, mechanical, catalyst
and dredging services required to maintain these large projects, and the continued training and development of
its employees, differentiates it from its competitors. Recognition of the value this business brings to its customers
has resulted in continued steady revenue growth and consistent operating margins.
2002 Compared to 2001
Revenue declined modestly as reductions in the oilfield equipment rental business was only partially offset
by increases in the industrial plant maintenance operation.The rental business saw revenue decline in
conjunction with reduced Canadian drilling activity.This also impacted overall segment profitability as the rental
business has higher margins than the plant maintenance business.
A N N U A L R E P O R T 2003
page65M A N A G E M E N T ’ S D I S C U S S I O N A N D A N A L Y S I S

The plant maintenance business benefited from commissioning work performed at a new heavy oil upgrading
plant and continued high levels of maintenance work at oil sands projects in northern Alberta. Operating margins
were consistent with 2001. During the year, this business was expanded through the acquisition of a vacuum
truck operation in northern Alberta.
Othe r I t ems
2003 Compared to 2002
Corporate and Other Expenses
Expenses in the Corporate and Other segment increased by $4.1 million in 2003 compared to 2002.
In contrast to last year, variable compensation payments tied to corporate performance increased in 2003. In
addition, directors and officers insurance premiums have increased as a result of increased scrutiny of corporate
governance practices of public equity market participants in North America and around the world. General and
administrative expenses are also affected by the ongoing requirements surrounding Sarbanes-Oxley legislation.
Interest Expense
Net interest expense remained constant at $35 million in 2003 and 2002.The impact of a $24 million
increase in average debt outstanding was offset by reduced interest rates. As anticipated at the end of last year,
interest coverage, defined as operating earnings divided by net interest expense, returned to 2001 levels. Interest
coverage in 2003, 2002 and 2001 was approximately 9, 4 and 8 times respectively, and is expected to improve in
2004 with the free cash flow being generated.
Income Taxes
The Corporation’s effective tax rate on earnings from continuing operations before income taxes,
non-controlling interest and goodwill amortization in 2003 was 27.3% compared to 25.3% in 2002.The Alberta
government reduced tax rates by 0.5% in each of 2003 and 2002. Canadian GAAP requires that the effect of
these rate reductions be reflected as a decrease of future tax expense.The impact of these rate reductions on tax
expense was similar in 2003 and 2002 at $3 million and $2.6 million respectively. However, given the higher
before tax earnings in 2003 compared to 2002, the impact of the reductions on the Corporation’s effective tax
rate amounted to 1.1 percentage points in 2003 versus 2.1 in 2002.
Similarly, the Corporation’s organization structure generates tax savings which, in absolute dollar terms, are
relatively consistent from year to year. In 2003 these tax savings reduced the effective tax rate by 4.1 percentage
points compared to 9.4 in 2002.
P R E C I S I O N D R I L L I N G C O R P O R A T I O N
page66

In the absence of the above factors the Corporation’s effective tax rate would have been 32.6% in 2003
compared to 36.8% in 2002.This decrease is a reflection of the tax rate reduction initiatives of the Canadian
Federal and Alberta Provincial governments and of the mix of income from different tax rate jurisdictions.The
Corporation’s effective tax rate is expected to be in the range of 32 – 34% in 2004.
2002 Compared to 2001
Corporate and Other Expenses
Net expenses for Corporate and Other declined by $1.2 million in 2002 compared to 2001.The primary
reason was the reduction in variable compensation payments, which are tied to corporate performance.
Interest Expense
Net interest expense declined by $7.9 million in 2002 as a result of reduced cost of borrowing due to
declining interest rates and reduced borrowing levels.The average debt outstanding in 2002 was $568.4 million
compared to $630.8 million in 2001. Interest coverage, defined as operating earnings divided by net interest
expense, declined to 4 times in 2002 compared to 8 times in 2001.
Income Taxes
The effective tax rate on earnings before income taxes and goodwill amortization was 25.3% in 2002
compared to 35.6% in 2001.This reduction is due to the combined impact of tax rate reductions instituted by
both the Alberta and Canadian governments and income taxed in jurisdictions with lower tax rates.
The effective tax rate in 2002 and 2001 was reduced by 0.5% and 2%, respectively, as a result of tax rate
decreases enacted by the Alberta government in those years. Canadian GAAP required that the effect of these
rate reductions be reflected as a decrease of future tax expense.The impact of these rate reductions was $2.6
million in 2002 and $6.0 million in 2001.
Goodwill Amortization
In 2001, standards under both Canadian and U.S. GAAP were issued that eliminated the amortization of
goodwill.These rules were adopted January 1, 2002 by the Corporation.
L IQUID I TY AND CAP I TAL RESOURCES
Historically the oilfield services business has been very cyclical. In managing the risk of this volatility,
Precision has adhered to its philosophy of maintaining a strong balance sheet. In addition, a strong balance sheet
has allowed the Corporation to grow through acquisition by providing the financial flexibility to respond to
attractive investment opportunities in the form of both acquisitions and internal growth.The following graph
gives a historical perspective on how Precision has managed its cash flows and its debt levels.
A N N U A L R E P O R T 2003
page67M A N A G E M E N T ’ S D I S C U S S I O N A N D A N A L Y S I S

In 2004 the Corporation expects cash flow from operations to approach $400 million and net capital
expenditures to amount to approximately $320 million. Another significant source of cash has been proceeds
from the exercise of employee stock options, which has contributed an average of $23 million over each of the
past three years ended December 31, 2003. In January 2004 the Corporation received $25 million from the
exercise of options and the total amount for the year is anticipated to exceed $50 million.
As a Corporation with multiple lines of business, Precision also regularly assesses each unit from the
perspective of strategic fit with future growth plans and profitability improvement initiatives. In 2003 the
Corporation received $67 million from the sale of business units identified as non-core, primarily the gas
compression business carried on by Energy Industries Inc. In February 2004, the Corporation completed the
sale of substantially all of the assets of Fleet Cementers, Inc. realizing proceeds of approximately $26 million
(US$20 million). A similar transaction is being pursued with respect to the Polar Completions division.
The Corporation exited 2003 with a long-term debt to long-term debt plus equity ratio of 19% and a ratio
of long-term debt to trailing cash flow from operations of 155%. Both measures showed improvement over
2002 when these ratios amounted to 25% and 258% respectively. Continued improvement is expected in 2004,
barring the impact of any significant acquisitions.
Precision has a number of lines of credit available to finance its activities, the most significant of which is a
$350 million extendable revolving unsecured facility with a syndicate led by a Canadian chartered bank. At
December 31, 2003, $140 million had been borrowed under this facility, the majority of which was used to
finance working capital requirements. Canadian oilfield activity peaks in the first quarter of every year with a
P R E C I S I O N D R I L L I N G C O R P O R A T I O N
page68
Percentage$ millions 600
400
500
300
200
100
0
Investment Equals Net Cash Costof Capital Expenditures andBusiness Acquisitions
Cash Flow Equals Funds from Operations
Debt to Capitalization Equals the Ratio of Long-term Debt toLong-term Debt Plus Equity
99 00 0201 03
35
20
25
30
15
10
5
0
INVESTMENT, CASH FLOW and CAPITALIZATION

swift reduction in the second quarter due to spring breakup which precludes the movement of heavy equipment.
As a result, accounts receivable are expected to increase by approximately $175 million during the first quarter
with a similar reduction in the second quarter.
The Corporation’s contractual obligations are outlined in the following table:
(Stated in thousands of Canadian dollars) Payments Due by Period
Less Than AfterTotal 1 Year 1 - 3 Years 4 - 5 Years 5 Years
Long-term debt $ 415,951 $ 16,566 $ 239,570 $ – $ 159,815
Capital lease obligations 629 592 37 – –
Operating leases 110,500 28,104 49,566 11,168 21,662
Total contractual obligations $ 527,080 $ 45,262 $ 289,173 $ 11,168 $ 181,477
CR I T I CAL ACCOUNT ING ES T IMATES
This Management’s Discussion and Analysis of Precision’s financial condition and results of operations is based
on its consolidated financial statements which are prepared in accordance with Canadian generally accepted
accounting principles.The Corporation’s significant accounting policies are described in Note 1 to its consolidated
financial statements.The preparation of these financial statements requires that certain estimates and judgments be
made that affect the reported assets, liabilities, revenues and expenses.These estimates and judgments are based
on historical experience and on various other assumptions that are believed to be reasonable under the
circumstances. Anticipating future events cannot be done with certainty, therefore these estimates may change as
new events occur, more experience is acquired and as the Corporation’s operating environment changes.
The accounting estimates believed to require the most difficult, subjective or complex judgments and which
are the most critical to our reporting of results of operations and financial position are as follows:
Allowance for Doubtful Accounts Receivable
The Corporation performs ongoing credit evaluations of our customers and grants credit based upon past
payment history, financial condition and anticipated industry conditions. Customer payments are regularly
monitored and a provision for doubtful accounts is established based upon specific situations and overall industry
conditions.The Corporation’s history of bad debt losses has been within expectations and generally limited to
specific customer circumstances, however, given the cyclical nature of the oil and gas industry and the inherent
risk of successfully finding hydrocarbon reserves, a customer’s ability to fulfill its payment obligations can change
suddenly and without notice. In addition, many of our customers are located in international areas that are
inherently subject to risks of economic, political and civil instabilities, which may impact our ability to collect
those accounts receivable.
A N N U A L R E P O R T 2003
page69M A N A G E M E N T ’ S D I S C U S S I O N A N D A N A L Y S I S
Excess and Obsolete Inventory Provisions
Quantities of inventory on hand are regularly reviewed and provisions for excess or obsolete inventory are
established based on historical usage patterns and known changes to equipment or processes that would render
specific items no longer usable in operations. Significant or unanticipated changes in business conditions could
impact the amount and timing of any additional provision for excess or obsolete inventory that may be required.
The TS segment of our operations involves the application of new technologies in its efforts to deliver superior
products to our customers and therefore has a greater risk of obsolescence due to finding or developing better
products.The TS inventories comprise 87% of our total inventory of $99 million.These inventories are reviewed
on a quarterly basis to assess the appropriateness of quantities and valuation.
Impairment of Long-Lived Assets
Long-lived assets, which includes property, plant and equipment, intangibles and goodwill, comprise the
majority of the Corporation’s assets.The carrying value of these assets is periodically reviewed for impairment
or whenever events or changes in circumstances indicate that their carrying amounts may not be recoverable.
This requires the Corporation to forecast future cash flows to be derived from the utilization of these assets
based upon assumptions about future business conditions and technological developments. Significant,
unanticipated changes to these assumptions could require a provision for impairment in the future. During the
fourth quarter of 2003 the Corporation completed its goodwill assessment incorporating the work of independent
valuation experts resulting in the conclusion that there was no impairment of the carrying value.
Depreciation and Amortization
The Corporation’s property, plant and equipment and its intangible assets are depreciated and amortized
based upon estimates of useful lives and salvage values.These estimates may change as more experience is
gained, market conditions shift or new technological advancements are made.The high depreciation expense
associated with the TS segment is anticipated to improve with the optimization of equipment fleet sizes in each
geographic region.
P R E C I S I O N D R I L L I N G C O R P O R A T I O N
page70

Income Taxes
The Corporation uses the liability method which takes into account the differences between financial
statement treatment and tax treatment of certain transactions, assets and liabilities. Future tax assets and liabilities
are recognized for the future tax consequences attributable to differences between the financial statement
carrying amounts of existing assets and liabilities and their respective tax bases.Valuation allowances are established
to reduce future tax assets when it is more likely than not that some portion or all of the asset will not be
realized. Estimates of future taxable income and the continuation of ongoing prudent tax planning arrangements
have been considered in assessing the utilization of available tax losses. Changes in circumstances and
assumptions and clarification of uncertain tax regimes may require changes to the valuation allowances
associated with the Corporation’s future tax assets.
New Accounting Standards
In 2003 the Canadian Institute of Chartered Accountants issued revised recommendations with respect to
accounting for stock based compensation. Effective January 1, 2004 the Corporation will retroactively apply
these new standards to all common share purchase options granted in 2002 and subsequent years. Under the
new standard, the fair value of common share purchase options will be calculated at the date of grant and that
value will be recorded as compensation expense over the vesting period of those grants. Under the previous
Canadian accounting standard, the Corporation had the choice of using the intrinsic value method of accounting
for grants of common share purchase options, which resulted in no associated compensation expense being
recognized, and disclosing in a note to the financial statements the impact of expensing the fair value of option
grants.This alternative still exists under U.S. generally accepted accounting principles.
BUS INESS R I SKS
Crude Oil and Natural Gas Prices
The price received by our customers for the crude oil and natural gas they produce has a direct impact on
cash flow available for them to finance the acquisition of services provided by the Corporation.
Prices for crude oil are established in a worldwide market in which supply and demand are subject to a vast
array of economic and political influences.This results in very volatile pricing; a prime example of which is West
Texas Intermediate crude oil trading at US$12 per barrel in late 1998 and in excess of US$40 per barrel at one
point in 2000. Natural gas prices are established in a more “local” North American market due to the requirement
to transport this gaseous product in pressurized pipelines. Demand for natural gas is seasonal and is correlated to
heating and electricity generation requirements. Demand for natural gas and fuel oils is also affected by consumers
ability to switch from one to the other to take advantage of relative price variations.
A N N U A L R E P O R T 2003
page71M A N A G E M E N T ’ S D I S C U S S I O N A N D A N A L Y S I S

The Corporation partially manages the risk of volatile commodity prices, and thus volatile demand for its
services, by striving to maintain cost structures that are scalable to activity levels. However, cost structures in
Contract Drilling are more variable in nature than those within TS. In addition, our strong balance sheet and
adherence to conservative financing practices provide the resilience to withstand and benefit from downturns
and upturns in the business cycle.
North American oilfield service activity is focused on natural gas. One objective of the Corporation’s
international growth initiatives is to increase our exposure to crude oil activity in less cyclical markets.
Workforce Availability
The Corporation’s ability to provide reliable services is dependent upon the availability of well trained,
experienced crews to operate our field equipment.We must also balance the requirement to maintain a skilled
workforce with the need to establish cost structures that vary as much as possible with activity levels.
Within Contract Drilling, our most experienced people are retained during periods of low utilization by
having them fill lower level positions on our field crews.The Corporation has established training programs
for employees new to the oilfield service sector and we work closely with industry associations to ensure
competitive compensation levels and to attract new workers to the industry as required.
Many of our Canadian businesses are currently experiencing manpower shortages. Over 50 drilling rigs
have been running without relief crews, requiring them to shut down when crews need time off.Technology
Services Canadian operations have been supported by additional people and equipment brought in from other
regional operations to meet peak winter demand.
Weather
The ability to move heavy equipment in the Canadian oil and natural gas fields is dependent on weather
conditions. As warm weather returns in the spring, the winter’s frost comes out of the ground rendering many
secondary roads incapable of supporting the weight of heavy equipment until they have thoroughly dried out.
The duration of this “spring breakup” has a direct impact on the Corporation’s activity levels. In addition, many
exploration and production areas in northern Canada are accessible only in winter months when the ground is
frozen hard enough to support equipment.The timing of freeze up and spring breakup affects the ability to move
equipment in and out of these areas.
P R E C I S I O N D R I L L I N G C O R P O R A T I O N
page72

Working with customers, we strive to position equipment where possible such that it can be working on
location during spring breakup, limiting the need to move equipment during this time period as much as
possible. However, many uncontrollable factors affect our ability to plan in this fashion and the spring breakup,
which can occur any time from late March through May, is traditionally our slowest time.
Technology
Technological innovation by oilfield service companies has improved the effectiveness of the entire exploration
and production sector over the industry’s 140-year history. Recently, development of directional and horizontal
drilling, controlled pressure drilling, coil tubing drilling, and methods of providing real time data during drilling
and production operations have increased production volumes and the recoverable amount of discovered
reserves. Innovations such as 3-D and 4-D seismic have improved the success rate of exploration wells partially
offsetting the decline in the quantity of drillable prospects.
Our ability to deliver more efficient services is critical to our continued success.The Corporation has
continuously built upon its experience and teamed with customers to provide solutions to their unique problems.
Our ability to design and build specialized equipment has kept us on the leading edge of technology. The success
of our in-house designed and built Super Single® rig, both in Canada and abroad, is testimony of our dedication
to these efforts.
The continued development of our Technology Services segment, and in particular the research and
development work of Advantage R&D, Inc., puts the Corporation at another level where high-end technological
innovation is paramount to success.We have a team of highly qualified experienced professionals, that has been
assembled and working together for over two years in state-of-the-art testing facilities.The technologies they
have developed over this time are at or near the commercial deployment stage, however, the success of future
technological endeavours is never certain.
Acquisition Integration
The Corporation has worked towards its strategic objective of becoming an integrated service provider
of sufficient size to benefit from economies of scale and to provide the foundation from which to pursue
international opportunities. Business acquisitions have been an important tool in this pursuit and will continue
to be so in the future. Continued successful integration of new businesses, people and systems is key to our
future success.
A N N U A L R E P O R T 2003
page73M A N A G E M E N T ’ S D I S C U S S I O N A N D A N A L Y S I S

Foreign Operations
The Corporation is working hard to export its expertise and technologies to oil and gas producing regions
around the world.With this comes the risk of dealing with business and political systems that are much different
than we are accustomed to in North America.The Corporation has hired employees who have experience
working in the international arena and it is committed to recruiting qualified resident nationals on the staffs of
all of its international operations.
Foreign Currency Exchange Rates
The Corporation has a number of sources of foreign currency exchange risk. On international contracts,
attempts are made to structure revenue streams such that a portion sufficient to match local expenditures is
denominated in the local currency, with the remainder being denominated in U.S. dollars. In addition, many of
our business units buy a portion of their parts and supplies from suppliers in the United States. Also, the
manufacturing effort associated with the deployment of the new suite of tools is taking place in the U.S. As a
result, the Corporation is presently a net payer of U.S. dollars.
Merger and Acquisition Activity
Merger and acquisition activity in the oil and gas exploration and production sector can impact demand for
our services as customers focus on reorganization activities prior to committing funds to significant drilling and
maintenance projects. Future merger and acquisition activity could have a short-term impact on our business,
but in the long-term should result in a stronger, more active market.
OUTLOOK
The fortunes of the oilfield services business are dictated by current and anticipated future crude oil and
natural gas prices.The supply and demand fundamentals that have brought prices to today’s relatively high levels
are not expected to change rapidly. Energy price prognosticators have historically focused on the supply side of
the equation where geopolitical events can have a large impact on short-term supply and where consensus was
generally that there was abundant supply to fill long-term requirements.This view is now starting to be
questioned in some corners.The surplus crude oil production capacity of the Middle East is being examined
with suggestions that it is not as high as once thought. Similarly, the ability to rapidly increase production of the
vast crude oil reserves in the former Soviet Union is being slowed by the recognition of the large amount of
infrastructure investment required. Recent world events have also brought security of supply issues to the top of
the energy agenda for many countries.
P R E C I S I O N D R I L L I N G C O R P O R A T I O N
page74

The North American natural gas market is also facing supply challenges. Natural gas directed drilling
activity has increased significantly in recent years, however this has only served to maintain production.
Liquefied natural gas, once viewed as the element that would increase gas supplies and thus reduce prices, is
now being thought of as a requirement to fill the void between future demand requirements and conventional
production capabilities. It is not anticipated that the price of natural gas will experience sustained downward
pressure from the supply side of the pricing equation any time soon.
Many analysts are now looking at the demand elements of energy pricing economics. Commodity prices
have risen over the last number of years in an environment where the major economies of the world were
generally in a period of slow growth.This is changing as growth rates in the major industrialized countries are
beginning to recover. Of particular importance to the outlook for the demand for energy is the emergence of
countries such as China where economic expansion is bringing new found purchasing power to a very large
population. On a per capita basis, these populations use energy at a fraction of the rate of other industrialized
nations.This should change as new products, such as automobiles and electric appliances, are introduced to these
markets which in turn should drive exponential growth in energy demand.
On the basis of these fundamentals, Precision is optimistic about the prospects to operate and grow our
businesses profitably. Canada will play a major role in supplying the energy needs of North America and our
dominant position in that market will continue to be the cornerstone of the Corporation. From this strong
foundation we will continue to step out into international markets where the opportunities are such that
operations can reach an efficient size in a reasonable time frame.The strength of our balance sheet will allow us
to examine acquisition opportunities that may allow this process to be accelerated.
A N N U A L R E P O R T 2003
page75M A N A G E M E N T ’ S D I S C U S S I O N A N D A N A L Y S I S

The accompanying consolidated financial statements and all information in the Annual Report are the
responsibility of management.The consolidated financial statements have been prepared by management in
accordance with the accounting policies in the notes to financial statements.When necessary, management has
made informed judgments and estimates in accounting for transactions which were not complete at the balance
sheet date. In the opinion of management, the financial statements have been prepared within acceptable limits of
materiality, and are in accordance with Canadian generally accepted accounting principles (GAAP) appropriate in
the circumstances.The financial information elsewhere in the Annual Report has been reviewed to ensure
consistency with that in the consolidated financial statements.
Management has prepared Management’s Discussion and Analysis (MD&A).The MD&A is based upon the
Corporation’s financial results prepared in accordance with Canadian GAAP. The MD&A compares the audited
financial results for the twelve months ended December 31, 2003 to December 31, 2002 and the twelve months
ended December 31, 2002 to December 31, 2001. Note 15 to the consolidated financial statements describes the
impact on the consolidated financial statements of significant differences between Canadian and United States GAAP.
Management maintains appropriate systems of internal control. Policies and procedures are designed to give
reasonable assurance that transactions are properly authorized, assets are safeguarded and financial records properly
maintained to provide reliable information for the preparation of financial statements.
KPMG LLP, an independent firm of Chartered Accountants, was engaged, as approved by a vote of shareholders
at the Corporation’s most recent Annual and Special Meeting, to audit the consolidated financial statements in
accordance with generally accepted auditing standards in Canada and provide an independent professional opinion.
The Audit Committee of the Board of Directors, which is comprised of three independent and unrelated
directors who are not employees of the Corporation, has discussed the consolidated financial statements, including
the notes thereto, with management and external Auditors.The consolidated financial statements have been
approved by the Board of Directors on the recommendation of the Audit Committee.
P R E C I S I O N D R I L L I N G C O R P O R A T I O N
page76
M A N A G E M E N T ’ S R E P O R T T O T H E S H A R E H O L D E R S
H A N K B . S W A R T O U TChairman of the Board, President and Chief Executive Officer
February 10, 2004
D A L E E . T R E M B L A YSenior Vice President Finance and Chief Financial Officer

We have audited the consolidated balance sheets of Precision Drilling Corporation as at December 31, 2003
and 2002 and the consolidated statements of earnings and retained earnings and cash flow for each of the years
in the three-year period ended December 31, 2003.These consolidated financial statements are the responsibility
of the Corporation’s management. Our responsibility is to express an opinion on these consolidated financial
statements based on our audits.
We conducted our audits in accordance with Canadian generally accepted auditing standards.Those standards
require that we plan and perform an audit to obtain reasonable assurance whether the financial statements are
free of material misstatement. An audit includes examining, on a test basis, evidence supporting the amounts and
disclosures in the financial statements. An audit also includes assessing the accounting principles used and
significant estimates made by management, as well as evaluating the overall financial statement presentation.
In our opinion, these consolidated financial statements present fairly, in all material respects, the financial
position of the Corporation as at December 31, 2003 and 2002 and the results of its operations and its cash flow
for each of the years in the three-year period ended December 31, 2003 in accordance with Canadian generally
accepted accounting principles.
Chartered AccountantsCalgary, Canada
February 10, 2004
A N N U A L R E P O R T 2003
page77F I N A N C I A L R E P O R T I N G
A U D I T O R S ’ R E P O R T T O T H E S H A R E H O L D E R S

As at December 31, (stated in thousands of dollars) 2003 2002
A S S E T S
Current assets:
Cash $ 21,370 $ 17,315
Accounts receivable 544,850 431,331
Income taxes recoverable – 8,712
Inventory (Note 3) 99,088 92,744
Assets of discontinued operations (Note 20) 21,150 51,725
686,458 601,827
Property, plant and equipment, net of accumulated depreciation (Note 4) 1,588,250 1,457,273
Intangibles, net of accumulated amortization of $19,844 (2002 – $13,792) 65,262 71,355
Goodwill 527,443 527,443
Other assets (Note 5) 8,932 17,443
Assets of discontinued operations (Note 20) 32,040 84,674
$ 2,908,385 $ 2,760,015
L I A B I L I T I E S A N D S H A R E H O L D E R S ’ E Q U I T Y
Current liabilities:
Bank indebtedness (Note 6) $ 147,909 $ 95,321
Accounts payable and accrued liabilities (Note 18) 260,545 257,913
Incomes taxes payable 7,373 –
Current portion of long-term debt (Note 7) 17,158 27,098
Liabilities of discontinued operations (Note 20) 5,212 11,239
438,197 391,571
Long-term debt (Note 7) 399,422 514,878
Future income taxes (Note 11) 320,599 311,164
Future income taxes of discontinued operations (Note 20) 1,107 7,383
Non-controlling interest 3,771 2,019
Shareholders’ equity:
Share capital (Note 8) 936,529 912,916
Retained earnings 808,760 620,084
1,745,289 1,533,000
Commitments and contingencies (Notes 10 and 19)
$ 2,908,385 $ 2,760,015
See accompanying notes to consolidated financial statements.
P R E C I S I O N D R I L L I N G C O R P O R A T I O N
page78C O N S O L I D A T E D B A L A N C E S H E E T S
H . G A R T H W I G G I N SDirector
Approved by the Board:
H A N K B . S W A R T O U TDirector

Years ended December 31, (stated in thousands of dollars, except per share amounts) 2003 2002 2001
(Restated – Note 2)
Revenue $ 1,917,933 $ 1,567,506 $ 1,815,208Expenses:
Operating 1,273,434 1,094,846 1,138,231General and administrative 136,747 144,466 143,521Depreciation and amortization 170,788 133,384 139,271Research and engineering 42,419 34,862 31,677Foreign exchange (2,565) 4,389 723
1,620,823 1,411,947 1,453,423Operating earnings 297,110 155,559 361,785Interest:
Long-term debt 34,492 34,378 43,577Other 1,425 1,334 556Income (867) (589) (1,074)
Dividend income – (39) (1,106)Gain on disposal of investments (3,355) (900) (1,805)Earnings from continuing operations before income taxes,
non-controlling interest and goodwill amortization 265,415 121,375 321,637Income taxes: (Note 11)
Current 59,681 64,762 17,841Future 12,851 (34,072) 96,631
72,532 30,690 114,472Earnings from continuing operations before
non-controlling interest and goodwill amortization 192,883 90,685 207,165Non-controlling interest 1,752 1,151 868
Earnings from continuing operationsbefore goodwill amortization 191,131 89,534 206,297
Goodwill amortization, net of tax (Note 2) – – 30,587Earnings from continuing operations 191,131 89,534 175,710Gain on disposal of discontinued operations (Note 20) 17,460 – –Discontinued operations, net of tax (Note 20) (19,915) 1,731 10,824Net earnings 188,676 91,265 186,534Retained earnings, beginning of year (Note 2) 620,084 528,819 342,285Retained earnings, end of year $ 808,760 $ 620,084 $ 528,819
Earnings per share from continuing operations before goodwill amortization (Note 12)
Basic $ 3.51 $ 1.67 $ 3.90Diluted $ 3.46 $ 1.63 $ 3.81
Earnings per share from continuing operations (Note 12)
Basic $ 3.51 $ 1.67 $ 3.31Diluted $ 3.46 $ 1.63 $ 3.23
Earnings per share: (Note 12)
Basic $ 3.47 $ 1.70 $ 3.52Diluted $ 3.41 $ 1.66 $ 3.44
See accompanying notes to consolidated financial statements.
A N N U A L R E P O R T 2003
page79F I N A N C I A L R E P O R T I N G
C O N S O L I D A T E D S T A T E M E N T S O F E A R N I N G S A N D R E T A I N E D E A R N I N G S

Years ended December 31,(stated in thousands of dollars) 2003 2002 2001
(Restated – Note 2)
Cash provided by (used in):Continuing operations:
Earnings from continuing operations $ 191,131 $ 89,534 $ 175,710Items not affecting cash:
Depreciation and amortization 170,788 133,384 139,271Goodwill amortization – – 30,587Future income taxes 12,851 (34,072) 96,631Gain on disposal of investments (3,355) (900) (1,805)Amortization of deferred financing costs 1,286 1,294 1,302Unrealized foreign exchange loss (gain)
on long-term monetary items (16,433) (2,039) 6,576Non-controlling interest 1,752 1,151 868
Funds provided by continuing operations 358,020 188,352 449,140Changes in non-cash working capital balances (Note 18) (101,146) (601) (22,600)
256,874 187,751 426,540Discontinued operations: (Note 20)
Funds provided by (used in) discontinued operations (5,692) 6,868 17,261Changes in non-cash working capital balances of
discontinued operations 7,245 4,604 (11,571)1,553 11,472 5,690
Investments:Business acquisitions, net of cash acquired (Note 14) (6,800) (4,594) (35,557)Purchase of property, plant and equipment (314,921) (267,794) (366,019)Purchase of intangibles (6) (4,198) (5,673)Proceeds on sale of property, plant and equipment 24,423 32,449 31,001Proceeds on disposal of investments 10,966 1,872 2,283Investments (1,080) (5,672) 227Proceeds on disposal of discontinued operations 67,274 – –
(220,144) (247,937) (373,738)Financing:
Increase in long-term debt 85,228 119,380 22,083Repayment of long-term debt (145,657) (102,275) (83,437)Deferred financing costs on long-term debt – – (38)Issuance of common shares on exercise of options 23,613 25,756 20,294Issuance of common shares on exercise of warrants – – 2,371Change in bank indebtedness 2,588 9,937 (27,236)
(34,228) 52,798 (65,963)Increase (decrease) in cash 4,055 4,084 (7,471)Cash, beginning of year 17,315 13,231 20,702Cash, end of year $ 21,370 $ 17,315 $ 13,231
See accompanying notes to consolidated financial statements.
P R E C I S I O N D R I L L I N G C O R P O R A T I O N
page80C O N S O L I D A T E D S T A T E M E N T S O F C A S H F L O W

Precision Drilling Corporation (the “Corporation”) is a global oilfield services company providing a broad range of
drilling, production and evaluation services with focus on fulfilling customer needs through fit-for-purpose technologies.
The financial statements are prepared in accordance with generally accepted accounting principles (GAAP) in
Canada. Management is required to make estimates and assumptions that affect the reported amounts of assets and
liabilities and disclosure of contingent assets and liabilities at the date of the financial statements and the reported
amounts of revenues and expenses during the reported period. Actual results could differ from these estimates.
Significant Accounting Policies
(a) Principles of consolidation:
The consolidated financial statements include the accounts of the Corporation and its subsidiaries, all of which,
except one, are wholly-owned.
(b) Inventory:
Inventory is carried at the lower of average cost and replacement cost.
(c) Property, plant and equipment:
Drilling rig equipment is depreciated by the unit-of-production method based on 3,650 drilling days with a 20%
salvage value. Drill pipe and drill collars are depreciated over 1,100 drilling days and have no salvage value.
Service rig equipment is depreciated by the unit-of-production method based on 24,000 hours for single and
double rigs and 48,000 hours for heavy double rigs. Service rigs have a 20% salvage value.
Field technical equipment is depreciated by the straight-line method over periods ranging from 2 to 10 years.
Rental equipment is depreciated by the straight-line method over periods ranging from 10 to 15 years. Other
equipment is depreciated by the straight-line method over periods ranging from 3 to 10 years.
Light duty vehicles are depreciated by the straight-line method over 4 years. Heavy-duty vehicles are depreciated
by the straight-line method over periods ranging from 7 to 10 years.
Buildings are depreciated by the straight-line method over periods ranging from 10 to 30 years.
(d) Intangibles:
Intangibles, which are comprised of acquired patents, are recorded at cost and amortized by the straight-line
method over their useful lives ranging from 5 to 15 years.
A N N U A L R E P O R T 2003
page81
N O T E S T O C O N S O L I D A T E D F I N A N C I A L S T A T E M E N T S
(Tabular amounts stated in thousands of dollars except per share amounts)
note 1:
F I N A N C I A L R E P O R T I N G

(e) Goodwill:
Goodwill is the residual amount that results when the purchase price of an acquired business exceeds the sum
of the amounts allocated to the assets acquired, less liabilities assumed, based on their fair values. Goodwill is
allocated as of the date of the business combination to the Corporation’s reporting segments that are expected to
benefit from the business combination.
Goodwill is not amortized and is tested for impairment annually in the fourth quarter, or more frequently if
events or changes in circumstances indicate that the asset might be impaired.The impairment test is carried out
in two steps. In the first step, the carrying amount of the reporting segment is compared with its fair value.
When the fair value of a reporting segment exceeds its carrying amount, goodwill of the reporting segment is
considered not to be impaired and the second step of the impairment test is unnecessary.The second step is carried
out when the carrying amount of a reporting segment exceeds its fair value, in which case the implied fair value
of the reporting segment’s goodwill is compared with its carrying amount to measure the amount of the
impairment loss, if any.The implied fair value of goodwill is determined in the same manner as the value of
goodwill is determined in a business combination described in the preceding paragraph, using the fair value of the
reporting segment as if it was the purchase price.When the carrying amount of the reporting segment’s goodwill
exceeds the implied fair value of the goodwill, an impairment loss is recognized in an amount equal to the excess.
(f) Investments:
Investments in shares of associated companies, over which the Corporation has significant influence, are
accounted for by the equity method. Other investments are carried at cost. If there are other than temporary
declines in value, these investments are written down to their net realizable value.
(g) Deferred financing costs:
Costs associated with the issuance of long-term debt are deferred and amortized by the straight-line method over
the term of the debt.The amortization is included in interest expense.
(h) Income taxes:
The Corporation follows the liability method of accounting for future income taxes. Under the liability method,
future income tax assets and liabilities are determined based on “temporary differences” (differences between the
accounting basis and the tax basis of the assets and liabilities), and are measured using the currently enacted, or
substantively enacted, tax rates and laws expected to apply when these differences reverse. Income tax expense is
the sum of the Corporation’s provision for current income taxes and the difference between opening and ending
balances of the future income tax assets and liabilities.
P R E C I S I O N D R I L L I N G C O R P O R A T I O N
page82
(i) Revenue recognition:
The Corporation’s services are generally sold based upon purchase orders or contracts with the customer that
include fixed or determinable prices based upon daily, hourly or job rates. Customer contract terms do not
include provisions for significant post-service delivery obligations. Revenue is recognized when services and
equipment rentals are rendered and only when collectability is reasonably assured.
(j) Retirement allowance:
The Corporation has entered into an employment agreement with a senior officer, which provides for a one-time
payment upon retirement.The amount of this retirement allowance increases by a fixed amount for each year of
service over a ten year period commencing April 30, 1996.The estimated cost of this benefit is accrued and
charged to earnings on a straight-line basis over the 10-year period.
(k) Foreign currency translation:
Accounts of foreign operations, all of which are considered financially and operationally integrated, are translated
to Canadian dollars using average exchange rates for the year for revenue and expenses. Monetary assets and
liabilities are translated at the year-end current exchange rate and non-monetary assets and liabilities are
translated using historical rates of exchange. Gains or losses resulting from these translation adjustments are
included in net earnings.
Transactions in foreign currencies are translated at rates in effect at the time of the transaction. Monetary assets
and liabilities are translated at current rates. Gains and losses are included in net earnings.
(l) Stock-based compensation plans:
The Corporation has equity incentive plans, which are described in Note 8. No compensation expense is recognized
for these plans when stock options are issued. Any consideration received on exercise of the stock options is
credited to share capital.The Corporation discloses the pro forma effect of stock options grants, had those grants
been accounted for following the fair value method.
Effective January 1, 2004, the Corporation will retroactively adopt new required Canadian accounting standards
that will apply the fair value method to all stock options granted in 2002 and subsequent years.
Under the fair value method, the Corporation will calculate the fair value of stock option grants and record that
fair value as compensation expense over the vesting period of those grants.
(m) Research and engineering:
Research and engineering costs are charged to income as incurred. Costs associated with the development of
new operating tools and systems are expensed during the period unless the recovery of these costs can be
reasonably assured given the existing and anticipated future industry conditions. Upon successful completion and
field testing of the tools any deferred costs are transferred to the related capital asset accounts.
A N N U A L R E P O R T 2003
page83F I N A N C I A L R E P O R T I N G

(n) Per share amounts:
Basic per share amounts are calculated using the weighted average number of shares outstanding during the year.
Diluted per share amounts are calculated based on the treasury stock method, which assumes that any proceeds
obtained on exercise of options would be used to purchase common shares at the average market price during
the period.The weighted average number of shares outstanding is then adjusted by the net change.
(o) Comparative figures:
Certain comparative figures have been reclassified to conform with the current financial statement presentation.
Accounting Changes
(a) Accounting for business combinations, goodwill and other intangible assets:
Effective January 1, 2002, the Corporation prospectively adopted the new Canadian accounting standards relating
to business combinations and goodwill and other intangible assets, as outlined in Note 1(e).
(b) Foreign currency translation:
Effective January 1, 2002, the Corporation adopted, on a retroactive basis, a new Canadian accounting standard
whereby unrealized gains or losses are not deferred and amortized as previously required but rather expensed
as incurred.
As a result of this change, unrealized gains and losses related to translation of foreign currency denominated
long-term debt are no longer deferred and amortized over the term of the debt but are expensed as incurred.
Prior period results have been restated to reflect this change.The retroactive application of this standard has
reduced the opening balance of retained earnings by $1.6 million and $115,000 at January 1, 2002 and
January 1, 2001 respectively.
Inventory2003 2002
Operating supplies and spare parts $ 95,254 $ 86,002
Manufacturing parts and materials 3,834 6,742
$ 99,088 $ 92,744
P R E C I S I O N D R I L L I N G C O R P O R A T I O N
page84
note 2:
note 3:
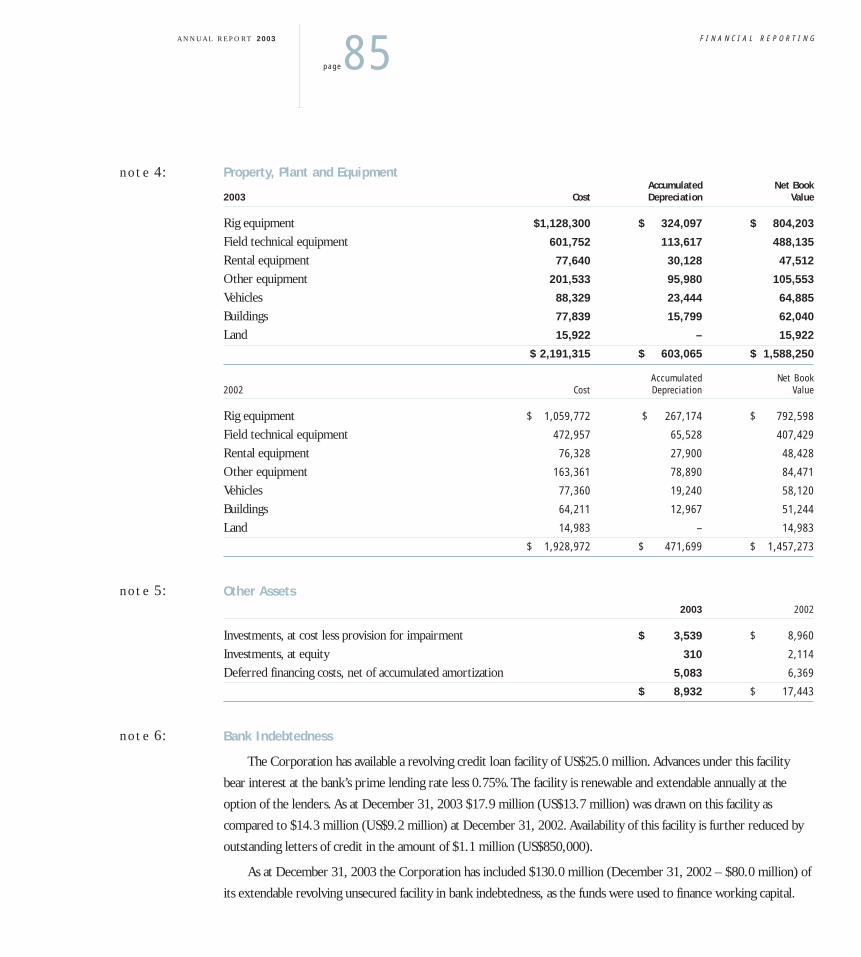
Property, Plant and EquipmentAccumulated Net Book
2003 Cost Depreciation Value
Rig equipment $1,128,300 $ 324,097 $ 804,203
Field technical equipment 601,752 113,617 488,135
Rental equipment 77,640 30,128 47,512
Other equipment 201,533 95,980 105,553
Vehicles 88,329 23,444 64,885
Buildings 77,839 15,799 62,040
Land 15,922 – 15,922
$ 2,191,315 $ 603,065 $ 1,588,250
Accumulated Net Book2002 Cost Depreciation Value
Rig equipment $ 1,059,772 $ 267,174 $ 792,598
Field technical equipment 472,957 65,528 407,429
Rental equipment 76,328 27,900 48,428
Other equipment 163,361 78,890 84,471
Vehicles 77,360 19,240 58,120
Buildings 64,211 12,967 51,244
Land 14,983 – 14,983
$ 1,928,972 $ 471,699 $ 1,457,273
Other Assets2003 2002
Investments, at cost less provision for impairment $ 3,539 $ 8,960
Investments, at equity 310 2,114
Deferred financing costs, net of accumulated amortization 5,083 6,369
$ 8,932 $ 17,443
Bank Indebtedness
The Corporation has available a revolving credit loan facility of US$25.0 million. Advances under this facility
bear interest at the bank’s prime lending rate less 0.75%.The facility is renewable and extendable annually at the
option of the lenders. As at December 31, 2003 $17.9 million (US$13.7 million) was drawn on this facility as
compared to $14.3 million (US$9.2 million) at December 31, 2002. Availability of this facility is further reduced by
outstanding letters of credit in the amount of $1.1 million (US$850,000).
As at December 31, 2003 the Corporation has included $130.0 million (December 31, 2002 – $80.0 million) of
its extendable revolving unsecured facility in bank indebtedness, as the funds were used to finance working capital.
A N N U A L R E P O R T 2003
page85F I N A N C I A L R E P O R T I N G
note 5:
note 6:
note 4:

Long-Term Debt2003 2002
Unsecured debentures – Series 1 $ 200,000 $ 200,000
Unsecured debentures – Series 2 150,000 150,000
EDC facility (2003 – US$2,639; 2002 – US$7,917) 3,459 12,255
EDC facility (2003 – US$20,000; 2002 – US$30,000) 26,214 46,440
EDC facility (US$20,190) 26,463 –
Extendable revolving unsecured facility 9,815 128,318
Other 629 4,963
416,580 541,976
Less amounts due within one year 17,158 27,098
$ 399,422 $ 514,878
The $200.0 million 6.85% Series 1 unsecured debentures mature June 26, 2007 and have an effective interest
rate of 7.44% after taking into account deferred financing costs.The debentures are redeemable at any time at the
option of the Corporation upon payment of a redemption price equal to the greater of an amount calculated with
reference to the yield on a Government of Canada bond with the same maturity, and par.
The $150.0 million 7.65% Series 2 unsecured debentures mature October 27, 2010 and have an effective interest
rate of 7.71% after taking into account deferred financing costs.The debentures are redeemable at any time at the
option of the Corporation upon payment of a redemption price equal to the greater of an amount calculated with
reference to the yield on a Government of Canada bond with the same maturity, and par.
The $3.5 million unsecured term financing facility with Export Development Canada (EDC) is repayable in
semi-annual installments, matures on January 20, 2004 and bears interest at six-month U.S. Libor plus applicable
margin.The margin is dependent upon the Corporation’s credit rating, which at December 31, 2003 resulted in a
margin of 0.8%.
The $26.2 million unsecured term financing facility with EDC is repayable over five years in semi-annual
installments, matures September 15, 2005 and bears interest at six-month U.S. Libor plus applicable margin.The
margin is dependent upon the Corporation’s credit rating, which at December 31, 2003 results in a margin of 0.9%.
The $26.5 million unsecured financing facility with EDC matures on October 24, 2004 and bears interest at
six-month U.S. Libor plus applicable margin.The margin is dependent upon the Corporation’s margin on its $350.0
million extendable revolving unsecured credit facility, which at December 31, 2003 resulted in a margin of 0.8%.The
facility is extendable upon mutual agreement between the Corporation and the Lender, or can be converted, at the
Corporation’s option, to a term loan repayable in two equal semi-annual installments, with the first payment due
April 25, 2005.
P R E C I S I O N D R I L L I N G C O R P O R A T I O N
page86
note 7:

The Corporation has an extendable revolving unsecured facility of $350.0 million (or U.S. equivalent) with a
syndicate led by a Canadian chartered bank. Advances are available at either the bank’s prime lending rate, U.S. base
rate, U.S. Libor plus applicable margin or Bankers’ Acceptance plus applicable margin or in combination.The
applicable margin is dependent on the Corporation’s credit rating and the percentage of the total facility outstanding,
which at December 31, 2003 resulted in a margin of 0.8%.The facility is extendable annually at the option of the
lenders. Should this facility not be extended, outstanding amounts will be transferred to a two-year term facility
repayable in equal quarterly installments. As at December 31, 2003 the Corporation had drawn $139.8 million under
this facility, of which $130.0 million has been included in bank indebtedness as the funds were used to finance
working capital.
Principal repayments over the next five years are as follows:
2004 $ 17,158
2005 39,588
2006 19
2007 200,000
2008 –
Thereafter 159,815
$ 416,580
Share Capital
(a) Authorized:
• unlimited number of non-voting cumulative convertible redeemable preferred shares without nominal or par value;
• unlimited number of common shares without nominal or par value.
(b) Issued:Common Shares: Number Amount
Balance, December 31, 2000 52,283,053 $ 864,495
Options exercised 855,935 20,294
Warrants exercised 37,050 2,371
Balance, December 31, 2001 53,176,038 $ 887,160
Options exercised 890,715 25,756
Balance, December 31, 2002 54,066,753 $ 912,916
Options exercised 778,925 23,613
Balance, December 31, 2003 54,845,678 $ 936,529
A N N U A L R E P O R T 2003
page87F I N A N C I A L R E P O R T I N G
note 8:

(c) Equity Incentive Plans:
The Corporation has equity incentive plans under which a combined total of 3,966,711 options to purchase
common shares are reserved to be granted to employees and directors. Of the amount reserved, 3,393,194 options
have been granted. Under these plans, the exercise price of each option equals the market value of the
Corporation’s stock on the date of the grant and an option’s maximum term is 10 years. Options vest over a period
from 1 to 4 years from the date of grant as employees or directors render continuous service to the Corporation.
A summary of the equity incentive plans as at December 31, 2001, 2002 and 2003, and changes during the
periods then ended is presented below:Weighted
Range of AverageOptions Exercise Exercise Options
Outstanding Price Price Exercisable
Outstanding at December 31, 2000 4,474,103 $ 13.50 - 54.20 $ 31.18 946,087
Granted 1,055,350 31.05 - 65.90 44.03
Exercised (855,935) 13.50 - 44.38 23.71
Cancelled or expired (267,237) 25.50 - 52.39 38.63
Outstanding at December 31, 2001 4,406,281 $ 13.50 - 65.90 $ 35.21 1,217,428
Granted 786,050 41.06 - 52.61 48.77
Exercised (890,715) 13.50 - 44.38 28.92
Cancelled or expired (182,288) 25.50 - 65.90 40.19
Outstanding at December 31, 2002 4,119,328 $ 13.50 - 65.90 $ 38.93 1,627,777
Granted 416,000 49.28 - 51.04 50.61
Exercised (778,925) 13.50 - 51.00 30.34
Cancelled or expired (363,209) 31.05 - 65.90 44.89
Outstanding at December 31, 2003 3,393,194 $ 13.50 - 65.90 $ 41.69 2,038,198
The range of exercise prices for options outstanding at December 31, 2003 are as follows:
Total Options Outstanding Exercisable Options
WeightedWeighted Average WeightedAverage Remaining AverageExercise Contractual Exercise
Range of Exercise Prices: Number Price Life (Years) Number Price
$ 13.50 - 19.99 161,486 $ 14.12 0.39 161,486 $ 14.12
20.00 - 29.99 51,300 28.98 0.79 51,300 28.98
30.00 - 39.99 1,089,665 34.96 1.21 907,940 35.29
40.00 - 49.99 1,029,943 42.86 3.34 557,172 42.29
50.00 - 59.99 1,038,300 51.98 4.69 359,050 53.24
60.00 - 65.90 22,500 65.81 2.55 1,250 65.10
$ 13.50 - 65.90 3,393,194 $ 41.69 2.89 2,038,198 $ 38.55
P R E C I S I O N D R I L L I N G C O R P O R A T I O N
page88

In accordance with the Corporation’s stock option plans, these options have an exercise price equal to the market
price at date of grant.The per share weighted average fair value of stock options granted during the year ended
December 31, 2003 was $19.48 (2002 – $20.85) based on the date of grant using the Black-Scholes option
pricing model with the following assumptions: average risk-free interest rate of 3.47% (2002 – 4.53%), average
expected life of 3.42 years (2002 – 3.88 years) and expected volatility of 47% (2002 – 49%).
Had the Corporation determined compensation costs based on the fair value at the date of grant for stock
options granted since January 1, 2002; net earnings and earnings per share (EPS) would have decreased to the
pro forma amounts indicated below.These pro forma amounts reflect compensation cost amortized over the
option’s vesting period.2003 2002
Years Ended December 31 As Reported Pro forma As Reported Pro forma
Net earnings $ 188,676 $ 178,993 $ 91,265 $ 85,071
Basic EPS $ 3.47 $ 3.29 $ 1.70 $ 1.59
Diluted EPS $ 3.41 $ 3.24 $ 1.66 $ 1.55
Employee Benefit Plans
The Corporation has a defined contribution employee benefit plan covering a significant number of its employees.
The Corporation matches individual employee contributions up to 5% of the employee’s compensation. Employer matching
contributions under the plan totalled $7.5 million for the year ended December 31, 2003 (year ended December 31, 2002
– $6.9 million; year ended December 31, 2001 – $6.3 million).
With respect to the retirement allowance described in Note 1(j), the Corporation charged $351,000 to earnings
in 2003 (2002 – $371,000; 2001 – $360,000) and at December 31, 2003 had accrued a total of $2.5 million, which
amount is included in accounts payable and accrued liabilities.
Commitments
The Corporation has commitments for operating lease agreements, primarily for vehicles and office space, in the
aggregate amount of $110.5 million. Payments over the next five years are as follows:
2004 $ 28,104
2005 21,439
2006 15,948
2007 12,179
2008 11,168
A N N U A L R E P O R T 2003
page89F I N A N C I A L R E P O R T I N G
note 9:
note 10:

Rent expense included in the statements of earnings is as follows:
2003 $ 23,924
2002 18,085
2001 16,923
Income Taxes
The provision for income taxes differs from that which would be expected by applying statutory rates.
A reconciliation of the difference is as follows:2003 2002 2001
Earnings before income taxes, non-controlling interest,
discontinued operations and goodwill amortization $ 265,415 $ 121,375 $ 321,637
Income tax rate 36% 39% 42%
Expected income tax provision $ 95,549 $ 47,336 $ 135,088
Add (deduct):
Non-deductible expenses 2,380 2,084 3,861
Income taxed in jurisdictions with lower tax rates (14,062) (13,450) (14,302)
Non-taxable disposition of investment (2,327) – –
Other (6,020) (2,729) (4,211)
75,520 33,241 120,436
Reduction of future tax balances due to
substantively enacted tax rate reductions (2,988) (2,551) (5,964)
$ 72,532 $ 30,690 $ 114,472
In both 2003 and 2002, the Province of Alberta enacted a 0.5% reduction in tax rates and in 2001 it enacted a
2% reduction in tax rates.These rate changes have been reflected as a reduction in future tax expense in 2003, 2002
and 2001.
The Corporation’s operations are complex and computation of the provision for income taxes involves tax
interpretations, regulations and legislation that are continually changing.There are tax matters that have not yet been
confirmed by taxation authorities, however, management believes the provision for income taxes is adequate.
P R E C I S I O N D R I L L I N G C O R P O R A T I O N
page90
note 11:

The net future tax liability is comprised of the tax effect of the following temporary differences:2003 2002
Liabilities:
Property, plant and equipment and intangibles $ 290,371 $ 288,720
Assets held in partnership with different tax year 92,163 50,640
Deferred financing costs 1,774 2,385
$ 384,308 $ 341,745
Assets:
Losses carried forward $ 63,431 $ 29,070
Accrued liabilities 278 1,511
63,709 30,581
$ 320,599 $ 311,164
The Corporation has available losses of $251.4 million of which the benefit of $181.9 million has been recognized.
These losses expire depending upon the year incurred and various limitations under tax codes in the jurisdictions in
which the losses were incurred.
Per Share Amounts
Per share amounts have been calculated on the weighted average number of common shares outstanding.
The weighted average shares outstanding for the year ended December 31, 2003 was 54,430,468 (year ended
December 31, 2002 – 53,701,873; year ended December 31, 2001 – 52,952,879).
Diluted per share amounts reflect the dilutive effect of the exercise of the options outstanding.The diluted shares
for the year ended December 31, 2003 was 55,299,920 (year ended December 31, 2002 – 54,815,167; year ended
December 31, 2001 – 54,198,348).
Significant Customers
During the years ended December 31, 2003, 2002 and 2001, no one customer accounted for more than 10% of
the Corporation’s revenue.
Acquisitions
Acquisitions have been accounted for by the purchase method with results of operations acquired included in
the financial statements from the effective date of acquisition.The details of acquisitions for the past three years are
as follows.
A N N U A L R E P O R T 2003
page91F I N A N C I A L R E P O R T I N G
note 12:
note 13:
note 14:

In February 2003, the Corporation completed the acquisition of the operating assets of MacKenzie Caterers
(1984) Ltd., a provider of oilfield camp and catering services in western Canada, for $6.8 million. No value was
assigned to intangibles or goodwill.
During the year ended December 31, 2002, the Corporation completed the following business acquisitions:
(a) Acquisition of the business assets of NightHawk Vacuum Services Ltd. (NightHawk) in September 2002.
NightHawk provides oilfield vacuum services in northern Alberta and British Columbia.
(b) Paid additional consideration in conjunction with an acquisition made in 2001.This additional consideration
was payable based on the development of a commercially viable technology.NightHawk Other Total
Net assets acquired at assigned values:
Working capital $ (47) $ – $ (47)
Property, plant and equipment 3,097 – 3,097
Goodwill – 1,544 1,544
3,050 1,544 4,594
Consideration:
Cash $ 3,050 $ 1,544 $ 4,594
During the year ended December 31, 2001, the Corporation completed business acquisitions, the most significant
of which was the acquisition of all the issued and outstanding shares of BecField Drilling Services Ltd. (BecField) in
January 2001. BecField provides directional drilling and measurement-while-drilling services through its technical
field and support personnel to the onshore and offshore oil and gas industry. It has established operations in Europe
and the Middle East.BecField Other Total
Net assets acquired at assigned values:
Working capital $ 2,446(a) $ 1,136(b) $ 3,582
Property, plant and equipment 5,036 4,074 9,110
Goodwill 23,877 2,783 26,660
Future income taxes – (800) (800)
$ 31,359 $ 7,193 $ 38,552
Consideration:
Cash $ 31,359 $ 7,193 $ 38,552
(a) includes cash of $ 1,880
(b) includes cash of $ 1,115
P R E C I S I O N D R I L L I N G C O R P O R A T I O N
page92

United States Generally Accepted Accounting Principles
These financial statements have been prepared in accordance with Canadian GAAP which, in the case of the
Corporation conform with United States generally accepted accounting principles (U.S. GAAP) in all material
respects, except as follows:
a) Income taxes:
In 2000 the Corporation adopted the liability method as described in Note 1 without restatement of prior years.
As a result, the Corporation recorded an adjustment to retained earnings and future tax liability in the amount of
$70 million at January 1, 2000. U.S. GAAP required the use of the liability method prescribed in the Statement of
Financial Accounting Standards (SFAS) No. 109, which substantially conforms with the Canadian GAAP
accounting standard adopted in 2000. Application of U.S. GAAP in years prior to 2000 would have resulted in
$70 million of additional goodwill being recognized at January 1, 2000 as opposed to an implementation adjustment
to retained earnings allowed under Canadian GAAP. In 2001, 2002 and 2003 the U.S. GAAP financial statements
would reflect an increase in goodwill of $63 million and a corresponding increase in retained earnings.An
additional charge to earnings of $3.5 million in 2001 would be required related to the amortization of
the goodwill.
Under Canadian GAAP, future tax liabilities and assets are calculated by reference to current tax legislation and
proposed legislation that is considered substantively enacted but not yet enacted into law. U.S. GAAP requires
that only enacted income tax legislation be used for calculation of future tax amounts. In 2000 the Federal
Government of Canada introduced tax rate reductions that were substantively enacted at December 31, 2000 but
that were not passed into legislation until 2001.The resulting reduction of future tax balances recognized under
Canadian GAAP in 2000 would not be recognized under U.S. GAAP until 2001.
The application of U.S. accounting principles would have the following impact on the consolidated
financial statements:
Consolidated Statements of EarningsYears ended December 31, 2003 2002 2001
Net earnings under Canadian GAAP $ 188,676 $ 91,265 $ 186,534
Adjustments under U.S. GAAP:
Goodwill amortization – – (3,502)
Income tax rate – – 19,934
Net income and comprehensive income
under U.S. GAAP $ 188,676 $ 91,265 $ 202,966
Earnings per share under U.S. GAAP:
Basic $ 3.47 $ 1.70 $ 3.83
Diluted $ 3.41 $ 1.66 $ 3.74
A N N U A L R E P O R T 2003
page93F I N A N C I A L R E P O R T I N G
note 15:

Balance SheetsDecember 31, 2003 December 31, 2002
As reported U.S. GAAP As reported U.S. GAAP
Current assets $ 686,458 $ 686,458 $ 601,827 $ 601,827
Property, plant and equipment 1,588,250 1,588,250 1,457,273 1,457,273
Intangibles 65,262 65,262 71,355 71,355
Goodwill 527,443 590,472 527,443 590,472
Other assets 8,932 8,932 17,443 17,443
Long-term assets
of discontinued operations 32,040 32,040 84,674 84,674
$ 2,908,385 $ 2,971,414 $ 2,760,015 $ 2,823,044
Current liabilities $ 438,197 $ 438,197 $ 391,571 $ 391,571
Long-term debt 399,422 399,422 514,878 514,878
Future income taxes 320,599 320,599 311,164 311,164
Liabilities of discontinued operations 1,107 1,107 7,383 7,383
Non-controlling interest 3,771 3,771 2,019 2,019
Shareholders’ equity 1,745,289 1,808,318 1,533,000 1,596,029
$ 2,908,385 $ 2,971,414 $ 2,760,015 $ 2,823,044
Consolidated Statement of Cash Flows
The application of U.S. accounting principles would have no impact on the consolidated statement of cash flows.
Stock Compensation
In 2003 and 2002 Canadian GAAP and U.S. GAAP were substantially the same with respect to stock
compensation. Prior to 2002, U.S. GAAP required the disclosure of the impact of using fair value accounting for
stock options if in fact this alternative was not used. Canadian GAAP did not require such disclosure.The per
share weighted average fair value of stock options granted during the year ended December 31, 2001 was $19.87
on the date of grant using the Black-Scholes option pricing model with the following assumptions: risk free
interest rate of 5.75%, expected life of 5 years and expected volatility of 49%.
Had the Corporation determined compensation cost based on the fair value at the date of grant for its stock
options under SFAS 123, net earnings in accordance with U.S. GAAP would have decreased by $12.2 million to
$190.8 million (basic EPS – $3.60) for the year ended December 21, 2001.
P R E C I S I O N D R I L L I N G C O R P O R A T I O N
page94
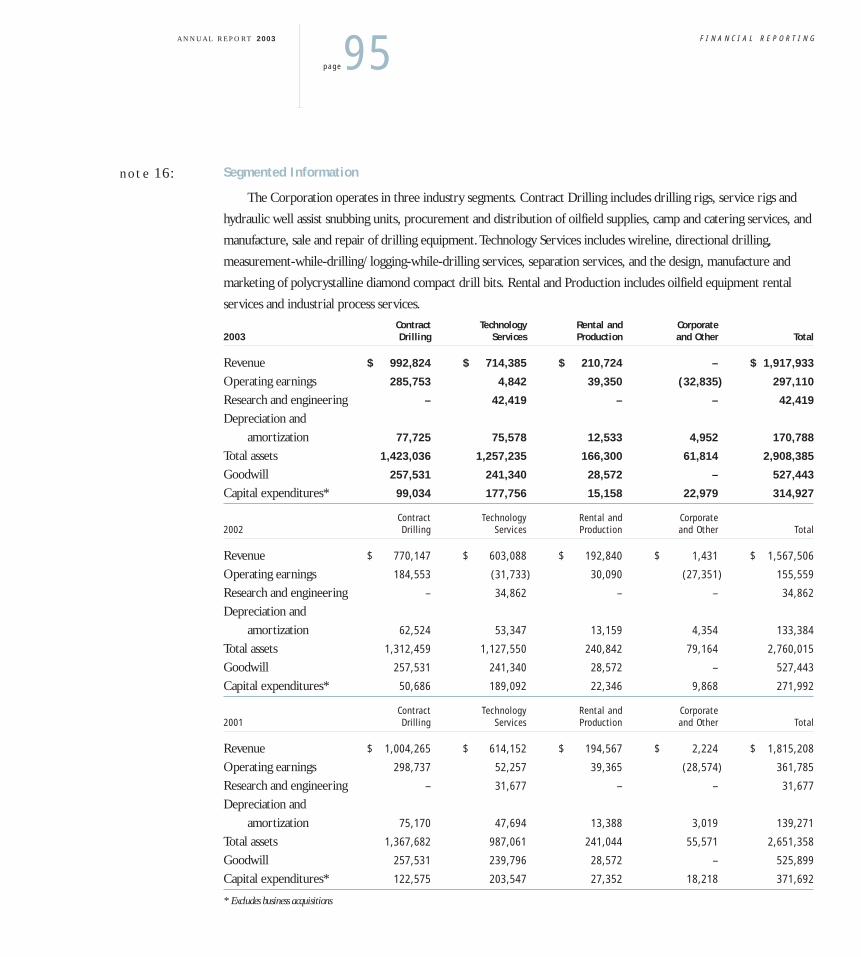
Segmented Information
The Corporation operates in three industry segments. Contract Drilling includes drilling rigs, service rigs and
hydraulic well assist snubbing units, procurement and distribution of oilfield supplies, camp and catering services, and
manufacture, sale and repair of drilling equipment.Technology Services includes wireline, directional drilling,
measurement-while-drilling/logging-while-drilling services, separation services, and the design, manufacture and
marketing of polycrystalline diamond compact drill bits. Rental and Production includes oilfield equipment rental
services and industrial process services.
Contract Technology Rental and Corporate2003 Drilling Services Production and Other Total
Revenue $ 992,824 $ 714,385 $ 210,724 – $ 1,917,933
Operating earnings 285,753 4,842 39,350 (32,835) 297,110
Research and engineering – 42,419 – – 42,419
Depreciation and
amortization 77,725 75,578 12,533 4,952 170,788
Total assets 1,423,036 1,257,235 166,300 61,814 2,908,385
Goodwill 257,531 241,340 28,572 – 527,443
Capital expenditures* 99,034 177,756 15,158 22,979 314,927
Contract Technology Rental and Corporate2002 Drilling Services Production and Other Total
Revenue $ 770,147 $ 603,088 $ 192,840 $ 1,431 $ 1,567,506
Operating earnings 184,553 (31,733) 30,090 (27,351) 155,559
Research and engineering – 34,862 – – 34,862
Depreciation and
amortization 62,524 53,347 13,159 4,354 133,384
Total assets 1,312,459 1,127,550 240,842 79,164 2,760,015
Goodwill 257,531 241,340 28,572 – 527,443
Capital expenditures* 50,686 189,092 22,346 9,868 271,992
Contract Technology Rental and Corporate2001 Drilling Services Production and Other Total
Revenue $ 1,004,265 $ 614,152 $ 194,567 $ 2,224 $ 1,815,208
Operating earnings 298,737 52,257 39,365 (28,574) 361,785
Research and engineering – 31,677 – – 31,677
Depreciation and
amortization 75,170 47,694 13,388 3,019 139,271
Total assets 1,367,682 987,061 241,044 55,571 2,651,358
Goodwill 257,531 239,796 28,572 – 525,899
Capital expenditures* 122,575 203,547 27,352 18,218 371,692
* Excludes business acquisitions
A N N U A L R E P O R T 2003
page95F I N A N C I A L R E P O R T I N G
note 16:
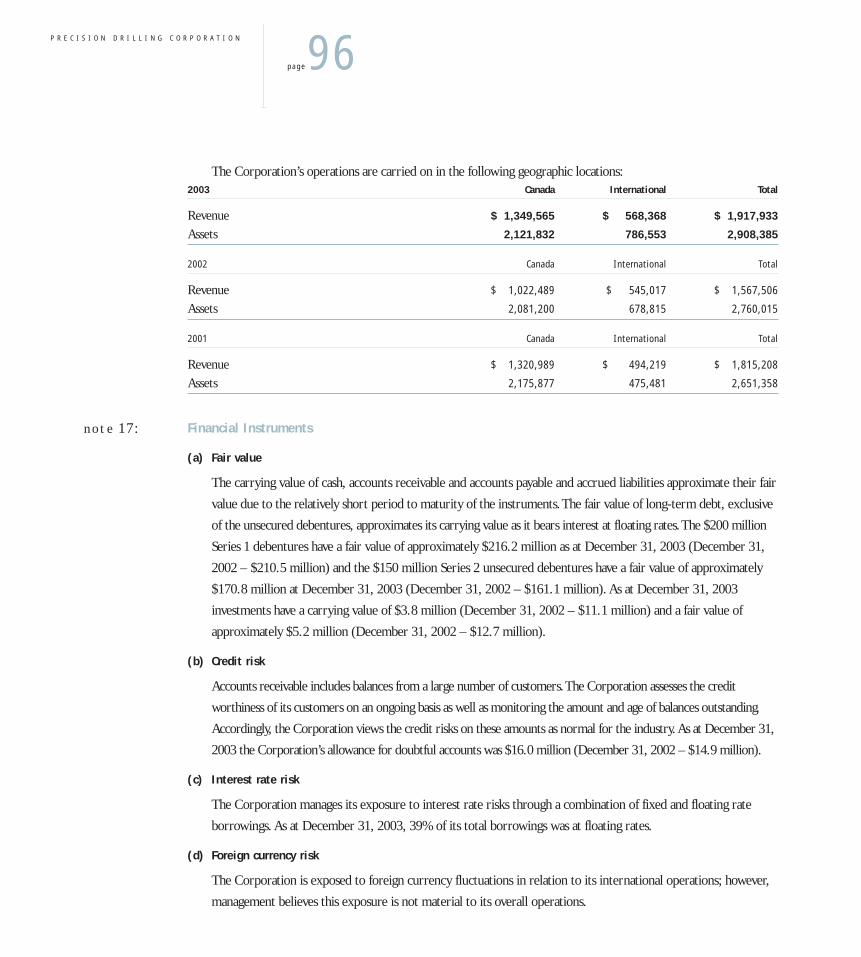
The Corporation’s operations are carried on in the following geographic locations:2003 Canada International Total
Revenue $ 1,349,565 $ 568,368 $ 1,917,933
Assets 2,121,832 786,553 2,908,385
2002 Canada International Total
Revenue $ 1,022,489 $ 545,017 $ 1,567,506
Assets 2,081,200 678,815 2,760,015
2001 Canada International Total
Revenue $ 1,320,989 $ 494,219 $ 1,815,208
Assets 2,175,877 475,481 2,651,358
Financial Instruments
(a) Fair value
The carrying value of cash, accounts receivable and accounts payable and accrued liabilities approximate their fair
value due to the relatively short period to maturity of the instruments.The fair value of long-term debt, exclusive
of the unsecured debentures, approximates its carrying value as it bears interest at floating rates.The $200 million
Series 1 debentures have a fair value of approximately $216.2 million as at December 31, 2003 (December 31,
2002 – $210.5 million) and the $150 million Series 2 unsecured debentures have a fair value of approximately
$170.8 million at December 31, 2003 (December 31, 2002 – $161.1 million). As at December 31, 2003
investments have a carrying value of $3.8 million (December 31, 2002 – $11.1 million) and a fair value of
approximately $5.2 million (December 31, 2002 – $12.7 million).
(b) Credit risk
Accounts receivable includes balances from a large number of customers.The Corporation assesses the credit
worthiness of its customers on an ongoing basis as well as monitoring the amount and age of balances outstanding.
Accordingly, the Corporation views the credit risks on these amounts as normal for the industry.As at December 31,
2003 the Corporation’s allowance for doubtful accounts was $16.0 million (December 31, 2002 – $14.9 million).
(c) Interest rate risk
The Corporation manages its exposure to interest rate risks through a combination of fixed and floating rate
borrowings. As at December 31, 2003, 39% of its total borrowings was at floating rates.
(d) Foreign currency risk
The Corporation is exposed to foreign currency fluctuations in relation to its international operations; however,
management believes this exposure is not material to its overall operations.
P R E C I S I O N D R I L L I N G C O R P O R A T I O N
page96
note 17:

Supplemental Information2003 2002 2001
Cash interest paid $ 36,721 $ 35,660 $ 45,967
Cash income taxes paid 43,994 89,856 11,066
Components of change in non-cash working capital balances:
Accounts receivable $ (113,519) $ 14,231 $ (35,607)
Inventory (6,344) (13,982) (18,245)
Accounts payable and accrued liabilities 2,632 20,000 15,878
Income taxes payable 16,085 (20,850) 15,374
$ (101,146) $ (601) $ (22,600)
The components of accounts payable and accrued liabilities are as follows:2003 2002
Accounts payable $ 62,958 $ 66,015
Accrued liabilities
Payroll 43,901 43,547
Other 153,686 148,351
$ 260,545 $ 257,913
Contingencies
The Corporation, through the performance of its services and product sales obligations, is sometimes named as a
defendant in litigation. One such case relates to a former agent of the Corporation in Indonesia who filed a suit in
Indonesian courts seeking a pronouncement that they be the sole agent for certain of the Corporation’s product lines
in Indonesia and they are seeking damages of US$17.5 million.This matter is at trial and all written evidence and oral
testimony has been presented by all parties.The outcome of this and other claims is not determinable at this time;
however, their ultimate resolution is not expected to have a material adverse effect on the Corporation.
The Corporation maintains a level of insurance coverage deemed appropriate by management and for matters for
which insurance coverage can be acquired.
A N N U A L R E P O R T 2003
page97F I N A N C I A L R E P O R T I N G
note 18:
note 19:

Discontinued Operations
On March 6, 2003, the Corporation sold Energy Industries Inc., a wholly-owned subsidiary included in the
Rental and Production segment, for $60.0 million cash.The effective date of the transaction was January 1, 2003.
Energy Industries designed and manufactured modularized natural gas compression packages. Although Energy
Industries had been profitable since its acquisition by Precision in 1996, the compression packaging business was
determined to be not core to the Corporation’s energy services globalization strategy.
In May 2003 the Corporation sold its 50% interest in Energy Equipment Rentals General Partnership (“EER”)
and Oil Drilling Exploration (Argentina) SA (“OD&E”) for cash proceeds of $6.9 million, net of transaction costs.
Both entities were components of the Contract Drilling segment.
The review of the business plan for the Technology Services segment was completed in the fourth quarter of
2003. One of the outcomes of this process was the identification of two product lines, namely pressure pumping and
completion services carried on by the Fleet Cementers and Polar Completions divisions respectively, as being not
core to the segment’s ongoing growth initiatives. As a result, a program has been initiated to dispose of these
businesses and discussions are being held with interested parties.
Results of the operations of these businesses have been classified as results of discontinued operations.The following
table provides additional information with respect to amounts included in the results of discontinued operations:2003 2002 2001
Gain on disposal of Energy Industries $ 13,071 $ – $ –
Gain on disposal of EER and OD&E 4,389 – –
$ 17,460 $ – $ –
Revenue
Gas compression $ – $ 81,563 $ 77,313
Pressure pumping and completion services 48,150 36,279 55,287
Other 560 3,802 5,755
Discontinued operations before income taxes $ 48,710 $ 121,644 $ 138,355
Results of operations before income taxes
Gas compression $ – $ 13,545 $ 11,685
Pressure pumping and completion services (15,585) (9,042) 7,078
Other 49 (1,154) (637)
Writedown of assets held for sale (10,799) – –
(26,335) 3,349 18,126
Income tax expense (recovery) (6,420) 1,618 7,302
Discontinued operations $ (19,915) $ 1,731 $ 10,824
P R E C I S I O N D R I L L I N G C O R P O R A T I O N
page98
note 20:
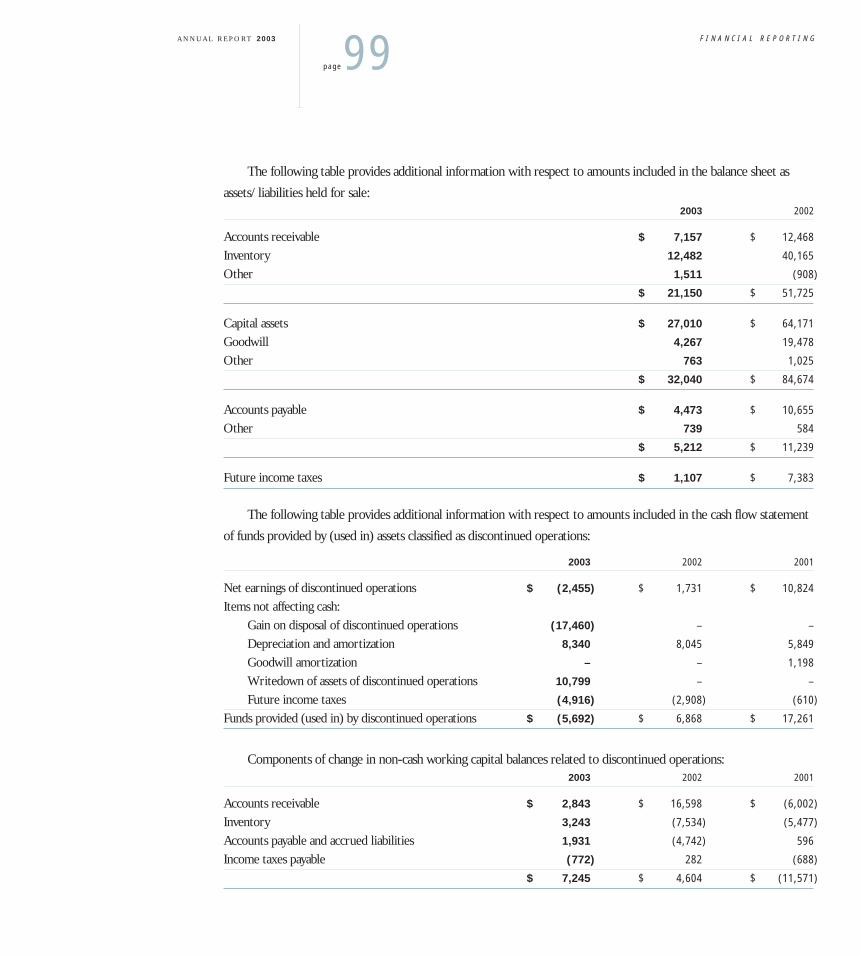
The following table provides additional information with respect to amounts included in the balance sheet as
assets/liabilities held for sale:2003 2002
Accounts receivable $ 7,157 $ 12,468
Inventory 12,482 40,165
Other 1,511 (908)
$ 21,150 $ 51,725
Capital assets $ 27,010 $ 64,171
Goodwill 4,267 19,478
Other 763 1,025
$ 32,040 $ 84,674
Accounts payable $ 4,473 $ 10,655
Other 739 584
$ 5,212 $ 11,239
Future income taxes $ 1,107 $ 7,383
The following table provides additional information with respect to amounts included in the cash flow statement
of funds provided by (used in) assets classified as discontinued operations:
2003 2002 2001
Net earnings of discontinued operations $ (2,455) $ 1,731 $ 10,824
Items not affecting cash:
Gain on disposal of discontinued operations (17,460) – –
Depreciation and amortization 8,340 8,045 5,849
Goodwill amortization – – 1,198
Writedown of assets of discontinued operations 10,799 – –
Future income taxes (4,916) (2,908) (610)
Funds provided (used in) by discontinued operations $ (5,692) $ 6,868 $ 17,261
Components of change in non-cash working capital balances related to discontinued operations:2003 2002 2001
Accounts receivable $ 2,843 $ 16,598 $ (6,002)
Inventory 3,243 (7,534) (5,477)
Accounts payable and accrued liabilities 1,931 (4,742) 596
Income taxes payable (772) 282 (688)
$ 7,245 $ 4,604 $ (11,571)
A N N U A L R E P O R T 2003
page99F I N A N C I A L R E P O R T I N G
Guarantees
The Corporation has entered into agreements indemnifying certain parties primarily with respect to tax and
specific third party claims associated with businesses sold by the Corporation. Due to the nature of the indemnifications,
the maximum exposure under these agreements cannot be estimated. No amounts have been recorded for such
indemnities as the Corporation’s obligations under them are not probable and estimable.
P R E C I S I O N D R I L L I N G C O R P O R A T I O N
page
note 21:
100
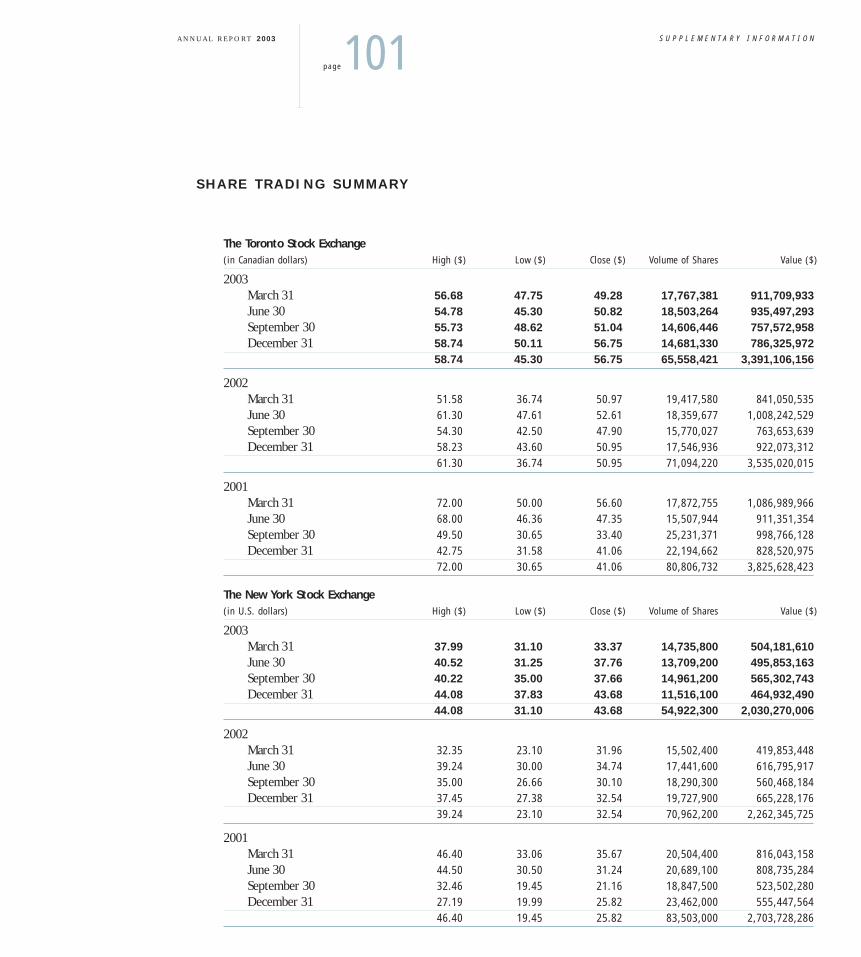
The Toronto Stock Exchange(in Canadian dollars) High ($) Low ($) Close ($) Volume of Shares Value ($)
2003March 31 56.68 47.75 49.28 17,767,381 911,709,933June 30 54.78 45.30 50.82 18,503,264 935,497,293September 30 55.73 48.62 51.04 14,606,446 757,572,958December 31 58.74 50.11 56.75 14,681,330 786,325,972
58.74 45.30 56.75 65,558,421 3,391,106,156
2002March 31 51.58 36.74 50.97 19,417,580 841,050,535June 30 61.30 47.61 52.61 18,359,677 1,008,242,529September 30 54.30 42.50 47.90 15,770,027 763,653,639December 31 58.23 43.60 50.95 17,546,936 922,073,312
61.30 36.74 50.95 71,094,220 3,535,020,015
2001March 31 72.00 50.00 56.60 17,872,755 1,086,989,966June 30 68.00 46.36 47.35 15,507,944 911,351,354September 30 49.50 30.65 33.40 25,231,371 998,766,128December 31 42.75 31.58 41.06 22,194,662 828,520,975
72.00 30.65 41.06 80,806,732 3,825,628,423
The New York Stock Exchange(in U.S. dollars) High ($) Low ($) Close ($) Volume of Shares Value ($)
2003March 31 37.99 31.10 33.37 14,735,800 504,181,610June 30 40.52 31.25 37.76 13,709,200 495,853,163September 30 40.22 35.00 37.66 14,961,200 565,302,743December 31 44.08 37.83 43.68 11,516,100 464,932,490
44.08 31.10 43.68 54,922,300 2,030,270,006
2002March 31 32.35 23.10 31.96 15,502,400 419,853,448June 30 39.24 30.00 34.74 17,441,600 616,795,917September 30 35.00 26.66 30.10 18,290,300 560,468,184December 31 37.45 27.38 32.54 19,727,900 665,228,176
39.24 23.10 32.54 70,962,200 2,262,345,725
2001March 31 46.40 33.06 35.67 20,504,400 816,043,158June 30 44.50 30.50 31.24 20,689,100 808,735,284September 30 32.46 19.45 21.16 18,847,500 523,502,280December 31 27.19 19.99 25.82 23,462,000 555,447,564
46.40 19.45 25.82 83,503,000 2,703,728,286
A N N U A L R E P O R T 2003
page101S U P P L E M E N T A R Y I N F O R M A T I O N
S H A R E T R A D I N G S U M M A R Y

Years ended December 31,
(stated in millions of Canadian dollars except per share amounts) 2003 2002 2001 2000 1999
Revenue 1,917.9 1,567.5 1,815.2 1,251.0 667.3 Expenses:
Operating 1,273.4 1,094.8 1,138.2 787.6 433.5 General and administrative 136.8 144.5 143.5 97.4 55.1 Depreciation and amortization 170.8 133.3 139.3 98.3 64.9 Research and engineering 42.4 34.9 31.7 20.3 3.6 Foreign exchange (2.6) 4.4 0.7 1.5 (0.6)
Operating earnings 297.1 155.6 361.8 245.9 110.8 Interest, net 35.1 35.1 43.1 28.6 16.6 Dividend income – – (1.1) – (1.4)Gain on disposal of investments (3.4) (0.9) (1.8) – (1.3)Reduction of carrying amount of investments – – – – 13.1 Reduction of carrying amount of property,
plant and equipment – – – – 10.2 Earnings from continuing operations before income taxes,
non-controlling interest and goodwill amortization 265.4 121.4 321.6 217.3 73.6 Income taxes 72.5 30.7 114.4 70.5 50.5 Earnings from continuing operations before non-controlling
interest and goodwill amortization 192.9 90.7 207.2 146.8 23.1 Non-controlling interest 1.8 1.2 0.9 – –Earnings from continuing operations before
goodwill amortization 191.1 89.5 206.3 146.8 23.1 Goodwill amortization – – 30.6 21.8 15.0 Earnings from continuing operations 191.1 89.5 175.7 125.0 8.1 Discontinued operations (2.4) 1.8 10.8 5.1 27.5 Net earnings 188.7 91.3 186.5 130.1 35.6 Retained earnings, beginning of period 620.1 528.8 342.3 282.2 246.6 Adjustment on adoption of liability method of accounting
for income taxes – – – (70.0) –Retained earnings, end of period 808.8 620.1 528.8 342.3 282.2
Earnings per share from continuing operations before goodwill amortization:Basic ($) 3.51 1.67 3.90 3.01 0.52Diluted ($) 3.46 1.63 3.81 2.91 0.51
Earnings per share from continuing operations:Basic ($) 3.51 1.67 3.31 2.57 0.18Diluted ($) 3.46 1.63 3.23 2.48 0.18
Earnings per share:Basic ($) 3.47 1.70 3.52 2.67 0.80 Diluted ($) 3.41 1.66 3.44 2.58 0.79
P R E C I S I O N D R I L L I N G C O R P O R A T I O N
page102
S T A T E M E N T S O F E A R N I N G S A N D R E T A I N E D E A R N I N G S

Years ended December 31,
(stated in millions of Canadian dollars except per share amounts) 2003 2002 2001 2000 1999
R E T U R N S
Return on sales (1) 10.0% 5.7% 9.7% 10.0% 1.2%Return on assets (2) 6.6% 3.4% 7.3% 7.5% 2.7%Return on equity (3) 11.5% 6.1% 14.0% 13.4% 4.4%
F I N A N C I A L R AT I O S
Working capital 248.3 210.3 215.9 157.7 162.9 Working capital ratio 1.57 1.54 1.56 1.42 1.85PP&E and intangibles 1,653.5 1,528.6 1,436.5 1,243.3 748.7 Total assets 2,908.4 2,760.0 2,651.4 2,387.9 1,436.3Long-term debt 399.4 514.9 496.2 548.1 226.8 Shareholders’ equity 1,745.3 1,533.0 1,416.0 1,206.8 910.1 Long-term debt to long-term debt plus equity 0.19 0.25 0.26 0.31 0.20 Interest coverage (4) 8.5 4.4 8.4 8.6 6.7
O T H E R F I N A N C I A L D ATA
Net capital expenditures excluding business acquisitions 290.5 239.5 340.7 180.5 41.1 EBITDA (5) 467.9 288.9 501.1 344.2 175.7 EBITDA – % of revenue 24.4% 18.4% 27.6% 27.5% 26.3%Operating earnings 297.1 155.6 361.8 245.9 110.8 Operating earnings – % of revenue 15.5% 9.9% 19.9% 19.7% 16.6%Cash flow from operations (6) 258.4 199.2 432.2 236.9 39.3 Cash flow from operations per share ($)
Basic 4.75 3.71 8.16 4.86 0.88Diluted 4.67 3.63 7.97 4.70 0.87
Book value per share ($) (7) 31.82 28.35 26.63 23.08 19.30Price earnings ratio (8) 16.4 30.0 11.7 21.1 46.3Weighted average common shares outstanding (000’s) 54,430 53,702 52,953 48,722 44,500
(1) Return on sales was calculated by dividing earnings from continuing operations by total revenues.(2) Return on assets was calculated by dividing net earnings by quarter average total assets.(3) Return on equity was calculated by dividing net earnings by quarter average total shareholders’ equity.(4) Interest coverage was calculated by dividing operating earnings by net interest expense.(5) Earnings before net interest, taxes, depreciation, amortization, non-controlling interest, dividend income, gain on disposal of investments and subsidiary, reduction in
carrying amounts of investments and property, plant and equipment and discontinued operations. EBITDA is not a recognized measure under Canadian GAAP. Managementbelieves that in addition to net earnings, EBITDA is a useful supplemental measure as it provides an indication of the results generated by the Corporation’s principal business activities prior to consideration of how those activities are financed or how the results are taxed in various jurisdictions and prior to the impact of depreciationand amortization. Investors should be cautioned, however,that EBITDA should not be construed as an alternative to net earnings determined in accordance with GAAP asan indicator of Precision’s performance. Precision’s method of calculating EBITDA may differ from other companies and, accordingly, EBITDA may not be comparable tomeasures used by other companies.
(6) Cash flow from operations including discontinued operations.(7) Book value per share was calculated by dividing shareholders’ equity by common shares outstanding.(8) Year end closing price divided by basic earnings per share.
A N N U A L R E P O R T 2003
page103S U P P L E M E N T A R Y I N F O R M A T I O N
A D D I T I O N A L S E L E C T E D F I N A N C I A L I N F O R M A T I O N

(Stated in thousands of Canadian dollars, except per share amounts, which are presented on a diluted basis)
Year ended December 31, 2003 Q1 Q2 Q3 Q4 Year
Revenue $ 587,970 $ 345,641 $ 455,625 $ 528,697 $ 1,917,933
Operating earnings (1) 120,523 15,520 64,560 96,507 297,110
Cash flow from operations (2) (19,812) 170,357 8,874 99,008 258,427
Per share (0.36) 3.09 0.16 1.78 4.67
Earnings from continuing operations 75,818 11,251 39,075 64,987 191,131
Per share 1.37 0.20 0.71 1.17 3.46
Net earnings 84,897 10,862 37,772 55,145 188,676
Per share 1.54 0.20 0.68 0.99 3.41
Year ended December 31, 2002 Q1 Q2 Q3 Q4 Year
Revenue $ 527,411 $ 314,894 $ 355,552 $ 369,649 $ 1,567,506
Operating earnings (1) 112,303 4,238 24,204 14,814 155,559
Cash flow from operations (2) 20,681 136,799 14,025 27,718 199,223
Per share 0.38 2.49 0.26 0.50 3.63
Earnings from continuing operations 65,580 2,482 14,611 6,861 89,534
Per share 1.21 0.05 0.27 0.12 1.63
Net earnings 66,829 3,327 12,246 8,863 91,265
Per share 1.23 0.06 0.22 0.13 1.66
(1) Refer to explanation on page 43 of this annual report.(2) Cash flow from operations including discontinued operations.
P R E C I S I O N D R I L L I N G C O R P O R A T I O N
page104
Q U A R T E R L Y F I N A N C I A L S U M M A R Y

A N N U A L R E P O R T 2003
page105
S H A R E H O L D E R I N F O R M A T I O N
H E A D O F F I C E
Precision Drilling Corporation
4200, 150 - 6th Avenue SWCalgary, Alberta, Canada T2P 3Y7Telephone: 403-716-4500Facsimile: 403-264-0251www.precisiondrilling.com
I N T E R N AT IO N A L C E N T R E S
United States
Suite 1700, 363 N. Sam Houston Parkway EastHouston,Texas 77060, U.S.Telephone: 281-260-5600Facsimile: 281-260-5670
Latin America
Centro Ciudad Comercial Tamanaco (CCCT)Torre B, Piso 1, Oficina B-105Avenida la EstanciaChuao, Caracas,VenezuelaCodigo Postal 1064Telephone: 58-212-959-6211Facsimile: 58-212-959-3595
Europe/Africa
Eddesser Strasse 131234 Edemissen, GermanyTelephone: 49-5176-989650Facsimile: 49-5176-989670
Middle East
P.O. Box 2146 Bin Arrar BuildingFloor 2, Office Number 2Al Nadja Street, Abu DhabiUnited Arab EmiratesTelephone: 971-2-6747-333Facsimile: 971-2-6747-373
Asia/Pacific
4th Floor, Graha ElnusaJ.I. T.B. Sirmatupang Kav 1BJakarta, 12560IndonesiaTelephone: 62-21-7854-6300Facsimile: 62-21-7884-1277
OT H E R I N T E R N AT IO N A L O F F I C E S
Barbados
2nd Floor Trident House,Broad Street,Bridgetown, Barbados,West IndiesTelephone: 246-228-4293Facsimile: 246-426-5992
Mexico
Av. Ind. Rio San Juan Manzana 7,Lote 6Parque Industrial del Norte,Cd. Reynosa,Tamaulipas,Mexico C.P. 88730Telephone: 52-899-29-5104Facsimile: 52-899-29-5114
Venezuela
Avenida Intercomunal El Tigre-El TigritoAl Lado de American Diesel,El Tigre, Estado AnzoateguiVenezuelaTelephone: 58-283-2-412701Facsimile: 58-298-2-412228
D I R E C TO R S
[see page 33 for listing and biographies]
O F F I C E R S
Hank B. Swartout
Chairman of the Board, President and Chief Executive Officer
Dale E. Tremblay
Senior Vice President Finance and Chief Financial Officer
John R. King
Senior Vice President,Technology Services
M.J. (Mick) McNulty
Senior Vice President, Operations Finance
R.T. (Bob) German
Vice President and Chief Accounting Officer
Jan M. Campbell
Corporate Secretary
BA N K E R
Royal Bank of Canada
Calgary, Alberta
L E GA L C O U N S E L
Borden Ladner Gervais LLP
Calgary, Alberta
AU D I TO R S
KPMG LLP
Calgary, Alberta
T R A N S F E R AG E N T A N D R E G IS T R A R
Computershare Trust Company of Canada
Calgary, Alberta
T R A N S F E R P O I N T
Computershare Trust Company, Inc.
New York, New York
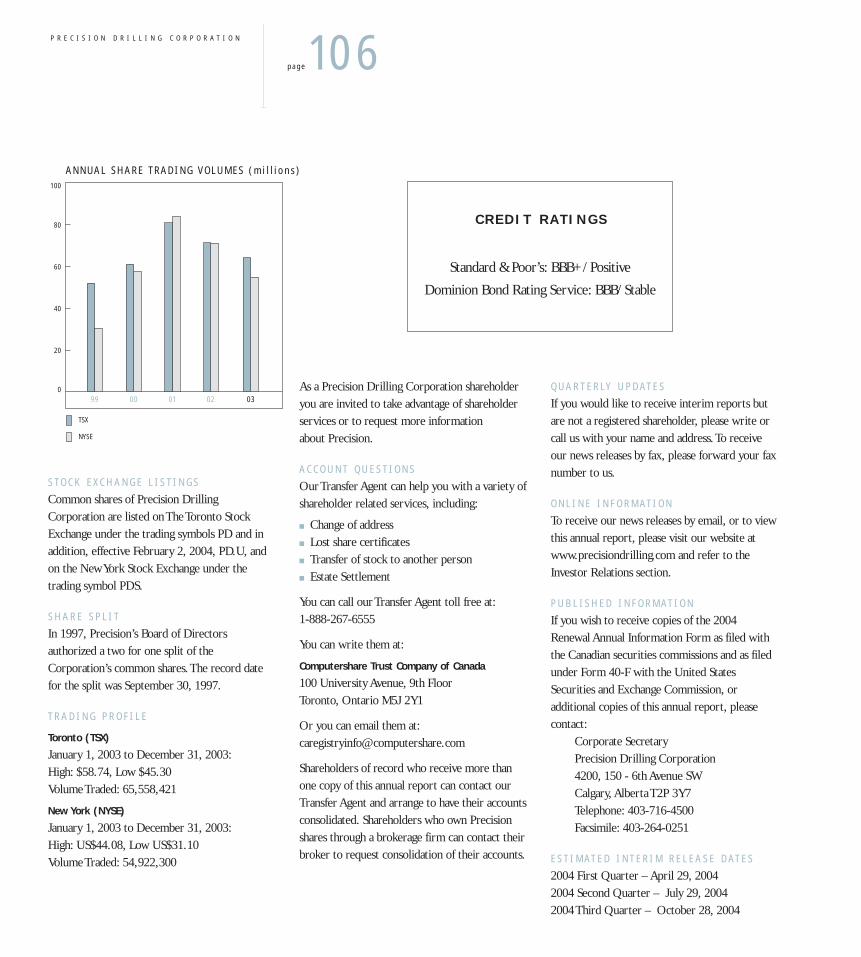
P R E C I S I O N D R I L L I N G C O R P O R A T I O N
page106
Q UA R T E R LY U P DAT E S
If you would like to receive interim reports butare not a registered shareholder, please write orcall us with your name and address.To receiveour news releases by fax, please forward your faxnumber to us.
O N L I N E I N F O R M AT IO N
To receive our news releases by email, or to viewthis annual report, please visit our website atwww.precisiondrilling.com and refer to theInvestor Relations section.
P U B L IS H E D I N F O R M AT IO N
If you wish to receive copies of the 2004Renewal Annual Information Form as filed withthe Canadian securities commissions and as filedunder Form 40-F with the United StatesSecurities and Exchange Commission, or additional copies of this annual report, pleasecontact:
Corporate SecretaryPrecision Drilling Corporation 4200, 150 - 6th Avenue SWCalgary, Alberta T2P 3Y7Telephone: 403-716-4500Facsimile: 403-264-0251
E S T I M AT E D I N T E R I M R E L E A S E DAT E S
2004 First Quarter – April 29, 20042004 Second Quarter – July 29, 20042004 Third Quarter – October 28, 2004
As a Precision Drilling Corporation shareholderyou are invited to take advantage of shareholderservices or to request more information about Precision.
AC C O U N T Q U E S T IO N S
Our Transfer Agent can help you with a variety ofshareholder related services, including:
■ Change of address■ Lost share certificates■ Transfer of stock to another person■ Estate Settlement
You can call our Transfer Agent toll free at:1-888-267-6555
You can write them at:
Computershare Trust Company of Canada
100 University Avenue, 9th FloorToronto, Ontario M5J 2Y1
Or you can email them at:[email protected]
Shareholders of record who receive more thanone copy of this annual report can contact ourTransfer Agent and arrange to have their accountsconsolidated. Shareholders who own Precisionshares through a brokerage firm can contact theirbroker to request consolidation of their accounts.
S TO C K E XC H A N G E L I S T I N G S
Common shares of Precision DrillingCorporation are listed on The Toronto StockExchange under the trading symbols PD and inaddition, effective February 2, 2004, PD.U, andon the New York Stock Exchange under the trading symbol PDS.
S H A R E S P L I T
In 1997, Precision’s Board of Directorsauthorized a two for one split of theCorporation’s common shares.The record datefor the split was September 30, 1997.
T R A D I N G P R O F I L E
Toronto (TSX)
January 1, 2003 to December 31, 2003:High: $58.74, Low $45.30Volume Traded: 65,558,421
New York (NYSE)
January 1, 2003 to December 31, 2003:High: US$44.08, Low US$31.10Volume Traded: 54,922,300
TSX
NYSE
100
80
60
40
20
099 00 0201 03
ANNUAL SHARE TRADING VOLUMES (mil l ions)
C R E D I T R A T I N G S
Standard & Poor’s: BBB+/Positive
Dominion Bond Rating Service: BBB/Stable
A N N U A L R E P O R T 2003
page107
G L O S S A R Y
Borehole - Also known as the wellbore, this is the holemade by the drill bit, including the open or uncasedpart of the well.
Cased hole - The part of the wellbore which has beenprotected by metal casing to prevent fluid, pressure,and stability problems.
Coil tubing - A long continuous length of pipe wound onto a spool.The pipe is straightened prior to pushinginto a wellbore and recoiled to spool the pipe backonto the transport and storage spool.
Completion - The process of assembling downhole tubingand equipment to finish a well so that it can safelyproduce oil and gas.
Controlled Pressure Drilling (CPD) - Drilling with abottom hole pressure less than, equal to or overreservoir pressure.
Directional drilling - The use of equipment andengineering to intentionally change the angle of awellbore so that drilling efficiency can be enhanced orformations or obstructions can be circumvented inorder to reach the pay zone.
Drill string - Comprised of a string of tools, includingthe drill pipe, bottom hole assembly and any othertools needed to make the drill bit rotate at the bottomof the wellbore.
Electromagnetic (EM) telemetry - A downhole datacommunication method which uses the transmission ofelectromagnetic signals along the drill string to surfacewhere the data is decoded by a surface transceiver.
Fracturing - A method of stimulating production byincreasing formation permeability by creating andopening fractures through which formation fluids can flow.
Gamma Ray Logging (GR) - Measures the naturallyoccurring radiation in formations. Primarily used todifferentiate types of lithology.
Heavy oil - A viscous oil with an American PetroleumIndex (API) gravity of less than 22.3 degrees.
Oil sands - Any consolidated or unconsolidated rock thatcontains a hydrocarbon material with a gas-freeviscosity, measured at reservoir temperature, greaterthan 10,000 mPa, or that contains a hydrocarbonmaterial that is extractable from the mined or quarried rock.
Horizontal drilling - Directional drilling techniquewhere the wellbore inclination approaches or exceeds90 degrees from vertical.
Logging-While-Drilling (LWD) technology - Usesdownhole tools to measure formation properties in realtime while the well is being drilled. Propertiesmeasured include formation resistivity, porosity and density.
Measurement-While-Drilling (MWD) technology- Uses downhole tools to measure wellboreproperties in real time while the well is beingdrilled. Properties measured include wellboreinclination and azimuth, downhole pressure,temperature drillstring vibration and shock.
Mud Pulse telemetry - The transmission of downholeinformation to the surface while drilling by pressurepulses in the drilling mud.
Multi-Frequency Resistivity (MFR) - A logging-while-drilling tool that uses multiplefrequencies to accurately determine resistivitymeasurements in many different mud and formation types.
Open hole - The part of a well that is not cased.This canbe the complete wellbore immediately after the well isdrilled, or the section of the wellbore that occursbelow the casing after completion.
Polycrystalline Diamond Compact (PDC) bits - A type of bit that uses cutters with synthetic diamonddisks to shear rock with a continuous scraping motion.
Rotary Steerable (RS)- A tool designed for directionaldrilling that allows wellbore direction to be controlledwhile drilling with continuous rotation of the drill stringfrom surface.
Slickline - A thin non-electric cable used for selectiveplacement and retrieval of wellbore hardware and tools.
Snubbing - A procedure for moving drill pipe or tubing inand out of a wellbore while the well is under pressure.
Steam Assisted Gravity Drainage (SAGD) - Atechnique used to extract heavy oils which involves theinjection of steam into the producing zone, creating ahigh-temperature steam chamber in the formation.The injected heat decreases the viscosity of the thickcrude and allows it to flow more freely, with gravity'sassistance, to the horizontal production well oftenlocated below the injector.
Underbalanced Drilling (UBD) - When thehydrostatic head of a drilling fluid is intentionallydesigned to create a bottom hole pressure lowerthan the formation being drilled.The hydrostatichead of the drilling fluid may be naturally less thanthe formation pressure or it can be induced.Theinduced state may be created by adding natural gas,nitrogen or air to the liquid phase of the drillingfluid.Whether induced or natural this may result inan influx of formation fluids which must becirculated from the well and controlled at surface.
Well testing - Using specialized equipment andprocedures to obtain essential information about oil and gas wells after the drilling process is complete. Typical information derived may includereservoir performance, reservoir pressure, reserves,damage, permeability, porosity, and formation fluid composition.
Wireline - Single-strand or multi-strand cable used tolower evaluation tools into the borehole and to transmit data.
Workover - The repair or servicing of a producing well torestore or increase production.
TRADEMARKS used in this annual reportEMpulse™
Hostile Environment Logging (HEL™)
Multi-Frequency Resistivity (MFR™)
PrecisionLWD™
Revolution™
RBOP®
SuperLance™
Super Single® rig
Target Zero™
A N N UA L M E E T I N G
The Annual and Special Meeting of the Shareholders of Precision Drilling Corporation will be
held in the Devonian Room of the Calgary Petroleum Club, 319 – 5th Avenue SW, Calgary,
Alberta, Canada at 3:00 p.m. (Calgary time) on Tuesday, May 11, 2004.
Shareholders are encouraged to attend and those unable to do so are requested to complete
the Form of Proxy at their earliest convenience.
TA B L E O F C O N T E N TS
Corporate Profile 1
At-A-Glance 2
Report of the Chief Executive Officer 4
Disclosure Regarding Forward-Looking Statements 11
Leadership in Safety 13
Rapid Growth in Mexico 19
Bringing Technology Services Products to Market 25
Community Relations 31
The Board of Directors 32
Corporate Governance 34
Management’s Discussion and Analysis(including Operations Review) 43
Financial Reporting 76
Supplementary Information 101
Quarterly Financial Summary 104
Shareholder Information 105
Glossary 107
FRONT COVER PHOTO : PRECIS ION RIG 420 , P INK MOUNTAIN , NORTHEAST BRIT ISH COLUMBIA , CANADA
BACK COVER PHOTO : PRECIS ION RIG 724 , BURGOS BASIN , MEXICO
DRILL BIT TEETH RIG CREW – MEXICO
Des
igne
d an
d pr
oduc
ed b
y R
esul
t Inc
.Pr
inte
d in
Can
ada
by S
undo
g Pr
intin
g
cover_sd 3/24/04 6:05 PM Page 2

Precision Drilling Corporation4200, 150 - 6th Avenue SWCalgary, Alberta, Canada T2P 3Y7Telephone: 403-716-4500Facsimile: 403-264-0251www.precisiondrilling.com
Precision Drilling Corporation Annual Report2003
Precision Drilling Corporation2003
Annual Report
cover_sd 3/24/04 6:05 PM Page 1