Embed Size (px)
Citation preview
Precise and accurate measurement of 226Ra–230Th–238U
disequilibria in volcanic rocks using plasma ionization
multicollector mass spectrometry
Aaron J. Pietruszka *, Richard W. Carlson, Erik H. Hauri
Department of Terrestrial Magnetism, Carnegie Institution of Washington, 5241 Broad Branch Road, N.W., Washington, DC 20015, USA
Received 28 June 2001; accepted 28 April 2002
Abstract
We describe analytical techniques for the measurement of 226Ra–230Th–238U disequilibria in volcanic rocks using plasma
ionization multicollector mass spectrometry (MC-ICP-MS). Our methods build upon previous MC-ICP-MS techniques for232Th/230Th and 238U/234U measurements with the addition of new chemical and/or mass spectrometric procedures for the
determination of Th, U and 226Ra abundances. Using sample sizes that are similar to the requirements of state-of-the-art thermal
ionization mass spectrometry (TIMS), we are able to measure Th isotope ratios and 226Ra–230Th–238U disequilibria with a
precision that is at least f 2–3� better than TIMS and U isotope ratios with a precision that is comparable to TIMS. Replicate
analyses of a 226Ra–230Th–234U–238U radioactive equilibrium rock standard (Table Mountain Latite) demonstrate that our
MC-ICP-MS techniques are also highly accurate. An additional bonus is that analyses of Ra, Th and U isotope ratios by MC-
ICP-MS are much less time-consuming than by TIMS. These analytical improvements will increase the usefulness of U-series
isotopes as high-resolution tracers of the nature and timing of magmatic processes at active volcanoes.
D 2002 Elsevier Science B.V. All rights reserved.
Keywords: U-series isotopes; Thorium; Uranium; Radium; Mass spectrometry; Plasma ionization; Volcanic rocks
1. Introduction
Analyses of radioactive disequilibria between the
short-lived daughter isotopes of the 238U decay series
(e.g., 226Ra, 230Th and 234U) have been used exten-
sively to investigate the nature and timing of magmatic
processes at active volcanoes. The primary analytical
challenge for these measurements is the precise and
accurate determination of the minute quantities of
these isotopes in volcanic rocks (e.g.,f 1 g of a
typical Hawaiian basalt contains < 1�10� 12 g 226Ra),
which translate to extreme isotope ratios for those
elements of the U decay series with a major, naturally
occurring isotope (e.g., 232Th/230Thf 1–2� 105 and238U/234Uf 1.8� 104). Early studies used relatively
time-consuming and low precision decay-counting
methods to determine the activities (or decay rates)
of the U-series isotopes in volcanic rocks (e.g.,
Somayajulu et al., 1966; Oversby and Gast, 1968).
The subsequent development of techniques to directly
measure the abundances of these isotopes in geological
0009-2541/02/$ - see front matter D 2002 Elsevier Science B.V. All rights reserved.
PII: S0009 -2541 (02 )00106 -7
* Corresponding author. Present address: Department of
Geology, University of Maryland, College Park, MD 20742,
USA. Tel.: +1-301-405-0084; fax: +1-301-314-9661.
E-mail address: [email protected] (A.J. Pietruszka).
www.elsevier.com/locate/chemgeo
Chemical Geology 188 (2002) 171–191
materials by thermal ionization mass spectrometry
(TIMS) significantly improved the accuracy and pre-
cision of these measurements and reduced the analysis
time compared to the earlier decay-counting methods
(e.g., Edwards et al., 1987; Goldstein et al., 1989;
Cohen and O’Nions, 1991; Volpe et al., 1991).
Despite the great promise of TIMS methods, a
number of analytical problems have limited the effec-
tiveness of U-series isotopes as high-resolution geo-
chemical tracers of magmatic processes. There are two
major disadvantages of TIMS techniques for volcanic
rocks: (1) the inefficient thermal ionization of Th
( < 0.1%; Edwards et al., 1987) and, to a lesser extent,
U ( < 0.5%; Yokoyama et al., 2001), and the related
difficulty of maintaining a sufficiently large, stable ion
beam, result in relatively low signal intensities and
poor counting statistics for the minor isotopes, 230Th
and 234U, and (2) the lack of enough non-radiogenic
isotopes with appropriate relative abundances for Ra,
Th and U make it difficult (238U/234U) or impossible
(232Th/230Th or 226Ra/228Ra) to simultaneously correct
the measured isotope ratios for the effects of instru-
mental mass fractionation and/or variations in the
relative efficiencies of the requisite ion-counting
(e.g., Daly) and non-ion-counting (Faraday) detectors
(often termed the ‘‘Daly–Faraday gain’’).
Recent studies (e.g., Luo et al., 1997; Turner et al.,
2001) have shown that it is possible to precisely
measure the extreme Th and U isotope ratios of
volcanic rocks using plasma ionization multicollector
mass spectrometry (MC-ICP-MS). In a pioneering
investigation, Luo et al. (1997) demonstrated a dra-
matic improvement in the precision of 232Th/230Th
(in particular) and 238U/234U measurements by MC-
ICP-MS compared to TIMS using relatively large
samples of Th and U. Subsequently, Turner et al.
(2001) obtained a precision for 232Th/230Th measure-
ments by MC-ICP-MS that is comparable to TIMS
using relatively small samples of Th (down to a
factor of f 10–20 less than typically used for
TIMS). These analytical improvements derive from
(1) the much higher sensitivity for Th by MC-ICP-
MS (up to f 0.3% in their studies) compared to
TIMS and the fact that the intensity of the Th or U
ion beam using MC-ICP-MS is directly proportional
to concentration of these elements in the sample
solution and (2) the ability to easily correct the
measured 238U/234U and 232Th/230Th ratios for the
effects of instrumental mass fractionation and varia-
tions in the Daly–Faraday gain using simultaneous
measurements of the 238U/235U ratio (u 137.88) of
the sample or a natural U standard solution added to
the sample (impossible by TIMS).
The accuracy of these MC-ICP-MS techniques was
also evaluated by Luo et al. (1997) and Turner et al.
(2001). Most notably, Luo et al. (1997) reported
several high-precision 238U/234U analyses of the Plio-
cene Table Mountain Latite (TML) rock standard and
>1 Ga old monazite and zircon crystals that all lie
within uncertainty of radioactive equilibrium between234U and 238U (as would be expected from their old
ages compared to thef 245 ka half-life of 234U). This
demonstrates that U isotope ratio measurements by
MC-ICP-MS can be highly accurate. Both Luo et al.
(1997) and Turner et al. (2001) presented 232Th/230Th
measurements of solution and rock standards (e.g.,
TML) that have been frequently analyzed by TIMS
and their results agree with previous TIMS measure-
ments within analytical uncertainty. However, it
should be noted that these solution standards are not
calibrated to the high level of precision achieved by
Luo et al. (1997) and TML is thought to be hetero-
geneous with respect to its Th/U ratio and Th isotopic
composition (Williams et al., 1992). A more rigorous
test of the accuracy of 232Th/230Th measurements by
MC-ICP-MS, such as a complete analysis of a geo-
logical material thought to be in radioactive equilib-
rium between 230Th and 238U (both Th/U and Th
isotope ratio measurements are required for this pur-
pose), has never been reported.
In this paper, we describe analytical techniques for
the determination of the U-series isotope abundances
in volcanic rocks using a VG Elemental Plasma 54-30
(P54-30) plasma ionization multicollector mass spec-
trometer, which is equipped with a 30-cm electrostatic
(energy) filter prior to the ion-counting Daly detector
to improve the abundance sensitivity. Our methods
build upon the chemical and mass spectrometric
procedures outlined by Luo et al. (1997) for232Th/230Th and 238U/234U measurements by MC-
ICP-MS with the addition of new techniques for the
determination of Th, U and 226Ra concentrations. We
also evaluate the accuracy and precision of our
analytical methods using a range of rock (TML and
Kil1919) and solution standards (UCSC Th ‘‘A’’ and
ZSR Th).
A.J. Pietruszka et al. / Chemical Geology 188 (2002) 171–191172
2. Chemistry and mass spectrometry
The chemical and mass spectrometric techniques
that we developed are considerably different from
those typically used for TIMS analyses of the U-series
isotope abundances in volcanic rocks. In this section,
we describe our new analytical methods (summarized
in Tables 1 and 2) with a comparison to the proce-
dures used by Luo et al. (1997) for 232Th/230Th and238U/234U measurements by MC-ICP-MS.
2.1. Sample dissolution
Samples of rock standards (f 0.5–0.6 g for
Kil1919 and 0.05–0.08 g for TML) were digested
in a 1:2 mixture of concentrated HF:HNO3, dried,
treated with 8 N HNO3, dried and heated in 6 N HCl.
In order to ensure complete sample-spike equilibra-
tion, each sample was centrifuged and any residue
was treated with 6 N HCl until dissolved. This clear
solution was then dried to a small volume, treated
with 8 N HNO3, dried again to a small volume and
diluted to 4 N HNO3 for splitting and spiking. The
small split (for Th and U concentration measurement
by isotope dilution) was spiked with calibrated 229Th
and 233U tracers and the large split (for Th and U
isotope ratio and Ra concentration measurement) was
spiked only with a calibrated 228Ra tracer. Finally,
each solution was dried completely to equilibrate the
sample with the spike(s).
2.2. Thorium, uranium and radium chemistry
Th and U for both isotope dilution and isotope ratio
measurements were separated and purified using 0.5-
ml columns of Eichrom TRU (TRansUranic) Resin
(Horwitz et al., 1993). Our procedure (Table 1) was
similar to that of Luo et al. (1997). The sample was
loaded onto the pre-cleaned resin in 1.5 N HNO3. For
the Ra cut, this solution and a wash of 1.5 N HNO3
was collected (along with most of the unwanted major
and trace elements). The resin was next washed with
3 N HCl to remove the light to middle rare earth
elements. Finally, Th and U were eluted sequentially
with 0.2 N HCl and a 0.1 N HCl–0.3 N HF mixture,
respectively.
The typical Th and U yields using this procedure
were >95% and >85% for the small and large splits,
respectively. The Th cuts were essentially free of U,
but the U cuts contained a significant amount of Th
(U/Th ratios of f 4–6) due to the more efficient
stripping of Th from the resin in 0.1 N HCl–0.3 N
HF compared to 0.2 N HCl (cf., U/Th ratios >100;
Luo et al., 1997). However, the presence of Th in the
U cut did not affect either the 238U/234U or 238U/233U
measurements (e.g., the 232Th hydride at mass 233
was < 0.01% of the signal intensity of 233U for U
concentration measurement, which is insignificant).
The total procedural blanks were negligible (10–20
pg Th and 6–12 pg U for isotope ratio measurements
and 1–4 pg Th and 1–6 pg U for abundance measure-
ments). The minor isotopes of Th and U (230Th or234U) were below the level of detection in unspiked
blanks. The Th cuts were diluted directly off the
column and run in a solution of 0.2 N HCl (after
the addition of a natural U standard to correct for the
effects of the Daly–Faraday gain and/or the instru-
mental mass fractionation). The U cuts were dried to a
small volume (f 5–10 Al) and diluted with 0.2 N
HCl plus a trace amount of HF ( < 0.01 N). Analyzing
Th and U in dilute HCl (with a trace amount of HF for
U) maximized the intensity and stability of the ion
beam. A variable, low signal intensity (down to a level
indistinguishable from the baseline) was observed if
Th and U were run in dilute HNO3 due to chelation
between the Th or U and the small amount of
extractant from the TRU Resin that bleeds into the
sample solution during chemistry (both Th and U
partition strongly onto TRU Resin in dilute HNO3;
Horwitz et al., 1993).
To separate and purify Ra (Table 1), we modified
the technique of Chabaux et al. (1994). The 1.5 N
HNO3 wash from the Th and U column was dried,
dissolved in 1.25 N HCl and loaded onto a 22-ml
column of AG50W� 8 cation exchange resin. The
column was washed sequentially with 2.5, 4 and 6 N
HCl to remove most of the unwanted major and trace
elements and f 50% of the Ba. The Ra (and the rest
of the Ba) was collected in 9 N HCl, dried, treat-
ed with concentrated aqua regia, dried, dissolved in
1.25 N HCl and loaded onto a 0.4-ml column of
AG50W� 8 cation exchange resin to further purify
the Ra and to remove organic material derived from
the large cation resin column (which may cause high-
mass hydrocarbon interferences with 228Ra and226Ra). This small cation resin column was washed
A.J. Pietruszka et al. / Chemical Geology 188 (2002) 171–191 173
with 2.5 N HCl, and the Ra was collected in 6 N HCl,
dried and dissolved in 3 N HNO3. The sample was
loaded onto a 0.4-ml column of Eichrom Sr Resin
(Horwitz et al., 1992) to separate the Ba from the Ra
(Chabaux et al., 1994). Although the presence of Ba
does not suppress the signal intensity of Ra by MC-
ICP-MS (in direct contrast to TIMS; Volpe et al.,
1991; Chabaux et al., 1994), this procedure prevents
the contamination of the nebulizer, spray chamber,
cones and mass spectrometer with enormous (10s of
Ag) quantities of Ba and also helps to avoid potential
matrix effects on the instrumental mass fractionation
(cf., Carlson et al., 2001). Next, the sample was dried,
dissolved in 3 N HNO3 and passed through a 0.4-ml
column of Eichrom ‘‘pre-filter’’ resin to remove any
organic material derived from the Sr resin (another
potential source of high-mass hydrocarbon interfer-
ences). Immediately prior to analysis ( < 2–3 days),
any 228Th present in the sample (a natural decay
product of and interference with 228Ra) was removed
using a 16-Al column of TRU Resin (analogous to the
initial 1.5 N HNO3 Ra cut for the TRU Resin
procedure described above). Within this time period,
the amount of ingrown 228Th will be < 0.1% of the228Ra (228Ac is calculated to be negligible due to its
extremely short half-life of f 6.2 h). The efficiency
of this Th-elimination step was verified at >99.99%
using a mixed 232Th–226Ra solution standard contain-
ing Th and Ra concentrations that were similar to a
typical sample. It is important to note that the presence
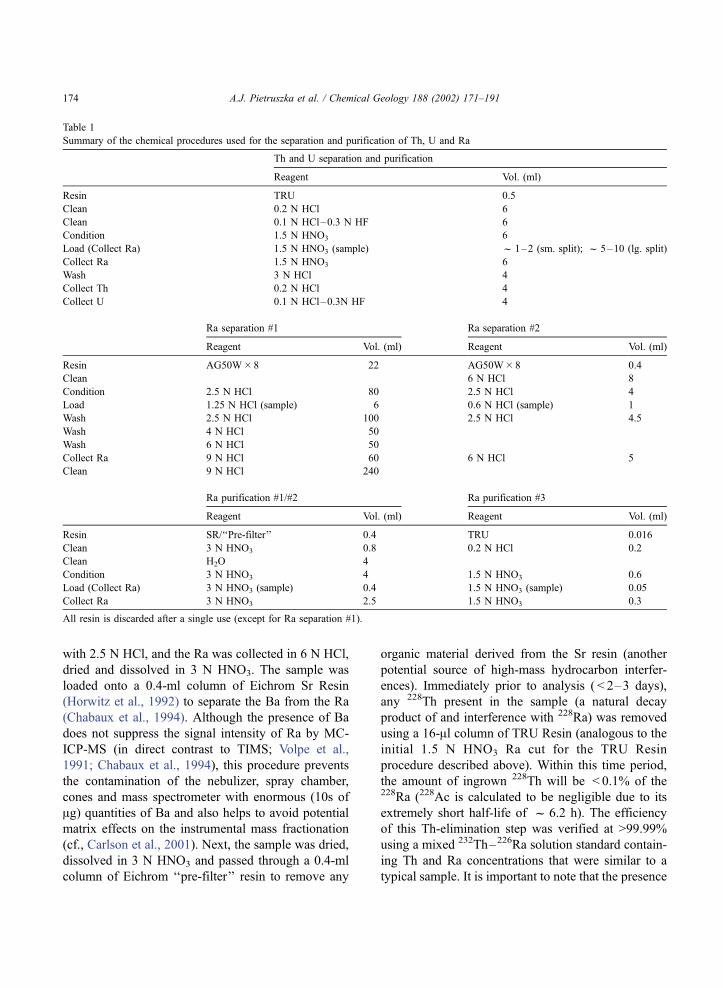
Table 1
Summary of the chemical procedures used for the separation and purification of Th, U and Ra
Th and U separation and purification
Reagent Vol. (ml)
Resin TRU 0.5
Clean 0.2 N HCl 6
Clean 0.1 N HCl–0.3 N HF 6
Condition 1.5 N HNO3 6
Load (Collect Ra) 1.5 N HNO3 (sample) f 1–2 (sm. split); f 5–10 (lg. split)
Collect Ra 1.5 N HNO3 6
Wash 3 N HCl 4
Collect Th 0.2 N HCl 4
Collect U 0.1 N HCl–0.3N HF 4
Ra separation #1 Ra separation #2
Reagent Vol. (ml) Reagent Vol. (ml)
Resin AG50W� 8 22 AG50W� 8 0.4
Clean 6 N HCl 8
Condition 2.5 N HCl 80 2.5 N HCl 4
Load 1.25 N HCl (sample) 6 0.6 N HCl (sample) 1
Wash 2.5 N HCl 100 2.5 N HCl 4.5
Wash 4 N HCl 50
Wash 6 N HCl 50
Collect Ra 9 N HCl 60 6 N HCl 5
Clean 9 N HCl 240
Ra purification #1/#2 Ra purification #3
Reagent Vol. (ml) Reagent Vol. (ml)
Resin SR/‘‘Pre-filter’’ 0.4 TRU 0.016
Clean 3 N HNO3 0.8 0.2 N HCl 0.2
Clean H2O 4
Condition 3 N HNO3 4 1.5 N HNO3 0.6
Load (Collect Ra) 3 N HNO3 (sample) 0.4 1.5 N HNO3 (sample) 0.05
Collect Ra 3 N HNO3 2.5 1.5 N HNO3 0.3
All resin is discarded after a single use (except for Ra separation #1).
A.J. Pietruszka et al. / Chemical Geology 188 (2002) 171–191174
of 228Th in the sample is probably not a problem for
TIMS analysis (and is typically ignored) because Th
ionizes at a much higher temperature than Ra. Follow-
ing the last column, the Ra cut was dried to a small
volume (f 5–10 Al), treated with 6 N HCl, dried
again to a small volume and diluted with a solution of
0.2 N HCl. Finally, a natural U standard was added to
the sample to correct for the effects of instrumental
mass fractionation Analyzing Ra in dilute HCl pre-
vented a decrease in the intensity and stability of the U
ion beam. The typical Ra yield using this procedure
was >95%. The total procedural blanks for 226Ra and228Ra were below the limits of detection.
2.3. Th, U and 226Ra concentration and 232Th/230Th
and 238U/234U analyses
All analyses were performed on the P54-30 at the
Carnegie Institution of Washington, which is equip-
ped with a 30-cm electrostatic (energy) filter prior to
the ion-counting Daly detector to improve the abun-
dance sensitivity. Additional technical details about
this instrument may be found in Halliday et al.
(1998) and references therein. Samples were intro-
duced into the system using a desolvating micro-
concentric nebulizer (Cetac Technologies MCN-6000
or Aridus, hereafter called the MCN) at an uptake
rate of f 60F 10 Al/min. Two different combinations
of spray chambers and nebulizers were used: the
standard PTFE unit provided by Cetac that runs at a
spray chamber temperature of 70 jC and a PFA unit
from CPI International that operates at a higher
temperature (85 jC) to help prevent droplet forma-
tion and, thus, decrease washout time. Typical sensi-
tivities for Th, U and Ra were 0.5F 0.1% (cf., < 0.3%;
Luo et al., 1997; Turner et al., 2001). This value is
greater than, equal to and less than the comparable
thermal ionization efficiencies estimated for Th
( < 0.1% for >10 ng; Edwards et al., 1987), U
( < 0.5% for >10 ng; Yokoyama et al., 2001) and Ra
(f 10–15% for pure standards, but f 2� lower for
samples; Cohen and O’Nions, 1991), respectively.
The Th and U fractions were run separately on the
mass spectrometer. The U abundance was determined
by measuring masses 233, 235 and 238 in static mode
on the Faraday collectors, with the 233U/238U ratio
corrected for instrumental mass fractionation relative
to natural 238U/235U (u 137.88). The 238U/234U ratio
was measured on the large unspiked split using the
‘‘multi-static’’ routine of Luo et al. (1997): two static
sequences with masses 234 and 235 measured on the
Daly (the latter for Daly–Faraday gain determination)
and the 238U/234U ratio corrected for instrumental
mass fractionation relative to natural 238U/235U (Table
2). The Th samples were mixed with a U solution
prepared from the CRM112 standard, which is a
certified reference material from the New Brunswick
Laboratory (NBL) with a natural 238U/235U ratio. The
Th abundance was determined by measuring masses
229, 232, 235 and 238 in static mode on the Faraday
collectors with the 229Th/232Th ratio corrected for
instrumental mass fractionation relative to natural
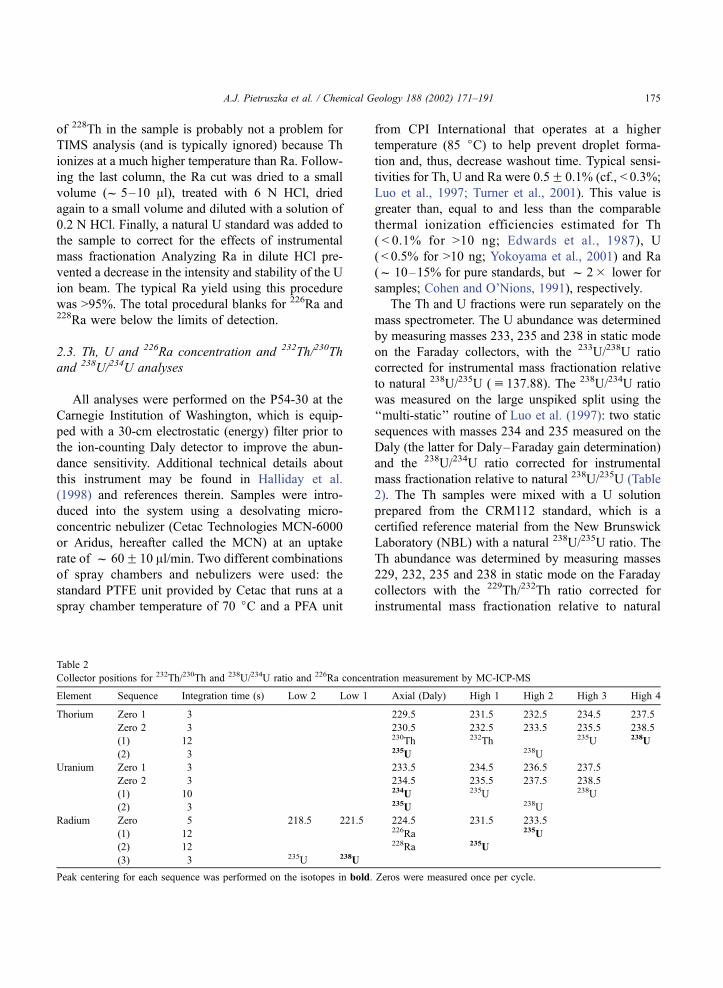
Table 2
Collector positions for 232Th/230Th and 238U/234U ratio and 226Ra concentration measurement by MC-ICP-MS
Element Sequence Integration time (s) Low 2 Low 1 Axial (Daly) High 1 High 2 High 3 High 4
Thorium Zero 1 3 229.5 231.5 232.5 234.5 237.5
Zero 2 3 230.5 232.5 233.5 235.5 238.5
(1) 12 230Th 232Th 235U 238U
(2) 3 235U 238U
Uranium Zero 1 3 233.5 234.5 236.5 237.5
Zero 2 3 234.5 235.5 237.5 238.5
(1) 10 234U 235U 238U
(2) 3 235U 238U
Radium Zero 5 218.5 221.5 224.5 231.5 233.5
(1) 12 226Ra 235U
(2) 12 228Ra 235U
(3) 3 235U 238U
Peak centering for each sequence was performed on the isotopes in bold. Zeros were measured once per cycle.
A.J. Pietruszka et al. / Chemical Geology 188 (2002) 171–191 175
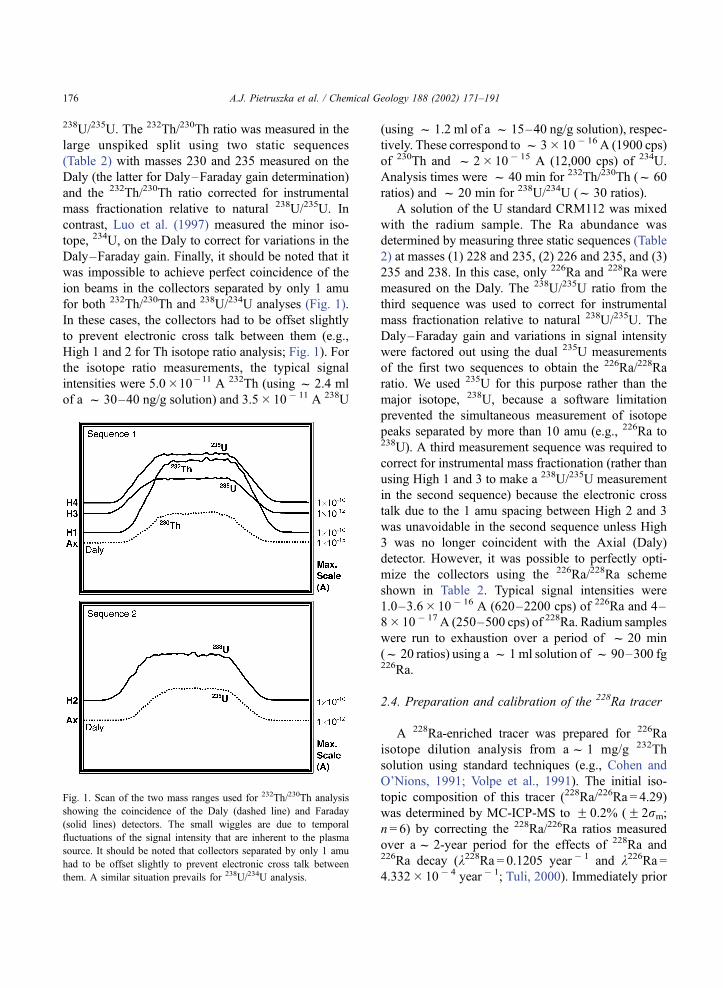
238U/235U. The 232Th/230Th ratio was measured in the
large unspiked split using two static sequences
(Table 2) with masses 230 and 235 measured on the
Daly (the latter for Daly–Faraday gain determination)
and the 232Th/230Th ratio corrected for instrumental
mass fractionation relative to natural 238U/235U. In
contrast, Luo et al. (1997) measured the minor iso-
tope, 234U, on the Daly to correct for variations in the
Daly–Faraday gain. Finally, it should be noted that it
was impossible to achieve perfect coincidence of the
ion beams in the collectors separated by only 1 amu
for both 232Th/230Th and 238U/234U analyses (Fig. 1).
In these cases, the collectors had to be offset slightly
to prevent electronic cross talk between them (e.g.,
High 1 and 2 for Th isotope ratio analysis; Fig. 1). For
the isotope ratio measurements, the typical signal
intensities were 5.0�10�11 A 232Th (using f 2.4 ml
of a f 30–40 ng/g solution) and 3.5� 10� 11 A 238U
(using f 1.2 ml of a f 15–40 ng/g solution), respec-
tively. These correspond to f 3� 10� 16 A (1900 cps)
of 230Th and f 2� 10� 15 A (12,000 cps) of 234U.
Analysis times were f 40 min for 232Th/230Th (f 60
ratios) and f 20 min for 238U/234U (f 30 ratios).
A solution of the U standard CRM112 was mixed
with the radium sample. The Ra abundance was
determined by measuring three static sequences (Table
2) at masses (1) 228 and 235, (2) 226 and 235, and (3)
235 and 238. In this case, only 226Ra and 228Ra were
measured on the Daly. The 238U/235U ratio from the
third sequence was used to correct for instrumental
mass fractionation relative to natural 238U/235U. The
Daly–Faraday gain and variations in signal intensity
were factored out using the dual 235U measurements
of the first two sequences to obtain the 226Ra/228Ra
ratio. We used 235U for this purpose rather than the
major isotope, 238U, because a software limitation
prevented the simultaneous measurement of isotope
peaks separated by more than 10 amu (e.g., 226Ra to238U). A third measurement sequence was required to
correct for instrumental mass fractionation (rather than
using High 1 and 3 to make a 238U/235U measurement
in the second sequence) because the electronic cross
talk due to the 1 amu spacing between High 2 and 3
was unavoidable in the second sequence unless High
3 was no longer coincident with the Axial (Daly)
detector. However, it was possible to perfectly opti-
mize the collectors using the 226Ra/228Ra scheme
shown in Table 2. Typical signal intensities were
1.0–3.6� 10� 16 A (620–2200 cps) of 226Ra and 4–
8� 10� 17 A (250–500 cps) of 228Ra. Radium samples
were run to exhaustion over a period of f 20 min
(f 20 ratios) using a f 1 ml solution of f 90–300 fg226Ra.
2.4. Preparation and calibration of the 228Ra tracer
A 228Ra-enriched tracer was prepared for 226Ra
isotope dilution analysis from af 1 mg/g 232Th
solution using standard techniques (e.g., Cohen and
O’Nions, 1991; Volpe et al., 1991). The initial iso-
topic composition of this tracer (228Ra/226Ra = 4.29)
was determined by MC-ICP-MS to F 0.2% (F 2rm;
n = 6) by correcting the 228Ra/226Ra ratios measured
over af 2-year period for the effects of 228Ra and226Ra decay (k228Ra = 0.1205 year � 1 and k226Ra =4.332� 10� 4 year � 1; Tuli, 2000). Immediately prior
Fig. 1. Scan of the two mass ranges used for 232Th/230Th analysis
showing the coincidence of the Daly (dashed line) and Faraday
(solid lines) detectors. The small wiggles are due to temporal
fluctuations of the signal intensity that are inherent to the plasma
source. It should be noted that collectors separated by only 1 amu
had to be offset slightly to prevent electronic cross talk between
them. A similar situation prevails for 238U/234U analysis.
A.J. Pietruszka et al. / Chemical Geology 188 (2002) 171–191176

to analysis ( < 2–3 days), each of these aliquots were
passed through a 16-Al column of TRU Resin to
remove any 228Th present in the solution. The tempo-
ral 228Ra/226Ra evolution of our 228Ra tracer lies
within analytical uncertainty of the trend expected
for pure 228Ra and 226Ra decay without interference
from either 228Th or 228Ac. The 228Ra tracer was
calibrated against the National Institute of Standards
and Technology (NIST) 226Ra standard SRM4966,
which has an overall concentration uncertainty of
1.2%. Mass spectrometric analysis of this standard
showed that it was essentially pure 226Ra (226Ra/228Ra>104). Measurements of seven different mixtures
of our 226Ra standard and 228Ra tracer (also passed
through TRUResin immediately prior to analysis) gave
spike concentrations that agree to F 0.2% (F 2rm),
which is f 6� better than its overall accuracy.
2.5. Calibration of the Daly detector
All of our 232Th/230Th, 238U/234U and 226Ra/228Ra
analyses use the ion-counting Daly detector. Isotope
ratios measured using a Daly are influenced by a
number of instrumental parameters, such as the dead
time and the voltages on the Daly knob and photo-
multiplier tube (PMT). Thus, it is critical to calibrate
the Daly (like any ion-counting system) to produce
accurate results for these isotope ratio measurements.
For this purpose, we used a solution of the U
standard CRM112. Although this standard has a nat-
ural 238U/235U ratio, its 235U/234U ratio was unknown
prior to this study. Since the 235U/234U ratio must be
known to calibrate the Daly, we measured the isotopic
composition of CRM112 solely on the Faraday col-
lectors using two solutions with different U concen-
trations. First, the 238U/235U ratio was measured in a
relatively dilute solution to determine the magnitude of
the instrumental mass fractionation. Second, the235U/234U ratio was measured in a relatively concen-
trated solution with the Faraday collectors positioned
to avoid the large 238U ion beam (234U in High 3
and 235U in High 4). Third, the 238U/235U ratio was
again measured in the dilute solution. The measured235U/234U ratio was corrected for instrumental mass
fractionation using the average of the two 238U/235U
analyses. The 234U signal intensities ranged from 8 to
20� 10� 15 A for these measurements. Four analyses
of CRM112 using only the Faraday collectors gave a
mean 235U/234U = 135.50F 0.08 (F 2rm), which we
adopt as the ‘‘true’’ value for this standard. It should
be noted that this value is considerably different from
the 235U/234U ratio of the commonly used NBL U
standard CRM112-A (235U/234Uf 137.2; Cheng et
al., 2000), which is a completely different standard
that was formerly issued by the NIST as SRM960.
The origin of the difference in the abundance of 234U
between these U standards is unknown.
Given this result, we measured the 235U/234U ratio
of CRM112 on the Daly and adjusted the voltages on
the Daly knob and PMT (1) to obtain the closest
possible approach to the expected 235U/234U ratio, (2)
to preserve a flat-topped shape to the signal peaks on
the Daly (Fig. 1) and (3) to minimize any background
noise on the Daly baseline. This procedure was
followed by a measurement of the Daly dead time.
The dead time was set to 0 ns in the software (i.e., no
correction for dead time) and the apparent Daly–
Faraday gain (a direct comparison of the 235U signal
intensity between the Daly and the Faraday detectors)
was measured at a range of signal intensities. The
apparent decrease in the Daly–Faraday gain as the
signal intensity of 235U increases provides a direct
estimate of the dead time, which was calculated from
the best-fit line on a plot of the Daly–Faraday gain vs.
the intensity of the 235U signal on the Daly (dead
time =� slope/intercept). After setting the dead time,
the linearity of the Daly was verified by measuring the235U/234U ratio of CRM112 at a range of solution
concentrations (and, thus, signal intensities of 235U on
the Daly). The Daly was checked before every Th, U
and Ra isotope ratio analysis session and this entire
procedure was repeated as necessary to maintain
accurate and linear results.
Despite our calibration and monitoring of the Daly,
we observed a distinct drift in the 235U/234U ratios of
CRM112 during the last f 3 years (Fig. 2). Although
there is no simple 1:1 trend, the major changes in the235U/234U ratio of CRM112 seem to correlate with
shifts in the Daly–Faraday gain (despite the fact that
the effect of this gain on the 235U/234U ratio is
corrected during analysis). This suggests that the
temporal variation in the 235U/234U ratio of CRM112
is related to changes in the performance of the Daly
detector rather than other analytical causes, although
the exact origin is unknown. Indeed, the relatively
large offsets in the 235U/234U ratio correlated with
A.J. Pietruszka et al. / Chemical Geology 188 (2002) 171–191 177
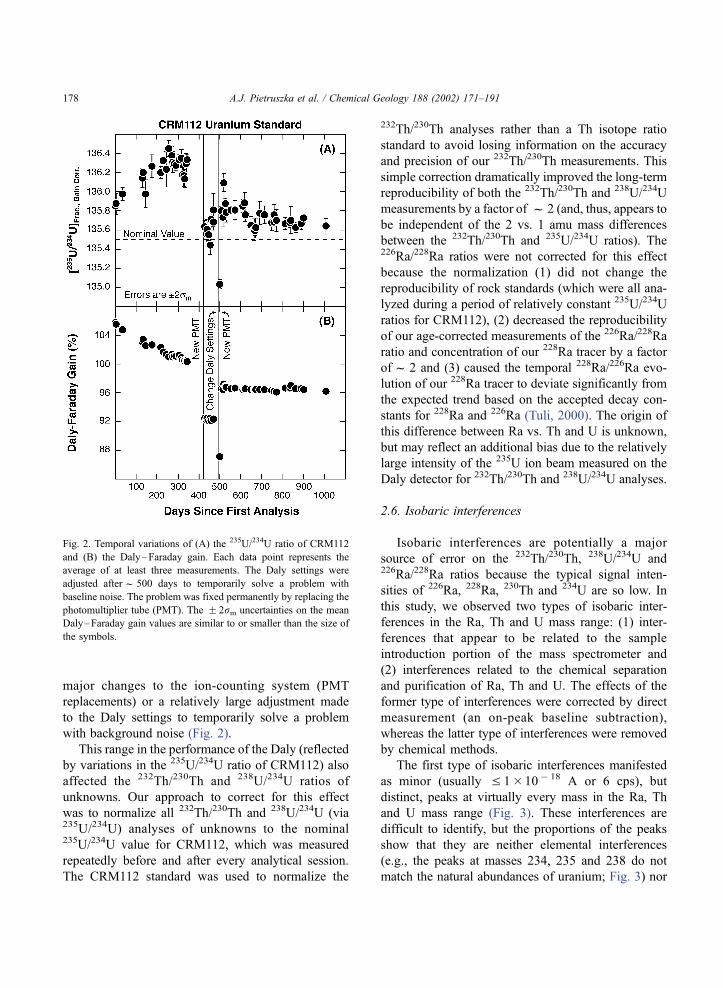
major changes to the ion-counting system (PMT
replacements) or a relatively large adjustment made
to the Daly settings to temporarily solve a problem
with background noise (Fig. 2).
This range in the performance of the Daly (reflected
by variations in the 235U/234U ratio of CRM112) also
affected the 232Th/230Th and 238U/234U ratios of
unknowns. Our approach to correct for this effect
was to normalize all 232Th/230Th and 238U/234U (via235U/234U) analyses of unknowns to the nominal235U/234U value for CRM112, which was measured
repeatedly before and after every analytical session.
The CRM112 standard was used to normalize the
232Th/230Th analyses rather than a Th isotope ratio
standard to avoid losing information on the accuracy
and precision of our 232Th/230Th measurements. This
simple correction dramatically improved the long-term
reproducibility of both the 232Th/230Th and 238U/234U
measurements by a factor of f 2 (and, thus, appears to
be independent of the 2 vs. 1 amu mass differences
between the 232Th/230Th and 235U/234U ratios). The226Ra/228Ra ratios were not corrected for this effect
because the normalization (1) did not change the
reproducibility of rock standards (which were all ana-
lyzed during a period of relatively constant 235U/234U
ratios for CRM112), (2) decreased the reproducibility
of our age-corrected measurements of the 226Ra/228Ra
ratio and concentration of our 228Ra tracer by a factor
off 2 and (3) caused the temporal 228Ra/226Ra evo-
lution of our 228Ra tracer to deviate significantly from
the expected trend based on the accepted decay con-
stants for 228Ra and 226Ra (Tuli, 2000). The origin of
this difference between Ra vs. Th and U is unknown,
but may reflect an additional bias due to the relatively
large intensity of the 235U ion beam measured on the
Daly detector for 232Th/230Th and 238U/234U analyses.
2.6. Isobaric interferences
Isobaric interferences are potentially a major
source of error on the 232Th/230Th, 238U/234U and226Ra/228Ra ratios because the typical signal inten-
sities of 226Ra, 228Ra, 230Th and 234U are so low. In
this study, we observed two types of isobaric inter-
ferences in the Ra, Th and U mass range: (1) inter-
ferences that appear to be related to the sample
introduction portion of the mass spectrometer and
(2) interferences related to the chemical separation
and purification of Ra, Th and U. The effects of the
former type of interferences were corrected by direct
measurement (an on-peak baseline subtraction),
whereas the latter type of interferences were removed
by chemical methods.
The first type of isobaric interferences manifested
as minor (usually V 1�10 � 18 A or 6 cps), but
distinct, peaks at virtually every mass in the Ra, Th
and U mass range (Fig. 3). These interferences are
difficult to identify, but the proportions of the peaks
show that they are neither elemental interferences
(e.g., the peaks at masses 234, 235 and 238 do not
match the natural abundances of uranium; Fig. 3) nor
Fig. 2. Temporal variations of (A) the 235U/234U ratio of CRM112
and (B) the Daly–Faraday gain. Each data point represents the
average of at least three measurements. The Daly settings were
adjusted afterf 500 days to temporarily solve a problem with
baseline noise. The problem was fixed permanently by replacing the
photomultiplier tube (PMT). The F 2rm uncertainties on the mean
Daly–Faraday gain values are similar to or smaller than the size of
the symbols.
A.J. Pietruszka et al. / Chemical Geology 188 (2002) 171–191178

simple molecular interferences (e.g., oxides or hy-
drides). Instead, our best explanation is that these
small peaks are high-mass hydrocarbons derived from
a number of sources related to the sample introduction
portion of the mass spectrometer, such as organic
material introduced with the argon supply, released
from the surface of the cones or retained in the MCN
from previous samples. Over the long term (days to
months), the magnitude and proportions of the peaks
were variable. However, we found that the worst of
the interferences could be eliminated by installing
clean cones, changing to a new Ar tank and/or
cleaning the interior of the MCN with 0.5 N HNO3.
Over the short term (hours), the magnitude and
proportions of the peaks tended to be fairly constant.
Thus, we simply made an on-peak background cor-
rection for any interferences before every Ra, Th and
U isotope ratio measurement. For Ra and Th, this was
done by measuring masses 226 and 228 or 230 using
a solution of CRM112 (for the purpose of peak
centering) that was previously purified using standard
anion exchange chemistry and verified to be free of226Ra, 228Ra or 230Th. The interferences for 234U
were usually negligible (due to the relatively large
signal intensities for 234U), but a clean wash solution
(0.2 N HCl with a trace amount of HF) was used
when a correction was necessary. The typical inten-
sities of these interferences were: 226 ( < 8� 10� 20 A
or 0.5 cps), 228 ( < 1�10� 19 A or 0.9 cps), 230
( < 7� 10� 19 A or 4 cps) and 234 ( < 2� 10� 19 A or
1 cps). In all cases, the magnitude of the background
correction was < 0.2% (similar to or less than the F 2runcertainty of our measurements).
The second type of isobaric interferences were
identified as high-mass hydrocarbons derived from
organic material that bleeds into the sample solutions
from the resins used for the chemical separation and
purification of Ra, Th and U (Fig. 4). Isobaric
interferences at masses 226 and 228 in samples passed
through Sr Resin are frequently observed during
TIMS analysis of Ra prior to thermal degassing of
the sample in the mass spectrometer. Although it may
be surprising that such hydrocarbons (and those
described previously) can survive the high temper-
ature of the plasma source, we note that the hydro-
carbon peaks observed using MC-ICP-MS are several
orders of magnitude smaller than those observed
during the initial low-temperature degassing stage of
Ra analysis by TIMS. In any case, we characterized
the potential interferences at masses 226, 228, 230
and 234 by analyzing unspiked blank solutions that
had been passed through the same chemical proce-
dures as the samples. For the Th cut, no interference at
mass 230 was detected as long as the blank solutions
were analyzed in dilute HCl (Fig. 4). In contrast,
distinct peaks at mass 230 became apparent if even
a trace amount of HF was added to the Th solution.
Although the U cut was free of any interference at
mass 234, this solution typically contained a signifi-
cant peak at mass 230 (Fig. 4). Thus, a sample’s U cut
could not be re-mixed with its Th cut after chemistry
to correct the measured 232Th/230Th ratio for the
effects of instrumental mass fractionation and Daly–
Faraday gain (cf., Luo et al., 1997). Instead, it was
necessary to use a U solution standard, such as
CRM112, to avoid this problem. For Ra, interferences
Fig. 3. Baseline scan of the Ra, Th and U mass range showing the small, but distinct, isobaric interferences that are thought to be high-mass
hydrocarbons that survive the high temperature of the plasma source. The interference peaks observed during this particular analytical session
were much larger than typically observed (usually V 1�10 � 18 or 6 cps) and were subsequently reduced to normal levels by cleaning the
interior of the desolvating microconcentric nebulizer (MCN). The larger peaks at masses 232 and 238 are due mostly to the presence of 232Th
and 238U in the wash solution and/or MCN.
A.J. Pietruszka et al. / Chemical Geology 188 (2002) 171–191 179

were observed at masses 226 and 228 only in blank
solutions passed through the initial 0.5-ml TRU Resin
column or the 22-ml cation resin column. However,
these interferences were effectively removed (Fig. 4)
when the blank solution was subsequently passed
through the 0.4-ml cation resin column (interferences
from the final 16-Al TRU Resin column were below
the limits of detection). Thus, we conclude that any
interferences at masses 226, 228, 230 and 234 derived
from the chemical separation and purification of Ra,
Th and U had a negligible effect on the 232Th/230Th,238U/234U and 226Ra/228Ra ratios.
2.7. Memory effects
We used the following washout procedures after
every sample. For Th and U, a sequential wash of
0.5 N HNO3, 0.2 N HCl and 0.2 N HCl with a
trace amount of HF ( < 0.01 N) was repeated until the232Th and 238U signal intensities decayed to an insig-
nificant level ( < 0.01% of the anticipated signal inten-
sity of the next sample). The 0.2 N HCl–trace HF
solution was particularly effective at removing Th and
U from the system, but we minimized its use during232Th/230Th analysis because the HF sometimes
caused an increase in the magnitude of the isobaric
interference at mass 230. For Ra, a sequential wash of
0.5 N HNO3 and 0.2 N HCl was used. The 0.2 N HCl–
trace HF solution was not used for Ra because it did
not significantly improve the washout and sometimes
caused an increase in the magnitude of the isobaric
interferences at masses 226 and 228. In all cases, the
MCN was conditioned with a solution identical to that
of the sample prior to analysis. In general, it took the
following times to wash the MCN after a sample:
Th (f20–40 min), U (f10–20 min) and Ra (f10–
20 min). The amount of time required depended
strongly on the type of spray chamber and nebulizer
used with the MCN. Washout was substantially faster
(a factor of f 2) using the PFA unit compared to the
PTFE unit. Thus, the total amount of time required
for a Th, U or Ra isotope ratio analysis by MC-ICP-
MS (including washout) wasf 60–80 min for232Th/230Th, f30–40 min for 238U/234U and f30–
40 min for 226Ra/228Ra. In each case, this is much
faster than the typical amount of time required for a
similar analysis by TIMS (H1 h).
2.8. Abundance sensitivity
High abundance sensitivity is critical for our 232Th/230Th, 238U/234U and 226Ra/228Ra measurements.
During this study, the abundance sensitivity at the
Daly detector ranged between 0.4 and 0.9 ppm
(typicallyf 0.5 ppm) at 1 amu lower than mass
238 (measured using CRM112; Fig. 5), which is a
factor of f 5–10� better than observed at the Fara-
day detector prior to the 30-cm electrostatic (energy)
filter. At this level of abundance sensitivity, we found
that the contribution of the 238U tail to 226Ra, 228Ra
and 230Th was negligible due to the relatively large
mass spacing between them. The 238U tail under mass
234 was relatively small, but significant ( < 0.1%).
Thus, the baseline correction for 238U/234U analysis
was performed using the average of two baseline
measurements at F 0.5 amu around mass 234 (Table
Fig. 4. Measurements of the potential isobaric interferences in blank
solutions run through the total chemical procedure for Ra, Th and U.
Any interferences at masses 226, 228, 230 and 234 that derive from
the chemical separation and purification of Ra, Th and U are
negligible (the interference at mass 230 in the U cut does not affect
the 238U/234U measurement). The error bars are the within-run
F 2rm uncertainties.
A.J. Pietruszka et al. / Chemical Geology 188 (2002) 171–191180
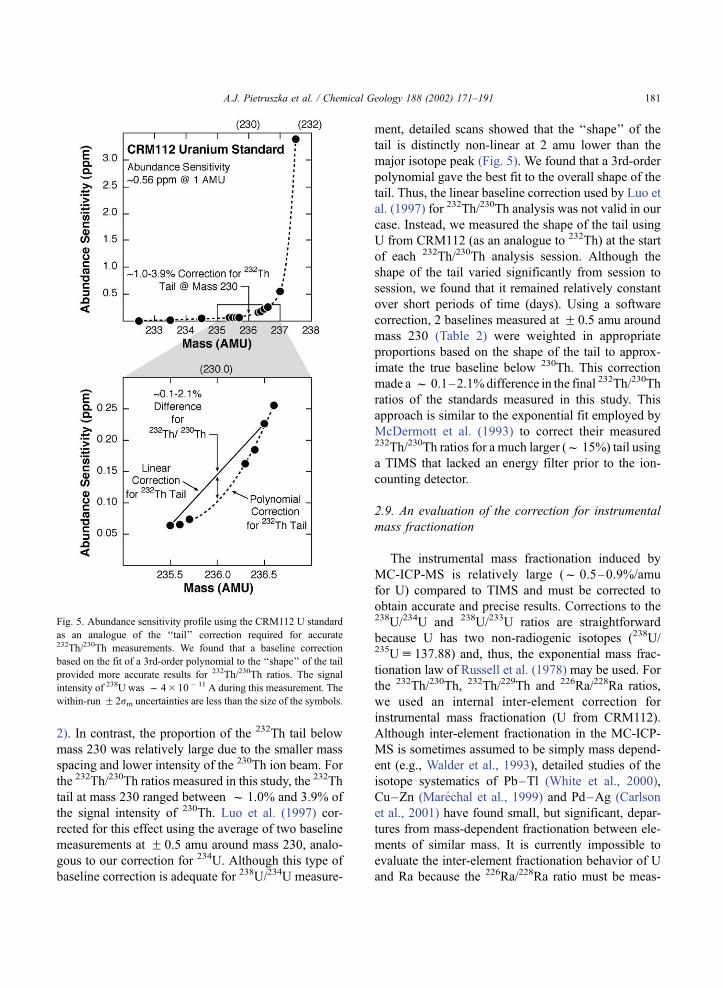
2). In contrast, the proportion of the 232Th tail below
mass 230 was relatively large due to the smaller mass
spacing and lower intensity of the 230Th ion beam. For
the 232Th/230Th ratios measured in this study, the 232Th
tail at mass 230 ranged between f 1.0% and 3.9% of
the signal intensity of 230Th. Luo et al. (1997) cor-
rected for this effect using the average of two baseline
measurements at F 0.5 amu around mass 230, analo-
gous to our correction for 234U. Although this type of
baseline correction is adequate for 238U/234U measure-
ment, detailed scans showed that the ‘‘shape’’ of the
tail is distinctly non-linear at 2 amu lower than the
major isotope peak (Fig. 5). We found that a 3rd-order
polynomial gave the best fit to the overall shape of the
tail. Thus, the linear baseline correction used by Luo et
al. (1997) for 232Th/230Th analysis was not valid in our
case. Instead, we measured the shape of the tail using
U from CRM112 (as an analogue to 232Th) at the start
of each 232Th/230Th analysis session. Although the
shape of the tail varied significantly from session to
session, we found that it remained relatively constant
over short periods of time (days). Using a software
correction, 2 baselines measured at F 0.5 amu around
mass 230 (Table 2) were weighted in appropriate
proportions based on the shape of the tail to approx-
imate the true baseline below 230Th. This correction
made a f 0.1–2.1%difference in the final 232Th/230Th
ratios of the standards measured in this study. This
approach is similar to the exponential fit employed by
McDermott et al. (1993) to correct their measured232Th/230Th ratios for a much larger (f 15%) tail using
a TIMS that lacked an energy filter prior to the ion-
counting detector.
2.9. An evaluation of the correction for instrumental
mass fractionation
The instrumental mass fractionation induced by
MC-ICP-MS is relatively large (f 0.5–0.9%/amu
for U) compared to TIMS and must be corrected to
obtain accurate and precise results. Corrections to the238U/234U and 238U/233U ratios are straightforward
because U has two non-radiogenic isotopes (238U/235Uu 137.88) and, thus, the exponential mass frac-
tionation law of Russell et al. (1978) may be used. For
the 232Th/230Th, 232Th/229Th and 226Ra/228Ra ratios,
we used an internal inter-element correction for
instrumental mass fractionation (U from CRM112).
Although inter-element fractionation in the MC-ICP-
MS is sometimes assumed to be simply mass depend-
ent (e.g., Walder et al., 1993), detailed studies of the
isotope systematics of Pb–Tl (White et al., 2000),
Cu–Zn (Marechal et al., 1999) and Pd–Ag (Carlson
et al., 2001) have found small, but significant, depar-
tures from mass-dependent fractionation between ele-
ments of similar mass. It is currently impossible to
evaluate the inter-element fractionation behavior of U
and Ra because the 226Ra/228Ra ratio must be meas-
Fig. 5. Abundance sensitivity profile using the CRM112 U standard
as an analogue of the ‘‘tail’’ correction required for accurate232Th/230Th measurements. We found that a baseline correction
based on the fit of a 3rd-order polynomial to the ‘‘shape’’ of the tail
provided more accurate results for 232Th/230Th ratios. The signal
intensity of 238U was f 4� 10� 11 A during this measurement. The
within-run F 2rm uncertainties are less than the size of the symbols.
A.J. Pietruszka et al. / Chemical Geology 188 (2002) 171–191 181

ured using very low signal intensities on the Daly (due
to the low concentrations of our 226Ra standard and228Ra tracer) and, thus, the analytical uncertainties are
too large to distinguish small departures from mass-
dependant fractionation. Therefore, we assumed that
the instrumental mass fractionation between U and Ra
is simply mass dependent. Similarly, it is difficult to
evaluate the inter-element fractionation behavior of
Th and U because there is only one major, naturally
occurring isotope of Th. However, we were able to
examine several aspects of the inter-element fraction-
ation behavior of Th and U using U from CRM112
and two different mixtures of our 232Th standard and229Th tracer.
According to the exponential mass fractionation
law of Russell et al. (1978)
RThMeas: ¼ RTh
Frac:Corr:
M 232Th
M 229Th
� �bTh
; ð1Þ
where RTh = 232Th/229Th, M is the mass of the isotope
(in amu), and b is the fractionation factor. The ‘‘Meas.’’
and ‘‘Frac. Corr.’’ subscripts refer to the measured and
fractionation-corrected (or ‘‘true’’) isotope ratios,
respectively. A similar equation can be written for U.
These two equations may be combined and rearranged
to produce an expression that is useful for evaluating
inter-element instrumental mass fractionation (e.g.,
Marechal et al., 1999; White et al., 2000):
lnRThMeas: ¼
bTh
bU
lnM 232Th
M 229Th
� �
lnM238U
M235U
� � lnRUMeas: þ lnRTh
Frac: Corr:
26664
� bTh
bU
lnM 232Th
M 229Th
� �
lnM238U
M235U
� � lnRUFrac: Corr:
37775: ð2Þ
This equation has the form of a straight line on a plot of
the natural logarithms of the measured 232Th/229Th and238U/235U ratios with a slope given by
bTh
bU
lnM232Th
M229Th
� �
lnM238U
M235U
� � : ð3Þ
If the inter-element instrumental mass fractionation
between Th and U is simply mass dependent, then
bTh = bU and the observed slope is a function only of
the relative masses of the isotopes (e.g., Marechal et al.,
1999; White et al., 2000).
This relationship was tested experimentally using a
Th solution with a 232Th/229Th ratio of f 4 (Fig. 6A).
U from CRM112 was added to this solution in variable
proportions to simulate the range of Th/U ratios in our
unknowns (for both Th concentration and 232Th/230Th
ratio measurements). These mixtures were run on two
separate analytical sessions using only the Faraday
collectors. Fortunately, the two sessions displayed
slightly different and variable fractionation factors
(f 0.73–0.75% and 0.77–0.83% amu � 1 for U).
Overall, a plot of the measured ln[232Th/229Th] vs.
ln[238U/235U] shows a linear trend (r2 = 0.94). How-
ever, the slope of the data on this plot (0.9F 0.1, 2r)does not quite equal the value expected from the
relative masses of the isotopes (1.03). This indicates
that, in fact, bTh p bU. A more detailed examination of
the data reveals a correlation between either the
fractionation-corrected or measured 232Th/229Th ratios
and the measured Th/U ratio of the solution (Fig. 6B).
The 232Th/229Th ratio increases slightly as the Th/U
ratio increases (f 0.011F 0.003% amu � 1, 2r, for
every unit increase in Th/U). This indicates the pre-
sence of a relatively small matrix effect on Th and U
fractionation (cf., Pd–Ag matrix effects; Carlson et al.,
2001). As the relative concentration of Th (or Th/U
ratio) in the solution increases, the fractionation factor
measured using U becomes a greater underestimate of
the actual Th fractionation.
To correct for this matrix effect, all 232Th/229Th
and 232Th/230Th measurements in this study were
normalized to Th/U = 0 using the relationship in Fig.
6B, which seems to represent the limit of purely mass
dependant inter-element instrumental mass fractiona-
tion for Th–U mixtures. The validity of this correc-
tion was verified in two ways. First, the measured232Th/229Th ratios from the previous experiment
(which were determined at a relatively large range
in Th/U) were normalized to Th/U = 0 and plotted
again in Fig. 6A. The normalized data show a better
linear trend (r2 = 0.98) with a slope that lies within
uncertainty of the value expected from the relative
masses of the isotopes (1.04F 0.06, 2r). Second, weperformed another experiment using a Th solution
A.J. Pietruszka et al. / Chemical Geology 188 (2002) 171–191182

with a 232Th/229Th ratio off 12 (Fig. 6C). Two
portions of this solution were run using only the
Faraday collectors: one that contained only Th and
one that had U from CRM112 added to give a Th/U
ratio of f 0.8. The mixed Th–U solution was run in
the same fashion as the solution from the first experi-
ment with the final 232Th/229Th ratios normalized to
Th/U = 0. For the U-free Th solution, the fractionation
factor was measured using U from CRM112 before
and after each analysis. In this case, the 232Th/229Th of
the U-free solution was corrected for the effects of
instrumental mass fractionation using the average of
the two 238U/235U ratios. The average fractionation-
corrected 232Th/229Th ratios of these two types of
measurements are identical within uncertainty
( < 0.01% different), which demonstrates the validity
of our correction for the Th–U matrix effect. In any
case, it is important to note that the magnitude of the
matrix effect that we observed for Th ( < 0.03%/amu)
is insignificant given the current analytical uncertainty
of our techniques. However, a correction for this
effect will be critical for future studies that improve
Fig. 6. An evaluation of inter-element instrumental mass fractiona-
tion effects for Th and U. (A) A plot of the natural logarithms of the
measured 232Th/229Th vs. 238U/235U ratios of mixed Th–U solutions
with variable Th/U ratios and a constant 232Th/229Th ratio of f 4.
Data were collected during two separate analytical sessions that
displayed slightly different fractionation factors (circles vs. squares).
The raw data (open symbols) have a slope that is significantly
different from the slope expected from the relative masses of the
isotopes (line of bTh =bU), which indicates that the inter-element
instrumental mass fractionation for Th and U is not simply mass
dependant. When the 232Th/229Th ratios are normalized for the
variable Th/U ratios of the solutions (closed symbols), the data plot
along a line with bTh= bU. It should be noted that the intercept of thebTh= bU line is somewhat uncertain because the ‘‘true’’ 232Th/229Th
ratio is not independently known. (B) A plot of the fractionation-
corrected 232Th/229Th ratios of the same data as in (A). The
fractionation-corrected data (open symbols) display a trend of
increasing 232Th/229Th ratios with increasing Th/U ratio of the
solution. When normalized for this effect, the 232Th/229Th ratios
agree within analytical uncertainty (closed symbols). (C) A plot of
fractionation-corrected 232Th/229Th ratios of two aliquots of a Th
solution with a constant 232Th/229Th ratio of f 12. Two portions of
this solution were run: one that contained only Th (open symbols)
and one that had U from CRM112 added to give a Th/U ratio of
f 0.8 (closed symbols). The mixed Th–U solution was run in the
same fashion as the solution from the first experiment with the final232Th/229Th ratios normalized to Th/U= 0. For the U-free Th
solution, the fractionation factor was measured using U from
CRM112 before and after each analysis. In this case, the 232Th/229Th
of the U-free solution was corrected for the effects of instrumental
mass fractionation using the average of the two 238U/235U ratios
(crosses). The average fractionation-corrected 232Th/229Th ratios of
these two types of measurements are identical within uncertainty
( < 0.01% different). The error bars are the average within-runF 2rm
uncertainties.
A.J. Pietruszka et al. / Chemical Geology 188 (2002) 171–191 183
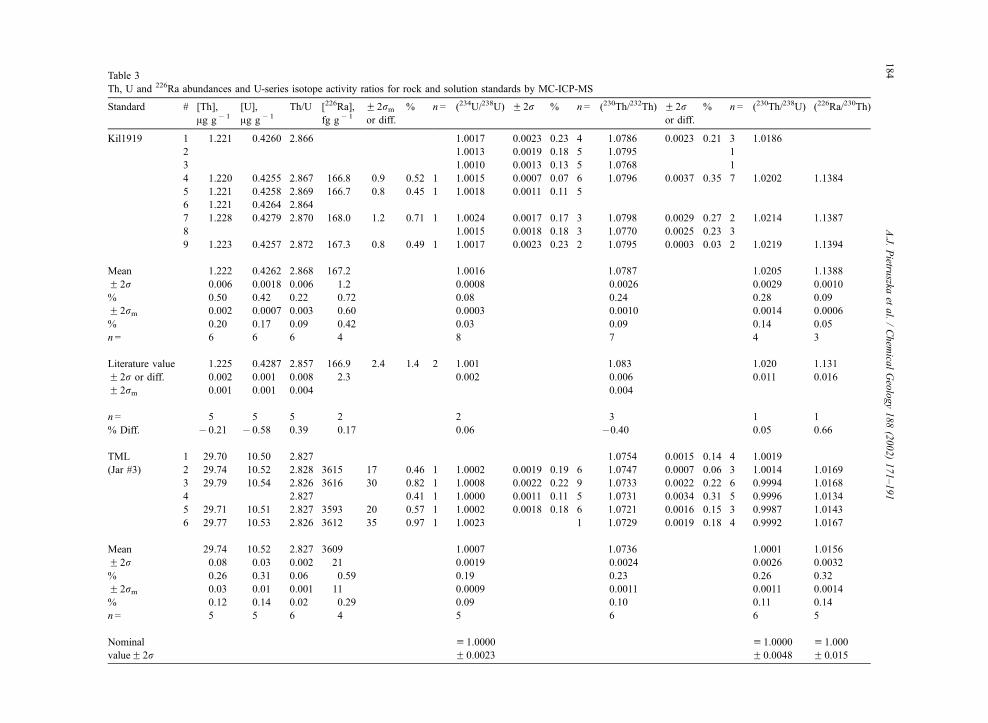
Table 3
Th, U and 226Ra abundances and U-series isotope activity ratios for rock and solution standards by MC-ICP-MS
Standard # [Th],
Ag g� 1
[U],
Ag g� 1
Th/U [226Ra],
fg g� 1
F 2rmor diff.
% n= (234U/238U) F 2r % n= (230Th/232Th) F 2ror diff.
% n= (230Th/238U) (226Ra/230Th)
Kil1919 1 1.221 0.4260 2.866 1.0017 0.0023 0.23 4 1.0786 0.0023 0.21 3 1.0186
2 1.0013 0.0019 0.18 5 1.0795 1
3 1.0010 0.0013 0.13 5 1.0768 1
4 1.220 0.4255 2.867 166.8 0.9 0.52 1 1.0015 0.0007 0.07 6 1.0796 0.0037 0.35 7 1.0202 1.1384
5 1.221 0.4258 2.869 166.7 0.8 0.45 1 1.0018 0.0011 0.11 5
6 1.221 0.4264 2.864
7 1.228 0.4279 2.870 168.0 1.2 0.71 1 1.0024 0.0017 0.17 3 1.0798 0.0029 0.27 2 1.0214 1.1387
8 1.0015 0.0018 0.18 3 1.0770 0.0025 0.23 3
9 1.223 0.4257 2.872 167.3 0.8 0.49 1 1.0017 0.0023 0.23 2 1.0795 0.0003 0.03 2 1.0219 1.1394
Mean 1.222 0.4262 2.868 167.2 1.0016 1.0787 1.0205 1.1388
F 2r 0.006 0.0018 0.006 1.2 0.0008 0.0026 0.0029 0.0010
% 0.50 0.42 0.22 0.72 0.08 0.24 0.28 0.09
F 2rm 0.002 0.0007 0.003 0.60 0.0003 0.0010 0.0014 0.0006
% 0.20 0.17 0.09 0.42 0.03 0.09 0.14 0.05
n= 6 6 6 4 8 7 4 3
Literature value 1.225 0.4287 2.857 166.9 2.4 1.4 2 1.001 1.083 1.020 1.131
F 2r or diff. 0.002 0.001 0.008 2.3 0.002 0.006 0.011 0.016
F 2rm 0.001 0.001 0.004 0.004
n= 5 5 5 2 2 3 1 1
% Diff. � 0.21 � 0.58 0.39 0.17 0.06 �0.40 0.05 0.66
TML 1 29.70 10.50 2.827 1.0754 0.0015 0.14 4 1.0019
(Jar #3) 2 29.74 10.52 2.828 3615 17 0.46 1 1.0002 0.0019 0.19 6 1.0747 0.0007 0.06 3 1.0014 1.0169
3 29.79 10.54 2.826 3616 30 0.82 1 1.0008 0.0022 0.22 9 1.0733 0.0022 0.22 6 0.9994 1.0168
4 2.827 0.41 1 1.0000 0.0011 0.11 5 1.0731 0.0034 0.31 5 0.9996 1.0134
5 29.71 10.51 2.827 3593 20 0.57 1 1.0002 0.0018 0.18 6 1.0721 0.0016 0.15 3 0.9987 1.0143
6 29.77 10.53 2.826 3612 35 0.97 1 1.0023 1 1.0729 0.0019 0.18 4 0.9992 1.0167
Mean 29.74 10.52 2.827 3609 1.0007 1.0736 1.0001 1.0156
F 2r 0.08 0.03 0.002 21 0.0019 0.0024 0.0026 0.0032
% 0.26 0.31 0.06 0.59 0.19 0.23 0.26 0.32
F 2rm 0.03 0.01 0.001 11 0.0009 0.0011 0.0011 0.0014
% 0.12 0.14 0.02 0.29 0.09 0.10 0.11 0.14
n= 5 5 6 4 5 6 6 5
Nominal
valueF 2ru 1.0000
F 0.0023
u 1.0000
F 0.0048
u 1.000
F 0.015
A.J.
Pietru
szkaet
al./Chem
icalGeology188(2002)171–191
184
the precision of Th concentration and 232Th/230Th
measurements using MC-ICP-MS.
2.10. Summary of our analytical procedures
A typical 232Th/230Th, 226Ra/228Ra or 238U/234U
analytical session requires measurements of (1) the235U/234U ratio of CRM112, (2) the abundance sensi-
tivity and the shape of the tail (this procedure is only
necessary for 232Th/230Th ratios), (3) the isobaric
interference(s) for the minor isotope(s) and (4) the
isotope ratios of the sample. After an analytical ses-
sion, the final isotope ratio of the sample is (1) cor-
rected for the isobaric interference(s) by subtracting the
on-peak baseline(s), (2) normalized to the nominal235U/234U value for CRM112 (232Th/230Th and 238U/234U ratios only) and (3) normalized to Th/U = 0 using
the relationship in Fig. 6B (232Th/230Th ratios only).
3. Results and discussion
We evaluated the accuracy and precision of our
analytical techniques using a range of rock (TML and
Kil1919) and solution (UCSC Th ‘‘A’’ and ZSR Th)
standards measured over a period off 3 years. Our
results are reported in Table 3. In this section, we
compare our new MC-ICP-MS data for these stand-
ards with literature data collected by mass spectrom-
etry (both MC-ICP-MS and TIMS; Table 4). It should
be noted that we switch from atomic to activity ratios
for this discussion (the latter are indicated by paren-
theses and are used to evaluate the presence or
absence of radioactive equilibrium between U-series
isotopes).
3.1. Accuracy
One test of accuracy is to measure the isotopic
composition of Th and/or U solution standards. Our U
solution standard, CRM112, cannot be used as a test
of accuracy since it was regularly used to correct for
variations in the performance of the Daly detector
(Fig. 2). Instead, we ran the Th solution standard,
UCSC Th ‘‘A’’, which has been analyzed frequently
by TIMS. Our average (230Th/232Th) ratio for UCSC
Th ‘‘A’’ isf 0.6% lower than the nominal value for
this standard (Table 3) andf 0.3–0.6% lower than
the range of values previously determined by TIMS
(Table 4). Our lower value for UCSC Th ‘‘A’’ lies
within the relatively large F 2r uncertainties of the
TIMS analyses. However, the standard deviation of
the mean (F 2rm) is probably a better estimate of the
analytical uncertainty for a comparison of the average
values of a relatively large number of multiple anal-
yses. In this case, our average (230Th/232Th) ratio for
UCSC Th ‘‘A’’ appears to be distinctly lower than two
of the three literature TIMS values listed in Table 3.
The origin of this discrepancy is unknown, but it is
interesting to note that our value for UCSC Th ‘‘A’’
agrees closely (f 0.08% different) with the MC-ICP-
MS value of Turner et al. (2001).
The analysis of rock standards is another way to
explore the accuracy of our analytical techniques. For
this purpose, we used a tholeiitic basalt from Kilauea
Volcano (Kil1919), which was analyzed previously by
Notes to Table 3:
The accuracy and precision of our Th isotope ratio measurements was evaluated further using the UCSC Th ‘‘A’’ and ZSR Th solution
standards. Our average for UCSC Th ‘‘A’’ was (230Th/232Th) = 1.0783F 0.0023 (F 2r, n= 17), which is 0.62% lower than the nominal value
(1.085). Our average for ZSR Th was (230Th/232Th) = 0.7991F 0.0025 (F 2r, n= 24). The Th, U and 226Ra concentrations are not reported for
dissolution #4 of TML-3 because a small amount of sample (f 1%) was spilled immediately prior to splitting and spiking (this will not affect
any of the ratios reported in the table). The other ‘‘missing’’ data are either portions of rock standards that were exhausted during the
development of the analytical techniques or rock standards that were analyzed only for Th and U concentrations (Kil1919 #6) or isotope ratios
(Kil1919 #2, 3 and 8). The 226Ra concentrations and (226Ra/230Th) ratios for Kil11919 are corrected for post-eruptive decay of 226Ra. The age-
corrected 226Ra concentration of Kil1919 #5 was calculated from its measured value using the average (230Th/232Th) for Kil1919. The literature
values and uncertainties for Kil1919 are from Pietruszka et al. (2001). The uncertainties of the single 226Ra concentration measurements are the
within-runF 2rm counting statistics. The decay constants used to calculate activity ratios are: k238U (1.551�10� 10 year� 1), k234U (2.826�10� 6 year� 1), k232Th (4.948� 10� 11 year� 1), k230Th (9.158� 10� 6 year� 1), and k226Ra (4.332� 10� 4 year� 1) from Jaffey et al. (1971)
for 238U, Cheng et al. (2000) for 234U and 230Th, Le Roux and Glendenin (1963) for 232Th and Tuli (2000) for 226Ra. The F 2r errors listed for
the nominal (equilibrium) TML values combine the uncertainties of these decay constants with the uncertainties related to the calibration of our233U, 229Th and 228Ra tracers.
A.J. Pietruszka et al. / Chemical Geology 188 (2002) 171–191 185
Pietruszka et al. (2001) for Th, U and 226Ra abundan-
ces and (234U/238U) and (230Th/232Th) ratios using
TIMS. In the following discussion, we directly com-
pare only ratios of the U-series isotopes for Kil1919
because the concentrations may be somewhat variable
due to the heterogeneous distribution of Ra-, Th- and
U-free olivine in this standard (e.g., Jochum and
Hofmann, 1995). Overall, our average (234U/238U),
(230Th/232Th), (230Th/238U) and (226Ra/230Th) ratios
for Kil1919 agree with the results of Pietruszka et al.
(2001) given the relatively large analytical uncertain-
ties of the TIMS data (Table 3). As might be expected
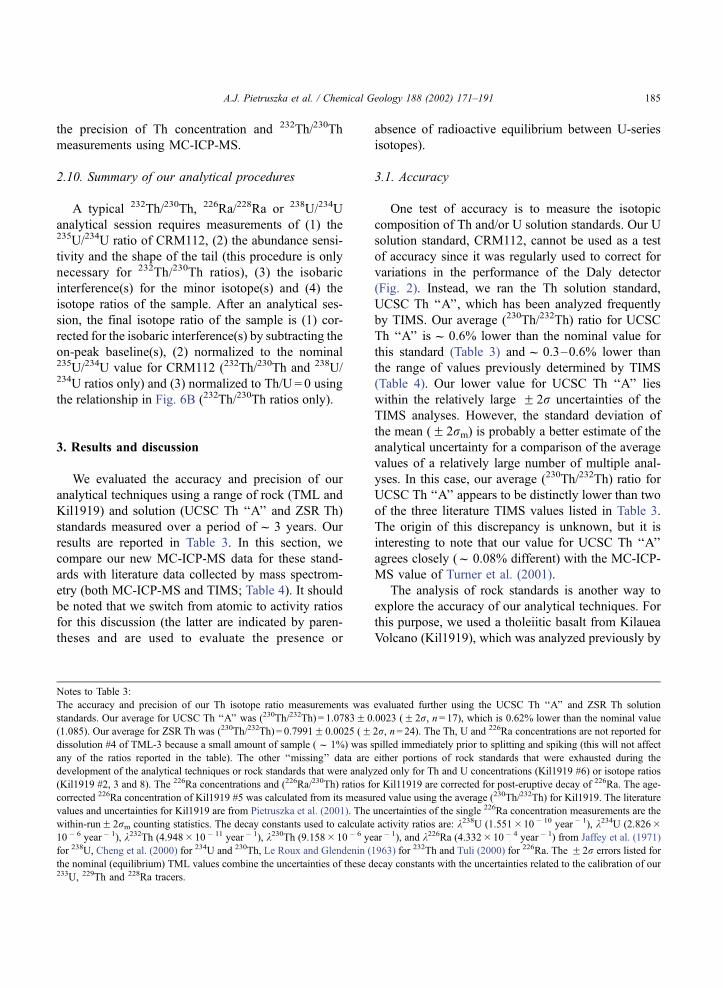
Table 4
Reproducibility of 232Th/230Th, 238U/234U and Th/U ratios and 226Ra concentrations by mass spectrometry
Element(s) Sample/standard information Technique Amount used
or sample
concentration
Ratio Reproducibility n= Ref.
Th Solution/rock standards [Th], ng 232Th/230Th F 2r (F 2rm)
Th ‘‘U’’ MC-ICP-MS 100 161,920 1.0% (0.35%) 8 1
UCSC Th ‘‘A’’ MC-ICP-MS 75–100 171,660 0.21% (0.05%) 17 2
UCSC Th ‘‘A’’ MC-ICP-MS 100 171,527 0.57% (0.21%) 7 1
Kil1919 MC-ICP-MS 75–100 171,600 0.24% (0.09%) 19 2
TML MC-ICP-MS 600 174,170 0.12% (0.04%) 8 3
TML MC-ICP-MS 75–100 172,410 0.23% (0.09%) 25 2
TML MC-ICP-MS 100 173,010 0.80% (0.30%) 7 1
L-80-6 MC-ICP-MS 600 175,670 0.10% (0.04%) 8 3
ATHO MC-ICP-MS 100 182,150 0.93% (0.38%) 6 1
Th S1 MC-ICP-MS 5 183,790 1.1% (0.46%) 6 1
ZSR Th MC-ICP-MS 75–100 231,640 0.31% (0.06%) 24 2
Cambridge Th ‘‘A’’ TIMS 400 91,200 0.70% (0.18%) 15 4
Th ‘‘U’’ TIMS z 100 163,100 0.69% (0.15%) 22 5
Th ‘‘U’’ TIMS z 100 163,500 1.0% (0.24%) 19 6
UCSC Th ‘‘A’’ TIMS 50–100 171,100 1.1% (0.18%) 39 7
UCSC Th ‘‘A’’ TIMS ? 171,100 1.1% (0.35%) 10 8
UCSC Th ‘‘A’’ TIMS ? 170,600 1.5% (0.25%) 35 9
Th S1 TIMS 100 181,900 1.5% (0.44%) 12 10
Th Sample replicates [Th], Ag g� 1 232Th/230Th F 2r or diff.
Kilauea Volcano TIMS 0.70–1.3 170,100–179,000 0.19–1.4% 6� 2, 1� 3 7
Mid-Atlantic Ridge TIMS 0.10–0.87 148,600–175,800 0.36–4.6% 7� 2, 4� 3 11
Socorro Island TIMS 2.3–20 173,400–249,100 0.05–2.8% 11� 2 9
U Solution/rock/mineral standards [U], ng 235U/234U F 2r (F 2rm)
SRM960 (CRM112-A) MC-ICP-MS 300–450 137.2 0.13% (0.03%) 19 3
Kil1919 MC-ICP-MS 20–50 131.9 0.16% (0.03%) 33 2
TML MC-ICP-MS 20–50 132.1 0.20% (0.04%) 27 2
‘‘Equilib.’’ materials TIMS 500–3000 132.1 0.08% (0.01%) 36 12
JR-2 TIMS 100 132.1 0.13% (0.04%) 11 13
JR-2 TIMS 50 132.2 0.18% (0.05%) 12 13
SRM960 (CRM112-A) TIMS 200–600 137.3 0.31% (0.08%) 14 3
U010 TIMS 50–100 185.5 0.52% (0.16%) 10 7
U Sample replicates [U], Ag g� 1 235U/234U F 2r or diff.
Lanzarote Island TIMS 1.1–1.6 132.3 0.20–0.30% 2� 2 5
Kilauea Volcano TIMS 0.42–0.43 131.1–132.0 0.18–0.83% 2� 2 7
Mid-Atlantic Ridge TIMS 0.036–0.21 130.5–133.0 0.60–3.0% 4� 2 11
A.J. Pietruszka et al. / Chemical Geology 188 (2002) 171–191186
from thef 0.3% difference in the (230Th/232Th) ratio
of the UCSC Th ‘‘A’’ standard between the two
laboratories (Table 4), our average (230Th/232Th) ratio
for Kil1919 is slightly (f 0.4%) lower than the value
of Pietruszka et al. (2001). However, only the Th/U
ratios are significantly different between the two
laboratories outside of the F 2rm uncertainties, which
may reflect small errors (adding up tof 0.4% differ-
ence) in the concentrations of the Th and U standards
used to calibrate the 229Th and 233U tracers.
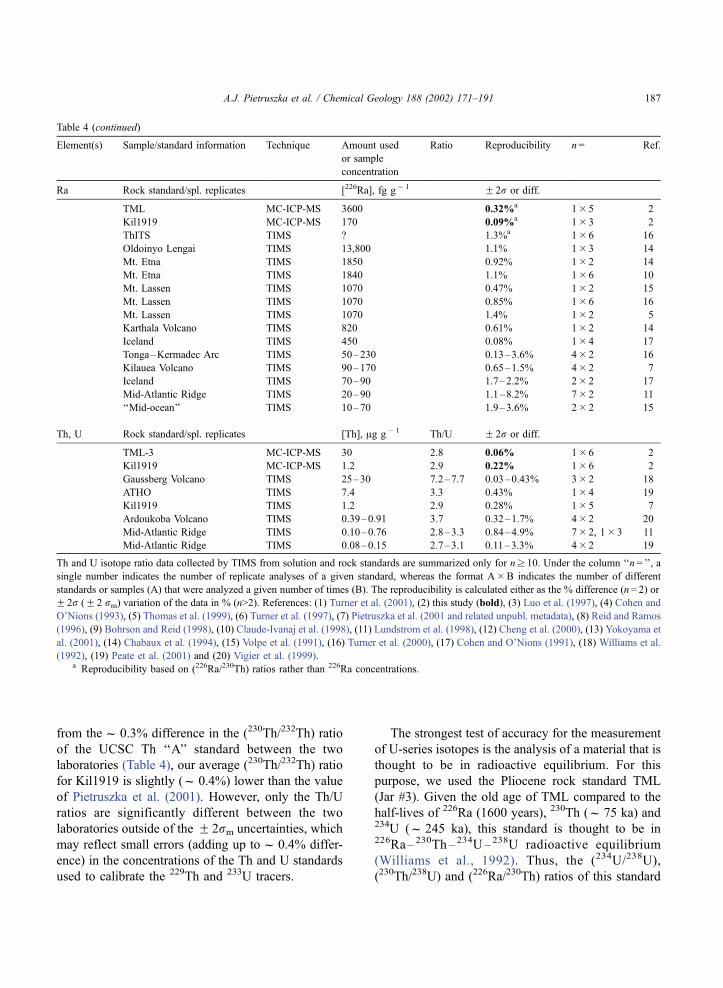
The strongest test of accuracy for the measurement
of U-series isotopes is the analysis of a material that is
thought to be in radioactive equilibrium. For this
purpose, we used the Pliocene rock standard TML
(Jar #3). Given the old age of TML compared to the
half-lives of 226Ra (1600 years), 230Th (f 75 ka) and234U (f 245 ka), this standard is thought to be in226Ra– 230Th– 234U–238U radioactive equilibrium
(Williams et al., 1992). Thus, the (234U/238U),
(230Th/238U) and (226Ra/230Th) ratios of this standard
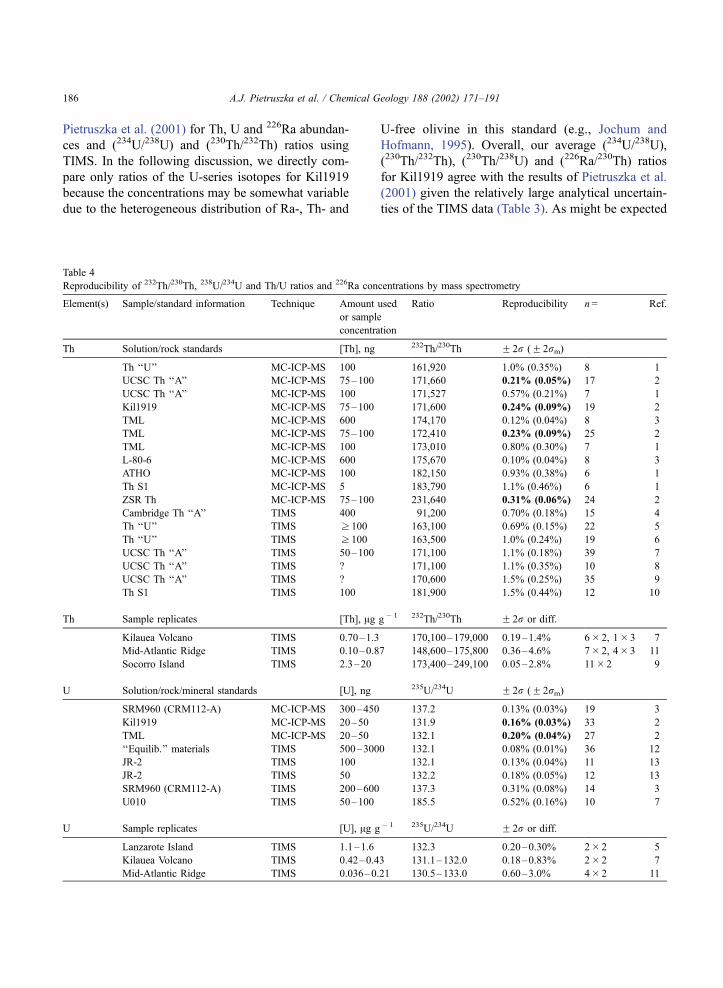
Table 4 (continued)
Element(s) Sample/standard information Technique Amount used
or sample
concentration
Ratio Reproducibility n= Ref.
Ra Rock standard/spl. replicates [226Ra], fg g� 1 F 2r or diff.
TML MC-ICP-MS 3600 0.32%a 1� 5 2
Kil1919 MC-ICP-MS 170 0.09%a 1� 3 2
ThITS TIMS ? 1.3%a 1� 6 16
Oldoinyo Lengai TIMS 13,800 1.1% 1� 3 14
Mt. Etna TIMS 1850 0.92% 1� 2 14
Mt. Etna TIMS 1840 1.1% 1� 6 10
Mt. Lassen TIMS 1070 0.47% 1� 2 15
Mt. Lassen TIMS 1070 0.85% 1� 6 16
Mt. Lassen TIMS 1070 1.4% 1� 2 5
Karthala Volcano TIMS 820 0.61% 1� 2 14
Iceland TIMS 450 0.08% 1� 4 17
Tonga–Kermadec Arc TIMS 50–230 0.13–3.6% 4� 2 16
Kilauea Volcano TIMS 90–170 0.65–1.5% 4� 2 7
Iceland TIMS 70–90 1.7–2.2% 2� 2 17
Mid-Atlantic Ridge TIMS 20–90 1.1–8.2% 7� 2 11
‘‘Mid-ocean’’ TIMS 10–70 1.9–3.6% 2� 2 15
Th, U Rock standard/spl. replicates [Th], Ag g� 1 Th/U F 2r or diff.
TML-3 MC-ICP-MS 30 2.8 0.06% 1� 6 2
Kil1919 MC-ICP-MS 1.2 2.9 0.22% 1� 6 2
Gaussberg Volcano TIMS 25–30 7.2–7.7 0.03–0.43% 3� 2 18
ATHO TIMS 7.4 3.3 0.43% 1� 4 19
Kil1919 TIMS 1.2 2.9 0.28% 1� 5 7
Ardoukoba Volcano TIMS 0.39–0.91 3.7 0.32–1.7% 4� 2 20
Mid-Atlantic Ridge TIMS 0.10–0.76 2.8–3.3 0.84–4.9% 7� 2, 1� 3 11
Mid-Atlantic Ridge TIMS 0.08–0.15 2.7–3.1 0.11–3.3% 4� 2 19
Th and U isotope ratio data collected by TIMS from solution and rock standards are summarized only for nz 10. Under the column ‘‘n= ’’, a
single number indicates the number of replicate analyses of a given standard, whereas the format A�B indicates the number of different
standards or samples (A) that were analyzed a given number of times (B). The reproducibility is calculated either as the % difference (n= 2) or
F 2r (F 2 rm) variation of the data in % (n>2). References: (1) Turner et al. (2001), (2) this study (bold), (3) Luo et al. (1997), (4) Cohen and
O’Nions (1993), (5) Thomas et al. (1999), (6) Turner et al. (1997), (7) Pietruszka et al. (2001 and related unpubl. metadata), (8) Reid and Ramos
(1996), (9) Bohrson and Reid (1998), (10) Claude-Ivanaj et al. (1998), (11) Lundstrom et al. (1998), (12) Cheng et al. (2000), (13) Yokoyama et
al. (2001), (14) Chabaux et al. (1994), (15) Volpe et al. (1991), (16) Turner et al. (2000), (17) Cohen and O’Nions (1991), (18) Williams et al.
(1992), (19) Peate et al. (2001) and (20) Vigier et al. (1999).a Reproducibility based on (226Ra/230Th) ratios rather than 226Ra concentrations.
A.J. Pietruszka et al. / Chemical Geology 188 (2002) 171–191 187
should equal unity within the uncertainty of the
calibration of our 228Ra, 229Th and 233U tracers (for230Th–238U and 226Ra–230Th) and/or the decay con-
stants (for all three isotope pairs). However, it is
important to note that TML is thought to be hetero-
geneous with respect to its (230Th/232Th) and Th/U
ratios (Williams et al., 1992). Thus, a comparison of
our results for these ratios with other laboratories is
not particularly meaningful. Overall, our average
F 2r results for (234U/238U), (230Th/238U) and
(226Ra/230Th) for TML are identical to equilibrium
within the uncertainties of the decay constants and the
errors associated with the calibration of our 229Th,233U and 228Ra tracers (Table 3). Furthermore, our
average (234U/238U) and (230Th/238U) ratios for TML
equal unity within the smaller F 2rm errors of the
replicate analyses (f 0.1% each), which attests to the
accuracy of the new decay constants proposed for230Th and 234U (Cheng et al., 2000). In contrast, our
average (226Ra/230Th) for TML is measurably differ-
ent from unity at the F 2r and F 2rm levels of the
replicate analyses (although still within the F 2runcertainty of the equilibrium value). This is some-
what unsatisfying, but we do not regard the elevated226Ra content of TML to be significant due to the
relatively large overall uncertainty in the concentra-
tion of our 226Ra standard (1.2%).
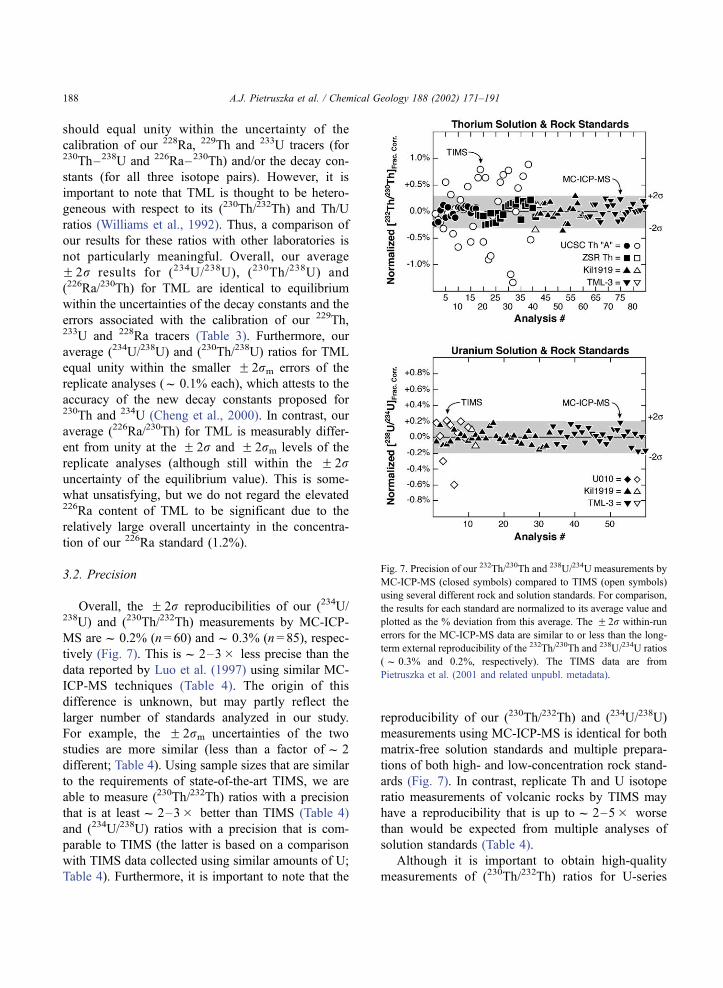
3.2. Precision
Overall, the F 2r reproducibilities of our (234U/238U) and (230Th/232Th) measurements by MC-ICP-
MS aref 0.2% (n = 60) andf 0.3% (n = 85), respec-
tively (Fig. 7). This isf 2–3� less precise than the
data reported by Luo et al. (1997) using similar MC-
ICP-MS techniques (Table 4). The origin of this
difference is unknown, but may partly reflect the
larger number of standards analyzed in our study.
For example, the F 2rm uncertainties of the two
studies are more similar (less than a factor off 2
different; Table 4). Using sample sizes that are similar
to the requirements of state-of-the-art TIMS, we are
able to measure (230Th/232Th) ratios with a precision
that is at leastf 2–3� better than TIMS (Table 4)
and (234U/238U) ratios with a precision that is com-
parable to TIMS (the latter is based on a comparison
with TIMS data collected using similar amounts of U;
Table 4). Furthermore, it is important to note that the
reproducibility of our (230Th/232Th) and (234U/238U)
measurements using MC-ICP-MS is identical for both
matrix-free solution standards and multiple prepara-
tions of both high- and low-concentration rock stand-
ards (Fig. 7). In contrast, replicate Th and U isotope
ratio measurements of volcanic rocks by TIMS may
have a reproducibility that is up tof 2–5� worse
than would be expected from multiple analyses of
solution standards (Table 4).
Although it is important to obtain high-quality
measurements of (230Th/232Th) ratios for U-series
Fig. 7. Precision of our 232Th/230Th and 238U/234U measurements by
MC-ICP-MS (closed symbols) compared to TIMS (open symbols)
using several different rock and solution standards. For comparison,
the results for each standard are normalized to its average value and
plotted as the % deviation from this average. The F 2r within-run
errors for the MC-ICP-MS data are similar to or less than the long-
term external reproducibility of the 232Th/230Th and 238U/234U ratios
(f 0.3% and 0.2%, respectively). The TIMS data are from
Pietruszka et al. (2001 and related unpubl. metadata).
A.J. Pietruszka et al. / Chemical Geology 188 (2002) 171–191188

isotope studies of active volcanoes, precise measure-
ments of 230Th–238U disequilibria in volcanic rocks
require a similar reproducibility for Th/U ratios. The
precision of our Th/U measurements by MC-ICP-MS
was evaluated using multiple preparations of the rock
standards Kil1919 (n = 6) and TML (n = 6). These
results show a reproducibility off 0.2% (F 2r),which is similar to or slightly better than the precision
of the highest quality TIMS data (Table 4). It is
important to note that this high precision was attained
without the use of HClO4 or boric acid, which are
frequently used by other laboratories during sample
dissolution to ensure complete equilibration between
the sample and spike. We estimate the F 2r precision
of our MC-ICP-MS techniques for the measurement
of 230Th–238U disequilibria atf 0.3% based on mul-
tiple analyses of Kil1919 and TML (Table 3). This
reproducibility is consistent with the overall precision
of our Th/U and (230Th/232Th) measurements
(f 0.2% and 0.3%, respectively) and translates
directly to a precision for 230Th–238U disequilibria
that is at leastf 2–3� better than TIMS.
The precision of our 226Ra–230Th disequilibria
measurements by MC-ICP-MS was evaluated using
multiple preparations of the rock standards Kil1919
(n = 3) and TML (n = 5). Our results indicate a F 2rre-producibility for 226Ra–230Th disequilibria of
f 0.3% (Table 3). Although few TIMS laboratories
have directly evaluated the precision of their measure-
ments of 226Ra – 230Th disequilibria, this is at
leastf 2–3� better than the reproducibility of most
replicate analyses of 226Ra abundances in volcanic
rocks by TIMS (Table 4). However, it is important to
note that the true precision of 226Ra–230Th disequi-
libria measurements should also include the reprodu-
cibility of the (230Th/232Th) ratios and Th concen-
trations (which is rarely evaluated). If these were
included, the overall precision of our measurements
of 226Ra–230Th disequilibria by MC-ICP-MS would
be expected to be even better than TIMS (given the
higher precision of Th isotope ratio measurements by
MC-ICP-MS).
4. Conclusions
In this paper, we have described new analytical
techniques for the precise and accurate measurement
of 226Ra–230Th–238U disequilibria in volcanic rocks
using MC-ICP-MS. The greatest strength of our MC-
ICP-MS methods is the higher precision compared to
TIMS (at leastf 2–3� better using sample sizes
that are similar to the requirements of state-of-the-art
TIMS). However, there are several weaknesses to our
analytical techniques for 230Th and 226Ra that could
be improved substantially by future studies, such as
(1) the magnitude of the correction for the tail of232Th beneath 230Th, (2) the lower sensitivity for Ra
by MC-ICP-MS (f 0.5F 0.1% in this study) com-
pared to TIMS (f 10–15% for pure standards,
butf 2� lower for samples; Cohen and O’Nions,
1991), (3) the software limitation that requires the
use of 235U (rather than 238U) to correct the226Ra/228Ra ratio for fluctuations in the signal inten-
sity and (4) the requirement of a third measurement
sequence for 226Ra/228Ra measurement due to prob-
lems setting the Faraday collectors at 1 amu spacing
(Fig. 1). However, it is important to note that these
‘‘problems’’ for MC-ICP-MS are more than offset by
the much higher sensitivity for Th compared to TIMS
and the ability to correct the measured 232Th/230Th
and 226Ra/228Ra ratios for the effects of instrumental
mass fractionation and/or variations in the Daly–
Faraday gain using the 238U/235U ratio of a natural
U standard added to the sample (impossible by
TIMS). These analytical improvements will increase
the usefulness of U-series isotopes as high-resolution
tracers of the nature and timing of magmatic pro-
cesses at active volcanoes.
Acknowledgements
This development work was conducted while the
first author was a Carnegie Postdoctoral Research
Fellow at DTM. The creative advice ofM. Horan and T.
Mock helped us to surmount a number of vexing
analytical challenges related to the chemistry and
mass spectrometry. We are very grateful to both of
them. D. Snyder conducted analysis #6 of the TML
rock standard as part of his dissertation research
project at DTM. We also thank M. Garcia, J. Gill, S.
Hart, P. Holden, K. Rubin and K. Sims for
providing some of the isotopic spikes and/or rock
and solution standards used in this project. The
critical comments of S. Turner and an anonymous
A.J. Pietruszka et al. / Chemical Geology 188 (2002) 171–191 189
reviewer helped us to focus the presentation of our
results. [RR]
References
Bohrson, W.A., Reid, M.R., 1998. Genesis of evolved ocean island
magmas by deep- and shallow-level basement recycling, Socor-
ro Island, Mexico: constraints from Th and other isotope signa-
tures. J. Petrol. 39, 995–1008.
Carlson, R.W., Hauri, E.H., Alexander, C.M.O.D., 2001. Matrix
induced isotopic mass fractionation in the ICP-MS. In: Holland,
G.P., Tanner, S.D. (Eds.), Plasma Source Mass Spectrometry:
The New Millennium. The Royal Society of Chemistry, Cam-
bridge, pp. 288–297.
Chabaux, F., Ben Othman, D., Birck, J.L., 1994. A new Ra–Ba
chromatographic separation and its application to Ra mass-spec-
trometric measurement in volcanic rocks. Chem. Geol. 114,
191–197.
Cheng, H., Edwards, R.L., Hoff, J., Gallup, C.D., Richards, D.A.,
Asmerom, Y., 2000. The half-lives of uranium-234 and thorium-
230. Chem. Geol. 169, 17–33.
Claude-Ivanaj, C., Bourdon, B., Allegre, C.J., 1998. Ra–Th–Sr iso-
tope systematics in Grande Comore Island: a case of plume–
lithosphere interaction. Earth Planet. Sci. Lett. 164, 99–117.
Cohen, A.S., O’Nions, R.K., 1991. Precise determination of femto-
gram quantities of radium by thermal ionization mass spectrom-
etry. Anal. Chem. 63, 2705–2708.
Cohen, A.S., O’Nions, R.K., 1993. Melting rates beneath Hawaii:
evidence from uranium series isotopes in recent lavas. Earth
Planet. Sci. Lett. 120, 169–175.
Edwards, R.L., Chen, J.H., Wasserburg, G.J., 1987. 238U–234U–230Th– 232Th systematics and the precise measurement of
time over the past 500,000 years. Earth Planet. Sci. Lett.
81, 175–192.
Goldstein, S.J., Murrell, M.T., Janecky, D.R., 1989. Th and U iso-
topic systematics of basalts from the Juan de Fuca and Gorda
Ridges by mass spectrometry. Earth Planet. Sci. Lett. 96,
134–146.
Halliday, A.N., Lee, D.-C., Christensen, J.N., Rehkamper, M., Yi,
W., Luo, X., Hall, C.M., Ballentine, C.J., Pettke, T., Stirling,
C., 1998. Applications of multiple collector-ICPMS to cosmo-
chemistry, geochemistry, and paleoceanography. Geochim.
Cosmochim. Acta 62, 919–940.
Horwitz, E.P., Chiarizia, R., Dietz, M.L., 1992. A novel strontium-
selective extraction chromatographic resin. Solvent Extr. Ion
Exch. 10, 313–336.
Horwitz, E.P., Chiarizia, R., Dietz, M.L., Diamond, H., Nelson,
D.M., 1993. Separation and preconcentration of actinides from
acidic media by extraction chromatography. Anal. Chim. Acta
281, 361–372.
Jaffey, A.H., Flynn, K.F., Glendenin, L.E., Bentley, W.C., Essling,
A.M., 1971. Precison measurement of half-lives and specific
activities of 235U and 238U. Phys. Rev. 4, 1889–1906.
Jochum, K.P., Hofmann, A.W., 1995. Contrasting Th/U in histor-
ical Mauna Loa and Kilauea lavas. In: Rhodes, J.M., Lock-
wood, J.P. (Eds.), Mauna Loa Revealed: Structure, Com-
position, History, and Hazards. AGU Geophys. Monogr., vol.
92, pp. 307–314.
Le Roux, L.J., Glendenin, L.E., 1963. Half-live of thorium-232.
Proc. of the National Conference on Nuclear Energy, Pretoria,
South Africa, 83–94.
Lundstrom, C.C., Gill, J., Williams, Q., Hanan, B.B., 1998. Inves-
tigating solid mantle upwelling beneath mid-ocean ridges using
U-series disequilibria: II. A local study at 33jS Mid-Atlantic
Ridge. Earth Planet. Sci. Lett. 157, 167–181.
Luo, X., Rehkamper, M., Lee, D.-C., Halliday, A.N., 1997. High
precision 230Th/232Th and 234U/238U measurements using en-
ergy-filtered magnetic sector multiple collector mass spectrom-
etry. Int. J. Mass Spectrom. Ion Processes 171, 105–117.
Marechal, C.N., Telouk, P., Albarede, F., 1999. Precise analysis of
copper and zinc isotopic compositions by plasma-source mass
spectrometry. Chem. Geol. 156, 251–273.
McDermott, F., Elliott, T.R., van Calsteren, P., Hawkesworth, C.J.,
1993. Measurement of 230Th/232Th ratios in young volcanic
rocks by single-sector thermal ionization mass spectrometry.
Chem. Geol. 103, 283–292.
Oversby, V.M., Gast, P.W., 1968. Lead isotope compositions and
uranium decay series disequilibrium in recent volcanic rocks.
Earth Planet. Sci. Lett. 5, 199–206.
Peate, D.W., Hawkesworth, C.J., van Calsteren, P.W., Taylor, R.N.,
Murton, B.J., 2001. 238U–230Th constraints on mantle upwell-
ing and plume– ridge interaction along the Reykjanes Ridge.
Earth Planet. Sci. Lett. 187, 259–272.
Pietruszka, A.J., Rubin, K.H., Garcia, M.O., 2001. 226Ra –230Th– 238U disequilibria of historical Kilauea lavas (1790–
1982) and the dynamics of mantle melting within the Hawaiian
plume. Earth Planet. Sci. Lett. 186, 15–31.
Reid, M.R., Ramos, F.C., 1996. Chemical dynamics of enriched
mantle in the southwestern United States: thorium isotope evi-
dence. Earth Planet. Sci. Lett. 138, 67–81.
Russell, W.A., Papanastassiou, D.A., Tombrello, T.A., 1978. Ca
isotope fractionation on the Earth and other solar system mate-
rials. Geochim. Cosmochim. Acta 42, 1075–1090.
Somayajulu, B.L.K., Tatsumoto, M., Rosholt, J.N., Knight, R.J.,
1966. Disequilibrium of the 238U series in basalt. Earth Planet.
Sci. Lett. 1, 387–391.
Thomas, L.E., Hawkesworth, C.J., van Calsteren, P., Turner, S.P.,
Rogers, N.W., 1999. Melt generation beneath ocean islands: a
U–Th–Ra isotope study from Lanzarote in the Canary Islands.
Geochim. Cosmochim. Acta 63, 4081–4099.
Tuli, J.K., 2000. Nuclear Wallet Cards. Brookhaven National Labo-
ratory, New York, 114 pp.
Turner, S., Hawkesworth, C., Rogers, N., King, P., 1997. U–Th
isotope disequilibria and ocean island basalt generation in the
Azores. Chem. Geol. 139, 145–164.
Turner, S., Bourdon, B., Hawkesworth, C., Evans, P., 2000.226Ra– 230Th evidence for multiple dehydration events, rapid
melt ascent and the time scales of differentiation beneath the
Tonga –Kermadec island arc. Earth Planet. Sci. Lett. 179,
581–593.
Turner, S., van Calsteren, P., Vigier, N., Thomas, L., 2001. Deter-
mination of thorium and uranium isotope ratios in low-concen-
A.J. Pietruszka et al. / Chemical Geology 188 (2002) 171–191190
tration geological materials using a fixed multi-collector-ICP-
MS. J. Anal. At. Spectrom. 16, 612–615.
Vigier, N., Bourdon, B., Joron, J.L., Allegre, C.J., 1999. U-decay
series and trace element systematics in the 1978 eruption of
Ardoukoba, Asal rift: timescale of magma crystallization. Earth
Planet. Sci. Lett. 174, 81–97.
Volpe, A.M., Olivares, J.A., Murrell, M.T., 1991. Determination
of radium isotope ratios and abundances in geologic samples
by thermal ionization mass spectrometry. Anal. Chem. 63,
913–916.
Walder, A.J., Platzner, I., Freedman, P.A., 1993. Isotope ratio meas-
urement of lead, neodymium, and neodymium–samarium mix-
tures, hafnium and hafnium– lutetium mixtures with a double
focusing multiple collector inductively coupled plasma mass
spectrometer. J. Anal. At. Spectrom. 8, 19–23.
White, W.M., Albarede, F., Telouk, P., 2000. High-precision analy-
sis of Pb isotope ratios by multi-collector ICP-MS. Chem. Geol.
167, 257–270.
Williams, R.W., Collerson, K.D., Gill, J.B., Deniel, C., 1992. High
Th/U ratios in subcontinental lithospheric mantle: mass spectro-
metric measurement of Th isotopes in Gaussberg lamproites.
Earth Planet. Sci. Lett. 111, 257–268.
Yokoyama, T., Makishima, A., Nakamura, E., 2001. Precise anal-
ysis of 234U/238U ratio using UO2+ ion with thermal ioniza-
tion mass spectrometry for natural samples. Chem. Geol. 181,
1–12.
A.J. Pietruszka et al. / Chemical Geology 188 (2002) 171–191 191