Embed Size (px)
Citation preview

Precipitation Associated with Convergence Lines
EVAN WELLER
School of Earth, Atmosphere and Environment, and Centre of Excellence for Climate System Science,
Monash University, Clayton, Victoria, Australia
KAY SHELTON
JBA Consulting, Skipton, United Kingdom
MICHAEL J. REEDER AND CHRISTIAN JAKOB
School of Earth, Atmosphere and Environment, Centre of Excellence for Climate
System Science, Monash University, Clayton, Victoria, Australia
(Manuscript received 20 July 2016, in final form 29 November 2016)
ABSTRACT
Precipitation is often organized along coherent lines of low-level convergence, which at longer time and
space scales form well-known convergence zones over the world’s oceans. Here, an automated, objective
method is used to identify instantaneous low-level convergence lines in reanalysis data and calculate their
frequency for the period 1979–2013. Identified convergence lines are combined with precipitation observa-
tions to assess the extent to which precipitation around the globe is associated with convergence lines in the
lower troposphere. It is shown that a large percentage of precipitation (between 65% and 90%) over the
tropical oceans is associated with such convergence lines, with large regional variations of up to 30%
throughout the year, especially in the eastern Pacific and Atlantic Oceans. Over land, the annual-mean
proportion of precipitation associated with convergence lines ranges between 30% and 60%, and the lowest
proportions (less than 15%) associated with convergence lines occur on the eastern flank of the subtropical
highs. Overall, much greater precipitation is associated with long coherent lines (greater than 300 km in
length) than with shorter fragmented lines (less than 300 km), and the majority of precipitation associated
with shorter lines occurs over land. The proportion of precipitation not associated with any convergence line
primarily occurs where both precipitation and frequency of convergence lines are low. The high temporal and
spatial resolution of the climatology constructed also enables an examination of the diurnal cycle in the
relationship between convergence lines and precipitation. Here an example is provided over the tropical
Maritime Continent region.
1. Introduction
Although rainfall is intermittent in both time and
space, its timing and location are intimately tied to
vertical motion, and the internal circulation of weather
systems commonly provides this vertical motion (Birch
et al. 2014a; Bony et al. 2015). For this reason, variations
in the frequency, structure, or intensity of weather sys-
tems exert a strong control on the variability of rainfall.
Moreover, the convergence of mass in the low-level
boundary layer plays an important role in the initiation
and organization of clouds and convection (Reeder and
Smith 1998; Reeder et al. 2013; Birch et al. 2014a, 2015).
This initiation and organization is particularly evident
over tropical and subtropical latitudes where the ma-
jority of precipitation occurs in the vicinity of low-level
convergence (Fig. 1).
Low-level convergence is often organized into co-
herent lines that can be seen in satellite imagery as they
are marked by distinct lines of clouds (i.e., Birch et al.
2014a,b). Presumably, these lines are produced by such
weather phenomena as the equatorward extension of
fronts, gravity waves, atmospheric boundary layer rolls,
evaporatively driven cold pools, and topographically
generated weather systems such as mountain waves and
sea and land breezes. Over longer time scales, persistent
sea surface temperature (SST) gradients can alsoCorresponding author e-mail: Evan Weller, evan.weller@
monash.edu
1 MAY 2017 WELLER ET AL . 3169
DOI: 10.1175/JCLI-D-16-0535.1
� 2017 American Meteorological Society. For information regarding reuse of this content and general copyright information, consult the AMS CopyrightPolicy (www.ametsoc.org/PUBSReuseLicenses).

produce mean vertical circulations and low-level con-
vergence (Lindzen and Nigam 1987). Further, Birch
et al. (2014a) examined the role of convergence lines in
initiating convection in West Africa and found that al-
though almost all deep convective initiations occurred
within patches of local-scale (60 km 3 60km) conver-
gence, half of all initiations occurred in the near vicinity
of low-level convergence lines oriented along the mean
wind. At longer time and space scales, these individual
convergence lines are organized into larger structures
such as the intertropical convergence zone (ITCZ) and
the South Pacific convergence zone (SPCZ) (Hastenrath
1995; Widlansky et al. 2011; Berry and Reeder 2014;
Wodzicki and Rapp 2016).
Predicting rainfall in the tropics remains one of the
most important and challenging problems in atmo-
spheric science (IPCC 2007; Flato et al. 2013; Bony et al.
2015). The problem is important because Earth’s cli-
mate is very strongly affected by deep tropical convec-
tion, which drives the wind systems that transport
momentum, heat, and water over much of the planet.
The problem of predicting rainfall in the tropics is
challenging because the main tools for making pre-
dictions are numerical models, ranging from those used
in numerical weather prediction to those used for cli-
mate, which generally handle tropical rainfall poorly
and it is not fully understood why (Stephens et al. 2010;
Collins et al. 2013). Nonetheless, the way in which
convection is represented and the spatial resolution in
these models are undoubtedly major factors (Stephens
et al. 2010; Stevens and Bony 2013; Birch et al. 2014a;
Jakob 2014). On the time scale of a weather forecast, a
model’s state is predominantly governed by atmospheric
processes, but on seasonal and climate time scales, all
coupled ocean–land–ice–atmosphere processes become
important. Although these models are designed to sim-
ulate the main large-scale dynamical processes leading
to precipitation (or its suppression), they rely on con-
ceptual parameterizations to represent cloud and
microphysical processes. Apart from the rate of emis-
sion of the greenhouse gases themselves, the parame-
terization of convection, especially in the tropics, is
generally thought to be one of the biggest sources of
uncertainty in climate model projections (Jakob 2014;
Rybka and Tost 2014). Many model errors have been
ascribed to a poor simulation of convection, which in
turn is strongly coupled to the atmospheric circulation.
Hence, investigating the relationship between the cir-
culation and the precipitation may provide insights into
the performance of models and a better understanding
of how atmospheric convection is organized on the scale
resolved by the models (Jakob 2010; Catto et al. 2015).
Here, we examine the role of convergence lines (and
organized convergence more generally) in organizing
precipitation and provide a benchmark by which de-
ficiencies in weather and climate models can be better
understood. An automatic objective method is de-
veloped to identify convergence lines and the rainfall
associated with them. Previous studies have developed
methods to automatically identify fronts (Berry et al.
2011a,b) and the associated rainfall (Catto et al. 2012).
These studies have shown that large proportions of the
rainfall in the major storm-track regions can be associ-
ated with fronts. Recent work applying these techniques
to climate models has shown much promise in identify-
ing model errors (Catto et al. 2013, 2015). Fronts are just
one weather system that initiates and organizes pre-
cipitation. Moreover, fronts are themselves but a subset
of the larger class of low-level convergence lines in the
atmosphere, and are an ineffective feature for examin-
ing rainfall in the tropics because fronts and their cir-
culation become weak due to the weak temperature
gradients at low latitudes.
The method developed and used in the present study
to objectively identify low-level convergence lines is a
variation on that described in Berry and Reeder (2014),
who used the method to construct a climatology of the
ITCZ from reanalyses of mean lower tropospheric
FIG. 1. Spatial correlation coefficients for 1998–2013 between monthly-mean time series of
CMORPH precipitation rate and 950-hPa layer divergence (calculated using ERA-Interim
winds). Regions where the surface topography is higher than 1 km have been shaded gray.
3170 JOURNAL OF CL IMATE VOLUME 30

convergence. Wodzicki and Rapp (2016) modified the
method outlined by Berry and Reeder (2014) to exam-
ine changes in the ITCZ extent and precipitation in-
tensity within the identified ITCZ boundaries in
monthly mean data. The benefit of an objective ap-
proach is that it avoids any prior human training of the
model as in some earlier methods (Bain et al. 2011).
However, Berry and Reeder (2014) and Wodzicki and
Rapp (2016) adopted long time averaging to isolate
continuous line features and isolated tropical features
using the lower-troposphere potential temperature.
To associate precipitation with the convergence lines,
instantaneous velocity fields are used to identify the
lines. From the instantaneous fields of low-level con-
vergence lines, Birch et al. (2014b) developed a clima-
tology of convergence lines over the Arabian Sea and
found that it captured the location and offshore propa-
gation of wave-cloud lines from the west coast of India.
In the present study, the technique of Berry and Reeder
(2014) is applied to a global reanalysis and combined
with satellite data to quantify rainfall associated with
convergence lines around the globe, including an ex-
ample examining the diurnal variation of both conver-
gence lines and the associated rainfall over theMaritime
Continent. We treat the ERA-Interim global reanalysis
as an observed field, but note that the data may include
some error in regions with few observations.
Section 2 describes the reanalysis and observational
datasets, and the methodology. Section 3 presents an-
nual and seasonal mean global distributions of identified
convergence lines and the precipitation associated with
them. The results are then discussed and summarized in
section 4.
2. Data and methodology
a. Data
The locations of instantaneous convergence lines are
computed using the European Centre for Medium-Range
Weather Forecasts (ECMWF) interim reanalysis (ERA-
Interim;Dee et al. 2011) 6-hourlywind fields at 950hPa for
the period 1979–2013 on a regular 0.758 horizontal grid.This constructed atlas of convergence lines is combined
with 6-hourly rainfall on a regular 0.258 horizontal grid
from the National Oceanic and Atmospheric Adminis-
tration (NOAA)/Climate Prediction Center (CPC)
morphing technique (CMORPH; Joyce et al. 2004) for the
period 1998–2013, when the two datasets overlap in time.
b. Methodology
The current study combines a modified form of
Berry and Reeder (2014) used to identify layer- and
time-averaged convergence features such as the ITCZ
with the approach taken by Catto et al. (2012) to as-
sociate precipitation with such objectively identified
synoptic features. Modifications are described below
and the method is illustrated in Figs. 2 and 3. We
conduct our analysis equatorward of 608, consistentwith the spatial extent of the precipitation data.
Instantaneous convergence lines are detected from
the locations of the minima in the 6-hourly divergence
field calculated at 950 hPa. The wind fields are not
averaged in the vertical or time. The method is as
follows. First, the points potentially belonging to a
convergence line are detected by isolating sufficiently
strong regions of convergence. As shown in Fig. 2a,
regions in which the divergence is more positive
than20.13 1025 s21 are masked, leaving only regions
of convergence. Second, the location and orientation
of the convergence lines are calculated by analogy
with the moment of inertia. Specially, using all un-
masked grid points within a defined box (8.258 latitude/longitude, equivalent to 65 grid points; Fig. 3a), the
moment of inertia and the centroid of mass are
calculated where, by analogy, the convergence re-
places the mass (Fig. 3b). This analogous tensor I is
called the convergence inertia tensor and is defined
here by
"Ixx
Iyy
Ixy
Iyy
#, where
Ixx5 �
i
cix2i , I
yy5 �
i
ciy2i , I
xy5 �
i
cixiyi.
Here Ixx, Iyy, and Ixy are sums of the convergence at each
grid point ci weighted by products of the distances in the
x and y directions to the centroid. The eigenvalues and
eigenvectors of the convergence inertia tensor are cal-
culated (Fig. 3c). The larger eigenvalue and its corre-
sponding eigenvector define the orientation of themajor
axis of convergence within the box (i.e., the along-line
direction; Fig. 2b), while the eigenvector associated with
the smaller eigenvalue defines the perpendicular axis
(i.e., across line direction, Fig. 2c). Last, a bilinear in-
terpolated polynomial is fitted to the convergence field
in the across line (i.e., minor eigenvector) direction to
determine and locate the convergence maximum, if one
exists (Figs. 3d,e).
The technique adopted here improves that used in
Berry and Reeder (2014). They took the first derivatives
of the divergence (in the x and y directions) and summed
them, and then used the second derivative to determine
which stationary points were local minima. Their
method resulted in a slight bias to northwest–southeast-
oriented lines. While their method worked well in the
1 MAY 2017 WELLER ET AL . 3171

tropics, this bias increases with latitude. Using the ei-
genvectors of the inertia tensor eliminates this bias.
Once all convergence maxima are identified in a
6-hourly field (i.e., Fig. 2d), the line-joining algorithmused
by Berry et al. (2011a) is employed. This algorithm joins
the maxima into coherent lines assuming neighboring
points are sufficiently close (here we use a threshold of
less than 18 to join points to their nearest neighbor) and
the resulting lines meet a minimum length threshold
(here we use a threshold of 300 km along the respective
line of joined points) (Fig. 2e). The objectively identified
lines are shown to coincide with regions of precipitation
when overlaid on satellite imagery for the same time
(Fig. 2f). The frequency of occurrence of the in-
stantaneous convergence lines over the globe from 608Sto 608N is calculated. To assess the robustness of the
objective detection method, the sensitivity of the iden-
tified convergence lines to the imposed threshold
parameters (such as the maximum convergence, the box
size used to calculate the centroid, and the minimum
length of an identified line) is also examined.
To associate rainfall with the objectively identified
convergence lines we first determine the location of grid
points with rainfall greater than zero for each 6-hourly
field. For each rain grid point, a 28 3 28 box centered on thepoint is searched for an identified convergence line. If
there is at least one convergence line in the box, then the
rainfall at that grid point is assumed to be associatedwith a
convergence line. The 6-hourly times are then aggregated
to determine how much of the daily rainfall is associated
with convergence lines at each grid point. This daily rain-
fall is expressed as a percentage of the total rainfall. The
main difference between themethod used here and that by
Catto et al. (2012) used to associate rainfall with fronts, is
the size of the search box.We employ a smaller search box
size primarily due to the higher temporal and spatial
FIG. 2. Example of the procedure employed to objectively identify convergence lines using an instantaneous
divergence field over the PacificOcean andAustralian landmass. (a) Convergent regions are isolated and (b),(c) the
components of the inertia tensor relative to the center of convergence using all convergence points in a box are
calculated to obtain the eigenvalues and eigenvectors of the inertia tensor. (d) The locations of convergence
maxima are located, and (e) a line-joining algorithm joins the maxima into coherent lines. (f) Objectively identified
convergence lines are overlaid on satellite imagery to show the association with precipitation.
3172 JOURNAL OF CL IMATE VOLUME 30

resolution of the data utilized in the current study. This
smaller search box allows a higher degree of confidence in
associating rainfall with convergence lines owing to the
closer relationship between local-scale convergence and
rainfall (Birch et al. 2014a). In addition, fronts are usually
tilted, and their rainfall can often extend well ahead of or
behind the actual front (Catto et al. 2012). Overall, the 28search box size allows only the same grid point or adjacent
grid points of rainfall to be allocated to a convergence line
when it is in close proximity; similar to Catto et al. (2012),
the size is a compromise between missing convergence
lines for small search areas or counting convergence lines
that are too far removed from the rain grid point with too
large a search area. Sensitivity tests found that while the
choice of search box did not change the spatial pattern of
associated rainfall, it did alter the magnitude and is pre-
sented in the results. For example, over the region equa-
torward of 608 the proportion of rainfall allocated to
convergence lines using 18, 28, and 38 search boxes are
55%, 71%, and 96%, respectively.
3. Results
a. Frequency of convergence lines
The annual-mean frequency and seasonal variability of
instantaneous convergence lines greater than 300km in
length identified in the ERA-Interim dataset over the
period 1979–2013 are shown in Fig. 4. The overall pattern
and seasonality over the tropics are consistent with
previous studies (Waliser and Gautier 1993; Berry and
Reeder 2014). Nonetheless, compared to Berry and
Reeder (2014), the increased temporal resolution
and fewer and weaker constraints (e.g., a shorter line
length threshold) result in more lines being detected. The
annual-mean frequency (Fig. 4a), expressed as the per-
centage of time a convergence line is present in each
0.758 3 0.758 grid box, shows that the largest values are of
the order of 20% and occur within the ITCZs in all three
ocean basins. Because of the higher resolution of the
ERA-Interim dataset in comparison to earlier studies, a
double ITCZ is also more evident in all basins with a
frequency around 10%–15% (Zhang 2001; Liu and Xie
2002; Meenu et al. 2007; Zhang et al. 2007). The lowest
values, less than 5%, are found on the eastern flank of the
subtropical highs, whereas in themidlatitudes a thin band
of lower frequency occurs at approximately 408 in both
hemispheres, generally on the southern flank of where
dry air descends in the atmospheric overturning circula-
tion. Over land, small regions with high frequency co-
incide with the major monsoonal systems of India,
northern Australia, Africa, and South America.
The mean seasonal evolution of convergence lines is
shown by the 3-month mean anomalies from the annual
FIG. 3. Schematic showing the method employed to detect locations of divergenceminima in
the instantaneous field by (a)–(c) calculating the components of inertia tensor relative to
a convergence centroid, using all convergence points in the box, to obtain the eigenvalues and
eigenvectors of inertia tensor. The larger eigenvalue and corresponding eigenvector describes
the orientation of the major axis of convergence within the box (i.e., the along line direction),
while the smaller pair describes the perpendicular (i.e., across-line direction). (d),(e) A bilinear
interpolated polynomial is fit to the convergence field along the across line (i.e., minor
eigenvector) direction to determine and locate a divergence minimum, if one exists.
1 MAY 2017 WELLER ET AL . 3173

FIG. 4. (a) Annual-mean and (b)–(e) seasonal-mean frequency of objectively identified
convergence lines (.300 km in length; percentage per month with line in each 0.758 3 0.758box). Seasonal frequency is shown as the difference from annual (shading) and absolute mean
frequency (contours). Regions where the surface topography is higher than 1 km have been
shaded gray.
3174 JOURNAL OF CL IMATE VOLUME 30
mean from December–February (DJF) to September–
November (SON) in Figs. 4b–e. Overall, these maps
highlight a seasonal cycle in which the oceanic conver-
gence lines migrate meridionally and land-based con-
vergence lines form predominantly during summer.
Convergence lines in the ITCZ south of the equator in
the eastern Pacific are most frequent in boreal spring
[March–May (MAM)], occurring around 20% of the
time. They are less frequent in all other seasons, the least
frequent being around 5% in boreal fall (SON). In-
deed, the weak double ITCZ patterns on the annual-
mean frequency across all basins appear to be related
to a signature of their seasonal migrations and
intensifications.
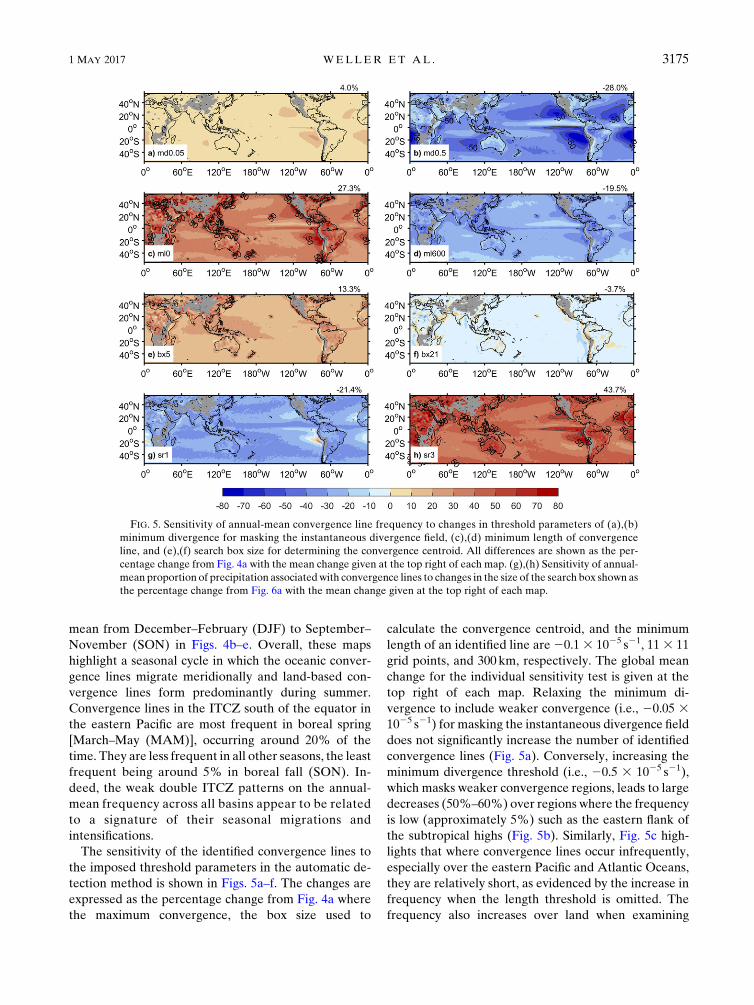
The sensitivity of the identified convergence lines to
the imposed threshold parameters in the automatic de-
tection method is shown in Figs. 5a–f. The changes are
expressed as the percentage change from Fig. 4a where
the maximum convergence, the box size used to
calculate the convergence centroid, and the minimum
length of an identified line are20.13 1025 s21, 113 11
grid points, and 300 km, respectively. The global mean
change for the individual sensitivity test is given at the
top right of each map. Relaxing the minimum di-
vergence to include weaker convergence (i.e., 20.05 31025 s21) for masking the instantaneous divergence field
does not significantly increase the number of identified
convergence lines (Fig. 5a). Conversely, increasing the
minimum divergence threshold (i.e., 20.5 3 1025 s21),
which masks weaker convergence regions, leads to large
decreases (50%–60%) over regions where the frequency
is low (approximately 5%) such as the eastern flank of
the subtropical highs (Fig. 5b). Similarly, Fig. 5c high-
lights that where convergence lines occur infrequently,
especially over the eastern Pacific and Atlantic Oceans,
they are relatively short, as evidenced by the increase in
frequency when the length threshold is omitted. The
frequency also increases over land when examining
FIG. 5. Sensitivity of annual-mean convergence line frequency to changes in threshold parameters of (a),(b)
minimum divergence for masking the instantaneous divergence field, (c),(d) minimum length of convergence
line, and (e),(f) search box size for determining the convergence centroid. All differences are shown as the per-
centage change from Fig. 4a with the mean change given at the top right of each map. (g),(h) Sensitivity of annual-
mean proportion of precipitation associatedwith convergence lines to changes in the size of the search box shown as
the percentage change from Fig. 6a with the mean change given at the top right of each map.
1 MAY 2017 WELLER ET AL . 3175

convergence lines of any length, suggesting that topog-
raphy causes lines to become more fragmented than
over the ocean. Doubling the minimum length threshold
of convergence lines to 600 km results in a decrease of
nearly 20% globally, more so over land and the adjacent
coastal waters such as the Maritime Continent. This
decrease further highlights that shorter lines generally
occur over these regions (Fig. 5d). Last, adjusting (de-
creasing and increasing) the box size used to calculate
the convergence centroid of the unmasked divergence
field has only a small influence on the frequency of
identified convergence lines (Figs. 5e,f). A nearly spa-
tially uniform change is found in both cases of de-
creasing and increasing the size, except for slightly larger
increases of occurrence over land and the Indo-Pacific
warm pool when the box is reduced to 5 3 5 grid points
(equivalent to 3.758 latitude/longitude).
b. Association of precipitation with convergence lines
Combining precipitation data with the convergence
line locations allows the precipitation to be attributed to
these rainfall-related features. The annual-mean and
seasonal-mean global distributions of the proportion of
precipitation associated with convergence lines for the
period 1998–2013 are shown in Fig. 6. The annual map
should be interpreted as identifying regions where there
is a strong dynamical coupling between convergence
lines and precipitation (Fig. 6a). For example, in most
regions of high rainfall, such as in the ITCZ, more than
75% of rainfall is attributed to convergence lines greater
than 300 km in length. Similar maximum proportions of
precipitation are also evident in the regions of the
midlatitudes, even though here the convergence line
frequency is lower than in the tropics. Over the rest of
the oceans, the proportion is still relatively high, gen-
erally greater than about 65%. Over land, values range
between 30% and 60%, and the lowest proportions of
precipitation (less than 15%) associated with conver-
gence lines occur on the eastern flank of the subtropical
highs. The sensitivity of the proportion of precipitation
associated with convergence lines to the imposed search
box size is shown in Figs. 5g and 5h as the percentage
change from Fig. 6a. Decreasing the search box size
(from 28 to 18 latitude/longitude; Fig. 5g) used to asso-
ciated convergence lines with precipitation has less in-
fluence than an increase (from 28 to 38 latitude/
longitude; Fig. 5h). However, when using a larger search
box size, the largest increases occur in regions where the
proportion of precipitation associated with convergence
lines is relatively low, resulting in a large percentage
change. This result highlights that 28 latitude/longitudeis a suitable threshold for the datasets used as the pro-
portions do not change drastically when the search box
size is reduced, but any larger and the precipitation
seems to be unrealistically associated with convergence
lines far removed.
The mean seasonal variations from the annual-mean
precipitation associated with convergence lines shows
variations of up to 30% throughout the year (Figs. 6b–e).
These large variations highlight the regions where the
association increases (red) or decreases (blue) during
the seasons and where it mainly varies in proportion to
the frequency of convergence lines. The largest seasonal
variations occur over the tropical eastern Pacific and
Atlantic Oceans; here generally more than 75% of
precipitation is associated with convergence lines in
MAM, but this reduces to about 40% in SON. The
proportion of precipitation associated with convergence
lines in the SPCZ varies only slightly throughout the
year, with values being 5%–10% larger in JJA and SON
and 5%–10% smaller in the other two seasons. Increases
on the eastern flanks of the subtropical highs occur
during wintertime and are accompanied by decreases
over the adjacent land area, such as over northernAfrica
and North America in DJF (Fig. 6b), and over Australia
and South America in JJA (Fig. 6d).
The results above only consider the proportion of
precipitation associated with well-defined convergence
lines (greater than 300km in length). Figure 7 shows the
annual-mean global distributions of the residual pro-
portion of precipitation associated with shorter, more
fragmented lines (less than 300 km in length; Fig. 7b),
and the proportion of precipitation that is not associated
with any convergence line (Fig. 7c). For comparison, the
proportion of precipitation associated with convergence
lines greater than 300km in length is repeated in Fig. 7a,
and the mean values over the region equatorward of 608are given at the top right of each map. On average, only
about 13% of precipitation is associated with shorter
convergence lines, with larger values over land (20%–
35%) than over the ocean (5%–15%). This difference
may be due to the diurnal cycle having a greater influ-
ence over land and adjacent ocean water than in open
ocean regions, reducing the time for local-scale con-
vergence to organize into larger features and an increase
in noise (Hendon andWoodberry 1993; Yang and Slingo
2001). The residual proportion of precipitation not as-
sociated with any convergence lines averaged over the
map is under 30% (Fig. 7c) and occurs primarily in re-
gions with both low precipitation (indicated by contours
enclosing regions less than 1mmday21) and low fre-
quency of convergence lines. In these regions, the pro-
portion of precipitation not associated with any
convergence lines is up to 60%, whereas lower values
between 15%–20% occur elsewhere, the lowest being in
the ITCZs. It is noted that, although the proportion of
3176 JOURNAL OF CL IMATE VOLUME 30

FIG. 6. (a) Annual-mean and (b)–(e) seasonal-mean proportion of precipitation (percentage)
associated with convergence lines (shading) and the frequency of lines (contours, as in Fig. 4,
but for 1998–2013). Seasonal proportion of precipitation is shown as a difference from annual.
Regions where the surface topography is higher than 1 km have been shaded gray.
1 MAY 2017 WELLER ET AL . 3177

precipitation associated with long coherent and shorter
convergence lines changes with changing search box
size, the same conclusions can be drawn. For example,
the mean proportion of precipitation associated with
long coherent convergence lines (i.e., 57% using a
search box size of 28 latitude/longitude) ranges from
43% to 83% for search box sizes of 18 and 38 latitude/longitude, respectively. The proportion of precipitation
associated with the shorter convergence lines and that
not associated with any convergence lines have ranges of
12%–13% and 4%–45%, respectively. Overall, only a
small increase results from using 28 over 18; however,using a search box size of 38 results in a much larger
increase in attributable precipitation to long coherent
convergence lines, further supporting our choice.
To highlight some of the key relationships found in
the study, the precipitation and convergence associated
with identified convergence lines has been calculated for
several locations. Figures 8a and 8b show the high
correlation between the strength of convergence and the
precipitation amounts over the western and eastern
equatorial Pacific Oceans, respectively. In addition, the
length of the identified convergence lines (indicated by
the color of the data points) also has a strong relation-
ship with both fields. In particular, stronger convergence
and heavier precipitation is generally associated with
more well-defined, long convergence lines over these
tropical ocean regions. The sensitivity of this relation-
ship (indicated by the slope ratio) is twice as strong in
the western equatorial Pacific Ocean than in the east,
primarily due to the greater precipitation there, which
is a consequence of the higher SSTs and increased
moisture availability. On the other hand, although sim-
ilar relationships exist for regions over land, such as
equatorial Africa (Fig. 8c) and the Maritime Continent
(Fig. 8d), the range of values is smaller than over the
ocean regions, and the convergence lines are generally
much shorter or fragmented. Birch et al. (2014b) found
FIG. 7. Annual-mean proportion of precipitation (percentage) associated with convergence
lines (a) greater than and (b) less than 300 km. (c) The residual proportion of precipitation not
associated with any convergence lines (shaded) and areas where the daily rainfall is less than
1mmday21 (dashed contours). The global mean proportion is given at the top-right of each
map and regions where the surface topography is higher than 1 km have been shaded gray.
3178 JOURNAL OF CL IMATE VOLUME 30

that although lines derived from the ERA-Interim re-
analysis are consistent with those derived from satellite
imagery, they were somewhat under resolved and
weaker. Therefore the sensitivity of the relationship in
Fig. 8 may change with different datasets, especially for
small-scale features.
4. Discussion and conclusions
In the present study a new automated, objective
method is derived to identify low-level convergence
lines in gridded datasets of the horizontal wind field. By
combining it with satellite-derived global gridded pre-
cipitation data we quantify the proportion of global
precipitation associated with such coherent lines. The
overall spatial pattern and seasonality of convergence
lines over the tropics remain similar to those in previous
studies (Berry and Reeder 2014), highlighting the re-
producibility of the objective method given some mod-
ifications. Specifically, by utilizing reanalysis output with
increased temporal resolution, and imposing fewer (e.g.,
omitting lower troposphere temperature thresholds to
isolate tropical features) and weaker (e.g., a shorter
length threshold) constraints, the present study also al-
lows for an examination of the instantaneous relation-
ship between precipitation and convergence in the lower
troposphere, which varies substantially on regional and
even subdaily scales (Bain et al. 2010).
Over the tropical oceans, a large percentage of pre-
cipitation is associated with convergence lines, with
stronger convergence and heavier precipitation gener-
ally associated with more well-defined, longer conver-
gence lines. Over land and the adjacent ocean waters,
less precipitation is associated with convergence lines.
FIG. 8. Mean convergence (s21 scaled by 105) of the objectively identified convergence lines and the associated
precipitation over the (a) western and (b) eastern equatorial Pacific, (c) equatorial Africa, and (d) Maritime
Continent. The color of each data point depicts the length of the convergence line (km).
1 MAY 2017 WELLER ET AL . 3179

This change in the proportion appears to be a result of
more shorter or fragmented convergence lines over land
and the adjacent waters, where an increase in noise from
the diurnal cycle and topography may act to reduce the
time and space for local-scale convergence to organize
into larger well-organized features. The change in the
proportion may also be due to systematic biases in the
precipitation dataset used. For example, although
CMORPH captures the spatial precipitation distribu-
tion patterns well, some biases include overestimation in
the tropic to subtropics, underestimation in the middle
to high latitudes, and overestimation (underestimation)
of weak (strong) intensities (e.g., Joyce and Xie 2011).
These influences need to be taken into consideration
when interpreting the results of the present study.
Nonetheless, the proportion of precipitation not asso-
ciated with any convergence line primarily occurs where
both the amount of precipitation and frequency of
convergence lines are low.
The present study is useful for understanding the re-
gional relationships between organized low-level con-
vergence and rainfall over both ocean and land.
Nonetheless, some results appear counterintuitive, es-
pecially over some land regions. For example, pre-
cipitation over equatorial Africa is generally governed
by the seasonal movement of the ITCZ (Nicholson 2000;
Preethi et al. 2015). For this reason, the rainfall in the
equatorial region is greatest during the two transition
seasons (i.e., MAM and SON), and greatest in each
tropical margin during the summer of the respective
hemispheres (i.e., JJA in the north and DJF in the
south). However, the seasonal cycle of all convergence
lines has aminimum over north equatorial Africa during
JJA and a maximum in DJF (black line in Fig. 9a).
Similarly, the frequency of convergence lines associated
with precipitation is also lower in JJA (blue line in
Fig. 9a). This result is physically sensible as longer co-
herent convergence lines may be more organized in the
ITCZ, and are generally associated with increased pre-
cipitation intensity (Fig. 8). During DJF, there are more
convergence lines (Fig. 9a), although they are pre-
sumably smaller. Hence, an increase in the number of
shorter convergence lines may be associated with de-
creased precipitation at this time of year. This conclu-
sion appears to also apply for India, which has the
opposite seasonal cycle. Over India the number of
convergence lines is greatest during JJA (black line in
Fig. 9b), despite some negative anomalies in the south-
ern central region (Fig. 4d). This spatial pattern in the
convergence line frequency anomalies agrees well with
the areas of greatest precipitation during this time of
year (e.g., the southwest coast and northeastern interior
of India; Goswami et al. 2006). However, although the
frequency of all convergence lines increases in JJA over
India, once again there are fewer lines associated with
precipitation (blue line in Fig. 9b). This result further
supports the idea that more organized (and longer)
convergence lines are associated with greater rainfall.
One advantage of using instantaneous fields to con-
struct the climatology of the relationship between rain-
fall and organized convergence is that it allows the
diurnal cycle to be investigated, among other things.
Mesoscale convergence lines produced by the diurnal
cycle of continental heating and cooling are thought to
play an important role in the initiation and organization
of clouds and convection in the tropics (Hendon and
Woodberry 1993; Yang and Slingo 2001). Figure 10
shows an example of the diurnal variation of con-
vergence lines and precipitation over the Maritime
Continent and Australian region. At 0000 UTC (ap-
proximately midmorning) the convergence lines lie
almost wholly offshore of the islands such as Sumatra,
Java, Borneo, and New Guinea, coinciding with the
heaviest precipitation (Figs. 10a,b). These offshore
convergence lines are presumably connected land
breezes and gravity waves. By 1200 UTC
FIG. 9. Mean seasonal cycle of the frequency (lines) and 10%–90% range across years (shading) of all (black)
objectively identified convergence lines, and only those associated with precipitation (blue) over (a) northern
equatorial Africa (08–108N, 108–358E) and (b) India (58–258N, 708–858E).
3180 JOURNAL OF CL IMATE VOLUME 30

(approximately late evening) most convergence lines
and the heaviest precipitation lie over the islands and
northern Australia (Figs. 10d,e). These onshore con-
vergence lines are presumably associated with the
thermally driven upslope circulation and sea breezes.
Over the open ocean regions there is little change in
the frequency over the day. The proportion of pre-
cipitation associated with convergence lines captures
this diurnal variation (Figs. 10c,f), highlighting that
the location of the local-scale convergence is a sig-
nificant determinant of the local-scale precipitation.
Under greenhouse warming, regional dynamical pre-
cipitation changes are projected to be in spatial contrast
to much of that associated with thermodynamic in-
creases in moisture (Bony et al. 2013; Chadwick et al.
2013; Widlansky et al. 2013; Wills et al. 2016). Therefore
it is of great interest to better understand the underlying
dynamical processes responsible for initiation of
convection and the subsequent development of pre-
cipitation. It also an important issue for the evaluation of
global climate models and their projections of pre-
cipitation changes. There is some consistency between
the models on the increase in global mean precipitation
per degree of global warming due to counteracting
changes in net tropospheric radiative cooling and latent
heating (Stephens 2005; Lambert and Webb 2008), al-
though the level of agreement is weaker at the regional
scale (Rowell 2012; Chadwick et al. 2013). This weak-
ened level of agreement may be a consequence of how
well the models simulate the dynamical precipitation
change, among other model errors, owing to their poor
simulation of convection. For example, although aver-
age global composites of precipitation produced by
models can be in agreement with observations, this
agreement can result from opposing errors, such as
producing precipitation that is too light too often
FIG. 10. Diurnal cycle shown at (left) 0000 and (right) 1200 UTC of the (a),(d) annual-mean frequency of ob-
jectively identified convergence lines (% month with line in each 0.758 3 0.758 box), (b),(e) annual-mean
CMORPHprecipitation [mm (6 h)21], and (c),(f) annual-mean proportion of precipitation (percentage) associated
with convergence lines. Regions where the surface topography is higher than 1 km have been shaded gray.
1 MAY 2017 WELLER ET AL . 3181

(Stephens et al. 2010). However, such models may be
able to represent well the aspects of the circulation, such
as low-level convergence, important for large pro-
portions of the precipitation, providing an insightful
measure of the model performance and better un-
derstanding of how regional precipitation may change.
The method of the present study can be used to attempt
to answer such issues by applying it to global climate
models, which is currently underway. The initial results
show that the frequency and proportion of the pre-
cipitation associated with convergence lines in climate
models is less than reported here. This result is pre-
sumably due to lower resolution in the climate models,
even though the general patterns and many large-
regional features are well represented. This is the case
when the analysis is repeated with the ERA-Interim
precipitation in place of CMORH. In this case, the
proportion of precipitation associated with convergence
lines is reduced by about 10%, as there are fewer small-
scale and high-intensity precipitation features.
Acknowledgments. The ERA-Interim data used were
obtained via the ECMWF MARS website. The
CMORPH data used were obtained via the NOAA
Climate Prediction Center website. This study was
supported by theAustralianResearch Council Centre of
Excellence for Climate System Science.
REFERENCES
Bain, C. L., G.Magnusdottir, P. Smyth, andH. Stern, 2010: Diurnal
cycle of the intertropical convergence zone in the east Pacific.
J. Geophys. Res., 115, D23116, doi:10.1029/2010JD014835.
——, J. De Paz, J. Kramer, G. Magnusdottir, P. Smyth, H. Stern,
and C.-C. Wang, 2011: Detecting the ITCZ in instantaneous
satellite data using spatiotemporal statistical modelling: ITCZ
climatology in the east Pacific. J. Climate, 24, 216–230,
doi:10.1175/2010JCLI3716.1.
Berry, G., and M. J. Reeder, 2014: Objective identification of the
intertropical convergence zone: Climatology and trends from
the ERA-Interim. J. Climate, 27, 1894–1909, doi:10.1175/
JCLI-D-13-00339.1.
——, C. Jakob, and M. J. Reeder, 2011a: Recent global trends in
atmospheric fronts. Geophys. Res. Lett., 38, L21812,
doi:10.1029/2011GL049481.
——, M. J. Reeder, and C. Jakob, 2011b: A global climatology of
atmospheric fronts. Geophys. Res. Lett., 38, L04809,
doi:10.1029/2010GL046451.
Birch, C. E., J. H. Marsham, D. J. Parker, and C. M. Taylor, 2014a:
The scale dependence and structure of convergence fields
preceding the initiation of deep convection. Geophys. Res.
Lett., 41, 4769–4776, doi:10.1002/2014GL060493.
——, M. J. Reeder, and G. J. Berry, 2014b: Wave-cloud lines over
the Arabian Sea. J. Geophys. Res. Atmos., 119, 4447–4457,
doi:10.1002/2013JD021347.
——, M. Roberts, L. Garcia-Carreras, D. Ackerley, M. J. Reeder,
A. Lock, and R. Schiemann, 2015: Sea breeze dynamics and
convection initiation: The influence of convective parame-
terization in weather and climate model biases. J. Climate, 28,
8093–8108, doi:10.1175/JCLI-D-14-00850.1.
Bony, S., G. Bellon, D. Klocke, S. Sherwood, S. Fermepin, and
S. Denvil, 2013: Robust direct effect of carbon dioxide on
tropical circulation and regional precipitation. Nat. Geosci., 6,
447–451, doi:10.1038/ngeo1799.
——, and Coauthors, 2015: Clouds, circulation and climate sensi-
tivity. Nat. Geosci., 8, 261–268, doi:10.1038/ngeo2398.Catto, J. L., C. Jakob, G. Berry, and N. Nicholls, 2012: Relating
global precipitation to atmospheric fronts. Geophys. Res.
Lett., 39, L10805, doi:10.1029/2012GL051736.
——,——, and N. Nicholls, 2013: A global evaluation of fronts and
precipitation in the ACCESS model. Aust. Meteor. Oceanogr.
J., 63, 191–203.
——, ——, and ——, 2015: Can the CMIP5 models represent
winter frontal precipitation? Geophys. Res. Lett., 42, 8596–
8604, doi:10.1002/2015GL066015.
Chadwick, R., I. Boutle, and G. Martin, 2013: Spatial patterns of
precipitation change in CMIP5: Why the rich do not get richer
in the tropics. J. Climate, 26, 3803–3822, doi:10.1175/
JCLI-D-12-00543.1.
Collins, M., and Coauthors, 2013: Long-term climate change:
Projections, commitments and irreversibility. Climate Change
2013: The Physical Science Basis, T. F. Stocker et al., Eds.,
Cambridge University Press, 1029–1136.
Dee, D. P., and Coauthors, 2011: The ERA-Interim reanalysis: Con-
figuration and performance of the data assimilation system.
Quart. J. Roy. Meteor. Soc., 137, 553–597, doi:10.1002/qj.828.
Flato, G., and Coauthors, 2013: Evaluation of climate models.
Climate Change 2013: The Physical Science Basis, T. F. Stocker
et al., Eds., Cambridge University Press, 741–866.
Goswami, B. N., V. Venugopal, D. Sengupta, M. S.
Madhusoodanan, and P. K. Xavier, 2006: Increasing trend of
extreme rain events over India in a warming environment.
Science, 314, 1442–1445, doi:10.1126/science.1132027.
Hastenrath, S., 1995: Climate Dynamics of the Tropics. Kluwer
Academic, 488 pp.
Hendon, H. H., and K. Woodberry, 1993: The diurnal cycle of
tropical convection. J. Geophys. Res., 98, 16 623–16 637,
doi:10.1029/93JD00525.
IPCC, 2007: Climate Change 2007: The Physical Science Basis.
Cambridge University Press, 996 pp.
Jakob, C., 2010: Accelerating progress in global atmospheric model
development through improved parameterizations: Chal-
lenges, opportunities, and strategies.Bull. Amer. Meteor. Soc.,
91, 869–875, doi:10.1175/2009BAMS2898.1.
——, 2014: Going back to basics. Nat. Climate Change, 4, 1042–
1045, doi:10.1038/nclimate2445.
Joyce, R. J., and P. Xie, 2011: Kalman filter-based CMORPH.
J. Hydrometeor., 12, 1547–1563, doi:10.1175/JHM-D-11-022.1.
——, J. E. Janowiak, P. A. Arkin, and P. Xie, 2004: CMORPH: A
method that produces global precipitation estimates from
passive microwave and infrared data at high spatial and tem-
poral resolution. J. Hydrometeor., 5, 487–503, doi:10.1175/
1525-7541(2004)005,0487:CAMTPG.2.0.CO;2.
Lambert, F. H., andM. J. Webb, 2008: Dependency of global mean
precipitation on surface temperature. Geophys. Res. Lett., 35,
L16706, doi:10.1029/2008GL034838.
Lindzen, R. S., and S. Nigam, 1987: On the role of sea surface
temperature gradients in forcing low-level winds and conver-
gence in the tropics. J. Atmos. Sci., 44, 2418–2436, doi:10.1175/
1520-0469(1987)044,2418:OTROSS.2.0.CO;2.
3182 JOURNAL OF CL IMATE VOLUME 30

Liu, W. T., and X. Xie, 2002: Double intertropical convergence
zones—A new look using scatterometer. Geophys. Res. Lett.,
29, 2072, doi:10.1029/2002GL015431.
Meenu, S., K. Rajeev, K. Parameswaran, and C. Suresh Raju, 2007:
Characteristics of the double intertropical convergence zone
over the tropical IndianOcean. J. Geophys. Res., 112, D11106,
doi:10.1029/2006JD007950.
Nicholson, S. E., 2000: The nature of rainfall variability over Africa
on time scales of decades to millennia.Global Planet. Change,
26, 137–158, doi:10.1016/S0921-8181(00)00040-0.
Preethi, B., T. P. Sabin, J. A. Adedoyin, and K. Ashok, 2015: Im-
pacts of the ENSO Modoki and other tropical Indo-Pacific
climate-drivers on African rainfall. Sci. Rep., 5, 16653,
doi:10.1038/srep16653.
Reeder, M. J., and R. K. Smith, 1998: Mesoscale meteorology.
Meteorology of the Southern Hemisphere, D. Vincent and
D. J. Karoly, Eds., Amer. Meteor. Soc., 201–241.
——, ——, D. J. Low, J. Taylor, S. J. Arnup, L. C. Muir, and
G. Thomsen, 2013: Diurnally forced convergence lines in the
Australian tropics.Quart. J. Roy. Meteor. Soc., 139, 1283–1297,
doi:10.1002/qj.2021.
Rowell, D., 2012: Sources of uncertainty in future changes in local
precipitation. Climate Dyn., 39, 1929–1950, doi:10.1007/
s00382-011-1210-2.
Rybka, H., and H. Tost, 2014: Uncertainties in future cli-
mate predictions due to convection parameterisations.
Atmos. Chem. Phys., 14, 5561–5576, doi:10.5194/
acp-14-5561-2014.
Stephens, G. L., 2005: Cloud feedbacks in the climate system:
A critical review. J. Climate, 18, 237–273, doi:10.1175/
JCLI-3243.1.
——, and Coauthors, 2010: Dreary state of precipitation in global
models. J. Geophys. Res., 115, D24211, doi:10.1029/2010JD014532.
Stevens, B., and S. Bony, 2013: What are climate models missing?
Science, 340, 1053–1054, doi:10.1126/science.1237554.Waliser, D. E., and C. Gautier, 1993: A satellite-derived climatol-
ogy of the ITCZ. J. Climate, 6, 2162–2174, doi:10.1175/
1520-0442(1993)006,2162:ASDCOT.2.0.CO;2.
Widlansky, M. J., P. J. Webster, and C. D. Hoyos, 2011: On
the location and orientation of the South Pacific convergence
zone. Climate Dyn., 36, 561–578, doi:10.1007/s00382-010-0871-6.
——,A. Timmermann, K. Stein, S. McGregor, N. Schneider, M. H.
England, M. Lengaigne, and W. Cai, 2013: Changes in South
Pacific rainfall bands in a warming climate. Nat. Climate
Change, 3, 417–423, doi:10.1038/nclimate1726.
Wills, R. C., M. P. Byrne, and T. Schneider, 2016: Thermodynamic
and dynamic controls on changes in the zonally anomalous
hydrological cycle. Geophys. Res. Lett., 43, 4640–4649,
doi:10.1002/2016GL068418.
Wodzicki, K. R., and A. D. Rapp, 2016: Long-term character-
ization of the Pacific ITCZ using TRMM, GPCP, and ERA-
Interim. J. Geophys. Res. Atmos., 121, 3153–3170, doi:10.1002/
2015JD024458.
Yang,G.Y., and J. Slingo, 2001: The diurnal cycle in the tropics.Mon.
Wea. Rev., 129, 784–801, doi:10.1175/1520-0493(2001)129,0784:
TDCITT.2.0.CO;2.
Zhang, C., 2001: Double ITCZs. J. Geophys. Res., 106, 11 785–11 792, doi:10.1029/2001JD900046.
Zhang, X., W. Lin, andM. Zhang, 2007: Toward understanding the
double intertropical convergence zone pathology in coupled
ocean–atmosphere general circulation models. J. Geophys.
Res., 112, D12102, doi:10.1029/2006JD007878.
1 MAY 2017 WELLER ET AL . 3183