Embed Size (px)
Citation preview

Research ArticlePrecipitable Water Vapor Retrieval and Analysis by MultipleData Sources: Ground-Based GNSS, Radio Occultation,Radiosonde, Microwave Satellite, and NWP Reanalysis Data
Qin Zhang, Junhua Ye , Shuangcheng Zhang, and Fei Han
College of Geology Engineering and Geomantic, Chang’an University, Xi’an, Shanxi 710054, China
Correspondence should be addressed to Junhua Ye; [email protected]
Received 4 October 2018; Accepted 18 November 2018; Published 24 December 2018
Guest Editor: Sang-Hoon Hong
Copyright © 2018 Qin Zhang et al. This is an open access article distributed under the Creative Commons Attribution License,which permits unrestricted use, distribution, and reproduction in any medium, provided the original work is properly cited.
Precipitable water vapor (PWV) content detection is vital to heavy rain prediction; up to now, lots of different measuring methodsand devices are developed to observe PWV. In general, these methods can be divided into two categories, ground-based or space-based. In this study, we analyze the advantages and disadvantages of these technologies, compare retrieved atmosphere parametersby different RO (radio occultation) observations, like FORMOSAT-3/COSMIC (Formosa Satellite-3 and Constellation ObservingSystem for Meteorology, Ionosphere, and Climate) and FY3C (China Feng Yun 3C), and assess retrieved PWV precision with aradiosonde. Besides, we interpolate PWV from NWP (numerical weather prediction) reanalysis data for more comparison andanalysis with RO. Specifically, ground-based GNSS is of high precision and continuous availability to monitor PWVdistribution; in our paper, we show cases to validate and compare GNSS retrieving PWV with a radiosonde. Except GNSS PWV,we give two different radio occultation sounding results, COSMIC and FY3C, to validate the precision to monitor PWV fromspace in a global area. FY3C results containing Beidou (China Beidou Global Satellite Navigation System) radio occultationevents need to be emphasized. So, in our study, we get the retrieved atmospheric profiles from GPS and Beidou radiooccultation observations and derive atmosphere PWV by a variational retrieval method based on these data over a global area.Besides, other space-based methods, such as microwave satellite, are also useful in detecting PWV distribution situations in aglobal area from space; in this study, we present a case of retrieved PWV using microwave satellite observation. NWPreanalysis data ECMWF (European Centre for Medium-Range Weather Forecasts) ERA-Interim and the new-generationreanalysis data ERA5 provide global grid atmosphere parameters, like surface temperature, different-level pressures, andprecipitable water. We show cases of retrieved PWV and validate the precision with radiosonde results and compare newreanalysis dataset ERA5 with ERA-Interim, finding that ERA5 can get higher precision-retrieved atmosphere parameters andPWV. In the end, from our comparison, we find that the retrieved PWV from RO (FY3C and COSMIC) and ECMWFreanalysis data (ERA-Interim and ERA5) have a high positive correlation and that almost all R2 values exceed 0.9, compareretrieved PWV with a radiosonde, and find that whether it is RO and ECMWF reanalysis data, ground-based GNSS, ormicrowave satellite, they all show small biases.
1. Introduction
Precipitable water vapor content change plays an importantrole in atmospheric water transport, energy conversion, andclimate change, so it is meaningful to monitor and under-stand its change situation and mechanism [1, 2]. Nowadays,lots of methods and platforms can be used to detect atmo-spheric PWV; in general, there are two categories: ground-based and space-based devices or sensors. Ground-based
methods, like radiosonde, sun photometry, and microwaveradiometry, and space-based observation methods, such asCOSMIC radio occultation, moderate-resolution imagingspectroradiometry (MODIS), SCIAMACHY, and atmo-spheric infrared sounder (AIRS), have the capability to detectPWV, for example, MODIS which provides daytime andnight PWV products over land and ocean areas [3–9]. Tradi-tional atmosphere sensing techniques such as radiosondeand microwave radiometer have shortcomings in reflecting
HindawiJournal of SensorsVolume 2018, Article ID 3428303, 13 pageshttps://doi.org/10.1155/2018/3428303

the continuous transformations of atmospheric PWV due totheir low, inhomogeneous spatial distribution and insuffi-cient time availability. But the radiosonde has been thoughtto be a useful reference tool for atmospheric sounding [10].In contrast, the ground-based GNSS technique has severaladvantages: it has been recognized as an efficient approachto estimate PWV change situations in nearly real time, andit can keep tracking and sensing continuously [11–16].However, GNSS stations, for example, IGS stations, still havelow spatial resolution, especially in the ocean area. Someother ground-based PWV detection technologies, like sunphotometry and microwave radiometry, are used some-where, but actually, due to the cost and observation condi-tion limitation reasons, these devices cannot be usedextensively, and it is impossible to get a continuous and widerange of observations. In these years, space-based methods,like radio occultation and microwave satellite-borne passivemicrowave detectors, provide availability to measure meteo-rology parameters and PWV distribution from space [3, 17,18]; they have lots of advantages compared to ground obser-vation methods. Like RO, it has high vertical resolution andRO measurements are not significantly affected by cloudsand precipitation [19–22]; besides, its observation coverageis global, not a matter of land or ocean area, so radio occul-tation is applied to obtain PWV in a global area under all-weather conditions [23–25]. Precision statistical relatedstudies reveal over ocean-dominated geographical areas;PWV retrieved from RO and ground-based GNSS exhibitsa global mean difference of around 1mm, a root-mean-square deviation of about 5mm, and a correlation above0.9 [26]. ECMWF and National Centers for EnvironmentalPrediction (NCEP) have developed some numerical weatherprediction models based on historical multiple data sourcesand provided a global reanalysis dataset, such as the mostused ERA-Interim. ERA5 is a new-generation ECMWF-retrieved reanalysis product; it has higher temporal and spa-tial resolutions [27]. ECMWF analysis represents optimalhumidity estimates from high-quality observations amongmultisatellite sounders, imagers, and conventional in situobservations through a data assimilation system [28–30];researchers have validated global ERA-Interim integratedprecipitable water using ground-based GNSS observationsand related techniques, which showed a high correlation[8]. Except radio occultation, microwave satellite infraredobservations can also be used to provide PWV distributionand change situations.
Up to now, the radiosonde and radiometer are mostlythought to be efficient atmospheric observation techniques.In this study, we present some comparison and analysis workbetween these observations and reference results obtainedfrom the radiosonde; besides, we derive PWV from the IGSGNSS station’s observations and present PWV of ATVOSmeasurements; what is more, we retrieve PWV from ERA-Interim and ERA5 reanalysis datasets and perform a globalcomparison of PWV from the collocated COSMIC andFY3C radio occultation profiles. We compare these resultswith the radiosonde to check their applicability and preci-sion. In this paper, background information and methodol-ogy are described in Section 2. Analysis, comparison, and
discussion of PWV results from these data sources ground-based GNSS, COSMIC and FY3C RO, microwave satellite,ECMWF ERA-Interim, ERA5 and radiosonde are presentedin Section 3. Conclusions are presented in Section 4.
2. Data Source and Methodology
2.1. Ground-Based GNSS. GNSS is widely used in positioningor navigation areas; in recent years, several regional or globalsatellite navigation systems have been built. In relation tothis, lots of ground GNSS observation networks are runningfor multiple scientific tests, such as EUREF Permanent GNSSNetwork (EPN), US Constellation Observation System forMeteorology, Ionosphere, and Climate (SuomiNet), andHong Kong Satellite Positioning Reference Station Network(SatRef). These GNSS networks provide sufficient and con-tinuous observations for space monitoring. We all knowthat raw GNSS observations contain different types oferrors due to signal transmission from satellite to receiver,so researchers try to use GNSS observations and relateddata processing algorithms to get troposphere delay, thencombine meteorology parameters like pressure and tem-perature to get a PWV distribution situation [31]. The tro-posphere delay effect on the GNSS signal can be dividedto a hydrostatic part and a wet part by
ZTD = ZHD + ZWD, 1
where ZTD is the zenith total delay, ZHD is the zenithhydrostatic delay, and ZWD denotes the zenith wet delay.Usually, ZHD can be calculated with high accuracy basedon the Saastamoinen model, which can be expressed as
ZHD =0 0022768P
1 − 0 00266 cos 2φ − 0 00028H, 2
where P,∅, and H represent the station total pressure andstation height, respectively. PWV is related to ZWD via aconversion factor by
PWV = π ∗ ZWD, 3
π =106
ρwRv K3/Tm + K ,2, 4
where π is the conversion factor, ρw is the density con-stant of liquid water (103kg/m3), Rv is the gas constantfor PWV (461 J · kg−1 · K−1), K2′ and K3 are the atmo-spheric refractivity constants, where K2′ = 16 48K · hPa−1
and K3 = 3 776 ± 0 014 ∗ 105K2 · hPa−1, respectively, andTm is the weighted mean temperature of the troposphere.
Tm can be expressed as
Tm =e/T dz
e/T2 dz, 5
where e is the precipitable water pressure, T is the absolutetemperature, and dz is the integral path. Generally, it can
2 Journal of Sensors

be calculated by empirical equation from the Bevis formulausing the ground surface temperature Ts, as follows:
Tm = a + bTs 6
2.2. Space-Based GNSS Radio Occultation. The GNSS radiooccultation technique provides wealthy data for monitoringthe global atmosphere. RO measures the time delay in theocculted signal using the GNSS receiver on board a lowEarth orbiting (LEO) satellite, which can be transformed toatmospheric bending angle and refractivity; then, the verti-cal profiles of atmospheric pressure, temperature, andPWV are obtained. The GNSS radio occultation soundingtechnique provides the other possibility to monitor airPWV distribution from space. Up to now, there are severalradio occultation satellite constellations, such as CHAlleng-ing Minisatellite Payload (CHAMP), Gravity Recovery andClimate Experiment (GRACE), COSMIC, and FY3C. In thispaper, we use COSMIC and FY3C radio occultation obser-vations to retrieve PWV, so here we introduce more aboutCOSMIC and FY3C constellations; the COSMIC radiooccultation mission had been successfully launched on April14, 2006. Receivers were installed on board the six smallFORMOSAT-3/COSMIC satellites to capture the phaseand amplitude of radio waves at two GPS frequencies.Termed as the FORMOSAT-3/COSMIC mission [32], thenew constellation’s primary science goal is to obtain the nearreal-time vertical profiles of temperature, pressure, refractiv-ity, and PWV in the neutral atmosphere and electron den-sity in the ionosphere with global coverage at differentaltitudes [3, 33]. The measurements during five years of mis-sion existence will provide about 2500 soundings per day,thus generating an extensive body of information to supportoperational global weather prediction, climate change mon-itoring, ionospheric phenomena, space weather research,and estimations of connections of meteorological and iono-spheric processes with solar activity and human impact. TheFY3C satellite was launched at 03:07 UTC on September 23,2013, from the Taiyuan Satellite Base, Shanxi province,China. The Global Navigation Satellite System OccultationSounder (GNOS) is installed in Feng-Yun 3 (FY3) satellites.The FY3C/GNOS is capable of tracking the occultation sig-nal of the Beidou from space for the first time.
Assuming that the effects of ionization have beencompletely corrected and that scattering due to waterdroplets is negligible, refractivity is related to temperature(T), partial pressure of dry air (Pd), and precipitable water(e) through
N = K1 ∗PdZdT
+ K2 ∗e
ZwT2 + K3 ∗
eZwT
, 7
where K1 = 77 643K/hpa, K2 = 3 75463 ∗ 105K2/hpa, andK3 = 71 2952K/hpa are empirically determined constants,and Zd and Zw are the dry air and wet air compressibilityfactors. The compressibility factors correct for nonideal gaseffects. Zd and Zw may be up to 0 05% smaller than unityin the denser parts of the atmosphere. Below 7~8 km
altitude, PWV is nonignorable; formula (7) cannot resolveatmosphere temperature and PWV simultaneously. Rawmeasurements of GNSS radio occultation can be used toretrieve atmospheric parameters such as temperature, pres-sure, and humidity. The one-dimensional variational (1D-Var) method provides an effective way to combine observa-tions and background information that are retrieved fromECMWF forecast datasets [29, 34, 35]. The method consistsof finding the most probable atmospheric state by minimiz-ing a cost function (J):
J x = h x − y0TO + F −1 h x − y0
+ x − xb B−1 x − xb ,8
where y0 donates the observation vector; h is the observa-tion operator (nonlinear); xb is the background referenceinformation; O, F, and B are the error covariance matricesof observations, observation operator, and backgroundinformation, respectively; and h x is an estimate of obser-vations that would be made with a state of atmosphere x.The minimum variance problem can be solved by Quasi-Newton iteration.
As a result, we get statistically optimal pressure, tem-perature, and humidity profiles and their respective errors.The vertical integral of the absolute vapor mass densityyields the PWV per square meter, and it can also be con-verted to the unit of millimeter or centimeter by dividingby the density of liquid water, 1 g/cc; the following is thePWV formula:
PWV =Ps
0
qgdP, 9
where N denotes the refractivity index; K1, K2, and K3 areconstants; e expresses the precipitable water pressure; Zdis the dry delay; T is the temperature; Zw is the wet delay;Pd represents dry air pressure; and PWV is the precipitablewater vapor: PWV (kg/m2or mm/cm).
The vertical integral of the humidity, both vapor andcondensed moisture, yields the column water per m2. Thetotal atmospheric PWV contained in a vertical column ofunit cross-sectional area extends from the earth’s surface tothe “top” boundary of the atmosphere. It is generallyexpressed in terms of the height to which the water sub-stance would stand if completely condensed and collectedin a vessel of the same unit cross section. Mathematically,PWV contained in a layer bounded by pressures p1 and p2is given by this formula:
PWV =Z
Z0=0qh z ρm z dz 10
qh z denotes the specific humidity in elevation z, andρm z denotes the moist air density in elevation z. The atmo-sphere is approximately divided to lots of layers from surface
3Journal of Sensors

to top, so the PWV formula can be converted to follow theequation, expressed by pressure:
PWV = −1g
p Z
p Z0=0qh p dz ≅ −
1g〠N
i=1qh,iΔp 11
The average specific humidity is calculated by layer bot-tom–specific humidity and layer top–specific humidity:
qh,i =qh,i−1 + qh,i
212
COSMIC wet atmosphere profiles provide multiplelevels of precipitable water pressure data, so we can use thefollowing formula to calculate specific humidity:
q =ε ∗ e
p − e ∗ 1 − ε, 13
where ε is a constant, which equals 0 622g kg−1, r is the mix-ing ratio of precipitable water, e is the precipitable waterpressure, ε is the ratio of the molecular weight of precipitablewater to dry air, p is the total atmospheric pressure, and q isthe specific humidity.
2.3. NWP Reanalysis Data. ERA-Interim is a global atmo-spheric reanalysis data from 1979 to the present, producedby a numerical weather prediction model run at ECMWF.The horizontal resolution of ERA-Interim is 0 75° × 0 75°,with a temporal resolution of 6 h [36]. ERA-Interim is oneof the most advanced global atmospheric reanalysis datawhich represents the state of the atmosphere using the 4D-Var method [37] and assimilates a number of differentsources of observations such as radiosonde humidity, atmo-spheric infrared sounder radiance (AIRS), GNSS RO-bending angle profiles, and Special Sensor Microwave/Imager (SSM/I), ERS- (European Remote Sensing Satellite-)1 and -2 [36]. Here, we use monthly ERA-Interim data witha horizontal resolution of 1 5° × 1 5° on 37 pressure levelsbetween 1hPa and 1000 hPa [36]. The spatial resolution ofthe dataset is approximately 80 km (T255 spectral) on 60 ver-tical levels from the surface up to 0.1 hPa [29]. This model isone of the most advanced in operational use and capable ofpredicting the global atmosphere with accuracy just barelyless than what is theoretically possible [37]. ERA5 will bethe fifth generation of ECMWF atmospheric reanalysis ofthe global climate, which starts with the reanalysis producedin the 1980s, followed by ERA-15, ERA-40, and the mostused ERA-Interim. The new ERA5 reanalysis will span themodern observing period from 1979 onward, with dailyupdates continuing forward in time. ERA5 will eventuallyreplace ERA-Interim. ERA5 data will be at a much higherresolution than ERA-Interim; hourly analysis fields will beavailable at a horizontal resolution of 31 km on 137 levels,from the surface up to 0.01 hPa (around 80 km). ERA-Interim and ERA5 both provide surface and multiple pres-sure levels of data; users can select different types of atmo-sphere datasets, such as temperature, pressure, or columnprecipitable water profiles. In the paper, we use the total
column precipitable water data from 0 75° × 0 75° 6h ERA-Interim reanalysis and 0 25° × 0 25° 3h ERA5 datasets.
2.4. Microwave Satellite. Based on satellite-borne passivemicrowave detectors, it is possible to observe the atmo-spheric PWV over the vast oceanic regions where onlylimited ship-based and buoy-based observations were pre-viously available [38]. Microwaves are less affected by scatter-ing and absorption from cloud, allowing for PWVmeasurements in most weather conditions. Unlike the infra-red measurements, the passive microwave detector is able tomeasure the atmospheric PWV content under both cloud-free and cloudy conditions since the microwave can pene-trate cloud. Lots of studies had presented that the datasources from satellite measurements can be used to retrievePWV distribution with varying accuracy; for example,researchers use microwave satellite data to retrieve PWV inpolar winter conditions and analyze the global PWV trendand its diurnal asymmetry based on GPS, radiosonde, andmicrowave satellite measurements. The High-ResolutionInfrared Radiation Sounder (HIRS) unit in the TIROS-NOperational Vertical Sounder (TOVS) package is designedto sense the amount of PWV in the upper troposphere withhigh quality [11]. In this paper, we use TOVS-detected datafor PWV retrieval and analysis.
2.5. Radiosonde. Radiosonde balloon measurements arelaunched globally, although with sparse coverage in lots ofareas, such as over oceans or in the Southern Hemisphere.Most radiosonde locations are in land; in addition, thereare also some radiosonde observations made on ships overoceans, but actually it is not easy and convenient for users.Radiosonde can get high precision atmosphere observationsand has high vertical resolution, and its observation coversthe range from the ground surface to an altitude of 30 km.However, the data quality varies strongly depending on thesensor type; now, many different types of sensors are usedglobally, and each one has its unique known and unknownbiases. Besides, sensor types at different locations change overtime, which can lead to artificial trends or jumps. Most sta-tions provide twice observations in one day, one is in 00 : 00and the other one is in 12 : 00, while some stations can alsoprovide four times observations per day. From radiosondeobservations, we can get pressure, temperature, relativehumidity, wind direction, and wind speed these parameters,and then we can use formula (13) to calculate the PWV ineach site.
2.6. PWV Horizontal and Vertical Interpolation. When wedo PWV comparison and precision evaluation between dif-ferent datasets, the direct issue is to match them to the samesite, which means we need to do horizontal and verticalinterpolation. In our paper, we use five different types ofdatasets: radio occultation, ECMWF reanalysis data, GNSSobservation, microwave satellite, and radiosonde. All thesedata, in horizontal, often express location using geographiccoordinates latitude/longitude. If we want to interpolatePWV to RO sites using ERA-Interim reanalysis data, firstlywe need to pick up the total column PWV values of four
4 Journal of Sensors
grid points surrounding RO location and then calculate thecomprehensive value using the following equations:
PWV = 〠4
i=1WiPi, 14
Wi =1/di
∑4j=1 1/di
15
di denotes the distance grid point to the target point,Wiis the weight of each grid point PWV value, Pi is the gridpoint retrieving PWV, and PWV is the end target pointPWV.
Actually, different datasets use multiple height systems,like ERA-Interim or ERA5, geopotential height is used toexpress different layer observations, the GNSS station oftenuses geodetic height, and the radiosonde uses altitude. How-ever, in our paper, we need the total column precipitablewater vapor, which means from ground surface to top nomatter what kind height systems they used.
2.7. Evaluation. In the paper, we use mean bias and RMSE(root-mean-square error) to analyze and evaluate theretrieved PWV precision of different types of measurements.
Mean bias =∑n
i=1 xobs,i − xmodel,in
, 16
RMSE =∑n
i=1 xobs,i − xmodel,i2
n17
3. Results and Discussion
In this paper, mostly we focus on analyzing PWV retrievedby multiple data sources. We show cases and analyze the pre-cision of ground-based GNSS and space-based monitoringmethods, like microwave satellites and radio occultation.We try to use the retrieved atmospheric profiles of FY3Cand COSMIC radio occultation soundings on the day ofFebruary 4, 2016 for PWV calculation and analysis. Besides,we also interpolate the “total column precipitable watervapor” data from ECMWF ERA-Interim and ERA5 for com-parison and validation. Same as lots of related research, westill use the retrieved PWV from ground-based radiosondeas the reference, for precision analysis and validation. Thefollowing sections will show more details and analysis.
3.1. GNSS Retrieved PWV Comparison and Analysis. Lots ofstudies have been done for PWV content and distributionmonitoring by the ground-based GNSS network. Especiallyin recent several years, the precise point positioning (PPP)technique developed rapidly; some researchers try to usethe near real-time satellite orbit, clock, and ionospherestreams, for example the International Geodetic Service(IGS) RT-PP product, to monitor atmosphere zenith totaldelay, then combine atmospheric temperature and pressureobservations to convert to PWV. In this paper, we just givea case to show the statistical dependence of retrieved PWV
of IGS stations by GNSS and the nearby radiosonde’s obser-vations [33, 39–41].
We select the GNSS station SVTL for our test as well as itscoordinates (latitude: 60 53 deg, longitude: 29 78 deg, eleva-tion: 60 64m) and location in Europe; the nearby radiosondestation ID is 26063, its coordinates are latitude: 59 95 deg,longitude: 30 70 deg, and elevation: 78 00m. The two typesof observations are completely in 2017, so we choose thewhole year’s observations to do analysis.
GNSS can get high-frequency ZTD nearly real-time,which depends on receiver antenna and hardware processability, which means it has a possibility of getting high-frequency PWV. In this case, the SVTL station providesretrieved PWV 30min each. In the whole year of 2017, it gets15,410 observation values; however, in each day, the radio-sonde just measures twice, one at 00 : 00 and the other at12 : 00 a.m., so each day we can get only two PWV values inthe 26063 station. Totally, we get 730 PWV values in 2017,so it is easy to find GNSS providing much more PWV obser-vations compared to the radiosonde.
In the paper, so as to compare and analyze the retrievedPWV bias and accuracy by the two types of observations, weselect each day’s 00 : 00 and 12 : 00 observations from GNSSPWV to do statistical analysis. The following is the distribu-tion map of matched PWV values in each month of 2017.
From Figures 1 and 2, we can see in the whole year of2017 GNSS retrieving PWV and radiosonde retrievingPWV; their correlation is up to 0.95. The max PWV of GNSSand RS are both produced between July and September, andthe local season is in the summer. Table 1 lists the statisticalinformation min bias, max bias, mean bias, and mean RMSEof matched RS retrieving PWV and GNSS retrieving PWV.
From Table 1, we can easily see that the mean bias isonly 0.23mm and the mean RMSE is 2.41mm; they arevery small, which means GNSS-retrieved PWV values havehigh precision. It is a useful method to monitor PWV situ-ation changes.
3.2. Microwave Satellite Inferred PWV Analysis. We use theday January 1, 2014 (00 : 00), ATOVS (The Advanced TIROSOperational Vertical Sounder) data (Figure 3) and radio-sonde data to investigate and analyze PWV content distribu-tion status and interpolate ATOVS-detected PWV in 589radiosonde locations, so we can get the statistical results.In Table 2, the min bias is 0.003mm, the max bias is12.068mm, the mean bias is −0.348mm, and the meanRMS is 3.461mm.
3.3. PWV Retrieval from RO and NWP Reanalysis Data
3.3.1. Distributions of COSMIC and FY3C RO Events. OnFebruary 4, 2016, COSMIC produced 891 radio occultationevents and FY3C had 410. Figure 4 shows the distributionmap of these radio occultation event locations; we can seethat these occultation event locations nearly cover the entireworld from the North Pole to the South Pole.
3.3.2. Retrieved Atmosphere Parameters of FY3C andCOSMIC. In Figure 5, we select two nearby FY3C and COS-MIC radio occultation events as an example for comparison
5Journal of Sensors

analysis; (a), (b), and (c) are the retrieved specific humidityprofile, pressure profile, and temperature profile, respec-tively, of FY3C radio occultation on the site latitude24 99°, longitude −11 68° at 11 : 51 : 03 of the day February4, 2016, so we find the nearest COSMIC radio occultationevent regardless of the location but also the event timewhich occurred latitude 26 95°, longitude −11 35° at14 : 10 : 41 of February 4, 2016; (d), (e), and (f) list the
COSMIC-retrieved specific humidity profile, pressure pro-file, and temperature profile, respectively. From (a) and (d),we can see that radio occultation detected specific humiditywhether it is FY3C or COSMIC; in nearly ground height,the value exceeds 4 k/kg and the height is between 2 kmand 7 km. COSMIC detected that specific humidity has a big-ger jump than FY3C, above 10 km, both of which detected aspecific humidity reduction to 0, which means no PWVexists in the upper layer. From (b) and (e), the graphics showFY3C and COSMIC retrieving pressure from the ground sur-face to the upper atmosphere; FY3C shows a pressure of0~60 km and COSMIC gives 0~40 km. We can see that above20 km, the air pressure becomes very small; from the groundsurface to 20 km, the pressure degrades rapidly. The maxvalue of pressure is located at the ground surface, both show-ing no more than 1000Mb; besides, the pressure variationtendencies of both pressure data are in substantial agreement.(c) shows FY3C retrieving temperature from the surface to60 km; from the graphic, we can see that the highest temper-ature is in the ground surface, and then from the surface to20 km, the temperature becomes lower and lower, with thelowest temperature being nearly 20 km in height. However,from 20km, the temperature (205K) increases, reaching255K in the 42 km height layer. From 42km, the temperaturedecreases again until reaching 220K in the 60 km layer. Thesame situation occurs in graphic (f); from the ground surfaceto 20 km, the temperature decreases, especially between theground surface and the 12 km height layer, in which the tem-perature variation trend is nearly linearly decreasing; from20 km to 40 km, the temperature becomes linearly increasing,although FY3C and COSMIC events have more than a 2hgap, but as can be easily seen, their variation trends are basi-cally the same.
3.3.3. Evaluation of COSMIC and FY3C Retrieved PWV. Thepaper uses radiosonde measurements as the reference stan-dard to do analysis; due to this reason, radiosonde observa-tions can only be measured at around 11 : 00 and 23 : 00.We use the following three rules to collect nearby matchedRO and RS observations for comparison and do statisticalanalysis. In the first rule, we set latitude and longitude differ-ences between radiosonde observation sites and radio occul-tation event which produced sites below 1°; for the temporalresolution, we limit it to a ±2h difference. For example, if weuse 11 : 00 radiosonde observations, the related radio occul-tation events must be produced at 9 : 00~13 : 00. That is tosay, all of these observations we selected are produced inthe time range 9 : 00~13 : 00 and 21 : 00~01 : 00 on February4, 2016. For the second and third standards, we change thesearch range from latitude-longitude difference 1°/1° to 2°/2° and 3°/3° individually.
On February 4, 2016, COSMIC produced 891 radiooccultation events and FY3C had 410. We use the above threestandards to collect matched data from FY3C, COSMICradio occultations, and radiosonde observations in the globalarea. Statistical results are listed in Table 3, whether it isFY3C- or COSMIC-retrieved PWV; compared to nearbyradiosonde observations, their RMSE values are no morethan 10mm. From our statistical data, we find that RMSEs
Table 1: Precision statistic of retrieved PWV from ground-basedGNSS station (STVL) compared with the nearby radiosonde.
Min bias(mm)
Max bias(mm)
Mean bias(mm)
RMSE(mm)
RS_PWV-GPS_PWV
−0.01 15.15 0.23 2.41
05
10
0 50 100 150 200Day
GNSSRadiosonde
Distribution of precipitable water vapor retrieved by GNSS and radiosonde
PWW
(mm
)
250 300 350
152025303540
Figure 1: The graphic shows SVTL GNSS station and the nearbyradiosonde station 26063 PWV time series distributions of thewhole year of 2017.
0
5
10
0 10 20 30 40PWV_RS (mm)
y = x ⁎⁎ 0.9563 + 0.3425PWV values
PWV
_GN
SS (m
m)
15
20
25
30
35
40Coefficient of precipitable water vapor retrieved by GNSS and radiosonde
Figure 2: PWV correlation analysis of the ground-based GNSS(SVTL) and the matched radiosonde (26063) in the whole year of2017.
6 Journal of Sensors

at 23 : 00 are all larger than 11 : 00, whether it is FY3C orCOSMIC; it is not sure if RO measurements have big biasesat 23 : 00 or RS produces large bias. In the future, we will domore deep research about this phenomenon.
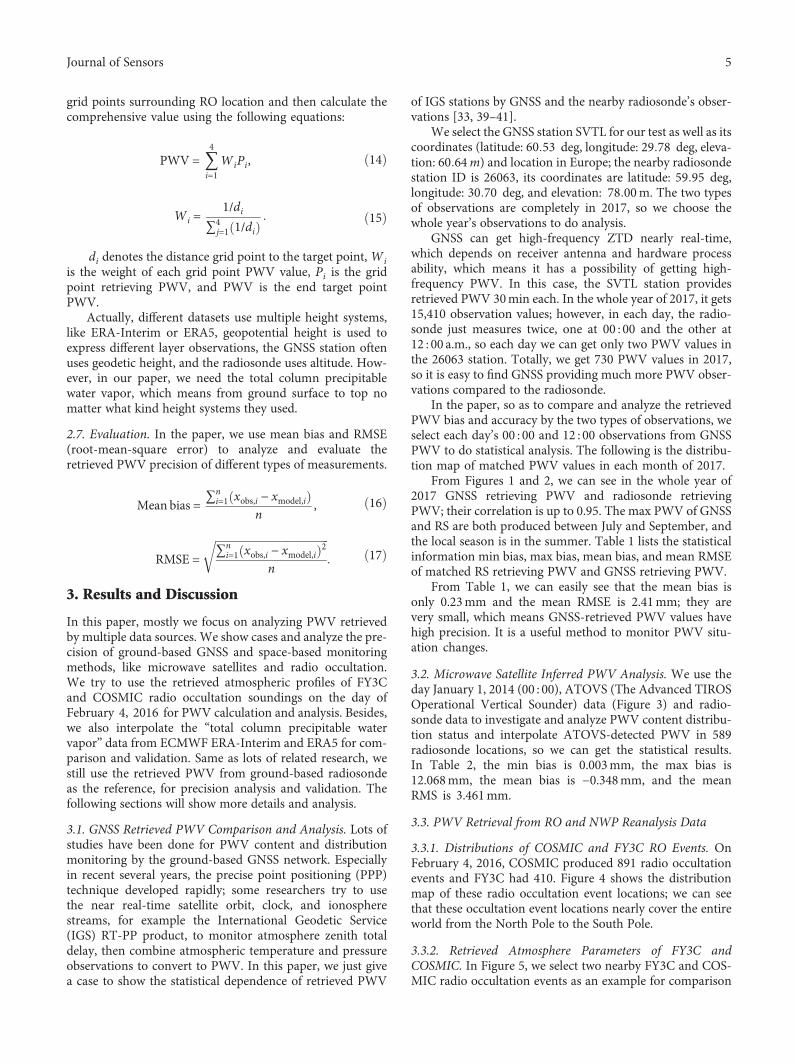
3.3.4. PWV Retrieved from ECMWF ERA-Interim and ERA5.Figure 6 shows the retrieved PWV distribution in the globalarea from ECMWF ERA-Interim and ERA5 in four periods(00 : 00, 06 : 00, 12 : 00, and 18 : 00); we can see that surround-ing the equator, the PWV content exceeds 40mm, and thePWV distribution decreases along the latitude from the equa-tor to the South Pole to the North Pole.
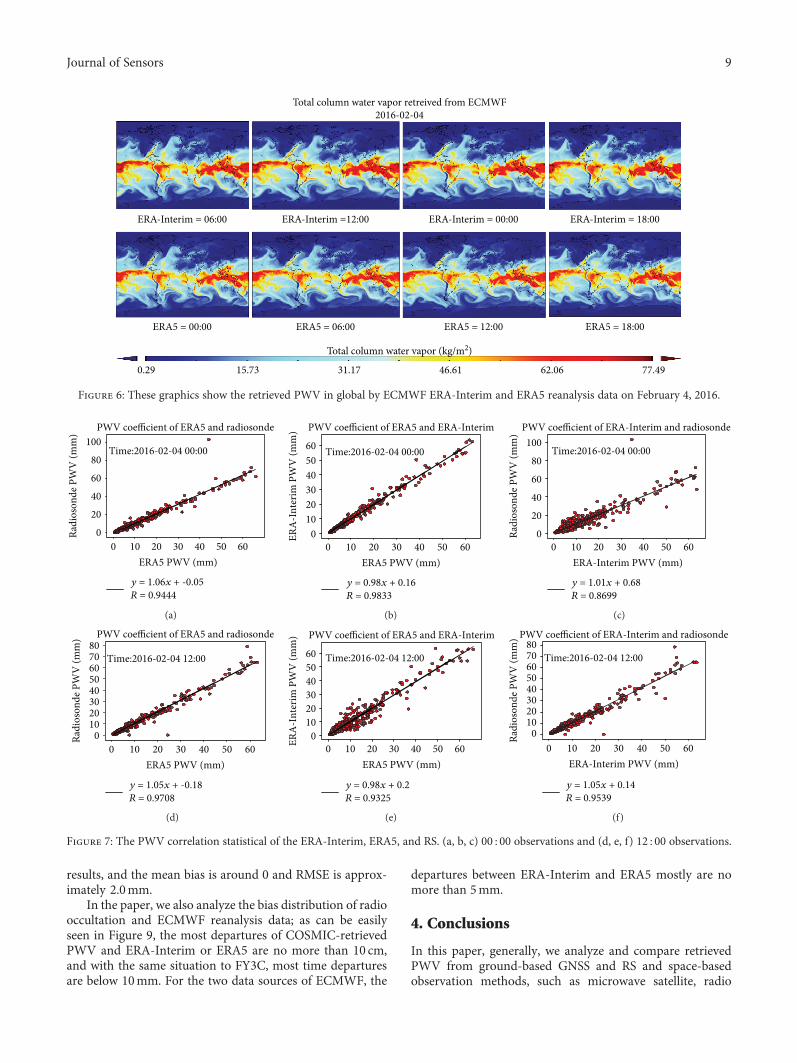
3.3.5. Evaluation of ERA-Interim and ERA5-Retrieved PWV.In Figure 7, it shows the retrieved PWV statistical coefficientsbetween different data sources; we present the statistical anal-ysis using two groups’ observations; respectively, one is in00 : 00 and the other one uses 12 : 00 observations, so fromthese graphics, we can see that graph (a) shows the retrievedPWV coefficient between ERA5 and radiosonde at 00 : 00,with R2 equal to 0.9444. From (d), at 12 : 00, R2 equals0.9708, so we can see that the retrieved PWV by ERA5 andradiosonde has a higher linear correlation. In (b) and (e),they show a retrieved PWV relationship of ERA-Interimand ERA5 at 00 : 00 and 12 : 00, and their R2 values are
Time: 201401010000 Unit: (kg/m2)0.3 13.7 27.0 40.4 53.8 67.2
Vertically integrated water vapor
Figure 3: Distribution of the PWV detected by microwave satellite on January 1, 2014 (00 : 00).
Table 2: Precision statistic of retrieved PWV from the ATOVS product compared with radiosondes.
Min bias (mm) Max bias (mm) Mean bias (mm) RMSE (mm)
RS_PWV-Sat_PWV 0.003 12.068 −0.348 3.461
COSMIC radio occultation distribution mapTime: 2016-02-04
FY3C radio occultation distribution mapTime: 2016- 02-04
70°N50°N
30°N10°N
70°N50°N
30°N10°N
70°S50°S
30°S10°S
70°S50°S
30°S10°S
140°W100°W60°W 20°W 20°E 60°E 100°E140°E180° 140°W100°W60°W 20°W 20°E 60°E 100°E140°E180°
Figure 4: The two graphics show the locations of COSMIC radio occultation and FY3C radio occultation events produced onFebruary 4, 2016.
7Journal of Sensors

0.9833 and 0.9325. Respectively, in theory both methods canget nearly the same results; ERA5 is little superior comparedto ERA-Interim, due to the reason that it uses more datasources and new technology for assimilation analysis. (c)and (f) express the relationship of PWV between ERA-Interim and radiosonde, and their R2 values are 0.8699and 0.9539, respectively, which means they have a higherlinear correlation.
3.3.6. PWV Intercomparison between RO and ERA-Interimand ERA5. In Figure 8, these graphics show the retrievedPWV distribution along the latitude: (a) shows obtainedCOSMIC-retrieved atmospheric profiles, (b) shows interpo-lated PWV in the site COSMIC radio occultation events that
occurred based on ERA-Interim data, (c) shows interpolationin the same sites from ERA5, (d) shows obtained FY3C radiooccultation–retrieved atmospheric profiles, and (e)-(f) showinterpolated PWV in FY3C radio occultation events produc-ing sites from ERA-Interim and ERA5 data. From the abovegraphics, we can easily see that the PWV has symmetricaldistribution along the equator; from latitude 0° to the NorthPole or South Pole, the retrieved PWV decreases to nearly 0in the South or North Pole. The biggest PWV is detected inthe equator area which exceeds 60 g/m2. In (a), (b), and (c),these graphics show that they have nearly the same variationtendency in these sites by different data sources; (d), (e), and(f) have the same situations.
We calculate the mean bias and mean RMSE of COSMICand FY3C-retrieved PWV with interpolated PWV fromERA-Interim and ERA5 datasets; these results are listed inTable 4.
As can be seen from Table 4, the mean bias of COSMIC-retrieved PWV and ERA-Interim is −2.3mm, RMSE is4.5mm, compared to COSMIC-ERA5 results, the statisticalvalue has only −0.2mm bias, and RMSE has 0.3mm bias;the same situation occurs in FY3C observations, but onthe whole, FY3C-retrieved PWV has smaller mean biasvalues and mean RMSE than COSMIC-retrieved results.COSMIC has 891 observations, and FY3C contains 410observations; whether in COSMIC radio occultation sitesor FY3C, ERA-Interim and ERA5 have stable statistical
Latitude = 24.99Longitude = -11.68Time: 2016-02-04 11:51:03
Retrieved specific humidity fromFY3C radio occultation soundings
4
3
2
Spec
ific h
umid
ity (k
g)
1
00 10 20 30 40 50 60
Mean sea level altitude (km)
(a)
Retrieved pressure fromFY3C radio occultation soundings
Latitude = 24.99Longitude = -11.68Time: 2016-02-04 11:51:03
800
1000
600
400
Pres
sure
(mb)
200
00 10 20 30
Mean sea level altitude (km)40 50 60
(b)
Retrieved temperature fromFY3C radio occultation soundings
Latitude = 24.99Longitude = -11.68Time: 2016-02-04 11:51:03
280
260
240
Tem
pera
ture
(K)
220
2000 10 20 30
Mean sea level altitude (km)40 50 60
(c)
Retrieved water vapor pressure fromCOSMIC radio occultation soundings
Latitude = 26.95Longitude = -11.35Time: 2016-02-04 14:10:41
4
3
2
Wat
er v
apor
pre
ssur
e (m
b))
1
0
0 5 10 15Mean sea level altitude (km)
20 25 30 35 40
(d)
Retrieved pressure from COSMICradio occultation soundings
Latitude = 26.95Longitude = -11.35Time: 2016-02-04 14:10:41
0 5 10 15 20 25 30 35 40
800
1000
600
400
Pres
sure
(mb)
200
0
Mean sea level altitude (km)
(e)
Retrieved temperature from COSMICradio occultation soundings
Latitude = 26.95Longitude = -11.35Time: 2016-02-04 14:10:41280
300
260
240
220
2000 5 10 15 20 25 30 35 40
Tem
pera
ture
(K)
Mean sea level altitude (km)
(f)
Figure 5: The above group graphics show the retrieved atmosphere profiles from FY3C and COSMIC radio occultation observations onFebruary 4, 2016.
Table 3: Retrieved PWV precision statistic between FY3C,COSMIC, and radiosonde.
ROLatitude/longitudedifference (deg)
RMSE (mm)11 : 00 23 : 00
FY3C
1/1 0.34 6.64
2/2 1.09 5.28
3/3 1.26 4.65
COSMIC
1/1 3.03 6.03
2/2 4.30 5.32
3/3 3.29 6.92
8 Journal of Sensors
results, and the mean bias is around 0 and RMSE is approx-imately 2.0mm.
In the paper, we also analyze the bias distribution of radiooccultation and ECMWF reanalysis data; as can be easilyseen in Figure 9, the most departures of COSMIC-retrievedPWV and ERA-Interim or ERA5 are no more than 10 cm,and with the same situation to FY3C, most time departuresare below 10mm. For the two data sources of ECMWF, the
departures between ERA-Interim and ERA5 mostly are nomore than 5mm.
4. Conclusions
In this paper, generally, we analyze and compare retrievedPWV from ground-based GNSS and RS and space-basedobservation methods, such as microwave satellite, radio
ERA-Interim = 06:00
ERA5 = 00:00 ERA5 = 06:00
0.29 15.73 31.17 46.61 62.06 77.49
ERA5 = 12:00
Total column water vapor (kg/m2)
Total column water vapor retreived from ECMWF2016-02-04
ERA5 = 18:00
ERA-Interim =12:00 ERA-Interim = 00:00 ERA-Interim = 18:00
Figure 6: These graphics show the retrieved PWV in global by ECMWF ERA-Interim and ERA5 reanalysis data on February 4, 2016.
Time:2016-02-04 00:00
y = 1.06x + -0.05R = 0.9444
100PWV coefficient of ERA5 and radiosonde
80
60
40
20
Radi
oson
de P
WV
(mm
)
00 10 20 30
ERA5 PWV (mm)40 50 60
(a)
y = 0.98x + 0.16R = 0.9833
Time:2016-02-04 00:00
PWV coefficient of ERA5 and ERA-Interim
60
4050
302010
ERA
-Int
erim
PW
V (m
m)
00 10 20 30
ERA5 PWV (mm)40 50 60
(b)
y = 1.01x + 0.68R = 0.8699
Time:2016-02-04 00:00
PWV coefficient of ERA-Interim and radiosonde100
80
60
40
20Ra
dios
onde
PW
V (m
m)
00 10 20 30 40 50 60
ERA-Interim PWV (mm)
(c)
y = 1.05x + -0.18R = 0.9708
Time:2016-02-04 12:00
PWV coefficient of ERA5 and radiosonde80
40506070
302010
Radi
oson
de P
WV
(mm
)
00 10 20 30
ERA5 PWV (mm)40 50 60
(d)
y = 0.98x + 0.2R = 0.9325
Time:2016-02-04 12:00
PWV coefficient of ERA5 and ERA-Interim
60
4050
302010
0ERA
-Int
erim
PW
V (m
m)
0 10 20 30ERA5 PWV (mm)
40 50 60
(e)
y = 1.05x + 0.14R = 0.9539
Time:2016-02-04 12:00
PWV coefficient of ERA-Interim and radiosonde80
40506070
302010
0Radi
oson
de P
WV
(mm
)
0 10 20 30ERA-Interim PWV (mm)
40 50 60
(f)
Figure 7: The PWV correlation statistical of the ERA-Interim, ERA5, and RS. (a, b, c) 00 : 00 observations and (d, e, f) 12 : 00 observations.
9Journal of Sensors

occultation and ECMWF reanalysis data, ERA-Interim, andERA5. This section will show more detailed conclusions:
(1) We analyze the ground-based GNSS retrieved PWVand compare its results with radiosonde; GNSS cannot only get high-frequency PWV values, but stillthey are of high precision, and the mean RMSE isabout 2.41mm, so it is real useful and meaningfulto monitor PWV distribution and change situationsby the ground-based GNSS technique
(2) We analyze the PWV from microwave satelliteATOVS and interpolate it to global 589 radiosondesites, compare the detected PWV of ATOVS withradiosonde, and get a statistical min bias of0.003mm, a max bias of 12.068mm, a mean biasof −0.348mm, and a mean RMS of 3.461mm. It
can satisfy the PWV detection requirement andshould be a valuable method to get PWV distribu-tion from space
(3) We verify China FY3C radio occultation observa-tions and compare its retrieved atmospheric parame-ters with COSMIC; we find that there is no big biasregardless of whether these are FY3C-retrieved atmo-spheric parameters, such as temperature, pressure, orwater vapor pressure profiles. Besides, althoughFY3C can provide retrieved atmosphere observationsabove 40 km, for the retrieved PWV of FY3C, wecompare it to COSMIC’s results and find that onthe whole it has a smaller bias, compared to the refer-ence radiosondes, and their average RMSE values areboth no more than 10mm. From our statistic results,whether it is FY3C or COSMIC, on the whole, theRMSE value at 11 : 00 (day) is smaller than 23 : 00’sresults (night). We need do more future research tounderstand the reasons in detail
(4) We also analyze the NWP reanalysis data with a tra-ditional radiosonde, interpolate the PWV from ERA-Interim and new reanalysis dataset ERA5 to radio-sonde sites, and find that on the whole they have highconsistency and no big biases. However, relatively,for the PWV of ERA5, we find that it has higher pre-cision compared to ERA-Interim data, and it is alsoreasonable, because ERA5 assimilates more differenttypes of observations and has higher spatial and tem-poral resolution
605040302010
0-75 -50 -25 0
Latitude (degree)
Prec
ipita
ble w
ater
vap
or (m
m)
Retrieved precipitable water vapor from COSMIC2016-02-04
25 50 75
(a)
0
Interpolated total column water vapor from ERA52016-02-04
605040302010
-75 -50 -25 0Latitude (degree)
Tota
l col
umn
wat
er v
apor
(mm
)
25 50 75
70
(b)
0
Interpolated total column water vapor from ERA-Interim2016-02-04
605040302010
-75 -50 -25 0Latitude (degree)
Tota
l col
umn
wat
er v
apor
(mm
)
25 50 75
70
(c)
Retrieved precipitable water vapor from COSMIC2016-02-04
-75 -50 -25 0Latitude (degree)
Prec
ipita
ble w
ater
vap
or (m
m)
25 50 75
605040302010
0
(d)
Interpolated total column water vapor from ERA52016-02-04
-75 -50 -25 0Latitude (degree)
Tota
l col
umn
wat
er v
apor
(mm
)
25 50 75
605040302010
0
70
(e)
Interpolated total column water vaport from ERA-Interim2016-02-04
-75 -50 -25 0Latitude (degree)
Tota
l col
umn
wat
er v
apor
(mm
)
25 50 75
6070
5040302010
0
(f)
Figure 8: The six graphics show the retrieved PWV in global along the latitude by COSMIC radio occultation (a), FY3C radio occultation (d),ERA-Interim (c, f), and ERA5 (b, e) reanalysis data on February 4, 2016. (a, b, c) Retrieved PWV from COSMIC RO and interpolated totalcolumn water vapor from ECMWF ERA-Interim and ERA5 reanalysis data on COSMIC radio occultation sites. (d, e, f) Retrieved PWV fromFY3C RO and interpolated total column water vapor from ECMWF ERA-Interim and ERA5 reanalysis data on FY3C radio occultation sites.
Table 4: Retrieved PWV precision statistic between FY3C,COSMIC, and ERA-Interim, ERA5.
Mean bias(mm)
Mean RMSE(mm)
COSMIC RO sites
COSMIC-Interim −2.3 4.5
COSMIC-ERA5 −2.5 4.8
Interim-ERA5 −0.1 2.0
FY3C RO sites
FY3C-Interim 0.9 3.6
FY3C-ERA5 1.0 3.8
Interim-ERA5 0.1 1.9
10 Journal of Sensors

(5) We try to detect the retrieved PWV bias between ROand ECMWF reanalysis data, so we compare FY3Cand COSMIC radio occultation results with ERA-Interim and ERA5. From the precision statisticalresults and correlation analysis, we know that themean bias is 0.9mm and the mean RMSE is 3.6mmbetween FY3C results and ERA-Interim; comparingFY3C results to those of ERA5, the mean bias andmean RMSE are 1.0mm, 3.8mm, respectively; how-ever, the mean bias (around 2.5mm) and meanRMSE (around 4.5mm) between COSMIC andECMWF reanalysis data are both larger than thoseof FY3C results. But on the whole, regardless ofwhether it is COSMIC, FY3C, ERA-Interim, orERA5, their PWV all have a higher correlation
Data Availability
The authors would like to thank all the related agencies ofthese data providers; the following are data sources used inthis paper. ECMWF ERA-Interim and ERA5 reanalysis data-sets can be obtained from https://www.ecmwf.int/. COSMICradio occultation data can be downloaded from CDAAC(COSMIC Data Analysis and Archive Center); its website ishttp://cdaac-www.cosmic.ucar.edu/cdaac/index.html. FY3Cradio occultation sounding data can be found from thewebsite http://apps.ecmwf.int/datasets/data/interim-full-daily.ATOVS data can be obtained from this website https://www.ospo.noaa.gov/Products/atmosphere/soundings/atovs/profiles/index.html. GNSS data can be downloaded from this web-site https://www.suominet.ucar.edu/data.html. Radiosonde
data can be obtained from http://weather.uwyo.edu/upperair/sounding.html.
Conflicts of Interest
The authors declare no conflicts of interest.
Authors’ Contributions
Qin Zhang supervised and designed the research, Junhua Yewrote the manuscript and performed the experiments,Shuangchen Zhang reedited the manuscript and checkedthe experiment results, and Fei Han developed relatedprograms and did data analysis.
Acknowledgments
This research was funded by Chang’an University (Xi’an,China) through the Natural Science Foundation of China(NSFC) projects (nos. 41731066, 41790445, 41604001,41674001) and a Special Fund from the State Key Laboratoryof Geo-information Engineering, No. SKLGIE2017-Z-2-1.
References
[1] J. Shi, C. Xu, J. Guo, and Y. Gao, “Real-time GPS precise pointpositioning-based precipitable water vapor estimation forrainfall monitoring and forecasting,” IEEE Transactions onGeoscience and Remote Sensing, vol. 53, no. 6, pp. 3452–3459,2015.
[2] Y. Yao, L. Shan, and Q. Zhao, “Establishing a method of short-term rainfall forecasting based on GNSS-derived PWV and itsapplication,” Scientific Reports, vol. 7, no. 1, article 12465, 2017.
0.25
0.20
0.15
0.10Prob
abili
ty
0.05
0.00-20 -15 -10 -5 0
Departure (mm)
Departure of COSMIC and ERA-Interim retrieved PWV
5 10 15 20
(a)
Departure of COSMIC and ERA5 retrieved PWV0.25
0.20
0.15
0.10Prob
abili
ty
0.05
0.00-20 -15 -10 -5 0
Departure (mm)5 10 15 20
(b)
Departure of ERA-Interim and ERA5 retrieved PWV
0.5
0.6
0.4
0.3
0.2Prob
abili
ty
0.1
0.0-20 -15 -10 -5 0
Departure (mm)5 10 15 20
(c)
Departure of FY3C and ERA-Interim retrieved PWV0.25
0.20
0.15
0.10Prob
abili
ty
0.05
0.00-20 -15 -10 -5 0
Departure (mm)5 10 15 20
(d)
Departure of FY3C and ERA5 retrieved PWV0.25
0.20
0.15
0.10Prob
abili
ty
0.05
0.00-20 -15 -10 -5 0
Departure (mm)5 10 15 20
(e)
Departure of ERA-Interim and ERA5 retrieved PWV
0.5
0.4
0.3
0.2Prob
abili
ty
0.1
0.0-20 -15 -10 -5 0
Departure (mm)5 10 15 20
(f)
Figure 9: The above graphics show the departures of the retrieved PWV by different observations.
11Journal of Sensors

[3] P. Kishore, M. Venkat Ratnam, S. P. Namboothiri et al.,“Global (50°S–50°N) distribution of water vapor observed byCOSMIC GPS RO: comparison with GPS radiosonde, NCEP,ERA-Interim, and JRA-25 reanalysis data sets,” Journal ofAtmospheric and Solar-Terrestrial Physics, vol. 73, no. 13,pp. 1849–1860, 2011.
[4] Z. Liu, M. Li, W. Zhong, and M. S. Wong, “An approach toevaluate the absolute accuracy of WVR water vapor measure-ments inferred frommultiple water vapor techniques,” Journalof Geodynamics, vol. 72, pp. 86–94, 2013.
[5] D. M. Ward, E. R. Kursinski, A. C. Otarola et al., “Retrieval ofwater vapor using ground-based observations from a proto-type ATOMMS active cm- and mm- wavelength occultationinstrument,” Atmospheric Measurement Techniques Discus-sions, pp. 1–36, 2017.
[6] S.-J. Fan, J. F. Zang, X. Y. Peng, S. Q. Wu, Y. X. Liu, andK. F. Zhang, “Validation of atmospheric water vapor derivedfrom ship-borne GPS measurements in the Chinese BohaiSea,” Terrestrial, Atmospheric and Oceanic Sciences, vol. 27,no. 2, pp. 213–220, 2016.
[7] T. Zhang, J. Wen, R. van der Velde et al., “Estimation of thetotal atmospheric water vapor content and land surface tem-perature based on AATSR thermal data,” Sensors, vol. 8,no. 3, pp. 1832–1845, 2008.
[8] O. Bock and M. Nuret, “Verification of NWP model analysesand radiosonde humidity data with GPS precipitable watervapor estimates during AMMA,” Weather and Forecasting,vol. 24, no. 4, pp. 1085–1101, 2009.
[9] J. Wang, L. Zhang, A. Dai, T. van Hove, and J. van Baelen, “Anear-global, 2-hourly data set of atmospheric precipitablewater from ground-based GPS measurements,” Journal ofGeophysical Research, vol. 112, no. D11, 2007.
[10] S. Gong, D. F. T. Hagan, X. Wu, and G. Wang, “Spatio-tempo-ral analysis of precipitable water vapour over Northwest Chinautilizing MERSI/FY-3A products,” International Journal ofRemote Sensing, vol. 39, no. 10, pp. 3094–3110, 2018.
[11] M. Shangguan, K. Matthes, W. Wang, and T. K. Wee, “Valida-tion of COSMIC water vapor data in the upper troposphereand lower stratosphere using MLS, MERRA and ERA-Interim,” Atmospheric Measurement Techniques Discussions,vol. 2016, pp. 1–28, 2016.
[12] Z. Dong and S. Jin, “3-D water vapor tomography in WuhanfromGPS, BDS and GLONASS observations,” Remote Sensing,vol. 10, no. 2, p. 62, 2018.
[13] P. Jiang, S. Ye, D. Chen, Y. Liu, and P. Xia, “Retrieving precip-itable water vapor data using GPS zenith delays and globalreanalysis data in China,” Remote Sensing, vol. 8, no. 5,p. 389, 2016.
[14] C. Lu, X. Li, M. Ge et al., “Estimation and evaluation of real-time precipitable water vapor from GLONASS and GPS,”GPS Solutions, vol. 20, no. 4, pp. 703–713, 2016.
[15] H. Zhang, Y. Yuan, W. Li, J. Ou, Y. Li, and B. Zhang, “GPSPPP-derived precipitable water vapor retrieval based on Tm/Ps frommultiple sources of meteorological data sets in China,”Journal of Geophysical Research: Atmospheres, vol. 122, no. 8,pp. 4165–4183, 2017.
[16] M. Bevis, S. Businger, T. A. Herring, C. Rocken, R. A. Anthes,and R. H. Ware, “GPS meteorology: remote sensing of atmo-spheric water vapor using the Global Positioning System,”Journal of Geophysical Research-Atmospheres, vol. 97,no. D14, pp. 15787–15,801, 1992.
[17] E. R. Kursinski, G. A. Hajj, J. T. Schofield, R. P. Linfield, andK. R. Hardy, “Observing earth’s atmosphere with radio occul-tation measurements using the global positioning system,”Journal of Geophysical Research: Atmospheres, vol. 102,no. D19, pp. 23429–23465, 1997.
[18] C. A. Mears, J. Wang, D. Smith, and F. J. Wentz, “Intercom-parison of total precipitable water measurements made by sat-ellite- borne microwave radiometers and ground-based GPSinstruments,” Journal of Geophysical Research – Atmospheres,vol. 120, no. 6, pp. 2492–2504, 2015.
[19] G. A. Wick, Y. H. Kuo, F. M. Ralph, T. K. Wee, and P. J.Neiman, “Intercomparison of integrated water vapor retrievalsfrom SSM/I and COSMIC,” Geophysical Research Letters,vol. 35, no. 21, pp. 3263–3266, 2008.
[20] R. A. Anthes, P. A. Bernhardt, Y. Chen et al., “The COS-MIC/FORMOSAT-3 mission: early results,” Bulletin of theAmerican Meteorological Society, vol. 89, no. 3, pp. 313–334, 2008.
[21] R. A. Anthes, “Exploring Earth’s atmosphere with radio occulta-tion: contributions to weather, climate and space weather,”Atmospheric Measurement Techniques, vol. 4, no. 6, pp. 1077–1103, 2011.
[22] S.-P. Ho, L. Peng, C. Mears, and R. A. Anthes, “Comparison ofglobal observations and trends of total precipitable waterderived from microwave radiometers and COSMIC radiooccultation from 2006 to 2013,” Atmospheric Chemistry andPhysics, vol. 18, no. 1, pp. 259–274, 2018.
[23] D. Jacob, “The role of water vapour in the atmosphere. A shortoverview from a climate modeller’s point of view,” Physics andChemistry of the Earth, Part A: Solid Earth and Geodesy,vol. 26, no. 6–8, pp. 523–527, 2001.
[24] X. Li, G. Dick, M. Ge, S. Heise, J. Wickert, and M. Bender,“Real-time GPS sensing of atmospheric water vapor: precisepoint positioning with orbit, clock, and phase delay correc-tions,” Geophysical Research Letters, vol. 41, no. 10, pp. 3615–3621, 2014.
[25] X. Meng, J. Cheng, and S. Liang, “Estimating land surface tem-perature from Feng Yun-3C/MERSI data using a new land sur-face emissivity scheme,” Remote Sensing, vol. 9, no. 12, p. 1247,2017.
[26] Y. Burgos Fonseca, P. Alexander, A. de la Torre, R. Hierro,P. LLamedo, and A. Calori, “Comparison between GNSSground-based and GPS radio occultation precipitable waterobservations over ocean-dominated regions,” AtmosphericResearch, vol. 209, pp. 115–122, 2018.
[27] H. Namaoui, S. Kahlouche, A. H. Belbachir, R. van Malderen,H. Brenot, and E. Pottiaux, “GPS water vapor and its compar-ison with radiosonde and ERA-Interim data in Algeria,”Advances in Atmospheric Sciences, vol. 34, no. 5, pp. 623–634, 2017.
[28] B. Chen and Z. Liu, “Analysis of precipitable water vapor(PWV) data derived from multiple techniques: GPS, WVR,radiosonde and NHM in Hong Kong,” China SatelliteNavigation Conference (CSNC) 2014 Proceedings: VolumeI. Lecture Notes in Electrical Engineering, vol 303, J. Sun,W. Jiao, H. Wu, and M. Lu, Eds., 159–175, Springer, Berlin,Heidelberg, 2014.
[29] S.-p. Ho, X. Zhou, Y. H. Kuo, D. Hunt, and J. H. Wang,“Global evaluation of radiosonde water vapor systematicbiases using GPS radio occultation from COSMIC andECMWF analysis,” Remote Sensing, vol. 2, no. 5, pp. 1320–1330, 2010.
12 Journal of Sensors

[30] J.-H. Heo, G.-H. Ryu, and J.-D. Jang, “Optimal interpolation ofprecipitable water using low earth orbit and numerical weatherprediction data,” Remote Sensing, vol. 10, no. 3, p. 436, 2018.
[31] G. Esteban Vázquez B and D. A. Grejner-Brzezinska, “GPS-PWV estimation and validation with radiosonde data andnumerical weather prediction model in Antarctica,” GPS Solu-tions, vol. 17, no. 1, pp. 29–39, 2013.
[32] Y.-A. Liou, A. G. Pavelyev, S.-F. Liu et al., “FORMOSAT-3/COSMIC GPS radio occultation mission: preliminary results,”IEEE Transactions on Geoscience and Remote Sensing, vol. 45,no. 11, pp. 3813–3826, 2007.
[33] C.-Y. Huang, W. H. Teng, S. P. Ho, and Y. H. Kuo, “Globalvariation of COSMIC precipitable water over land: compari-sons with ground-based GPS measurements and NCEP reana-lyses,” Geophysical Research Letters, vol. 40, no. 19, pp. 5327–5331, 2013.
[34] DMI, ECMWF, IEEC, and METO, “ROM SAF CDOP-2 Algo-rithm Theoretical Baseline Document: Level 2B and 2C 1D-Var product,” Version 1.2, April 2016, http://www.romsaf.org/product_documents/romsaf_atbd_tph.pdf.
[35] A. von Engeln, “One-dimensional variational (1-D Var)retrieval of temperature, water vapor, and a reference pressurefrom radio occultation measurements: a sensitivity analysis,”Journal of Geophysical Research, vol. 108, no. D11, 2003.
[36] P. Poli, “1DVAR analysis of temperature and humidity usingGPS radio occultation refractivity data,” Journal of GeophysicalResearch, vol. 107, no. D20, 2002.
[37] A. Simmons and A. Hollingsworth, “Some aspects of theimprovement in skill of numerical weather prediction. Techni-cal Memorandum,” Shinfield Park, Reading, ECMWF, 2001.
[38] B. Chen and Z. Liu, “Global water vapor variability and trendfrom the latest 36 year (1979 to 2014) data of ECMWF andNCEP reanalyses, radiosonde, GPS, and microwave satellite,”Journal of Geophysical Research: Atmospheres, vol. 121,no. 19, pp. 11,442–411,462, 2016.
[39] O. Bock, M. N. Bouin, A. Walpersdorf et al., “Comparison ofground-based GPS precipitable water vapour to independentobservations and NWP model reanalyses over Africa,” Quar-terly Journal of the Royal Meteorological Society, vol. 133,no. 629, pp. 2011–2027, 2007.
[40] Y.-A. Liou, Y. T. Teng, T. van Hove, and J. C. Liljegren, “Com-parison of precipitable water observations in the near tropicsby GPS, microwave radiometer, and radiosondes,” Journal ofApplied Meteorology, vol. 40, no. 1, pp. 5–15, 2001.
[41] S. Jade and M. S. M. Vijayan, “GPS-based atmospheric precip-itable water vapor estimation using meteorological parametersinterpolated from NCEP global reanalysis data,” Journal ofGeophysical Research: Atmospheres, vol. 113, no. D3, 2008.
13Journal of Sensors

International Journal of
AerospaceEngineeringHindawiwww.hindawi.com Volume 2018
RoboticsJournal of
Hindawiwww.hindawi.com Volume 2018
Hindawiwww.hindawi.com Volume 2018
Active and Passive Electronic Components
VLSI Design
Hindawiwww.hindawi.com Volume 2018
Hindawiwww.hindawi.com Volume 2018
Shock and Vibration
Hindawiwww.hindawi.com Volume 2018
Civil EngineeringAdvances in
Acoustics and VibrationAdvances in
Hindawiwww.hindawi.com Volume 2018
Hindawiwww.hindawi.com Volume 2018
Electrical and Computer Engineering
Journal of
Advances inOptoElectronics
Hindawiwww.hindawi.com
Volume 2018
Hindawi Publishing Corporation http://www.hindawi.com Volume 2013Hindawiwww.hindawi.com
The Scientific World Journal
Volume 2018
Control Scienceand Engineering
Journal of
Hindawiwww.hindawi.com Volume 2018
Hindawiwww.hindawi.com
Journal ofEngineeringVolume 2018
SensorsJournal of
Hindawiwww.hindawi.com Volume 2018
International Journal of
RotatingMachinery
Hindawiwww.hindawi.com Volume 2018
Modelling &Simulationin EngineeringHindawiwww.hindawi.com Volume 2018
Hindawiwww.hindawi.com Volume 2018
Chemical EngineeringInternational Journal of Antennas and
Propagation
International Journal of
Hindawiwww.hindawi.com Volume 2018
Hindawiwww.hindawi.com Volume 2018
Navigation and Observation
International Journal of
Hindawi
www.hindawi.com Volume 2018
Advances in
Multimedia
Submit your manuscripts atwww.hindawi.com