Embed Size (px)
Citation preview
Optimization on proportion for recycled aggregate inconcrete using two-stage mixing approach
Author
Tam, Vivian WY, Tam, CM, Wang, Y
Published
2007
Journal Title
Construction and Building Materials
DOI
https://doi.org/10.1016/j.conbuildmat.2006.05.040
Copyright Statement
© 2007 Elsevier. This is the author-manuscript version of this paper. Reproduced in accordancewith the copyright policy of the publisher. Please refer to the journal's website for access to thedefinitive, published version.
Downloaded from
http://hdl.handle.net/10072/15031
Link to published version
http://www.elsevier.com/wps/find/journaldescription.cws_home/30405/description#description
Griffith Research Online
https://research-repository.griffith.edu.au

Optimization on Proportion for Recycled Aggregate in Concrete Using Two-Stage Mixing Approach
Vivian W. Y. Tam1*, C. M. Tam2 and Y. Wang3
Abstract
Recycled aggregate (RA) is well acknowledged having a poorer quality due to its higher porosity
resulted from cement mortar remains attaching to its surface that hampers the recycling rate of
concrete waste. Many previous researches recorded reduction in strength for concrete made with
RA. As a result, the use of RA is mainly confined to low-grade applications. Tam et al. [6]
proposed a two-stage mixing approach (TSMA) for improving the strength of recycled aggregate
concrete (RAC), by testing mixes with up to 30 percent RA replacement. This paper extends Tam
et al.’s work [6] by exploring RA substitutions ranging from 0 and 100 percent and compares
their performance with the traditional mixing procedure. Based upon the experimental works,
improvements on strength and rigidity of RAC using TSMA were compared with those of
traditional mixing procedure based on different percentages of RA replacements. The results
were then optimized using General Regression Neural Networks (GRNN) and RA replacements
of 25 to 40 percent and 50 to 70 percent were found to be optimal when TSMA was adopted. It
confirms the conservative recommendation of 20% RA substitution by many previous
researchers and public users.
Keywords: optimization, strength, recycled aggregate, concrete, construction
1* Corresponding Author, Lecturer, Griffith School of Engineering, Gold Coast Campus, Griffith University PMB50 Gold Coast Mail Centre, Queensland 9726, Australia. Email: [email protected] 2 Professor, Department of Building & Construction, City University of Hong Kong, 83 Tat Chee Avenue, Kowloon, Hong Kong. 3 Research Student, Department of Computer Science, Tsinghua University
1

Introduction
Sustainable development has been advocated all over the world [1]. ERL [2] indicated that the
amount of demolition debris dumped at landfill sites in the United Kingdom is in excess of 20
million tons per annum. The bulk of this material is concrete (50 to 55%) and masonry (30 to
40%) with only small percentages of other materials such as metals, glass and timber [3].
Recovery of these waste materials can reduce the consumption rate of landfill areas and natural
gravel resources.
In the Netherlands, about 14 million tons of building and demolishing wastes per annum are
produced, in which about 8 million tons are recycled, mainly for unbound road base courses [4].
National waste strategies in UK require increase in household waste recycling and recovery rates
and these measures will require the development of the infrastructure to support national high-
intensity recycling and composting schemes and the construction of at least 35 new municipal
wastes incinerators. Although 40% of demolition waste in the United Kingdom is recycled, they
are mainly used for low grade application such as fills and hardcore. Higher grade utilization
such as concrete has been discouraged by a lack of suitable specifications [5]. The demand from
low grade applications is almost saturated and a further increase in reuse must be realized
through other sectors of the building industry, such as aggregates for concrete.
This paper aims at the following objectives:
i) Study the extent of construction waste;
ii) Examination of the current obstacles on recycling concrete wastes;
iii) Comparison and analysis of recycled aggregate concrete (RAC) made from the two-stage
2

mixing approach (TSMA) developed by Tam et al. [6] with recycled aggregate (RA)
replacements ranging from 0 to 100 percent and that of the traditional mixing procedure;
and
iv) Optimization of percentages of RA replacements using TSMA by General Regression
Neural Networks (GRNN).
Obstacles in Using Recycled Aggregate
Although it is environmentally beneficial to use RA, the current legislation and experience,
however, are not sufficient to support and encourage recycling of demolished concrete waste.
These technical problems, include weak interfacial transition zones between cement paste and
aggregate, porosity and traverse cracks within demolished concrete, high level of sulphate and
chloride contents, impurity, cement remains, poor grading, high variations in quality, which
render the use of RA for structural applications difficult [7-8].
Two-Stage Mixing Approach
In order to improve the quality of recycled aggregate concrete, a mixing method: Two-Stage
Mixing Approach (TSMA) was developed by Tam et al. [6], which divides the mixing process
into two parts and proportionally splits the required water into two parts which are added after
mixing one part with fine and coarse aggregate and cement; while the normal mixing approach
only puts all the ingredients of concrete and mix them. Improvement of strength can be achieved
up to 21.19 percent for 20 percent of RA under 28-day curing conditions using TSMA as
recorded by Tam et al. [6].
3

Experimental Method
The experimental works by Tam et al. [6] was limited to 30 percent RA substitutions. This study
further explores RA replacement ratios of 40%, 50%, 60%, 70%, 80%, 90% and 100%
experimented under the normal mixing approach (NMA) and TSMA in addition to the
proportions of 0%, 5%, 10%, 15%, 20%, 25% and 30% previously recorded by Tam et al. [6].
The designated mix proportions follow the specifications of Buildings Department (BD) of the
Hong Kong Special Administrative Region [9] with 1:1.8:1.8:0.9 (ordinary Portland cement /
fine aggregate / 20mm coarse aggregate / 10mm coarse aggregate) with a water/cement ratio of
0.45 and grading requirements according to BS 882 [10].
The RA used for the experiments were collected from the Tuen Mun Area 38 recycling plant with
average absorption values of 1.65% for 20mm and 2.63% for 10mm aggregate. The quality of
RA is poorer than virgin aggregate (water absorption of virgin aggregate at 0.77% and 0.57% for
20mm and 10mm respectively), indicating that the major weakness of RA is its high porosity.
The compressive and flexural strengths of the mixes were then compared, which are the most
important mechanical properties of concrete in concrete mix design. Cubes of 100mm and
100mm x 500mm beams were used for testing the compressive and flexural strength
development respectively under the standard curing conditions for 7, 14, 28 and 56 days. Three
cubes and beams were tested at 7, 14, 28 and 56 days and then the average strength was taken,
according to BS 1881: Part 116 [11] and BS 1881: Part 118 [12] for compressive and flexural
strength respectively. Density of hardened concrete was also measured. Furthermore, the static
modulus of elasticity using cylinders of 100mm diameter under 28-day curing conditions were
4

examined based on BS 1881: Part 121 [13]. Three preloading cycles, using the same loading and
unloading rate, were used. One hundred and sixty-eight specimens of 500mm x 100mm beams,
cubes of 100mm and cylinders of 100mm diameter had been used for measuring the density,
compressive strength, flexural strength and modulus of elasticity respectively.
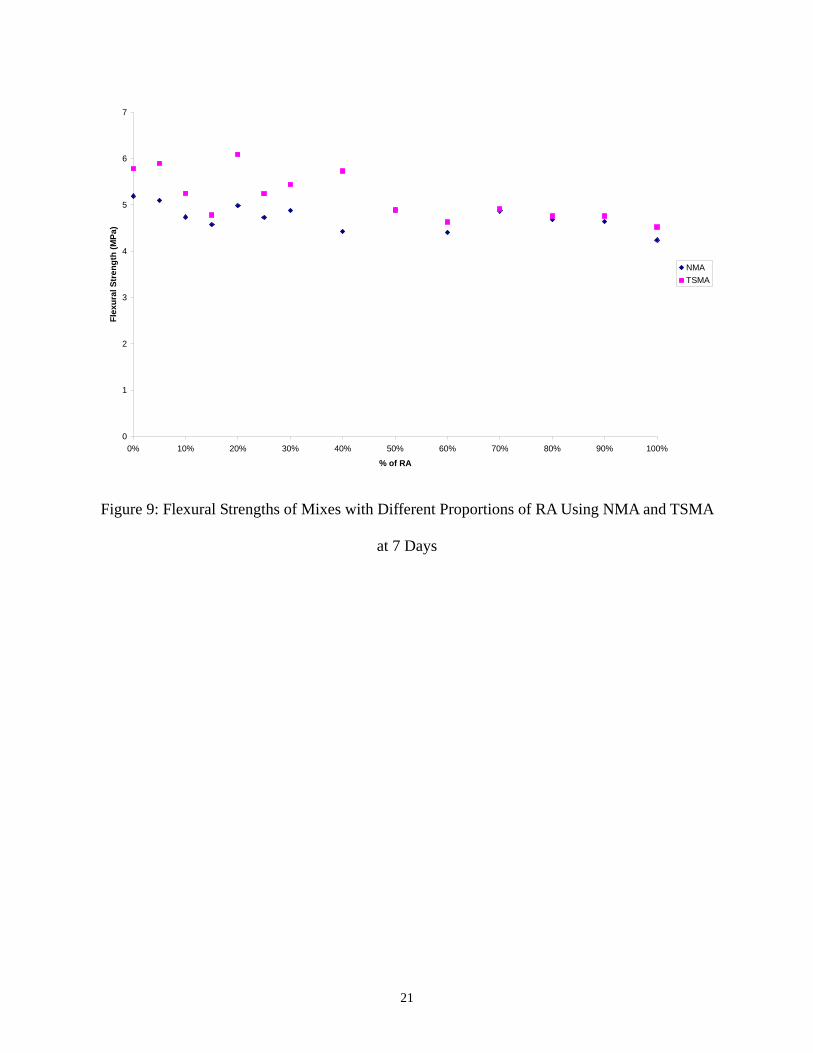
Experimental Results
All the mix proportions of recycled aggregate concrete mixed using TSMA and NMA were
collected with a slump of 75mm as required by BD [9]. The results of density, compressive
strengths, flexural strength and static modulus of elasticity to mixing with different proportions
of RA using NMA and TSMA are shown in Figures 1 to 4, Figures 5 to 8, Figures 9 to 12 and
Figure 13 respectively. A clear strength enhancement in using TSMA can be found when
compared with that of NMA.
<Figures 1-13>
In TSMA, during the first stage of mixing, the use of half of the required water for mixing leads
to the formation of a thin layer of cement slurry on the surface of RA which permeates into the
porous old cement mortar, filling up the old cracks and voids. In the second stage of mixing, the
remaining water is added to complete the cement hydration process. A stronger interfacial zone
(ITZ) is thus developed.
The quality of ITZ depends on the surface characteristics of the aggregate particles, the degree of
bleeding, chemical bonding and the specimen preparation technique which, however, are difficult
to measure. Although these effects have been reported by some investigators, the results are
5

difficult to reconcile. Nonetheless, it is generally agreed that as the paste-aggregate bond strength
increases, the concrete strength also increases [14]. Figure 14 illustrated the interfacial zone of
concrete using TSMA, which is much better than that of NMA shown in Figure 15.
<Figure 14>
<Figure 15>
Optimization on RA Proportions in Using TSMA
Because the proportions of RA replacement are taken in discrete sampling space, regression of
discrete experimental data into a continuous real function is important and necessary for further
analysis, like comparison, accumulation, and optimization. The crystallization of concrete is,
however, a complex physical-chemical process affected by many ingredients that are hard to
control, so the experimental data is usually inevitably noisy. In the some cases, large noises even
fake data with high frequency can be found. In comparing the two mixing methods, TSMA and
NMA, convictive continuous regression results were assumed so that the representative trends
amongst these noisy data could be modeled with robust mathematical methods.
After attempting various mathematical models including polynomial curve fitting, multi-layer
perceptron (MLP) and radial basis network (RBN) (all of which bear some problems in
analyzing the experimental results [15-17]), General Regression Neural Network (GRNN) was
found to work better in harmonizing the noises by introducing a normalized dot product weight
function to substitute the weighted sum in RBN [18]. It presents the improvement resulted from
different proportions of RA substitutions recorded in the various experimental results. The
modeling work is undertaken with Matlab version 7. Improvements of compressive strength,
6

flexural strength, and static modulus of elasticity of concrete samples mixed by TSMA and NMA
with respect of various percentages of RA substitutions and curing times are shown in Figures 16
to 19, Figure 20 to 23 and Figure 24 respectively. It can be seen that the values obtained by
TSMA are higher than those of NMA for any percentage of RA substitution.
<Figures 16 to 24>
The noise-tolerant regression, it can be used to compare TSMA with NMA quantitatively. The
percentage improvements’ of TSMA over NMA are shown in Figures 16 to 24. The local maxima
with different RA substitutions are also highlighted in each figure. The local maxima and their
improvement percentages are tabulated in Table 1.
<Table 1>
From the results of the compressive strength shown in Figures 16 to 19, it is clearly indicated
that around 25 to 40 percent of RA substitutions yield optimal properties using TSMA with
improvements of 17.39, 10.83, 17.68 and 12.70 percent in 7, 14, 28 and 56 days of curing [the
optimal RA percentages obtained were 37.37%, 36.36%, 24.24% and 39.39% in 7, 14, 28 and 56
days of curing respectively] (see Table 1). Another local maximum happens at around 55 to 70
percent of RA substitution with improvements of 11.93, 6.03, 7.82 and 9.13 percent of 58.59%,
68.69%, 58.59% and 56.57% of RA substitution after 7, 14, 28 and 56 days of curing
respectively.
Similar situations occurred in flexural strength and static modulus of elasticity. The optimal
points occurred at RA substitutions of 39.39%, 28.28%, 31.31% and 29.29% with improvements
7

in flexural strength of 21.79%, 21.54%, 7.59% and 12.86% at 7, 14, 28 and 56 days of curing
respectively (see Figures 20 to 23). At 31.31% of RA substitutions, an improvement of 14.35%
on static modulus of elasticity was recorded (see Figure 24). Furthermore, improvements in
flexural strength of 3.56%, 9.38%, 2.25% and 2.40% with RA substitutions of 60.61%, 60.61%,
69.70% and 67.68% at 7, 14, 28 and 56 days of curing are recorded respectively. An
improvement in static modulus of elasticity of 12.07% with RA substitution of 46.46% was also
recorded.
With the inherent weakness of RA including high porosity, high amounts of cracks, high level of
impurity and high cement mortar remains, the mechanical properties of RAC are affected, which
is thus limited to lower-grade applications. The pre-mix process can provide a better interfacial
behaviour between the aggregate and cement paste. This study has identified that the optimal
proportions of RA when using TSMA is around 25 to 40 percent and 50 to 70 percent of RA
substitution. Therefore, the current regulation in Hong Kong and other countries limiting the
adoption of 20 percent of RA substitution is on the conservative side. The use of TSMA can
allow higher percentages of RA substitution.
Conclusion
Recycled aggregate is strongly advocated by the Hong Kong government such as the motives of
setting up the centralized recycling plant, issuance of practice guidelines, specification and
technical circulars in guiding the use of recycled aggregate. The porous nature of recycled
aggregate reduces the mechanical properties of the recycled aggregate concrete. A series of full
scale experiments testing RA substitution between 0 and 100 percent is reported in this paper.
8

Optimization of RA substitution is modeled. Around 25 to 40 percent of RA substitution is found
to be most favourable in using TSMA. Further, around 50 to 70 percent of RA replacement can
also give some improvement although the enhancements are less significant when compared with
that of 25 to 40 percent.
Acknowledgments
The work described in this paper was fully supported by a grant from the Housing Authority
Research Fund of the Hong Kong Special Administrative Region, China (Project Ref. No.
9460004).
References
[1]. Kawano H. The state of reuse of demolished concrete in Japan. Integrated design and
environmental issues in concrete technology: proceedings of the International Workshop
'Rational Design of Concrete Structures under Severe Conditions': Hakodate, Japan, 7-9
August 1995, London: E & FN Spon, 1995: p. 243-249.
[2]. ERL (Environmental Resources Limited). Demolition waste, Construction Press Limited,
Lancaster, England, 1980.
[3]. Mulheron M. The recycling of demolition debris: current practice, products and standards in
the United Kingdom. Demolition and reuse of concrete and masonry: reuse of demolition
waste, London: Chapman and Hall,1988, p. 510-519.
[4]. Hendriks CF. Certification system for aggregates produced from building waste and
demolished buildings. Environmental aspects of construction with waste materials:
proceeding[s] of the International Conference on Environmental Implications of Construction
9

Materials and Technology Developments, Maastricht, the Netherlands, 1-3 June 1994, p.
821-834.
[5]. Collins RJ. Reuse of demolition materials in relation to specifications in the UK. Demolition
and reuse of concrete and masonry: guidelines for demolition and reuse of concrete and
masonry: proceedings of the Third International RILEM Symposium on Demolition and
Reuse of Concrete Masonry, held in Odense, Denmark, 24-27 October 1993, London: E &
FN Spon, 1993, p. 49-56.
[6]. Tam WYV, Gao XF, Tam CM. Micro-structural analysis of recycled aggregate concrete
produced from two-stage mixing approach. Cement and Concrete Research 2005;35(6):1195-
1203.
[7]. Chan CY, Fong FK. Development in recycling of construction and demolition materials.
Civil Engineering Department, Hong Kong, Homepage, available at
http://www.ced.gov.hk/eng/services/recycling/development.pdf, 2002.
[8]. Kawano H. Barriers for sustainable use of concrete materials. Concrete technology for a
sustainable development in the 21st century, London: New York: E & FN Spon, 2000, p. 288-
293.
[9]. BD (Buildings Department). Practice note for authorized persons and registered structural
engineers: use of recycled aggregates in concrete. Hong Kong, 2003.
[10]. BS 882. Specification for aggregates from natural sources for concrete, British Standards
Institution, London, United Kingdom, 1992.
[11]. BS 1881: Part 116. Method for determination of compressive strength of concrete cubes,
British Standards Institution, London. United Kingdom, 1983.
[12]. BS 1881: Part 118. Method for determination of flexural strength. British Standards
10

Institution, London. United Kingdom, 1983.
[13]. BS 1881: Part 121. Method for determination of static modulus of elasticity in
compression. British Standard Institution. United Kingdom, 1983.
[14]. Mindess JF, Young DD. Concrete. Upper Saddle River, NJ: Prentice Hall, 2003.
[15]. Cybenko G. Approximation by superpositions of a sigmoidal function. Mathematics of
Control, Signals, and Systems 1989;2:303-314.
[16]. Hartman EJ, Keller JD, Kowalski JM. Layered neura networks with Gaussian hidden
units as universal approximations. Neural Computation 1990;2(2):210-215.
[17]. Mitchell TM. Machine Learning. McGraw-Hill Companies, Inc, 1997.
[18]. Specht DF. A General Regression Neural Network. IEEE Transactions on Neural
Networks 1991;2(6):568-575.
11

Table 1: Local Maxima of Percentages of RA and Respective Improvement Percentages
Strength Curing conditions Local maxima (% of RA) Improvement when compared
with NMA (%) 7 days 6.06 37.37 58.59 10.54 17.39 11.93
14 days 10.10 36.36 68.69 10.23 10.83 6.03 28 days 24.24 58.59 81.82 17.68 7.82 3.03
Compressive strength
56 days 39.39 56.57 12.70 9.13 7 days 2.02 22.22 39.39 60.61 12.79 14.00 21.79 3.56
14 days 28.28 60.61 90.91 21.54 9.38 8.44 28 days 31.31 69.70 94.95 7.59 2.25 3.29
Flexural strength
56 days 10.10 29.29 67.68 10.44 12.86 2.40 Static modulus
of elasticity 28 days 31.31 46.46 89.90 14.35 12.07 4.40
12

2300
2350
2400
2450
2500
2550
0% 10% 20% 30% 40% 50% 60% 70% 80% 90% 100%
% of RA
Den
sity
(kg/
m3)
NMATSMA
Figure 1: Density of Mixes with Different Proportions of RA Using NMA and TSMA at 7 Days
13

2300
2320
2340
2360
2380
2400
2420
2440
0% 10% 20% 30% 40% 50% 60% 70% 80% 90% 100%
% of RA
Den
sity
(kg/
m3)
NMATSMA
Figure 2: Density of Mixes with Different Proportions of RA Using NMA and TSMA at 14 Days
14

2300
2320
2340
2360
2380
2400
2420
2440
2460
0% 10% 20% 30% 40% 50% 60% 70% 80% 90% 100%
% of RA
Den
sity
(kg/
m3)
NMATSMA
Figure 3: Density of Mixes with Different Proportions of RA Using NMA and TSMA at 28 Days
15

2280
2300
2320
2340
2360
2380
2400
2420
0% 10% 20% 30% 40% 50% 60% 70% 80% 90% 100%
% of RA
Den
sity
(kg/
m3)
NMATSMA
Figure 4: Density of Mixes with Different Proportions of RA Using NMA and TSMA at 56 Days
16

0
10
20
30
40
50
60
0% 10% 20% 30% 40% 50% 60% 70% 80% 90% 100%
% of RA
Com
pres
sive
Str
engt
h (M
Pa)
NMATSMA
Figure 5: Compressive Strengths of Mixes with Different Proportions of RA Using NMA and
TSMA at 7 Days
17

0
10
20
30
40
50
60
70
0% 10% 20% 30% 40% 50% 60% 70% 80% 90% 100%
% of RA
Com
pres
sive
Str
engt
h (M
Pa)
NMATSMA
Figure 6: Compressive Strengths of Mixes with Different Proportions of RA Using NMA and
TSMA at 14 Days
18

0
10
20
30
40
50
60
70
0% 10% 20% 30% 40% 50% 60% 70% 80% 90% 100%
% of RA
Com
pres
sive
Str
engt
h (M
Pa)
NMATSMA
Figure 7: Compressive Strengths of Mixes with Different Proportions of RA Using NMA and
TSMA at 28 Days
19

0
10
20
30
40
50
60
70
80
90
0% 10% 20% 30% 40% 50% 60% 70% 80% 90% 100%
% of RA
Com
pres
sive
Str
engt
h (M
Pa)
NMATSMA
Figure 8: Compressive Strengths of Mixes with Different Proportions of RA Using NMA and
TSMA at 56 Days
20
0
1
2
3
4
5
6
7
0% 10% 20% 30% 40% 50% 60% 70% 80% 90% 100%
% of RA
Flex
ural
Str
engt
h (M
Pa)
NMATSMA
Figure 9: Flexural Strengths of Mixes with Different Proportions of RA Using NMA and TSMA
at 7 Days
21

0
1
2
3
4
5
6
7
8
0% 10% 20% 30% 40% 50% 60% 70% 80% 90% 100%
% of RA
Flex
ural
Str
engt
h (M
Pa)
NMATSMA
Figure 10: Flexural Strengths of Mixes with Different Proportions of RA Using NMA and TSMA
at 14 Days
22

0
1
2
3
4
5
6
7
8
0% 10% 20% 30% 40% 50% 60% 70% 80% 90% 100%
% of RA
Flex
ural
Str
engt
h (M
Pa)
NMATSMA
Figure 11: Flexural Strengths of Mixes with Different Proportions of RA Using NMA and TSMA
at 28 Days
23

0
1
2
3
4
5
6
7
8
0% 10% 20% 30% 40% 50% 60% 70% 80% 90% 100%
% of RA
Flex
ural
Str
engt
h (M
Pa)
NMATSMA
Figure 12: Flexural Strengths of Mixes with Different Proportions of RA Using NMA and TSMA
at 56 Days
24

0
5000
10000
15000
20000
25000
30000
35000
40000
0% 10% 20% 30% 40% 50% 60% 70% 80% 90% 100%
% of RA
Mod
ulus
of E
last
icity
[N(m
m2)
-1]
NMATSMA
Figure 13: Modulus of Elasticity of Mixes with Different Proportions of RA Using NMA and
TSMA
25

Aggregate
New ITZ
Cement Mortar
Figure 14: Interfacial Zone for TSMA
26

Cement Mortar
Poorer New ITZ
Aggregate
Figure 15: Poorer New Interfacial Zone for NMA
27

Figure 16: Improvement on Compressive Strength with 7-Day Curing
28

Figure 17: Improvement on Compressive Strength with 14-Day Curing
29

Figure 18: Improvement on Compressive Strength with 28-Day Curing
30

Figure 19: Improvement on Compressive Strength with 56-Day Curing
31

Figure 20: Improvement on Flexural Strength with 7-Day Curing
32

Figure 21: Improvement on Flexural Strength with 14-Day Curing
33

Figure 22: Improvement on Flexural Strength with 28-Day Curing
34

Figure 23: Improvement on Flexural Strength with 56-Day Curing
35

Figure 24: Improvement on Static Modulus of Elasticity with 28-Day Curing
36