Embed Size (px)
Citation preview

1
Pre-print version 1
2
Delivery of floral resources and pollination services on farmland under three different wildlife-3 friendly schemes 4
Chloe J. Hardmana, Ken Norrisb, Tim D. Nevardc, Brin Hughesd, Simon G. Pottsa 5
6
aCentre for Agri Environmental Research, School of Agriculture, Policy and Development, University 7 of Reading, Reading, RG6 6AR, UK 8
bInstitute of Zoology, Zoological Society of London, Regents Park, London, NW1 4RY, UK 9
cResearch Institute for the Environment and Livelihoods, Charles Darwin University, Darwin, NT0909, 10 Australia 11
dConservation Grade, 2 Gransden Park, Abbotsley, Cambridgeshire PE19 6TY, UK 12
Corresponding author: Chloe J. Hardman [email protected] 13

2
Abstract 14
Management that enhances floral resources can be an effective way to support pollinators and 15 pollination services. Some wildlife-friendly farming schemes aim to enhance the density and 16 diversity of floral resources in non-crop habitats on farms, whilst managing crop fields intensively. 17 Others, such as organic farming, aim to support ecological processes within both crop and non-crop 18 habitats. How effective these different approaches are for supporting pollination services at the 19 farm scale is unknown. We compared organic farming with two non-organic wildlife-friendly 20 farming schemes: one prescriptive (Conservation Grade, CG) and one flexible (Entry Level 21 Stewardship, ELS), and sampled a representative selection of crop and non-crop habitats. We 22 investigated the spatial distribution and overall level of: i) flower density and diversity, ii) pollinator 23 density and diversity and iii) pollination services provided to Californian poppy (Eschscholzia 24 californica) potted phytometer plants. Organic crop habitats supported a higher density of flowers, 25 insect-wildflower visits, and fruit set of phytometers than CG or ELS crop habitats. Non-crop 26 habitats supported a higher density of flowers and insect-flower visits than crop habitats on CG and 27 ELS farms. Pollination services were higher on organic farms overall compared to CG or ELS. 28 Pollinator diversity and density did not differ between schemes, at the point or farm level. CG farms 29 received the highest total number of insect-wildflower visits. The findings support organic farming 30 practices that increase floral resources in crop habitats, such as sowing clover or reduced herbicide 31 usage, as mechanisms to enhance pollination services. However trade-offs with other ecosystem 32 services are likely and these are discussed. The findings support the CG scheme as a way of 33 supporting pollinators within farms where high wheat yields are required. 34
35
Keywords: Agri-environment scheme; bees; ecosystem services; flowers; organic farming; pollinator; 36 phytometer. 37

3
1. Introduction 38
Declines in the abundance, diversity or ranges of insect pollinators have been documented in Britain 39 (Ollerton et al., 2014), China (Xie et al., 2008), Europe (Nieto et al., 2014), and North America 40 (Cameron et al., 2011). Key threats affecting pollinators include habitat loss, agrochemical use, 41 climate change, disease, invasive species and their interactions (Potts et al. 2010, Vanbergen et al., 42 2013, Goulson et al. 2015, Kerr et al., 2015). In addition to species conservation concerns, these 43 declines put pollination services at risk, which are important for 78% of wild plants (Ollerton et al., 44 2011) and 75% of crops (Klein et al., 2007). Demand for crop pollination in Europe has increased 45 faster than honeybee stocks, increasing the dependency on wild pollinators for crop production 46 (Breeze et al., 2014). In Sweden, red clover seed yield has declined and become more variable, most 47 likely due to the homogenisation of the bumblebee visitor community (Bommarco et al. 2012). 48 Parallel declines in insect-pollinated plants, bees and hoverflies have been documented in the UK 49 and the Netherlands, suggesting that insect-pollination services to wildflowers have declined 50 (Biesmeijer et al., 2006). However these declines have slowed since 1990, which may be due to 51 conservation efforts (Carvalheiro et al., 2013). 52
53
To mitigate declines in pollinators and associated pollination services, the limiting resources or risk 54 factors affecting pollinator populations need to be addressed. Policy responses that benefit 55 pollinators have so far focused on reversing habitat loss, particularly enhancing floral resources. 56 Floral resources are considered to be a major limiting factor for bee populations (Roulston and 57 Goodell, 2011) and have declined over the 20th century in the UK (Carvell et al. 2006). Areas 58 managed to enhance floral resources tend to support a higher density and/or diversity of pollinating 59 insects (Carvell et al., 2007, Haaland et al., 2011) and have been associated with higher densities of 60 bumblebee nests (Wood et al., 2015a). How effective floral resource enhancement is for pollinators 61 depends not only on the density and diversity of flowers, but also on the ecological contrast that the 62 management creates. Ecological contrast describes how far a resource is improved compared to a 63 control and compared to the surrounding landscape (Scheper et al. 2013). 64
65
It is possible that floral resource enhancement could improve pollination services. Floral resources 66 can influence pollination services through attracting more pollinators to the target plants (Ebeling et 67 al., 2008). This is an example of facilitation: when the surrounding floral display attracts pollinators 68 and increases visitation to the target plant. Multi-species plant assemblages have been found to 69 enhance visitation and pollination up to a threshold, above which the surrounding flowers compete 70 with the target species for pollinator visits (Ghazoul, 2006). Local weed diversity (Carvalheiro et al., 71 2011), proximity of semi-natural habitat (Garibaldi et al., 2011, Martins et al., 2015), creation of 72 sown flower strips (Blaauw and Isaacs, 2014) and traditional hay meadow management (Albrecht et 73 al., 2007) have all been found to enhance pollination services in the local vicinity. 74
75
The main tools in Europe for enhancing floral resources in agriculturally dominated landscapes are 76 wildlife-friendly farming schemes, which include both EU-funded governmental agri-environment 77 schemes and market-funded certification schemes. These schemes vary widely in their objectives 78 and management requirements. Most agri-environment schemes focus on managing land out of 79 production rather than focusing on within-crop practices. For example, the English governmental 80 scheme, Environmental Stewardship (ES), provides a number of options for enhancing floral 81

4
resources in non-crop habitats. ES had two tiers of whole-farm schemes: Entry Level Stewardship 82 (ELS), a flexible basic scheme and Higher Level Stewardship (HLS), a competitive scheme targeting 83 regions containing high priority natural features. Farmers chose from a menu of management 84 options which each had a payment rate, which in ELS was calculated using a points system. These 85 schemes can be applied to both conventional and organic agricultural systems. In 2013, ELS covered 86 64.6% of England’s agricultural land area, organic ELS covered 3.4% and HLS covered 18.4% (Natural 87 England, 2013). In ELS, the option considered most beneficial for pollinators was sown blocks of 88 legume based nectar flower mixture (Carvell et al., 2007, Breeze et al., 2014). HLS had a similar 89 nectar flower mixture, plus options for floristically enhanced grass buffer strips and maintenance, 90 restoration and creation of species-rich meadows. The adoption of floral resource enhancement 91 options has been higher in HLS (73,126 ha) than in ELS (2,883 ha, Natural England, 2011), likely due 92 to the wide choice of management options available to ELS participants. This high degree of farmer 93 choice reduced the potential of ELS to provide the greatest benefit to pollinators (Breeze et al., 94 2014). 95
96
Creating minimum management requirements that benefit pollinators is one way of encouraging 97 farmers to implement options that provide the greatest benefits to wildlife. This is the approach 98 taken by Conservation Grade (CG), a biodiversity-focused farming protocol, which is funded through 99 sales of ‘Fair to Nature’ branded food products (http://www.conservationgrade.org). Farmers are 100 required to provide wildlife habitat on at least 10% of the farmed area, of which 4% must be pollen 101 and nectar rich habitat. Given this protocol, we expect non-crop habitats on CG farms to contain 102 more floral resources, higher local pollinator density and diversity and higher pollination services 103 than non-crop habitats on ELS farms. 104
105
Another strategy to make agriculture more wildlife friendly is through organic farming practices. 106 These aim to promote ecological processes that aid production; therefore organic farming applies 107 agroecological management to cropped areas more often than non-organic farming. This includes 108 the use of legumes to build soil fertility and restrictions on pesticide inputs to encourage natural 109 enemies. The spatial difference, within the farm, in the allocation of agri-environmental 110 management between organic and non-organic farms in England is demonstrated by the national 111 patterns of ELS option uptake. Organic farms were eight times more likely to undersow spring 112 cereals with a 10% legume mix, and non-organic farms were three times more likely to take a field 113 corner out of management (Natural England, 2011). Furthermore, organic management of crops is 114 associated with a higher diversity and abundance of plants (Fuller et al., 2005). Therefore, we 115 expect to find a higher level of floral resource, a higher density and diversity of bees (as found by 116 Holzschuh et al. 2007) and a higher level of pollination service in organic crops compared to non-117 organic crops. 118
119
In this study we compared three contrasting wildlife-friendly farming schemes in England: organic 120 farming, Conservation Grade (CG), and Entry Level Stewardship (ELS). ELS was the baseline scheme 121 in which all study farms participated. From here on, farms in ELS only are referred to as ELS, farms in 122 ELS+CG are referred to as CG and farms in organic ELS are referred to as organic. In our study, three-123 quarters of the CG and organic farms were also in HLS and the implications of this are discussed. By 124 studying farms managed under these schemes, we were able to compare organic and non-organic 125 approaches and prescriptive versus more flexible approaches towards scheme design. This is the 126

5
first comparison of how whole-farm agri-environment schemes compare in terms of floral resources, 127 pollinator density and diversity and pollination services, using a sampling approach that takes into 128 account the habitat composition of the farm. We aimed to answer two key research questions: 1) 129 How did floral resources, pollinators and pollination services to phytometers vary between crop and 130 non-crop habitats on farms in these three schemes and; 2) How did farm level floral resources, 131 pollinators and pollination services vary between the schemes? 132
133
2. Methods 134
2.1. Study sites 135
This study was carried out in July and August 2013 in southern England. Triplets of farms (one in 136 each scheme) were selected that matched as closely as possible in terms of landscape character, as 137 defined by Natural England’s National Character Areas, which are designated based on geological, 138 historical, landscape, economic and cultural character (Natural England, 2011), hereafter termed 139 regions. Matching was also based on soil type (NSRI 2011) and production type (the most common 140 commodities were cereals and beef, full list in Appendix A: Table A.1). Four suitable triplets were 141 found (Figure 1a). Farming intensity parameters collected during farmer interviews (nitrogen 142 application, number of insecticide products used and stocking density of livestock, Appendix A, Table 143 A.2) showed no differences between conventional CG and ELS farms. Farm size and number of crops 144 per farm did not differ between schemes (Appendix A). However farmer reported wheat yields and 145 field sizes measured from maps did differ significantly between schemes, with organic wheat yields 146 being significantly lower and field sizes significantly smaller than CG and ELS (appendix A). A high 147 number of our study farms were in HLS (three-quarters of the CG and organic farms). Over 99% of 148 the HLS options by area were for management of non-crop habitats. This means that when 149 interpreting differences between non-crop habitats on organic vs. ELS, and CG vs. ELS farms, we 150 should be aware that the HLS scheme may exaggerate these differences. 151
152
2.2 Habitat maps 153
Farm habitat maps were created in Arc GIS v.10 using cropping plans and Environmental 154 Stewardship (ES) maps (Figure 1b). ES habitats include those in ELS and HLS, which cover a range of 155 management options for arable and grassland, boundaries, historic and landscape features, 156 protection of soil and water resources and trees and woodland. Habitat maps were ground-truthed 157 using a handheld GPS enabled PC with Arc Pad software (accuracy ± 4 m). Hedgerows and tree lines 158 were mapped using Google maps aerial images (Google Maps, 2013). There were no significant 159 differences between schemes in habitat composition of the farms when habitats were grouped into 160 broad categories of ES field margin, ES grassland, improved grassland, mass flowering crop, non-161 mass flowering crop and other (Appendix A: Table A.3, A.4). 162
163
2.3. Landscape variables 164
The landscape scale effects of area of mass flowering crop and semi-natural habitat in a 1km radius 165 have been shown to affect bees and pollination services (Carvell et al. 2011, Holzschuh et al. 2011). 166 Therefore, these variables were measured through the ground truthing of the Land Cover Map 2007 167

6
(Centre for Ecology & Hydrology, 2011). There was no significant difference between schemes in the 168 proportion of semi-natural habitat (SNH) or mass flowering crop (MFC) in the 1 km buffers around 169 the farms (SNH: Friedman Chi2=1.5, p=0.47), MFC: Friedman Chi2=2.5, p=0.28). However, the 170 proportion of semi-natural habitat and mass flowering crop in a 1km radius around each sampling 171 point was highly variable, so was included in pollinator models, to account for the potentially 172 confounding influence of neighbouring off-farm habitat on the pollinator density observed in crop 173 and non-crop habitats on-farm. Two of the landscapes were simple (<20% semi-natural habitat) and 174 two were complex (>20% semi-natural habitat, Appendix, Table A.5). 175
176
2.4. Floral resource surveys 177
One floral resource sampling point was surveyed in every habitat type per farm. In addition, five 178 sampling points per farm were randomly allocated to hedgerows, to representatively sample this 179 highly variable linear habitat that is a common field boundary in England. The total number of 180 sampling points at which floral resources were recorded in each scheme was: ELS: 66, CG: 72, Org: 181 61. Each floral resource sampling point consisted of 1 m2 quadrats and transects. Only plants 182 considered rewarding to insects (Appendix B) were recorded. For hedgerows, a column of basal area 183 1 m2 and hedge height was surveyed and additional species occurring on the 25 m long x 1 m wide x 184 hedge height transect were recorded. For all other habitats, the number of floral units was recorded 185 in each of three 1 m2 quadrats. A central quadrat was placed at the randomly allocated point, then 186 another quadrat was placed 50 m north and another 50 m east, with the whole transect fitting 187 within the allocated habitat. Additional insect-rewarding plant species were recorded along the two 188 50 m x 1m transects between quadrats. 189
190
To estimate floral resource availability, we measured the density of open flowers. For composite 191 floral units (defined in Carvell et al. 2007), this involved dissecting three typical floral units to count 192 the number of open flowers. The mean number of open flowers per floral unit was multiplied by the 193 number of floral units to estimate open flower abundance per m2 (flower density). The average 194 flower density per species across the three quadrats was taken and the density per m2 of additional 195 species recorded on transects was added. For points with open flowers, the Shannon index was 196 used to calculate flower diversity. Only sampling points in non-crop habitats had sufficient open 197 flower species for diversity analysis. A diversity index was used because the relative density of 198 species surrounding the focal plant is likely to influence whether facilitation of pollination occurs 199 (Ghazoul, 2006). The main assumptions in these floral resource estimations are: i) that the 200 distribution of flowers in each habitat was homogeneous, and therefore the sampling plots are 201 representative of the whole habitat area, ii) that the number of open flowers in three floral units 202 was representative of the wider population. 203
204
2.5. Pollinator surveys 205
For pollinator surveys, a proportional stratified sampling design was used to represent the 206 composition of habitats on the farm. The area of each habitat on each farm was calculated in Arc 207 GIS. Then a weighting system was used to give areas of land in Environmental Stewardship (ES) a 208 greater representation in the proportional stratified sample. If stratified solely by area, small areas 209 of high value for biodiversity may have been missed. The habitats not in ES were given a weighting 210
7
of 1, whereas the ES habitats were weighted using the following equation: ES points or payment per 211 ha/ (85 x 0.9). This equation was used because the lowest number of points that any of the ES 212 options on these farms earned per ha was 85. Therefore the lowest scoring ES option had a 213 weighting of 1.05 and the weighting for other options increased proportionally up to the highest 214 scoring option which earned 485 points and received a weighting of 6.34. The proportion that each 215 habitat’s weighted area made of the summed weighted habitat areas for each farm was used to 216 assign the twelve sampling points to habitats. These points were then randomly plotted within 217 habitats using the ‘genrandompnts’ tool (Beyer 2012, (Figure 1b). 218
219
We focused on the density and species richness of bees and hoverflies, which are the main 220 functional groups of pollinators in Europe (Albrecht et al., 2012). For our phytometer species, bees 221 are considered to be the most important pollinator guild (Cook, 1962), but hoverfly visits have also 222 been observed (Wickens, J., personal communication). Pollinator sampling points consisted of three 223 pan trap sampling points 50 m apart and a 100 m observation transect between them, arranged as 224 for floral resource surveys. 225
226
Observation transects were used to assess bee and hoverfly density and wildflower visitation over a 227 constant sampling area. This method is recommended by Popic et al. (2013) for studying bee-flower 228 interactions. Transects 100 m long were walked at a constant speed over a period of 10 minutes, 229 and wild bees and honeybees (Apis mellifera L.) were observed within 2 m either side and in front of 230 the observer and recorded to the most accurate taxonomic level as possible. Specimens not easily 231 identified in the field were collected with a hand net for later identification under the microscope 232 using keys. Species level identification was achieved for 88% of bee observations on transects. 233 Bombus terrestris (L.) and B. lucorum (L.) (sensu lato) workers were recorded as B.terrestris/lucorum 234 because they cannot be reliably distinguished in the field. Wind speed was recorded using an 235 anemometer, cloud cover using visual scale of oktas and maximum temperature using a 236 thermometer. As far as possible, the UK Butterfly Monitoring guidelines for weather conditions for 237 transects were used (Pollard and Yates, 1993). The frequency and species identity of bee-flower 238 visits on transects was recorded. 239
240
At each pan trap sampling point, triplicate blue-white-yellow pan traps were set containing dilute 241 soap solution. This method was used to assess bee species richness since this is considered less 242 subjective than net sampling for small solitary bees (Westphal et al., 2008). Contents of pan traps 243 were collected after 24 hours. All three farms in a landscape were sampled as close together in time 244 as possible, normally over a period of four days for logistical reasons. Bees were frozen and then 245 identified to species using the keys of Else (In press) for solitary bees and Prŷs-Jones & Corbet (2011) 246 for bumblebees. Hoverfly species richness was not assessed due to time constraints. 247
248
2.6. Pollination service surveys 249
Ten of the twelve pollinator sampling points also had phytometers present. Phytometers are potted 250 plants that are self-incompatible and insect pollinated. Californian poppy (Eschscholzia californica, 251 Cham.) plants were used as phytometers to measure pollination services. Phytometers have been 252

8
shown to be a consistent and cost effective method for measuring pollination services (Woodcock et 253 al., 2014). Californian poppy was chosen because it is an ornamental species not found in the 254 natural environment that performed well in field trials. This allowed us to standardise the 255 availability of pollen, which is important because it allows us to measure insect pollination services 256 in a way that is not affected by the distribution of a particular native plant species in the landscape. 257 It is an open-access flower accessible by a wide range of pollinators and so can be used as proxy of 258 ambient pollination services. 259
260
Phytometer sampling points were allocated using the same proportional stratified sampling design 261 used for pollinator surveys. The proportion of phytometer points in crop habitats was 53.6 % (ELS), 262 38.0 % (CG) and 47.0 % (Org). Phytometers were placed 50 cm apart at the central point. 263 Phytometers remained in pots which were partly sunk into the soil. Surrounding vegetation was 264 flattened within a 1 m radius to allow access to flowers by pollinators and prevent shading of the 265 phytometers. Phytometers were watered well on setting out, once during the exposure period and 266 once upon collection. 267
268
On setting out, phytometers were classified using a three point plant vigour score based on a visual 269 appraisal of health. Where livestock were in fields, phytometers were placed at field edges behind 270 fences. Where possible plants were arranged in a triangle, but if not possible they were arranged in 271 a line. Phytometers were exposed on-site for three weeks, after which they were collected and any 272 damage or drought was noted. They were then left in pollinator exclusion cages whilst fruit ripening 273 occurred. Fruit set, defined as the proportion of nodes which contained at least one developed 274 seed, along with the number of seeds per fruit were counted. 275
276
2.7. Data analysis 277
Sampling points were divided into crop and non-crop habitats to further investigate differences 278 between schemes, since organic farming affects the cropped areas of the farm, whereas the majority 279 of the ELS and CG schemes are focused on non-cropped areas. Crop habitats were defined as fields 280 reseeded annually with a crop other than grass, as part of an arable rotation. Grassland (including 281 grass/clover mixes), hedgerows, field margins, and other non-production areas were classified as 282 non-crop habitats. Improved grassland was not classified with crop habitats as ‘production area’ 283 because the differences between organic and non-organic systems are expected to be largest in 284 arable fields. 285
286
To compare floral resources, pollinators and pollination services among schemes we used 287 generalised linear mixed effects models (GLMMs) from the package lme4 (Bates et al., 2014) with 288 nested random effects (farms within regions). The probability of presence of floral resource, 289 pollinators and pollination service at the ten proportionally allocated sampling points were modelled 290 using GLMMs with binomial distributions, with scheme as a predictor variable. 291
292
9
Flower density was log+1 transformed and modelled using a GLMM with Gaussian errors. For flower 293 density models, heteroscedascity of residuals could not be reduced, so estimates and SE values are 294 reported from post-hoc tests as the p values were considered unreliable. Flower diversity was 295 analysed using a GLMM with a Gamma error distribution since it was positive continuous data. Total 296 floral resource at the farm scale was estimated by multiplying the habitat flower density by the 297 habitat area, summing across habitat types, and dividing by total farm area. Area of hedgerows was 298 estimated using length multiplied by a mean width of 1.93 m (data from 14 hedges in Berkshire and 299 Oxfordshire, Garratt, M.P. pers. comm.). 300
301
In order to reduce overdispersion, the GLMMs for density of bees and hoverflies used a log-normal 302 Poisson distribution (Elston et al., 2001) and for species richness of bees used a negative binomial 303 distribution. The covariates temperature, wind, cloud, proportion of mass flowering crop and 304 proportion of semi-natural habitat in 1km buffer around sampling points were include in pollinator 305 models. Number of bee species per scheme was rarefied to the minimum number of individuals per 306 scheme using the rarecurve function in the vegan package (Oksanen et al., 2015). 307
Full pollination service models included plant vigour score, proportion of semi-natural habitat and 308 mass flowering crop in a 1 km radius around sampling points, scheme type, and distance to nearest 309 field edge. The latter variable was included to account for the potentially confounding influence of 310 phytometers needing to be moved to the edge of fields to avoid livestock and farm operations more 311 on some farms than others. Survival in crop vs. non-crop habitats was marginally significantly 312 different between schemes (Non-crop habitats, Org: 61, CG: 59, ELS: 35, Chi2 (2) = 5.70, p=0.058). 313 Therefore, distance to nearest surviving phytometer (log transformed) was included in models to 314 account for the potential confounding effect of scheme on phytometer mortality. Fruit set was 315 modelled using a binomial GLMM and sampling point was included as a random effect. Due to 316 excess zeros and overdispersion in the number of seeds per plant data, a zero inflated negative 317 binomial (ZINB) model (Zuur et al., 2009) was used. Data were summed at the sampling point level, 318 because random effects could not be incorporated into ZINB models. The full model included a term 319 for the number of surviving nodes at each sampling point. For testing correlations between flower 320 density and fruit set, a binomial error distribution was used. For testing correlations between flower 321 density and seed set, both variables were log+1 transformed and a Gaussian error distribution was 322 used. 323
324
Likelihood ratio tests (LRT Chi2) were used to test for the significance of scheme and the interaction 325 of habitat type (crop/non-crop) with scheme. We applied post-hoc simultaneous tests for general 326 linear hypotheses (from the multcomp package, Hothorn et al., 2008), using contrast matrices to test 327 for differences between crop and non-crop habitats within each scheme type and between schemes 328 within each habitat type. Data analysis was carried out using R version 3.1.2 (R Core Team, 2014). 329
330
3. Results 331
3.1.1. Spatial distribution of floral resources between habitats 332
The proportion of sampling points with insect-rewarding plants present was higher on organic 333 compared to ELS farms, (LRT Chi2 (2) = 9.552, p=0.008, Post-hoc test: Org>ELS: 0.001, Figure C.1). 334

10
However the proportion of sampling points with bees, hoverflies, insect-flower visits or fruit set 335 present did not vary between schemes (Appendix C, Table C.1). 336
337
The total floral resource from crop habitats (cereal and mass flowering crop) was higher on organic 338 farms (46 %) compared to CG (11 %) or ELS farms (0.28 %, Table 1), particularly due to the high 339 contribution from plants in mass flowering crop fields on organic farms. CG farms had the highest 340 average contribution from ES margin and grass habitats combined. ELS farms varied widely in the 341 spatial distribution of floral resources, with one having a particularly large area of floristically dense 342 grassland due to clover having being drilled into improved grass for silage. 343
344
The sampling points with the highest flower density in each scheme were all non-crop habitats: CG: 345 field corner, ELS: grass/clover ley and organic: low-input grassland. The plants which contributed the 346 most to each of these habitats were: CG field corner; 96% Tripleurospermum inodorum L. Sch.Bip. 347 (scentless mayweed), ELS grass/clover ley; 97% Trifolium pratense L. (red clover) and organic low 348 input-grassland; 75% Leucanthemum vulgare Lam. (oxeye daisy). 349
350
A range of organic crop habitats had open floral resources present, including cereals (arable silage, 351 einkorn, spelt, barley oats and wheat), and mass flowering crops (lucerne, lucerne/sanfoin silage, 352 clover and field beans, Table 1). The three plants with the highest open flower density in organic 353 crop habitats were Tripleurospermum inodorum, Trifolium repens L. (white clover) and Sinapis 354 arvensis L. (charlock). In organic crop fields, 84% of insect-rewarding flowers were from non-sown 355 species. The most common sown species with open flowers were white clover (9%) and lucerne 356 (6%). 357
358
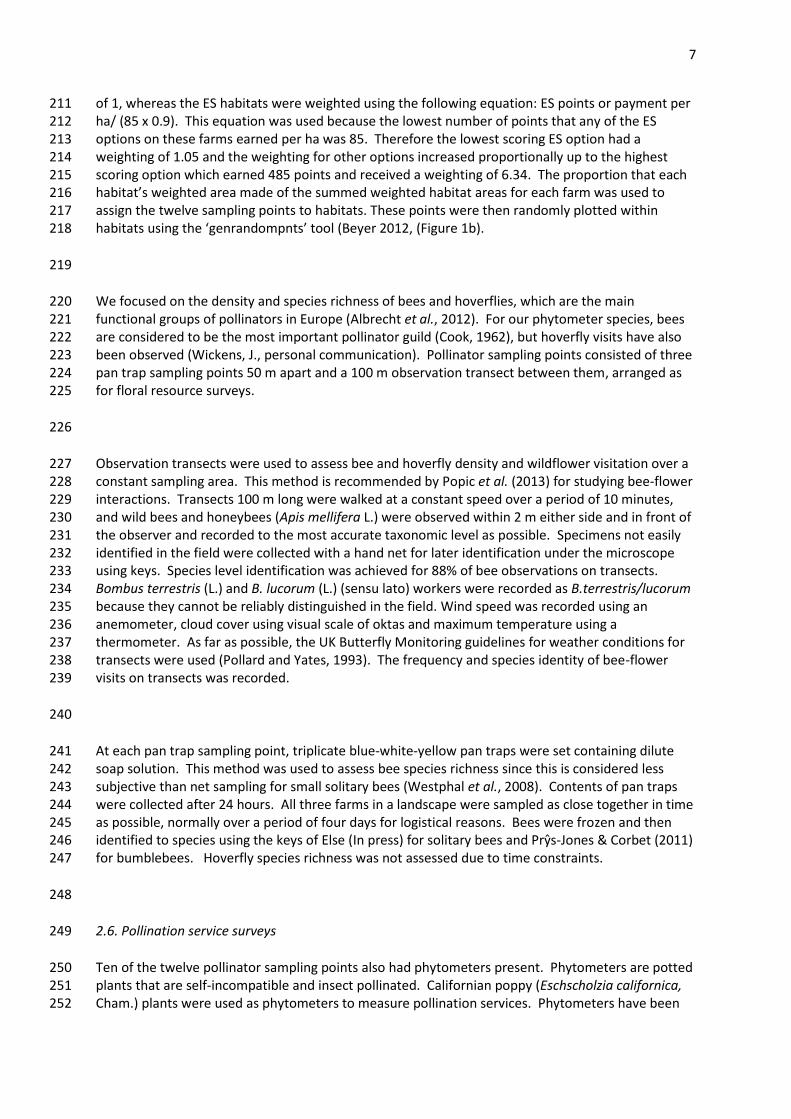
3.1.2. Differences between crop and non-crop habitats in flower density and diversity 359
There was a significant interaction between scheme and habitat type in explaining variation in 360 flower density (LRT Chi2(2) = 8.357, p=0.015, Figure 2a). Post-hoc tests revealed that flower density 361 was higher in non-crop habitat than in crop habitats on ELS (Estimate ±SE: 3.31 ±0.74) and CG farms 362 (3.59 ±0.79). Crop habitats supported a higher flower density on organic farms compared to ELS 363 (3.72 ±1.18) or CG farms (3.71 ±1.14). There were no significant differences between schemes in 364 flower Shannon diversity in non-crop habitats (LRT Chi2 (2) = 0.360, p=0.835, Figure 2b). 365
366
3.2.3. Differences between crop and non-crop habitats in pollinator density and diversity 367
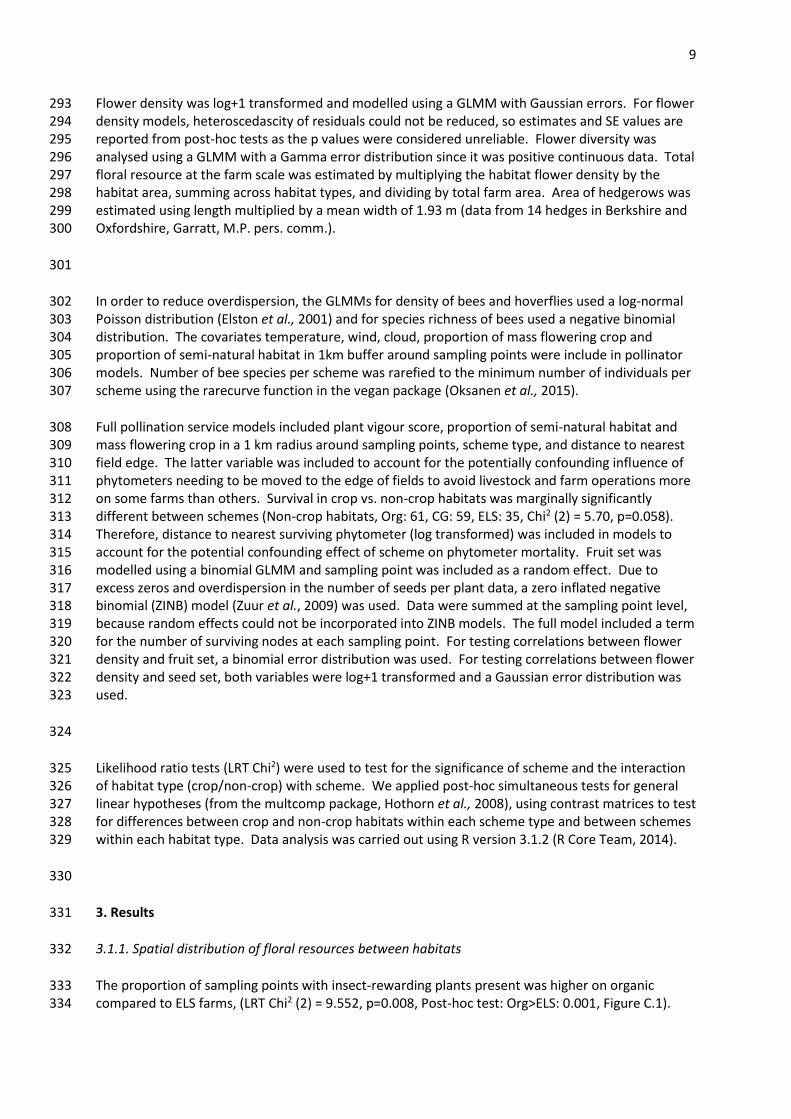
There were no significant interactions between scheme and habitat type (crop or non-crop) in 368 explaining bee species richness (LRT Chi2 (2) = 0.366, p=0.833, Figure 3a), hoverfly density (LRT Chi2 369 (2) = 1.082, p=0.582, Figure 3b) or bee density (LRT Chi2 (2) = 4.161, p=0.125, Figure 3c). There was a 370 significantly higher density of bees (LRT Chi2 (1) = 16.60, p<0.001) and species richness of bees (LRT 371 Chi2 (1) = 4.707, p=0.030) in non-crop habitats than in crop habitats overall. Habitat type did not 372 have a significant independent effect on hoverfly density (LRT Chi2 (1) = 0.162, p=0.688). 373

11
374
3.1.4. Differences between crop and non-crop habitats in insect-wildflower visitation 375
There was a significant interaction between scheme and habitat type in explaining density of 376 wildflower visits made by bees (LRT Chi2(2) = 11.65, p=0.003, Figure 3d). Post-hoc tests revealed 377 that on CG and ELS farms there were significantly more bee visits to wildflowers in non-crop 378 compared to crop habitats (CG: p<0.001, ELS: p<0.001) whereas on organic farms there were no 379 significant differences between crop and non-crop habitats (p=0.292). There was insufficient data 380 on density of hoverfly visits to be analysed. 381
382
3.1.5. Differences between crop and non-crop habitats in pollination services 383
There was an interaction between scheme and habitat type in explaining fruit set of phytometers 384 (LRT Chi2=10.79, p=0.005, Figure 4). Post-hoc tests revealed that organic crop habitats supported 385 significantly higher fruit set than CG crop habitats (p<0.001) or ELS crop habitats (p<0.001). In 386 addition, ELS non-crop habitats supported significantly higher fruit set than ELS crop habitats (p= 387 0.022). There was no significant interaction between habitat type and scheme in explaining seeds 388 per node per phytometer plant (LRT Chi2 = 1.018, df=2, p=0.601). 389
390
3.2 Farm level flower density, pollinator density, diversity and pollination service 391
3.2.1 Flower density 392
Flower density at the farm scale did not differ significantly between schemes (Friedman Chi2 = 1.5, df 393 = 2, p-value = 0.472). The gamma diversity (total species richness per farm) of open flowering plants 394 did not vary significantly between schemes (Friedman Chi2=2, df=2, p=0.368). 395
396
3.2.2. Pollinator density and species richness 397
In pan traps we recorded 52 bee species, and on transects we recorded 925 bee individuals and 386 398 hoverfly individuals. CG farms showed a weak tendency towards supporting a higher density of bees 399 on transects at the farm level, once an outlier with a particularly high density of honeybees on 400 restored organic heathland was removed, (Org=235, CG=283, ELS=243, Chi2(2)=5.214, p=0.074). ELS 401 farms supported a higher density of hoverflies overall (Org=113, CG=116, ELS=157, Chi2(2)=9.394, 402 p=0.009). At the point level, there were no significant differences in bee density (LRT Chi2 (2)=0.04, 403 p=0.98) or hoverfly density (LRT Chi2 (2)=0.523, p= 0.77) between schemes. 404
405
There was no significant difference in the total species richness of bees recorded in pan traps 406 between schemes (Org=36, CG=28, ELS=43, Chi2(2)=3.159, p=0.206). Rarefaction reduced 407 differences between schemes (Estimated species richness: ELS: 42.2 ± 0.869, Org: 34.3 ± 1.21, when 408 rarefied to the same level as CG: 28 species, 552 individuals). At the point level, there were no 409
12
significant overall differences between schemes in bee density (LRT Chi2 (2)=0.04, p=0.98), bee 410 species richness (LRT Chi2 (2)=4.38, p=0.219) or hoverfly density (LRT Chi2 (2)=0.523, p= 0.77). 411
412
3.2.3. Insect-wildflower visitation 413
The total number of bee visits to wildflowers at the farm scale differed significantly between 414 schemes, with CG farms supporting the highest number of insect-flower visits (Chi2(2) =8.603, 415 p=0.014, CG =217, ELS=160, Org=190) once the outlier was removed (one sampling point in organic 416 restored heathland with a high density of honeybees). The top three habitats for insect visitation 417 density were a naturally regenerated managed field corner on a CG farm (EF1), a floristically 418 enhanced margin on an organic farm (HE10), and a field margin with a high density of Centaurea 419 nigra L. (common knapweed) on an ELS farm. The majority of insect-wildflower visits were carried 420 out by wild bees (66%), followed by honeybees (20%), and hoverflies (14%). The red-tailed 421 bumblebee Bombus lapidarius (L.) made up 61% of all wild bee visits to wildflowers. Plants which 422 received particularly high numbers of visits were Erica tetralix L. (cross-leaved heather, mostly 423 visited by Apis mellifera at the heathland restoration point), Centaurea nigra, Cirsium arvense (L.) 424 Scop. (creeping thistle) and Chamerion angustifolium (L.) Holub (rosebay willowherb). 425
426
3.2.4. Pollination service 427
Survival of phytometers varied between schemes: Org: 97, CG: 89, ELS: 72, (Chi2 (2) = 13.4, p=0.002). 428 Survival was influenced by drought, damage by farm machinery and herbicide spraying. Farm type 429 had a marginally significant effect on farm level of fruit set per plant (Mean fruit set (%) ± SE: Org = 430 72.5 ± 2.9, CG = 56.6 ± 3.6, ELS = 51.9 ± 4.4, LRT Chi2(2) = 5.773, p=0.056) and organic farms 431 supported higher fruit set than ELS and CG (Post-hoc test: Org>ELS, p=0.011, Org>CG, p=0.021). 432 Seeds per node per plant was not significantly affected by scheme Chi2 (2)=3.034, p=0.219). 433
434
Floral resource density had a significant positive effect on fruit set (LRT Chi2(1) = 164, p<0.001), but 435 only explained 16% of the variation (marginal R2 = 0.159, conditional R2 = 0.205). Variation in seeds 436 per node per plant was not significantly related to surrounding flower density (LRT Chi2(1) = 1.288, 437 p=0.257). 438
439
4. Discussion 440
4.1. Spatial distribution of floral resources, pollinators and pollination services 441
On organic farms, we found that a greater proportion of the farm had floral resources present in July 442 and August, since both crop and non-crop habitats delivered floral resources. The greater density of 443 flowering plants in organic crop fields was consistent with other studies (Fuller et al., 2005, 444 Holzschuh et al., 2008). Pollination service and bee-wildflower visits were higher in organic crop 445 fields compared to non-organic crop fields. This is in line with findings that organic farming 446 disproportionately benefits insect-pollinated plants (Gabriel and Tscharntke, 2007, Power et al., 447 2012, Batáry et al., 2013). However, in contrast to other studies (Rundlöf et al., 2008, Holzschuh et 448

13
al., 2007), we did not find a higher species richness or density of bees in organic crop fields. This 449 may be because the pan trap and transect methods intercepted pollinators flying through the 450 habitat, rather than only recording pollinators using the habitat. The moderating effect of landscape 451 context could also explain the low effect size for organic farming on species richness and density of 452 bees in our study. Positive effects of organic farming on bee abundance and species richness have 453 been found in homogeneous landscapes (>60% arable land) but not in heterogeneous landscapes 454 (15-16% arable land) in Sweden (Rundlöf et al., 2008). In our study the proportion of arable land in a 455 1km radius buffer around our farms was 7- 36%, which is relatively low compared to the Swedish 456 study. This will have reduced the ecological contrast in floral resources that the schemes created 457 compared to the surrounding landscapes. 458
459
CG and ELS farms supported a significantly higher density of flowers and insect-wildflower visits in 460 non-crop habitats compared to crop habitats, which was consistent with Pywell et al., (2005). We 461 expected non-crop habitats on CG and organic farms to have higher floral resource densities than 462 those on ELS farms, since three-quarters of the CG and organic farms had HLS scheme managed non-463 crop areas. Wood et al., (2015b), found higher floral abundance on HLS farms implementing flower-464 rich margin options compared to ELS farms not implementing such options. However, flower density 465 was not higher in CG compared to ELS non-crop habitats in our study. This appears to have been 466 because some of the ELS farms in our study supported high non-crop densities of floral resource in 467 habitats such as field corners (EF1), buffer strips (EE3), and improved grass/clover leys. However, 468 after field surveys, one ELS farm removed the arable buffer strips (EE3) which contributed a high 469 density of Centaurea nigra and insect-flower visits. This demonstrates the vulnerability of habitats in 470 flexible schemes such as ELS, compared to more prescriptive schemes such as CG and longer-term 471 agreements such as HLS. 472
473
4.2. Farm level of floral resource, pollinators and pollination services 474
Farm level floral resource provision and pollinator diversity did not differ significantly between 475 schemes, contrary to expectations. However, CG farms supported a significantly higher overall 476 number of bee-flower visits, showing that the more prescriptive pollinator management was 477 successfully attracting foraging bees. This emphasises the importance of prescriptive non-crop 478 habitats, in addition to organic farming as measures to help reverse species declines in agricultural 479 ecosystems. 480
481
Our results suggest that the benefits of organic farming for pollination services were mediated more 482 by the enhancement of local floral resources than by enhancement of the local density and/or 483 diversity of pollinators. Our results concur with those of Power and Stout, (2011) who found that 484 organic farms supported a higher floral abundance and higher level of pollination service to 485 hawthorn (Crataegus monogyna Jacq.). Facilitation of pollination services by nearby floral resources 486 has also been found for weeds in sunflower crops (Carvalheiro et al., 2011) and uncultivated areas 487 next to oilseed rape crops (Morandin and Winston, 2006). 488
489
4.3 Implications for management 490
14
Our study took place in the later stage of the pollinator season in the UK, after the majority of the 491 mass flowering crop (oilseed rape) had flowered. This time of year tends to be when bee 492 populations are most limited by floral resource (Persson and Smith, 2013). Our results emphasise 493 the importance of managed non-crop habitat areas (such as floristically enhanced margins which 494 received the highest density of insect visits in this study) and organic crop areas in providing floral 495 resources for pollinators at this time of year. Further work will examine how the relative 496 contributions of different habitats in the farmed landscape changes throughout the season. 497
498
Organic farming supported an ecosystem service (pollination) to a greater extent than non-organic 499 wildlife-friendly farming schemes in our study. Organic farming is an example of ecological 500 intensification: the shift towards managing ecosystem services to support agricultural production 501 and away from synthetic inputs (Bommarco et al., 2013). This type of management will result in 502 trade-offs and synergies for different ecosystem services. We found enhanced pollination services 503 at the farm scale on organic farms and a greater floral resource in organic crop habitats. The 504 management practices which are likely to have contributed (legume cropping and reduced herbicide 505 use) are likely to create synergistic benefits for soil fertility (Watson et al., 2002) and weed seed 506 predation (Diekötter et al., 2010). Management practices commonly used in organic farming, such 507 as reduced herbicide use and sowing clover, are likely to be beneficial in non-organic systems for 508 supporting pollination services at both farm and landscape scales. 509
510
When considering management for pollination services, it is important to consider trade-offs with 511 other ecosystem services. Wild plants in crop fields could enhance ecosystem services (pollination, 512 pest control by natural enemies, nitrogen fixation) or provide disservices to crop production 513 (competition for resources with the crop, supporting pests). Determining economic thresholds for 514 weed tolerance in different crops is an important area of future research, and one factor to take into 515 account is the pollinator dependence of the crop (Deguines et al., 2014). There are potentially 516 opposing effects of weeds on yields for insect-pollinator-dependent vs. independent crops 517 (Bretagnolle and Gaba, 2015). Although our study was not designed to look at yields, farm intensity 518 data collected through farmer interviews revealed that organic winter wheat yields were 519 significantly lower than CG and ELS (winter wheat tonnes/ha mean ± SE , ELS: 7.00 ± 0.23, CG:8.04 ± 520 0.30, Org: 3.06 ± 0.17, Appendix A, Table A.2). Larger sample sizes show the yield gap for winter 521 wheat in England and Wales averaged 50% between 2009-2014 (Moakes, Lampkin & Gerrard 2015, 522 full list of reports in Appendix C). Where farm management aims to support high wheat yields and 523 pollinators within the same farm, our results suggest the CG scheme is likely to be more appropriate. 524
525
Deciding which wildlife-friendly farming scheme individual farms should enter is a process that 526 needs to be spatially optimised at both landscape and national scales. Factors to consider include 527 landscape level biodiversity and food production targets, starting conditions and the productivity of 528 the land. Spatial targeting is being used for both tiers in the new Countryside Stewardship scheme 529 which is replacing Environmental Stewardship (Natural England, 2015) and this process has potential 530 to be improved through better data and models. Our study stimulates further research questions on 531 which schemes or management practices will optimise pollination services to specific crops and 532 stimulates debate about potential trade-offs between managing for insect-pollinator dependent and 533 independent crops. This will involve consideration of how best to facilitate crop conspecific pollen 534

15
transfer and reduce potential pollen competition between crop plants and co-flowering species 535 (Schüepp et al., 2014). 536
537
5. Conclusion 538
Our research has explored three contrasting approaches towards management of biodiversity and 539 ecosystem services in agricultural landscapes. The most holistic approach (organic) supported the 540 highest level of pollination service, and the most prescriptive non-organic approach (CG) supported 541 the highest farm level density of insect visits, but these were more concentrated in non-crop areas. 542 The basic, flexible approach (ELS) still supported high flower densities in non-crop habitats and a 543 similar farm level pollination service to the CG scheme. Our work furthers the understanding of how 544 different habitat elements under contrasting wildlife-friendly farming schemes support pollination 545 services. 546
547
Acknowledgements 548
We would like to thank land owners and farmers for access and Harold Makant for site selection 549 assistance. We thank Cassie-Ann Dodson, Laurine Lemesle, Chris Reilly and Matthew Wisby for 550 assistance with field surveys, Stuart Roberts and Rebecca Evans for help with species identification 551 and Tom Breeze for manuscript comments. We thank Mathilde Baude and Mark Gillespie for advice 552 on floral resource survey methodology. This work was funded by BBSRC (Grant: BB/F01659X/1) and 553 Conservation Grade. SGP sits on the technical advisory board for Conservation Grade. 554
555
References 556
Albrecht, M., Duelli, P., Müller, C., Kleijn, D., Schmid, B., 2007. The Swiss agri-environment scheme 557 enhances pollinator diversity and plant reproductive success in nearby intensively managed 558 farmland. J. Appl. Ecol. 44, 813–822. doi:10.1111/j.1365-2664.2007.01306.x 559
Albrecht, M., Schmid, B., Hautier, Y., Müller, C.B., 2012. Diverse pollinator communities enhance 560 plant reproductive success. Proc. Biol. Sci. 279, 4845–52. doi:10.1098/rspb.2012.1621 561
Batáry, P., Sutcliffe, L., Dormann, C.F., Tscharntke, T., 2013. Organic farming favours insect-562 pollinated over non-insect pollinated forbs in meadows and wheat fields. PLoS One 8, e54818. 563 doi:10.1371/journal.pone.0054818 564
Bates, D., Maechler, M., Bolker, B., Walker, S., 2014. Linear mixed-effects models using Eigen and 565 S4_. R package version 1.1-7. 566
Beyer, H.L. (2012) Geospatial Modelling Environment. Available at http://www.spatialecology.com/ 567
Biesmeijer, J.C., Roberts, S.P.M., Reemer, M., Ohlemüller, R., Edwards, M., Peeters, T., Schaffers, 568 A.P., Potts, S.G., Kleukers, R., Thomas, C.D., Settele, J., Kunin, W.E., 2006. Parallel declines in 569 pollinators and insect-pollinated plants in Britain and the Netherlands. Science (80-. ). 313, 351–4. 570 doi:10.1126/science.1127863 571
16
Blaauw, B.R., Isaacs, R., 2014. Flower plantings increase wild bee abundance and the pollination 572 services provided to a pollination-dependent crop. J. Appl. Ecol. 51, 890–898. doi:10.1111/1365-573 2664.12257 574
Bommarco, R., Lundin, O., Smith, H.G., Rundlof, M., 2012. Drastic historic shifts in bumble-bee 575 community composition in Sweden. Proc. R. Soc. B Biol. Sci. 279, 309–315. 576 doi:10.1098/rspb.2011.0647 577
Bommarco, R., Kleijn, D., Potts, S.G., 2013. Ecological intensification: harnessing ecosystem services 578 for food security. Trends Ecol. Evol. 28, 230–8. doi:10.1016/j.tree.2012.10.012 579
Breeze, T.D., Bailey, A.P., Balcombe, K.G., Potts, S.G., 2014a. Costing conservation: an expert 580 appraisal of the pollinator habitat benefits of England’s Entry Level Stewardship. Biodivers. Conserv. 581 23, 1193–1214. doi:10.1007/s10531-014-0660-3 582
Breeze, T.D., Vaissière, B.E., Bommarco, R., Petanidou, T., Seraphides, N., Kozák, L., Scheper, J., 583 Biesmeijer, J.C., Kleijn, D., Gyldenkærne, S., Moretti, M., Holzschuh, A., Steffan-Dewenter, I., Stout, 584 J.C., Pärtel, M., Zobel, M., Potts, S.G., 2014b. Agricultural policies exacerbate honeybee pollination 585 service supply-demand mismatches across Europe. PLoS One 9, e82996. 586 doi:10.1371/journal.pone.0082996 587
Bretagnolle, V., Gaba, S., 2015. Weeds for bees? A review. Agron. Sustain. Dev. 35, 891–909. 588 doi:10.1007/s13593-015-0302-5 589
Cameron, S.A., Lozier, J.D., Strange, J.P., Koch, J.B., Cordes, N., Solter, L.F., Griswold, T.L., 2011. 590 Patterns of widespread decline in North American bumble bees. Proc. Natl. Acad. Sci. U. S. A. 108, 591 662–667. doi:10.1073/pnas.1014743108 592
Carvalheiro, L.G., Kunin, W.E., Keil, P., Aguirre-Gutiérrez, J., Ellis, W.N., Fox, R., Groom, Q., 593 Hennekens, S., Van Landuyt, W., Maes, D., Van de Meutter, F., Michez, D., Rasmont, P., Ode, B., 594 Potts, S.G., Reemer, M., Roberts, S.P.M., Schaminée, J., WallisDeVries, M.F., Biesmeijer, J.C., 2013. 595 Species richness declines and biotic homogenisation have slowed down for NW-European pollinators 596 and plants. Ecol. Lett. 16, 870–8. doi:10.1111/ele.12121 597
Carvalheiro, L.G., Veldtman, R., Shenkute, A.G., Tesfay, G.B., Pirk, C.W.W., Donaldson, J.S., Nicolson, 598 S.W., 2011. Natural and within-farmland biodiversity enhances crop productivity. Ecol. Lett. 14, 251–599 9. doi:10.1111/j.1461-0248.2010.01579.x 600
Carvell, C., Meek, W.R., Pywell, R.F., Goulson, D., Nowakowski, M., 2007. Comparing the efficacy of 601 agri-environment schemes to enhance bumble bee abundance and diversity on arable field margins. 602 J. Appl. Ecol. 44, 29–40. doi:10.1111/j.1365-2664.2006.01249.x 603
Carvell, C., Osborne, J.L., Bourke, A.F.G., Freeman, S.N., Pywell, R.F., Heard, M.S., 2011. Bumble bee 604 species’ responses to a targeted conservation measure depend on landscape context and habitat 605 quality. Ecol. Appl. 21, 1760–71. 606
Carvell, C., Roy, D.B., Smart, S.M., Pywell, R.F., Preston, C.D., Goulson, D., 2006. Declines in forage 607 availability for bumblebees at a national scale. Biol. Conserv. 132, 481–489. 608 doi:10.1016/j.biocon.2006.05.008 609
Centre for Ecology & Hydrology, 2011. Countryside survey: Land Cover Map 2007. 610

17
Cook, S.A., 1962. Genetic System, Variation and Adaptation in Eschscholzia californica. Evolution (N. 611 Y). 16, 278–299. 612
Deguines, N., Jono, C., Baude, M., Henry, M., Julliard, R., Fontaine, C., 2014. Large-scale trade-off 613 between agricultural intensification and crop pollination services. Front. Ecol. Environ. 12, 212–217. 614 doi:10.1890/130054 615
Diekötter, T., Wamser, S., Wolters, V., Birkhofer, K., 2010. Landscape and management effects on 616 structure and function of soil arthropod communities in winter wheat. Agric. Ecosyst. Environ. 137, 617 108–112. doi:10.1016/j.agee.2010.01.008 618
Ebeling, A., Klein, A.-M., Schumacher, J., Weisser, W.W., Tscharntke, T., 2008. How does plant 619 richness affect pollinator richness and temporal stability of flower visits? Oikos 117, 1808–1815. 620 doi:10.1111/j.1600-0706.2008.16819.x 621
Else, G., (In press). Handbook of the Bees of the British Isles. The Ray Society, London. 622
Elston, D.A., Moss, R., Boulinier, T., Arrowsmith, C., Lambin, X., 2001. Analysis of aggregation, a 623 worked example: numbers of ticks on red grouse chicks. Parasitology 122, 563–569. 624 doi:10.1017/S0031182001007740 625
Fuller, R.J., Norton, L.R., Feber, R.E., Johnson, P.J., Chamberlain, D.E., Joys, A.C., Mathews, F., Stuart, 626 R.C., Townsend, M.C., Manley, W.J., Wolfe, M.S., Macdonald, D.W., Firbank, L.G., 2005. Benefits of 627 organic farming to biodiversity vary among taxa. Biol. Lett. 1, 431–4. doi:10.1098/rsbl.2005.0357 628
Gabriel, D., Tscharntke, T., 2007. Insect pollinated plants benefit from organic farming. Agric. 629 Ecosyst. Environ. 118, 43–48. doi:10.1016/j.agee.2006.04.005 630
Garibaldi, L.A., Steffan-Dewenter, I., Kremen, C., Morales, J.M., Bommarco, R., Cunningham, S.A., 631 Carvalheiro, L.G., Chacoff, N.P., Dudenhöffer, J.H., Greenleaf, S.S., Holzschuh, A., Isaacs, R., 632 Krewenka, K., Mandelik, Y., Mayfield, M.M., Morandin, L.A., Potts, S.G., Ricketts, T.H., Szentgyörgyi, 633 H., Viana, B.F., Westphal, C., Winfree, R., Klein, A.M., 2011. Stability of pollination services decreases 634 with isolation from natural areas despite honey bee visits. Ecol. Lett. 14, 1062–72. 635 doi:10.1111/j.1461-0248.2011.01669.x 636
Ghazoul, J., 2006. Floral diversity and the facilitation of pollination. J. Ecol. 94, 295–304. 637 doi:10.1111/j.1365-2745.2006.01098.x 638
Google Map (2013) Retrieved from http://maps.google.com 639
Goulson, D., Nicholls, E., Botias, C., Rotheray, E.L., 2015. Bee declines driven by combined stress 640 from parasites, pesticides, and lack of flowers. Science (80-. ). 347, 1255957. 641 doi:10.1126/science.1255957 642
Haaland, C., Naisbit, R.E., Bersier, L.F., 2011. Sown wildflower strips for insect conservation: A 643 review. Insect Conserv. Divers. 4, 60–80. doi:10.1111/j.1752-4598.2010.00098.x 644
Holzschuh, A., Dormann, C.F., Tscharntke, T., Steffan-Dewenter, I., 2011. Expansion of mass-645 flowering crops leads to transient pollinator dilution and reduced wild plant pollination. Proc. Biol. 646 Sci. 278, 3444–51. doi:10.1098/rspb.2011.0268 647

18
Holzschuh, A., Steffan-Dewenter, I., Kleijn, D., Tscharntke, T., 2007. Diversity of flower-visiting bees 648 in cereal fields: effects of farming system, landscape composition and regional context. J. Appl. Ecol. 649 44, 41–49. doi:10.1111/j.1365-2664.2006.01259.x 650
Holzschuh, A., Steffan-Dewenter, I., Tscharntke, T., 2008. Agricultural landscapes with organic crops 651 support higher pollinator diversity. Oikos 117, 354–361. doi:10.1111/j.2007.0030-1299.16303.x 652
Hothorn, T., Bretz, F., Westfall, P., 2008. Simultaneous Inference in General Parametric Models. 653 Biometrical J. 50, 346–363. 654
Kerr, J.T., Pindar, A., Galpern, P., Packer, L., Potts, S.G., Roberts, S.M., Rasmont, P., Schweiger, O., 655 Colla, S.R., Richardson, L.L., Wagner, D.L., Gall, L.F., Sikes, Derek, S., Pantoja, A., 2015. Climate 656 change impacts on bumblebees converge across continents. Science (80-. ). 349, 177–180. 657
Klein, A.-M., Vaissière, B.E., Cane, J.H., Steffan-Dewenter, I., Cunningham, S.A., Kremen, C., 658 Tscharntke, T., 2007. Importance of pollinators in changing landscapes for world crops. Proc. Biol. 659 Sci. 274, 303–13. doi:10.1098/rspb.2006.3721 660
Martins, K.T., Gonzalez, A., Lechowicz, M.J., 2015. Pollination services are mediated by bee 661 functional diversity and landscape context. Agric. Ecosyst. Environ. 200, 12–20. 662 doi:10.1016/j.agee.2014.10.018 663
Moakes, S., Lampkin, N., Gerrard, C., 2015. Organic Farm Incomes in England and Wales 2013/14. 664
Morandin, L.A., Kremen, C., 2013. Hedgerow restoration promotes pollinator populations and 665 exports native bees to adjacent fields. Ecol. Appl. 23, 829–39. 666
Morandin, L.A., Winston, M.L., 2006. Pollinators provide economic incentive to preserve natural land 667 in agroecosystems. Agric. Ecosyst. Environ. 116, 289–292. doi:10.1016/j.agee.2006.02.012 668
Natural England, 2015. Countryside Stewardship Update [WWW Document]. URL 669 www.gov.uk/natural-england 670
Natural England, 2013. Land Management Update October 2013 [WWW Document]. URL 671 www.naturalengland.org.uk/ES (accessed 10.30.13). 672
Natural England, 2011. Natural England [WWW Document]. URL www.gov.uk/how-to-access-673 natural-englands-maps-and-data (accessed 2.29.12). 674
Nieto, A., Roberts, S.P.M., Kemp, J., Rasmont, P., Kuhlmann, M., Criado, M.G., Biesmeijer, J.C., 675 Bogusch, P., Dathe, H.H., Rúa, P. De, 2014. European Red List of Bees. Luxembourg. 676 doi:10.2779/77003 677
NSRI. (2011) National Soil Resources Institute Soilscapes, https://www.landis.org.uk/soilscapes/ 678
Oksanen, J., Blanchet, G., Kindt, R., Legendre, P., Minchin, P.R., O’Hara, B., Simpson, G.L., Solymos, 679 P., Stevens, H.H., Wagner, H., 2015. Vegan: Community Ecology Package. 680
Ollerton, J., Erenler, H., Edwards, M., Crockett, R., 2014. Extinctions of aculeate pollinators in Britain 681 and the role of large-scale agricultural changes. Science (80-. ). 346, 1360–1362. 682

19
Ollerton, J., Winfree, R., Tarrant, S., 2011. How many flowering plants are pollinated by animals? 683 Oikos 120, 321–326. doi:10.1111/j.1600-0706.2010.18644.x 684
Persson, A.S., Smith, H.G., 2013. Seasonal persistence of bumblebee populations is affected by 685 landscape context. Agric. Ecosyst. Environ. 165, 201–209. doi:10.1016/j.agee.2012.12.008 686
Pollard, E., Yates, T.J., 1993. Monitoring Butterflies for Ecology and Conservation. Chapman & Hall, 687 London. 688
Popic, T.J., Davila, Y.C., Wardle, G.M., 2013. Evaluation of Common Methods for Sampling 689 Invertebrate Pollinator Assemblages : Net Sampling Out-Perform Pan Traps. PLoS One 8, e66665. 690 doi:10.1371/journal.pone.0066665 691
Potts, S.G., Biesmeijer, J.C., Kremen, C., Neumann, P., Schweiger, O., Kunin, W.E., 2010. Global 692 pollinator declines: trends, impacts and drivers. Trends Ecol. Evol. 25, 345–53. 693 doi:10.1016/j.tree.2010.01.007 694
Power, E.F., Kelly, D.L., Stout, J.C., 2012. Organic farming and landscape structure: Effects on insect-695 pollinated plant diversity in intensively managed grasslands. PLoS One 7. 696 doi:10.1371/journal.pone.0038073 697
Power, E.F., Stout, J.C., 2011. Organic dairy farming: impacts on insect-flower interaction networks 698 and pollination. J. Appl. Ecol. 48, 561–569. doi:10.1111/j.1365-2664.2010.01949.x 699
Prŷs-Jones, O.E., Corbet, S.A., 2011. Bumblebees. Pelagic Publishing Limited, Exeter. 700
Pywell, R.F., Warman, E.A., Carvell, C., Sparks, T.H., Dicks, L.V., Bennett, D., Wright, A., Critchley, 701 C.N.R., Sherwood, A., 2005. Providing foraging resources for bumblebees in intensively farmed 702 landscapes. Biol. Conserv. 121, 479–494. doi:10.1016/j.biocon.2004.05.020 703
R Core Team, 2014. R: A language and environment for statistical computing. 704
Roulston, T.H., Goodell, K., 2011. The role of resources and risks in regulating wild bee populations. 705 Annu. Rev. Entomol. 56, 293–312. doi:10.1146/annurev-ento-120709-144802 706
Rundlöf, M., Nilsson, H., Smith, H.G., 2008. Interacting effects of farming practice and landscape 707 context on bumble bees. Biol. Conserv. 141, 417–426. doi:10.1016/j.biocon.2007.10.011 708
Scheper, J., Holzschuh, A., Kuussaari, M., Potts, S.G., Rundlöf, M., Smith, H.G., Kleijn, D., 2013. 709 Environmental factors driving the effectiveness of European agri-environmental measures in 710 mitigating pollinator loss-a meta-analysis. Ecol. Lett. 16, 912–20. doi:10.1111/ele.12128 711
Schüepp, C., Herzog, F., Entling, M.H., 2014. Disentangling multiple drivers of pollination in a 712 landscape-scale experiment. Proc. R. Soc. B 281, 20132667. doi:10.1098/rspb.2013.2667 713
Watson, C.A., Atkinson, D., Gosling, P., Jackson, L.R., Rayns, F.W., 2002. Managing soil fertility in 714 organic farming systems. Soil Use Manag. 18, 239–247. doi:10.1111/j.1475-2743.2002.tb00265.x 715
Westphal, C., Bommarco, R., Carre, G., Lamborn, E., Morison, N., Petanidou, T., Potts, S.G., Roberts, 716 S.P.M., Szentgyörgyi, H., Tscheulin, T., Vaissiere, B., Woyciechowski, M., Biesmeijer, J.C., Kunin, W.E., 717
20
Settele, J., Steffan-Dewenter, I., 2008. Measuring bee diversity in different European habitats and 718 biogeographical regions. Ecol. Monogr. 78, 653–671. doi:http://dx.doi.org/10.1890/07-1292.1 719
Wood, T.J., Holland, J.M., Hughes, W.O.H., Goulson, D., 2015a. Targeted agri-environment schemes 720 significantly improve the population size of common farmland bumblebee species. Mol. Ecol. 24, 721 1668–1680. doi:10.1111/mec.13144 722
Wood, T.J., Holland, J.M., Goulson, D., 2015b. Pollinator-friendly management does not increase the 723 diversity of farmland bees and wasps. Biol. Conserv. 187, 120–126. 724 doi:10.1016/j.biocon.2015.04.022 725
Woodcock, T.S., Pekkola, L.J., Dawson, C., Gadallah, F.L., Kevan, P.G., 2014. Development of a 726 Pollination Service Measurement (PSM) method using potted plant phytometry. Environ. Monit. 727 Assess. 186, 5041–57. doi:10.1007/s10661-014-3758-x 728
Xie, Z., Williams, P.H., Tang, Y., 2008. The effect of grazing on bumblebees in the high rangelands of 729 the eastern Tibetan Plateau of Sichuan. J. Insect Conserv. 12, 695–703. doi:10.1007/s10841-008-730 9180-3 731
Zuur, A.F., Ieno, E.N., Walker, N.J., Saveliev, A.A., Smith, G.M., 2009. Mixed effects models and 732 extensions in ecology with R. Springer, New York, NY, USA. 733
734
735

21
736
Table 1. The proportion of total flowers (%) contributed by each habitat type to the total farm level 737
flower abundance on farms in three different wildlife-friendly farming schemes (mean and SE across 738
four farms per scheme). ELS = Entry Level Stewardship, CG = Conservation Grade, org = organic, ES = 739
Environmental Stewardship, Imp. grass = improved grass, MFC = mass flowering crop and other = 740
fallow, tree planting, woodland, game cover. 741
ES grass ES margin Hedgerow Imp. grass MFC Cereal Other
ELS 5.2 ± 2.9 50.3 ± 21.0 2.4 ± 1.1 24.7 ± 21.2 0.3 ± 0.2 0 ± 0 0.2 ± 0.15
CG 35.4 ± 10.7 39.2 ± 17.2 9.5 ± 7.4 2.1 ± 1.5 0 ± 0 10.9 ± 9.3 3.08 ± 1.38
Org 39.1 ± 14.9 0.6 ± 0.3 5.4 ± 3.9 8.9 ± 2.8 36.2 ± 15.5 9.8 ± 5.3 0.05 ± 0.04
742
743
22
744
745
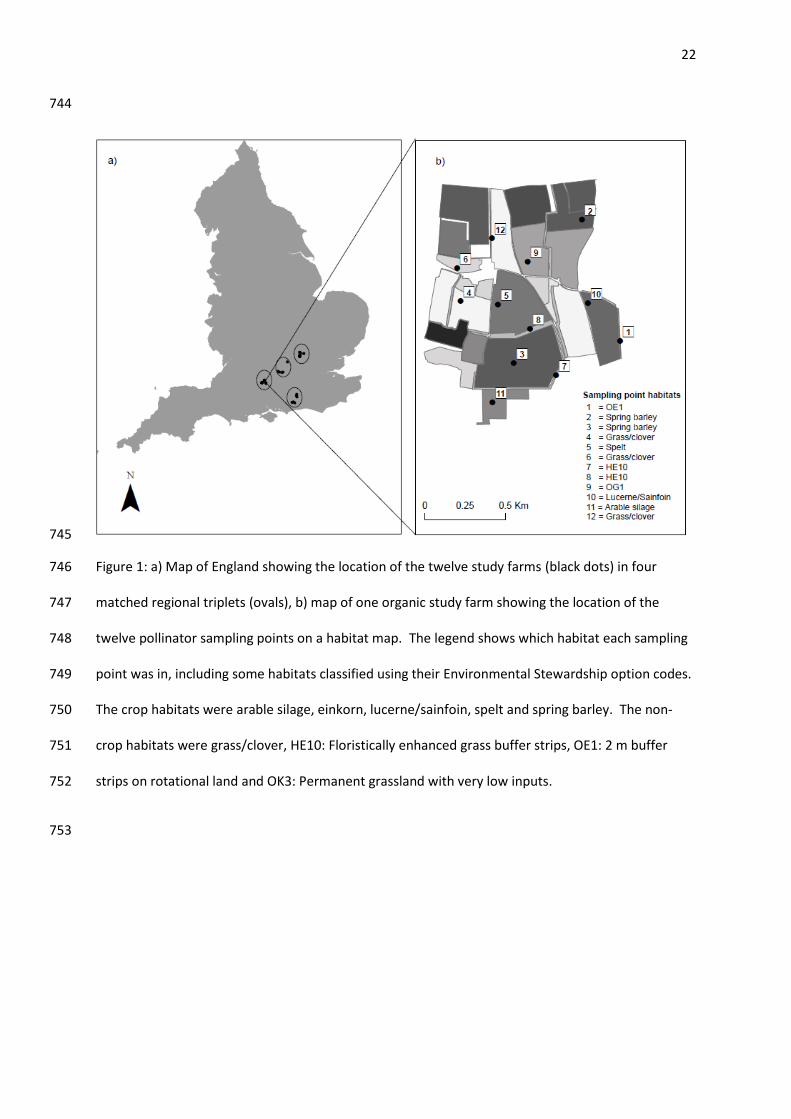
Figure 1: a) Map of England showing the location of the twelve study farms (black dots) in four 746
matched regional triplets (ovals), b) map of one organic study farm showing the location of the 747
twelve pollinator sampling points on a habitat map. The legend shows which habitat each sampling 748
point was in, including some habitats classified using their Environmental Stewardship option codes. 749
The crop habitats were arable silage, einkorn, lucerne/sainfoin, spelt and spring barley. The non-750
crop habitats were grass/clover, HE10: Floristically enhanced grass buffer strips, OE1: 2 m buffer 751
strips on rotational land and OK3: Permanent grassland with very low inputs. 752
753

23
Figure 2. Bar plots showing mean flower density (a) and flowering plant Shannon diversity (b) in crop 754
and non-crop habitats on farms in three different wildlife-friendly farming schemes (ELS = Entry 755
Level Stewardship, CG = Conservation Grade, Org = Organic). Error bars show 95% confidence 756
intervals. 757
758
759

24
760
Figure 3: Bar plots showing means with error bars showing 95% confidence intervals for a) bee 761
species richness, b) hoverfly density, c) bee density and d) bee-flower visit density, recorded on 762
twelve transects, each 100 m long and 2 m wide, in crop and non-crop habitats on farms in different 763
wildlife-friendly farming schemes: ELS =Entry Level Stewardship, CG =Conservation Grade and Org 764
=Organic. 765
766
767
768

25
Figure 4: Bar plots showing means for pollination service measured as fruit set and seeds per node 769
per phytometer plant recorded in crop and non-crop habitats on farms in three different wildlife-770
friendly farming schemes (ELS = Entry Level Stewardship, CG = Conservation Grade, Org = Organic). 771
Error bars show 95% confidence intervals. 772
773
774