Embed Size (px)
Citation preview

T. ROWE PRICE
April 30, 2018
PRASX New Asia Fund
PNSIX New Asia Fund–I Class
The fund invests in growth companies located in the Asia ex Japan region.
For more insights from T. Rowe Price investment professionals, go to troweprice.com.
SEMIANNUAL REPORT
Proof #5

T. ROWE PRICE NEW ASIA FUND
CIO Market Commentary
T. ROWE PRICE NEW ASIA FUND
HIGHLIGHTS
n Asia ex Japan stock markets rose in the six months ended April 30, 2018, as synchronized global growth supported the region’s export-driven economies, though surging U.S. bond yields curbed gains starting in February.
n The New Asia Fund returned 1.74% in the first half of its fiscal year and underperformed the MSCI All Country Asia ex Japan Index and the Lipper Pacific Ex Japan Funds Average.
n The financials sector produced many top contributors. The biggest detractors were technology stocks, which sold off in 2018 due to valuation concerns for some Internet stocks and underperformance in select Asian tech suppliers following weak iPhone demand.
n We continued our efforts to find companies that are gaining market share or enjoying pricing power in their respective industries. We turned more constructive toward select markets in Southeast Asia, where we were previously underweight.
Log in to your account at troweprice.com for more information.
* Certain mutual fund accounts that are assessed an annual account service fee can also save money by switching to e-delivery.
It’s fast—receive your statements and confirmations faster than U.S. mail.
It’s convenient—access your important account documents whenever you need them.
It’s secure—we protect your online accounts using “True Identity” to confirm new accounts and make verification faster and more secure.
It can save you money—where applicable, T. Rowe Price passes on the cost savings to fund holders.*
TO ENROLL:If you invest directly with T. Rowe Price, go to troweprice.com/paperless.
If you invest through an investment advisor, a bank, or a brokerage firm, please contact that organization and ask if it can provide electronic documentation.
Go PaperlessSign up for e-delivery of your statements, confirmations, and prospectuses or shareholder reports.
Proof #5

1
T. ROWE PRICE NEW ASIA FUND
CIO Market Commentary
T. ROWE PRICE NEW ASIA FUND
Dear Shareholder
Global markets experienced an abrupt reversal in early 2018, as a prolonged stretch of slow and steady gains in many equity markets gave way to a spike in volatility. In February, the S&P 500 Index broke its longest streak of positive monthly total returns on record and briefly declined by over 10% from its recent highs, putting it in correction territory. Overseas markets broadly followed Wall Street lower, and global stocks remained volatile through April. Strong results from November through January helped most markets end with gains for the first half of your fund’s fiscal year, however.
Several factors appeared to have unsettled investors, but the impact of tighter monetary policy and fears about heightened trade tensions were primary among them. Data in early February showing faster wage gains in the U.S. fostered speculation that the Federal Reserve might accelerate its pace of interest rate hikes in order to fight inflation. While most other central banks continued to keep short-term rates steady at very low levels, longer-term rates in many countries crept up as economic growth solidified. Investors around the world began to consider how the normalization of monetary policy might potentially impact stock and bond prices.
Uncertainties deepened in early March after the Trump administration surprised many with the announcement of tariffs on imported steel and aluminum, only to later grant select trading partners temporary exemptions. The trade conflict between China and the U.S. intensified, however, with the U.S. announcing additional tariffs on Chinese goods and China responding with its own tariffs in a tit-for-tat escalation that proceeded through April.
World currencies fluctuated amid increased market volatility, geopolitical swings, and concerns about rising U.S. protectionism. The greenback began to strengthen late in the period as the 10-year U.S. Treasury yield broke through 3%; but for the full six months ended April 30, the dollar declined almost 4% against the euro, British pound, and Japanese yen. The rise in other currencies boosted returns for U.S. investors in overseas markets.
Emerging markets, supported by good earnings growth, proved resilient for much of the period and outperformed their developed peers over the last six months. Oil exporters and other commodity producers benefited from rising prices, and improving fiscal conditions lowered borrowing costs in a number of emerging economies. The month of April proved tougher for emerging markets, though, as U.S. yields and the dollar began to rise.
Proof #5
2
T. ROWE PRICE NEW ASIA FUND
Notably, the shift in market sentiment beginning in February did not correspond to a widespread deterioration in economic conditions or corporate fundamentals. Indeed, corporate profit growth accelerated across many markets, and the world’s major economies continued to expand in sync for the first time in several years. Market strength in the first three months of the period was largely based on the expectation of this improvement; conversely, weakness in the back half of the period appears to have largely reflected growing skepticism about whether this pace of improvement is sustainable.
Time will tell if the recent turbulence was signaling trouble ahead or if the market was simply consolidating the strong gains over the past several years before moving higher. Among the developments we will be watching closely are election results in the U.S., Europe, and elsewhere, and whether a continuing populist backlash results in a wave of protectionism. On the economic front, the possibility that inflation finally takes hold in developed markets and how consumers and businesses adjust to an end of extreme monetary accommodation will help determine if growth can sustain its momentum. In historical terms, equity and bond valuations remain generally elevated, posing the risk that asset prices won’t keep pace with improving fundamentals over the short term.
Many investors have been asking our view on the recent return to more normal levels of market volatility. It’s important to underscore that volatility, while sometimes unsettling, can be the friend of long-term, patient investors. More volatility can benefit active management, and I am confident that our dedicated, worldwide team of investment professionals are taking advantage of this period to discover new opportunities. Moreover, I have no doubt that your fund’s experienced manager will continue to make the best use of those insights, putting the long-term interests of our shareholders above the short-term instincts that too often drive markets.
Thank you for your continued confidence in T. Rowe Price.
Sincerely,
Robert SharpsGroup Chief Investment Officer
Proof #5
3
T. ROWE PRICE NEW ASIA FUND
Management’s Discussion of Fund Performance
INVESTMENT OBJECTIVE
The fund seeks long-term growth of capital through investments primarily in the common stocks of companies located (or with primary operations) in Asia (excluding Japan).
FUND COMMENTARY
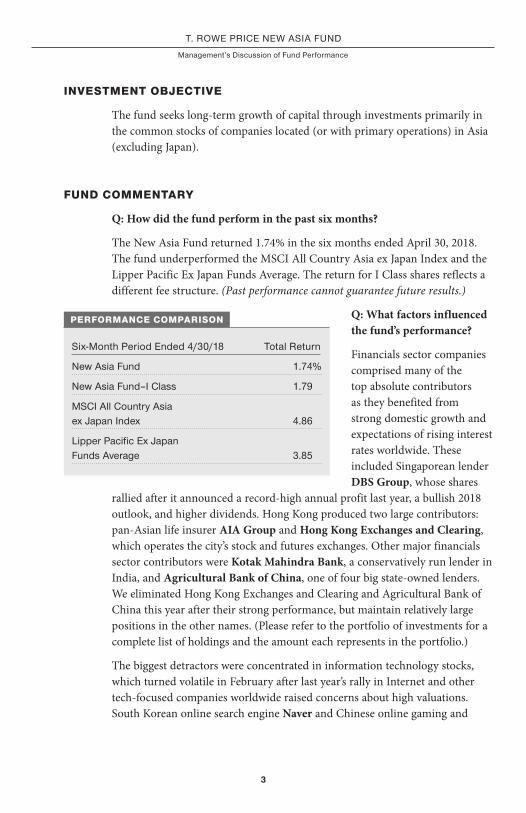
Q: How did the fund perform in the past six months?
The New Asia Fund returned 1.74% in the six months ended April 30, 2018. The fund underperformed the MSCI All Country Asia ex Japan Index and the Lipper Pacific Ex Japan Funds Average. The return for I Class shares reflects a different fee structure. (Past performance cannot guarantee future results.)
Q: What factors influenced the fund’s performance?
Financials sector companies comprised many of the top absolute contributors as they benefited from strong domestic growth and expectations of rising interest rates worldwide. These included Singaporean lender DBS Group, whose shares
rallied after it announced a record-high annual profit last year, a bullish 2018 outlook, and higher dividends. Hong Kong produced two large contributors: pan-Asian life insurer AIA Group and Hong Kong Exchanges and Clearing, which operates the city’s stock and futures exchanges. Other major financials sector contributors were Kotak Mahindra Bank, a conservatively run lender in India, and Agricultural Bank of China, one of four big state-owned lenders. We eliminated Hong Kong Exchanges and Clearing and Agricultural Bank of China this year after their strong performance, but maintain relatively large positions in the other names. (Please refer to the portfolio of investments for a complete list of holdings and the amount each represents in the portfolio.)
The biggest detractors were concentrated in information technology stocks, which turned volatile in February after last year’s rally in Internet and other tech-focused companies worldwide raised concerns about high valuations. South Korean online search engine Naver and Chinese online gaming and
Six-Month Period Ended 4/30/18 Total Return
New Asia Fund 1.74%
New Asia Fund–I Class 1.79
MSCI All Country Asia ex Japan Index 4.86
Lipper Pacific Ex Japan Funds Average 3.85
PERFORMANCE COMPARISON
Proof #5

4
T. ROWE PRICE NEW ASIA FUND
e-commerce company NetEase were two detractors in the Internet sector. Our holdings in two companies in Apple’s supply chain—Largan Precision, a Taiwanese manufacturer of high-precision camera lenses used in smartphones, and contract chipmaker Taiwan Semiconductor Manufacturing Co. (TSMC)—underperformed following disappointing shipments of the latest iPhone. Outside the IT sector, Hangzhou Robam Appliances, a Chinese manufacturer of high-end kitchen appliances, was another large detractor after reporting unexpectedly weak earnings.
Compared with the benchmark, financials followed by health care added the most to relative performance, while information technology and consumer discretionary were the biggest detractors. From a geographic perspective, stock selection in India and Singapore contributed the most to relative returns, while
stock selection in China and Taiwan detracted the most.
Q: How is the fund positioned?
The New Asia Fund invests in Asia-focused companies that feature strong and sustainable growth and/or solid potential for multiple expansion over the long term. Each position in the fund is the product of individual stock selection based on the insights of T. Rowe Price’s Asia-based investment team. Though we are bottom-up stock pickers, three themes emerged from our portfolio decisions over the past six months. First, we added to companies that we believe are positioned to increase share and pricing power in
their respective markets. Second, we increased our exposure to Southeast Asia, where corporate earnings appear to be improving after several disappointing years, and positioned our Indian holdings ahead of an expected recovery in private sector investment. Finally, we added to smaller Asian technology companies as we sought to extend our exposure beyond large-cap Chinese Internet holdings.
Percent of Net Assets 10/31/17 4/30/18
Information Technology 37.0% 35.4%
Financials 16.5 20.0
Consumer Staples 10.5 11.4
Consumer Discretionary 11.2 11.0
Industrials and Business Services 8.3 6.4
Real Estate 2.8 4.8
Health Care 4.1 3.3
Telecommunication Services 3.8 2.6
Materials 0.7 1.5
Energy 0.9 0.9
Utilities 0.7 0.0
Other and Reserves 3.5 2.7
Total 100.0% 100.0%
Historical weightings reflect current industry/sector classifications.
SECTOR DIVERSIFICATION
Proof #5
5
T. ROWE PRICE NEW ASIA FUND
Adding to companies gaining share or pricing power. Many of our biggest purchases were companies that we believed are well positioned to gain share and increase prices in their respective markets. This ability to take share—particularly in an environment of slowing growth—was evident in many Chinese consumer-driven companies. We initiated China Overseas Land & Investment, a government-backed homebuilder that we believe will continue to increase share in a cooling property market on the mainland, and added to our position in Tsingtao Brewery, which is benefiting from newfound pricing power following recent consolidation in the beer industry.
Warming up to ASEAN, but staying on the sidelines in India. Most Southeast Asian markets have lagged other Asian markets for well over a year. However, we are seeing signs that economic and earnings growth may be turning the corner in a few countries after a prolonged period of below-potential performance. After previously being underweight to the biggest markets in the Association of Southeast Asian Nations (ASEAN), we have become more constructive toward Thailand and Indonesia, where the earnings outlook has lately picked up. We maintained a large position in CP All, operator of the 7-Eleven convenience chain in Thailand, and initiated positions in Thai homebuilder Land & Houses and in Indonesian conglomerate Astra International. Our outlook didn’t extend to all ASEAN nations, however. We refrained from making any major purchases in the Philippines, one of Southeast Asia’s fastest-growing economies, due to concerns about rising inflation and higher interest rates.
We stayed on the sidelines in India, where we believe valuations appear expensive, but we remain constructive in the long run. India has mostly recovered from an abrupt demonetization in 2016 and the rollout of a nationwide sales tax in 2017, two major reforms that temporarily disrupted the economy. Though we find the direction of India’s reforms encouraging, our view is tempered by a lack of private sector investment, which is essential for the economy to reach its full potential. Our largest Indian holdings are private sector lenders HDFC Bank and Kotak Mahindra Bank, which should be early beneficiaries of a capital spending upturn.
Diversifying beyond the BATs. Our positioning in China’s so-called BAT stocks—an acronym for Baidu, Alibaba, and Tencent, the country’s biggest and best-known Internet companies—slightly shifted over the period. We maintained a large position in e-commerce leader Alibaba and gradually reduced our position in social media conglomerate Tencent after eliminating our long-held position in Baidu in 2017. However, we added to positions in Largan Precision, NetEase, and electronic components supplier
Proof #5
6
T. ROWE PRICE NEW ASIA FUND
AAC Technologies on weakness as we broadened our search for growth opportunities in smaller, up-and-coming companies in Asia’s technology sector. At the same time, we maintained key positions in global semiconductor and mobile phone leader Samsung Electronics and in custom chipmaker TSMC, which benefits from a diverse customer base worldwide. Looking ahead, businesses that are on the forefront of technology industry trends or gaining share in their respective industries will remain a key theme for your fund.
Q: What is portfolio management’s outlook?
Our medium-term outlook for the region is constructive. Corporate fundamentals in the region appear solid, and we expect continued earnings growth for the rest of 2018, albeit at a slower pace than last year. Asian companies remain disciplined and continue to generate substantially more cash flow and higher profit margins compared with previous years.
Risks to our outlook include a rise in protectionism worldwide, which would hurt Asia’s trade-driven economies. A faster-than-expected pace of U.S. interest rate increases, which could usher in higher borrowing costs in Asia, is another headwind. We have sought to cushion the impact of these potential risks by making sure your fund is well-diversified. Our holdings include companies encompassing a range of growth rates and valuation multiples. Additionally, we maintain a balanced exposure to stocks that would either do well or poorly in a rising rate environment. Moreover, we keep a measured exposure to export-dependent names, but also view the current turmoil as a buying opportunity for such companies.
Finally, we are mindful of the risk of a policy misstep in China as Beijing presses on with a long-term plan to deleverage the economy and promote higher-quality growth. China recently set a roughly 6.5% growth target for 2018, down slightly from last year’s 6.9% pace. Despite the slowdown in headline gross domestic product growth, we continue to see many attractive growth opportunities on the ground in China, particularly among companies that are increasing share as the economy cools.
Regardless of the overall policy backdrop, we continue to leverage the resources of T. Rowe Price’s global research platform to seek out Asian companies that are taking share in their respective markets, demonstrating innovation, and generating value for shareholders.
The views expressed reflect the opinions of T. Rowe Price as of the date of this report and are subject to change based on changes in market, economic, or other conditions. These views are not intended to be a forecast of future events and are no guarantee of future results.
Proof #5

7
T. ROWE PRICE NEW ASIA FUND
RISKS OF INTERNATIONAL INVESTING
Funds that invest overseas generally carry more risk than funds that invest strictly in U.S. assets. Funds investing in a single country or in a limited geographic region tend to be riskier than more diversified funds. Risks can result from varying stages of economic and political development; differing regulatory environments, trading days, and accounting standards; and higher transaction costs of non-U.S. markets. Non-U.S. investments are also subject to currency risk, or a decline in the value of a foreign currency versus the U.S. dollar, which reduces the dollar value of securities denominated in that currency.
The risks of international investing are heightened for securities of issuers in emerging market countries. Emerging market countries tend to have economic structures that are less diverse and mature, and political systems that are less stable, than those of developed countries. In addition to all of the risks of investing in international developed markets, emerging markets are more susceptible to governmental interference, local taxes being imposed on international investments, restrictions on gaining access to sales proceeds, and less liquid and less efficient trading markets.
BENCHMARK INFORMATION
Note: MSCI makes no express or implied warranties or representations and shall have no liability whatsoever with respect to any MSCI data contained herein. The MSCI data may not be further redistributed or used as a basis for other indices or any securities or financial products. This report is not approved, reviewed, or produced by MSCI.
Proof #5
8
T. ROWE PRICE NEW ASIA FUND
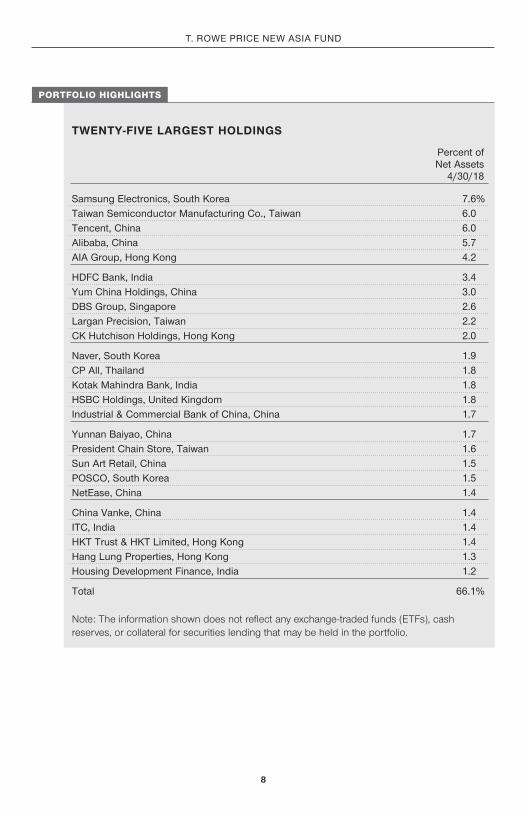
TWENTY-FIVE LARGEST HOLDINGS
Percent of Net Assets 4/30/18
Samsung Electronics, South Korea 7.6%Taiwan Semiconductor Manufacturing Co., Taiwan 6.0Tencent, China 6.0Alibaba, China 5.7AIA Group, Hong Kong 4.2
HDFC Bank, India 3.4Yum China Holdings, China 3.0DBS Group, Singapore 2.6Largan Precision, Taiwan 2.2CK Hutchison Holdings, Hong Kong 2.0
Naver, South Korea 1.9CP All, Thailand 1.8Kotak Mahindra Bank, India 1.8HSBC Holdings, United Kingdom 1.8Industrial & Commercial Bank of China, China 1.7
Yunnan Baiyao, China 1.7President Chain Store, Taiwan 1.6Sun Art Retail, China 1.5POSCO, South Korea 1.5NetEase, China 1.4
China Vanke, China 1.4ITC, India 1.4HKT Trust & HKT Limited, Hong Kong 1.4Hang Lung Properties, Hong Kong 1.3Housing Development Finance, India 1.2
Total 66.1%
Note: The information shown does not reflect any exchange-traded funds (ETFs), cash reserves, or collateral for securities lending that may be held in the portfolio.
PORTFOLIO HIGHLIGHTS
Proof #5

9
T. ROWE PRICE NEW ASIA FUND
This chart shows the value of a hypothetical $10,000 investment in the fund over the past 10 fiscal year periods or since inception (for funds lacking 10-year records). The result is compared with benchmarks, which includes a broad-based market index and may also include a peer group average or index. Market indexes do not include expenses, which are deducted from fund returns as well as mutual fund averages and indexes.
Since InceptionPeriods Ended 4/30/18 1 Year 5 Years 10 Years Inception Date
New Asia Fund 18.85% 7.20% 5.97% ‒ ‒
New Asia Fund–I Class 18.94 ‒ ‒ 16.25% 12/17/15
This table shows how the fund would have performed each year if its actual (or cumulative) returns for the periods shown had been earned at a constant rate. Returns do not reflect taxes that the shareholder may pay on fund distributions or the redemption of fund shares. Past performance cannot guarantee future results.
AVERAGE ANNUAL COMPOUND TOTAL RETURN
GROWTH OF $10,000
As of 4/30/18
$17,851
$16,375
$16,201
New Asia Fund
MSCI All Country Asia ex Japan Index
Lipper Pacific Ex Japan Funds Average
4000
7,500
11,000
14,500
18,000
21,500
$25,000
4/184/174/164/154/144/134/124/114/104/094/08
NEW ASIA FUND
Note: Performance for the I Class will vary due to its differing fee structure. See returns table below.
Proof #5

10
T. ROWE PRICE NEW ASIA FUND
New Asia Fund 0.93%
New Asia Fund–I Class 0.82
The expense ratio shown is as of the fund’s fiscal year ended 10/31/17. This number may vary from the expense ratio shown elsewhere in this report because it is based on a different time period and, if applicable, includes acquired fund fees and expenses but does not include fee or expense waivers.
EXPENSE RATIO
FUND EXPENSE EXAMPLE
As a mutual fund shareholder, you may incur two types of costs: (1) transaction costs, such as redemption fees or sales loads, and (2) ongoing costs, including management fees, distribution and service (12b-1) fees, and other fund expenses. The following example is intended to help you understand your ongoing costs (in dollars) of investing in the fund and to compare these costs with the ongoing costs of investing in other mutual funds. The example is based on an investment of $1,000 invested at the beginning of the most recent six-month period and held for the entire period.
Please note that the fund has two share classes: The original share class (Investor Class) charges no distribution and service (12b-1) fee, and the I Class shares are also available to institutionally oriented clients and impose no 12b-1 or administrative fee payment. Each share class is presented separately in the table.
Actual ExpensesThe first line of the following table (Actual) provides information about actual account values and expenses based on the fund’s actual returns. You may use the information on this line, together with your account balance, to estimate the expenses that you paid over the period. Simply divide your account value by $1,000 (for example, an $8,600 account value divided by $1,000 = 8.6), then multiply the result by the number on the first line under the heading “Expenses Paid During Period” to estimate the expenses you paid on your account during this period.
Hypothetical Example for Comparison PurposesThe information on the second line of the table (Hypothetical) is based on hypothetical account values and expenses derived from the fund’s actual expense ratio and an assumed 5% per year rate of return before expenses (not the fund’s actual return). You may compare the ongoing costs of investing in the fund with other funds by contrasting this 5% hypothetical example and the 5% hypothetical examples that appear in the shareholder reports of the other funds. The hypothetical account values and expenses may not be used to estimate the actual ending account balance or expenses you paid for the period.
Proof #5

11
T. ROWE PRICE NEW ASIA FUND
FUND EXPENSE EXAMPLE (CONTINUED)
Note: T. Rowe Price charges an annual account service fee of $20, generally for accounts with less than $10,000. The fee is waived for any investor whose T. Rowe Price mutual fund accounts total $50,000 or more; accounts electing to receive electronic delivery of account statements, transaction confirmations, prospectuses, and shareholder reports; or accounts of an investor who is a T. Rowe Price Personal Services or Enhanced Personal Services client (enrollment in these programs generally requires T. Rowe Price assets of at least $250,000). This fee is not included in the accompanying table. If you are subject to the fee, keep it in mind when you are estimating the ongoing expenses of investing in the fund and when comparing the expenses of this fund with other funds.
You should also be aware that the expenses shown in the table highlight only your ongoing costs and do not reflect any transaction costs, such as redemption fees or sales loads. Therefore, the second line of the table is useful in comparing ongoing costs only and will not help you determine the relative total costs of owning different funds. To the extent a fund charges transaction costs, however, the total cost of owning that fund is higher.
Beginning Ending Expenses Paid Account Value Account Value During Period* 11/1/17 4/30/18 11/1/17 to 4/30/18
Investor ClassActual $1,000.00 $1,017.40 $4.65
Hypothetical (assumes 5% return before expenses) 1,000.00 1,020.18 4.66
I ClassActual 1,000.00 1,017.90 4.10
Hypothetical (assumes 5% return before expenses) 1,000.00 1,020.73 4.11
* Expenses are equal to the fund’s annualized expense ratio for the 6-month period, multiplied by the average account value over the period, multiplied by the number of days in the most recent fiscal half year (181), and divided by the days in the year (365) to reflect the half-year period. The annualized expense ratio of the Investor Class was 0.93%, and the I Class was 0.82%.
NEW ASIA FUND
Proof #5

12
T. ROWE PRICE NEW ASIA FUND
Since InceptionPeriods Ended 3/31/18 1 Year 5 Years 10 Years Inception Date
New Asia Fund 24.59% 7.83% 6.90% – –
New Asia Fund–I Class 24.76 – – 17.88% 12/17/15
The fund’s performance information represents only past performance and is not necessarily an indication of future results. Current performance may be lower or higher than the performance data cited. Share price, principal value, and return will vary, and you may have a gain or loss when you sell your shares. For the most recent month-end performance, please visit our website (troweprice.com) or contact a T. Rowe Price representative at 1-800-225-5132 or, for I Class shares, 1-800-638-8790. The performance information shown does not reflect the deduction of a 2% redemption fee on shares held for 90 days or less. If it did, the performance would be lower.This table provides returns through the most recent calendar quarter-end rather than through the end of the fund’s fiscal period. It shows how the fund would have performed each year if its actual (or cumulative) returns for the periods shown had been earned at a constant rate. Average annual total return figures include changes in principal value, reinvested dividends, and capital gain distributions. Returns do not reflect taxes that the shareholder may pay on fund distributions or the redemption of fund shares. When assessing performance, investors should consider both short- and long-term returns.
QUARTER-END RETURNS
Proof #5

13
FINANCIAL HIGHLIGHTS For a share outstanding throughout each period
The accompanying notes are an integral part of these financial statements.
T. ROWE PRICE NEW ASIA FUND
Unaudited
Investor Class
6 Months Ended
4/30/18
Year Ended
10/31/17 10/31/16 10/31/15 10/31/14 10/31/13 NET ASSET VALUE
Beginning of period $ 20.91 $ 16.39 $ 15.60 $ 17.73 $ 16.81 $ 16.26
Investment activities
Net investment income(1) 0.02 0.10 0.13 0.16 0.17 0.17
Net realized and unrealized gain / loss 0.33 4.62 0.86 (1.48) 1.45 0.77
Total from investment activities 0.35 4.72 0.99 (1.32) 1.62 0.94
Distributions
Net investment income (0.10) (0.13) (0.20) (0.16) (0.15) (0.16)
Net realized gain (1.79) (0.07) – (0.65) (0.55) (0.23)
Total distributions (1.89) (0.20) (0.20) (0.81) (0.70) (0.39)
NET ASSET VALUE
End of period $ 19.37 $ 20.91 $ 16.39 $ 15.60 $ 17.73 $ 16.81
Ratios/Supplemental Data
Total return(2) 1.74% 29.24% 6.45% (7.52)% 10.15% 5.81%
Ratio of total expenses to average net assets 0.93%(3) 0.93% 0.95% 0.94% 0.94% 0.93%
Ratio of net investment income to average net assets 0.25%(3) 0.53% 0.83% 0.94% 1.04% 1.05%
Portfolio turnover rate 25.7% 71.3% 39.4% 53.2% 58.5% 49.4%
Net assets, end of period (in millions) $ 2,761 $ 2,793 $ 2,568 $ 2,768 $ 4,293 $ 4,699
(1) Per share amounts calculated using average shares outstanding method. (2) Total return reflects the rate that an investor would have earned on an investment in the fund
during each period, assuming reinvestment of all distributions and payment of no redemption or account fees. Total return is not annualized for periods less than one year.
(3) Annualized
Proof #5

14
FINANCIAL HIGHLIGHTS For a share outstanding throughout each period
The accompanying notes are an integral part of these financial statements.
T. ROWE PRICE NEW ASIA FUND
Unaudited
I Class
6 Months Ended
4/30/18
Year Ended
10/31/17
12/17/15(1) Through
10/31/16 NET ASSET VALUE
Beginning of period $ 20.94 $ 16.41 $ 15.13
Investment activities
Net investment income(2) 0.04 0.15(6) 0.09(3)
Net realized and unrealized gain / loss 0.32 4.59 1.19
Total from investment activities 0.36 4.74 1.28
Distributions
Net investment income (0.12) (0.14) –
Net realized gain (1.79) (0.07) –
Total distributions (1.91) (0.21) –
NET ASSET VALUE
End of period $ 19.39 $ 20.94 $ 16.41
Ratios/Supplemental Data
Total return(4) 1.79% 29.35%(6) 8.46%(3)
Ratio of total expenses to average net assets 0.82%(5) 0.82%(6) 0.84%(3) (5)
Ratio of net investment income to average net assets 0.35%(5) 0.79%(6) 0.80%(3) (5)
Portfolio turnover rate 25.7% 71.3% 39.4%
Net assets, end of period (in thousands) $ 346,149 $ 352,741 $ 99,530
(1) Inception Date (2) Per share amounts calculated using average shares outstanding method. (3) See Note 6. Excludes expenses in excess of a 0.05% contractual operating expense limitation in
effect through 2/29/20. (4) Total return reflects the rate that an investor would have earned on an investment in the fund
during each period, assuming reinvestment of all distributions and payment of no redemption or account fees. Total Return is not annualized for periods less than one year.
(5) Annualized (6) See Note 6. Includes expenses repaid (0.00% of average net assets) related to its contractual
expense limitation
Proof #5

T. ROWE PRICE NEW ASIA FUND
April 30, 2018 (Unaudited)
PORTFOLIO OF INVESTMENTS‡ Shares $ Value
(Cost and value in $000s)
15
CHINA 37.2%
Common Stocks 30.3%
3SBio (HKD)(1)(2) 7,698,500 16,542
58.com, ADR (USD) 383,774 33,538
AAC Technologies Holdings (HKD) 1,643,000 23,582
Alibaba Group Holding, ADR (USD)(2) 990,011 176,757
China Mengniu Dairy (HKD) 3,194,000 10,297
China Overseas Land & Investment (HKD) 9,758,000 32,695
China Pacific Insurance Group, Class H (HKD) 3,447,600 15,213
China Unicom Hong Kong (HKD)(2) 18,342,000 25,936
China Vanke, H Shares (HKD) 10,724,200 44,321
Ctrip.com International, ADR (USD)(2) 841,886 34,433
Industrial & Commercial Bank of China, H Shares (HKD) 60,819,000 53,392
Kunlun Energy (HKD) 33,438,000 28,630
NetEase, ADR (USD) 175,000 44,987
Sun Art Retail Group (HKD) 40,920,500 45,993
Tencent Holdings (HKD) 3,762,000 184,951
Tsingtao Brewery, H Shares (HKD) 6,360,000 32,928
Uni-President China Holdings (HKD) 33,369,000 31,545
Wuxi Biologics (HKD)(1)(2) 824,000 7,474
Yum China Holdings (USD) 2,182,200 93,311
Zhou Hei Ya International Holdings (HKD)(1) 6,523,000 5,729
942,254
Common Stocks - China A shares 6.9%
Hangzhou Robam Appliances (3) 1,577,877 8,288
Hangzhou Robam Appliances (CNH) 4,907,898 25,784
Hongfa Technology (CNH) 5,280,742 30,429
Huayu Automotive Systems (3) 1,692,729 5,908
Huayu Automotive Systems (CNH) 6,363,916 22,216
Inner Mongolia Yili Industrial Group (3) 6,936,001 28,665
Inner Mongolia Yili Industrial Group (CNH) 989,600 4,091
Jiangsu Hengrui Medicine (CNH) 1,994,184 26,095
Kweichow Moutai (CNH) 86,620 9,005
Proof #5

T. ROWE PRICE NEW ASIA FUND
Shares $ Value
(Cost and value in $000s)
16
Yunnan Baiyao Group (3) 220,169 3,282
Yunnan Baiyao Group (CNH) 3,284,278 48,963
212,726
Total China (Cost $829,632) 1,154,980
HONG KONG 12.4%
Common Stocks 12.4%
AIA Group 14,650,200 130,932
CK Hutchison Holdings 5,370,212 63,502
Hang Lung Properties 17,262,000 40,852
HKT Trust & HKT, Equity Units 32,891,000 43,274
HSBC Holdings 5,548,800 55,278
Jardine Strategic Holdings (USD) 334,500 12,659
Minth Group 4,126,000 19,591
Pacific Textiles Holdings 11,370,000 10,401
Stella International Holdings 8,546,000 10,070
Total Hong Kong (Cost $315,674) 386,559
INDIA 9.6%
Common Stocks 9.6%
Apollo Tyres 6,557,763 28,800
HDFC Bank 3,546,818 106,459
HDFC Standard Life Insurance (1) 820,440 6,355
Housing Development Finance 1,280,711 36,012
ITC 10,451,874 44,089
Kotak Mahindra Bank 3,129,366 56,715
Wipro 4,667,313 19,365
Total India (Cost $209,754) 297,795
INDONESIA 1.9%
Common Stocks 1.9%
Astra International 17,575,900 8,996
Proof #5

T. ROWE PRICE NEW ASIA FUND
Shares $ Value
(Cost and value in $000s)
17
Bank Central Asia 22,349,800 35,341
Hero Supermarket (2) 41,741,400 2,841
Sarana Menara Nusantara 53,866,700 12,112
Total Indonesia (Cost $58,698) 59,290
MALAYSIA 1.3%
Common Stocks 1.3%
British American Tobacco Malaysia 1,292,500 8,059
Malaysia Airports Holdings 14,734,100 33,756
Total Malaysia (Cost $40,032) 41,815
PHILIPPINES 1.1%
Common Stocks 1.1%
SM Investments 491,250 8,883
Universal Robina 9,319,610 25,293
Total Philippines (Cost $40,351) 34,176
SINGAPORE 3.6%
Common Stocks 3.6%
DBS Group Holdings 3,506,100 80,893
SATS 2,183,700 9,074
Sea, ADR (USD)(2) 2,131,695 22,362
Total Singapore (Cost $84,838) 112,329
SOUTH KOREA 13.2%
Common Stocks 12.0%
Hyundai Motor 132,478 19,759
KEPCO Plant Service & Engineering 343,884 16,258
LG Electronics 370,490 35,129
Naver 87,142 58,110
POSCO 131,572 45,335
Proof #5
T. ROWE PRICE NEW ASIA FUND
Shares $ Value
(Cost and value in $000s)
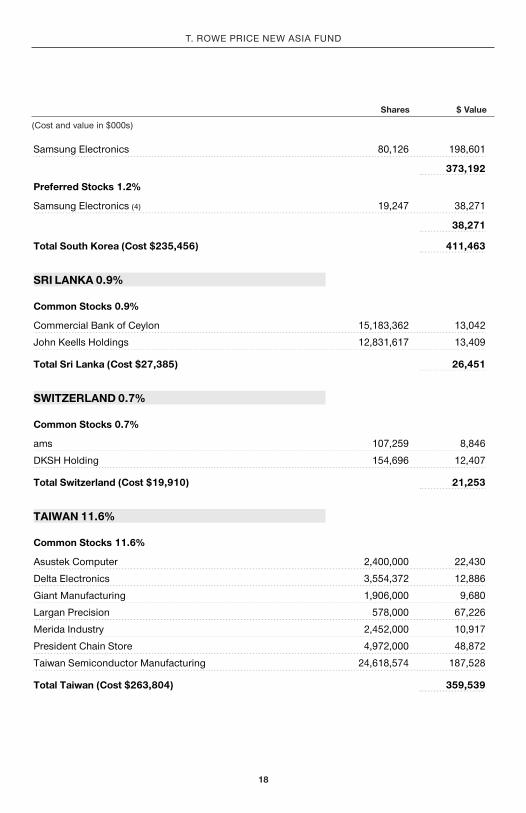
18
Samsung Electronics 80,126 198,601
373,192
Preferred Stocks 1.2%
Samsung Electronics (4) 19,247 38,271
38,271
Total South Korea (Cost $235,456) 411,463
SRI LANKA 0.9%
Common Stocks 0.9%
Commercial Bank of Ceylon 15,183,362 13,042
John Keells Holdings 12,831,617 13,409
Total Sri Lanka (Cost $27,385) 26,451
SWITZERLAND 0.7%
Common Stocks 0.7%
ams 107,259 8,846
DKSH Holding 154,696 12,407
Total Switzerland (Cost $19,910) 21,253
TAIWAN 11.6%
Common Stocks 11.6%
Asustek Computer 2,400,000 22,430
Delta Electronics 3,554,372 12,886
Giant Manufacturing 1,906,000 9,680
Largan Precision 578,000 67,226
Merida Industry 2,452,000 10,917
President Chain Store 4,972,000 48,872
Taiwan Semiconductor Manufacturing 24,618,574 187,528
Total Taiwan (Cost $263,804) 359,539
Proof #5

T. ROWE PRICE NEW ASIA FUND
Shares $ Value
(Cost and value in $000s)
19
THAILAND 2.8%
Common Stocks 2.8%
CP ALL 20,579,600 56,731
Land & Houses 39,845,100 13,743
Land & Houses, NVDR 48,621,500 16,923
Total Thailand (Cost $62,251) 87,397
UNITED KINGDOM 1.0%
Common Stocks 1.0%
Standard Chartered 3,022,244 31,746
Total United Kingdom (Cost $34,865) 31,746
SHORT-TERM INVESTMENTS 2.6%
Money Market Funds 2.6%
T. Rowe Price Government Reserve Fund, 1.72%, (5)(6) 79,840,822 79,841
Total Short-Term Investments (Cost $79,841) 79,841
Total Investments in Securities
99.9% of Net Assets (Cost $2,302,491) $ 3,104,634
‡
Country classifications are generally based on MSCI categories or another unaffiliated third party data provider; Shares are denominated in the currency of the country presented unless otherwise noted.
(1)
Security was purchased pursuant to Rule 144A under the Securities Act of 1933 and may be resold in transactions exempt from registration only to qualified institutional buyers -- total value of such securities at period-end amounts to $36,100 and represents 1.2% of net assets.
(2) Non-income producing (3)
China A shares held through the QFII are subject to certain restrictions. See Note 3.
(4)
Preferred stocks are shares that carry certain preferential rights. The dividend rate may not be consistent each pay period and could be zero for a particular year.
(5) Affiliated Company (6) Seven-day yield
ADR American Depositary Receipts
Proof #5

T. ROWE PRICE NEW ASIA FUND
20
CNH Offshore China Renminbi HKD Hong Kong Dollar
NVDR Non-Voting Depositary Receipts USD U.S. Dollar
Proof #5
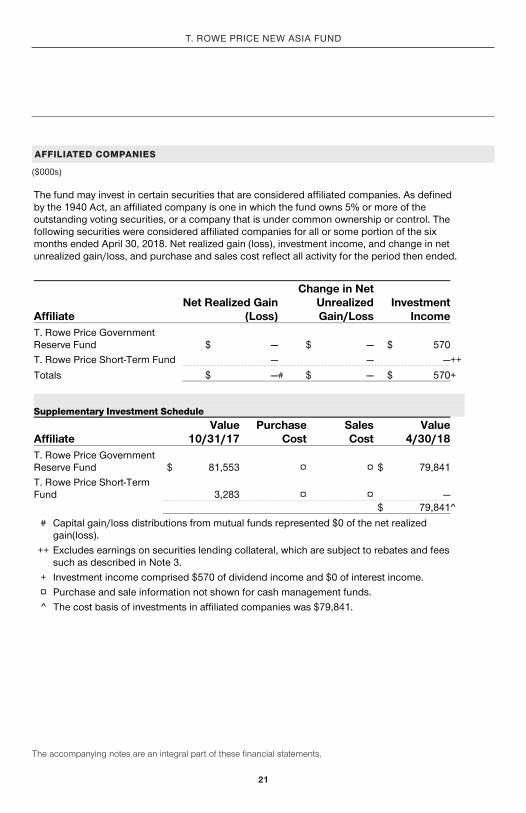
AFFILIATED COMPANIES
($000s)
T. ROWE PRICE NEW ASIA FUND
21
The accompanying notes are an integral part of these financial statements.
The fund may invest in certain securities that are considered affiliated companies. As defined by the 1940 Act, an affiliated company is one in which the fund owns 5% or more of the outstanding voting securities, or a company that is under common ownership or control. The following securities were considered affiliated companies for all or some portion of the six months ended April 30, 2018. Net realized gain (loss), investment income, and change in net unrealized gain/loss, and purchase and sales cost reflect all activity for the period then ended.
Affiliate
Net Realized Gain(Loss)
Change in NetUnrealizedGain/Loss
InvestmentIncome
T. Rowe Price Government Reserve Fund $ — $ — $ 570 T. Rowe Price Short-Term Fund — — —++Totals $ —# $ — $ 570+ Supplementary Investment Schedule Affiliate
Value10/31/17
PurchaseCost
SalesCost
Value4/30/18
T. Rowe Price Government Reserve Fund $ 81,553 ¤ ¤ $ 79,841 T. Rowe Price Short-Term Fund 3,283 ¤ ¤ — $ 79,841^
# Capital gain/loss distributions from mutual funds represented $0 of the net realized gain(loss).
++ Excludes earnings on securities lending collateral, which are subject to rebates and fees such as described in Note 3.
+ Investment income comprised $570 of dividend income and $0 of interest income. ¤ Purchase and sale information not shown for cash management funds. ^ The cost basis of investments in affiliated companies was $79,841.
Proof #5

T. ROWE PRICE NEW ASIA FUND
April 30, 2018 (Unaudited)
($000s, except shares and per share amounts)
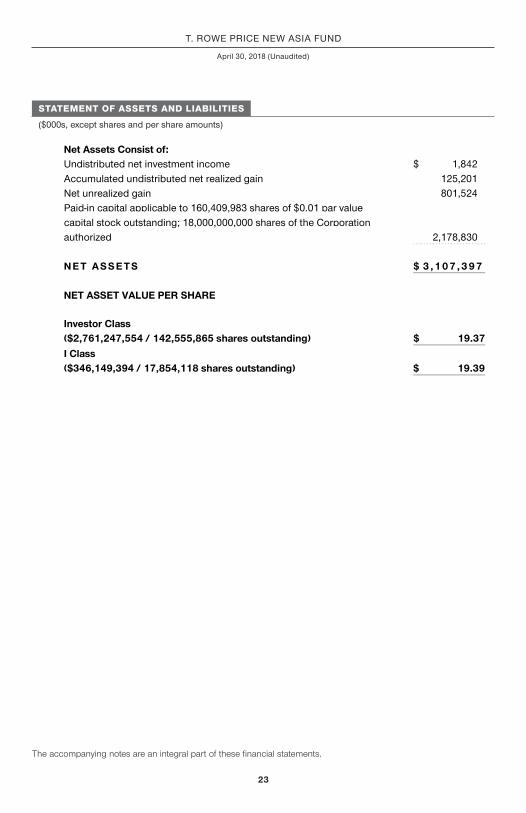
STATEMENT OF ASSETS AND LIABILITIES
22
Assets Investments in securities, at value (cost $2,302,491) $ 3,104,634 Dividends receivable 4,061 Receivable for shares sold 823 Foreign currency (cost $577) 576 Receivable for investment securities sold 551 Other assets 2,410 Total assets 3,113,055 Liabilities Investment management fees payable 2,025 Payable for investment securities purchased 1,563 Payable for shares redeemed 1,302 Due to affiliates 158 Payable to directors 2 Other liabilities 608 Total liabilities 5,658 N E T A S S E T S $ 3 , 1 0 7 , 3 9 7
Proof #5
T. ROWE PRICE NEW ASIA FUND
April 30, 2018 (Unaudited)
The accompanying notes are an integral part of these financial statements.
($000s, except shares and per share amounts)
STATEMENT OF ASSETS AND LIABILITIES
23
Net Assets Consist of: Undistributed net investment income $ 1,842 Accumulated undistributed net realized gain 125,201 Net unrealized gain 801,524 Paid-in capital applicable to 160,409,983 shares of $0.01 par value capital stock outstanding; 18,000,000,000 shares of the Corporation authorized 2,178,830 N E T A S S E T S $ 3 , 1 0 7 , 3 9 7 NET ASSET VALUE PER SHARE Investor Class ($2,761,247,554 / 142,555,865 shares outstanding) $ 19.37 I Class ($346,149,394 / 17,854,118 shares outstanding) $ 19.39
Proof #5

T. ROWE PRICE NEW ASIA FUND
($000s)
STATEMENT OF OPERATIONS
24
Unaudited
6 Months Ended
4/30/18Investment Income (Loss) Income
Dividend (net of foreign taxes of $127) $ 18,770 Securities lending 26 Total income 18,796
Expenses Investment management 12,588 Shareholder servicing
Investor Class $ 1,640 I Class 8 1,648
Prospectus and shareholder reports Investor Class 49 I Class 4 53
Custody and accounting 263 Proxy and annual meeting 46 Registration 37 Legal and audit 18 Directors 6 Miscellaneous 27 Total expenses 14,686
Net investment income 4,110 Realized and Unrealized Gain / Loss Net realized gain (loss)
Securities 136,922 Foreign currency transactions 112 Net realized gain 137,034
Proof #5

T. ROWE PRICE NEW ASIA FUND
($000s)
STATEMENT OF OPERATIONS
The accompanying notes are an integral part of these financial statements.
25
Unaudited
6 Months Ended
4/30/18Change in net unrealized gain / loss
Securities (84,796) Other assets and liabilities denominated in foreign currencies (94) Change in net unrealized gain / loss (84,890)
Net realized and unrealized gain / loss 52,144 INCREASE IN NET ASSETS FROM OPERATIONS $ 56,254
Proof #5

T. ROWE PRICE NEW ASIA FUND
($000s)
STATEMENT OF CHANGES IN NET ASSETS
26
Unaudited
6 Months Ended
4/30/18
Year Ended
10/31/17Increase (Decrease) in Net Assets Operations
Net investment income $ 4,110 $ 15,351 Net realized gain 137,034 318,200 Change in net unrealized gain / loss (84,890) 383,546
Increase in net assets from operations 56,254 717,097 Distributions to shareholders Net investment income Investor Class (13,416) (20,051) I Class (2,038) (859) Net realized gain Investor Class (240,151) (10,796) I Class (30,397) (430)
Decrease in net assets from distributions (286,002) (32,136) Capital share transactions* Shares sold Investor Class 104,476 160,996 I Class 41,516 231,102 Distributions reinvested Investor Class 233,197 27,066 I Class 29,730 1,028 Shares redeemed Investor Class (165,497) (580,712) I Class (52,197) (46,187) Redemption fees received 77 77
Increase (decrease) in net assets from capital share transactions 191,302 (206,630)
Proof #5

T. ROWE PRICE NEW ASIA FUND
The accompanying notes are an integral part of these financial statements.
($000s)
STATEMENT OF CHANGES IN NET ASSETS
27
Unaudited
6 Months Ended
4/30/18
Year Ended
10/31/17Net Assets Increase (decrease) during period (38,446) 478,331 Beginning of period 3,145,843 2,667,512 En d o f p e r i o d $ 3 , 1 0 7 , 3 9 7 $ 3 , 1 4 5 , 8 4 3 Undistributed net investment income 1,842 13,186 *Share information Shares sold Investor Class 5,113 9,008 I Class 2,047 13,253 Distributions reinvested Investor Class 12,127 1,760 I Class 1,545 67 Shares redeemed Investor Class (8,242) (33,845) I Class (2,584) (2,540)
Increase (decrease) in shares outstanding 10,006 (12,297)
Proof #5

T. ROWE PRICE NEW ASIA FUND
NOTES TO FINANCIAL STATEMENTS
28
Unaudited
T. Rowe Price International Funds, Inc. (the corporation) is registered under the Investment Company Act of 1940 (the 1940 Act). The New Asia Fund (the fund) is a nondiversified, open-end management investment company established by the corporation. The fund seeks long-term growth of capital through investments primarily in the common stocks of companies located (or with primary operations) in Asia (excluding Japan). The fund has two classes of shares: the New Asia Fund (Investor Class), and the New Asia Fund–I Class (I Class). I Class shares generally are available only to investors meeting a $1,000,000 minimum investment or certain other criteria. Each class has exclusive voting rights on matters related solely to that class; separate voting rights on matters that relate to both classes; and, in all other respects, the same rights and obligations as the other class.
NOTE 1 - SIGNIFICANT ACCOUNTING POLICIES
Basis of Preparation The fund is an investment company and follows accounting and reporting guidance in the Financial Accounting Standards Board (FASB) Accounting Standards Codification Topic 946 (ASC 946). The accompanying financial statements were prepared in accordance with accounting principles generally accepted in the United States of America (GAAP), including, but not limited to, ASC 946. GAAP requires the use of estimates made by management. Management believes that estimates and valuations are appropriate; however, actual results may differ from those estimates, and the valuations reflected in the accompanying financial statements may differ from the value ultimately realized upon sale or maturity.
Investment Transactions, Investment Income, and Distributions Investment transactions are accounted for on the trade date basis. Income and expenses are recorded on the accrual basis. Realized gains and losses are reported on the identified cost basis. Dividends received from mutual fund investments are reflected as dividend income; capital gain distributions are reflected as realized gain/loss. Dividend income and capital gain distributions are recorded on the ex-dividend date. Income tax-related interest and penalties, if incurred, are recorded as income tax expense. Income distributions are declared and paid by each class annually. Distributions to shareholders are recorded on the ex-dividend date. A capital gain distribution may also be declared and paid by the fund annually.
Proof #5

T. ROWE PRICE NEW ASIA FUND
29
Currency Translation Assets, including investments, and liabilities denominated in foreign currencies are translated into U.S. dollar values each day at the prevailing exchange rate, using the mean of the bid and asked prices of such currencies against U.S. dollars as quoted by a major bank. Purchases and sales of securities, income, and expenses are translated into U.S. dollars at the prevailing exchange rate on the respective date of such transaction. The portion of the results of operations attributable to changes in foreign exchange rates on investments is not bifurcated from the portion attributable to changes in market prices. The effect of changes in foreign currency exchange rates on realized and unrealized security gains and losses is reflected as a component of security gains and losses.
Class Accounting Shareholder servicing, prospectus, and shareholder report expenses incurred by each class are charged directly to the class to which they relate. Expenses common to both classes, investment income, and realized and unrealized gains and losses are allocated to the classes based upon the relative daily net assets of each class. To the extent any expenses are waived or reimbursed in accordance with an expense limitation (see Note 6), the waiver or reimbursement is charged to the applicable class or allocated across the classes in the same manner as the related expense.
Rebates Subject to best execution, the fund may direct certain security trades to brokers who have agreed to rebate a portion of the related brokerage commission to the fund in cash. Commission rebates are reflected as realized gain on securities in the accompanying financial statements and totaled $2,000 for the six months ended April 30, 2018.
Redemption Fees A 2% fee is assessed on redemptions of fund shares held for 90 days or less to deter short-term trading and to protect the interests of long-term shareholders. Redemption fees are withheld from proceeds that shareholders receive from the sale or exchange of fund shares. The fees are paid to the fund and are recorded as an increase to paid-in capital. The fees may cause the redemption price per share to differ from the net asset value per share.
New Accounting Guidance In March 2017, the FASB issued amended guidance to shorten the amortization period for certain callable debt securities held at a premium. The guidance is effective for fiscal years and interim periods beginning after December 15, 2018. Adoption will have no effect on the fund’s net assets or results of operations.
Indemnification In the normal course of business, the fund may provide indemnification in connection with its officers and directors, service providers, and/or private company investments. The fund’s maximum exposure under these arrangements is unknown; however, the risk of material loss is currently considered to be remote.
Proof #5

T. ROWE PRICE NEW ASIA FUND
30
NOTE 2 - VALUATION
The fund’s financial instruments are valued and each class’s net asset value (NAV) per share is computed at the close of the New York Stock Exchange (NYSE), normally 4 p.m. ET, each day the NYSE is open for business. However, the NAV per share may be calculated at a time other than the normal close of the NYSE if trading on the NYSE is restricted, if the NYSE closes earlier, or as may be permitted by the SEC.
Fair Value The fund’s financial instruments are reported at fair value, which GAAP defines as the price that would be received to sell an asset or paid to transfer a liability in an orderly transaction between market participants at the measurement date. The T. Rowe Price Valuation Committee (the Valuation Committee) is an internal committee that has been delegated certain responsibilities by the fund’s Board of Directors (the Board) to ensure that financial instruments are appropriately priced at fair value in accordance with GAAP and the 1940 Act. Subject to oversight by the Board, the Valuation Committee develops and oversees pricing-related policies and procedures and approves all fair value determinations. Specifically, the Valuation Committee establishes procedures to value securities; determines pricing techniques, sources, and persons eligible to effect fair value pricing actions; oversees the selection, services, and performance of pricing vendors; oversees valuation-related business continuity practices; and provides guidance on internal controls and valuation-related matters. The Valuation Committee reports to the Board and has representation from legal, portfolio management and trading, operations, risk management, and the fund’s treasurer.
Various valuation techniques and inputs are used to determine the fair value of financial instruments. GAAP establishes the following fair value hierarchy that categorizes the inputs used to measure fair value:
Level 1 – quoted prices (unadjusted) in active markets for identical financial instruments that the fund can access at the reporting date
Level 2 – inputs other than Level 1 quoted prices that are observable, either directly or indirectly (including, but not limited to, quoted prices for similar financial instruments in active markets, quoted prices for identical or similar financial instruments in inactive markets, interest rates and yield curves, implied volatilities, and credit spreads)
Level 3 – unobservable inputs
Proof #5

T. ROWE PRICE NEW ASIA FUND
31
Observable inputs are developed using market data, such as publicly available infor-mation about actual events or transactions, and reflect the assumptions that market participants would use to price the financial instrument. Unobservable inputs are those for which market data are not available and are developed using the best information available about the assumptions that market participants would use to price the financial instrument. GAAP requires valuation techniques to maximize the use of relevant observable inputs and minimize the use of unobservable inputs. When multiple inputs are used to derive fair value, the financial instrument is assigned to the level within the fair value hierarchy based on the lowest-level input that is significant to the fair value of the financial instrument. Input levels are not necessarily an indication of the risk or liquidity associated with financial instruments at that level but rather the degree of judgment used in determining those values.
Valuation Techniques Equity securities listed or regularly traded on a securities exchange or in the over-the-counter (OTC) market are valued at the last quoted sale price or, for certain markets, the official closing price at the time the valuations are made. OTC Bulletin Board securities are valued at the mean of the closing bid and asked prices. A security that is listed or traded on more than one exchange is valued at the quotation on the exchange determined to be the primary market for such security. Listed securities not traded on a particular day are valued at the mean of the closing bid and asked prices for domestic securities and the last quoted sale or closing price for international securities.
For valuation purposes, the last quoted prices of non-U.S. equity securities may be adjusted to reflect the fair value of such securities at the close of the NYSE. If the fund determines that developments between the close of a foreign market and the close of the NYSE will affect the value of some or all of its portfolio securities, the fund will adjust the previous quoted prices to reflect what it believes to be the fair value of the securities as of the close of the NYSE. In deciding whether it is necessary to adjust quoted prices to reflect fair value, the fund reviews a variety of factors, including developments in foreign markets, the performance of U.S. securities markets, and the performance of instruments trading in U.S. markets that represent foreign securities and baskets of foreign securities. The fund may also fair value securities in other situations, such as when a particular foreign market is closed but the fund is open. The fund uses outside pricing services to provide it with quoted prices and information to evaluate or adjust those prices. The fund cannot predict how often it will use quoted prices and how often it will determine it necessary to adjust those prices to reflect fair value. As a means of evaluating its security valuation process, the fund routinely compares quoted prices, the next day’s opening prices in the same markets, and adjusted prices.
Proof #5
T. ROWE PRICE NEW ASIA FUND
32
Actively traded equity securities listed on a domestic exchange generally are categorized in Level 1 of the fair value hierarchy. Non-U.S. equity securities generally are categorized in Level 2 of the fair value hierarchy despite the availability of quoted prices because, as described above, the fund evaluates and determines whether those quoted prices reflect fair value at the close of the NYSE or require adjustment. OTC Bulletin Board securities, certain preferred securities, and equity securities traded in inactive markets generally are categorized in Level 2 of the fair value hierarchy.
Investments in mutual funds are valued at the mutual fund’s closing NAV per share on the day of valuation and are categorized in Level 1 of the fair value hierarchy. Assets and liabilities other than financial instruments, including short-term receivables and payables, are carried at cost, or estimated realizable value, if less, which approximates fair value.
Thinly traded financial instruments and those for which the above valuation procedures are inappropriate or are deemed not to reflect fair value are stated at fair value as determined in good faith by the Valuation Committee. The objective of any fair value pricing determination is to arrive at a price that could reasonably be expected from a current sale. Financial instruments fair valued by the Valuation Committee are primarily private placements, restricted securities, warrants, rights, and other securities that are not publicly traded.
Subject to oversight by the Board, the Valuation Committee regularly makes good faith judgments to establish and adjust the fair valuations of certain securities as events occur and circumstances warrant. For instance, in determining the fair value of an equity investment with limited market activity, such as a private placement or a thinly traded public company stock, the Valuation Committee considers a variety of factors, which may include, but are not limited to, the issuer’s business prospects, its financial standing and performance, recent investment transactions in the issuer, new rounds of financing, negotiated transactions of significant size between other investors in the company, relevant market valuations of peer companies, strategic events affecting the company, market liquidity for the issuer, and general economic conditions and events. In consultation with the investment and pricing teams, the Valuation Committee will determine an appropriate valuation technique based on available information, which may include both observable and unobservable inputs. The Valuation Committee typically will afford greatest weight to actual prices in arm’s length transactions, to the extent they represent orderly transactions between market participants; transaction information can be reliably obtained, and prices are deemed representative of fair value. However, the Valuation Committee may also consider other valuation methods such as market-based valuation multiples; a discount or premium from market value of a similar, freely traded
Proof #5

T. ROWE PRICE NEW ASIA FUND
33
security of the same issuer; or some combination. Fair value determinations are reviewed on a regular basis and updated as information becomes available, including actual purchase and sale transactions of the issue. Because any fair value determination involves a significant amount of judgment, there is a degree of subjectivity inherent in such pricing decisions, and fair value prices determined by the Valuation Committee could differ from those of other market participants. Depending on the relative significance of unobservable inputs, including the valuation technique(s) used, fair valued securities may be categorized in Level 2 or 3 of the fair value hierarchy.
Valuation Inputs The following table summarizes the fund’s financial instruments, based on the inputs used to determine their fair values on April 30, 2018 (for further detail by category, please refer to the accompanying Portfolio of Investments):
($000s) Level 1 Level 2 Level 3 Total Value
Assets
Common Stocks $ 405,387 $ 2,581,135 $ — $ 2,986,522
Preferred Stocks — 38,271 — 38,271
Short-Term Investments 79,841 — — 79,841
Total $ 485,228 $ 2,619,406 $ — $ 3,104,634
There were no material transfers between Levels 1 and 2 during the six months ended April 30, 2018.
NOTE 3 - OTHER INVESTMENT TRANSACTIONS
Consistent with its investment objective, the fund engages in the following practices to manage exposure to certain risks and/or to enhance performance. The investment objective, policies, program, and risk factors of the fund are described more fully in the fund’s prospectus and Statement of Additional Information.
Emerging and Frontier Markets The fund may invest, either directly or through investments in T. Rowe Price institutional funds, in securities of companies located in, issued by governments of, or denominated in or linked to the currencies of emerging and frontier market countries; at period-end, approximately 79% of the fund’s net assets were invested in emerging markets and 1% in frontier markets. Emerging markets, and to a greater extent frontier markets, generally have economic structures that are less
Proof #5

T. ROWE PRICE NEW ASIA FUND
34
diverse and mature, and political systems that are less stable, than developed countries. These markets may be subject to greater political, economic, and social uncertainty and differing regulatory environments that may potentially impact the fund’s ability to buy or sell certain securities or repatriate proceeds to U.S. dollars. Such securities are often subject to greater price volatility, less liquidity, and higher rates of inflation than U.S. securities. Investing in frontier markets is significantly riskier than investing in other countries, including emerging markets.
Restricted Securities The fund may invest in securities that are subject to legal or contractual restrictions on resale. Prompt sale of such securities at an acceptable price may be difficult and may involve substantial delays and additional costs.
China A shares The fund invests in certain Chinese equity securities (A shares) that have limited availability to investors outside of China. The fund gains access to the A share market through the Shanghai-Hong Kong Stock Connect program (Shanghai Stock Connect), through the Shenzhen-Hong Kong Stock Connect program (Shenzhen Stock Connect), or through a wholly owned subsidiary of Price Associates, which serves as the registered Qualified Foreign Institutional Investor (QFII) for all participating T. Rowe Price-sponsored products (each a participating account). Related to A shares held through the QFII, investment decisions are specific to each participating account, and each account bears the economic consequences of its holdings and transactions in A shares. Further, the fund’s ability to repatriate cash associated with its A shares held through the QFII is subject to certain restrictions and administrative processes involving the Chinese government; consequently, the fund may experience substantial delays in gaining access to its assets or incur a loss of value in the event of noncompliance with governmental requirements. A shares acquired through the QFII are valued using the onshore renminbi exchange rate (CNY) and those acquired through the Shanghai Stock Connect and the Shenzhen Stock Connect are valued using the offshore renminbi exchange rate (CNH). CNY and CNH exchange rates may differ; accordingly, A shares of the same issue purchased through different channels may not have the same U.S. dollar value. Generally, the fund is not subject to capital gains tax related to its A share investments.
Securities Lending The fund may lend its securities to approved borrowers to earn additional income. Its securities lending activities are administered by a lending agent in accordance with a securities lending agreement. Security loans generally do not have stated maturity dates, and the fund may recall a security at any time. The fund receives collateral in the form of cash or U.S. government securities, valued at 102% to 105% of
Proof #5

T. ROWE PRICE NEW ASIA FUND
35
the value of the securities on loan. Collateral is maintained over the life of the loan in an amount not less than the value of loaned securities; any additional collateral required due to changes in security values is delivered to the fund the next business day. Cash collateral is invested in accordance with investment guidelines approved by fund management. Additionally, the lending agent indemnifies the fund against losses resulting from borrower default. Although risk is mitigated by the collateral and indemnification, the fund could experience a delay in recovering its securities and a possible loss of income or value if the borrower fails to return the securities, collateral investments decline in value, and the lending agent fails to perform. Securities lending revenue consists of earnings on invested collateral and borrowing fees, net of any rebates to the borrower, compensation to the lending agent, and other administrative costs. In accordance with GAAP, investments made with cash collateral are reflected in the accompanying financial statements, but collateral received in the form of securities is not. At April 30, 2018, there were no securities on loan.
Other Purchases and sales of portfolio securities other than short-term securities aggregated $798,436,000 and $862,342,000, respectively, for the six months ended April 30, 2018.
NOTE 4 - FEDERAL INCOME TAXES
No provision for federal income taxes is required since the fund intends to continue to qualify as a regulated investment company under Subchapter M of the Internal Revenue Code and distribute to shareholders all of its taxable income and gains. Distributions determined in accordance with federal income tax regulations may differ in amount or character from net investment income and realized gains for financial reporting purposes. Financial reporting records are adjusted for permanent book/tax differences to reflect tax character but are not adjusted for temporary differences. The amount and character of tax-basis distributions and composition of net assets are finalized at fiscal year-end; accordingly, tax-basis balances have not been determined as of the date of this report.
At April 30, 2018, the cost of investments for federal income tax purposes was $2,310,924,000. Net unrealized gain aggregated $793,091,000 at period-end, of which $923,524,000 related to appreciated investments and $130,433,000 related to depreciated investments.
Proof #5

T. ROWE PRICE NEW ASIA FUND
36
NOTE 5 - FOREIGN TAXES
The fund is subject to foreign income taxes imposed by certain countries in which it invests. Additionally, certain foreign currency transactions are subject to tax, and capital gains realized upon disposition of securities issued in or by certain foreign countries are subject to capital gains tax imposed by those countries. All taxes are computed in accordance with the applicable foreign tax law, and, to the extent permitted, capital losses are used to offset capital gains. Taxes attributable to income are accrued by the fund as a reduction of income. Taxes incurred on the purchase of foreign currencies are recorded as realized loss on foreign currency transactions. Current and deferred tax expense attributable to capital gains is reflected as a component of realized or change in unrealized gain/loss on securities in the accompanying financial statements. At April 30, 2018, the fund had no deferred tax liability attributable to foreign securities and $11,810,000 of foreign capital loss carryforwards, including $11,259,000 that expire in 2022, $204,000 that expire in 2026, and $347,000 that expire in 2027.
NOTE 6 - RELATED PARTY TRANSACTIONS
The fund is managed by T. Rowe Price Associates, Inc. (Price Associates), a wholly owned subsidiary of T. Rowe Price Group, Inc. (Price Group). Price Associates has entered into a sub-advisory agreement(s) with one or more of its wholly owned subsidiaries, to provide investment advisory services to the fund. The investment management agreement between the fund and Price Associates provides for an annual investment management fee, which is computed daily and paid monthly. The fee consists of an individual fund fee, equal to 0.50% of the fund’s average daily net assets, and a group fee. The group fee rate is calculated based on the combined net assets of certain mutual funds sponsored by Price Associates (the group) applied to a graduated fee schedule, with rates ranging from 0.48% for the first $1 billion of assets to 0.265% for assets in excess of $650 billion. The fund’s group fee is determined by applying the group fee rate to the fund’s average daily net assets. At April 30, 2018, the effective annual group fee rate was 0.29%.
The I Class is subject to an operating expense limitation (I Class limit) pursuant to which Price Associates is contractually required to pay all operating expenses of the I Class, excluding management fees, interest, expenses related to borrowings, taxes, brokerage, and other non-recurring expenses permitted by the investment management agreement, to the extent such operating expenses, on an annualized basis, exceed 0.05% of average net assets. This agreement will continue until February 29, 2020, and may be renewed, revised, or revoked only with approval of the fund’s Board. The I Class is required to repay Price Associates for expenses previously paid to the extent the class’s net assets
Proof #5
T. ROWE PRICE NEW ASIA FUND
37
grow or expenses decline sufficiently to allow repayment without causing the class’s operating expenses (after the repayment is taken into account) to exceed both: (1) the expense limitation in place at the time such amounts were paid; and (2) the class’s current expense limitation. However, no repayment will be made more than three years after the date of a payment or waiver. For the six months ended April 30, 2018, the I Class operated below its expense limitation.
In addition, the fund has entered into service agreements with Price Associates and two wholly owned subsidiaries of Price Associates, each an affiliate of the fund (collectively, Price). Price Associates provides certain accounting and administrative services to the fund. T. Rowe Price Services, Inc., provides shareholder and administrative services in its capacity as the fund’s transfer and dividend-disbursing agent. T. Rowe Price Retirement Plan Services, Inc., provides subaccounting and recordkeeping services for certain retirement accounts invested in the Investor Class and I Class. For the six months ended April 30, 2018, expenses incurred pursuant to these service agreements were $46,000 for Price Associates; $710,000 for T. Rowe Price Services, Inc.; and $52,000 for T. Rowe Price Retirement Plan Services, Inc. All amounts due to and due from Price, exclusive of investment management fees payable, are presented net on the accompanying Statement of Assets and Liabilities.
The fund is also one of several mutual funds sponsored by Price Associates (underlying Price funds) in which the T. Rowe Price Spectrum Funds (Spectrum Funds) may invest. The Spectrum Funds do not invest in the underlying Price funds for the purpose of exercising management or control. Pursuant to special servicing agreements, expenses associated with the operation of the Spectrum Funds are borne by each underlying Price fund to the extent of estimated savings to it and in proportion to the average daily value of its shares owned by the Spectrum Funds. Expenses allocated under this special servicing agreement are reflected as shareholder servicing expense in the accompanying financial statements. For the six months ended April 30, 2018, the fund was allocated $103,000 of Spectrum Funds’ expenses. Of these amounts, $61,000 related to services provided by Price. All amounts due to and due from Price, exclusive of investment management fees payable, are presented net on the accompanying Statement of Assets and Liabilities. Additionally, redemption fees received by the Spectrum Funds are allocated to each underlying Price fund in proportion to the average daily value of its shares owned by the Spectrum Funds. Approximately $4,000 of redemption fees reflected in the accompanying financial statements were received from the Spectrum Funds. At six months ended April 30, 2018, approximately 7% of the outstanding shares of the Investor Class were held by the Spectrum Funds.
Proof #5

T. ROWE PRICE NEW ASIA FUND
38
The fund may invest its cash reserves in certain open-end management investment companies managed by Price Associates and considered affiliates of the fund: the T. Rowe Price Government Reserve Fund or the T. Rowe Price Treasury Reserve Fund, organized as money market funds, or the T. Rowe Price Short-Term Fund, a short-term bond fund (collectively, the Price Reserve Funds). The Price Reserve Funds are offered as short-term investment options to mutual funds, trusts, and other accounts managed by Price Associates or its affiliates and are not available for direct purchase by members of the public. Cash collateral from securities lending is invested in the T. Rowe Price Short-Term Fund. The Price Reserve Funds pay no investment management fees.
The fund may participate in securities purchase and sale transactions with other funds or accounts advised by Price Associates (cross trades), in accordance with procedures adopted by the fund’s Board and Securities and Exchange Commission rules, which require, among other things, that such purchase and sale cross trades be effected at the independent current market price of the security. During the six months ended April 30, 2018, the fund had no purchases or sales cross trades with other funds or accounts advised by Price Associates.
Proof #5

39
T. ROWE PRICE NEW ASIA FUND
INFORMATION ON PROXY VOTING POLICIES, PROCEDURES, AND RECORDS
A description of the policies and procedures used by T. Rowe Price funds and portfolios to determine how to vote proxies relating to portfolio securities is available in each fund’s Statement of Additional Information. You may request this document by calling 1-800-225-5132 or by accessing the SEC’s website, sec.gov.
The description of our proxy voting policies and procedures is also available on our corporate website. To access it, please visit the following Web page:
https://www3.troweprice.com/usis/corporate/en/utility/policies.html
Scroll down to the section near the bottom of the page that says, “Proxy Voting Policies.” Click on the Proxy Voting Policies link in the shaded box.
HOW TO OBTAIN QUARTERLY PORTFOLIO HOLDINGS
The fund files a complete schedule of portfolio holdings with the Securities and Exchange Commission for the first and third quarters of each fiscal year on Form N-Q. The fund’s Form N-Q is available electronically on the SEC’s website (sec.gov); hard copies may be reviewed and copied at the SEC’s Public Reference Room, 100 F St. N.E., Washington, DC 20549. For more information on the Public Reference Room, call 1-800-SEC-0330.
Proof #5
40
T. ROWE PRICE NEW ASIA FUND
APPROVAL OF INVESTMENT MANAGEMENT AGREEMENT AND SUBADVISORY AGREEMENTS
Each year, the fund’s Board of Directors (Board) considers the continuation of the investment management agreement (Advisory Contract) between the fund and its investment advisor, T. Rowe Price Associates, Inc. (Advisor), as well as the continuation of the investment subadvisory agreements (Subadvisory Contracts) that the Advisor has entered into with T. Rowe Price International Ltd and T. Rowe Price Hong Kong Limited (Subadvisors) on behalf of the fund. In that regard, at an in-person meeting held on March 5–6, 2018 (Meeting), the Board, including a majority of the fund’s independent directors, approved the continuation of the fund’s Advisory Contract and Subadvisory Contracts. At the Meeting, the Board considered the factors and reached the conclusions described below relating to the selection of the Advisor and Subadvisors and the approval of the Advisory Contract and Subadvisory Contracts. The independent directors were assisted in their evaluation of the Advisory Contract and Subadvisory Contracts by independent legal counsel from whom they received separate legal advice and with whom they met separately.
In providing information to the Board, the Advisor was guided by a detailed set of requests for information submitted by independent legal counsel on behalf of the independent directors. In considering and approving the Advisory Contract and Subadvisory Contracts, the Board considered the information it believed was relevant, including, but not limited to, the information discussed below. The Board considered not only the specific information presented in connection with the Meeting but also the knowledge gained over time through interaction with the Advisor and Subadvisors about various topics. The Board meets regularly and, at each of its meetings, covers an extensive agenda of topics and materials and considers factors that are relevant to its annual consideration of the renewal of the T. Rowe Price funds’ advisory contracts, including performance and the services and support provided to the funds and their shareholders.
Services Provided by the Advisor and SubadvisorsThe Board considered the nature, quality, and extent of the services provided to the fund by the Advisor and Subadvisors. These services included, but were not limited to, directing the fund’s investments in accordance with its investment program and the overall management of the fund’s portfolio, as well as a variety of related activities such as financial, investment operations, and administrative services; compliance; maintaining the fund’s records and registrations; and shareholder communications. The Board also reviewed the background and experience of the Advisor’s and Subadvisors’ senior management teams and investment personnel involved in the management of the fund, as well as the Advisor’s compliance record. The Board concluded that it was satisfied with the nature, quality, and extent of the services provided by the Advisor and Subadvisors.
Proof #5

41
T. ROWE PRICE NEW ASIA FUND
APPROVAL OF INVESTMENT MANAGEMENT AGREEMENT AND SUBADVISORY AGREEMENTS (CONTINUED)
Investment Performance of the FundThe Board took into account discussions with the Advisor and reports that it receives throughout the year relating to fund performance. In connection with the Meeting, the Board reviewed the fund’s net annualized total returns for the 1-, 2-, 3-, 4-, 5-, and 10-year periods as of September 30, 2017, and compared these returns with the performance of a peer group of funds with similar investment programs and a wide variety of other previously agreed-upon comparable performance measures and market data, including those supplied by Broadridge, which is an independent provider of mutual fund data.
On the basis of this evaluation and the Board’s ongoing review of investment results and factoring in the relative market conditions during certain of the performance periods, the Board concluded that the fund’s performance was satisfactory.
Costs, Benefits, Profits, and Economies of ScaleThe Board reviewed detailed information regarding the revenues received by the Advisor under the Advisory Contract and other benefits that the Advisor (and its affiliates, including the Subadvisors) may have realized from its relationship with the fund, including any research received under “soft dollar” agreements and commission-sharing arrangements with broker-dealers. The Board considered that the Advisor and Subadvisors may receive some benefit from soft-dollar arrangements pursuant to which research is received from broker-dealers that execute the fund’s portfolio transactions. The Board received information on the estimated costs incurred and profits realized by the Advisor from managing the T. Rowe Price funds. The Board also reviewed estimates of the profits realized from managing the fund in particular, and the Board concluded that the Advisor’s profits were reasonable in light of the services provided to the fund.
The Board also considered whether the fund benefits under the fee levels set forth in the Advisory Contract from any economies of scale realized by the Advisor. Under the Advisory Contract, the fund pays a fee to the Advisor for investment management services composed of two components—a group fee rate based on the combined average net assets of most of the T. Rowe Price funds (including the fund) that declines at certain asset levels and an individual fund fee rate based on the fund’s average daily net assets—and the fund pays its own expenses of operations (subject to a contractual expense limitation agreed to by the Advisor with respect to the I Class). Under the Subadvisory Contracts, the Advisor may pay each Subadvisor up to 60% of the advisory fee that the Advisor receives from the fund. The Board concluded that the advisory fee structure for the fund continued to provide for a reasonable sharing of benefits from any economies of scale with the fund’s investors.
Proof #5

42
T. ROWE PRICE NEW ASIA FUND
APPROVAL OF INVESTMENT MANAGEMENT AGREEMENT AND SUBADVISORY AGREEMENTS (CONTINUED)
Fees and ExpensesThe Board was provided with information regarding industry trends in management fees and expenses. Among other things, the Board reviewed data for peer groups that were compiled by Broadridge, which compared: (i) contractual management fees, total expenses, actual management fees, and nonmanagement expenses of the Investor Class of the fund with a group of competitor funds selected by Broadridge (Expense Group); and (ii) total expenses, actual management fees, and nonmanagement expenses of the Investor Class of the fund with a broader set of funds within the Lipper investment classification (Expense Universe). The Board considered the fund’s contractual management fee rate, actual management fee rate (which reflects the management fees actually received from the fund by the Advisor after any applicable waivers, reductions, or reimbursements), operating expenses, and total expenses (which reflect the net total expense ratio of the fund after any waivers, reductions, or reimbursements) in comparison with the information for the Broadridge peer groups. Broadridge generally constructed the peer groups by seeking the most comparable funds based on similar investment classifications and objectives, expense structure, asset size, and operating components and attributes and ranked funds into quintiles, with the first quintile representing the funds with the lowest relative expenses and the fifth quintile representing the funds with the highest relative expenses. The information provided to the Board indicated that the fund’s contractual management fee ranked in the second quintile (Expense Group), the fund’s actual management fee rate ranked in the second quintile (Expense Group and Expense Universe), and the fund’s total expenses ranked in the first quintile (Expense Group and Expense Universe).
The Board also reviewed the fee schedules for institutional accounts and private accounts with similar mandates that are advised or subadvised by the Advisor and its affiliates. Management provided the Board with information about the Advisor’s responsibilities and services provided to subadvisory and other institutional account clients, including information about how the requirements and economics of the institutional business are fundamentally different from those of the mutual fund business. The Board considered information showing that the Advisor’s mutual fund business is generally more complex from a business and compliance perspective than its institutional account business and considered various relevant factors, such as the broader scope of operations and oversight, more extensive shareholder communication infrastructure, greater asset flows, heightened business risks, and differences in applicable laws and regulations associated with the Advisor’s proprietary mutual fund business. In assessing the reasonableness of the fund’s management fee rate, the Board considered the differences in the nature of the services required for the Advisor to manage its mutual fund business versus managing a discrete pool of assets as a subadvisor to another institution’s mutual fund or for an institutional account and that the Advisor generally performs significant additional services and assumes greater risk in managing the fund and other T. Rowe Price funds than it does for institutional account clients.
Proof #5

43
T. ROWE PRICE NEW ASIA FUND
APPROVAL OF INVESTMENT MANAGEMENT AGREEMENT AND SUBADVISORY AGREEMENTS (CONTINUED)
On the basis of the information provided and the factors considered, the Board concluded that the fees paid by the fund under the Advisory Contract are reasonable.
Approval of the Advisory Contract and Subadvisory ContractsAs noted, the Board approved the continuation of the Advisory Contract and Subadvisory Contracts. No single factor was considered in isolation or to be determinative to the decision. Rather, the Board concluded, in light of a weighting and balancing of all factors considered, that it was in the best interests of the fund and its shareholders for the Board to approve the continuation of the Advisory Contract and Subadvisory Contracts (including the fees to be charged for services thereunder).
Proof #5

This page intentionally left blank.
Proof #5

This page intentionally left blank.
Proof #5

STOCK FUNDSDomestic Blue Chip GrowthCapital Appreciation‡
Capital OpportunityCommunications & TechnologyDiversified Mid-Cap GrowthDividend GrowthEquity IncomeEquity Index 500Extended Equity Market IndexFinancial ServicesGrowth & IncomeGrowth StockHealth SciencesMid-Cap Growth‡
Mid-Cap Value‡
New America GrowthNew EraNew Horizons‡
QM U.S. Small & Mid-Cap Core Equity
QM U.S. Small-Cap Growth EquityQM U.S. Value EquityReal EstateScience & TechnologySmall-Cap Stock‡
Small-Cap ValueTax-Efficient Equity Total Equity Market IndexU.S. Large-Cap CoreValue
ASSET ALLOCATION FUNDSBalanced Global AllocationMulti-Strategy Total ReturnPersonal Strategy BalancedPersonal Strategy GrowthPersonal Strategy IncomeReal AssetsSpectrum GrowthSpectrum IncomeSpectrum InternationalTarget Date Fundsˆ
BOND FUNDSDomestic TaxableCorporate IncomeCredit OpportunitiesFloating RateGNMA High Yield‡
Inflation Protected BondLimited Duration Inflation
Focused BondNew IncomeShort-Term BondTotal ReturnUltra Short-Term BondU.S. Bond Enhanced IndexU.S. High YieldU.S. Treasury IntermediateU.S. Treasury Long-Term
Domestic Tax-FreeCalifornia Tax-Free BondGeorgia Tax-Free BondIntermediate Tax-Free High YieldMaryland Short-Term Tax-Free BondMaryland Tax-Free BondNew Jersey Tax-Free BondNew York Tax-Free BondSummit Municipal IncomeSummit Municipal IntermediateTax-Free High YieldTax-Free IncomeTax-Free Short-IntermediateVirginia Tax-Free Bond
MONEY MARKET FUNDSTaxableCash Reserves1
Government Money2
U.S. Treasury Money2
MONEY MARKET FUNDS (cont.)Tax-FreeCalifornia Tax-Free Money1
Maryland Tax-Free Money1
New York Tax-Free Money1
Summit Municipal Money Market1
Tax-Exempt Money1
INTERNATIONAL/GLOBAL FUNDSStockAfrica & Middle EastAsia OpportunitiesEmerging EuropeEmerging Markets StockEmerging Markets Value StockEuropean Stock Global ConsumerGlobal Growth StockGlobal IndustrialsGlobal Real EstateGlobal StockGlobal Technology‡
International Concentrated EquityInternational Discovery‡
International Equity IndexInternational StockInternational Value EquityJapanLatin AmericaNew AsiaOverseas StockQM Global Equity
BondDynamic Global BondEmerging Markets BondEmerging Markets Corporate BondEmerging Markets Local Currency
BondGlobal High Income BondGlobal Multi-Sector BondInternational BondInternational Bond (USD Hedged)
201806-488693F39-051 6/18 T. Rowe Price Investment Services, Inc. | 100 East Pratt Street | Baltimore, MD 21202-1009
T. Rowe Price Mutual Funds This page contains supplementary information that is not part of the shareholder report.
Call 1-800-225-5132 to request a prospectus or summary prospectus; each includes investment objectives, risks, fees, expenses, and other information that you should read and consider carefully before investing.
‡ Subject to certain exceptions, the fund is currently closed to new investors and new accounts.ˆ The Target Date Funds are inclusive of the Retirement Funds, the Target Funds, and the Retirement Balanced Fund.1 Retail Funds: You could lose money by investing in the Fund. Although the Fund seeks to preserve the value of your
investment at $1.00 per share, it cannot guarantee it will do so. Beginning October 14, 2016, the Fund may impose a fee upon the sale of your shares or may temporarily suspend your ability to sell shares if the Fund’s liquidity falls below required minimums because of market conditions or other factors. An investment in the Fund is not insured or guaranteed by the Federal Deposit Insurance Corporation or any other government agency. The Fund’s sponsor has no legal obligation to provide financial support to the Fund, and you should not expect that the sponsor will provide financial support to the Fund at any time.
2 Government Funds: You could lose money by investing in the Fund. Although the Fund seeks to preserve the value of your investment at $1.00 per share, it cannot guarantee it will do so. An investment in the Fund is not insured or guaranteed by the Federal Deposit Insurance Corporation or any other government agency. The Fund’s sponsor has no legal obligation to provide financial support to the Fund, and you should not expect that the sponsor will provide financial support to the Fund at any time.
Proof #5